Article

Influence of the Synthesis Protocol on the Catalytic Performance of PHI-Type Zeolites for the Dehydration of Lactic Acid

Institute of Technical Chemistry, University of Stuttgart, 70550 Stuttgart, Germany
*
Author to whom correspondence should be addressed.
Catalysts 2023, 13(2), 261; https://doi.org/10.3390/catal13020261
Submission received: 21 December 2022 / Revised: 16 January 2023 / Accepted: 18 January 2023 / Published: 24 January 2023
(This article belongs to the Special Issue Catalysis on Zeolites and Zeolite-Like Materials II)

Abstract

:
Acrylic acid is an important basic chemical and a key starting compound for a variety of consumer products. Today, acrylic acid is still produced from fossil-based propene. If acrylic acid were produced from bio-based lactic acid, this would be an important step towards sustainability. The gas-phase dehydration reaction of lactic acid to acrylic acid was performed over eight-membered ring PHI-type zeolites in the Na+ and K+-form. A few variations in the synthesis procedure of PHI-type zeolite made a big difference in the performance during the catalytic reaction due to differences in the physical and chemical properties, especially the accessibility of the pores. The catalysts were characterized with ICP-OES, XRD, CO2 physisorption, SEM and 27Al MAS NMR. The calcination resulted in a partial collapse of the PHI structure. In the case of Na,K-PHI with a low surface area, the catalysis tends to take place on the outer surface, while in the case of Na,K-PHI with a high surface area the catalysis can also take place within the pore system. This has a considerable influence on the selectivity of the catalysts.

1. Introduction

Industrial catalysts are essential for the efficient conversion of conventional and alternative hydrocarbon sources into fuels as well as chemical products [1]. Zeolites with their confined channels and cavities have found applications as shape-selective catalysts and adsorbents in numerous commercial processes. However, zeolites suffer from severe intracrystalline mass transfer limitations due to the comparable size of the zeolite channels and the diffusing molecules [2], which continuously interact with the channel walls [3]. This can lead to secondary reactions or to rapid deactivation because of the accumulation of carbonaceous deposits (coke).
One goal in the development of zeolite catalysts is to overcome these mass transport limitations. In the past few years, a lot of effort has been made to synthesize zeolitic nanocrystals or nanoparticles [2,4]. The strategy here is to shorten the diffusion paths within the catalyst and to increase the external surface area, thereby enhancing the catalyst’s effectiveness. A large external surface is advantageous, if large molecules are to be reacted, not fitting through the pores. However, a large external surface area can lead to reactions that are not shape-selective, thus reducing the selectivity of the zeolite [4]. The synthesis of zeolites at the nanoscale is very challenging. In the past years, substantial efforts have been undertaken to obtain nanosized zeolites by carefully optimizing crystallization parameters such as synthesis gel composition, crystallization period, reaction temperature, gel aging, adding crystal growth modifiers, and so on [2,4].
Recently, a new concept to reduce diffusion problems was proposed in the literature [5], namely the synthesis of finned zeolites with a secondary growth process. These zeolites are composed of aggregated nanosized crystallites with fin-like protrusions. The finned zeolites behave as pseudo-nanocrystals with a high molecular uptake in the fins, coupled with reduced internal diffusion. This decreases the coke formation on the external surface [5,6,7].
The performance of well-defined, crystalline catalysts can potentially more easily be explained with computational modeling of structure-activity relationships. However, a majority of commercial catalysts are amorphous rather than crystalline. They are often chosen because they are less expensive, their physical properties can be tuned, and their activity and productivity are often higher [8]. X-ray amorphous [9] or partially crystalline zeolitic materials are also of great interest. For the skeletal isomerization of n-butene, it was shown that zeolites with low crystallinity can achieve higher selectivity and yield compared to highly crystalline analogues [10,11].
In this publication, we also aim to show that there is an influence of crystallinity and particle morphology/crystal form of phillipsite (PHI) zeolites on the catalytic performance using lactic acid dehydration as an example. This reaction was chosen because the lactic acid dehydration to acrylic acid can be an important step on the way to new raw materials. Acrylic acid is an essential industrial chemical, but it is still petroleum-based. Since lactic acid can be produced fermentatively from sugar, bio-based acrylic acid is obtained in this way. However, it should be noted that due to the two functional groups of lactic acid, many reactions are possible besides the dehydration to acrylic acid, thus requiring a selective catalyst (Figure 1) [12,13]. The most important side reaction is the decarbonylation to acetaldehyde by protonation or decarboxylation. The reaction to 2,3-pentanedione is only occurring if strong nucleophiles are available, which can form an ester with lactic acid [14].
The PHI-type zeolite was synthesized without using a structure-directing agent. The PHI zeolite has eight-membered ring (8-MR) channels aligned along the a-axis (0.38 nm × 0.38 nm), b-axis (0.30 nm × 0.43 nm), and c-axis (0.32 nm × 0.33 nm) directions [15]. Due to its small pore size, it is used for the separation of CO2/CH4 mixtures [16] or ethanol purification with PHI membranes [17]. We assumed that the PHI structure is not very prone to deactivation due to its small pores. The structural, textural and elemental analysis results obtained in the present work show that adjusting the synthesis parameters and hydrothermal treatment conditions can strongly change the properties of the obtained catalysts.

2. Results

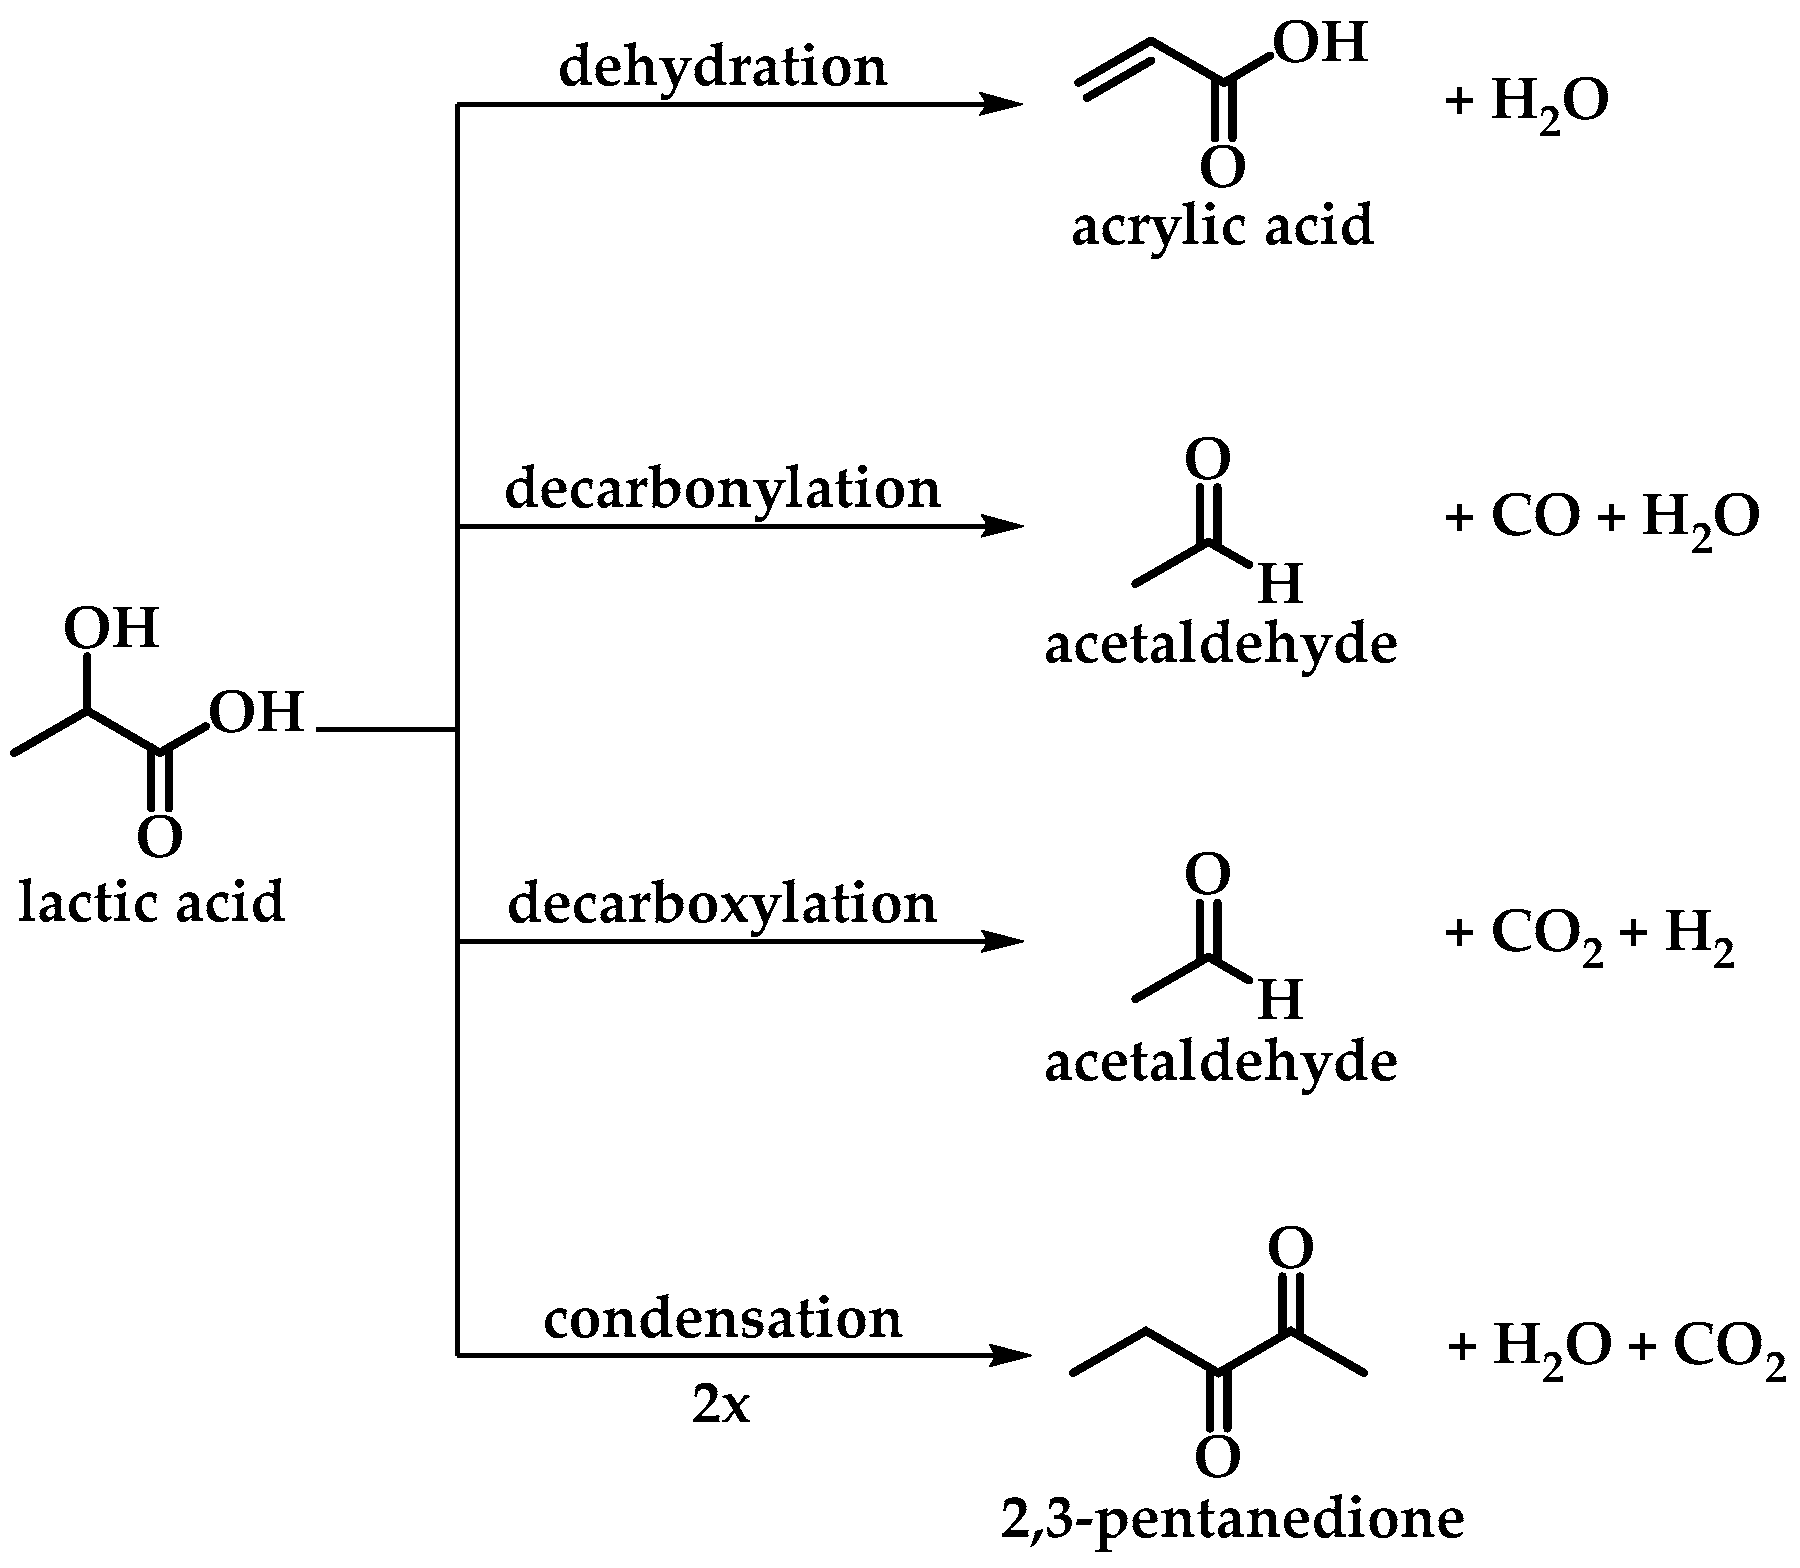
2.1. Catalytic Performance of the PHI Catalysts for the Gas-Phase Lactic Acid Dehydration

The catalytic performance of the synthesized and treated zeolites in the dehydration reaction of lactic acid to acrylic acid was tested. In Table 1, the catalytic results are summarized. Due to the fact that the catalytic performance was stable over a time on stream (TOS) of 285 min, the mean lactic acid conversions and the mean selectivities for the main products are indicated. Detailed TOS behavior, also for products not shown in Table 1, can be viewed in the diagrams in Figure S1 in the Supporting Information.
The naming of the catalysts starts with Na,K-PHI, which clarifies the counterions Na+ and K+ and the structure type PHI (IZA code). The catalysts with a low BET surface area are labeled “ls” (low surface area), and the catalysts with a high BET surface area “hs” (high surface area). The as-synthesized materials are named “a.s.”, the calcined materials “calc”, and the steamed materials “steamed”. A catalyst that has been filled into the reactor and flooded with N2 for one night at 598 K receives the additional term “N2”. This is the state of the catalyst, when the catalytic experiment is started. The relative crystallinity of the catalyst in % is the last part of the name.
The low surface area samples (Na,K-PHI_ls_calc_15% and Na,K-PHI_ls_calc_steamed_14%) show a high selectivity to acrylic acid and 2,3-pentanedione and a low selectivity to acetaldehyde. This is completely contrary to the performance of the high surface area samples (Na,K-PHI_hs_a.s._90% and Na,K-PHI_hs_calc_16%). This unexpected difference in behavior will be explained in Section 2.2 with the properties of the catalysts. The carbon content on the catalysts after the reaction is very low, ≤1.3% (Supporting Information, Table S1). Thus, there is almost no deposition of carbonaceous deposits on the catalyst that could block active centers. This is also reflected in the stable TOS behavior during catalysis.

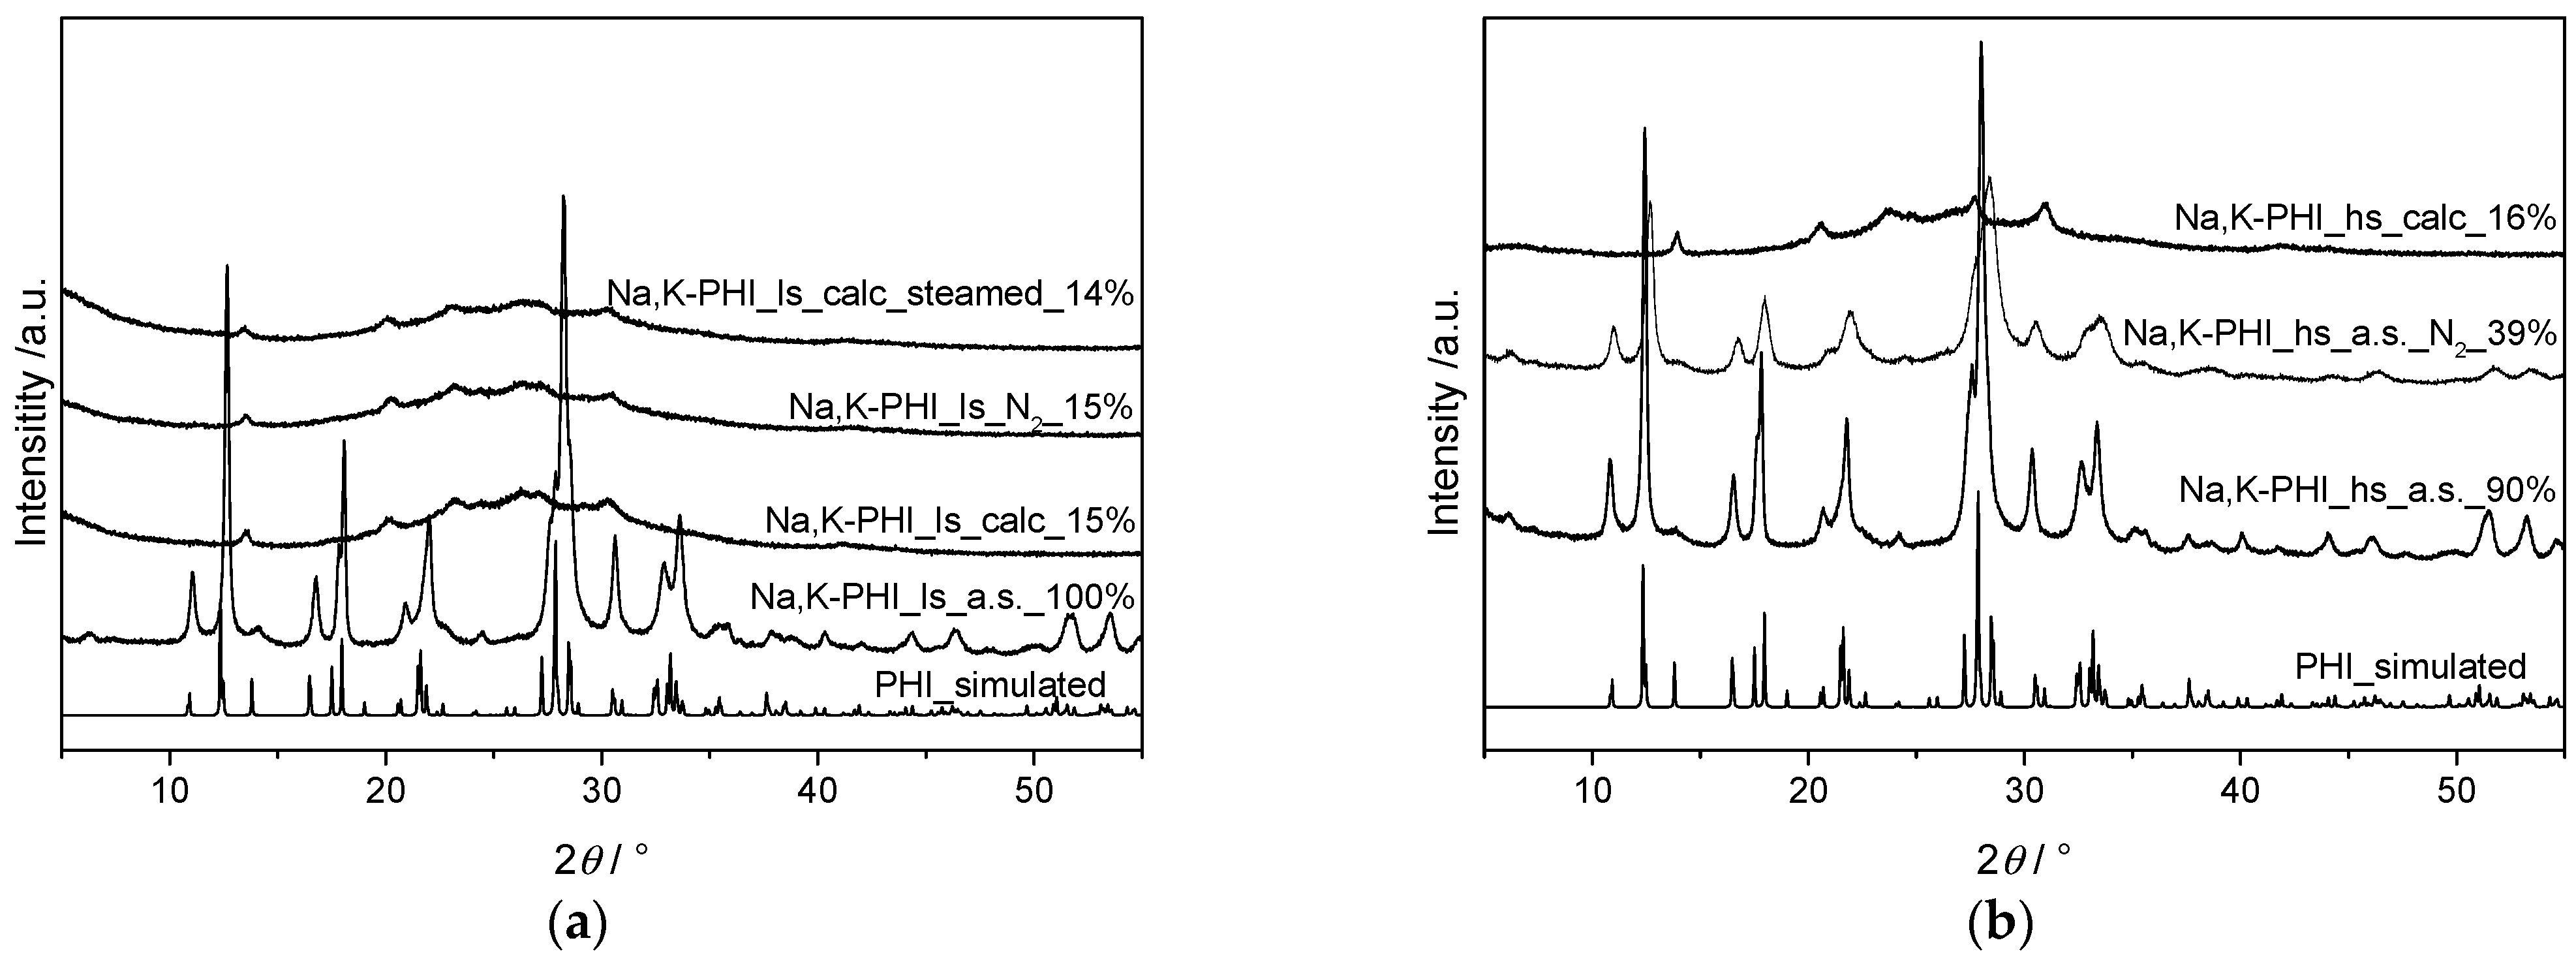
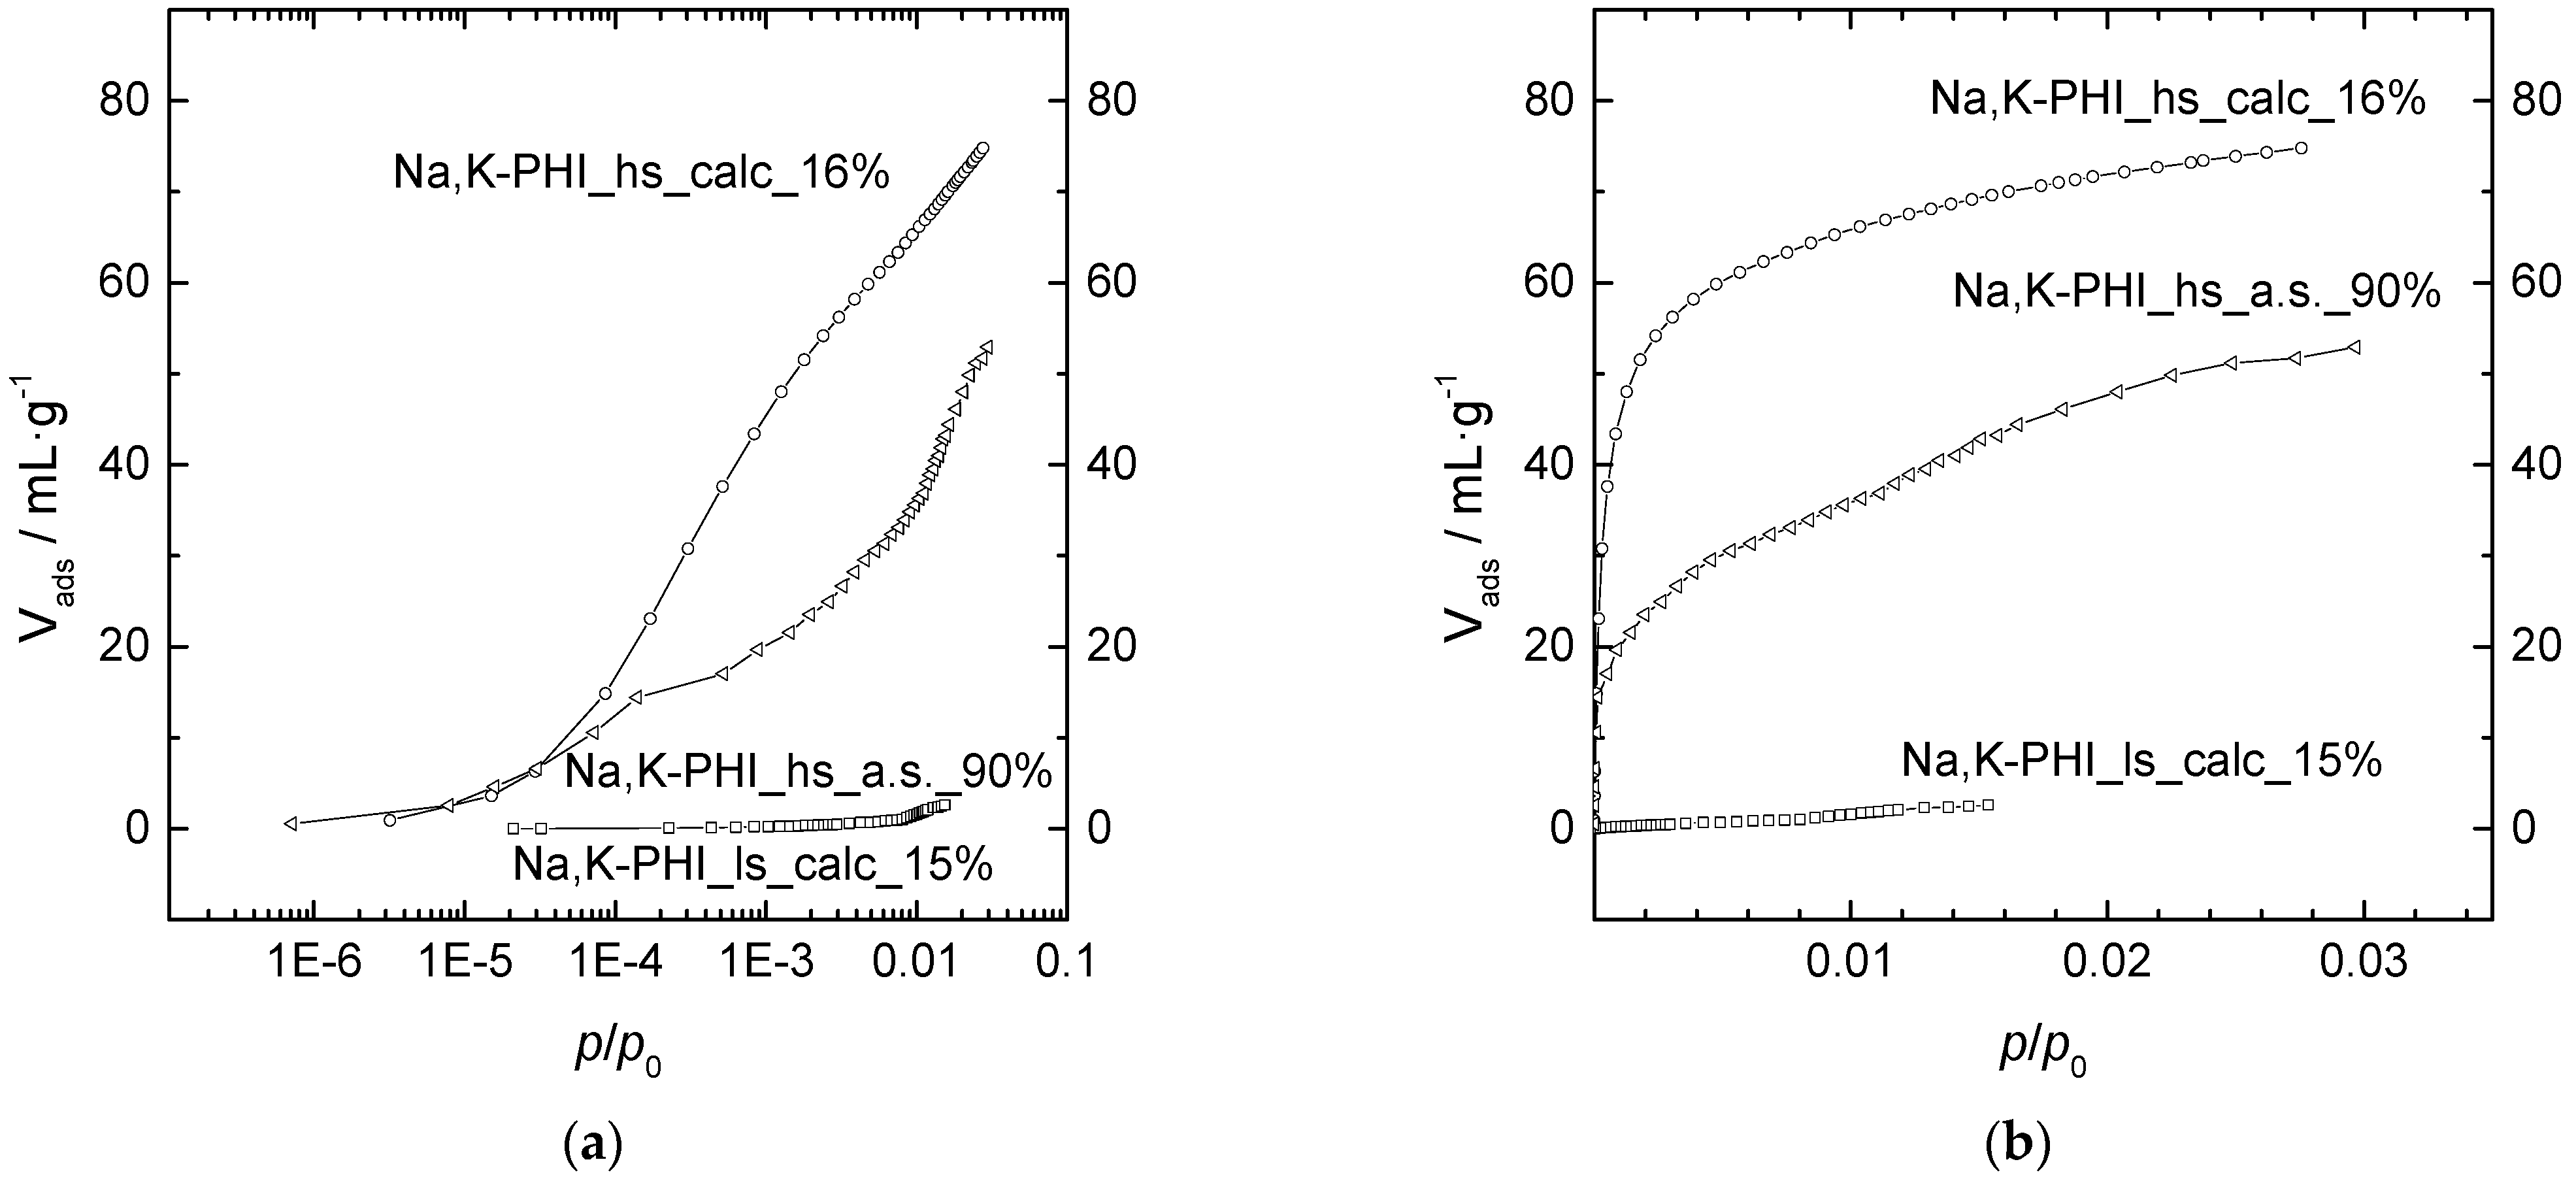
2.2. Characterization of the PHI Catalysts

X-ray powder diffraction (XRD) was used to confirm the successful synthesis of the PHI zeolites. The XRD patterns of the samples are shown in Figure 2. The relative crystallinity of the samples under study was determined via the peak intensity method by measuring the peak intensity of the (302) reflection at 2θ = 28°. For this purpose, the peak intensity of the sample Na,K_PHI_ls_a.s._100% with the best crystallinity was utilized as a reference with the value of 100%. Evaluation of the diffraction patterns in Figure 2 led to the relative crystallinities, which can be found as the last part of the samples name. The XRD patterns indicate that the samples are fully crystalline in the as synthesized form and have the characteristic reflection peaks of the PHI topology [15]. However, even a mild thermal treatment in the reactor at 593 K with N2 before the reaction, the calcination and the steaming lead to a strong decrease of the crystallinity, which is a first indication of structural changes as a result of the treatments. It should be mentioned that, during the treatment in the reactor, the catalyst is exposed to water vapor escaping from its own pores. Under these conditions, complex transformations can take place [19]. The steam hydrolyzes the framework Al, and this leads to a collapse of the zeolite structure. It is well known that aluminum-rich zeolites have a low thermal and hydrothermal stability [20,21,22]. Since water will always be present during the reaction process, it is important to know the effects of water.
The chemical composition analyzed with inductively coupled plasma optical emission spectroscopy (ICP-OES) of all catalysts is almost the same within the experimental accuracy. The molar ratio nSi/nAl is between 2.2 and 2.4, the nNa/nAl ratio between 0.51 and 0.58 and the nK/nAl ratio between 0.44 and 0.47 (Table 2). Within the measurement tolerance, it can be assumed that the zeolite catalysts are completely in the alkali-cationic form.
For the surface area and pore structure analysis, CO2 physisorption isotherms were measured at 273 K. This method is useful, because CO2 molecules, in contrast to N2 and Ar, are capable of diffusing into the ultramicropores, although their dimensions are almost equal (0.36 nm for N2, 0.34 nm for Ar, and 0.33 nm for CO2) [23]. However, it should be noted that CO2 has a quadrupole moment, which affects the adsorption behavior on microporous solids with polar surface groups such as zeolites. Therefore, pore size analysis with CO2 is not straightforward for micropores that have significant polar functional groups [24]. In Figure 3, the CO2 physisorption isotherms are shown, and Table 3 summarizes the physisorption results. During synthesis, no structure-directing agent was used, so the pores are not blocked by a structure-directing agent and should be accessible without calcination. There is a clear difference in surface area between the two synthetic approaches. This important information and distinguishing feature can also be found in the catalyst name (ls: low surface area, hs: high surface area). For the first synthesis batch (Na,K-PHI_ls_calc_15%), a Brunauer-Emmett-Teller (BET) surface area of 72 m2·g−1 and a Dubinin-Radushkevich (DR) micropore volume of 0.006 cm3·g−1 were measured. In contrast, for Na,K-PHI_hs_a.s._90% a much higher BET surface area of 384 m2·g−1 and DR micropore volume of 0.091 cm3·g−1 were measured. After the calcination, the BET surface area and the pore volume even increased for Na,K-PHI_hs_calc_16%. Since no structure-directing agent is used in the synthesis, its removal and an associated weight loss cannot be used as an explanation. We observe a significant collapse of the long-range order in the zeolite (strong decrease of the relative crystallinity in XRD and a broadening of the signal in 27Al MAS NMR, see below) due to calcination. Relocalization of counterions or even collapse of some pore walls during calcination could lead to a better pore accessibility. These structural changes may be one reason for an improved accessibility of the pores.
The isotherm for Na,K-PHI_ls_calc_15% looks like the one of a dense structure. For Na,K-PHI_hs_a.s._90% and Na,K-PHI_hs_calc_16%, the isotherms show the typical type I isotherm shape characteristic of microporous solids having a relatively small external surface (Figure 3) [25]. At 195 K, kinetically hindered CO2 adsorption was observed (only measured for Na,K-PHI_hs_a.s._90%, shown in Figure S2 in Supporting Information). Concurrently, the measurement times of CO2 physisorption at 273 K were unusually long, indicating very narrow pore sizes in the range of the size of CO2. The pore size distribution was calculated using Grand Canonical Monte Carlo (GCMC) simulation. The average pore diameters of Na,K-PHI_hs_a.s._90% and Na,K-PHI_hs_calc_16% were 0.68 nm and 0.76 nm, respectively. The graphs are shown in the Supporting Information Figure S3. The calculated pore diameters do not match with the pore diameters specified for the PHI type zeolite [15]. For the PHI structure type, the largest sphere that could diffuse through the pores is given as 0.369 nm, 0.311 nm and 0.331 nm along the a-axis, b-axis and c-axis, respectively [15,26]. Since the PHI structure was confirmed by XRD, we assume that the intact PHI channels were inaccessible for the measurement. Na,K-PHI_hs_a.s._90% has a very sharp pore size distribution, which fits well together with the high crystallinity of the catalyst. In addition, the volume of the pores is not large, which also shows that this catalyst has a predominantly intact PHI framework. The channels that were accessible to CO2 during the measurement are expanded channels of the partially damaged structure. For Na,K-PHI_hs_calc_16%, calcination caused the pores to expand even more. The pore size distribution of Na,K-PHI_hs_calc_16% is quite broad with a small fraction of pores with a larger pore diameter. Together with the XRD data, this suggests that due to calcination and the accompanying deconstruction of the zeolite framework the pores become larger. Since this deconstruction probably also happens relatively non-uniformly, this results in a broader pore size distribution. No GCMC simulation was possible for Na,K-PHI_ls_calc_15%, as the isotherm indicates that no microporosity is present.
In the 27Al magic-angle spinning nuclear magnetic resonance (MAS NMR) spectra shown in Figure 4, there is no signal at 0 ppm for all catalysts. The uncalcined high surface area zeolites Na,K-PHI_hs_a.s._90% and Na,K-PHI_hs_a.s._N2_39% show a chemical shift at δ27Al = 58 ppm. This means that all Al atoms should be tetrahedrally coordinated. However, the signals of the tetrahedrally coordinated aluminum become relatively broad after calcination and are shifted to lower values of 54 or 55 ppm. The broadening is asymmetrical and more prominent to smaller shifts. It can be assumed that the structure is partially destroyed. The deconvolution of the spectra with Lorentzian curves (Supporting Information Figure S4) shows that there is another peak at lower chemical shift at around 49 ppm. In the literature, it is reported that the signals at about 50 ppm can be attributed to aluminum species in a distorted tetrahedral environment as found in partially crystalline dealuminated Y and ZSM-5 zeolites [11,27], which is formed from normal tetrahedrally coordinated aluminum during the degradation of the zeolitic structure during calcination.
The determination of the particle morphology and size of the samples under study was performed via scanning electron microscopy (SEM). Table 2 gives a summary of the obtained values; the images are shown in Figure 5. The particles of the Na,K-PHI_ls_calc_15% have a “popcorn-like” structure. The “popcorns” are in a range of 4.84–6.75 μm. The higher magnification shows that the “popcorn” consists of aggregated cubic nanocrystals with defined edges in the range of 0.17–0.37 μm. A similar structure is also found in the literature for the finned zeolites [5].
For the high surface area material Na,K-PHI_hs_a.s._90% and Na,K-PHI_hs_calc_16%, aggregates are also observed. In the higher magnification, an amorphous layer covering the crystals can be observed, and the individual crystals do not have sharply defined edges. A popcorn structure can also be seen for Na,K-PHI_hs_a.s._90%. The crystal size of the high surface area materials is in the same range as the one of the low surface area materials.

3. Discussion

We synthesized two PHI-type zeolites and treated them in a similar manner. We found that the somewhat modified synthesis protocols produced different catalysts with completely different properties. We tested the catalysts in the lactic acid dehydration reaction, and fundamental differences were found in the catalytic performance of the two synthesis batches.
The PHI structure is a narrow pore structure without large cavities. The Van der Waals diameter of lactic acid is calculated to be 0.616 nm. The dimensions of a cylinder that would exactly enclose the lactic acid molecule would have a base diameter of 0.616 nm and a length of 0.685 nm (see SI) [28]. A size comparison between the space required by the lactic acid molecule and the pore diameters given for the PHI structure [15] suggests that it is difficult for lactic acid to access the pores. But the fact that one catalyst forms 2,3-pentanedione and the other does not leaves the possibility for interpretation. 2,3-Pentanedione is formed by the condensation of two lactic acid molecules, assuming a bulky bimolecular transition state. Because of the limited space in the zeolite pores, there is no way to form the bulky bimolecular transition state required for the formation of 2,3-pentanedione. We can assume that if 2,3-pentanedione is not formed, the reaction of lactic acid occurs mainly in the pores. Both, Na,K-PHI_hs_a.s._90% and Na,K-PHI_hs_calc_16% have a low selectivity to 2,3-pentanedione, so the reaction should occur in the pores and not at the outer surface. If a lot of 2,3-pentanedione is formed, as is the case with Na,K-PHI_ls_calc_15%, then the reaction should take place predominantly on the outer surface because only there enough space for the bulky transition state is provided.
This consideration of the different accessibilities of the catalysts is also supported by the CO2 physisorption measurement. Since the pores are very narrow, CO2 physisorption was chosen in order to be able to measure the small pores as well. Even if one could assume that the lactic acid molecule cannot diffuse through the 8-MR pore, we suspect that the surface and pores accessible for CO2 physisorption are also accessible for the lactic acid molecules (at least partially and especially at the higher temperature of the lactic acid conversion). The high BET surface area and the non-negligible micropore volume for Na,K-PHI_hs_a.s._90% and Na,K-PHI_hs_calc_16% shows the accessibility of the pores for CO2 and thus maybe also for lactic acid. In addition, the pore size distribution (Supporting Information Figure S3) shows that the pore diameters of Na,K-PHI_hs_a.s._90% and Na,K-PHI_hs_calc_16% are supposed to be large enough for an access of lactic acid. Hence, we assume that the reaction can take place inside the pores or at least at the pore entrances (and at the outer surface) for the hs-materials. The small BET surface area and the small micropore volume of Na,K-PHI_ls_calc_15% prove the inaccessibility of the pores for CO2 at low temperatures due to kinetic hindrance. However, we also conclude that the pores are too narrow for lactic acid even at higher temperatures. Consequently, the reaction of lactic acid should take place at the outer surface, which is also suggested by the large selectivity to 2,3-pentanedione.
Na,K-PHI_hs_a.s._90% has a relatively high acetaldehyde selectivity and a very low acrylic acid selectivity. It is possible that the slow diffusion of the reactants in the narrow pores leads to a lower conversion and to subsequent reactions and the already formed acrylic acid undergoes reactions such as decarbonylation or decomposition, oligomerization, condensation with lactic acid or other products [29,30]. The random arrangement in the aggregates can lead to blockage of the pores (dead ends). This prevents the reactants from leaving the pore system in the shortest way, which leads to secondary reactions and thus acetaldehyde formation. We can also imagine that there is a kind of “trapdoor” effect [31,32]. During diffusion into the hs-materials, the lactic acid can wriggle past the cations and thus become trapped in the catalyst Na,K-PHI_hs_a.s._90%. This is where the catalytic conversion then takes place. Since acrylic acid is difficult to diffuse back out of the catalyst, a lot of acetaldehyde is formed. As a result of the calcination, for Na,K-PHI_hs_calc_16% increased surface area and pore volume are measured. We found that more acrylic acid is formed, with a simultaneous decrease in acetaldehyde selectivity. It can be concluded that the diffusion is less hindered, compared to the as synthesized material. This means that the secondary reactions take place less, and this is due to the larger pore volume.
For Na,K-PHI_ls_calc_15%, a very low acetaldehyde selectivity and a high acrylic acid selectivity are found. This product distribution supports the assumption that catalysis occurs predominantly on the outer surface. Since there is no diffusion through the pores, a higher conversion is possible, and the secondary reactions are less likely. Once formed, acrylic acid can quickly leave the catalyst surface again and is not further converted to acetaldehyde. Therefore, a high acrylic acid selectivity is found. The high catalytic activity despite a small surface area can be explained by the special particle morphology of the catalyst. Na,K-PHI_ls_calc_15% looks like the finned zeolites, which are said to facilitate the diffusion around the fins and reactants have a smaller residence time near the pore mouths increasing the catalytic activity by not having any deactivation processes. In the observations of Dai et al., finned zeolites also showed higher activity than the zeolites without fins [6]. Finned zeolites behave as pseudo nanocrystallites [5]. Even if the XRD patterns show that the catalysts have a low crystallinity and the PHI structure is difficult to guess, based on the 27Al MAS NMR data it was shown that the low surface area materials have tetrahedral aluminum atoms and a zeolitic nature leading to a high catalytic activity.
The variation of the different parameters during the synthesis may have led to the significant differences of the catalysts. Zeolite synthesis and crystallization is a complex process. In our two syntheses, we have different parameters that affect the crystallization process. Only in the first synthesis was the reaction mixture aged for one day. Aging causes zeolite synthesis to be divided into two separate steps: Nucleation and crystal growth. During aging, nucleation can occur without competition from crystallization. The duration of aging controls the number of zeolite nuclei formed [33]. With a longer aging time, the number of nuclei increases, and the final average crystal size is smaller [34]. In addition, a higher concentration of hydroxides increases the dissolution of the amorphous gel and the nucleation rate, leading to the growth of more crystals [35]. Based on these two factors, smaller crystals would be expected for the first synthesis batch than for the second synthesis batch. However, this is not the case and the primary crystals are the same size in both syntheses. The longer crystallization time or the different addition sequence probably play a minor role in this case.
It could also be that the different sodium aluminates used for the synthesis are responsible for the differences. In the second synthesis batch, the sodium aluminate dissolved already at room temperature. In the first synthesis batch, heat was needed. We can speculate that not all of the aluminates dissolved, and invisible to the eye, undissolved aluminum oxide species (e.g., aluminum oxide hydrate, AlOOH) were suspended in the solution and then added to the reaction mixture. This could lead to fine aluminum oxide particles blocking the pores and making them difficult to access. If the concentration of these aluminate species are below the detection limit of 27Al MAS NMR, it is possible that they are not seen in the spectrum. This may be an explanation for the first synthesis batch having the impression of a dense structure.

4. Materials and Methods

4.1. Synthesis of the Zeolites

1st batch, ls-material: For the synthesis of zeolite PHI [36], three solutions need to be prepared. In 72 g demin. H2O, 3.1 g NaOH (Roth, ≥99%) and 8.8 g KOH (Roth, ≥85%) were dissolved (solution 1). 24.3 g NaAlO2 (Sigma-Aldrich, technical, 50–56% Al2O3, 40–45% Na2O, max. 0.05% Fe2O3) were added to 26.2 g demin. H2O while stirring and heating on a water bath (solution 2). Then, 134.0 g colloidal silica (Nouryon Levasil® Colloidal Silica CA316 PNL, 30 wt.-%) were placed in a 250 mL PP bottle (solution 3), and subsequently, solution 1 was added. Solution 2 was added drop-wise over a time period of 10 min. After addition, the solution became more and more viscous and milky, forming a white precipitate. The PP bottle was sealed and put aside in order to let it age for one day at room temperature without stirring. Afterwards, the PP bottle containing the white gel was transferred into an oven and heated at 373 K for 12 d. No stirring was applied during the heating (static crystallization process). The zeolite was washed by slurrying in demin. water, centrifugation and decantation.
2nd batch, hs-material: The second synthetic approach is very similar to the first. However, the small deviations make a big difference as has been shown. For the second synthesis batch, three solutions were also needed. 3.1 g NaOH (VWR, AnalaR NORMAPUR, 99%) and 7.5 g KOH (Merck, ≥85%) were dissolved in 72 g demin. H2O (solution 1). 24.3 g NaAlO2 (Riedel-de Haën, 54% Al2O3 and 41% Na2O) were completely dissolved at room temperature in 26.2 g demin. H2O (solution 2). Then 134 g colloidal silica (Nouryon Levasil® Colloidal Silica CA316 PNL, 30 wt.-%) (solution 3) was added to solution 1. After that, solution 2 was added dropwise to solutions 1 and 3 within 10 min under stirring at room temperature, and stirring was continued for 20 min. Without aging, the solution was divided up into three 125 mL PP bottles, transferred into an oven and heated at 373 K for 10 d. No stirring was applied during the heating. The combined products were washed by slurrying in demin. water, centrifugation and decantation.
The main differences between the two PHI syntheses are clearly listed in Table 4. No ion exchange was performed for any zeolite. The zeolites were calcined at 815 K for 5 h in air.
RT   60   K · h 1 815   K 5   h 815   K cool   down   RT
To test the hydrothermal stability, steaming was performed. For the treatment, the catalyst was flooded with steam (water vapor content of 82 vol.-% in nitrogen) at 623 K for 3 h 45 min.
RT   180   K · h 1 ,   N 2 623   K 3   h   45   min ,   N 2 ,   H 2 O   623   K cool   down ,   N 2 RT

4.2. Characterization of the Zeolites

The chemical composition of the materials was determined by ICP-OES (Varian VISTA-MPX). For the analysis of the carbon, hydrogen and nitrogen content in the samples, an Elementar Vario EL elementary analyzer was used. Powder X-ray diffraction patterns were recorded using an AXS D8 Advance diffractometer (Bruker) with Cu-Kα radiation (λ = 0.154 nm). The water content of the samples was measured with a Setaram thermogravimetric analyzer Setsys TG-16/18. CO2 physisorption was analyzed at 273 K by 3P Instruments with a 3P-Micro 300C with CryoTune option. The pore size distribution was calculated with the Quantachrome® ASiQwin software using the CO2 at 273 K on carbon GCMC method. 27Al MAS NMR spectroscopic studies of the catalysts were performed utilizing a Bruker Avance III 400WB spectrometer. A Vega3 emission scanning electron microscope (SEM) from Tescan was used to analyze the particle sizes and the crystal morphologies of all samples under study. The SEM images were recorded after covering the samples with a thin layer of carbon, deposited by sputtering. By measuring the particles and crystals in the SEM images with the ruler function in Adobe Photoshop CS2, the range of size was determined.

4.3. Conversion of Lactic Acid

For the catalytic tests, a 19–21 wt.-% aqueous lactic acid solution was used. To ensure complete hydrolysis of the lactic acid oligomers [37], the lactic acid was stirred at 353 K for at least 72 h before use. The mass content was determined by titration with NaOH solution. The gas-phase dehydration of lactic acid was carried out at 598 K at atmospheric pressure. The experimental rig as it is described elsewhere [38] was used. Starting from the evaporator zone, all reactant and product carrying lines were tempered to 493 K. The reactor filled with 0.5 mL pressed and sieved (200–300 μm) catalyst was tempered to 598 K. The residence time of the lactic acid in the reactor at 598 K is 0.16s, taking into account the bulk density. The condensable products were condensed out at 195 K. The flow rate of the aqueous lactic acid solution was 25 μL·min−1. With the beginning of the dosage, the time measurement for the time on stream (TOS) started. The N2 flow was adjusted in such way that the ratio between the mass of the liquid and the volume of the gaseous flow rate was 7.82·10−4 g·mL−1. The collected product of the first 45 min was not considered but discarded, and a new cold trap was installed. After every 60 min, a new cold trap was installed and the products collected during this period were analyzed. Thus, the first cold trap contains the products, which were collected between TOS = 45 min and 105 min. This sample is indicated with TOS = 105 min and so on. The condensed products were analyzed with an Agilent J&W HP-Innowax column (30 m, 0.320 mm, 0.5 μm) and a flame ionization detector (FID) with H2 as carrier gas. The carbon balance cannot be closed by analyzing only the condensable phase. Missing shares can be due to gaseous products that are not coproducts, gases lost from the cold trap or deposits on the catalyst.
The blank conversion was determined to be (1.1 ± 2.4)%. Lactic acid is heated abruptly to the reaction temperature. Therefore, the lactic acid is at 593 K only for a short time. Hardly any decomposition processes occur that would take place with a slow heating rate [39]. The reproducibility of catalytic tests and analytics were checked. For this purpose, the catalyst Na,K-PHI_ls_calc_15% was measured twice to show the reproducibility (Figure S1a,b). In addition, a reference catalyst NaY with nSi/nAl = 2.4 was measured three times and checked for comparability. The deviation between the measurements was less than ±4 percentage points. The results of previous research work [12] could also be reproduced. It could thus be shown that the influence of measurement and process errors is small. The determination of the pump speed and the lactic acid concentration, the weighing of the cold trap, the sample preparation for the analysis and the evaluation of the chromatograms all have an influence on the accuracy.

5. Conclusions

This work demonstrates that the structural properties of zeolites are a crucial factor in catalysis and especially in the lactic acid to acrylic acid reaction. Zeolite synthesis is a very complex process that should not be underestimated. Using an eight-membered ring PHI zeolite as an example, we were able to show how small changes in the synthesis protocol cause large structural changes and thus large catalytic changes. It is shown that the catalytic reaction takes place at the outer surface of Na,K-PHI_ls_calc_15%, which reduces secondary reactions and therefore yields a relatively high acrylic acid selectivity. The characterization, in combination with the catalytic results, clearly shows that properties of nanosized zeolites are present for this catalyst. In contrast, Na,K-PHI_hs_a.s._90% and Na,K_PHI_calc_16% show rather zeolitic properties. The high acetaldehyde selectivity of the high surface area materials is due to secondary reactions promoted by diffusion limitations.
Subsequently, for further use of the bio-based acrylic acid, the product mixture should be purified appropriately, for example by distillation [40,41].

Supplementary Materials

The following supporting information can be downloaded at: https://www.mdpi.com/article/10.3390/catal13020261/s1, Figure S1: Conversion of lactic acid XLA and selectivities to acrylic acid SAA, acetaldehyde SAcH, propionic acid SPA, 2,3-pentanedione SPTDN and hydroxyacetone SHAct as a function of time-on-stream TOS.; Figure S2: CO2 physisorption isotherms for Na,K-PHI_hs_a.s._90% at 273 K and 195 K and different equilibration times (EQ). At 195 K, the kinetic inhibition is clearly visible.; Figure S3: Pore size distributions calculated with Grand Canonical Monte Carlo Simulation (CO2 at 273 K on carbon (GCMC model)) for the CO2 physisorption measurements at 273 K for Na,K-PHI_hs_a.s._90% (left) and Na,K-PHI_hs_calc_16% (right). The fitting error for Na,K-PHI_hs_a.s._90% was 18.359 % and for Na,K-PHI_hs_calc_16% was 3.832 %.; Figure S4: 27Al MAS NMR spectra of the hydrated zeolites. Experimental spectra (black) and mathematically deconvoluted spectra using Lorentzian lines (red and green) and overall mathematical fit (blue).; Table S1: Carbon content wc of the catalysts after the reaction.; Description of the calculation of the size of the lactic acid molecule. References [42,43,44,45,46,47,48,49,50] are cited in the Supplementary Materials.

Author Contributions

Conceptualization, D.H. and Y.T.; methodology, D.H.; software, D.H.; validation, D.H., R.S. and B.G.; formal analysis, D.H., R.S. and B.G.; investigation, D.H.; resources, R.S. and B.G.; data curation, D.H. and R.S.; writing—original draft preparation, D.H. and Y.T.; writing—review and editing, D.H. and Y.T.; visualization, D.H.; supervision, Y.T.; project administration, Y.T.; funding acquisition, Y.T. All authors have read and agreed to the published version of the manuscript.

Funding

This research was funded by Deutsche Forschungsgemeinschaft (DFG, German Research Foundation, project number 388060787).

Data Availability Statement

All raw data obtained is stored at the data repository of the University of Stuttgart (DaRUS) and accessible via https://darus.uni-stuttgart.de/ (accessed on 23 January 2022).

Acknowledgments

We thank Hang Liu for measuring SEM, Zheng Li for measuring 27Al MAS NMR, Claudia Lauxmann for carrying out part of the elemental analysis. We thank Katrin Gugeler for calculation of the lactic acid molecule and 3p-instruments for the CO2 physisorption measurements.

Conflicts of Interest

The authors declare no conflict of interest.

References

  1. Peters, B.; Scott, S.L. Single atom catalysts on amorphous supports: A quenched disorder perspective. J. Chem. Phys. 2015, 142, 104708. [Google Scholar] [CrossRef] [PubMed]
  2. Palčić, A.; Catizzone, E. Application of nanosized zeolites in methanol conversion processes: A short review. Curr. Opin. Green Sustain. Chem. 2021, 27, 100393. [Google Scholar] [CrossRef]
  3. Hayat, K.; Li, X.-G.; Xiao, W.D. Theoretical Insights into Intracrystalline Diffusion of Olefins in MTO Catalysts. Catal. Lett. 2020, 150, 2056–2067. [Google Scholar] [CrossRef]
  4. Mintova, S.; Grand, J.; Valtchev, V. Nanosized zeolites: Quo vadis? Comptes Rendus Chim. 2016, 19, 183–191. [Google Scholar] [CrossRef] [Green Version]
  5. Dai, H.; Shen, Y.; Yang, T.; Lee, C.; Fu, D.; Agarwal, A.; Le, T.T.; Tsapatsis, M.; Palmer, J.C.; Weckhuysen, B.M.; et al. Finned zeolite catalysts. Nat. Mater. 2020, 19, 1074–1080. [Google Scholar] [CrossRef] [PubMed]
  6. Dai, H.; Lee, C.; Liu, W.; Yang, T.; Claret, J.; Zou, X.; Dauenhauer, P.J.; Li, X.; Rimer, J.D. Enhanced Selectivity and Stability of Finned Ferrierite Catalysts in Butene Isomerization. Angew. Chem. Int. Ed. 2022, 61, e202113077. [Google Scholar] [CrossRef]
  7. Lima, R.C.; Lopes, C.W.; Villarroel-Rocha, J.; Bieseki, L.; Sapag, K.; Pergher, S.B.C. Organic-Free Synthesis of Finned Mordenite Zeolite. Nanomaterials 2022, 12, 2623. [Google Scholar] [CrossRef]
  8. Goldsmith, B.R.; Peters, B.; Johnson, J.K.; Gates, B.C.; Scott, S.L. Beyond Ordered Materials: Understanding Catalytic Sites on Amorphous Solids. ACS Catal. 2017, 7, 7543. [Google Scholar] [CrossRef]
  9. Jacobs, P.A.; Derouane, E.G.; Weitkamp, J. Evidence for X-ray-amorphous zeolites. J. Chem. Soc. Chem. Commun. 1981, 194, 591–593. [Google Scholar] [CrossRef]
  10. Nicolaides, C.P. A novel family of solid acid catalysts: Substantially amorphous or partially crystalline zeolitic materials. Appl. Catal. A 1999, 185, 211–217. [Google Scholar] [CrossRef]
  11. Triantafyllidis, K.S.; Nalbandian, L.; Trikalitis, P.N.; Ladavos, A.K.; Mavromoustakos, T.; Nicolaides, C.P. Structural, compositional and acidic characteristics of nanosized amorphous or partially crystalline ZSM-5 zeolite-based materials. Microporous Mesoporous Mater. 2004, 75, 89–100. [Google Scholar] [CrossRef]
  12. Näfe, G.; López-Martínez, M.-A.; Dyballa, M.; Hunger, M.; Traa, Y.; Hirth, T.; Klemm, E. Deactivation behavior of alkali-metal zeolites in the dehydration of lactic acid to acrylic acid. J. Catal. 2015, 329, 413–424. [Google Scholar] [CrossRef]
  13. Bonnotte, T.; Paul, S.; Araque, M.; Wojcieszak, R.; Dumeignil, F.; Katryniok, B. Dehydration of Lactic Acid: The State of The Art. ChemBioEng Rev. 2018, 5, 34–56. [Google Scholar] [CrossRef]
  14. Wadley, D.C.; Tam, M.S.; Kokitkar, P.B.; Jackson, J.E.; Miller, D.J. Lactic Acid Conversion to 2,3-Pentanedione and Acrylic Acid over Silica-Supported Sodium Nitrate: Reaction Optimization and Identification of Sodium Lactate as the Active Catalyst. J. Catal. 1997, 165, 162–171. [Google Scholar] [CrossRef]
  15. Structure Commission of the International Zeolite Association, Database of Zeolite Structures. Available online: https://europe.iza-structure.org/IZA-SC/framework.php?STC=PHI (accessed on 7 October 2022).
  16. Bayat, M.; Nabavi, M.S.; Mohammadi, T. An experimental study for finding the best condition for PHI zeolite synthesis using Taguchi method for gas separation. Chem. Pap. 2018, 72, 1139. [Google Scholar] [CrossRef]
  17. Kiyozumi, Y.; Nemoto, Y.; Nishide, T.; Nagase, T.; Hasegawa, Y.; Mizukami, F. Synthesis of acid-resistant Phillipsite (PHI) membrane and its pervaporation performance. Microporous Mesoporous Mater. 2008, 116, 485–490. [Google Scholar] [CrossRef]
  18. Gunter, G.C.; Miller, D.; Jackson, J.E. Formation of 2,3-Pentanedione from Lactic Acid over Supported Phosphate Catalysts. J. Catal. 1994, 148, 252–260. [Google Scholar] [CrossRef]
  19. Weitkamp, J. Critical Evaluation of Catalytic Testing of Zeolites. Stud. Surf. Sci. Catal. 1988, 37, 515–534. [Google Scholar] [CrossRef]
  20. Dimitrijevica, R.; Lutz, W.; Ritzmann, A. Hydrothermal stability of zeolites: Determination of extra-framework species of H-Y faujasite-type steamed zeolite. J. Phys. Chem. Solids 2006, 67, 1741–1748. [Google Scholar] [CrossRef]
  21. Xu, M.; Liu, X.; Madon, R.J. Pathways for Y Zeolite Destruction: The Role of Sodium and Vanadium. J. Catal. 2002, 207, 237–246. [Google Scholar] [CrossRef]
  22. Cruciani, G. Zeolites upon heating: Factors governing their thermal stability and structural changes. J. Phys. Chem. Solids 2006, 67, 1973–1994. [Google Scholar] [CrossRef]
  23. Thommes, M.; Cychosz, K.A.; Neimark, A.V. Chapter 4—Advanced Physical Adsorption Characterization of Nanoporous Carbons. In Novel Carbon Adsorbents; Elsevier: Amsterdam, The Netherlands, 2012; pp. 107–145. [Google Scholar] [CrossRef]
  24. Cychosz, K.A.; Guillet-Nicolas, R.; Garcıá-Martínez, J.; Thommes, M. Recent advances in the textural characterization of hierarchically structured nanoporous materials. Chem. Soc. Rev. 2017, 46, 389–414. [Google Scholar] [CrossRef] [PubMed]
  25. Sing, K.S.W.; Everett, D.H.; Haul, R.A.W.; Mouscou, L.; Pierotti, R.A.; Rouquerol, J.; Siemieniewska, T. Reporting physisorption data for gas/solid systems with special reference to the determination of surface area and porosity. Pure Appl. Chem. 1985, 57, 603–619. [Google Scholar] [CrossRef]
  26. Foster, M.D.; Rivin, I.; Treacy, M.M.J.; Friedrichs, O.D. A geometric solution to the largest-free-sphere problem in zeolite frameworks. Microporous Mesoporous Mater. 2006, 90, 32–38. [Google Scholar] [CrossRef]
  27. Occelli, M.L.; Kalwei, M.; Wolker, A.; Eckert, H.; Auroux, A.; Gould, S.A.C. The Use of Nuclear Magnetic Resonance, Microcalorimetry, and Atomic Force Microscopy to Study the Aging and Regeneration of Fluid Cracking Catalysts. J. Catal. 2000, 196, 134–148. [Google Scholar] [CrossRef]
  28. Gugeler, K. (University of Stuttgart, Stuttgart, Germany). Personal communication. 2021.
  29. Yan, B.; Tao, L.-Z.; Liang, Y.; Xu, B.-Q. Sustainable Production of Acrylic Acid: Alkali-Ion Exchanged Beta Zeolite for Gas-Phase Dehydration of Lactic Acid. ChemSusChem 2014, 7, 1568–1578. [Google Scholar] [CrossRef] [PubMed]
  30. Zhang, J.; Zhao, Y.; Pan, M.; Feng, X.; Ji, W.; Au, C.-T. Efficient Acrylic Acid Production through Bio Lactic Acid Dehydration over NaY Zeolite Modified by Alkali Phosphates. ACS Catal. 2011, 1, 32–41. [Google Scholar] [CrossRef]
  31. Shang, J.; Li, G.; Singh, R.; Gu, Q.; Nairn, K.M.; Bastow, T.J.; Medhekar, N.; Doherty, C.M.; Hill, A.J.; Liu, J.Z.; et al. Discriminative Separation of Gases by a “Molecular Trapdoor” Mechanism in Chabazite Zeolites. J. Am. Chem. Soc. 2012, 134, 19246–19253. [Google Scholar] [CrossRef]
  32. Wang, X.; Yan, N.; Xie, M.; Liu, P.; Bai, P.; Su, H.; Wang, B.; Wang, Y.; Li, L.; Cheng, T.; et al. The inorganic cation-tailored “trapdoor” effect of silicoaluminophosphate zeolite for highly selective CO2 separation. Chem. Sci. 2021, 12, 8803–8810. [Google Scholar] [CrossRef]
  33. Chen, H.; Song, C.; Yang, W. Effects of aging on the synthesis and performance of silicalite membranes on silica tubes without seeding. Microporous Mesoporous Mater. 2007, 102, 249–257. [Google Scholar] [CrossRef]
  34. Cook, J.D.; Thomson, R.W. Modeling the effect of gel aging. Zeolites 1988, 8, 322–326. [Google Scholar] [CrossRef]
  35. Kianfar, E. Nanozeolites: Synthesized, properties, applications. J. Sol-Gel Sci. Technol. 2019, 91, 415–429. [Google Scholar] [CrossRef]
  36. Altwasser, S. Engporige Zeolithe: Synthese, Charakterisierung und Katalytische Eigenschaften. Ph.D. Thesis, University of Stuttgart, Stuttgart, Germany, 2006; pp. 44–45. [Google Scholar] [CrossRef]
  37. Vu, D.T.; Kolah, A.K.; Asthana, N.S.; Peereboom, L.; Lira, C.T.; Miller, D.J. Oligomer distribution in concentrated lactic acid solutions. Fluid Phase Equilib. 2005, 236, 125–135. [Google Scholar] [CrossRef]
  38. Näfe, G.; Traa, Y.; Hirth, T.; Klemm, E. True Catalytic Behavior of Lactic Acid Dehydration on Zeolite Na-Y in the Gas Phase Measured by Means of a Novel Apparatus Design. Catal. Lett. 2014, 144, 1144–1150. [Google Scholar] [CrossRef]
  39. Komesu, A.; Martinez, P.F.M.; Betânia Hoss Lunelli, B.H.; Oliveira, J.; Maciel, M.R.W.; Filho, R.M. Study of Lactic Acid Thermal Behavior Using Thermoanalytical Techniques. J. Chem. 2017, 2017, 1–7. [Google Scholar] [CrossRef] [Green Version]
  40. Nagengast, J.; Hahn, S.; Taccardi, N.; Kehrer, M.; Kadar, J.; Collias, D.; Dziezok, P.; Wasserscheid, P.; Albert, J. Highly Selective Synthesis of Acrylic Acid from Lactide in the Liquid Phase. ChemSusChem 2018, 11, 2936–2943. [Google Scholar] [CrossRef] [PubMed]
  41. Ohara, T.; Sato, T.; Shimizu, N.; Prescher, G.; Schwind, H.; Weiberg, O.; Marten, K.; Greim, H.; Shaffer, T.D.; Nandi, P. Acrylic Acid and Derivatives. In Ullmann’s Encyclopedia of Industrial Chemistry, 7th ed.; Wiley-VCH Verlag GmbH & Co. KGaA: Weinheim, Germany, 2020. [Google Scholar] [CrossRef]
  42. Bannwarth, C.; Ehlert, S.; Grimme, S. GFN2-xTB—An Accurate and Broadly Parametrized Self-Consistent Tight-Binding Quantum Chemical Method with Multipole Electrostatics and Density-Dependent Dispersion Contributions. J. Chem. Theory Comput. 2019, 15, 1652–1671. [Google Scholar] [CrossRef]
  43. A Development of University of Karlsruhe and Forschungszentrum Karlsruhe GmbH, 1989–2007; Turbomole V7.4.1 2019; TURBOMOLE GmbH: Karlsruhe, Germany, 2007.
  44. Sherwood, P.; de Vries, A.H.; Guest, M.F.; Schreckenbach, G.; Catlow, C.R.A.; French, S.A.; Sokol, A.A.; Bromley, S.T.; Thiel, W.; Turner, A.J.; et al. QUASI: A general purpose implementation of the QM/MM approach and its application to problems in catalysis. J. Mol. Struct. THEOCHEM 2003, 632, 1–28. [Google Scholar] [CrossRef]
  45. Metz, S.; Kästner, J.; Sokol, A.A.; Keal, T.W.; Sherwood, P. ChemShell—A modular software package for QM/MM simulations. WIREs Comput. Mol. Sci. 2014, 4, 101–110. [Google Scholar] [CrossRef]
  46. Kästner, J.; Carr, J.M.; Keal, T.W.; Thiel, W.; Wander, A.; Sherwood, P. DL-FIND: An Open-Source Geometry Optimizer for Atomistic Simulations. J. Phys. Chem. A 2009, 113, 11856–11865. [Google Scholar] [CrossRef]
  47. Pracht, P.; Bohle, F.; Grimme, S. Automated exploration of the low-energy chemical space with fast quantum chemical methods. Phys. Chem. Chem. Phys. 2020, 22, 7169–7192. [Google Scholar] [CrossRef] [PubMed]
  48. Humphrey, W.; Dalke, A.; Schulten, K. VMD—Visual Molecular Dynamics. J. Mol. Graph. 1996, 14, 33–38. [Google Scholar] [CrossRef] [PubMed]
  49. Rieg, C.; Dittmann, D.; Li, Z.; Lawitzki, R.; Gugeler, K.; Maier, S.; Schmitz, G.; Kästner, J.; Estes, D.P.; Dyballa, M. Quantitative Distinction between Noble Metals Located in Mesopores from Those on the External Surface. Chem. Eur. J. 2021, 27, 17012–17023. [Google Scholar] [CrossRef] [PubMed]
  50. Rieg, C.; Kirchhof, M.; Gugeler, K.; Beurer, A.-K.; Stein, L.; Dirnberger, K.; Frey, W.; Bruckner, J.R.; Traa, Y.; Kästner, J.; et al. Determination of Accessibility and Spatial Distribution of Chiral Rh Diene Complexes Immobilized on SBA-15 via Phosphine-based Solid-State NMR Probe Molecules. Catal. Sci. Technol. 2023, 13, 410–425. [Google Scholar] [CrossRef]
Figure 1. Conversion pathways of lactic acid. Decarbonylation and decarboxylation to acetaldehyde and condensation to 2,3-pentanedione, respectively, compete with the desired dehydration to acrylic acid [18].
Catalysts 13 00261 g001
Figure 2. Powder X-ray diffractograms of the catalysts. (a) ls-material; (b) hs-material. The simulated PHI pattern confirms that crystalline PHI zeolites were synthesized. The various treatments cause the crystallinity to decrease.
Catalysts 13 00261 g002
Figure 3. CO2 physisorption isotherms at 273 K in (a) logarithmic scale and (b) linear scale for Na,K-PHI_ls_calc_15% (□), Na,K-PHI_hs_a.s._90% (▽), Na,K-PHI_hs_calc_16% (◯). The textural differences are evident in the isotherms.
Catalysts 13 00261 g003
Figure 4. 27Al MAS NMR spectra of the hydrated zeolites. (a) Na,K-PHI_hs_a.s._90%; (b) Na,K-PHI_a.s._N2_39%; (c) Na,K-PHI_ls_calc_15%; (d) Na,K-PHI_ls_calc_steamed_14%; (e) Na,K-PHI_hs_calc_16%.
Catalysts 13 00261 g004
Figure 5. SEM pictures of the zeolites to see the morphology. (a,b) Na,K-PHI_ls_calc_15%; (c,d) Na,K-PHI_hs_calc_16%; (e,f) Na,K-PHI_hs_a.s._90%.
Catalysts 13 00261 g005
Table 1. Catalytic performance of the zeolites during the reaction of lactic acid. The mean conversion of lactic acid X ¯ ( LA )   and the mean selectivities to acetaldehyde S ¯ ( AcH ) , acrylic acid S ¯ ( AA )   and 2,3-pentanedione S ¯ ( PDN ) over the total TOS of 285 min are shown. The standard deviation of the mean values to the individual measuring points is given in parentheses. Na,K-PHI_ls_calc_15% was measured twice to show reproducibility, the mean values and standard deviation were calculated over both measurements. Na,K-PHI_ls_calc_steamed_14%, Na,K-PHI_ hs_a.s._90% and Na,K-PHI_ hs_calc_16% were measured once. Reaction conditions: 0.5 g catalyst, LHSV = 3 h−1, 598 K.
Na,K-PHI_
ls_calc_15%
Na,K-PHI_
ls_calc_steamed_14%
Na,K-PHI_
hs_a.s._90%
Na,K-PHI_
hs_calc_16%
X ¯ ( LA )   /   % 43 (±0.5)47 (±3.6)36 (±2.2)37 (±2.9)
S ¯ ( AcH )   /   % 10 (±2.1)9 (±0.7)32 (±4.8)14 (±1.5)
S ¯ ( AA )   /   % 36 (±1.6)34 (±1.8)5 (±0.2)11 (±0.9)
S ¯ ( PDN )   /   % 14 (±2.1)14 (±0.8)0 (±0.0)2 (±0.2)
Table 2. Chemical composition of the catalysts before the reaction measured by ICP-OES, relative crystallinity calculated from the XRD data, crystal and particle sizes based on the SEM images.
Na,K-PHI_
ls_calc_15%
Na,K-PHI_
ls_calc_steamed_14%
Na,K-PHI_
hs_a.s._90%
Na,K-PHI_
hs_calc_16%
nSi/nAl2.32.42.42.2
nNa/nAl0.570.520.510.58
nK/nAl0.470.440.470.47
Relative crystallinity/%15149016
Crystal size/μm0.17–0.37n.a.0.17–0.320.15–0.47
Particle size/μm4.84–6.75n.a.1.67–2.460.84–1.63
Table 3. Brunauer-Emmett-Teller (BET) surface area S(BET) and Dubinin-Radushkevich (DR) micropore volume V(DR μ-pore) determined by CO2 physisorption at 273 K.
Na,K-PHI_
ls_calc_15%
Na,K-PHI_
hs_a.s._90%
Na,K-PHI_
hs_calc_16%
S(BET)/m2⋅g-172384446
V(DR μ-pore)/cm3⋅g-10.0060.0910.164
Table 4. Comparison of the main differences of the two PHI syntheses.
1st Batch
Na,K-PHI_ls_...
2nd Batch
Na,K-PHI_hs_...
KOH8.8 g7.5 g
Addition order of solutions[(3) + (1)] + (2)[(1) + (3)] + (2)
Aging1 dayno
Time of hydrothermal synthesis12 days10 days
NaAlO2completely dissolved only on a water bath
(probably containing Al2O3)
completely dissolved at room temperature
Disclaimer/Publisher’s Note: The statements, opinions and data contained in all publications are solely those of the individual author(s) and contributor(s) and not of MDPI and/or the editor(s). MDPI and/or the editor(s) disclaim responsibility for any injury to people or property resulting from any ideas, methods, instructions or products referred to in the content.

