
Cobalt Catalyzed Fischer-Tropsch Synthesis with O2-Containing Syngas
Abstract
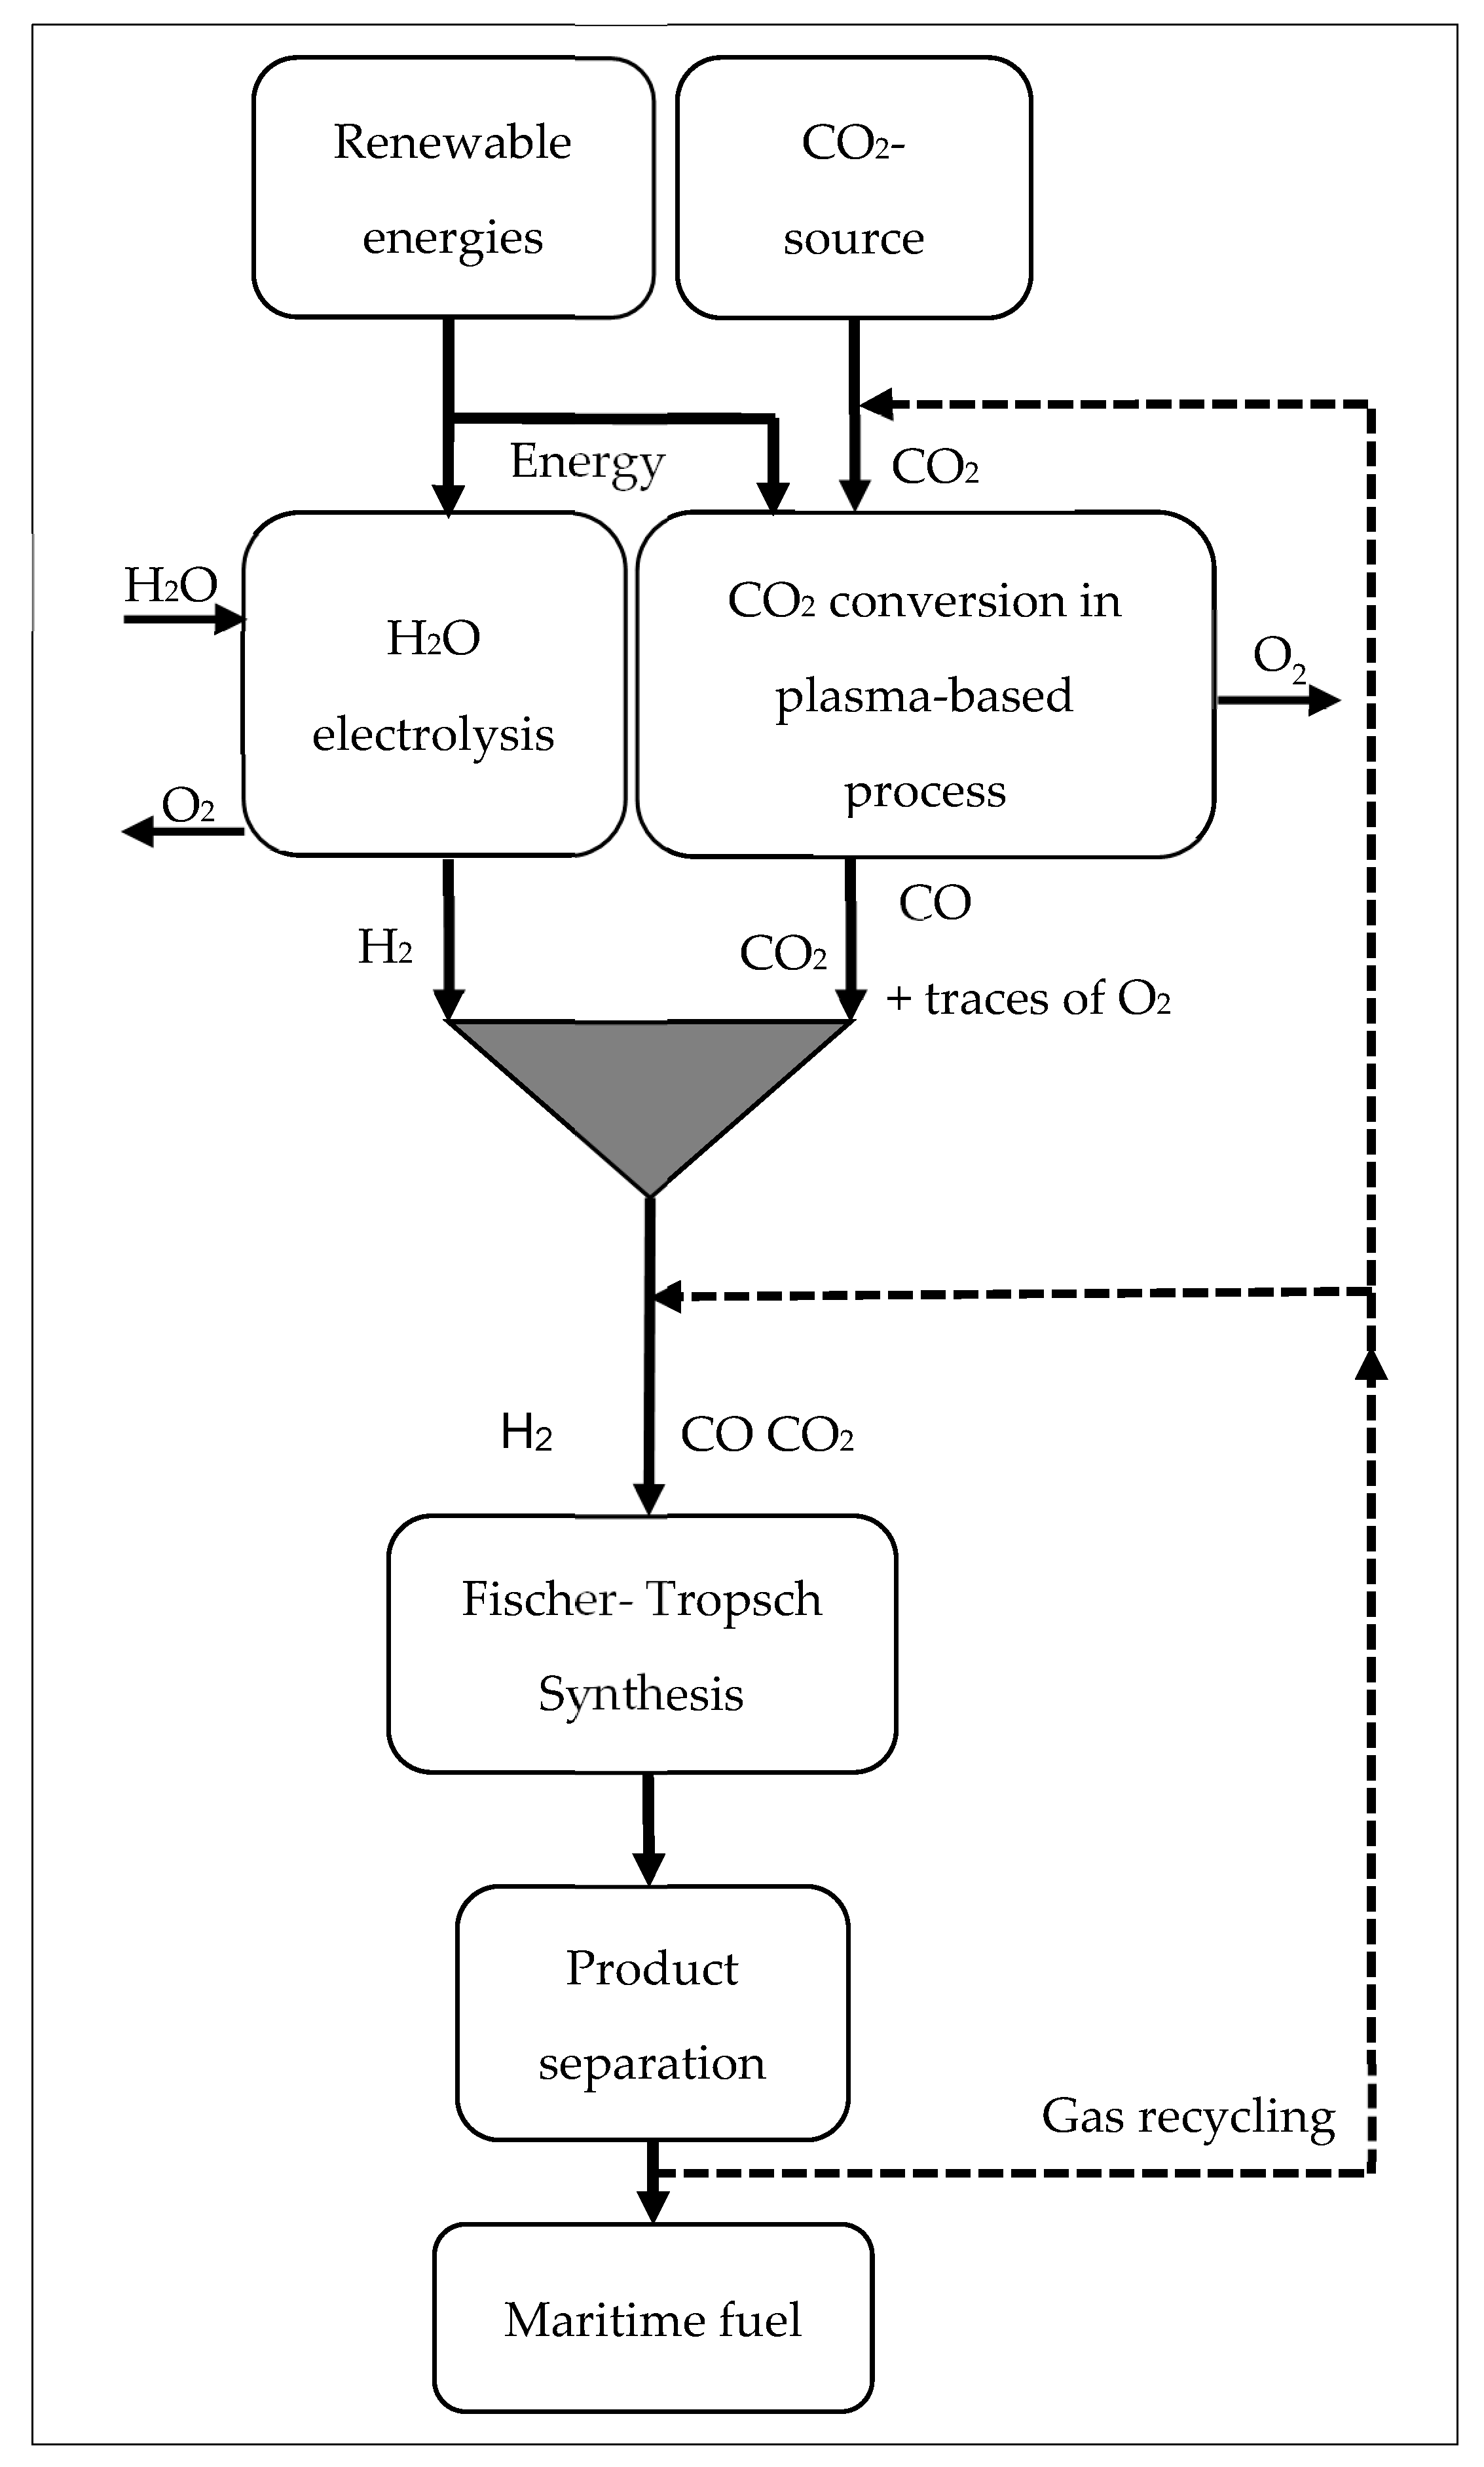
:1. Introduction
- Does the FT catalyst remain active for FTS in the presence of O2?
- If the answer of 1. is yes, does the product composition of the FTS change?
- Where does the O2 end up (selectivity to H2O and CO2)?
- What has to be considered in terms of process/FTS reactor safety?
2. Results and Discussion
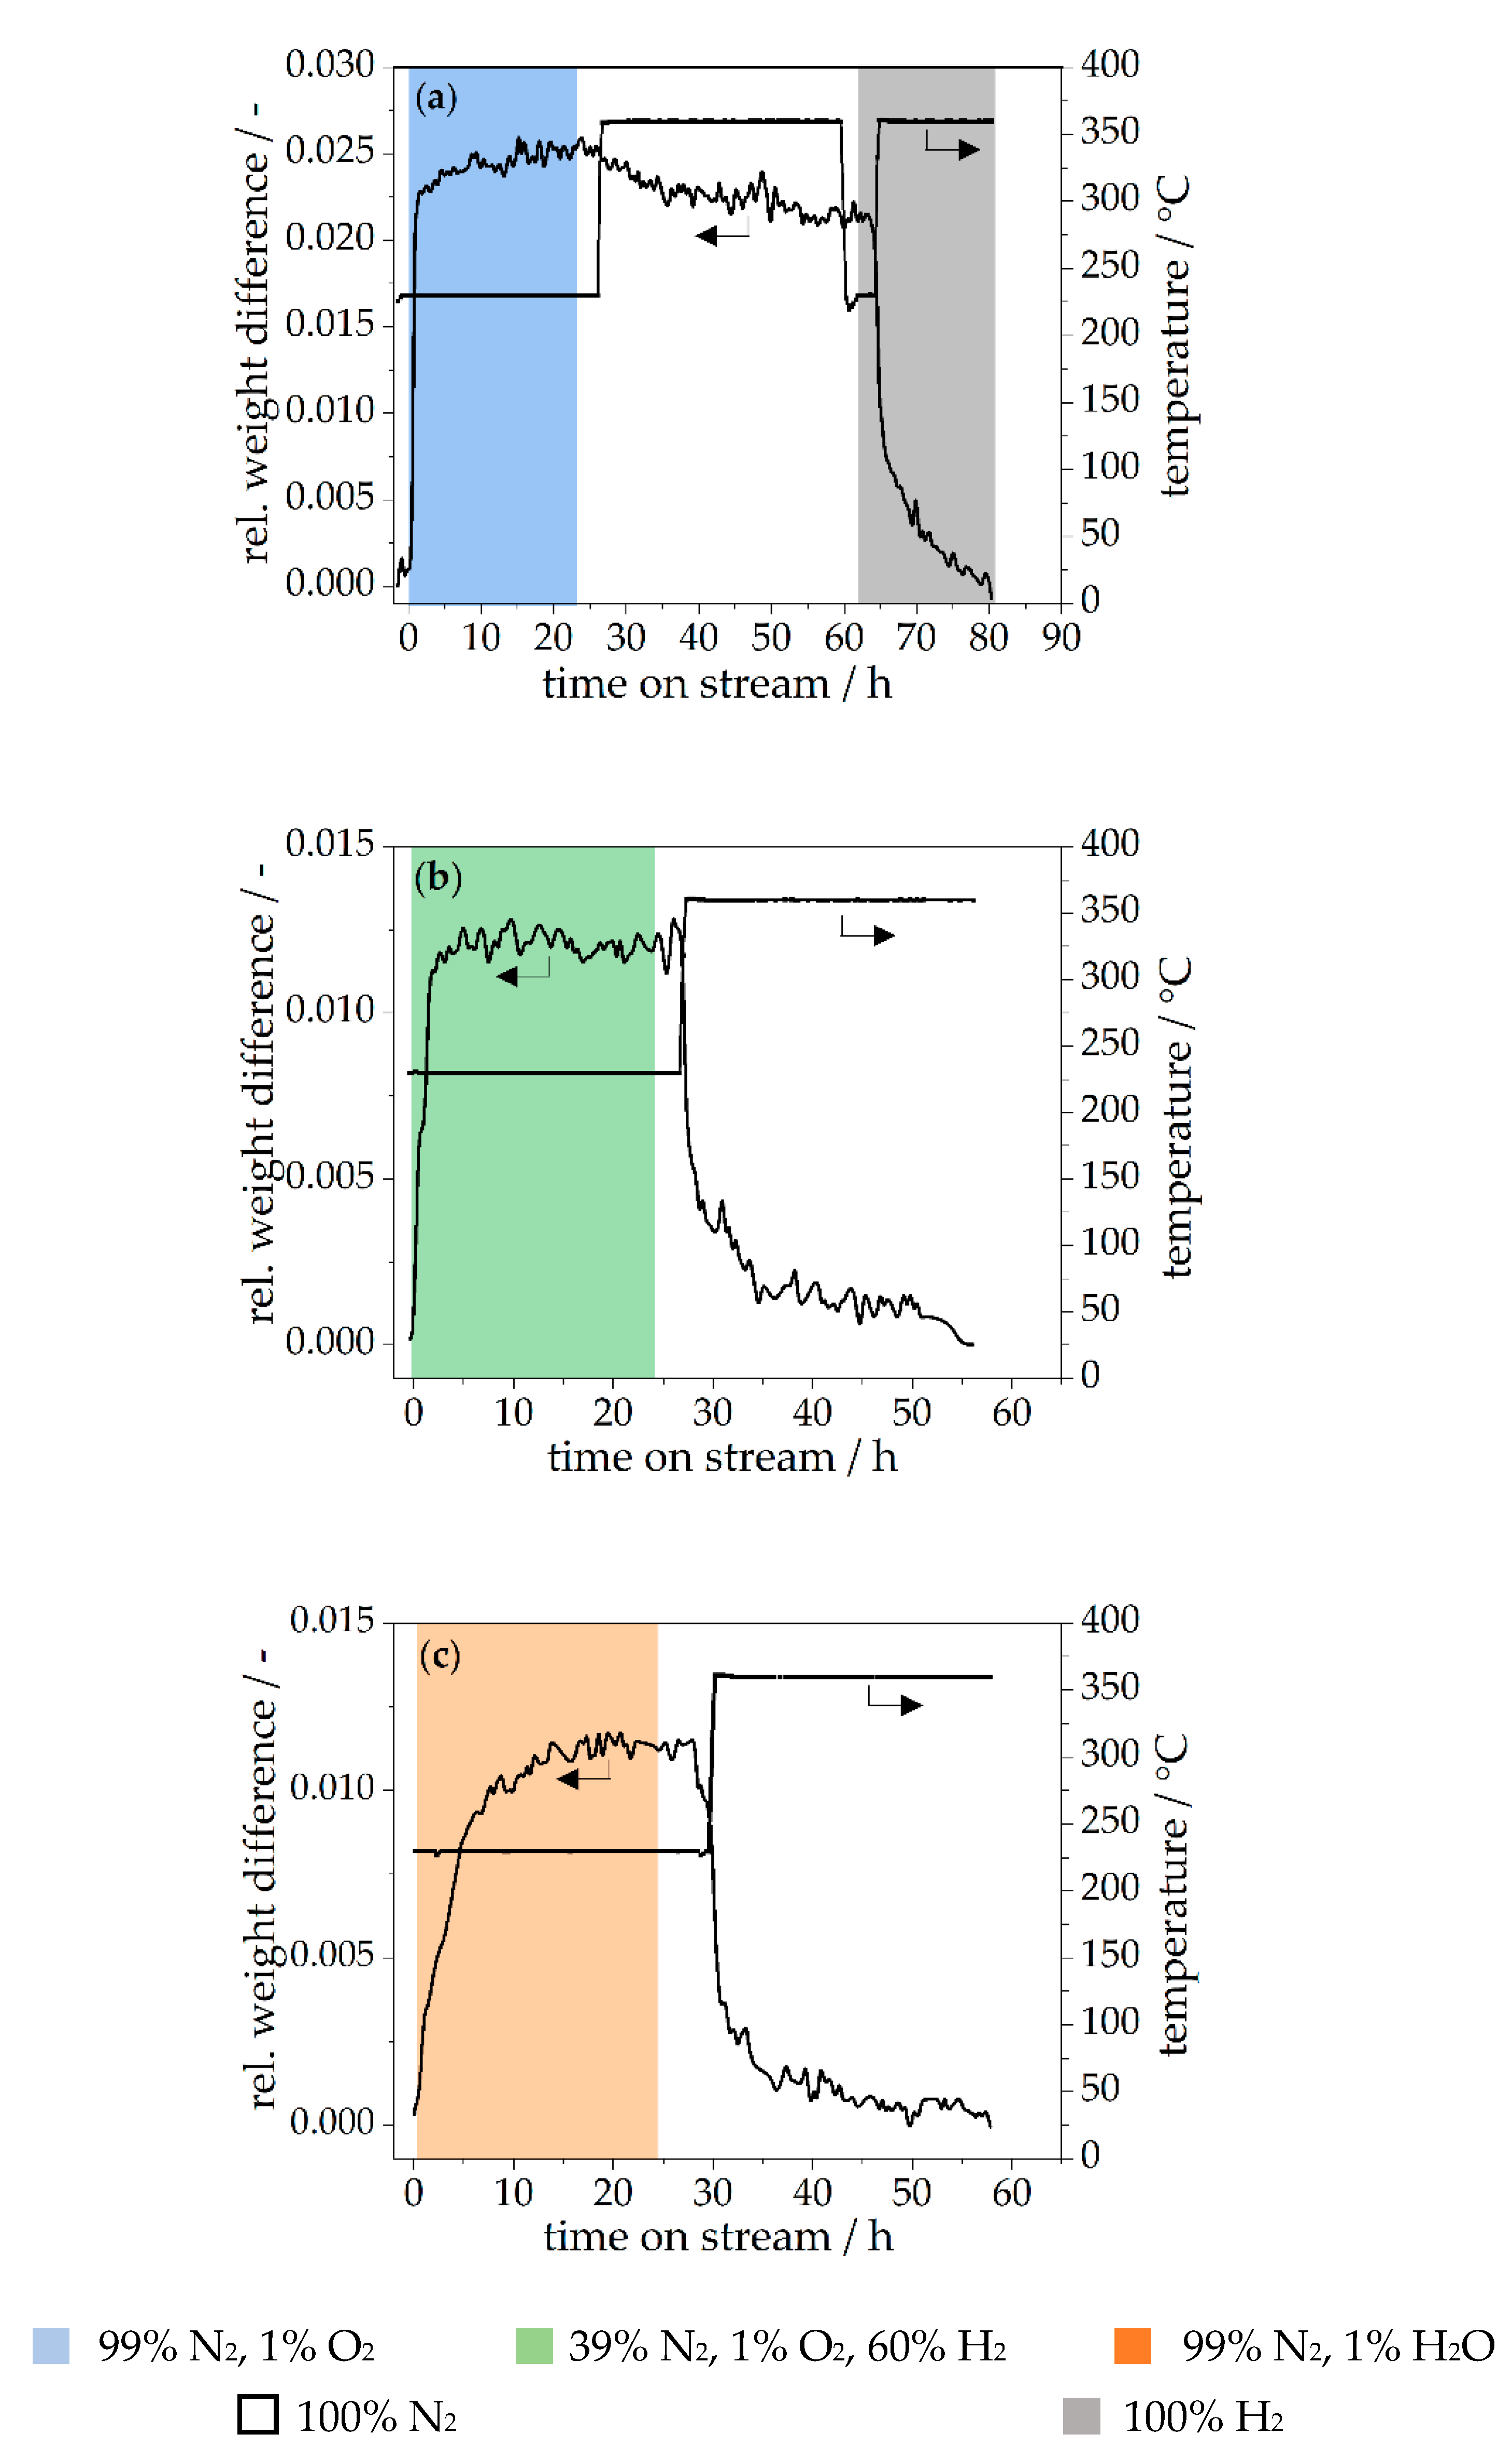
2.1. Stability of the FT Co Catalyst against O2 in O2-Containing Gas Mixtures
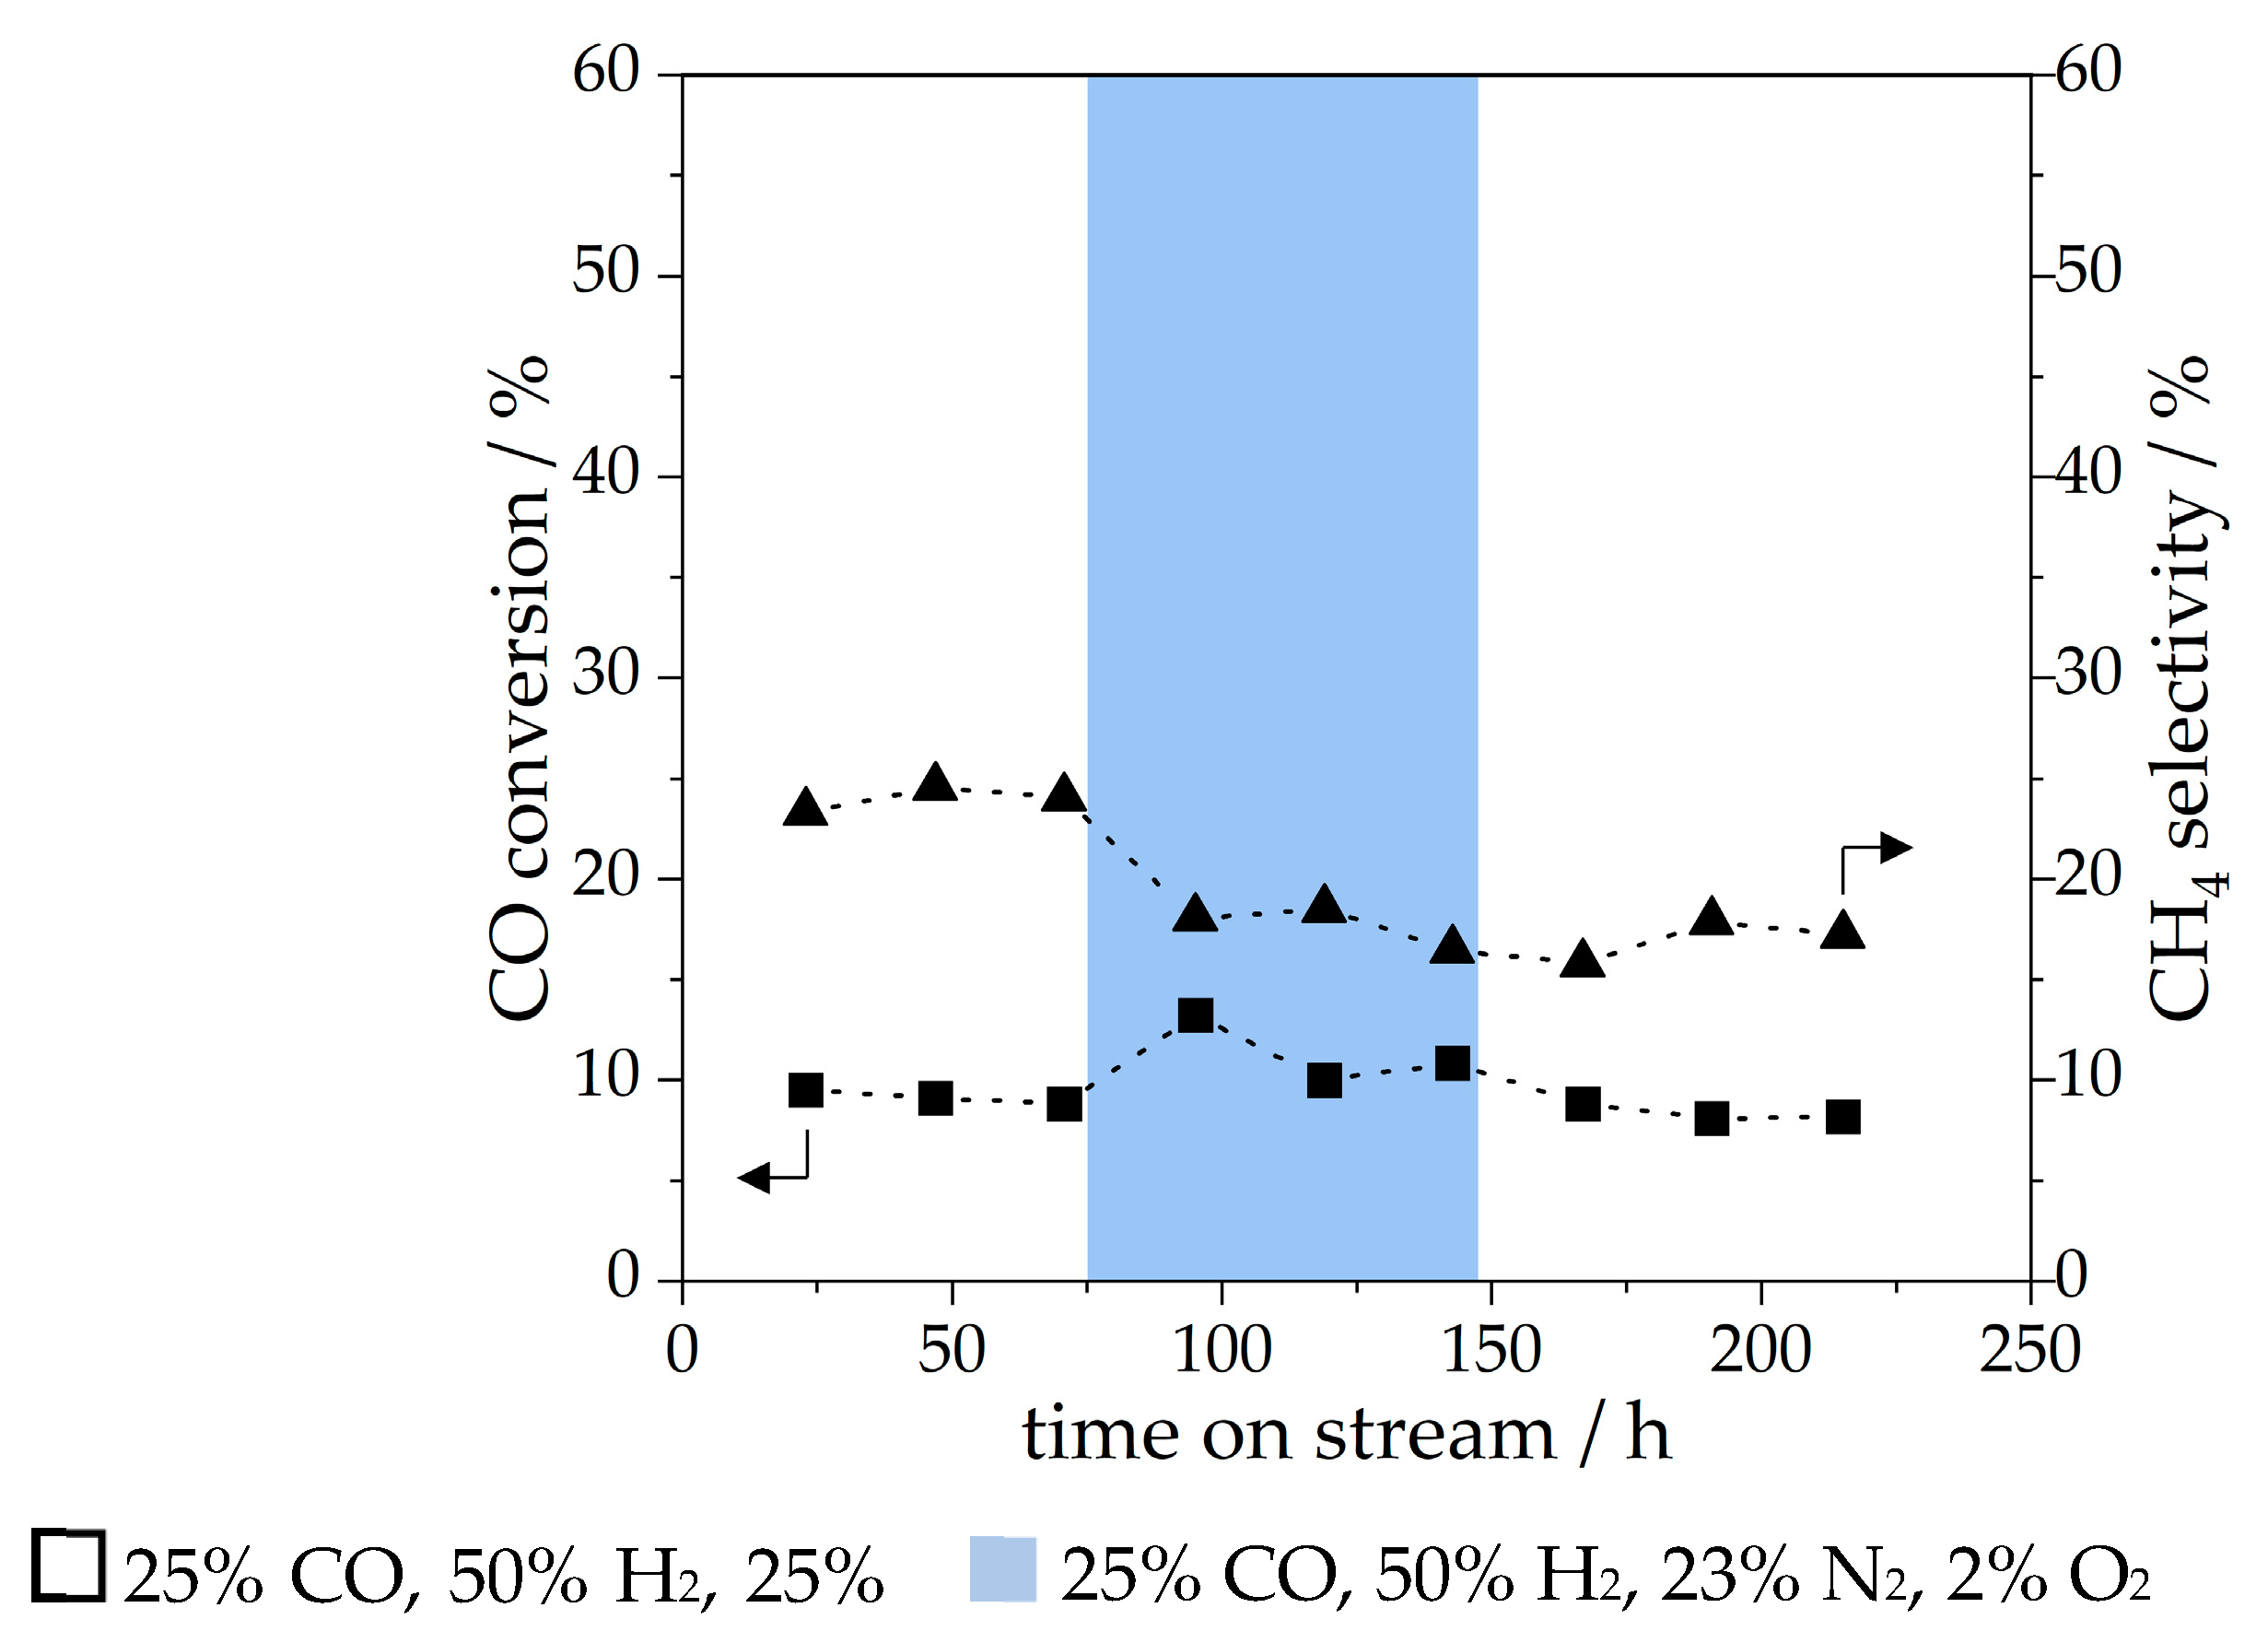
2.2. Reactivity of Co Catalyst for Fischer-Tropsch Synthesis with O2-Containing Syngas
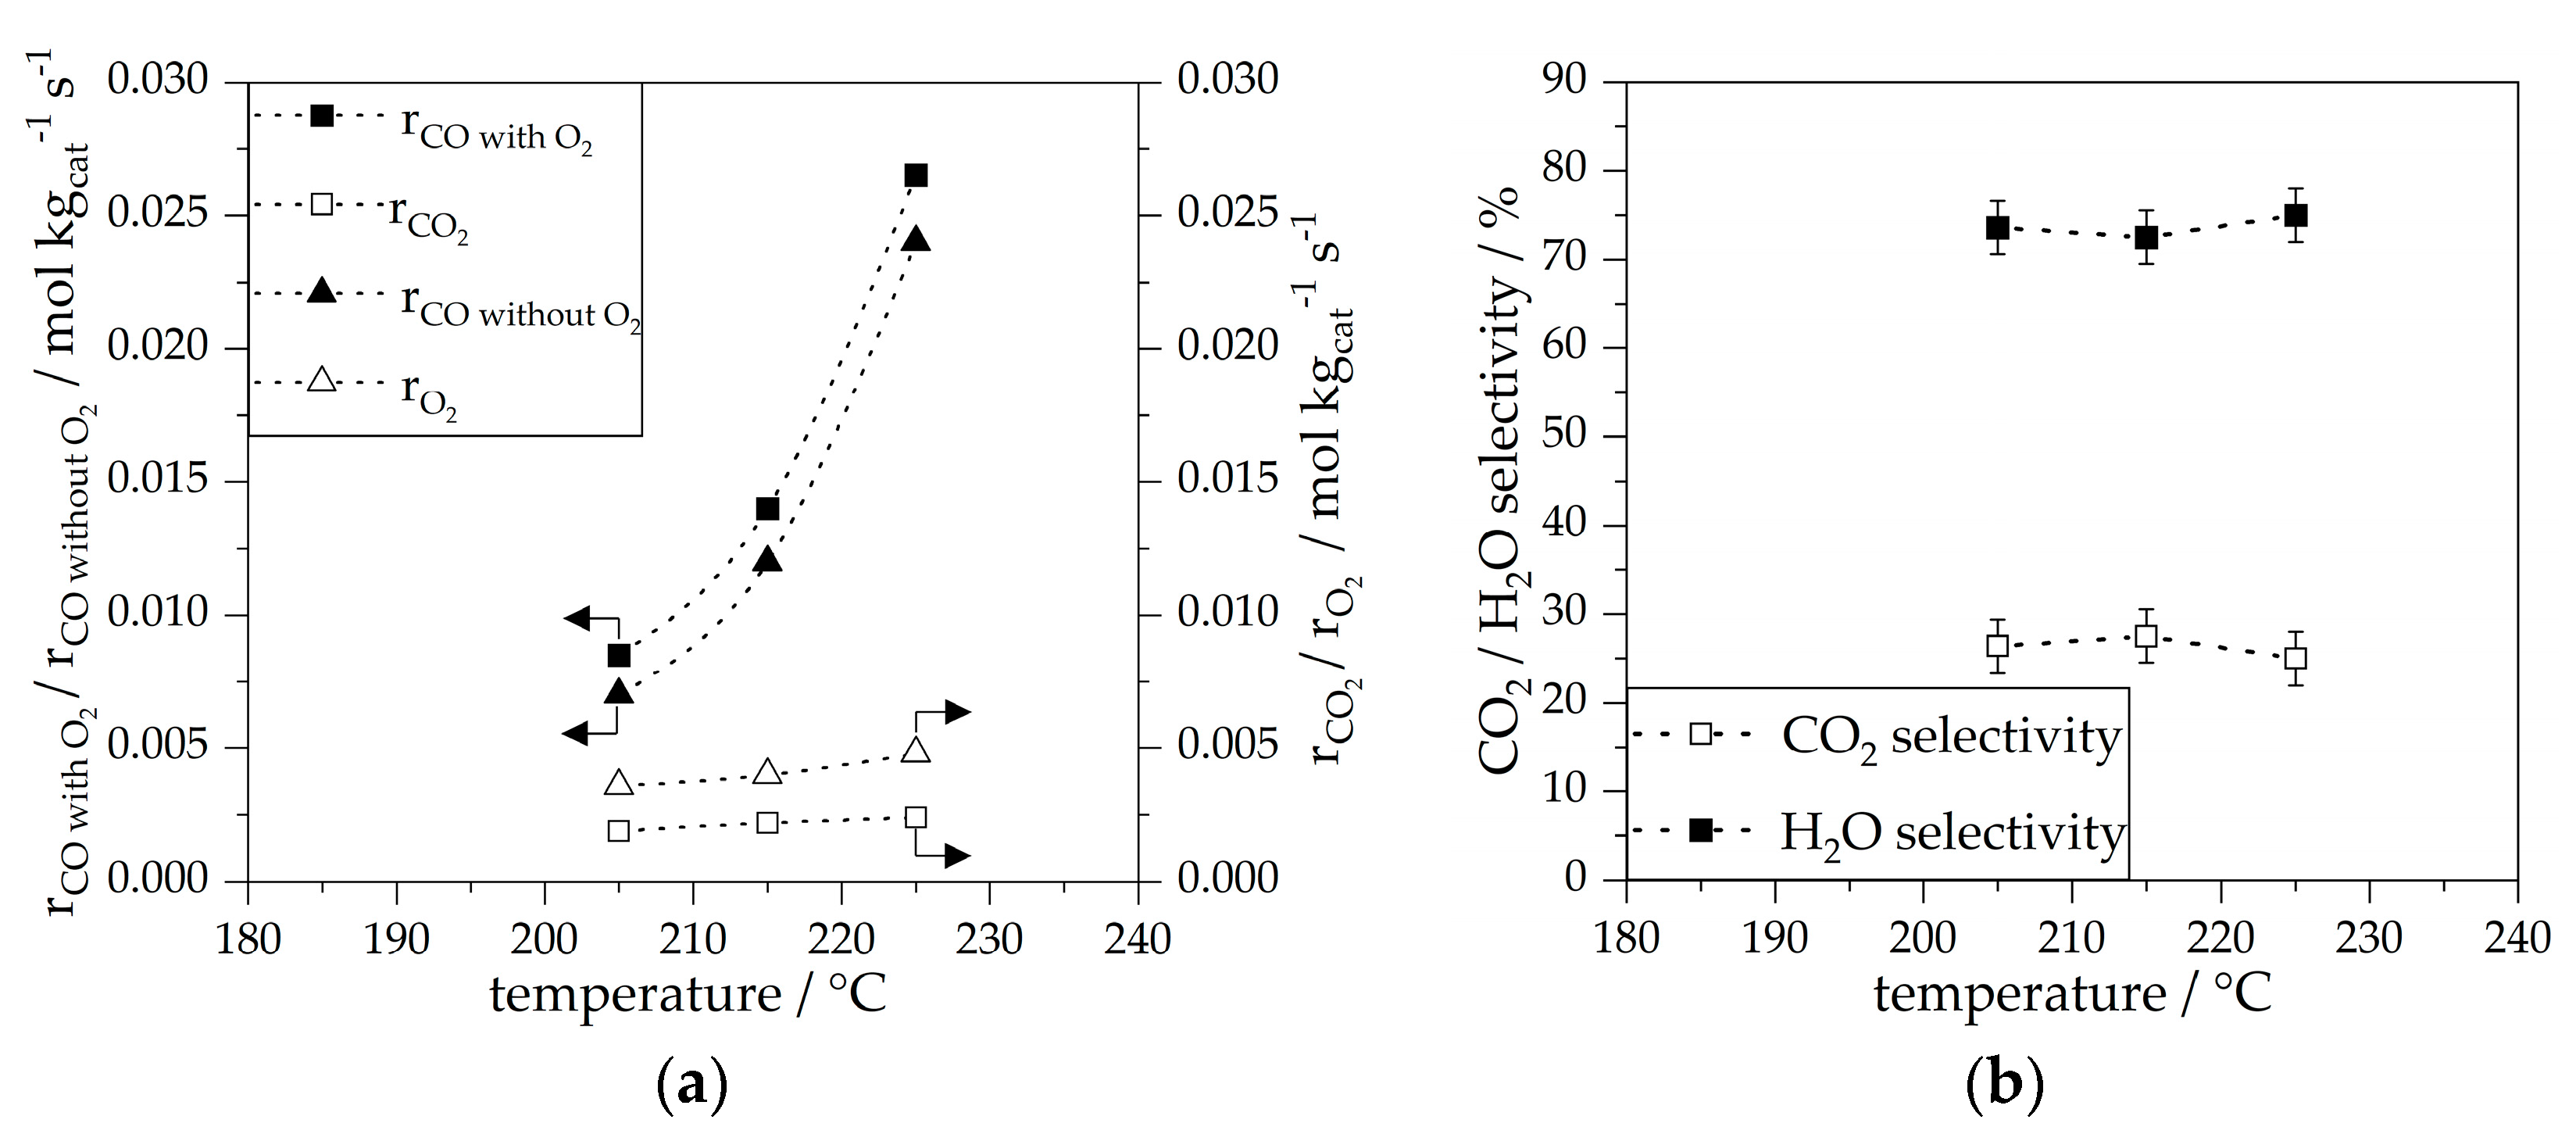
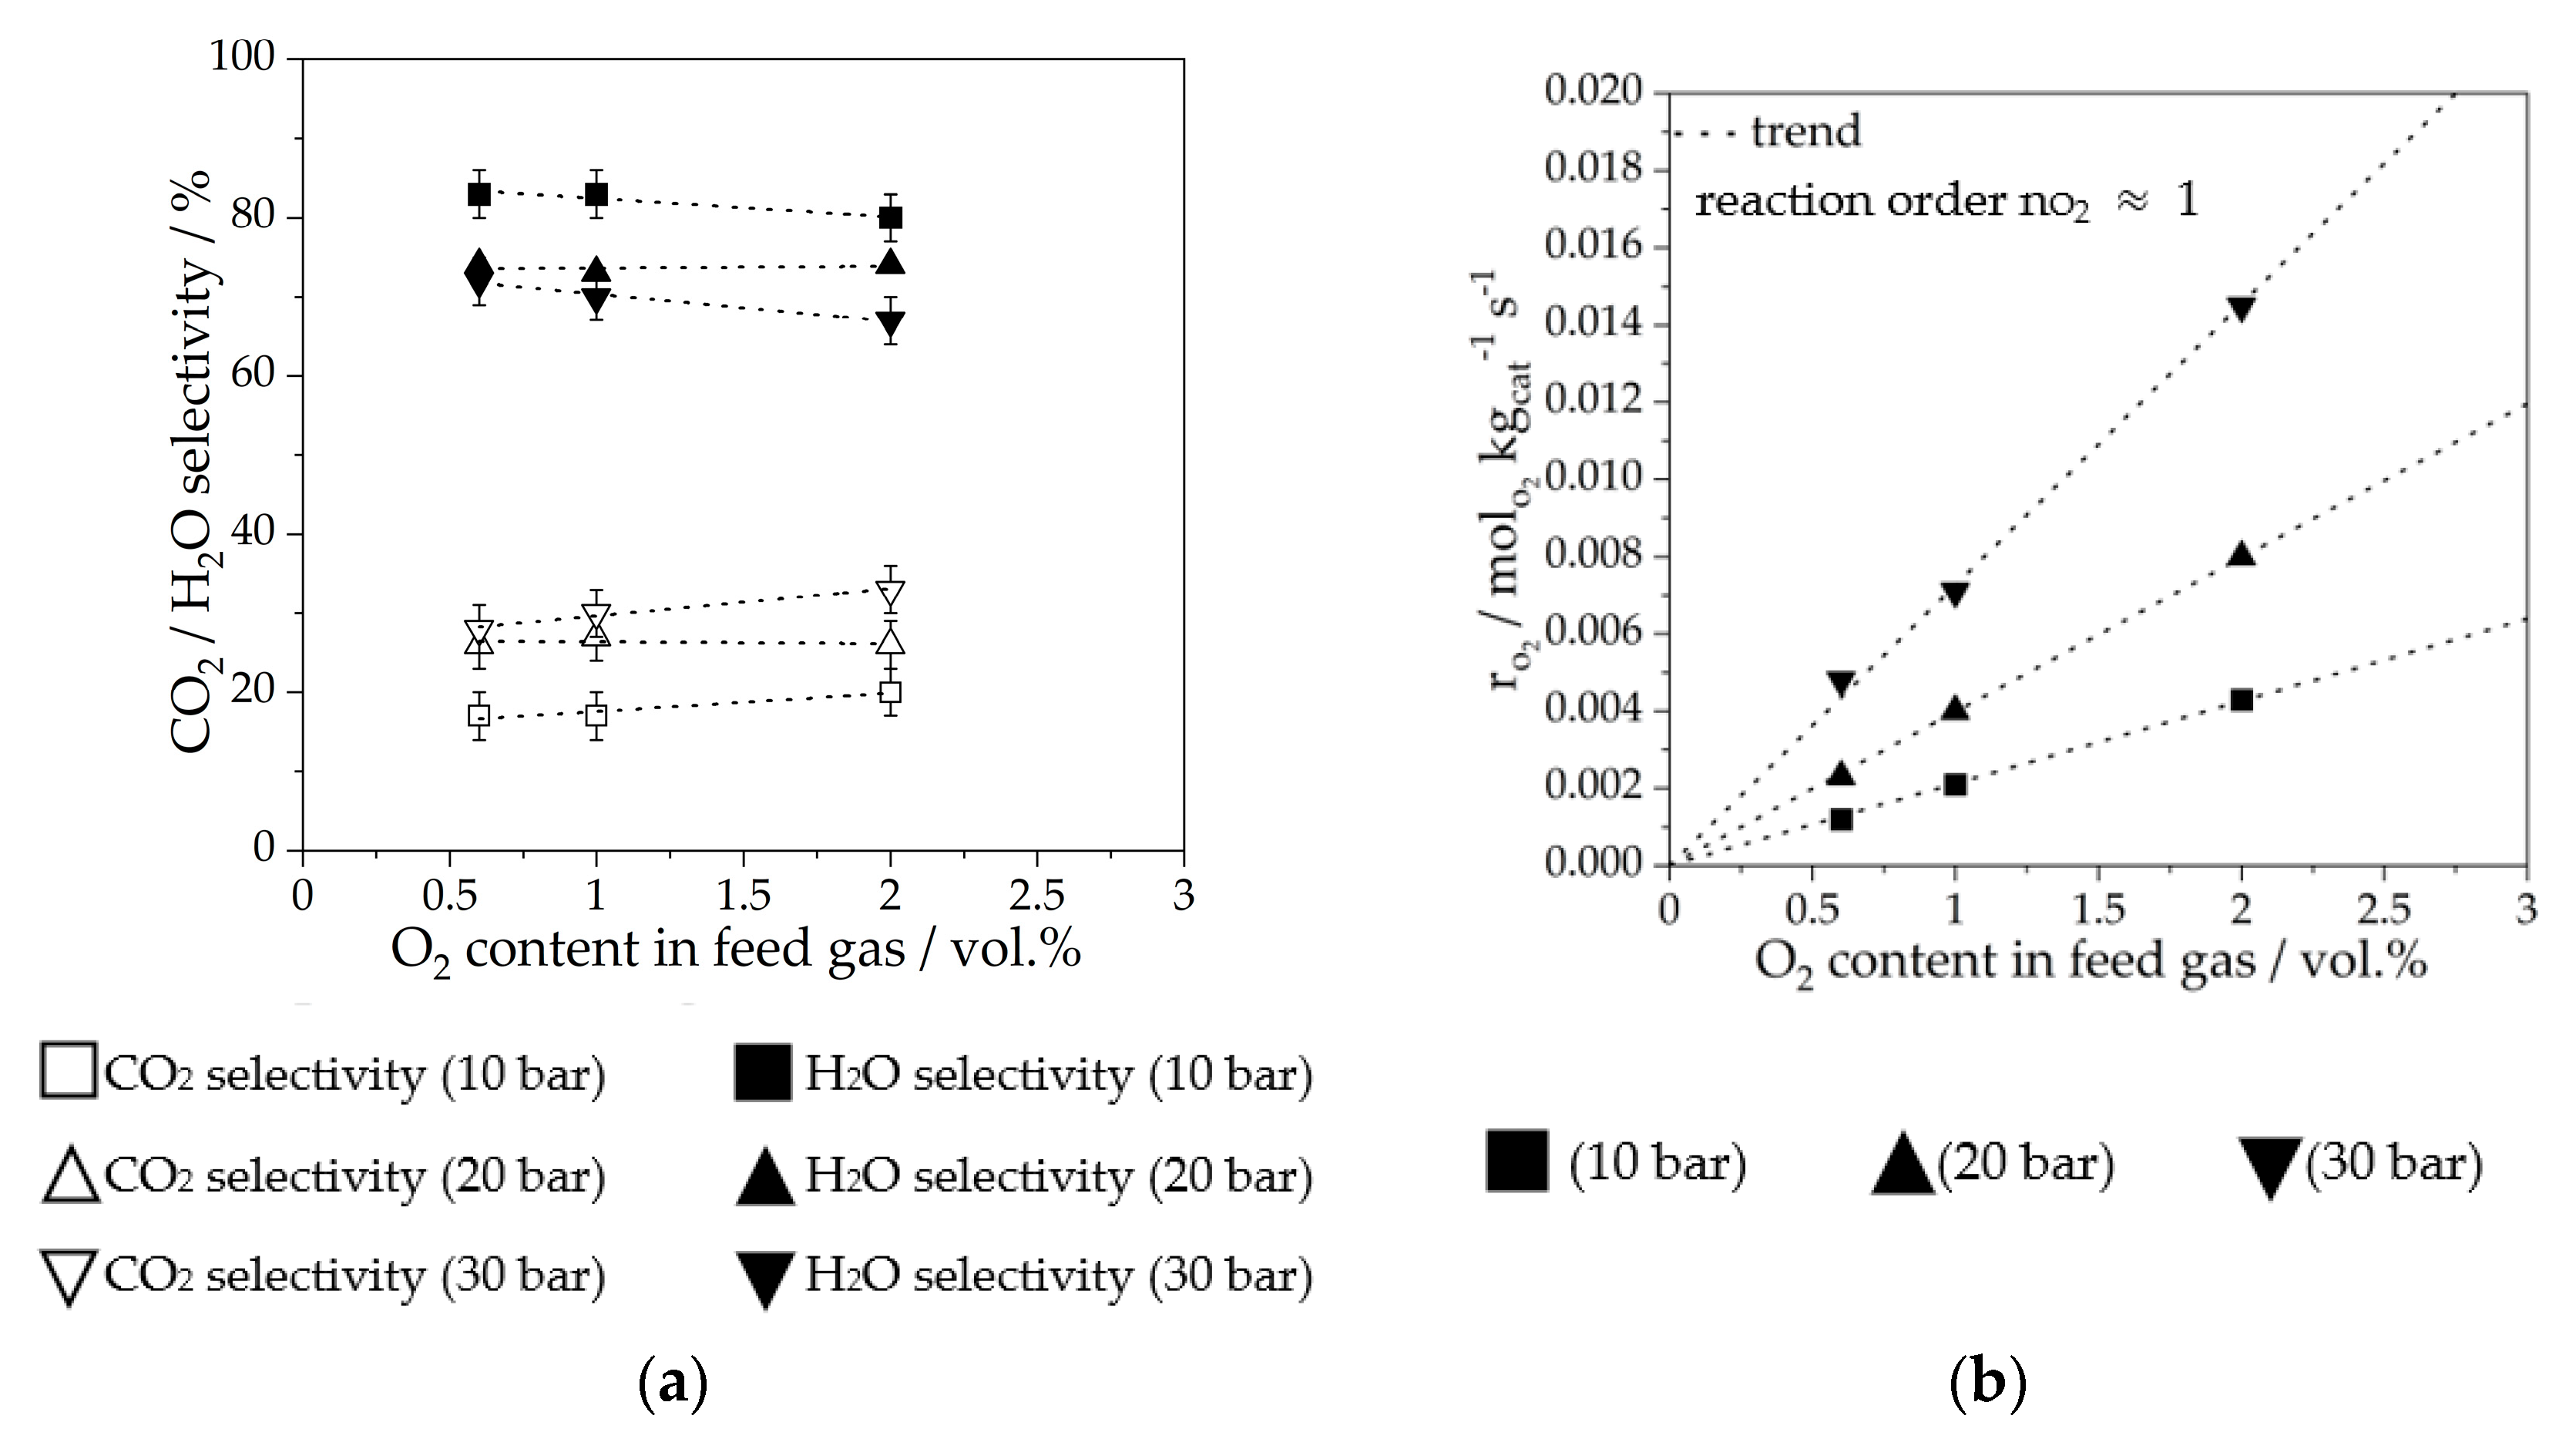
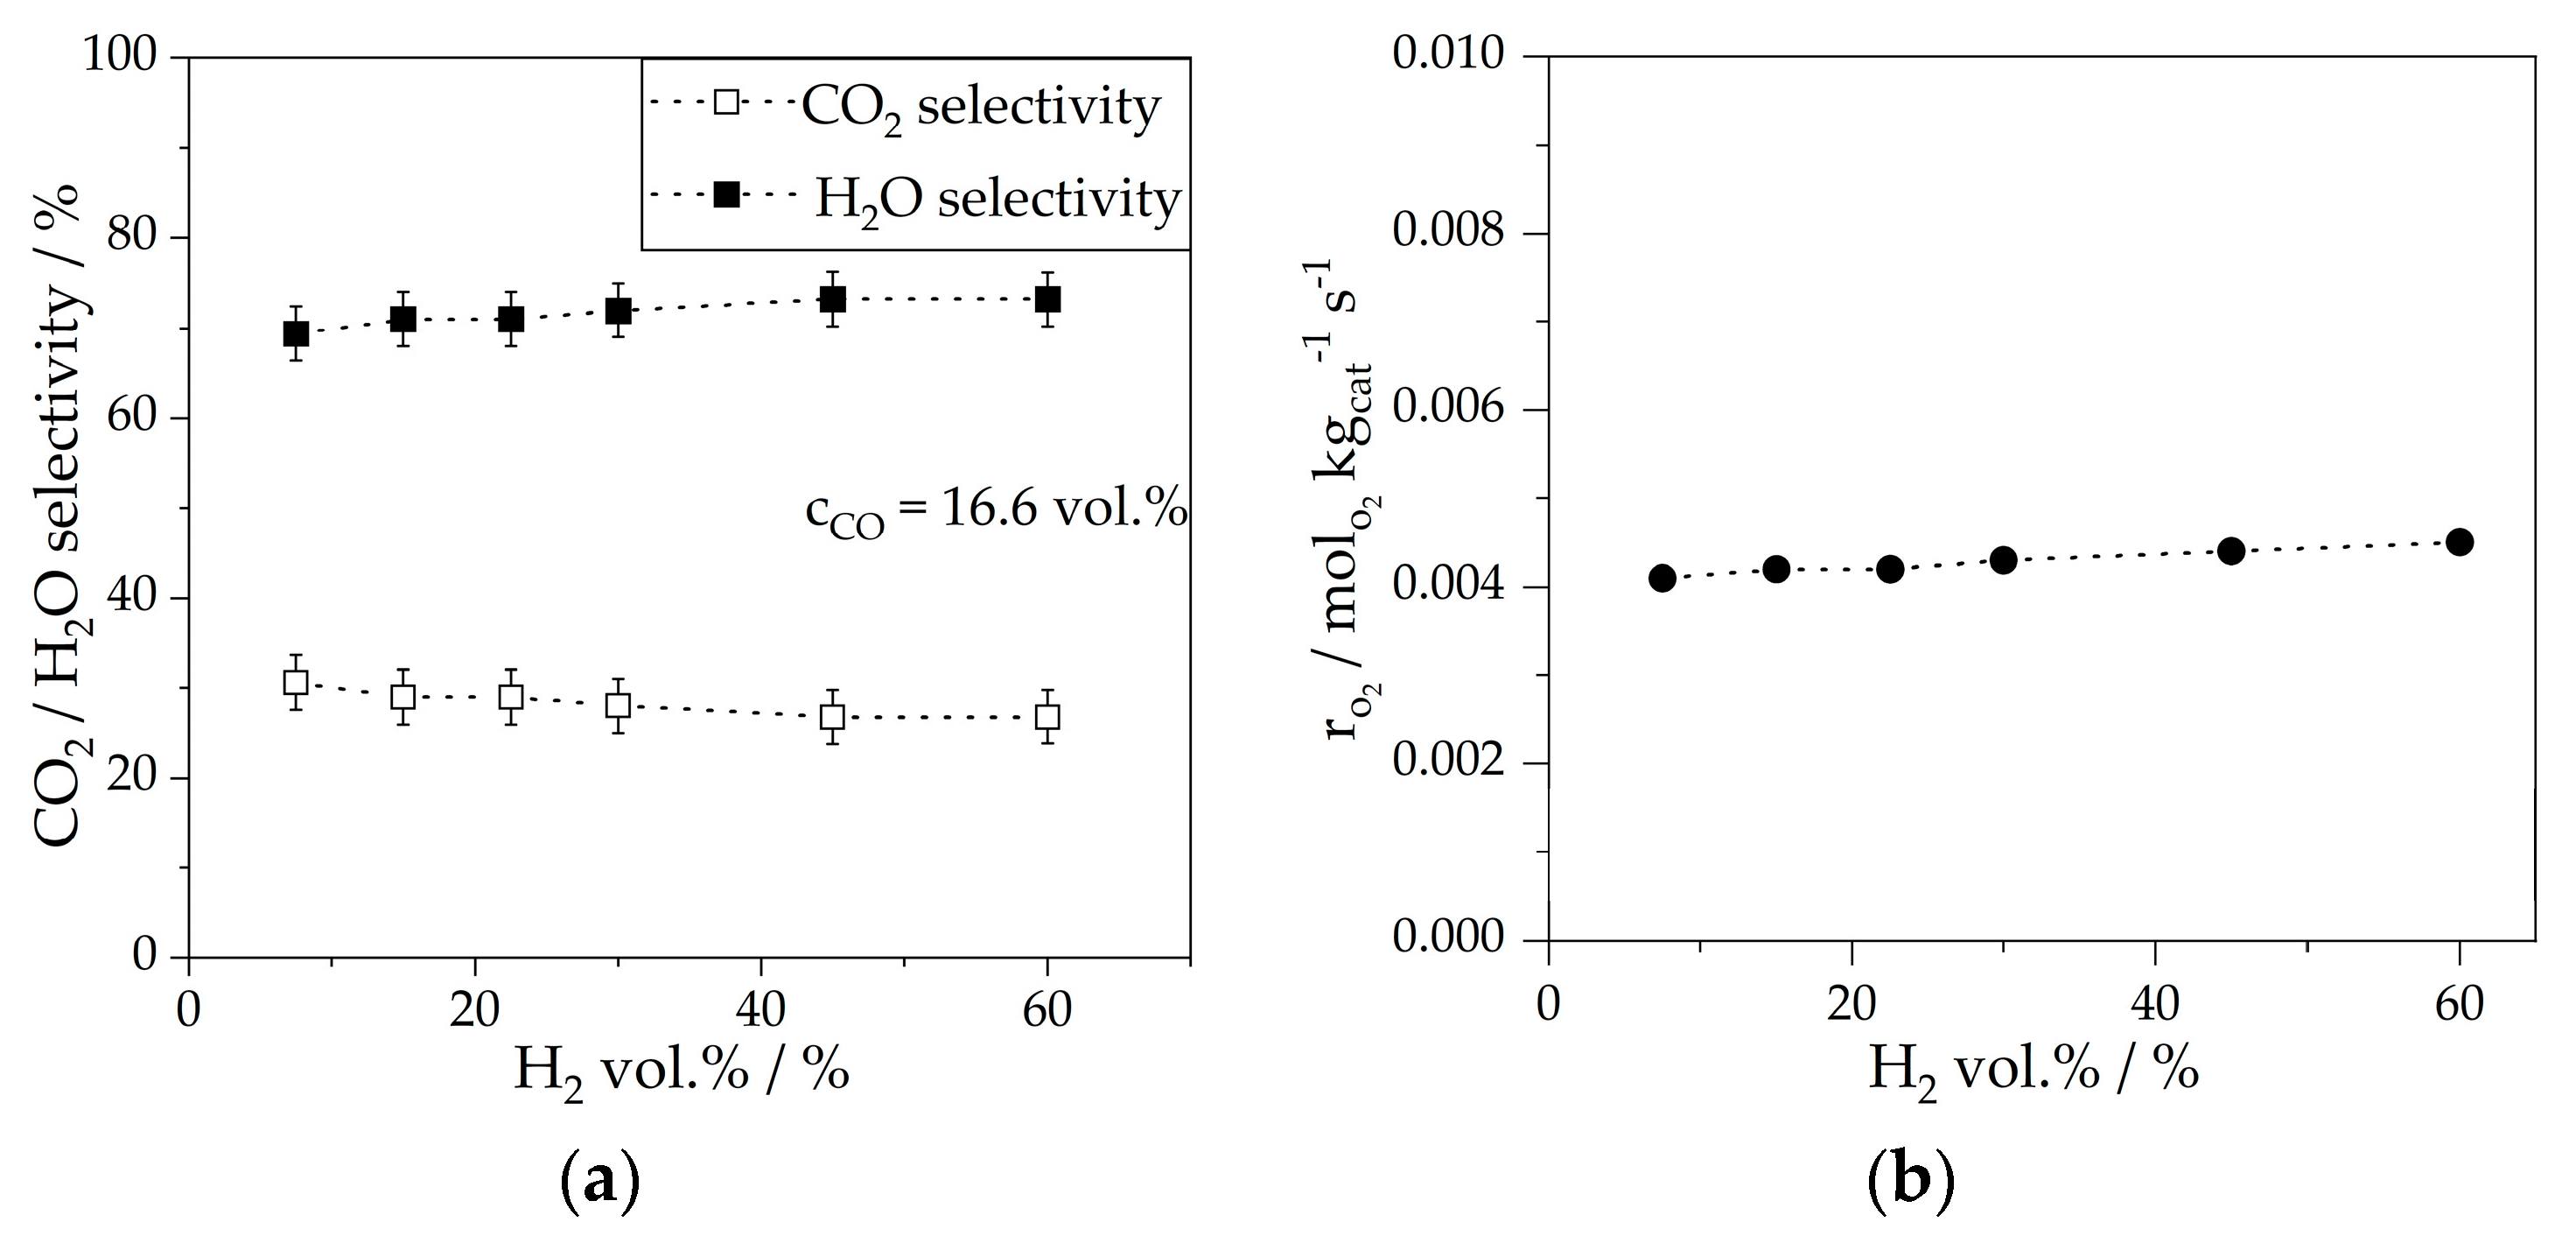
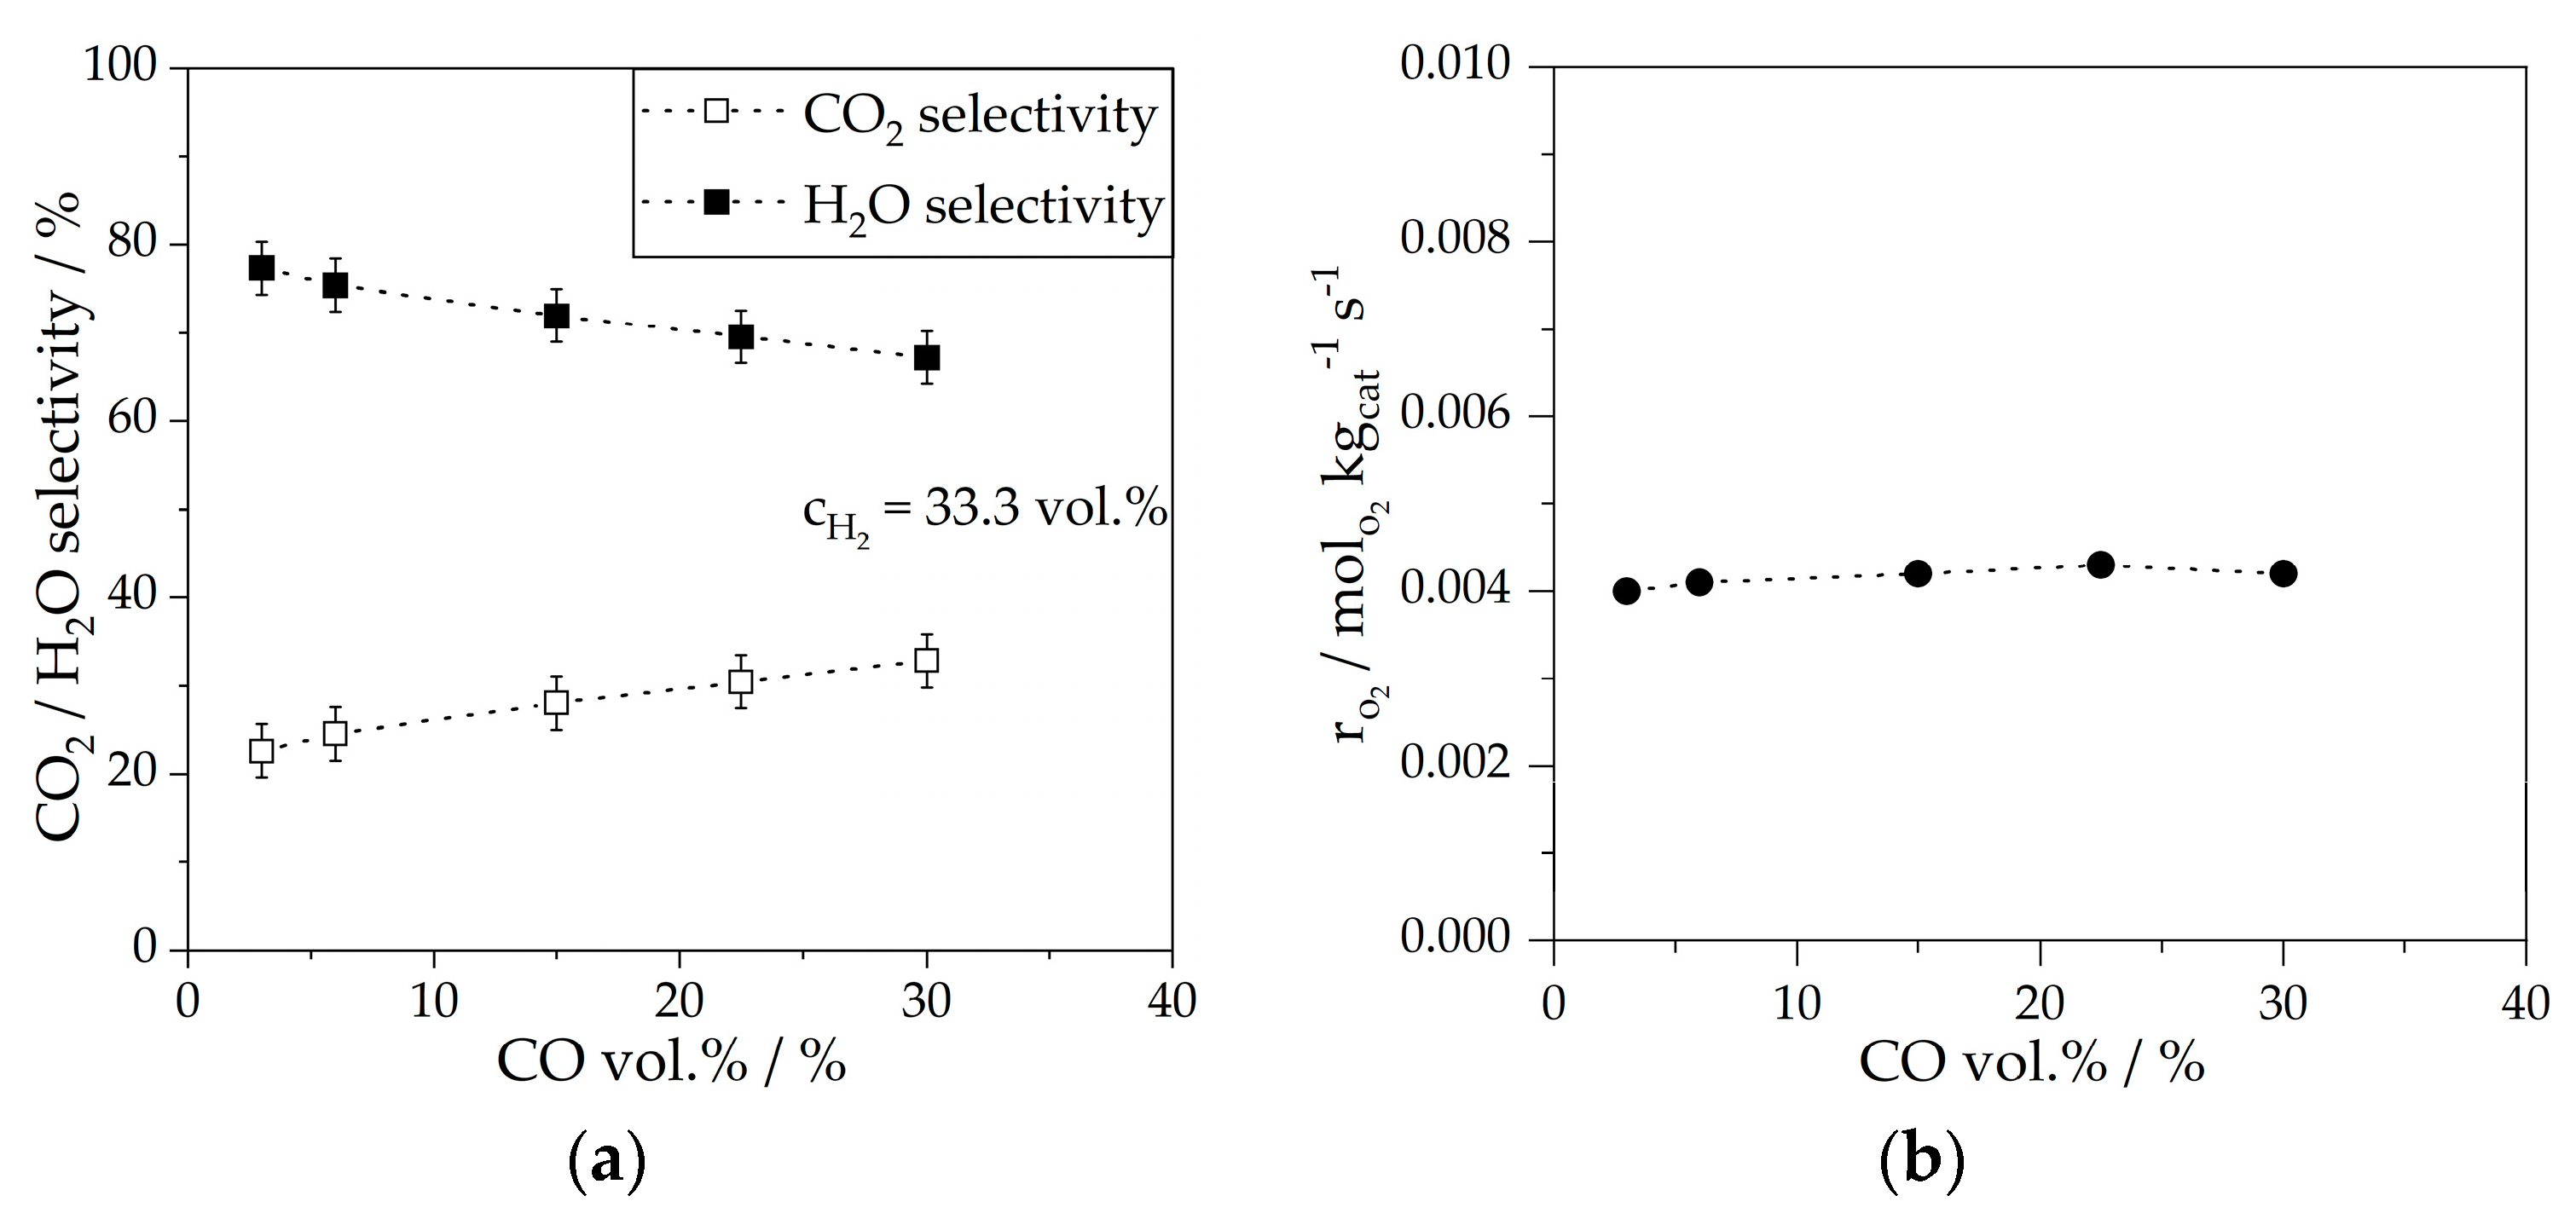
2.3. Selectivity of Reaction of Oxygen (to CO2 or H2O) If Present in the Syngas of FTS
2.4. Selectivity of O2 Reaction in Steady-State Operation of Fischer-Tropsch Synthesis
3. Materials and Methods
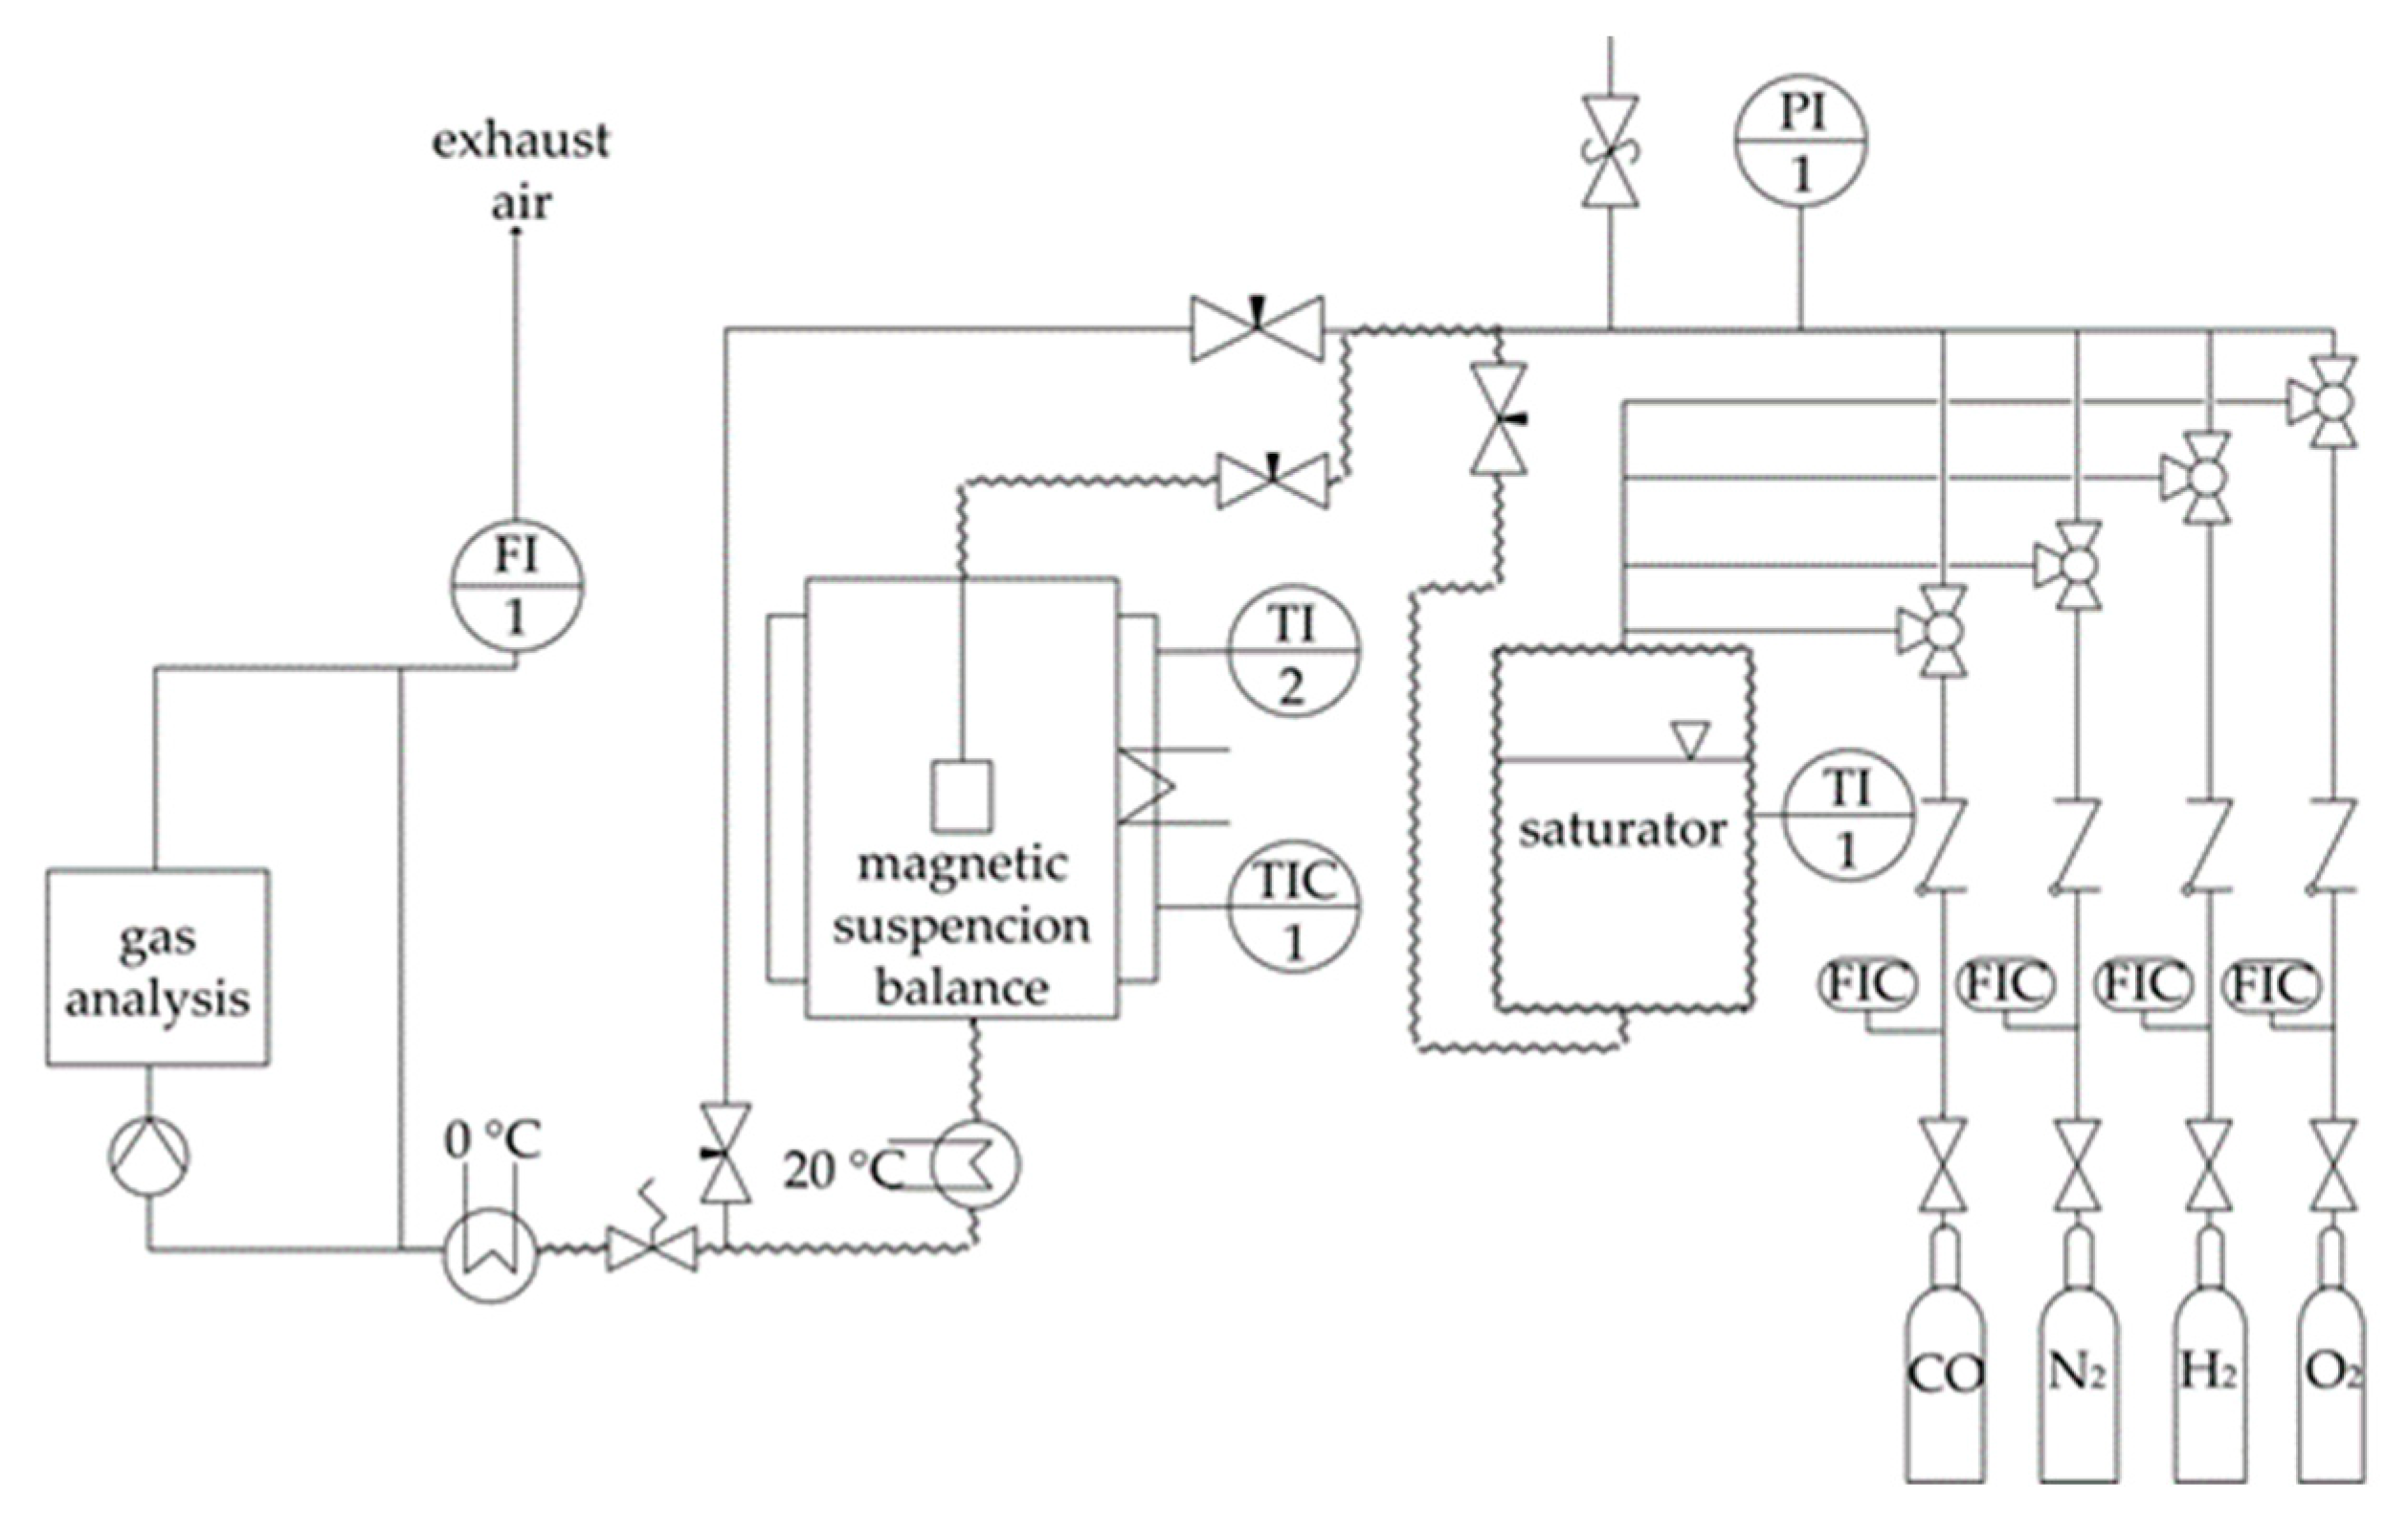
3.1. Measurements in a Magnetic Suspension Balance
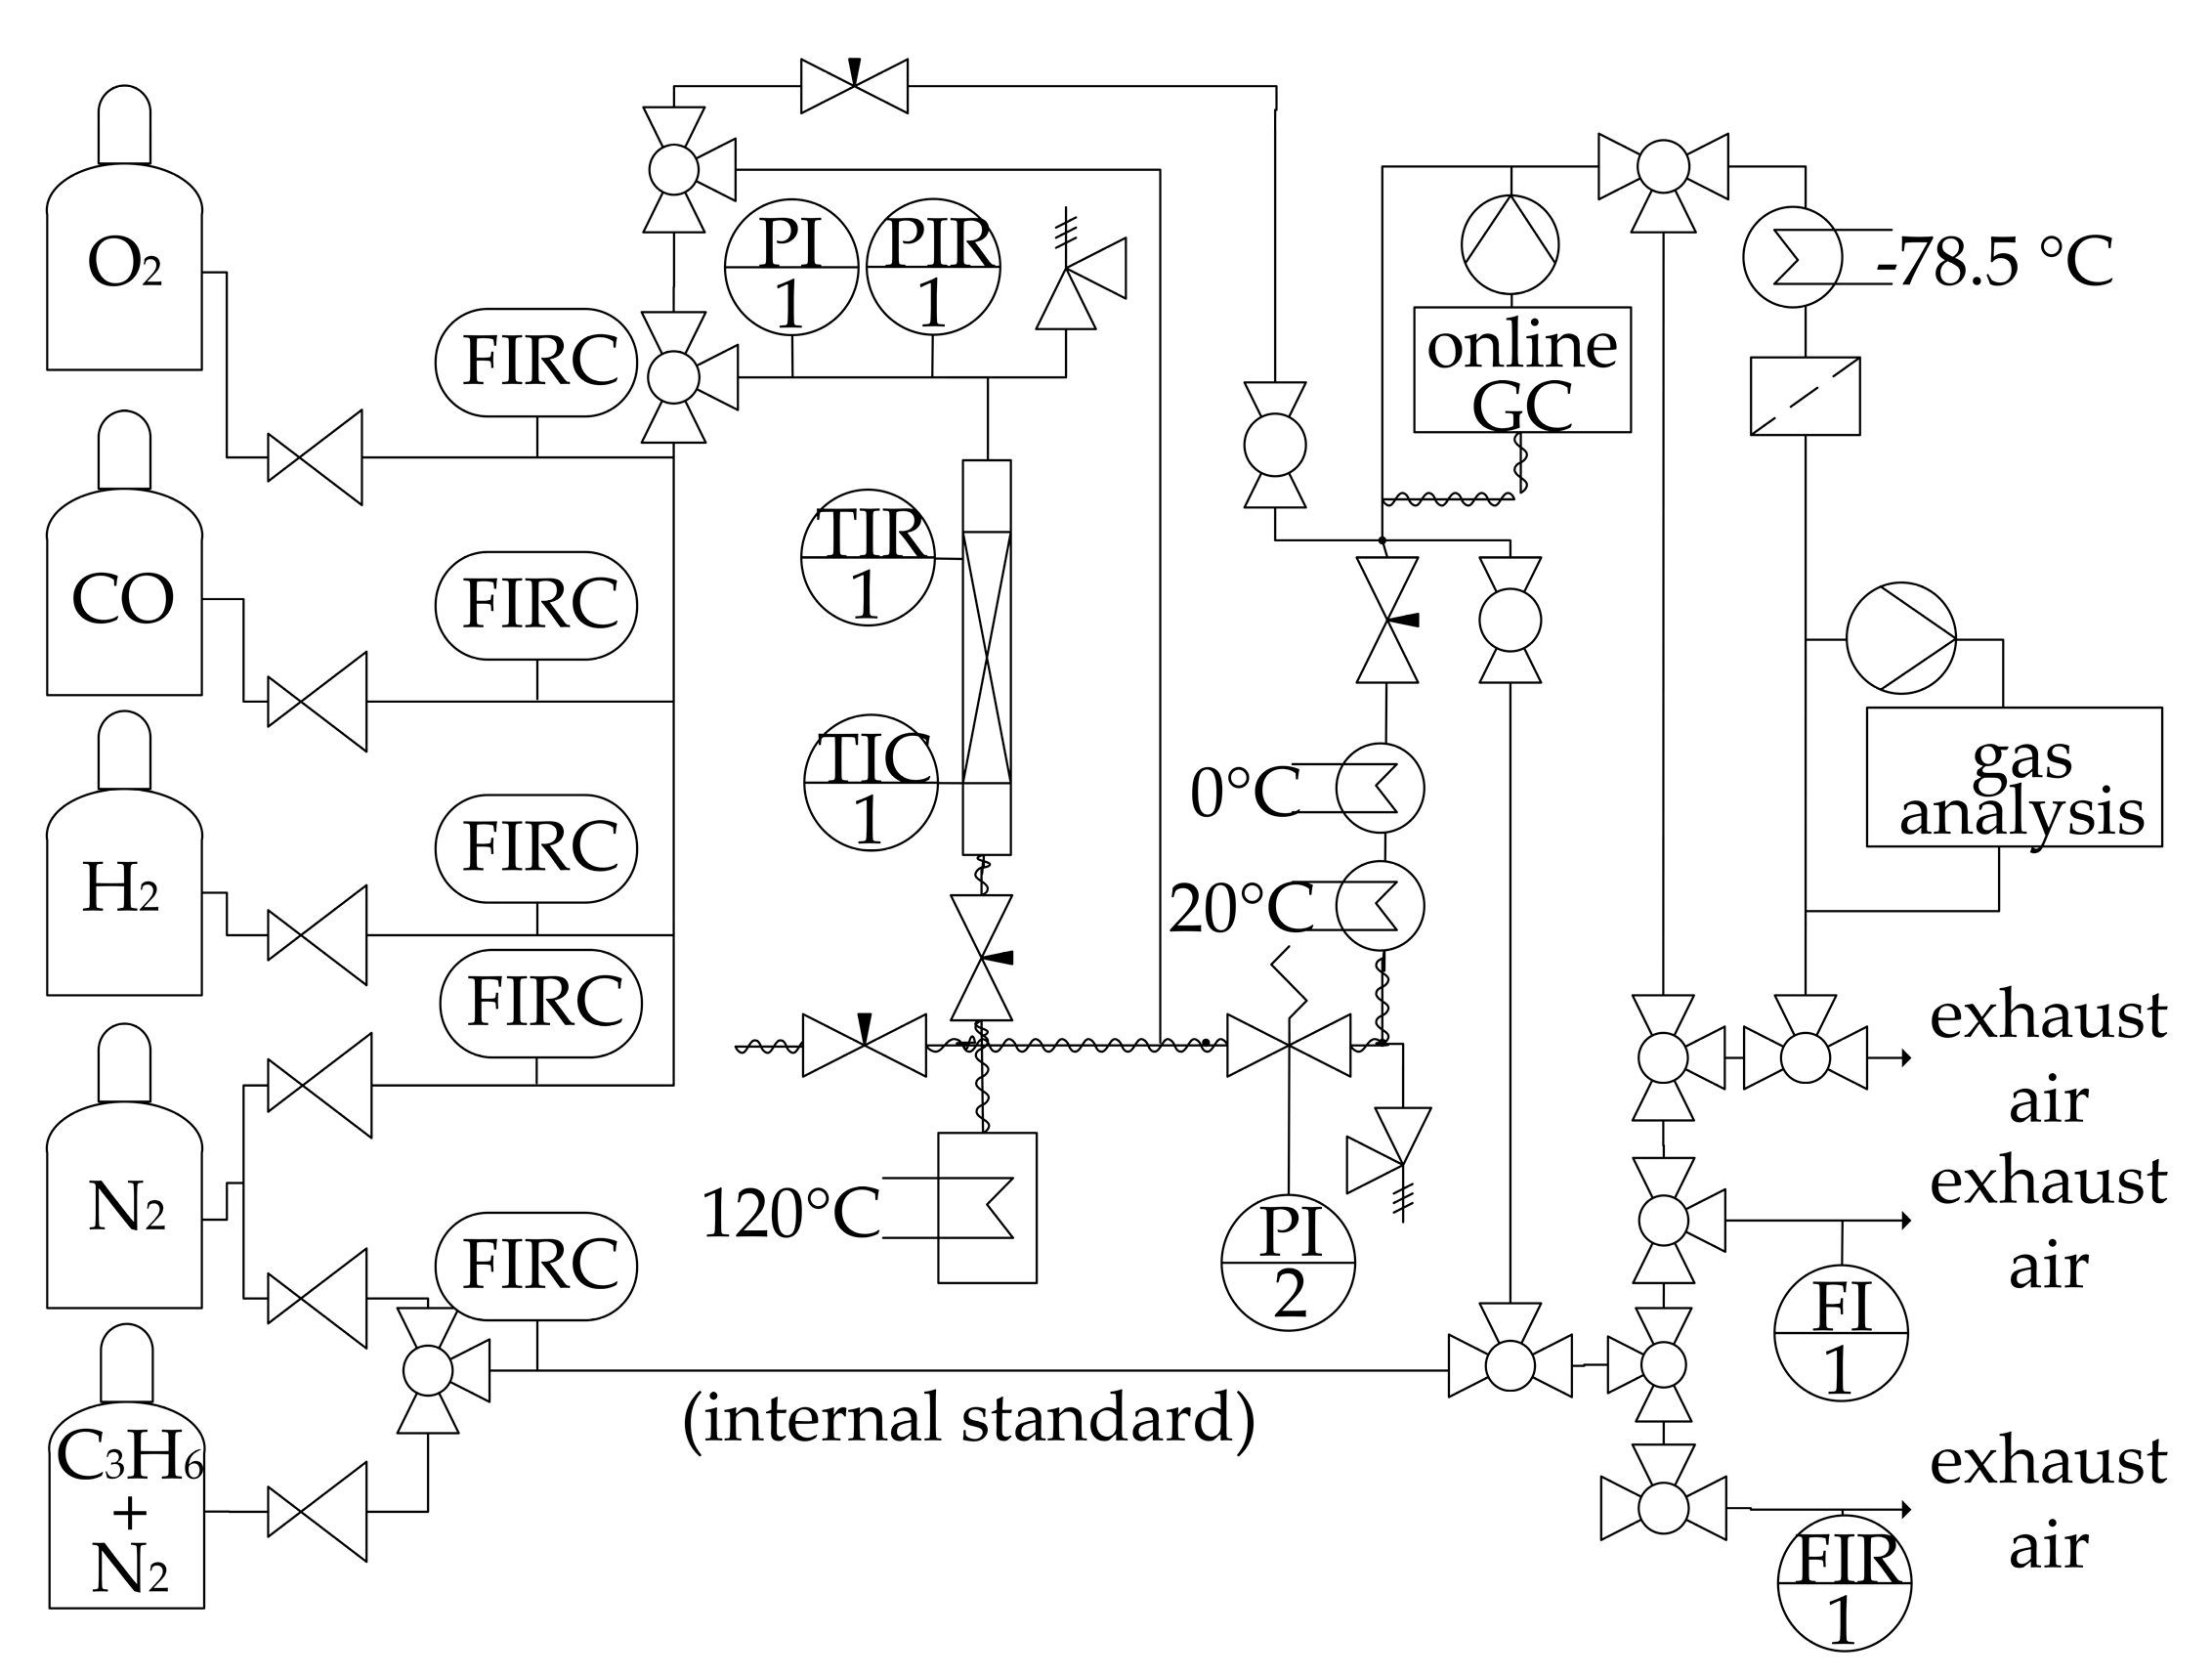
3.2. Fischer-Tropsch Synthesis
3.3. Evaluation of Experimental Data
4. Conclusions
Supplementary Materials
Author Contributions
Funding
Data Availability Statement
Conflicts of Interest
Abbreviations
| Symbols used | |
| m (kg) | mass |
| (mol s−1) | molar flow |
| p (Pa) | pressure |
| S (-) | selectivity |
| (m3 s−1) | volumetric flow |
| X (-) | conversion |
| Greek symbols | |
| εp (-) | porosity of particle |
| Sub- and Superscripts | |
| cat | catalyst |
| Co | cobalt |
| i | compound i |
| Abbreviations | |
| BET | measurement according to Brunauer-Emmett-Teller |
| FTS | Fischer-Tropsch synthesis |
| HC | hydrocarbon |
| LT-FTS | low temperature Fischer-Tropsch synthesis |
| MSB | magnetic suspension balance |
| NTP | normal temperature and pressure (0 °C, 1.013 bar) |
| PtL | power to liquid |
References
- Jackson, R.B.; Friedlingstein, P.; Andrew, R.M.; Canadell, J.G.; Le Quéré, C.; Peters, G.P. Persistent fossil fuel growth threatens the Paris Agreement and planetary health. Environ. Res. Lett. 2019, 14, 121001. [Google Scholar] [CrossRef]
- Gray, N.; McDonagh, S.; O’Shea, R.; Smyth, B.; Murphy, J.D. Decarbonising ships, planes and trucks: An analysis of suitable low-carbon fuels for the maritime, aviation and haulage sectors. Adv. Appl. Energy 2021, 1, 100008. [Google Scholar] [CrossRef]
- Paraschiv, S.; Paraschiv, L.S. Trends of carbon dioxide (CO2) emissions from fossil fuels combustion (coal, gas and oil) in the EU member states from 1960 to 2018. Energy Rep. 2020, 6, 237–242. [Google Scholar] [CrossRef]
- Qureshi, F.; Yusuf, M.; Kamyab, H.; Vo, D.-V.N.; Chelliapan, S.; Joo, S.-W.; Vasseghian, Y. Latest eco-friendly avenues on hydrogen production towards a circular bioeconomy: Currents challenges, innovative insights, and future perspectives. Renew. Sustain. Energy Rev. 2022, 168, 112916. [Google Scholar] [CrossRef]
- Schemme, S.; Samsun, R.C.; Peters, R.; Stolten, D. Power-to-fuel as a key to sustainable transport systems–An analysis of diesel fuels produced from CO2 and renewable electricity. Fuel 2017, 205, 198–221. [Google Scholar] [CrossRef]
- Schmidt, P.; Batteiger, V.; Roth, A.; Weindorf, W.; Raksha, T. Power-to-Liquids as Renewable Fuel Option for Aviation: A Review. Chem. Ing. Tech. 2018, 90, 127–140. [Google Scholar] [CrossRef]
- Qureshi, F.; Yusuf, M.; Kamyab, H.; Zaidi, S.; Junaid Khalil, M.; Arham Khan, M.; Azad Alam, M.; Masood, F.; Bazli, L.; Chelliapan, S.; et al. Current trends in hydrogen production, storage and applications in India: A review. Sustain. Energy Technol. Assess. 2022, 53, 102677. [Google Scholar] [CrossRef]
- König, D.H.; Freiberg, M.; Dietrich, R.-U.; Wörner, A. Techno-economic study of the storage of fluctuating renewable energy in liquid hydrocarbons. Fuel 2015, 159, 289–297. [Google Scholar] [CrossRef]
- van Hoecke, L.; Laffineur, L.; Campe, R.; Perreault, P.; Verbruggen, S.W.; Lenaerts, S. Challenges in the use of hydrogen for maritime applications. Energy Environ. Sci. 2021, 14, 815–843. [Google Scholar] [CrossRef]
- Pearson, R.J.; Eisaman, M.D.; Turner, J.W.G.; Edwards, P.P.; Jiang, Z.; Kuznetsov, V.L.; Littau, K.A.; Di Marco, L.; Taylor, S.R.G. Energy Storage via Carbon-Neutral Fuels Made From CO2, Water, and Renewable Energy. Proc. IEEE 2012, 100, 440–460. [Google Scholar] [CrossRef]
- Schäppi, R.; Rutz, D.; Dähler, F.; Muroyama, A.; Haueter, P.; Lilliestam, J.; Patt, A.; Furler, P.; Steinfeld, A. Drop-in Fuels from Sunlight and Air. Nature 2021, 601, 63–68. [Google Scholar] [CrossRef]
- Prussi, M.; Scarlat, N.; Acciaro, M.; Kosmas, V. Potential and limiting factors in the use of alternative fuels in the European maritime sector. J. Clean. Prod. 2021, 291, 125849. [Google Scholar] [CrossRef] [PubMed]
- König, D.H.; Baucks, N.; Dietrich, R.-U.; Wörner, A. Simulation and evaluation of a process concept for the generation of synthetic fuel from CO2 and H2. Energy 2015, 91, 833–841. [Google Scholar] [CrossRef]
- Kaiser, P.; Pöhlmann, F.; Jess, A. Intrinsic and Effective Kinetics of Cobalt-Catalyzed Fischer-Tropsch Synthesis in View of a Power-to-Liquid Process Based on Renewable Energy. Chem. Eng. Technol. 2014, 37, 964–972. [Google Scholar] [CrossRef]
- Renninger, S.; Stein, J.; Lambarth, M.; Birke, K.P. An optimized reactor for CO2 splitting in DC atmospheric pressure discharge. J. CO2 Util. 2022, 58, 101919. [Google Scholar] [CrossRef]
- Renninger, S.; Rößner, P.; Stein, J.; Lambarth, M.; Birke, K.P. Towards High Efficiency CO2 Utilization by Glow Discharge Plasma. Processes 2021, 9, 2063. [Google Scholar] [CrossRef]
- Pöhlmann, F.; Jess, A. Interplay of reaction and pore diffusion during cobalt-catalyzed Fischer–Tropsch synthesis with CO2-rich syngas. Catal. Today 2016, 275, 172–182. [Google Scholar] [CrossRef]
- Brookes, C.; Bowker, M.; Wells, P. Catalysts for the Selective Oxidation of Methanol. Catalysts 2016, 6, 92. [Google Scholar] [CrossRef]
- Jacobs, G.; Ma, W.; Davis, B. Influence of Reduction Promoters on Stability of Cobalt/g-Alumina Fischer-Tropsch Synthesis Catalysts. Catalysts 2014, 4, 49–76. [Google Scholar] [CrossRef]
- Shiba, N.C.; Liu, X.; Hildebrandt, D.; Yao, Y. Effect of Pre-Treatment Conditions on the Activity and Selectivity of Cobalt-Based Catalysts for CO Hydrogenation. Reactions 2021, 2, 258–274. [Google Scholar] [CrossRef]
- Jahangiri, H.; Bennett, J.; Mahjoubi, P.; Wilson, K.; Gu, S. A review of advanced catalyst development for Fischer–Tropsch synthesis of hydrocarbons from biomass derived syn-gas. Catal. Sci. Technol. 2014, 4, 2210–2229. [Google Scholar] [CrossRef]
- Rößler, S. Akkumulation flüssiger Kohlenwasserstoffe im Porensystem von Kobaltkatalysatoren Während der Anfangsphase der Fischer-Tropsch-Synthese. Ph.D. Thesis, Universität Bayreuth, Bayreuth, Germany, 2019. [Google Scholar]
- Bertole, C. The Effect of Water on the Cobalt-Catalyzed Fischer–Tropsch Synthesis. J. Catal. 2002, 210, 84–96. [Google Scholar] [CrossRef]
- Pöhlmann, F.; Kern, C.; Rößler, S.; Jess, A. Accumulation of liquid hydrocarbons in catalyst pores during cobalt-catalyzed Fischer–Tropsch synthesis. Catal. Sci. Technol. 2016, 6, 6593–6604. [Google Scholar] [CrossRef]


| Case A: Rel. Weight Change in O2 | Case B: Rel. Weight Change in H2/O2 | Case C: Rel. Weight Change in H2O | |
|---|---|---|---|
| Feed gas | 99% N2, 1% O2 | 60% H2, 39% N2, 1% O2 | 98% N2, 2% H2O |
| 165 °C | +2.3% | +2.4% | +2.1% |
| 230 °C | +2.5% | +1.2% | +1.1% |
| Catalyst | Pre-Reduction at 360 °C | Oxidation State of Co and Pt | rO2 in molO2 kgcat−1 s−1 | SCO2 in % | SH2O in % |
|---|---|---|---|---|---|
| Al2O3 | No | - | - | no O2 conversion no FTS-activity | |
| Yes | - | - | |||
| 9.7 wt.% Co rest Al2O3 | No | +2 (CoO) | 0.3 × 10⁻² | 80 ± 3 | 20 ± 3 |
| Yes | +2 (CoO) | 0.3 × 10⁻² | 80 ± 3 | 20 ± 3 | |
| 0.03 wt.% Pt rest Al2O3 | No | 0 (Pt) | 0.4 × 10⁻² | 58 ± 3 | 42 ± 3 |
| Yes | 0 (Pt) | 0.4 × 10⁻² | 58 ± 3 | 42 ± 3 | |
| 10 wt.% Co, 0.03 wt.% Pt rest Al2O3 | No | +2 (CoO), 0 (Pt) | 0.7 × 10⁻² | 63 ± 3 | 37 ± 3 |
| yes, fresh catalyst | 0 (Co), 0 (Pt) | 3.5 × 10⁻² | 36 ± 3 | 64 ± 3 | |
| yes, cat. In steady state (100 h TOS) | 0 (Co), 0 (Pt) | 0.2 × 10⁻² | 27 ± 3 | 73 ± 3 | |
| Parameter | Co/Pt/Al2O3-Catalyst | Co/Al2O3-Catalyst | Pt/Al2O3-Catalyst |
|---|---|---|---|
| Chemical composition | 0.031 wt.% Pt, 10 wt.% Co, rest γ-Al2O3 | 9.7 wt.% Co, rest γ-Al2O3 | 0.03 wt.% Pt, rest γ-Al2O3 |
| Size of cylindrical particles | 5 × 5 mm | 5 × 5 mm | 5 × 5 mm |
| BET surface area | 188 m2 gCat−1 | 196 m2 gCat−1 | 205 m2 gCat−1 |
| Pore volume | 0.36 cm3 gCat−1 | 0.4 cm3 gCat−1 | 0.43 cm3 gCat−1 |
| Porosity εp | 0.53 | 0.53 | 0.53 |
Disclaimer/Publisher’s Note: The statements, opinions and data contained in all publications are solely those of the individual author(s) and contributor(s) and not of MDPI and/or the editor(s). MDPI and/or the editor(s) disclaim responsibility for any injury to people or property resulting from any ideas, methods, instructions or products referred to in the content. |
© 2023 by the authors. Licensee MDPI, Basel, Switzerland. This article is an open access article distributed under the terms and conditions of the Creative Commons Attribution (CC BY) license (https://creativecommons.org/licenses/by/4.0/).
Share and Cite
Herbers, A.; Kern, C.; Jess, A. Cobalt Catalyzed Fischer-Tropsch Synthesis with O2-Containing Syngas. Catalysts 2023, 13, 391. https://doi.org/10.3390/catal13020391
Herbers A, Kern C, Jess A. Cobalt Catalyzed Fischer-Tropsch Synthesis with O2-Containing Syngas. Catalysts. 2023; 13(2):391. https://doi.org/10.3390/catal13020391
Chicago/Turabian StyleHerbers, Alexander, Christoph Kern, and Andreas Jess. 2023. "Cobalt Catalyzed Fischer-Tropsch Synthesis with O2-Containing Syngas" Catalysts 13, no. 2: 391. https://doi.org/10.3390/catal13020391