Article

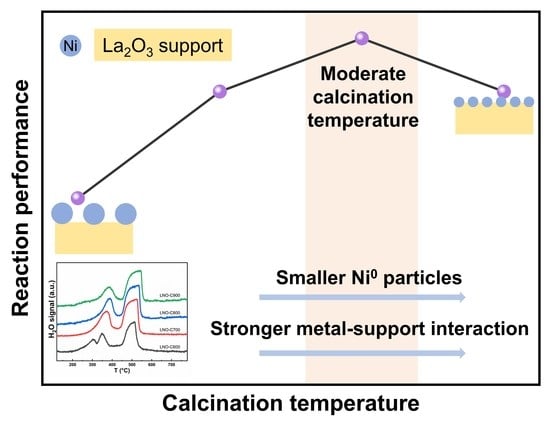
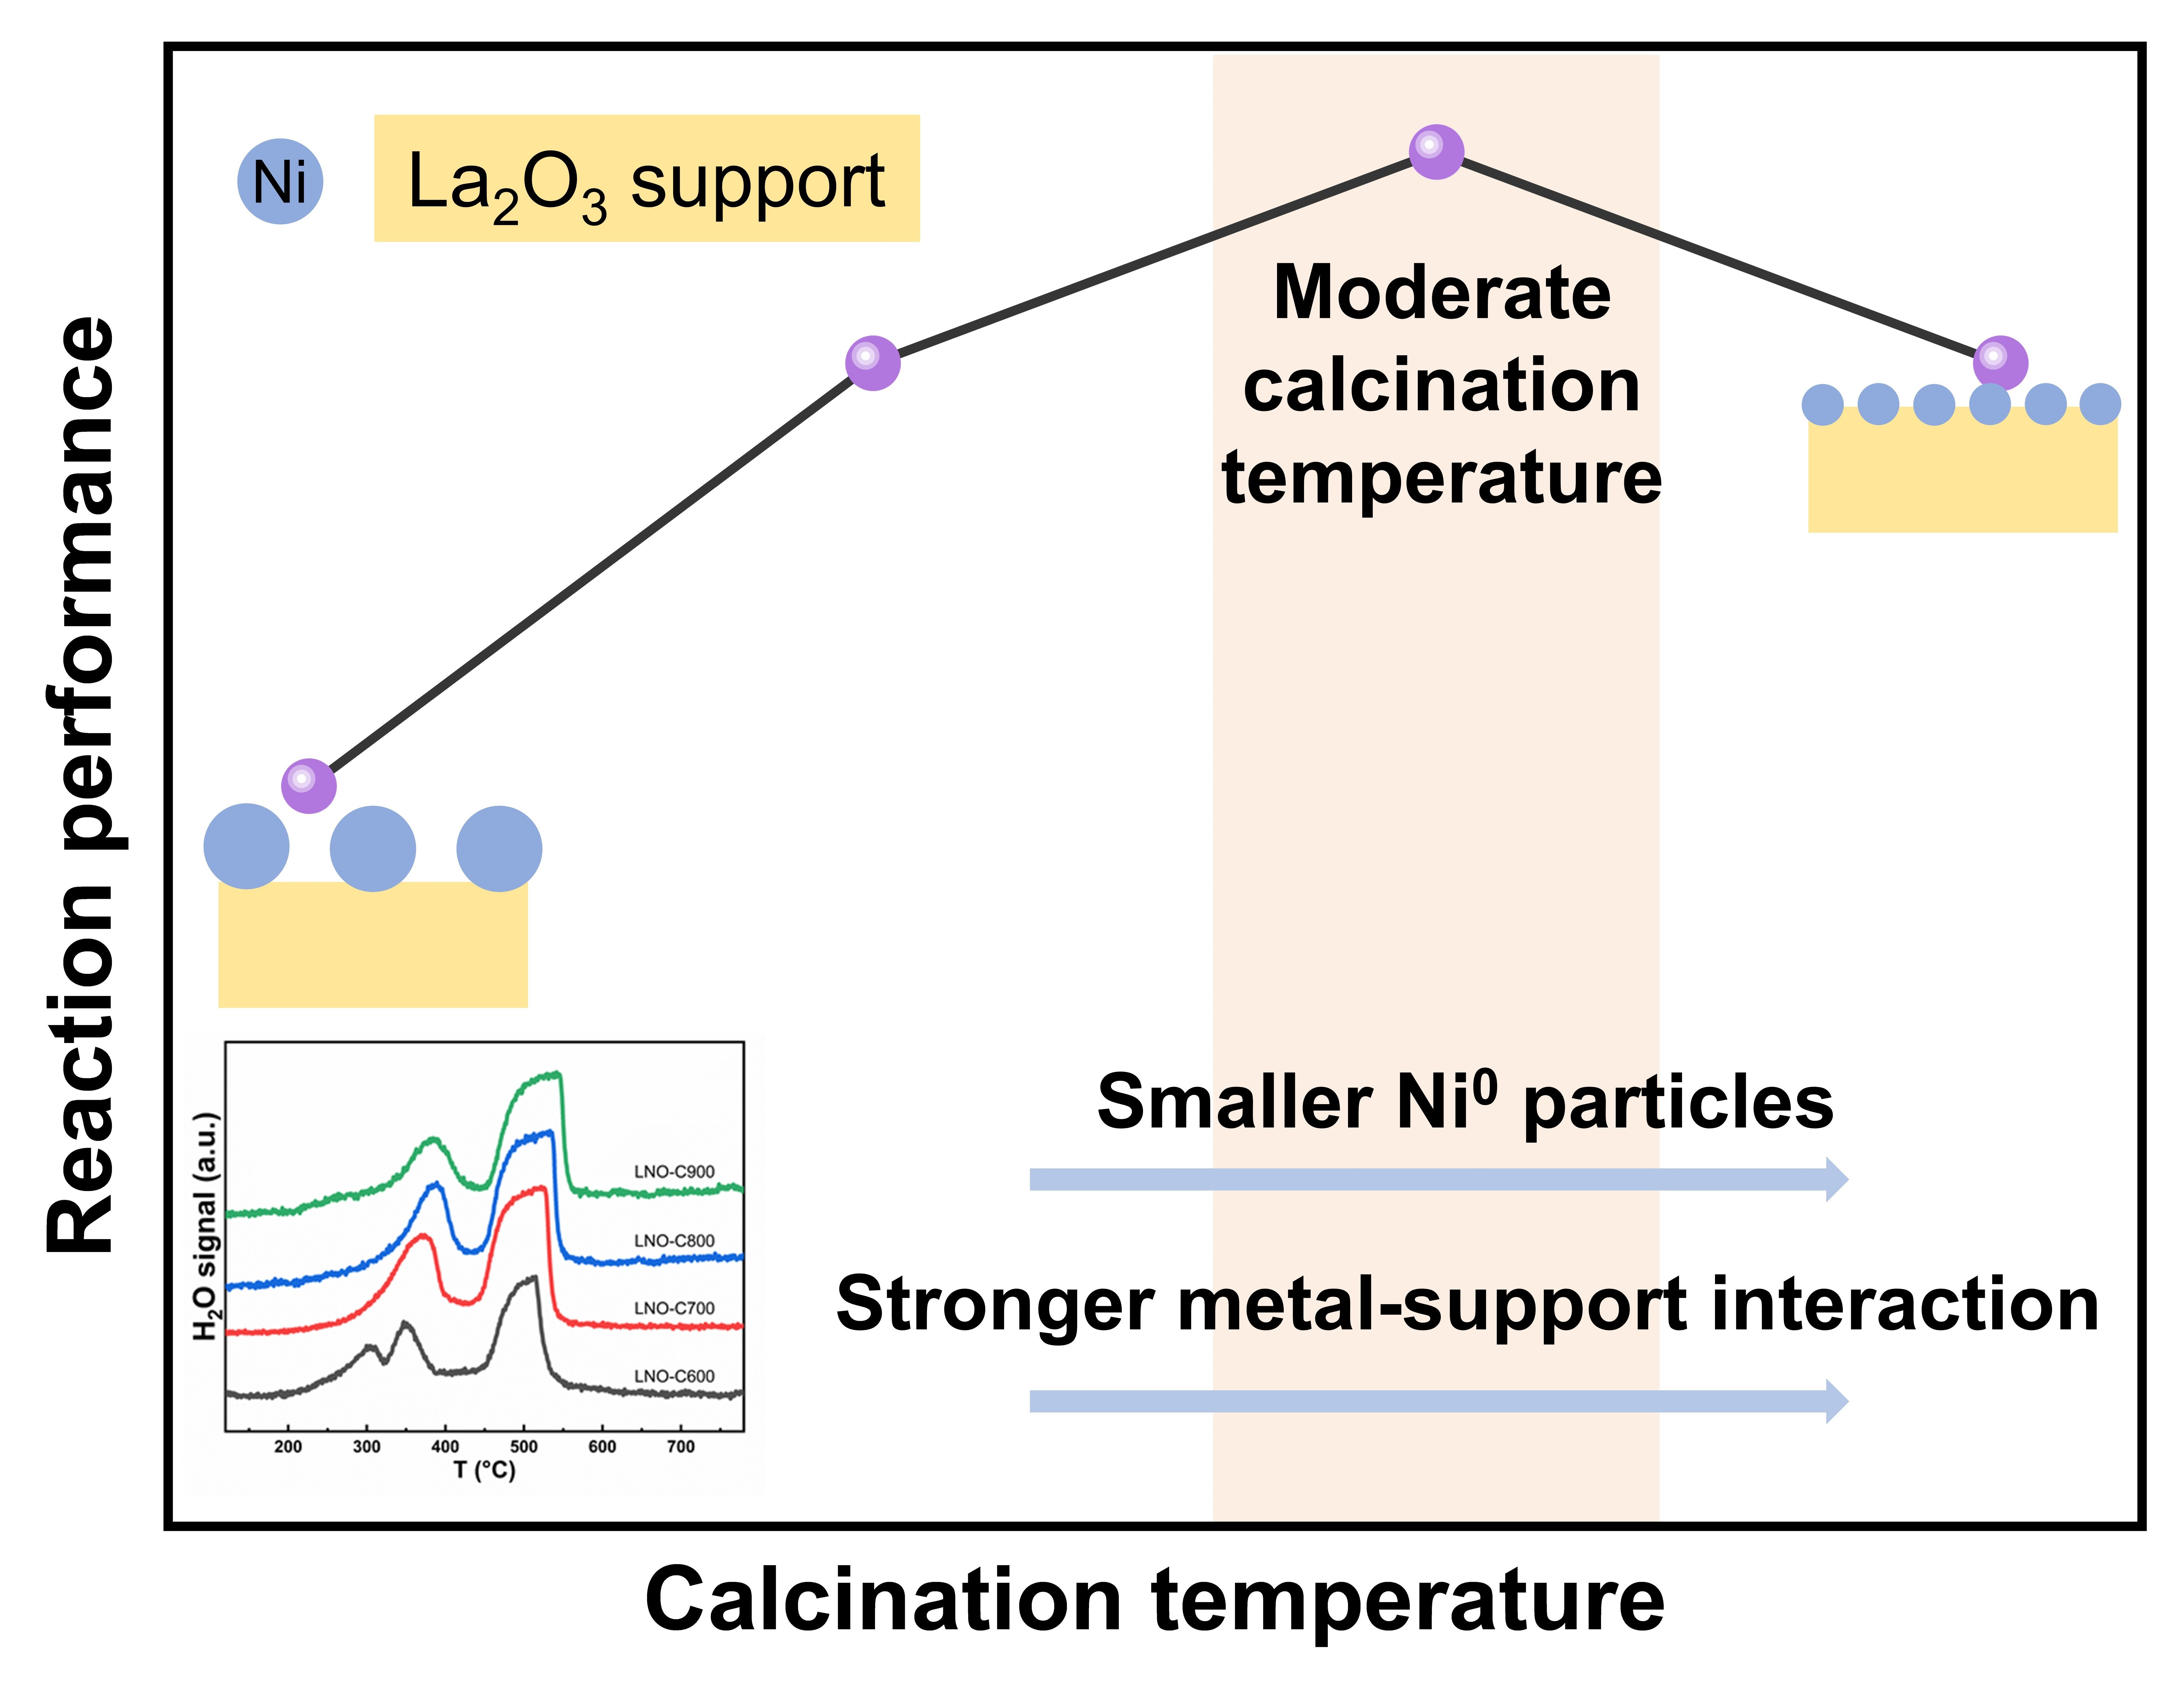
Effect of the Calcination Temperature of LaNiO3 on the Structural Properties and Reaction Performance of Catalysts in the Steam Reforming of Methane

Department of Chemical Engineering, Tsinghua University, Beijing 100084, China
*
Author to whom correspondence should be addressed.
Catalysts 2023, 13(2), 356; https://doi.org/10.3390/catal13020356
Submission received: 26 December 2022 / Revised: 29 January 2023 / Accepted: 3 February 2023 / Published: 6 February 2023

Abstract

:
The steam reforming of methane (SRM) reaction is a significant process for efficient syngas generation and for promising distributed hydrogen production. In this work, a series of LaNiO3 oxides were prepared using the Pechini method, calcined from 600 °C to 900 °C and tested for the SRM reaction. Fresh, reduced, and used samples were characterized using STA-MS-FTIR, in situ and ex situ XRD, N2 physical adsorption, H2-TPR, TEM, TPO, and Raman. The results show that LaNiO3 begins to crystallize at about 550 °C, and the increase in calcination temperature results in the following differences in the properties of the LaNiO3 samples: larger LaNiO3 grains, smaller specific surface area, higher reduction temperature, smaller Ni0 grains reduced from the bulk phase, and stronger metal–support interaction. The maximum CH4 conversion could be achieved over LaNiO3 calcinated at 800 °C. In addition, the effect of steam-to-carbon ratio (S/C) on the performance of the SRM reaction was studied, and a S/C of 1.5 was found to be optimal for CH4 conversion. Too strong a metal–support interaction and too much unreacted steam causes a loss of catalytic activity. Finally, it was also proved using TPO and Raman that an increase in calcination temperature improves the carbon deposition resistance of the catalyst.

Graphical Abstract

1. Introduction

Due to the continuous exploration of shale gas, combustible ice, and other natural gas (NG) resources, as well as the established mature infrastructure for the utilization of NGs, the reaction process of the steam reforming of methane still plays an important role in both the conventional manufacturing of syngas for subsequent liquid hydrocarbons and chemicals, and distributed hydrogen production with a combined use of fuel cells. Nickel-based catalysts are most commonly used for the SRM reaction because of their low cost, wide availability, and high activity comparable to noble metals. However, this type of catalyst is easily deactivated on account of sintering and/or carbon deposition, especially at a high reaction temperature [1,2,3]. Therefore, excessive steam is generally added to reduce or prevent coke deposition in industry, which leads to more energy input for water vaporization and water resource consumption. Thus, it is necessary to develop catalysts with a higher activity and less carbon deposition at lower S/C.
In addition to conventional catalysts, perovskite-type oxides (PTOs) have been widely used in a number of chemical reactions in recent years, including environmental catalysis [4], oxidation reactions (for CO and hydrocarbon) [5,6,7], reduction reactions (mainly for NO) [8,9,10], electrocatalysis as anode materials in solid oxide fuel cells (SOFCs) [11], and photoelectric conversion catalysis [12]. Owing to their excellent catalytic activity in reforming reactions, this type of oxide, with the general formula of ABO3, has also served as the precursor for various reactions used to produce syngas [13,14,15,16,17,18,19,20] by generating well-defined crystalline oxide and subsequent highly dispersed metal particles through controlled exsolution from the bulk phase. In ABO3, the B-site is usually occupied by a catalytically active transition metal, while the A-site metals are mainly alkali, alkaline earth, and rare earth metals that are related to catalyst stability and that can interact with B-site elements to alter catalytic performance [20,21]. In addition to simple perovskite-type oxides, partially substituted PTOs have been employed to favor the interaction between different metallic species and between reduced metal particles and metal support oxides [22,23,24,25,26,27]. For example, Co could be inserted into LaNiO3, and Ni-Co alloy is produced after LaNi1-xCox is reduced by H2, which promotes a high metal dispersion on the La2O3 support and better catalytic stability [28,29,30,31]. Some researchers have also found that Ni catalysts generated from the ex-solution of perovskite-supported metal, such as LaMnO3, LaFeO3, and ATiO3 (A=Ca, Sr, and Ba), showed superior resistance against coke formation in reforming reactions because the metal cations could reversibly enter the perovskite lattice to maintain high metal dispersion [32,33,34,35,36,37].
LaNiO3, as a typical perovskite-type oxide applied in reforming reactions, has been prepared using various methods, including solid state reaction, solution combustion, the Pechini method, the co-precipitate method, the hydrothermal method, the spray pyrolysis method, and so on [11]. Among these preparation approaches, the Pechini method is highly popular due to its simple operational procedure, controllable stoichiometry, high product purity, and strong reproducibility. Hence, it is employed to obtain the final LaNiO3 oxides herein. No matter what preparation method is adopted, the acquisition of the perovskite phase is the last step and the calcination temperature is the most critical process parameter. It has been reported in several studies that LaNiO3 exhibits a varying catalytic performance in reactions resulting from different calcination temperatures, which is induced by the different structures of calcinated and final products [13,15,38,39,40]. A study from the research group of Lina [41] has shown that calcination temperature would influence the Ni dispersion, metal–support interaction, and surface oxygen species of LaNiO3. Daniela and coworkers [42] have suggested that some microstructural and superficial features, such as the Ni3+/Ni2+ ratio and anionic vacancy presence, vary as a function of the calcination temperature of LaNiO3. A study by Sang has shown that the most suitable calcination temperature of LaNiO3 in the SRM reaction was 700 °C, but the influence of calcination temperature was not discussed in depth. Thus, no systematic and comprehensive study on LaNiO3 calcinated at different temperatures has been carried out in the SRM reaction so far. By changing the calcination temperature of the perovskite phase, this work brought in a temperature-programmed analysis of dry gel, including a thermal analysis and a phase analysis, investigated the structural changes of perovskite oxides related to the calcination temperature through a series of material characterizations, and determined the optimal treatment temperature of the preparation process considering the activity and resistance to carbon deposition in the SRM reaction.

2. Materials and Methods

2.1. Catalysts Preparation

A series of LaNiO3 samples were prepared through the Pechini method [39,43], and then calcinated at different temperatures. Stoichiometric nitrates including La(NO3)3·6H2O (Aladdin, 99.99% purity) and Ni(NO3)2·6H2O (Xilong Chemical engineering, 98% purity) were dissolved with deionized water and citric acid (CA, General-reagent, 99.5% purity) was added under magnetic stirring with the ratio of CA to total metal cations equal to 1.2. After stirring for 1 h, ethylene glycol (EG:CA = 1:1) was added to the above solution and the temperature of oil bath increased to 80 °C to promote chelation and polyester reaction. A sponge-like green gel was produced after 4 h treatment and transferred to a drying oven to dry at 110 °C overnight. Then, the obtained dry gel was crushed into powder and calcinated in a muffle furnace. At first, the temperature was raised to 400 °C with a heating rate of 5 °C/min, and kept for 2 h to promote the decomposition of organic components. Then, the temperature increased to various pre-set temperatures, including 600 °C, 700 °C, 800 °C and 900 °C, and maintained for 5 h to ensure the formation of perovskite-type oxides. The obtained perovskite oxides were denoted as LNO-C600, LNO-C700, LNO-C800 and LNO-C900, respectively. Such calcination temperature was selected on the basis of an analysis of the decomposition of the precursor in the air atmosphere.

2.2. Catalysts Characterization

After drying at 110 °C, the gel precursor was characterized with an STA-MS-FTIR (simultaneous thermal analysis mass spectrometer Fourier transform infrared spectrometer) connected system (STA449F3-QMS403C-VERTEX70V, from NETZSCH in Germany) to test weight change, heat effect, and burnt-off gas products with the increase in temperature. Approximately 12 mg dry gel was added to an alumina crucible and the temperature was increased from room temperature to 900 °C with a heating rate of 10 °C/min in air atmosphere. The flow rate of air was 50 mL/min. In the mass spectra, the ion current intensities at m/z = 18, 28, 30, 44 and 46 were used to represent the concentrations of H2O, CO, NO, CO2, and NO2, respectively. The absorbances at 1510, 2178, 1832, 2358, and 3073 cm−1 in the FTIR spectra were selected to stand for the concentration of H2O, CO, NO, CO2, and NO2, respectively.
In situ and ex situ X-ray diffraction (XRD) characterizations were carried out at a Bruker D8 ADVANCE diffractometer, using a Cu Kα radiation source (λ = 0.154 nm), and diffraction patterns were collected from 5° to 90° with a pace of 5°/min. Samples could also be placed in an alumina sample holder with programmable heating in hydrogen or air atmosphere to conduct in situ XRD measurement, with the temperature ranging from room temperature to 850 °C (the heating rate of 12 °C/min). The gas flow rate of hydrogen or air could be controlled at 10 mL/min with a mass flowmeter controller. The phase of the samples was identified by searching the JCPDS database and comparing the obtained patterns. The Scherrer equation was utilized to calculate the average crystallite size, where the value of k, shape factor, was 0.9.
N2 adsorption–desorption analyses were performed to measure the specific surface area of prepared samples using a physical adsorption instrument (QUADRASORB SI, from Quantachrome Instruments in America) at 77 K, and the samples were previously degassed in vacuum to remove water and organic impurities at 300 °C for 16 h. The relative pressure (denoted by P/P0) set for these measurements was 0.01–0.99. The BET (Brunauer-Emmett-Teller) model was used to calculate the specific surface area of the calcinated samples.
Temperature-programmed experiments including TPR and TPO were performed at a FTIR (Nicolet-is50, from Thermo Fisher Scientific in America) to detect the changes in H2O or CO2 concentration as the temperature increased. A total of 50 mg fresh sample was loaded in a quartz-tube reactor with an inner diameter of 4 mm under atmospheric pressure and pretreated at 400 °C under 20 mL/min Ar for 30 min to remove water from the calcinated samples. Cooling down to room temperature, the gas was switched to a 20 mL/min H2/Ar (20%) mixture gas to conduct the TPR process, and the absorbance at 1510 cm−1 marking the evolution concentration of H2O was recorded when the temperature increased from room temperature to 900 °C with the heating rate of 10 °C/min. A total of 5 mg of the used sample was used and the carbonate was removed at 700 °C in Ar with a flow rate of 20 mL/min for 60 min. After cooling down to room temperature, 20 mL/min air/Ar (50%) was employed to oxidize the carbon deposition possibly existing in the spent catalysts to produce the absorbance at 2358 cm−1 involving CO2 when the temperature increased to 900 °C with the heating rate of 10 °C/min.
TEM (transmission electron microscopy) images and EDS (energy dispersive spectroscopy) element mappings were obtained using JEM-2010 (from JEOL in Japan) operating at 200 kV. Samples for TEM were prepared by dispersing the sample with ethanol in an ultrasonic bath for 30 min to achieve a homogeneous dispersion and evaporating a drop of suspension in a carbon-coated copper grid at 80 °C for 10 min before observation.
Raman spectra were collected on a Raman spectrometer (LabRam HR Evolution Raman Spectrometer, from HORIBA Jobin Yvon in France) using a He-Ne laser (532 nm, 2 mW) under ambient conditions to probe into the nature of carbon formed during the SRM reaction, with the wavelength region scanned ranging from 1000 to 2000 cm−1. The integration time was 60 s for each spectrum.

2.3. Catalytic Performance Evaluation

The catalytic performance of LaNiO3 perovskite oxide, calcined at different temperatures, was tested for the SRM reaction. The reforming reaction was carried out in a continuous flow quartz-tube reactor with an inner diameter of 4 mm operated at atmospheric pressure. A certain amount of catalyst was loaded into a quartz reactor and fixed in place with quartz wool for each test. Before the reaction, the catalysts were reduced in situ in 10 mL/min H2 at 850 °C for 2 h. Next, the reactant of the CH4/H2O mixture was fed into the reactor at a flow rate of 10 mL/min of methane, with the S/C ratio ranging from 1 to 3. At the outlet of the reactor, unreacted steam was removed through a condenser, and the concentration of gaseous reaction products was analyzed online with a gas chromatograph (SHIMADZU 2010) equipped with a TCD and an FID.

3. Results and Discussion

3.1. Formation of LaNiO3 upon Calcination of the Gel Precursor in Air

3.1.1. The Thermal Decomposition Analysis of the Dry Gel

In order to analyze the changes in composition and phase of the gel precursor (after the drying step at 110 °C overnight) during calcination, the dry gel was tested using STA-MS-FTIR in air atmosphere to obtain information including weight loss, thermal effect, and volatilized and/or decomposed gas products with the increase in temperature, which were helpful to clarify the physical or chemical processes occurring at different temperature scopes, and preliminarily determine the appropriate calcination temperature program.
The simultaneous thermal analysis results of TGA and DSC for dry gel prepared using the Pechini method are shown in Figure 1a, and the total weight loss of the gel is about 70% [44]. The Gram–Schmidt curve (GS curve for short) obtained through infrared spectroscopy is shown in Figure 1b, which shows that the total concentration of the evolving gas components over temperature corresponds significantly with the DTG curve, i.e., the first derivative of the TG curve. The components, including the H2O, CO2, CO, NO2, and NO that are possible in exhaust gas, were monitored using mass spectrometry and infrared spectroscopy. Since the information obtained using the two methods was fairly consistent, the concentration of gas products acquired through mass spectrometry was used representatively to reveal the thermal decomposition behaviors in Figure 2.
Considering the weight loss rate, thermal effect, and exhaust gas composition in each period, the thermal decomposition may be distinguished as follows (details tabulated in Table 1). The first thermal event mainly occurred up to 140 °C (endothermic peak in the DSC curve), with only water in the gas product. This stage is related to the removal of adsorbed water or coordinated water in the gel powder, accompanied by 2% weight loss [45,46]. In the second one, between 140 and 360 °C, the TGA curve became steep, representing a significant weight loss of ca. 38%, and NO, CO2, and H2O were detected in the tail gas. No obvious NO2 and CO signals were detected, indicating that NO and CO2 are the main products of nitrate decomposition and organic oxidation, respectively. Therefore, the endothermic nitrate decomposition reaction and the exothermic organic oxidation process (mainly side-chain groups) occur simultaneously in this scope, but the overall effect is endothermic, which is due to the stronger reaction intensity of the former than that of the latter. The third process, from 360 to 570 °C, underwent a serious weight loss of ca. 28%, and the ionic strengths of the main products (CO2 and H2O) monitored through mass spectrometry increased greatly compared with the previous stages. This is attributed to the combustion of organic matter, along with an intense exothermic peak in the DSC curve [47]. The fourth period, from 570 to 700 °C, with an evolution of a small amount of CO2 as the only product, is ascribed to the decomposition of lanthanum oxycarbonate, which is the outcome of a basic lanthanum cation and CO2 from organic compounds oxidation [48]. In addition, the preliminary formation of the LaNiO3 crystalline phase took place during this process [39], which could be verified in the following in situ XRD spectra of powder precursor in air atmosphere. Above 700 °C, there is no further weight loss [49], and no gaseous product has been detected using MS and FTIR, demonstrating that organic species have been burned out. In summary, the whole process consists in hydrate dehydration, the decomposition of anhydrous lanthanum citrate to an oxycarbonate, and a final phase transformation from lanthanum oxycarbonate to lanthanum-nickel oxide.
As can be seen from the above analysis, the processes of nitrate decomposition and oxidative combustion of organic matter occur mostly within 400 °C. Thus, it is necessary to maintain a constant temperature at 400 °C for 2 h with the purpose of a full decomposition and oxidation reaction. The intermediate phase, i.e., lanthanum oxycarbonate, is produced in the temperature-programmed process, and it is completely decomposed within 700 °C. As for more exact temperature when the LaNiO3 crystalline phase appears, it needs to be further explored through an in situ XRD experiment in air atmosphere.

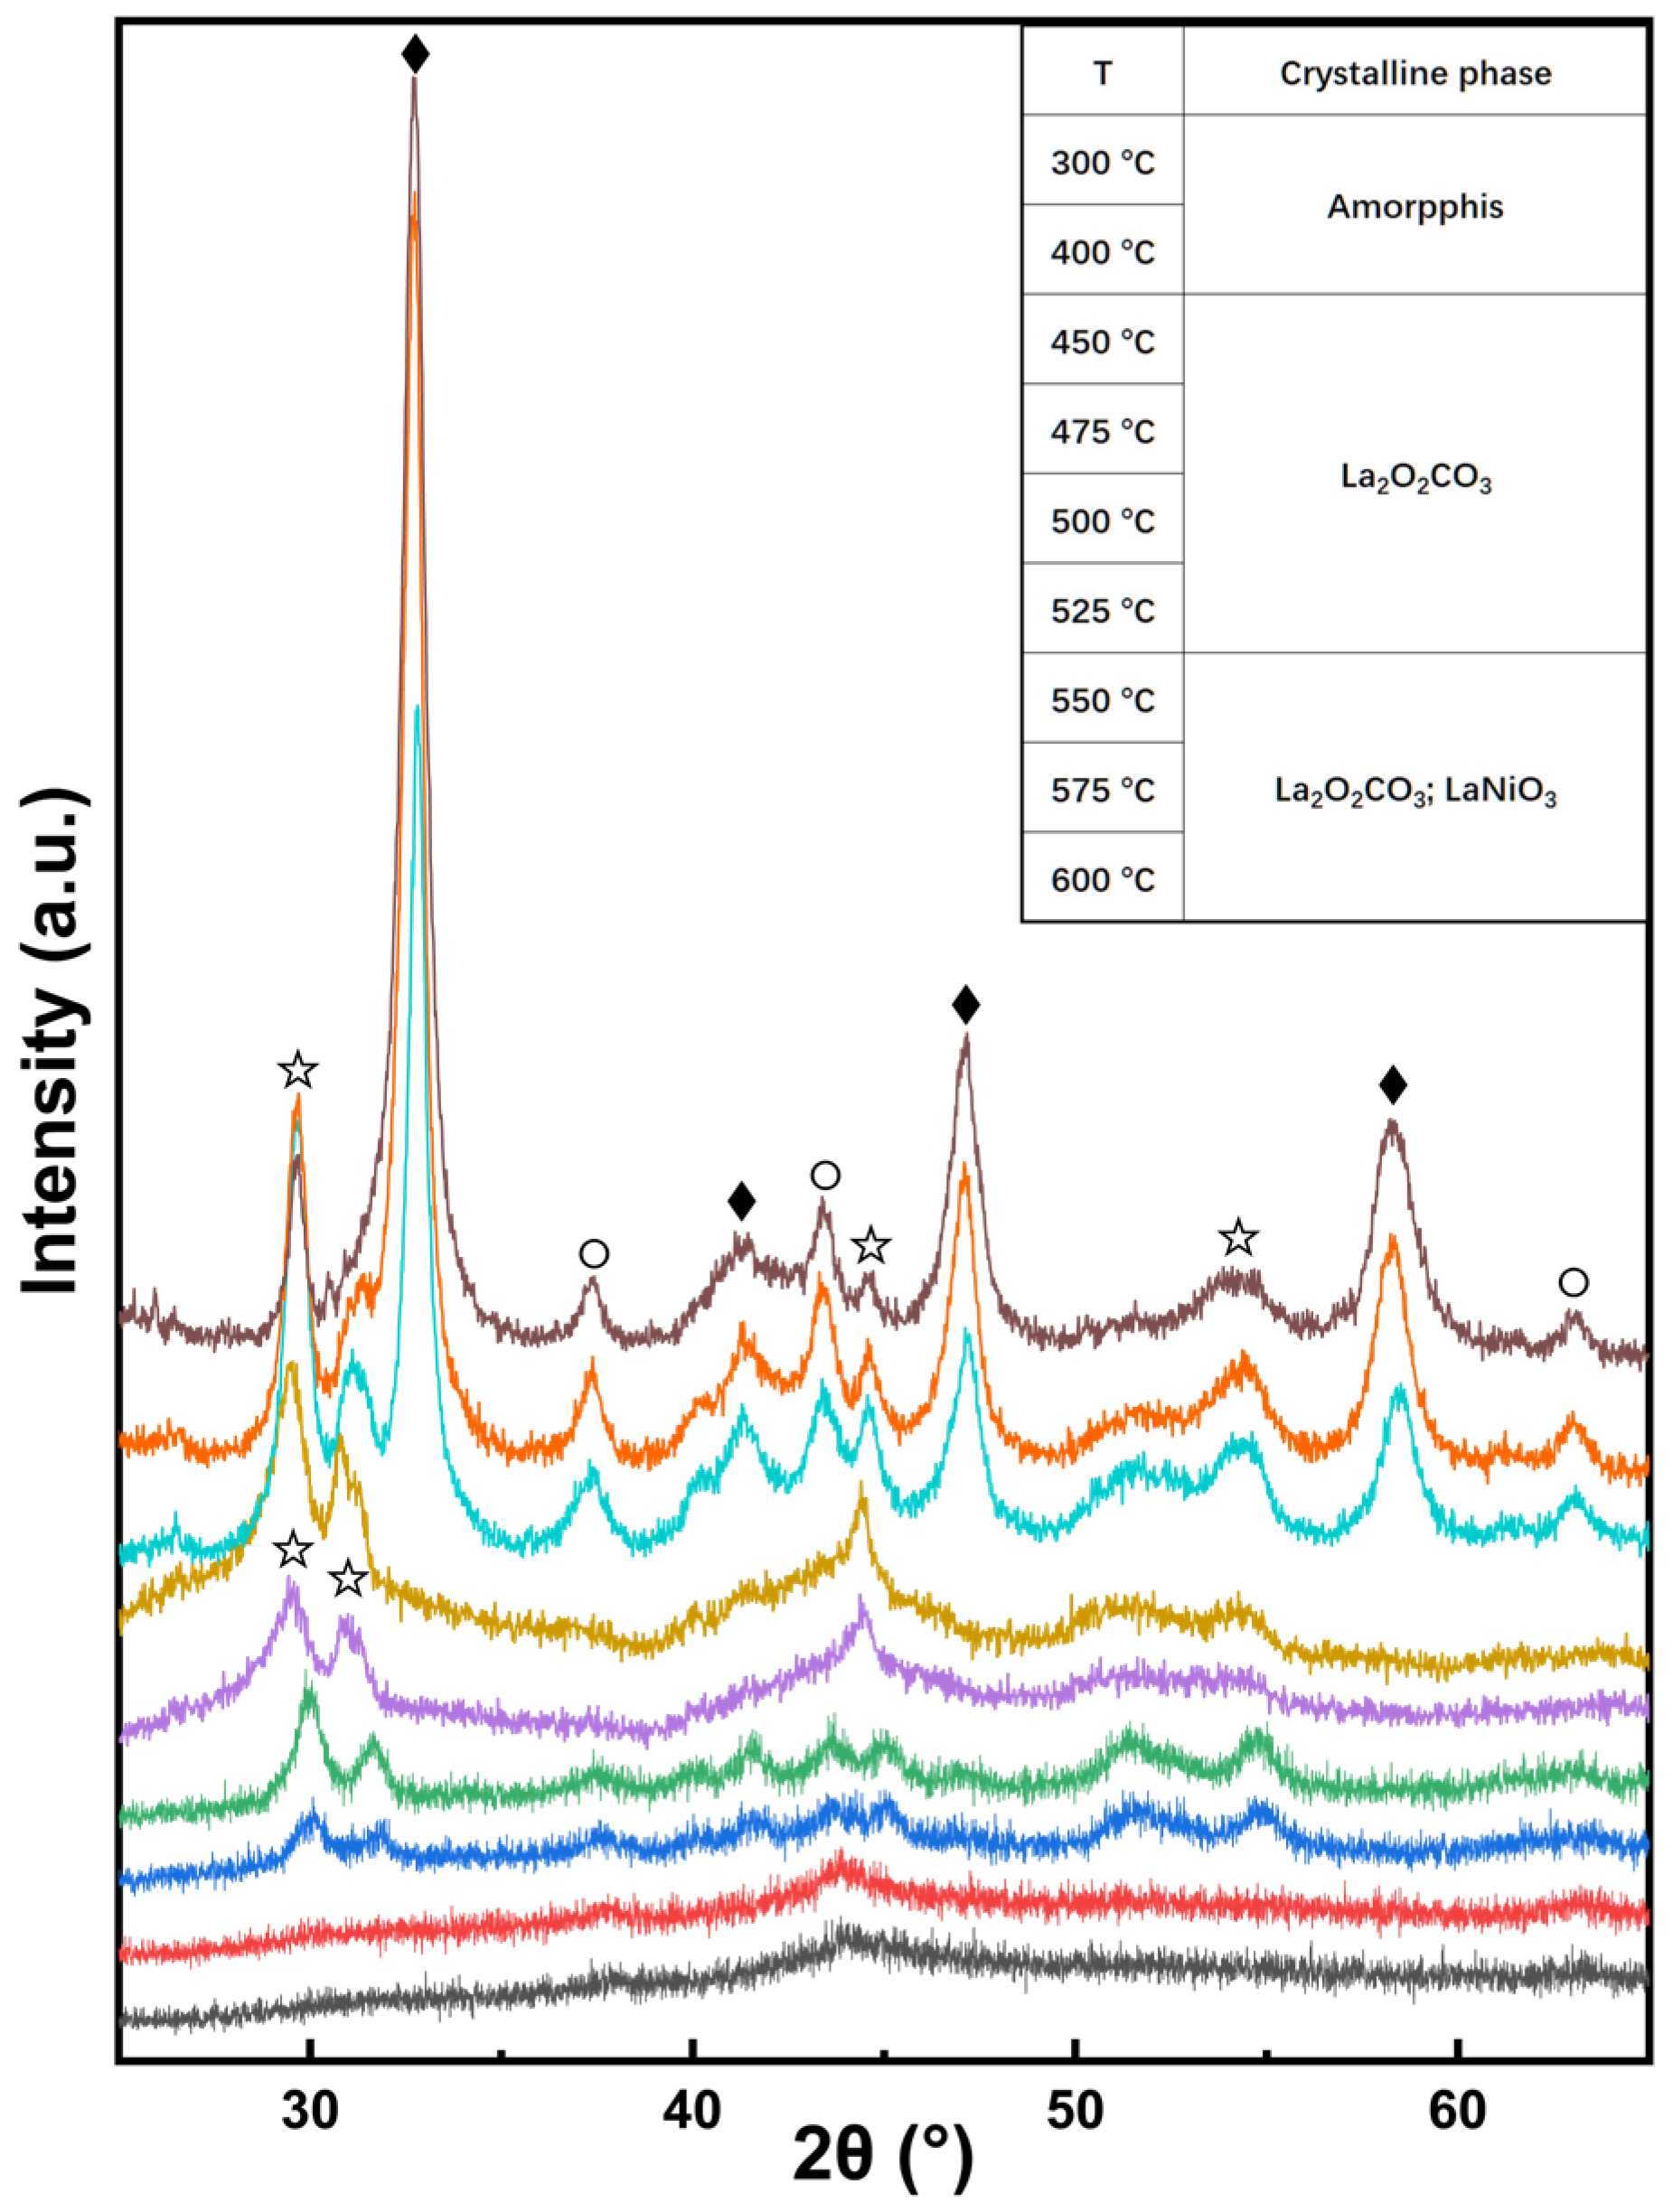
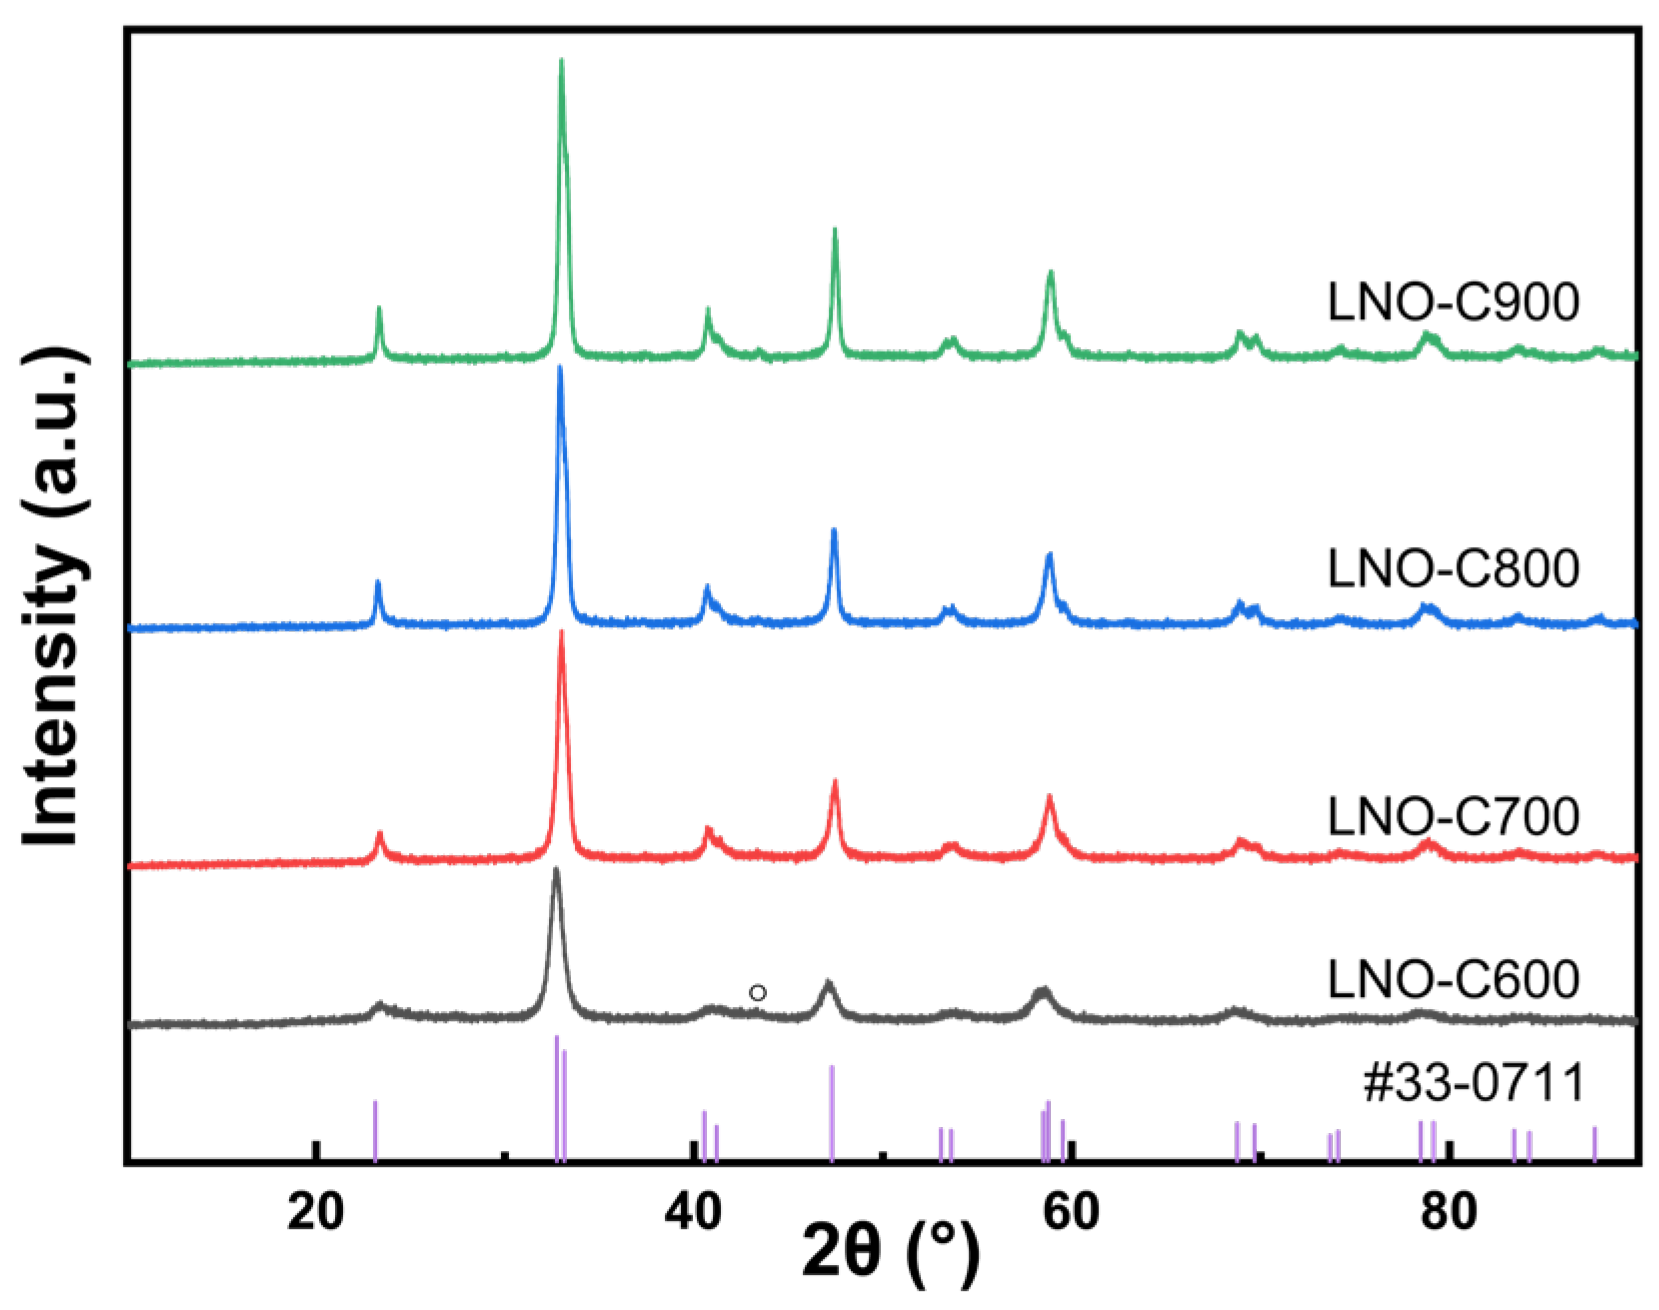
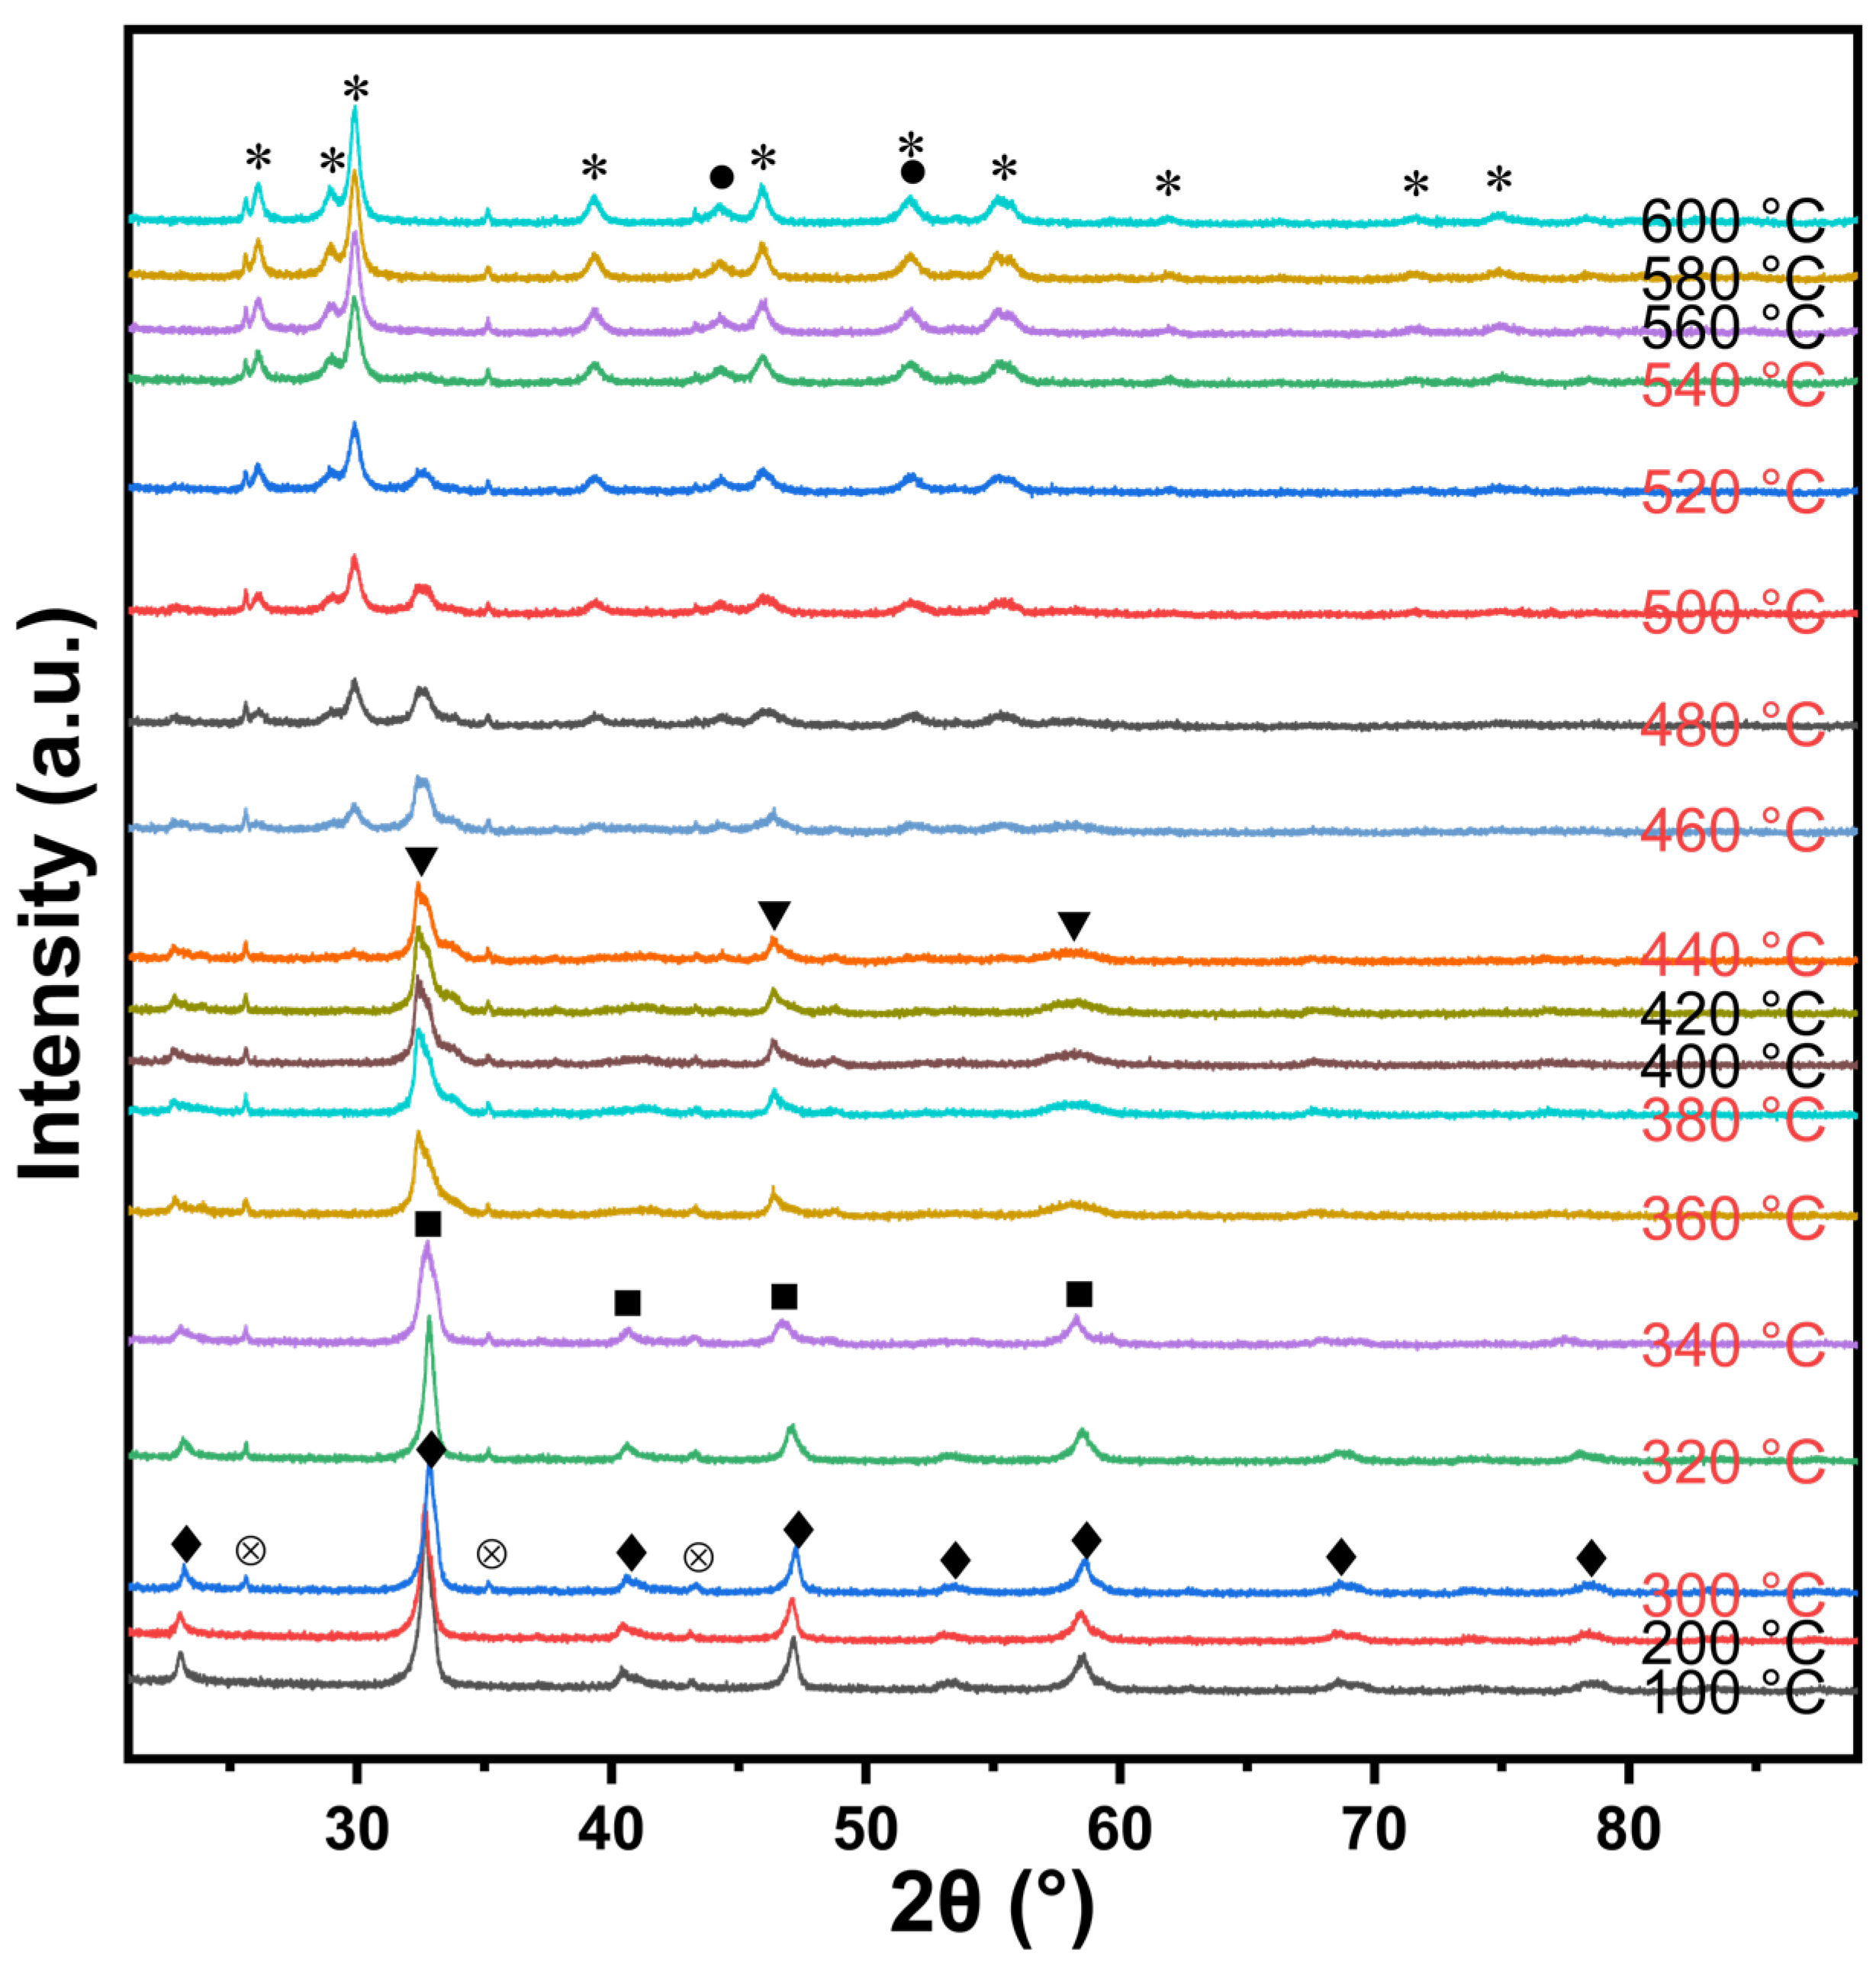
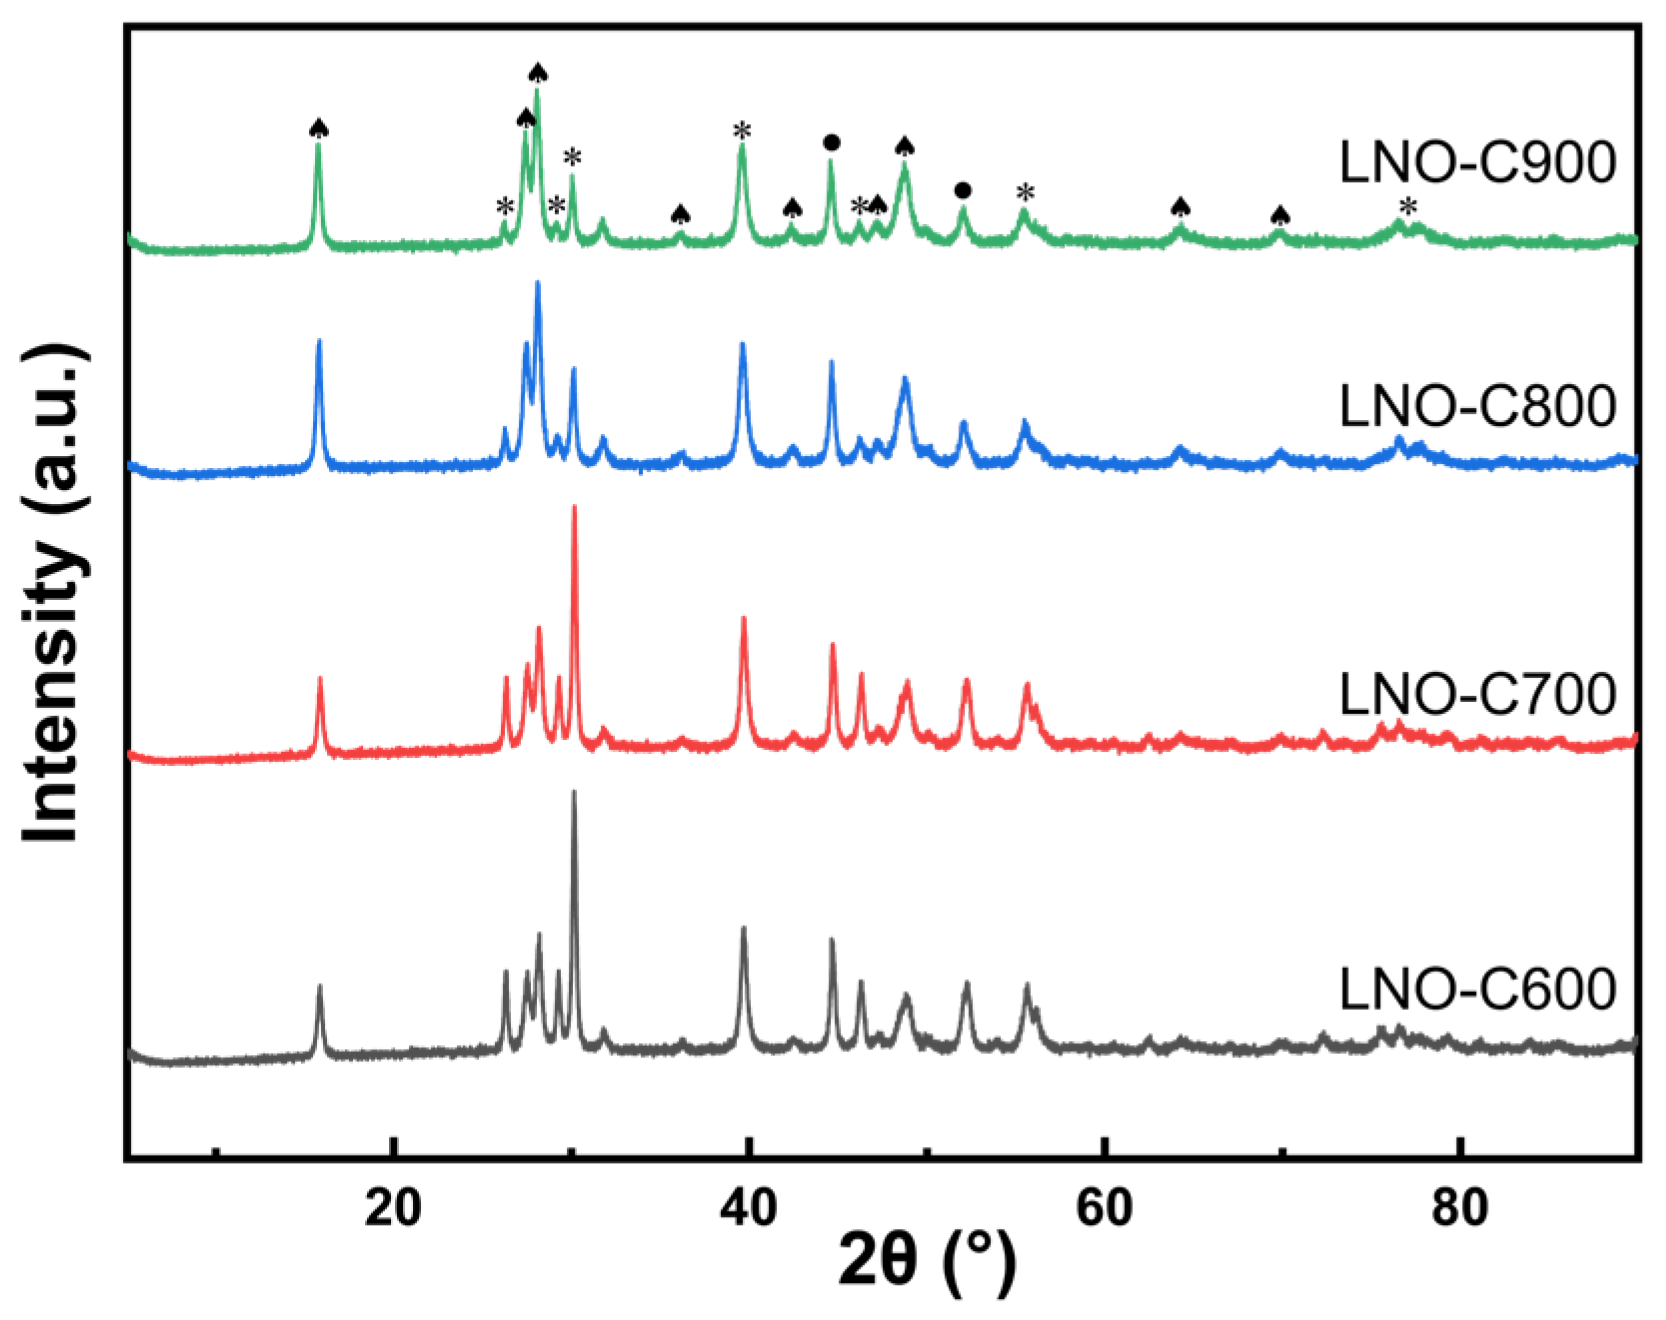
3.1.2. The Crystallization of LaNiO3 Crystalline Phase

To complement the thermal analysis results obtained using STA-MS-FTIR, an in situ XRD test of the gel precursor was carried out in flowing air in a reaction chamber with temperature ranging from room temperature to 600 °C. The diffraction patterns of the powder precursor at different temperatures are illustrated in Figure 3. The gel shows up in an amorphous pattern until 450 °C, when some peaks begin to appear due to the crystalline phase, in accordance with ex situ XRD diffractograms in some other research [44,46]. The crystalline signals result from lanthanum oxycarbonate, i.e., La2O2CO3, which is a common type of oxide in the presence of basic cations in atmosphere containing CO2, mentioned in some earlier research on lanthanum oxide [45,47,48]. Continuing to heat up to 550 °C, weak diffraction peaks corresponding to the LaNiO3 crystalline phase appear at 32.7 and 47.2° [44] and NiO at 37.3 and 43.3°. As the temperature continues to rise, La2O2CO3 decomposes further to yield the final oxide LaNiO3. Since the complete decomposition of carbonate oxide and the crystallization of perovskite require a continuous high-temperature treatment of several hours, the temperature of the thorough disappearance of the La2O2CO3 phase is not further studied here; we resort instead to ex situ XRD characterization, which is more realistic after consecutive calcination at a certain temperature.
With the aim of pure perovskite composition, the calcination temperature should be set above 600 °C at least according to Figure 3. Based on that, 600 °C, as a boundary temperature, was established as the lowest one used for calcination of LaNiO3. Considering also the STA-MS-FTIR results, which show that the decomposition process in fact proceeds until 700 °C, a series of calcination temperatures were chosen to prepare the catalysts.

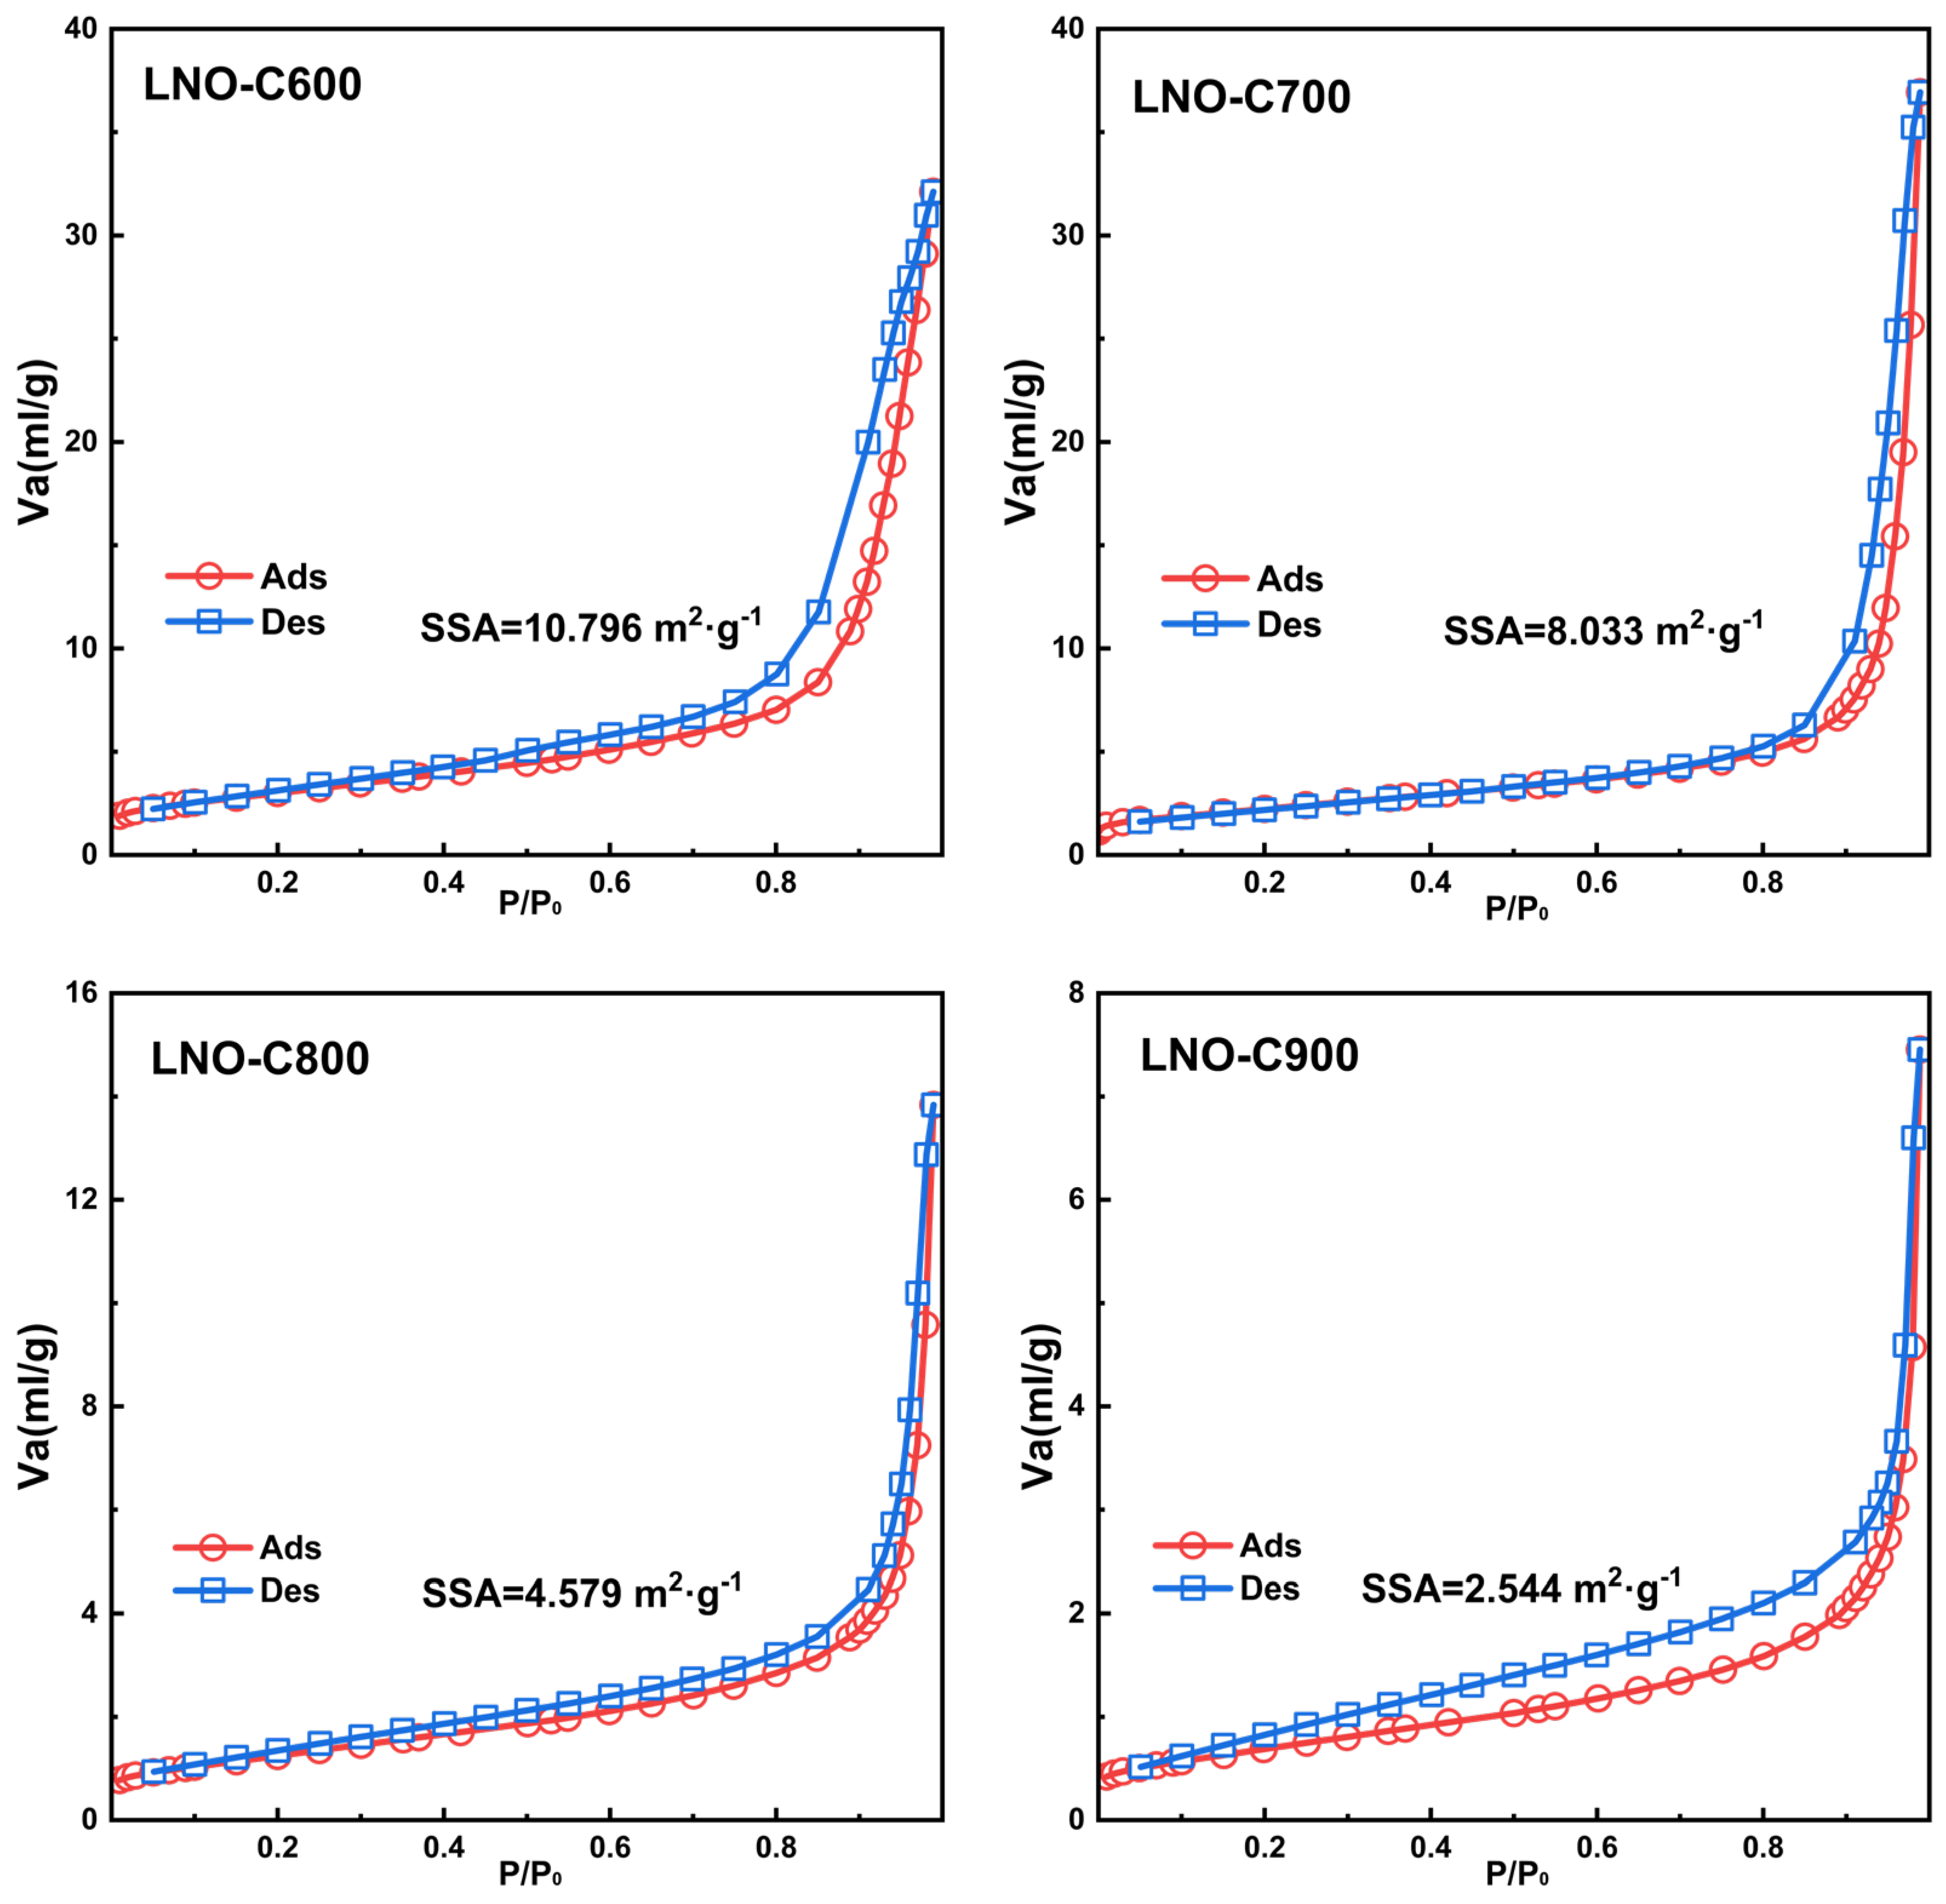
3.2. Physical Properties of Calcinated LaNiO3 Oxide

After analyzing the preparation process of the Pechini method, LaNiO3 samples calcinated at different temperatures (600–900 °C) were characterized using XRD to investigate the effect of calcination temperature on the LaNiO3 crystalline phase, with patterns shown in Figure 4. For samples treated at higher temperatures (≥700 °C), only pure perovskite phase indexed perfectly to JCPDS No.33-0711 was detected, which also indicates the proper application of the synthesis method46. In addition to the perovskite phase, the LNO-C600 sample also shows a weak diffraction peak of NiO13 marked with a hollow circle at 43.3° (indexed to JCPDS No.78-0643), demonstrating that part of the La and Ni components were not combined into the perovskite crystalline phase, and the intensity of the diffraction peak with burrs was relatively low, which reveals the poor crystallinity of oxide [39]. With the increase in calcination temperature, the peak of the perovskite structure was significantly enhanced, and also became sharper, which suggests more complete crystallization, that is, the structure of LaNiO3 is more perfect [15]. Furthermore, the grain size of the LaNiO3 crystalline phase can be calculated using the Scherrer equation based on the most intense peak of the XRD pattern at 32.7°. The results are summarized in Table 2, showing that the crystal size of LaNiO3 increased from 10.0 to 17.9 nm with calcination temperature [46,50]. The calculated cell parameters of each sample are also shown in Table 2. It has been reported that unit cell volume is concerned with atomic distance and bond length. Therefore, it could be inferred that increased calcination temperature reduces the length of the La-O and Ni-O bonds, thus affecting the corresponding bond strength.
The above results indicate that the increased calcination temperature can promote the crystallization process of perovskite oxide and enhance the ionic bond strength of LaNiO3. The higher the calcination temperature, the larger the crystal size of LaNiO3 [50,51].
The textural properties of fresh catalysts were studied using the N2 physical absorption analysis shown in Figure 5. Type Ⅲ adsorption isotherms, with Type H3 hysteresis during the desorption process, could be obtained in all the samples, indicating non-porous or macroporous materials. Consistent with the conclusions of related studies [15,39,52], the specific surface area of perovskite was generally less than 10 m2·g−1, due to the fact that high-temperature calcination is necessary for the crystallization of perovskite-type oxide. For the samples calcined at different temperatures, the specific surface area decreased markedly from 10.796 m2·g−1 of LNO-C600 to 2.544 m2·g−1 of LNO-C900 (in Table 2), which is attributed to particle sintering caused by higher temperature, corresponding with XRD characterization results in Figure 4.

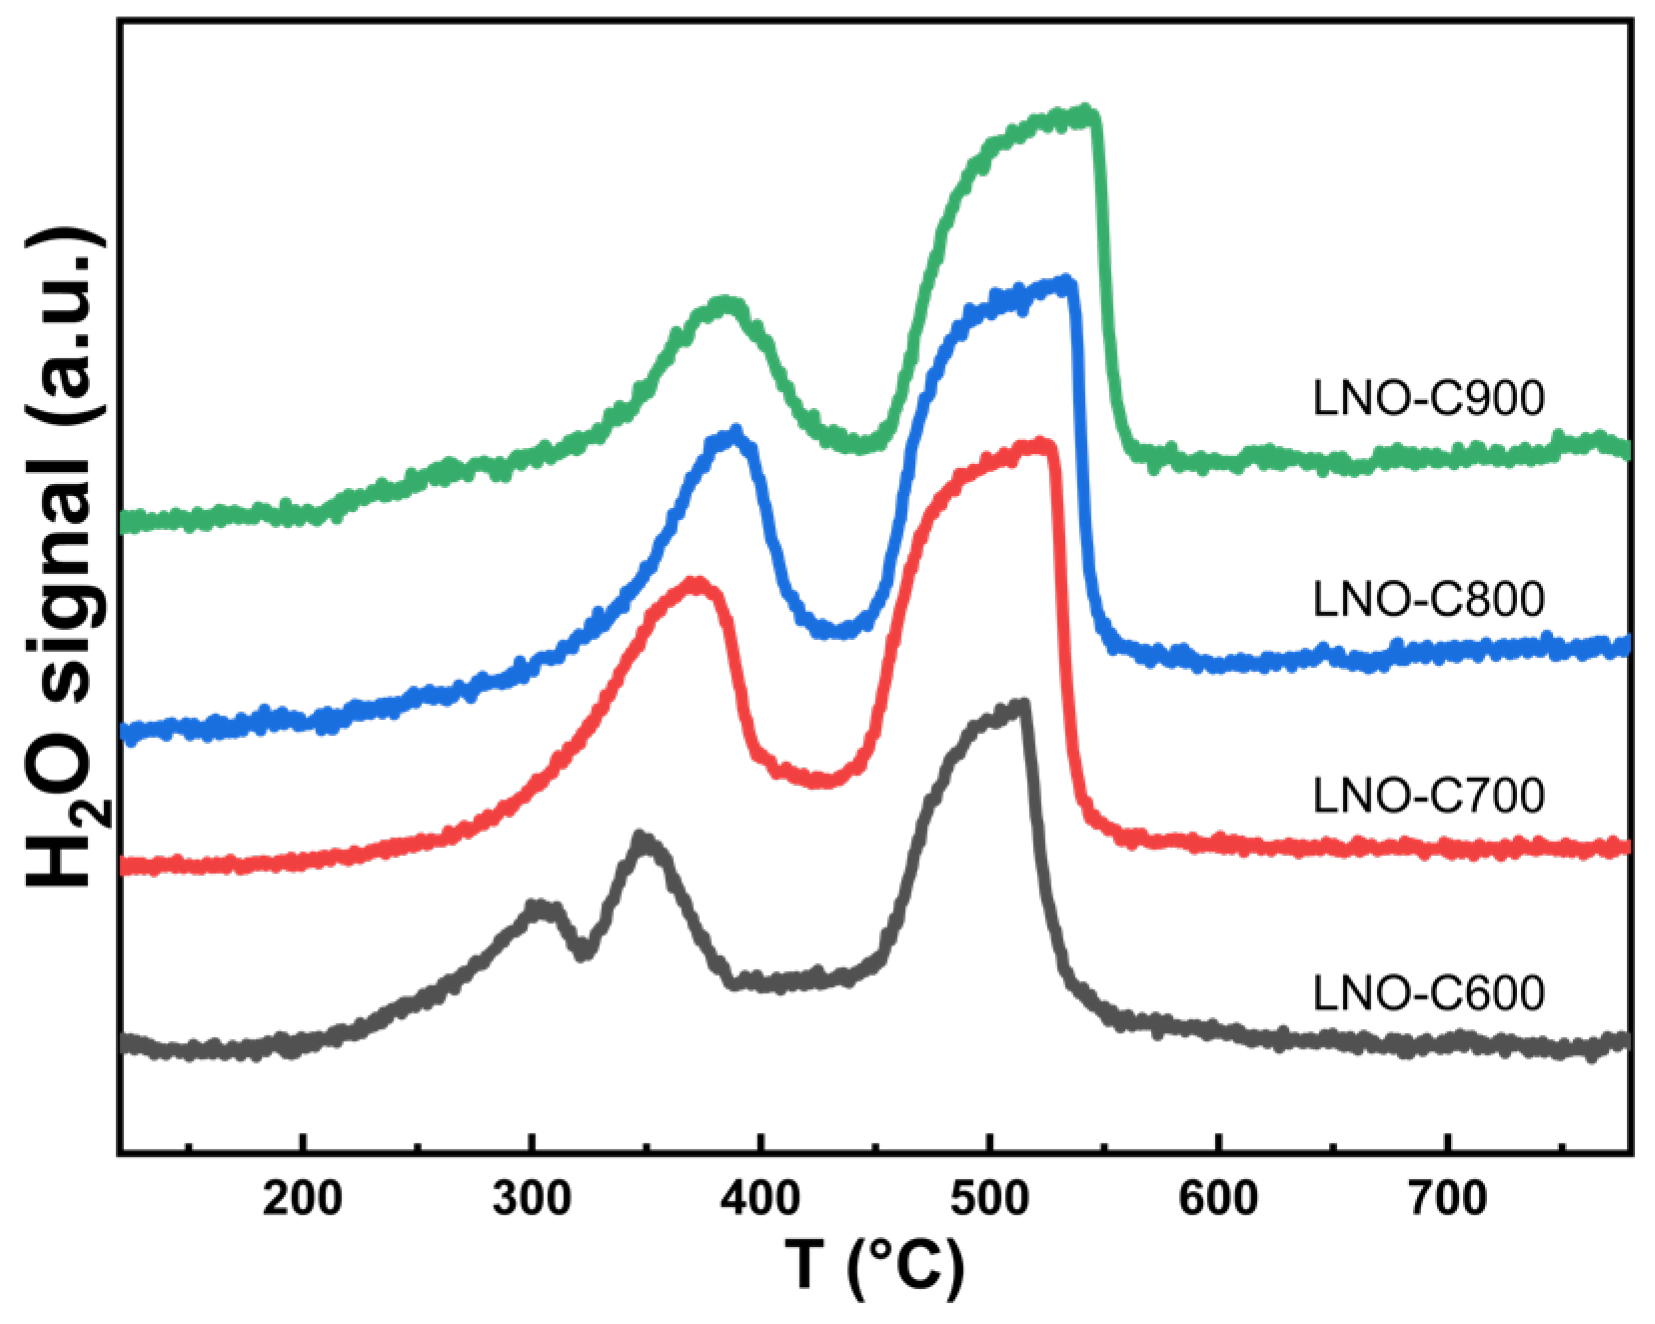
3.3. Reducibility of Calcinated LaNiO3 Oxides

Since the active component of the SRM reaction is reduced nickel metal located on the surface of catalyst, the reductive activation of LaNiO3 should be completed in the reducing atmosphere before methane conversion, transforming perovskite into metal supported on oxide. Therefore, the crucial reduction properties of the LaNiO3 crystalline phase were studied using H2-TPR and in situ XRD in H2 atmosphere [53,54], with the purpose of illuminating the reduction process and reduction results of samples obtained at different calcination temperatures.
The H2-TPR profiles of LaNiO3 samples are shown in Figure 6, where LNO-C600 has three reduction peaks, while the samples calcinated at temperatures above 700 °C have two peaks. Referring to the XRD characterization of LNO-C600 and in situ XRD in air, it can be known that there is still a certain amount of NiO present in the sample after 600 °C calcination, which is not combined with the stoichiometrically corresponding La component. Thus, there is the reduction process of free NiO phase, corresponding to the reduction peak in the left, at about 300 °C [13,55]. The remaining two peaks are consistent with those of other samples calcined at higher temperatures, which are attributed to the reduction of LaNiO3, but the positions shift. To be specific, the higher the calcination temperature of LaNiO3, the higher the reduction temperature [56,57,58]. In terms of the high-temperature reduction peak of LaNiO3, the temperature varies from the 514 °C of LNO-C600 to the 526, 536, and 545 °C of LNO-C700, LNO-C800, and LNO-900, respectively, which demonstrates more the difficult reduction process of LaNiO3 with the calcination temperature increasing. This phenomenon can be explained by the enhanced La-O-Ni ionic bond strength in the perovskite phase owing to the higher calcination temperature, deduced from the cell parameters of samples in XRD characterization, which makes it more difficult to extract Ni from bulk oxide.
Moreover, it can be concluded from the H2-TPR profiles that the reduction of the LaNiO3 phase is completed through two steps: (i) the first reduction step at 250–430 °C; (ii) the second reduction step at 44–560 °C [59,60]. Moreover, the area of high-temperature reduction peaks is larger than that of the low-temperature reduction peak. The actual crystalline phase transition during the reduction process was investigated by following in situ XRD in H2. Taking the LNO-C800 sample as an example, XRD patterns during the reduction process in H2 are collected, as shown in Figure 7, to learn about the transition temperature of the LaNiO3 phase and the intermediate phase existing in the reduction process. The reduction process mainly occurs between 300 and 560 °C, and two steps of the process can be clearly observed from the evolution of the crystalline phase.
The first step (Equation (1)), located at 300–380 °C, is consistent with the temperature range of the low-temperature reduction peak of the H2-TPR profile. By comparing the crystal database, it can be obtained that the crystalline phases at 340 and 360 °C are LaNiO2.7 (JCPDS No.37-0928) and LaNiO2.5 (JCPDS No.82-0556) [52,61,62], respectively. Above 360 °C, the LaNiO2.5 phase remains in spite of the increase in temperature [63,64]. In this step, Ni3+ is reduced to Ni2+, and part of the lattice oxygen in the LaNiO3 phase is consumed. The perovskite structure is still maintained, though the lattice arrangement is distorted by the oxygen vacancies in the bulk of the crystalline phase, which can be seen in the less intense and broader peaks than that of fresh samples without reduction. Moreover, it can be observed that the main diffraction peak of LaNiO3-δ shifts to the left, which corresponds to the decrease in diffraction angle 2θ. According to the Bragg equation, the interplanar crystal spacing becomes larger, attributable to the fact that the ion radius of Ni becomes larger and the unit cell expands, resulting from a partial reduction by receiving electrons. The second step (Equation (2)), from 440 °C to 560 °C, can be assigned to the high-temperature reduction peak in the H2-TPR profile. The diffraction pattern does not change until 440 °C, prior to which the previous LaNiO2.5 crystalline phase is preserved. With the increase in temperature, and the continuing decrease in the diffraction peak intensity of the distorted perovskite phase, the Ni metal and La2O3 oxide phase appears. By 560 °C, the perovskite phase disappears completely, and the activated nickel metal supported on La2O3 is obtained.
L a N i O 3 + H 2 L a N i O 2.5 + H 2 O
L a N i O 2.5 + H 2 N i + L a 2 O 3 + H 2 O
After the reduction process is completed, the diffraction peak of the pattern becomes more intense and sharper (not listed) with the increase in the temperature, indicating that the crystalline phase is more perfect and the crystal size increases to a certain extent [61]. As the temperature rises from 600 to 850 °C, the crystal size of Ni0 (calculated according to the main peak at 44.3°) increases from 15.0 nm to 23.0 nm, as shown in Figure 8.

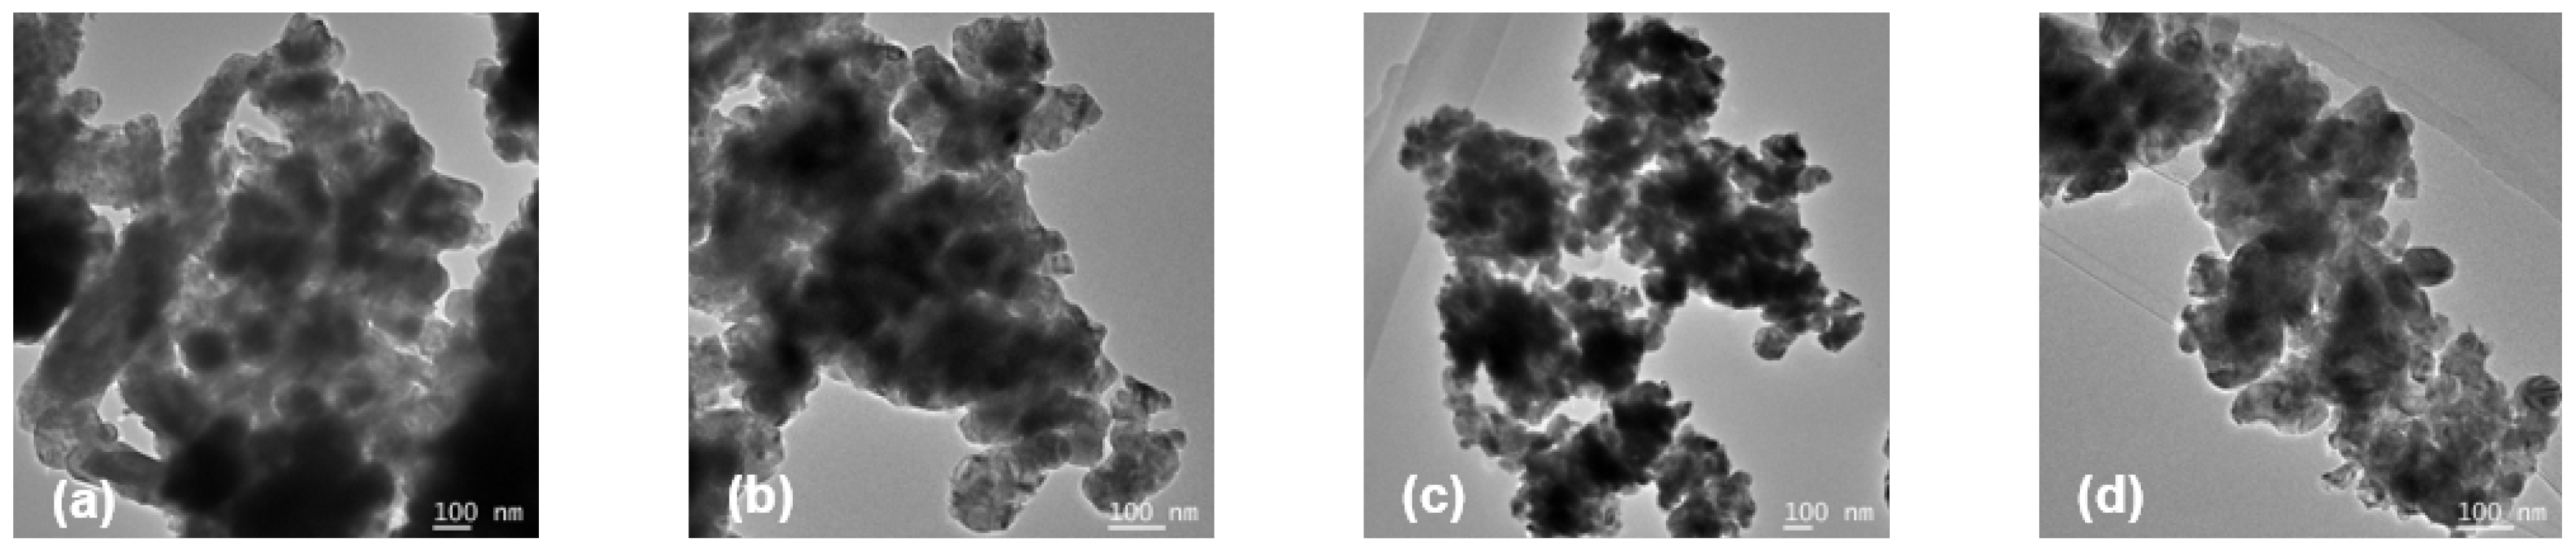
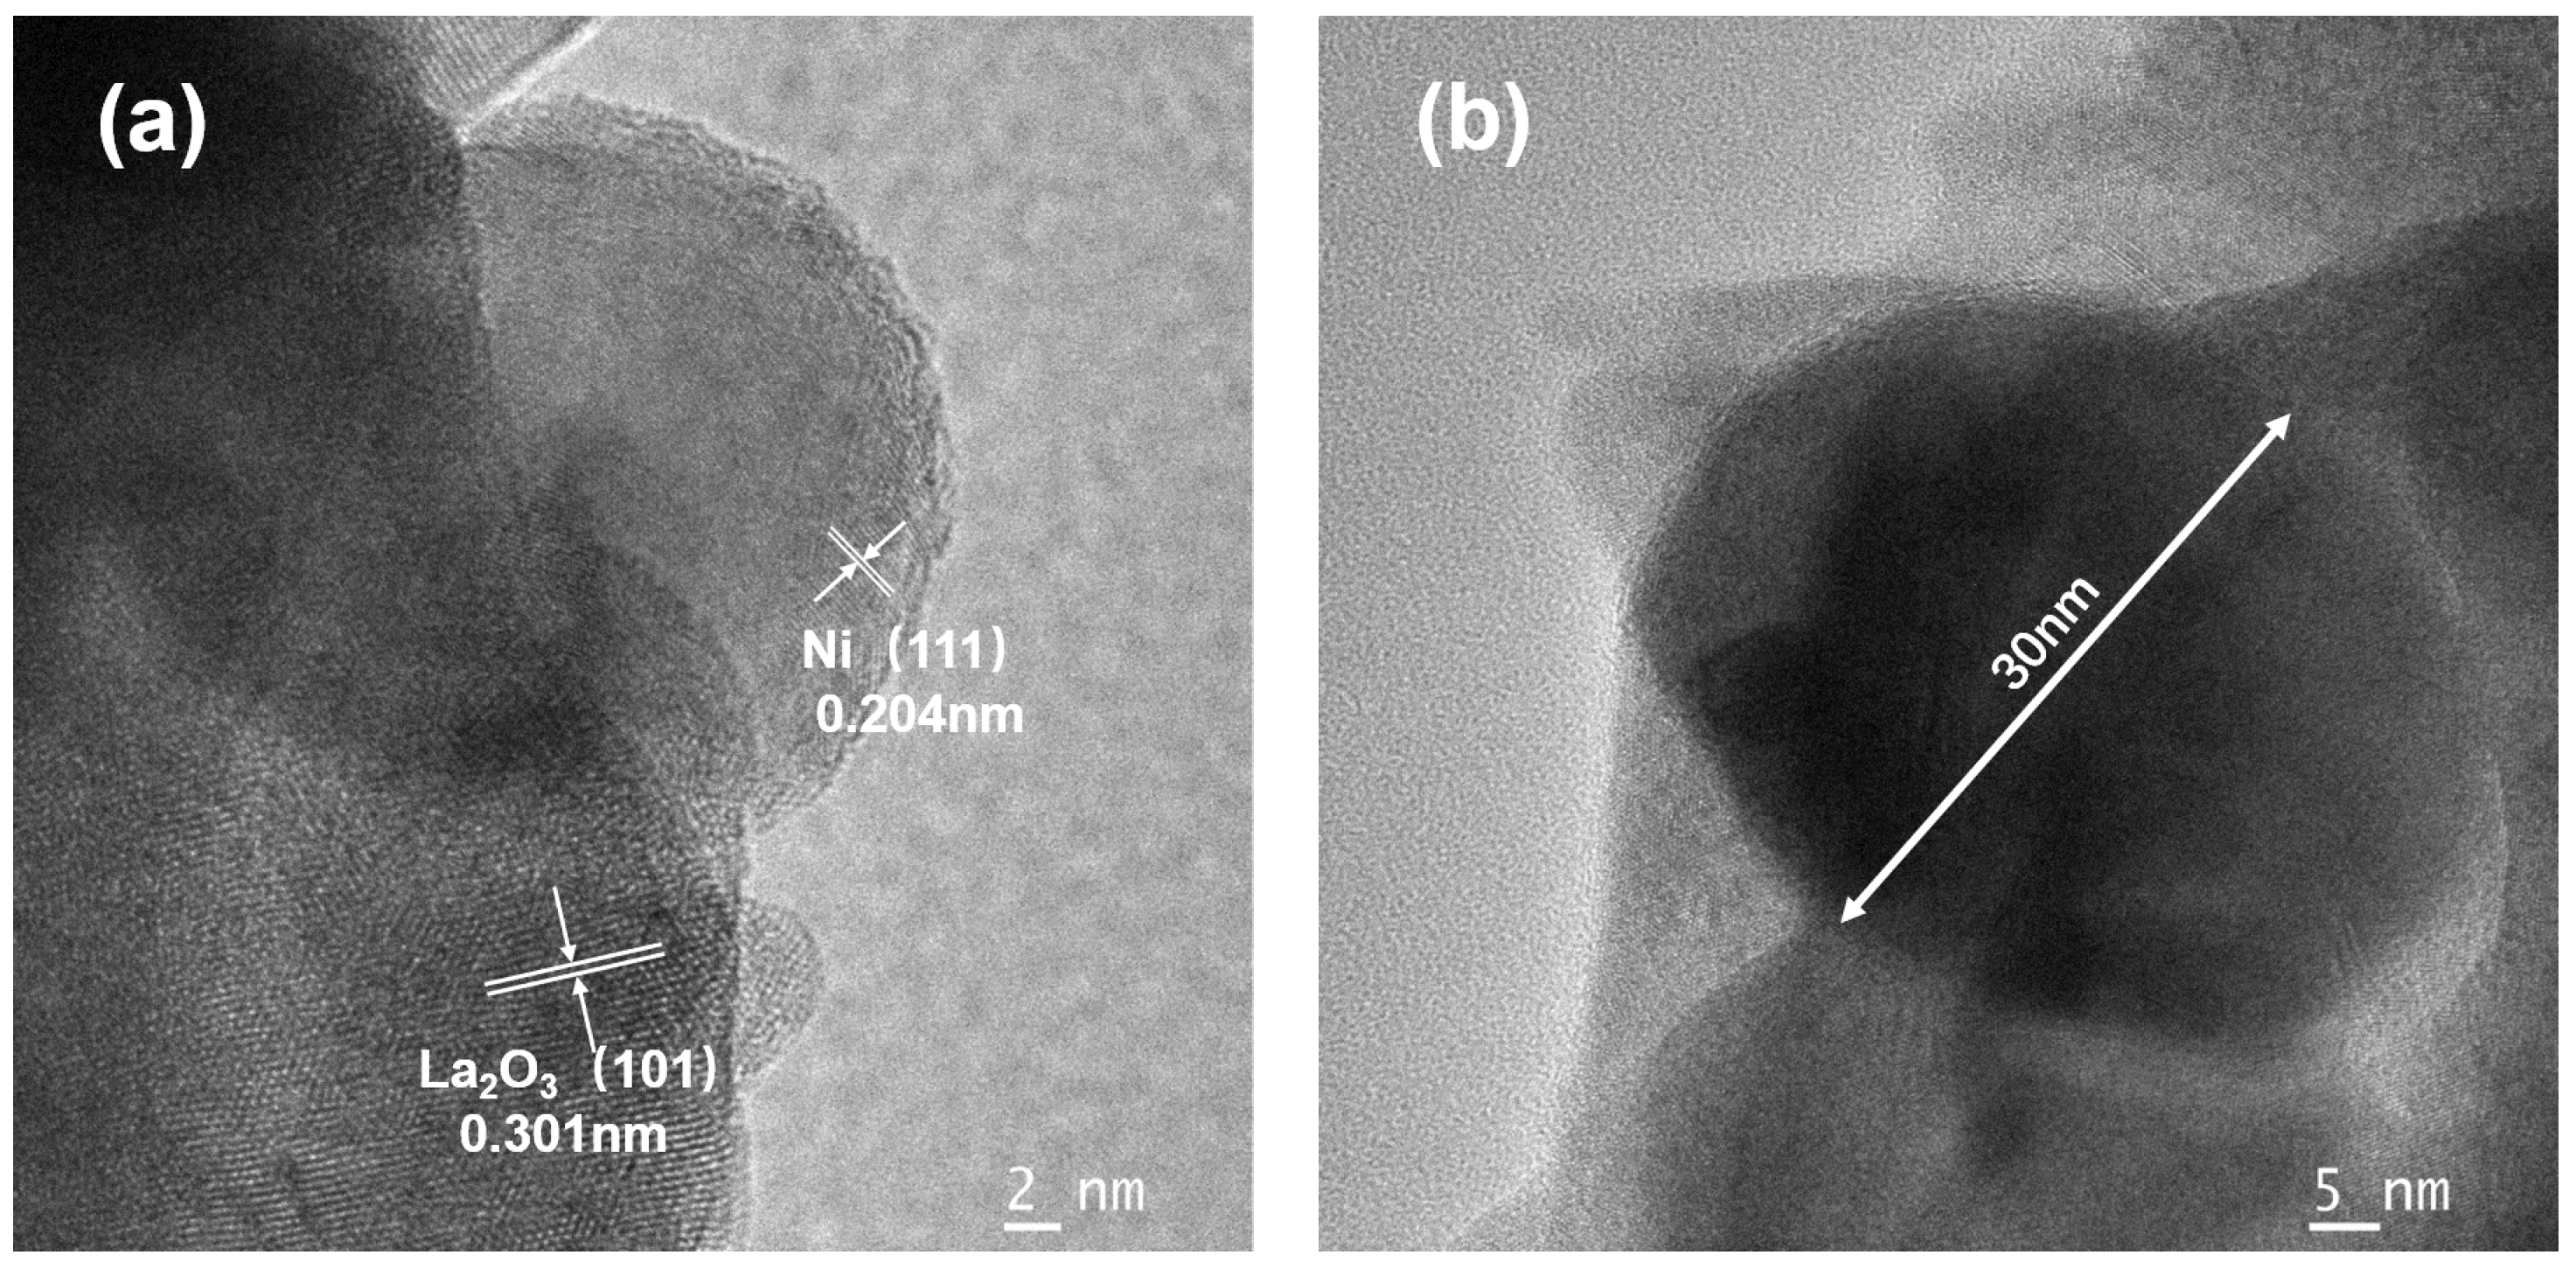
3.4. Characterization of Reduced Catalysts

It is necessary to explore crystalline phase and morphology of reduced catalyst by XRD and TEM characterization as the LaNiO3 sample needs to be activated in a pure hydrogen atmosphere at 850 °C for 2 h before the catalytic reforming reaction. The XRD patterns of each catalyst after reduction are illustrated in Figure 9. All the samples appear as Ni (JCPDS No.04-0850), La(OH)3 (JCPDS No.36-1481), and La2O3 (JCPDS No.74-2430) after reduction [65,66]. Comparing the diffraction peaks of Ni crystal from different samples after reduction, it can be concluded that the higher the calcination temperature of LaNiO3, the smaller the Ni0 crystal size obtained after reduction [38], as listed in Table 2.
The aforementioned H2-TPR profiles reveal the gradual reduction difficulty of the fresh sample with the higher calcination temperature, which is significant for elucidating this phenomenon. The higher calcination temperature of LaNiO3 makes it more difficult to extract Ni from bulk oxide, and the metal–support interaction of the catalysts obtained after reduction also becomes stronger [67,68]. The resistance of dissolving out from the bulk can keep Ni grains from aggregating in a degree, so that smaller grains can be obtained.
Transmission electron microscopy (TEM) was used to observe the morphology of reduced catalysts, and nearly spherical Ni crystalline grains, supported on layered La2O3 support [69,70], were obtained for each catalyst after reduction, as shown in Figure 10. Clear lattice fringes can be observed through high-resolution TEM images in Figure 11a, and the crystal plane spacing proves that a large amount of the spreading phase was La2O3 oxide, while the spherical structure in the edge was Ni metal crystal, as shown in Figure 11b. EDS mappings in Figure 12 also verify the catalyst system where Ni is loaded on the oxide of La after reduction. There is a highly consistent distribution in terms of La and O elements, while Ni and O do not coincide. The La element displays continuous distribution with a larger area, and Ni element appears as granular dispersion.

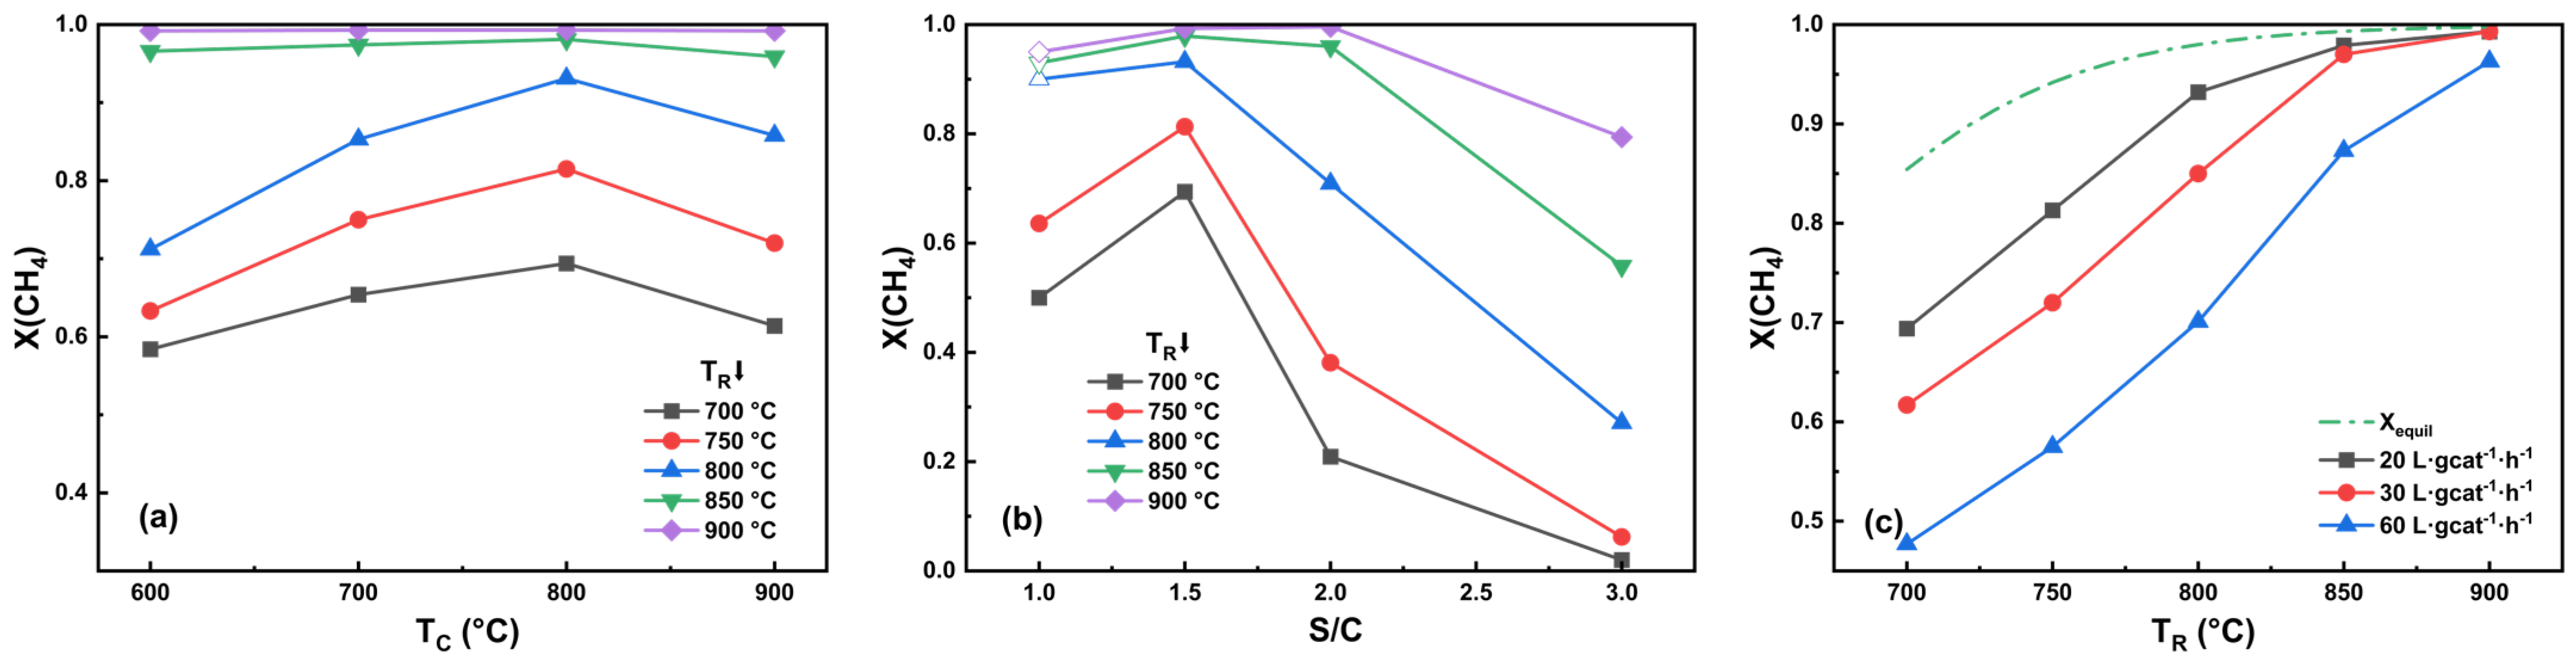
3.5. Reaction Performance of Reduced LaNiO3 Samples

The activity of LaNiO3 samples previously calcined at different temperatures was tested after in situ reduction at 850 °C for 2 h in H2. Firstly, the influence of the calcination temperature (TC) of LaNiO3 was studied. The reaction temperature (TR) varied from 700 to 900 °C, and each TR was held for 3 h, with a steam-to-carbon ratio (S/C) equal to 1.5. The reactor was first set at 900 °C, and the system could reach the steady state 20 min after the reactants were fed into the reactor. Then, the reaction performance data would be recorded. Moreover, 10 min for system stabilization were also allowed each time when the reactor temperature was switched. Figure 13a shows the relationship between catalyst activity and TC under different TR. For each catalyst, the higher the TR, the higher the methane conversion [15,71,72]. The conversion reached more than 95% at 850 °C, and nearly complete conversion could be acquired at 900 °C. At the same TR, elevated TC, ranging from 600 to 800 °C, resulted in a gradually increased methane conversion, which reached its maximum when LaNiO3 was calcinated at 800 °C. The reaction performance improved more remarkably with the increase in TC when TR was less than 800 °C. Nevertheless, continuing to raise TC to 900 °C, methane conversion decreased, and the reduction in activity was more notable at lower TR (below 800 °C). As the calcination temperature increased, the reduced Ni particle became smaller and smaller. As has been studied in the literature, smaller Ni grains can increase the activation rate of methane, which has a significant impact on the activity of the catalyst [73,74,75,76]. Moreover, it is generally accepted that steam is activated either through Ni crystal grains or by oxide support [73,77]. Then, the differences in calcination temperature will also alter the interaction between the support and the active component of the reduced catalyst, which facilitates the overflow of oxygen species from La2O3 to Ni [73,78,79]. The good hygroscopicity [80] of the La element makes it easier for it to adsorb and activate steam, and produce reactive oxygen species including hydroxyl and atomic oxygen, which can be delivered to some adjacent Ni clusters. In addition, a strong interaction would cause an unbalanced oxygen species supply against the methane dissociation rate and a reduction in catalytic activity [68,81].
Then, with S/C ranging from 1 to 3, an activity evaluation for the reduced catalyst of LNO-C800 was performed and the results obtained at different TR are shown in Figure 13b. It can be seen that 1.5 is the optimal S/C ratio, but the composition of the reactants consistent with the stoichiometry of the SRM reaction equation could not provide the highest conversion. The S/C continued to increase from 1.5 to 2.0, and the methane conversion decreased to various degrees at different TR. At relatively lower TR, the activity decreased more rapidly, which was caused by the oxidation effect of Ni through excess steam, verified in the XRD characterization of used catalyst in the following. If the S/C continues to increase, methane conversion will further decline. Compared with traditional supported nickel-based catalysts, this type of catalyst derived from LaNiO3 precursor requires a lower S/C to achieve optimal reforming reaction activity, which may also depend on the hygroscopicity and alkalinity of the La2O3 support oxide [78,80].
Finally, the effect of space velocity on methane conversion was studied by changing the catalyst loading amount to 25 mg, 50 mg, and 75 mg, respectively, and the results are illustrated in Figure 13c. At the space velocity of 20 L·gcat−1·h−1, the methane conversion close to the thermodynamic equilibrium can be reached when the reaction temperature is higher than 800 °C, while at a relatively low temperature (lower than or equal to 750 °C), the reaction performance is greatly limited by kinetics [82,83]. When the space velocity is increased to 30 and 60 L·gcat−1·h−1, the methane conversion decreases to an extent.

3.6. Spent Catalysts Characterization

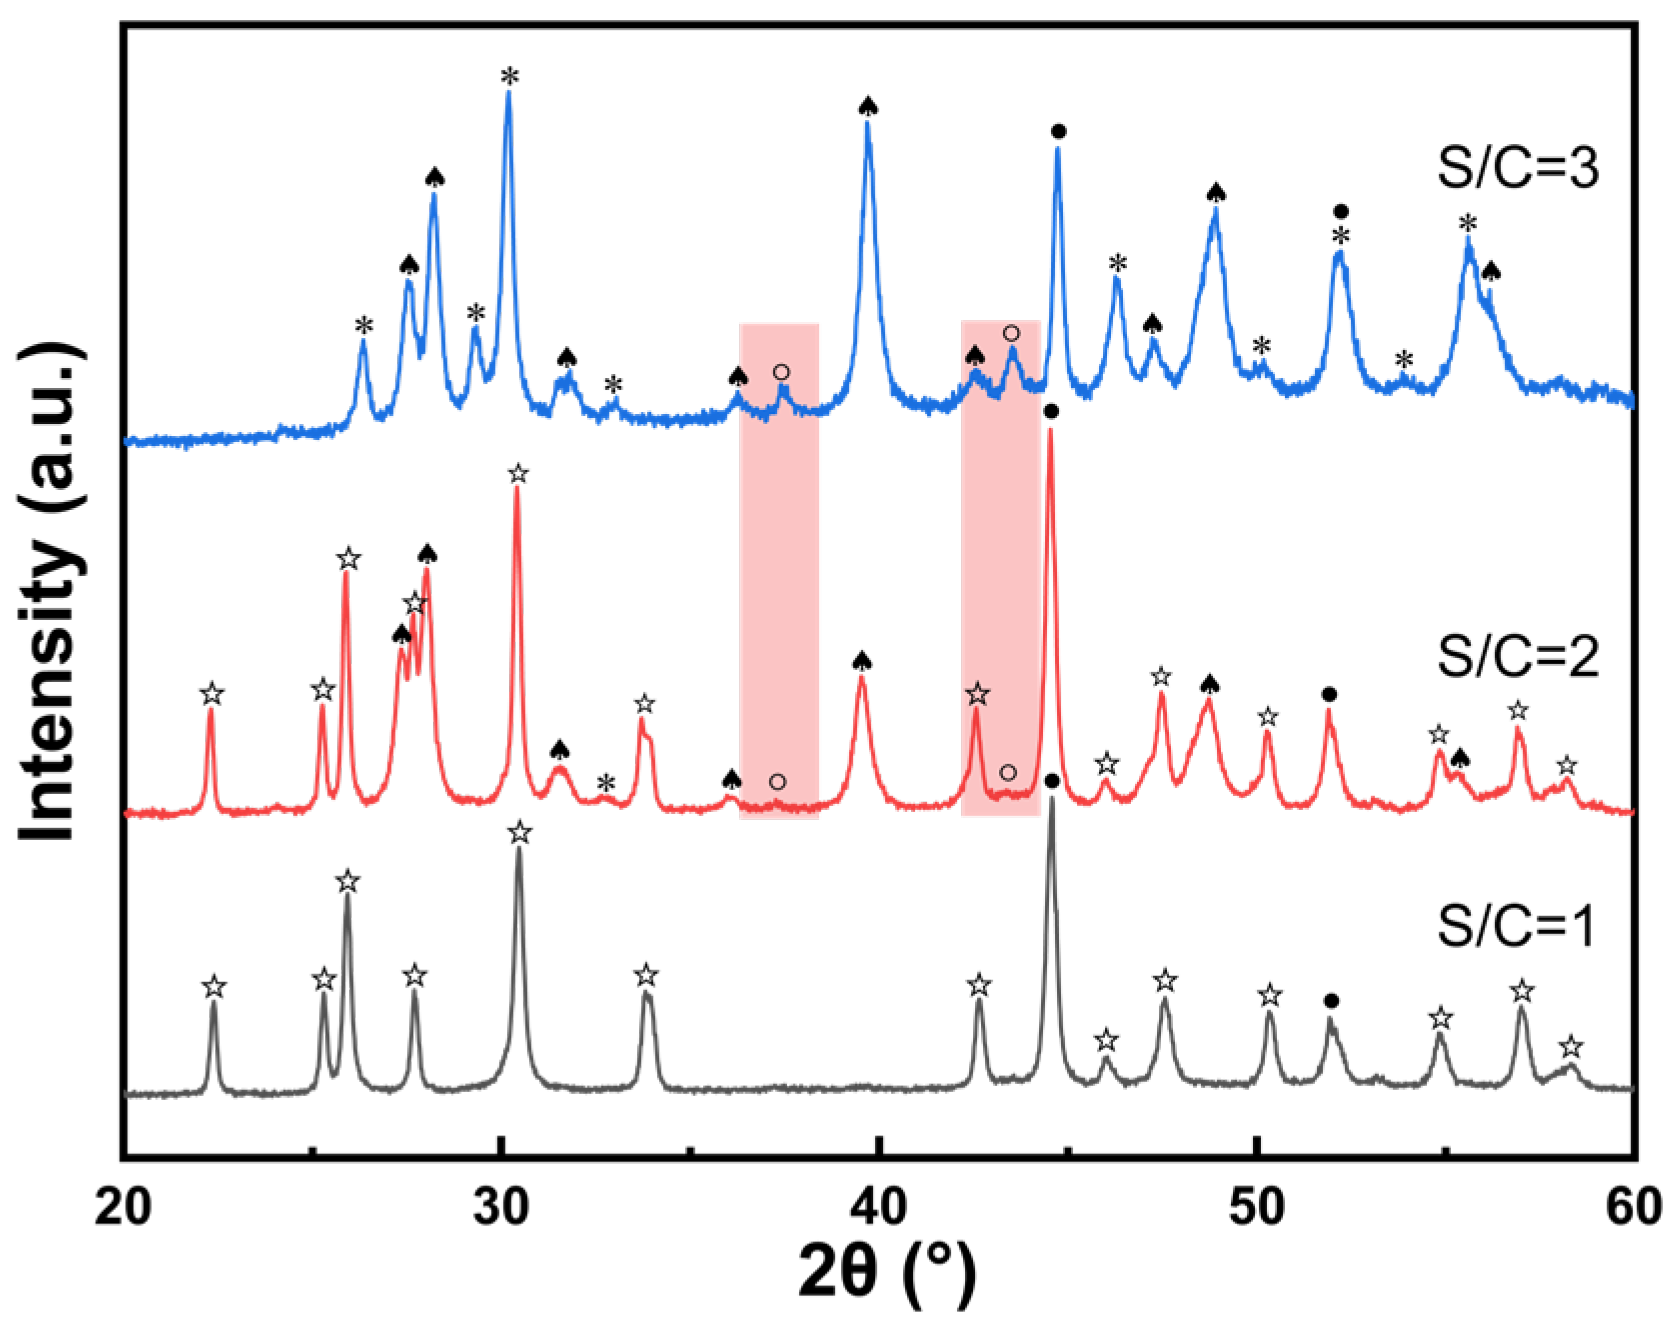
3.6.1. Effect of S/C on Crystalline Phase

The reduced catalysts from the LNO-C800 sample after the SRM reaction at different S/C were characterized using XRD. As shown in Figure 14, when stoichiometric reactants were fed, the support appeared as La2O2CO3 (JCPDS No. 37-0804), and the Ni element only existed in the metallic state. When S/C was 2, the crystalline phases of support included La2O2CO3 and La(OH)3, and NiO also began to emerge. With the increase in S/C to 3, La(OH)3 mainly existed in the support, accompanied by a small amount of La2O3, and the diffraction peak intensity of NiO was further strengthened. The more intense peak of NiO confirms that the increase in S/C causes the oxidation of the metallic active component of Ni in the catalyst, and a growing number of NiO results in the reduction in the reaction activity at higher S/C. In addition, when S/C is lower and the residual steam in the reactor is less, La2O3 tends to combine with CO2 in the product to form oxycarbonate La2O2CO3. By contrast, a higher S/C could make La2O3 transform into La(OH)3.

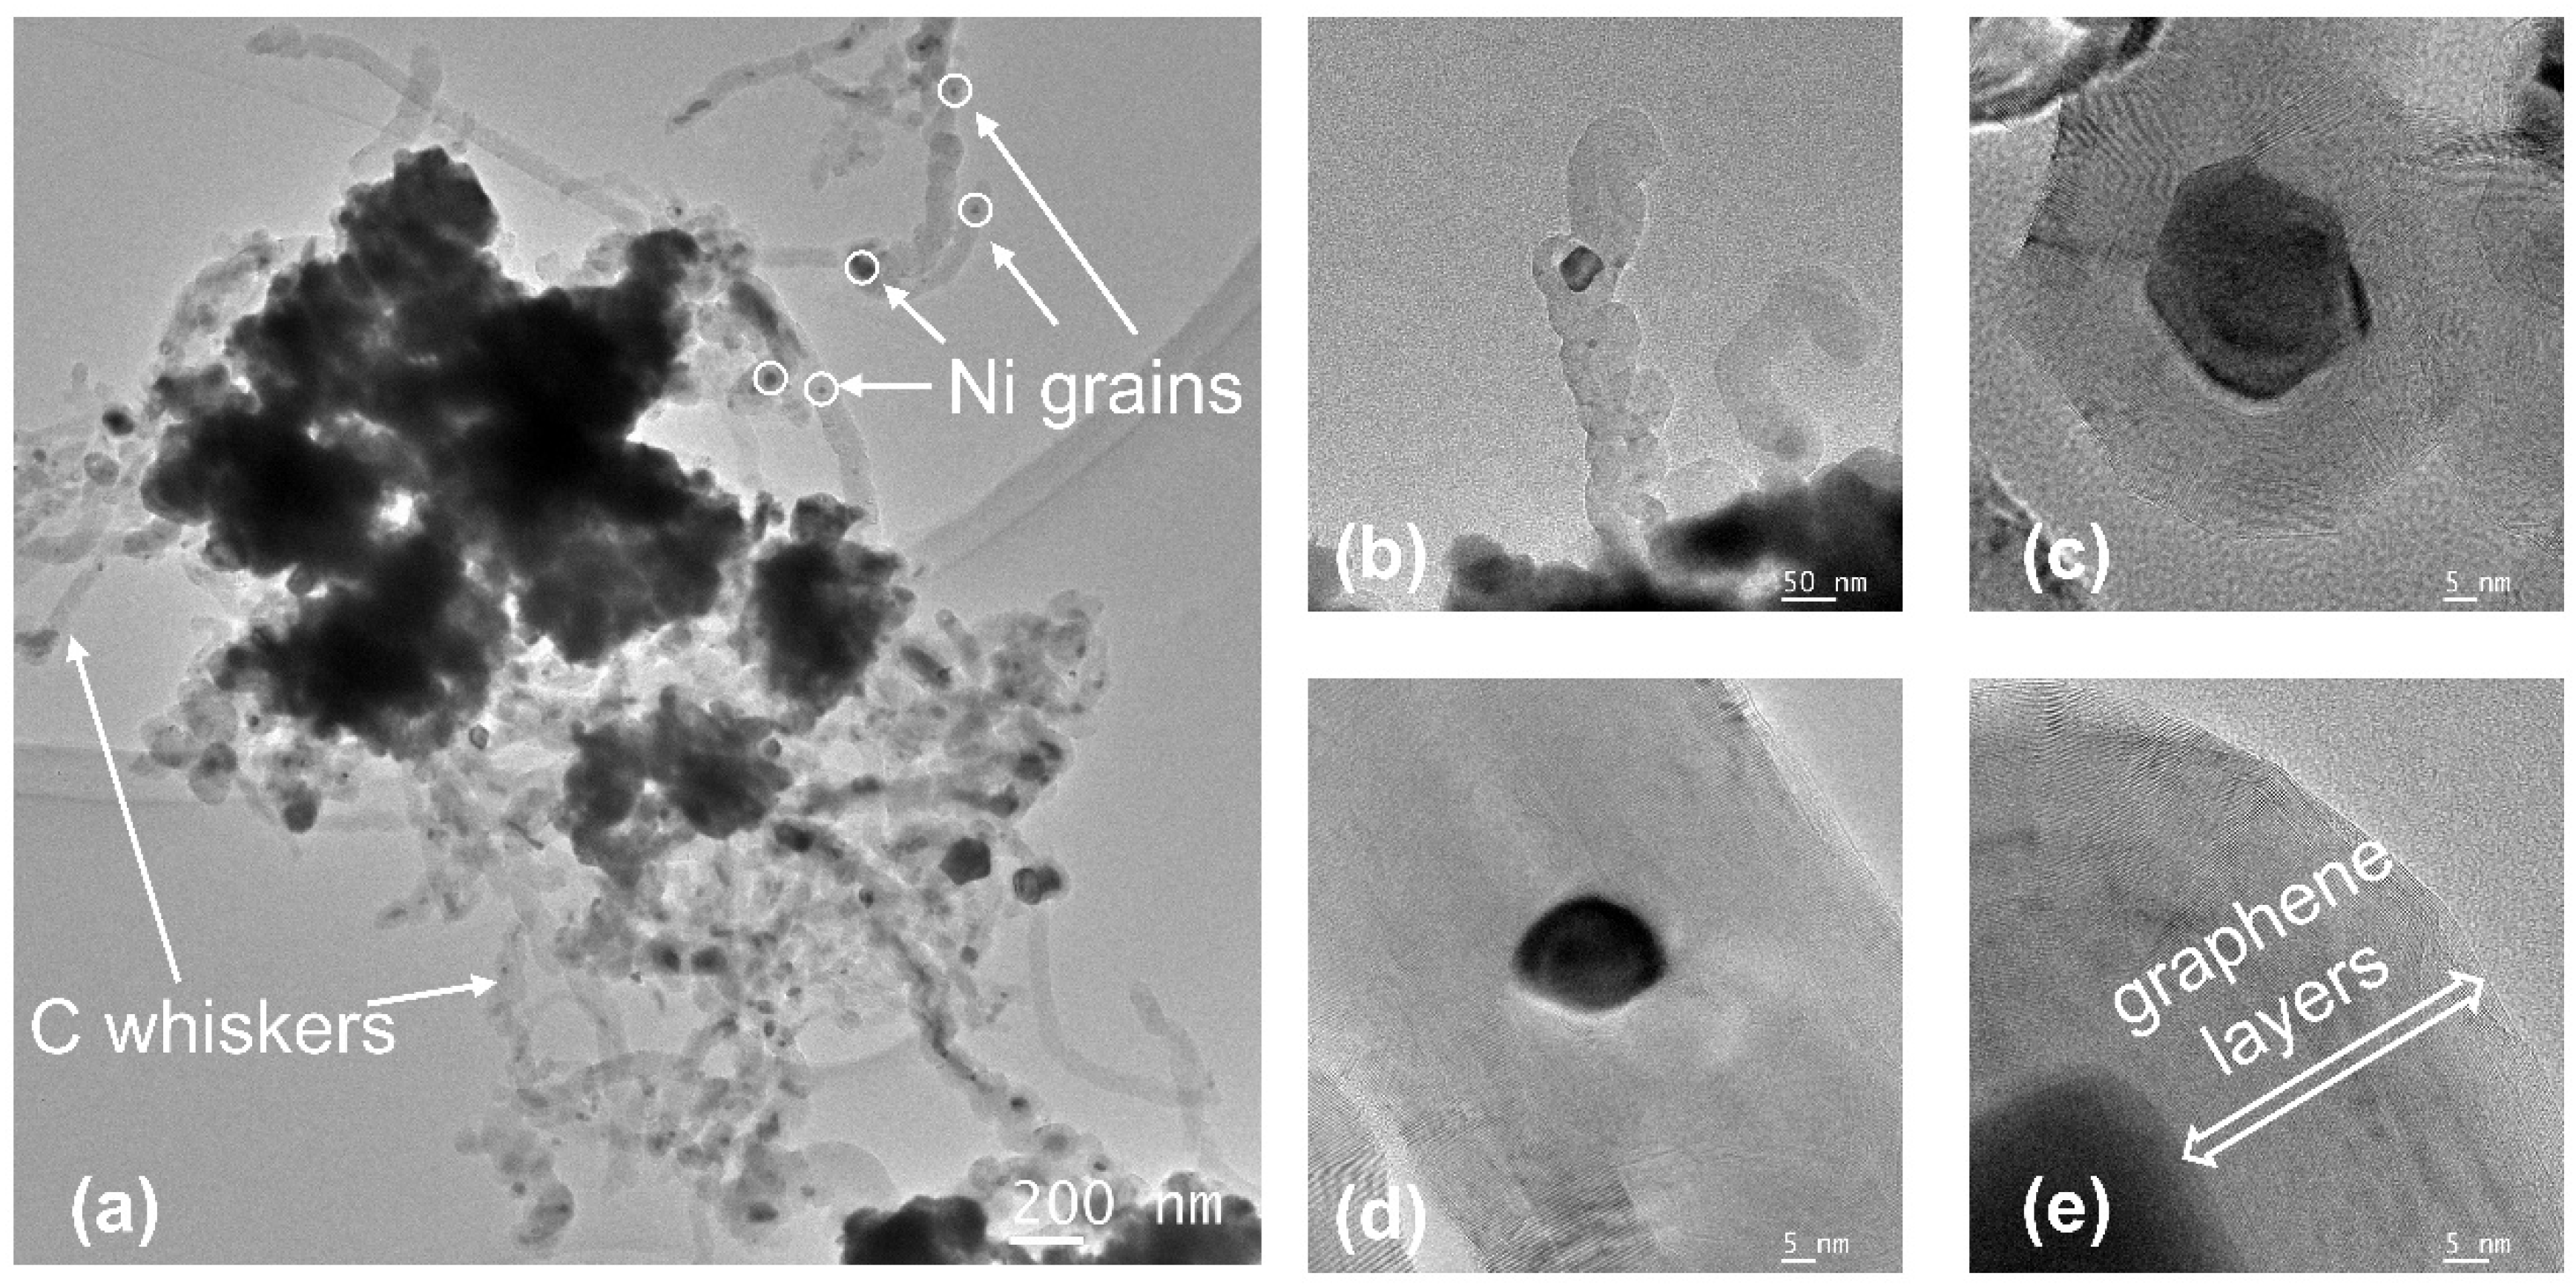
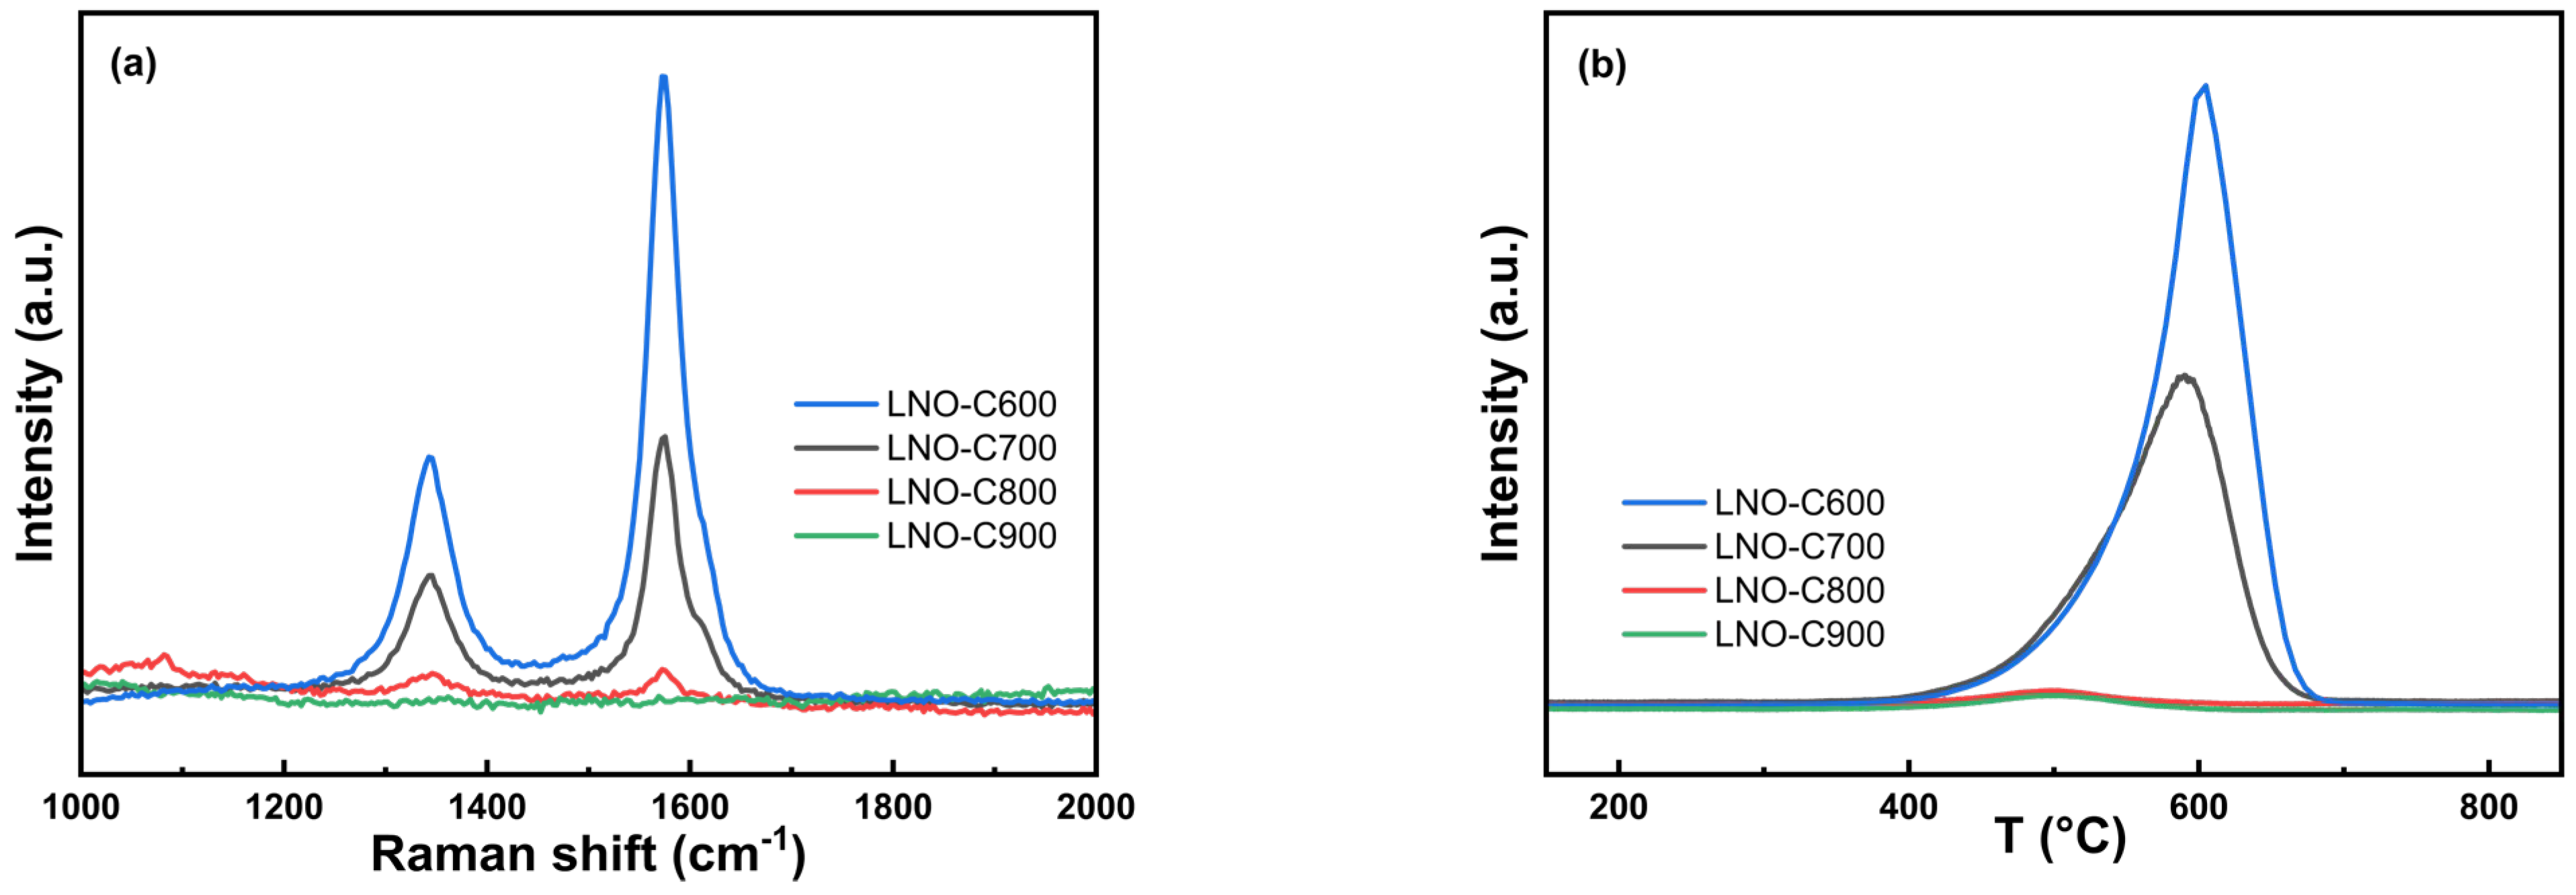
3.6.2. Resistance to Carbon Deposition

With S/C equal to 1, the catalyst (60–80 mesh) was used to carry out the SRM reaction for 4 h at 850 °C and 60 L·gcat−1·h−1. The study of the nature and amount of the carbonaceous deposition formed in reforming process was conducted with the approaches including the TEM, Raman, and temperature-programmed oxidation (TPO) experiments.
TEM was used to reveal the morphology of the carbonaceous deposition forming at S/C = 1, as shown in Figure 15. Fibrous carbon deposition was formed [84,85], and a large number of Ni particles were lifted from the support, isolated from the main catalyst system. The filamentous carbon material appeared as a layered graphene structure on either side or around the nickel particles13.
Raman spectra were used to elucidate the quality of the carbon deposition, where ID/IG ratios (standing for the Raman intensities of D-band and G-band peaks) could show amorphous degrees of carbon materials. Figure 16a reveals that the D peak and G peak signals appeared for each catalyst after the reaction [86,87], and the amorphous degree of graphite-carbon was about 0.4. The carbon deposition of LNO-C600 was the most serious, followed by LNO-C700, and the other two samples almost had some carbon deposition. A similar tendency was also obtained in the TPO experiment (in Figure 16b) [88,89,90]. LNO-C600 had the strongest CO2 evolution signal, at about 610 °C, compared with a weaker signal from LNO-C700 at about 580 °C. However, LNO-C800 and LNO-C900 had very weak evolution peaks at about 500 °C. Quantitative carbon deposition can be obtained by integrating CO2 signal curves, and the results are summarized in Table 3.
The Raman and TPO experiments demonstrate that the carbon deposition resistance of catalysts is improved with the increase in the calcination temperature of dry gel to prepare LaNiO3, and the carbon deposition is very low in terms of the calcination temperature of 800 °C and above. The stability of the catalyst depends on the size of the metal particle, the nature of support dispersing metal particles, and the interaction between the metal phase and the support [91]. According to the above studies, the higher calcination temperature can result in both smaller Ni grains and stronger interactions between Ni and La2O3. The latter brings more reactive oxygen species to Ni grains that are conducive to the elimination of carbon deposition [92,93]; there is therefore a positive correlation between calcination temperature and resistance to carbon deposition [81].

4. Conclusions

The LaNiO3 precursor was prepared using the Pechini method and reduced before the SRM reaction to form a supported Ni/La2O3 catalyst. The effect of the calcination temperature of LaNiO3 on the structural properties and catalytic performance of samples for the SRM reaction was analyzed. Firstly, the formation of LaNiO3 on the calcination of the gel precursor in air was investigated with STA-IR-MS and in situ XRD, providing the information which elaborates thermal events at different temperatures, the existence of a La2O3CO3 intermediate appearing about at 450 °C, and the initial crystallization temperature of LaNiO3 at about 550 °C. Moreover, then, the effect of calcination temperature on the catalyst properties was studied using XRD, BET, and TPR characterizations. It can be known that with the increase in calcination temperature, the LaNiO3 crystal phase tends to be more perfect, and the occurrence of the sintering phenomenon could cause a larger LaNiO3 particle size and a smaller specific surface area. The increasing reduction difficulty results in smaller Ni0 grains and a stronger interaction between the support and the metal active component. At the same reaction temperature, the methane conversion increases with increasing calcination temperature before 800 °C, while LNO-C900 shows a certain loss of activity compared with LNO-C800. There is also an optimal value of 1.5 for S/C. Excessive steam will also cause a significant decline in activity. The oxidation of the Ni component was also demonstrated using XRD characterization of spend catalysts when S/C was more than 2. TPO and Raman spectra also show that carbon deposition resistance of the catalysts can be enhanced with the increase in calcination temperature.

Author Contributions

Y.W.: investigation, methodology, conceptualization, writing—review and editing, and visualization. S.Q.: methodology and experiment. Y.C. (Yuxin Chen): methodology, experiment, and visualization. B.Y.: methodology and experiment. Y.C. (Yi Cheng): conceptualization, supervision, writing—reviewing and editing, and funding acquisition. All authors have read and agreed to the published version of the manuscript.

Funding

This research was funded by the National Natural Science Foundation of China (No. 22008137 and No. 22278235).

Conflicts of Interest

The authors declare that they have no known competing financial interests or personal relationships that could have appeared to influence the work reported in this paper.

References

  1. Sehested, J. Four challenges for nickel steam-reforming catalysts. Catal. Today 2006, 111, 103–110. [Google Scholar] [CrossRef]
  2. Meloni, E.; Martino, M.; Palma, V. A Short Review on Ni Based Catalysts and Related Engineering Issues for Methane Steam Reforming. Catalysts 2020, 10, 352. [Google Scholar] [CrossRef]
  3. Pashchenko, D.; Makarov, I. Carbon deposition in steam methane reforming over a Ni-based catalyst: Experimental and thermodynamic analysis. Energy 2021, 222, 119993. [Google Scholar] [CrossRef]
  4. Garba, Z.N.; Zhou, W.; Zhang, M.; Yuan, Z. A review on the preparation, characterization and potential application of perovskites as adsorbents for wastewater treatment. Chemosphere 2020, 244, 125474. [Google Scholar] [CrossRef] [PubMed]
  5. Fierro, J.L.G. Hydrogenation of Carbon Oxides over Perovskite-Type Oxides. Catal. Rev. 1992, 34, 321–336. [Google Scholar] [CrossRef]
  6. Singh, U.G.; Li, J.; Bennett, J.W.; Rappe, A.M.; Seshadri, R.; Scott, S.L. A Pd-doped perovskite catalyst, BaCe1−xPdxO3−δ, for CO oxidation. J. Catal. 2007, 249, 349–358. [Google Scholar] [CrossRef]
  7. Seiyama, T. Total Oxidation of Hydrocarbons on Perovskite Oxides. Catal. Rev. 1992, 34, 281–300. [Google Scholar] [CrossRef]
  8. Zhang, R.; Alamdari, H.; Kaliaguine, S. SO2 poisoning of LaFe0.8Cu0.2O3 perovskite prepared by reactive grinding during NO reduction by C3H6. Appl. Catal. A Gen. 2008, 340, 140–151. [Google Scholar] [CrossRef]
  9. Zhu, J.; Thomas, A. Perovskite-type mixed oxides as catalytic material for NO removal. Appl. Catal. B Environ. 2009, 92, 225–233. [Google Scholar] [CrossRef]
  10. Zhu, J.; Li, H.; Zhong, L.; Xiao, P.; Xu, X.; Yang, X.; Zhao, Z.; Li, J. Perovskite Oxides: Preparation, Characterizations, and Applications in Heterogeneous Catalysis. ACS Catal. 2014, 4, 2917–2940. [Google Scholar] [CrossRef]
  11. Shao, Z.; Zhou, W.; Zhu, Z. Advanced synthesis of materials for intermediate-temperature solid oxide fuel cells. Prog. Mater. Sci. 2012, 57, 804–874. [Google Scholar] [CrossRef]
  12. Royer, S.; Duprez, D.; Can, F.; Courtois, X.; Batiot-Dupeyrat, C.; Laassiri, S.; Alamdari, H. Perovskites as Substitutes of Noble Metals for Heterogeneous Catalysis: Dream or Reality. Chem. Rev. 2014, 114, 10292–10368. [Google Scholar] [CrossRef]
  13. Maneerung, T.; Hidajat, K.; Kawi, S. LaNiO3 perovskite catalyst precursor for rapid decomposition of methane: Influence of temperature and presence of H2 in feed stream. Catal. Today 2011, 171, 24–35. [Google Scholar] [CrossRef]
  14. Batiot-Dupeyrat, C.; Valderrama, G.; Meneses, A.; Martinez, F.; Barrault, J.; Tatibouët, J.M. Pulse study of CO2 reforming of methane over LaNiO3. Appl. Catal. A Gen. 2003, 248, 143–151. [Google Scholar] [CrossRef]
  15. Choi, S.O.; Moon, S.H. Performance of La1−xCexFe0.7Ni0.3O3 perovskite catalysts for methane steam reforming. Catal. Today 2009, 146, 148–153. [Google Scholar] [CrossRef]
  16. Valderrama, G.; Kiennemann, A.; Goldwasser, M.R. La-Sr-Ni-Co-O based perovskite-type solid solutions as catalyst precursors in the CO2 reforming of methane. J. Power Sources 2010, 195, 1765–1771. [Google Scholar] [CrossRef]
  17. Villoria, J.-A.; Mota, N.; Al-Sayari, S.; Álvarez-Galván, M.-C. Perovskites as catalysts in the reforming of hydrocarbons: A review. Micro Nanosyst. 2012, 4, 231–252. [Google Scholar] [CrossRef]
  18. Yang, Q.; Liu, G.; Liu, Y. Perovskite-Type Oxides as the Catalyst Precursors for Preparing Supported Metallic Nanocatalysts: A Review. Ind. Eng. Chem. Res. 2018, 57, 1–17. [Google Scholar] [CrossRef]
  19. Bian, Z.; Wang, Z.; Jiang, B.; Hongmanorom, P.; Zhong, W.; Kawi, S. A review on perovskite catalysts for reforming of methane to hydrogen production. Renew. Sustain. Energy Rev. 2020, 134, 110291. [Google Scholar] [CrossRef]
  20. Bhattar, S.; Abedin, M.A.; Kanitkar, S.; Spivey, J.J. A review on dry reforming of methane over perovskite derived catalysts. Catal. Today 2021, 365, 2–23. [Google Scholar] [CrossRef]
  21. Pena, M.; Fierro, J. Chemical structures and performance of perovskite oxides. Chem. Rev. 2001, 101, 1981–2018. [Google Scholar] [CrossRef] [PubMed]
  22. Arandiyan, H.; Li, J.; Ma, L.; Hashemnejad, S.M.; Mirzaei, M.Z.; Chen, J.; Chang, H.; Liu, C.; Wang, C.; Chen, L. Methane reforming to syngas over LaNixFe1−xO3 (0 ≤ x ≤ 1) mixed-oxide perovskites in the presence of CO2 and O2. J. Ind. Eng. Chem. 2012, 18, 2103–2114. [Google Scholar] [CrossRef]
  23. Jahangiri, A.; Aghabozorg, H.; Pahlavanzadeh, H. Effects of Fe substitutions by Ni in La–Ni–O perovskite-type oxides in reforming of methane with CO2 and O2. Int. J. Hydrog. Energy 2013, 38, 10407–10416. [Google Scholar] [CrossRef]
  24. Yang, E.-h.; Noh, Y.-s.; Ramesh, S.; Lim, S.S.; Moon, D.J. The effect of promoters in La0.9M0.1Ni0.5Fe0.5O3 (M = Sr, Ca) perovskite catalysts on dry reforming of methane. Fuel Process. Technol. 2015, 134, 404–413. [Google Scholar] [CrossRef]
  25. Tsoukalou, A.; Imtiaz, Q.; Kim, S.M.; Abdala, P.M.; Yoon, S.; Müller, C.R. Dry-reforming of methane over bimetallic Ni–M/La2O3 (M = Co, Fe): The effect of the rate of La2O2CO3 formation and phase stability on the catalytic activity and stability. J. Catal. 2016, 343, 208–214. [Google Scholar] [CrossRef]
  26. Wang, M.; Zhao, T.; Dong, X.; Li, M.; Wang, H. Effects of Ce substitution at the A-site of LaNi0.5Fe0.5O3 perovskite on the enhanced catalytic activity for dry reforming of methane. Appl. Catal. B Environ. 2018, 224, 214–221. [Google Scholar] [CrossRef]
  27. Komarala, E.P.; Komissarov, I.; Rosen, B.A. Effect of Fe and Mn Substitution in LaNiO3 on Exsolution, Activity, and Stability for Methane Dry Reforming. Catalysts 2019, 10, 27. [Google Scholar] [CrossRef]
  28. Wang, Z.; Wang, C.; Chen, S.; Liu, Y. Co–Ni bimetal catalyst supported on perovskite-type oxide for steam reforming of ethanol to produce hydrogen. Int. J. Hydrog. Energy 2014, 39, 5644–5652. [Google Scholar] [CrossRef]
  29. Liu, F.; Qu, Y.; Yue, Y.; Liu, G.; Liu, Y. Nano bimetallic alloy of Ni–Co obtained from LaCoxNi1− xO 3 and its catalytic performance for steam reforming of ethanol. RSC Adv. 2015, 5, 16837–16846. [Google Scholar] [CrossRef]
  30. Zhao, L.; Han, T.; Wang, H.; Zhang, L.; Liu, Y. Ni-Co alloy catalyst from LaNi1−xCoxO3 perovskite supported on zirconia for steam reforming of ethanol. Appl. Catal. B Environ. 2016, 187, 19–29. [Google Scholar] [CrossRef]
  31. Kim, W.Y.; Jang, J.S.; Ra, E.C.; Kim, K.Y.; Kim, E.H.; Lee, J.S. Reduced perovskite LaNiO3 catalysts modified with Co and Mn for low coke formation in dry reforming of methane. Appl. Catal. A Gen. 2019, 575, 198–203. [Google Scholar] [CrossRef]
  32. Kwon, O.; Huang, R.; Cao, T.; Vohs, J.M.; Gorte, R.J. Dry reforming of methane over Ni supported on LaMnO3 thin films. Catal. Today 2021, 382, 142–147. [Google Scholar] [CrossRef]
  33. Kwon, O.; Foucher, A.C.; Huang, R.; Stach, E.A.; Vohs, J.M.; Gorte, R.J. Evidence for redispersion of Ni on LaMnO3 films following high-temperature oxidation. J. Catal. 2022, 407, 213–220. [Google Scholar] [CrossRef]
  34. Nishihata, Y.; Mizuki, J.; Akao, T.; Tanaka, H.; Uenishi, M.; Kimura, M.; Okamoto, T.; Hamada, N. Self-regeneration of a Pd-perovskite catalyst for automotive emissions control. Nature 2002, 418, 164–167. [Google Scholar] [CrossRef]
  35. Neagu, D.; Oh, T.-S.; Miller, D.N.; Ménard, H.; Bukhari, S.M.; Gamble, S.R.; Gorte, R.J.; Vohs, J.M.; Irvine, J.T.S. Nano-socketed nickel particles with enhanced coking resistance grown in situ by redox exsolution. Nat. Commun. 2015, 6, 8120. [Google Scholar] [CrossRef]
  36. Lin, C.; Foucher, A.C.; Stach, E.A.; Gorte, R.J. A Thermodynamic Investigation of Ni on Thin-Film Titanates (ATiO3). Inorganics 2020, 8, 69. [Google Scholar] [CrossRef]
  37. Mao, X.; Foucher, A.C.; Stach, E.A.; Gorte, R.J. Changes in Ni-NiO equilibrium due to LaFeO3 and the effect on dry reforming of CH4. J. Catal. 2020, 381, 561–569. [Google Scholar] [CrossRef]
  38. Pereñiguez, R.; Gonzalez-delaCruz, V.M.; Caballero, A.; Holgado, J.P. LaNiO3 as a precursor of Ni/La2O3 for CO2 reforming of CH4: Effect of the presence of an amorphous NiO phase. Appl. Catal. B Environ. 2012, 123–124, 324–332. [Google Scholar]
  39. Rida, K.; Peña, M.A.; Sastre, E.; Martinez-Arias, A. Effect of calcination temperature on structural properties and catalytic activity in oxidation reactions of LaNiO3 perovskite prepared by Pechini method. J. Rare Earths 2012, 30, 210–216. [Google Scholar] [CrossRef]
  40. Haynes, D.J.; Shekhawat, D.; Berry, D.A.; Zondlo, J.; Roy, A.; Spivey, J.J. Characterization of calcination temperature on a Ni-substituted lanthanum-strontium-zirconate pyrochlore. Ceram. Int. 2017, 43, 16744–16752. [Google Scholar] [CrossRef]
  41. Liu, L.; Zhang, Z.; Das, S.; Xi, S.; Kawi, S. LaNiO3 as a precursor of Ni/La2O3 for reverse water-gas shift in DBD plasma: Effect of calcination temperature. Energy Convers. Manag. 2020, 206, 112475. [Google Scholar] [CrossRef]
  42. González-Varela, D.; Araiza, D.G.; Díaz, G.; Pfeiffer, H. LaNiO3 Perovskite Synthesis through the EDTA–Citrate Complexing Method and Its Application to CO Oxidation. Catalysts 2022, 12, 57. [Google Scholar] [CrossRef]
  43. Pechini, M. Method of Preparing Lead and Alkaline Earth Titanates and Niobates and Coating Method Using the Same to Form a Capacitor. US Patent No. 3330697A, 11 July 1967. [Google Scholar]
  44. Djani, F.; Omari, M.; Martínez-Arias, A. Synthesis, characterization and catalytic properties of La(Ni,Fe)O3–NiO nanocomposites. J. Sol.-Gel Sci. Technol. 2015, 78, 1–10. [Google Scholar] [CrossRef]
  45. Devi, P.S.; Rao, M.S. Study of the thermal decomposition of lanthanum and chromium citrate hydrates. J. Anal. Appl. Pyrolysis 1992, 22, 187–195. [Google Scholar] [CrossRef]
  46. Wang, H.; Zhu, Y.; Liu, P.; Yao, W. Preparation of nanosized perovskite LaNiO3 powder via amorphous heteronuclear complex precursor. J. Mater. Sci. 2003, 38, 1939–1943. [Google Scholar] [CrossRef]
  47. Fernandes, J.D.G.; Melo, D.M.A.; Zinner, L.B.; Salustiano, C.M.; Silva, Z.R.; Martinelli, A.E.; Cerqueira, M.; Alves Júnior, C.; Longo, E.; Bernardi, M.I.B. Low-temperature synthesis of single-phase crystalline LaNiO3 perovskite via Pechini method. Mater. Lett. 2002, 53, 122–125. [Google Scholar] [CrossRef]
  48. Fjellvåg, H.; Hansteen, O.H.; Tilset, B.G.; Olafsen, A.; Sakai, N.; Seim, H. Thermal analysis as an aid in the synthesis of non-stoichiometric perovskite type oxides. Thermochim. Acta 1995, 256, 75–89. [Google Scholar] [CrossRef]
  49. Dreyer, M.; Krebs, M.; Najafishirtari, S.; Rabe, A.; Friedel Ortega, K.; Behrens, M. The Effect of Co Incorporation on the CO Oxidation Activity of LaFe1−xCoxO3 Perovskites. Catalysts 2021, 11, 550. [Google Scholar] [CrossRef]
  50. Wang, Y.; Zhu, J.; Yang, X.; Lu, L.; Wang, X. Preparation and characterization of LaNiO3 nanocrystals. Mater. Res. Bull. 2006, 41, 1565–1570. [Google Scholar] [CrossRef]
  51. Le, N.T.H.; Calderón-Moreno, J.M.; Popa, M.; Crespo, D.; Van Hong, L.; Phuc, N.X. LaNiO3 nanopowder prepared by an ‘amorphous citrate’ route. J. Eur. Ceram. Soc. 2006, 26, 403–407. [Google Scholar] [CrossRef]
  52. Valderrama, G.; Goldwasser, M.R.; Navarro, C.U.D.; Tatibouët, J.M.; Barrault, J.; Batiot-Dupeyrat, C.; Martínez, F. Dry reforming of methane over Ni perovskite type oxides. Catal. Today 2005, 107–108, 785–791. [Google Scholar]
  53. Santos, D.B.L.; Noronha, F.B.; Hori, C.E. Bi-reforming of methane for hydrogen production using LaNiO3/CexZr1-xO2 as precursor material. Int. J. Hydrog. Energy 2020, 45, 13947–13959. [Google Scholar] [CrossRef]
  54. Ramon, A.P.; Li, X.; Clark, A.H.; Safonova, O.V.; Marcos, F.C.; Assaf, E.M.; van Bokhoven, J.A.; Artiglia, L.; Assaf, J.M. In situ study of low-temperature dry reforming of methane over La2Ce2O7 and LaNiO3 mixed oxides. Appl. Catal. B Environ. 2022, 315, 121528. [Google Scholar] [CrossRef]
  55. Ruckenstein, E.; Hu, Y. Interactions between Ni and La2O3 in Ni/La2O3 Catalysts Prepared Using Different Ni Precursors. J. Catal. 1996, 161, 55–61. [Google Scholar] [CrossRef]
  56. Cesteros, Y.; Salagre, P.; Medina, F.; Sueiras, J.E. Preparation and Characterization of Several High-Area NiAl2O4 Spinels. Study of Their Reducibility. Chem. Mater. 2000, 12, 331–335. [Google Scholar] [CrossRef]
  57. Courson, C.; Udron, L.; Świerczyński, D.; Petit, C.; Kiennemann, A. Hydrogen production from biomass gasification on nickel catalysts: Tests for dry reforming of methane. Catal. Today 2002, 76, 75–86. [Google Scholar] [CrossRef]
  58. Han, B.; Zhao, L.; Wang, F.; Xu, L.; Yu, H.; Cui, Y.; Zhang, J.; Shi, W. Effect of Calcination Temperature on the Performance of the Ni@SiO2 Catalyst in Methane Dry Reforming. Ind. Eng. Chem. Res. 2020, 59, 13370–13379. [Google Scholar] [CrossRef]
  59. Vella, L.D.; Villoria, J.A.; Specchia, S.; Mota, N.; Fierro, J.L.G.; Specchia, V. Catalytic partial oxidation of CH4 with nickel–lanthanum-based catalysts. Catal. Today 2011, 171, 84–96. [Google Scholar] [CrossRef]
  60. Kuras, M.; Roucou, R.; Petit, C. Studies of LaNiO3 used as a precursor for catalytic carbon nanotubes growth. J. Mol. Catal. A Chem. 2007, 265, 209–217. [Google Scholar] [CrossRef]
  61. Rabelo-Neto, R.C.; Sales, H.B.E.; Inocêncio, C.V.M.; Varga, E.; Oszko, A.; Erdohelyi, A.; Noronha, F.B.; Mattos, L.V. CO2 reforming of methane over supported LaNiO3 perovskite-type oxides. Appl. Catal. B Environ. 2018, 221, 349–361. [Google Scholar] [CrossRef]
  62. Santos, M.d.S.; Neto, R.C.R.; Noronha, F.B.; Bargiela, P.; Rocha, M.d.G.C.d.; Resini, C.; Carbó-Argibay, E.; Fréty, R.; Brandão, S.T. Perovskite as catalyst precursors in the partial oxidation of methane: The effect of cobalt, nickel and pretreatment. Catal. Today 2018, 299, 229–241. [Google Scholar] [CrossRef]
  63. Kuras, M.; Zimmermann, Y.; Petit, C. Reactivity of perovskite-type precursor in MWCNTs synthesis. Catal. Today 2008, 138, 55–61. [Google Scholar] [CrossRef]
  64. Da Silva, A.A.A.; da Costa, L.O.O.; Mattos, L.V.; Noronha, F.B. The study of the performance of Ni-based catalysts obtained from LaNiO3 perovskite-type oxides synthesized by the combustion method for the production of hydrogen by reforming of ethanol. Catal. Today 2013, 213, 25–32. [Google Scholar] [CrossRef]
  65. Batiot-Dupeyrat, C.; Gallego, G.A.S.; Mondragon, F.; Barrault, J.; Tatibouët, J.-M. CO2 reforming of methane over LaNiO3 as precursor material. Catal. Today 2005, 107–108, 474–480. [Google Scholar] [CrossRef]
  66. Sierra Gallego, G.; Batiot-Dupeyrat, C.; Barrault, J.; Mondragón, F. Dual Active-Site Mechanism for Dry Methane Reforming over Ni/La2O3 Produced from LaNiO3 Perovskite. Ind. Eng. Chem. Res. 2008, 47, 9272–9278. [Google Scholar] [CrossRef]
  67. He, L.; Ren, Y.; Yue, B.; Tsang, S.C.E.; He, H. Tuning Metal–Support Interactions on Ni/Al2O3 Catalysts to Improve Catalytic Activity and Stability for Dry Reforming of Methane. Processes 2021, 9, 706. [Google Scholar] [CrossRef]
  68. Wang, Y.-H.; Liu, H.-M.; Xu, B.-Q. Durable Ni/MgO catalysts for CO2 reforming of methane: Activity and metal–support interaction. J. Mol. Catal. A Chem. 2009, 299, 44–52. [Google Scholar] [CrossRef]
  69. Gallego, G.S.; Mondragón, F.; Barrault, J.; Tatibouët, J.-M.; Batiot-Dupeyrat, C. CO2 reforming of CH4 over La–Ni based perovskite precursors. Appl. Catal. A Gen. 2006, 311, 164–171. [Google Scholar] [CrossRef]
  70. Mosayebi, A.; Nasabi, M. Steam methane reforming on LaNiO3 perovskite-type oxide for syngas production, activity tests, and kinetic modeling. Int. J. Energy Res. 2020, 44, 5500–5515. [Google Scholar] [CrossRef]
  71. Lutz, A.E.; Bradshaw, R.W.; Keller, J.O.; Witmer, D.E. Thermodynamic analysis of hydrogen production by steam reforming. Int. J. Hydrog. Energy 2003, 28, 159–167. [Google Scholar] [CrossRef]
  72. Carapellucci, R.; Giordano, L. Steam, dry and autothermal methane reforming for hydrogen production: A thermodynamic equilibrium analysis. J. Power Sources 2020, 469, 228391. [Google Scholar] [CrossRef]
  73. Rostrup-Nielsen, J.R.; Sehested, J.; Nørskov, J.K. Hydrogen and Synthesis Gas by Steam and CO2 Reforming. In Advances in Catalysis; Academic Press: Cambridge, MA, USA, 2002; Volume 47, pp. 65–139. [Google Scholar]
  74. Rostrup-Nielsen, J.; Nørskov, J.K. Step sites in syngas catalysis. Top. Catal. 2006, 40, 45–48. [Google Scholar] [CrossRef]
  75. Wei, J.; Iglesia, E. Structural requirements and reaction pathways in methane activation and chemical conversion catalyzed by rhodium. J. Catal. 2004, 225, 116–127. [Google Scholar] [CrossRef]
  76. Hoang, D.L.; Chan, S.H.; Ding, O.L. Kinetic and modelling study of methane steam reforming over sulfide nickel catalyst on a gamma alumina support. Chem. Eng. J. 2005, 112, 1–11. [Google Scholar] [CrossRef]
  77. Hou, K.; Hughes, R. The kinetics of methane steam reforming over a Ni/α-Al2O catalyst. Chem. Eng. J. 2001, 82, 311–328. [Google Scholar] [CrossRef]
  78. Rostrup-Nielsen, J.R. Production of synthesis gas. Catal. Today 1993, 18, 305–324. [Google Scholar] [CrossRef]
  79. Aparicio, L.M. Transient Isotopic Studies and Microkinetic Modeling of Methane Reforming over Nickel Catalysts. J. Catal. 1997, 165, 262–274. [Google Scholar] [CrossRef]
  80. Mickevičius, S.; Grebinskij, S.; Bondarenka, V.; Vengalis, B.; Šliužienė, K.; Orlowski, B.A.; Osinniy, V.; Drube, W. Investigation of epitaxial LaNiO3−x thin films by high-energy XPS. J. Alloys Compd. 2006, 423, 107–111. [Google Scholar] [CrossRef]
  81. Serrano-Lotina, A.; Rodríguez, L.; Muñoz, G.; Martin, A.J.; Folgado, M.A.; Daza, L. Biogas reforming over La-NiMgAl catalysts derived from hydrotalcite-like structure: Influence of calcination temperature. Catal. Commun. 2011, 12, 961–967. [Google Scholar] [CrossRef]
  82. Abbas, S.Z.; Dupont, V.; Mahmud, T. Kinetics study and modelling of steam methane reforming process over a NiO/Al2O3 catalyst in an adiabatic packed bed reactor. Int. J. Hydrog. Energy 2017, 42, 2889–2903. [Google Scholar] [CrossRef]
  83. Imran, U.; Ahmad, A.; Othman, M. Kinetic Based Simulation of Methane Steam Reforming and Water Gas Shift for Hydrogen Production Using Aspen Plus. Chem. Eng. Trans. 2017, 56, 1681. [Google Scholar]
  84. Helveg, S.; López-Cartes, C.; Sehested, J.; Hansen, P.L.; Clausen, B.S.; Rostrup-Nielsen, J.R.; Abild-Pedersen, F.; Nørskov, J.K. Atomic-scale imaging of carbon nanofibre growth. Nature 2004, 427, 426–429. [Google Scholar] [CrossRef]
  85. Sierra Gallego, G.; Mondragón, F.; Tatibouët, J.-M.; Barrault, J.; Batiot-Dupeyrat, C. Carbon dioxide reforming of methane over La2NiO4 as catalyst precursor—Characterization of carbon deposition. Catal. Today 2008, 133–135, 200–209. [Google Scholar] [CrossRef]
  86. Hufschmidt, D.; Bobadilla, L.F.; Romero-Sarria, F.; Centeno, M.A.; Odriozola, J.A.; Montes, M.; Falabella, E. Supported nickel catalysts with a controlled molecular architecture for the catalytic reformation of methane. Catal. Today 2010, 149, 394–400. [Google Scholar] [CrossRef]
  87. Abasaeed, A.; Kasim, S.; Khan, W.; Sofiu, M.; Ibrahim, A.; Fakeeha, A.; Al-Fatesh, A. Hydrogen Yield from CO2 Reforming of Methane: Impact of La2O3 Doping on Supported Ni Catalysts. Energies 2021, 14, 2412. [Google Scholar] [CrossRef]
  88. Liu, B.S.; Au, C.T. Carbon deposition and catalyst stability over La2NiO4/γ-Al2O3 during CO2 reforming of methane to syngas. Appl. Catal. A Gen. 2003, 244, 181–195. [Google Scholar] [CrossRef]
  89. Habibi, N.; Rezaei, M.; Majidian, N.; Andache, M. CH4 reforming with CO2 for syngas production over La2O3 promoted Ni catalysts supported on mesoporous nanostructured lambda-Al2O3. J. Energy Chem. 2014, 23, 435–442. [Google Scholar] [CrossRef]
  90. Bicki, R.; Antoniak-Jurak, K.; Michalska, K.; Franczyk, E.; Konkol, M.; Kowalik, P.; Panczyk, M.; Ryczkowski, J.; Slowik, G.; Borowiecki, T. The effect of La2O3 and CeO2 modifiers on properties of Ni-Al catalysts for LNG prereforming. Int. J. Hydrog. Energy 2021, 46, 11664–11676. [Google Scholar] [CrossRef]
  91. Tuza, P.V.; Souza, M.M.V.M. Steam Reforming of Methane Over Catalyst Derived from Ordered Double Perovskite: Effect of Crystalline Phase Transformation. Catal. Lett. 2015, 146, 47–53. [Google Scholar] [CrossRef]
  92. Provendier, H.; Petit, C.; Roger, A.C.; Kiennemann, A. Influence of the Precursors on the Formation of a Trimetallic Defined Structure. Application on Ni Catalysts Used for Syngas Obtention. Stud. Surf. Sci. Catal. 1998, 118, 285–294. [Google Scholar]
  93. De Lima, S.M.; da Silva, A.M.; da Costa, L.O.O.; Assaf, J.M.; Jacobs, G.; Davis, B.H.; Mattos, L.V.; Noronha, F.B. Evaluation of the performance of Ni/La2O3 catalyst prepared from LaNiO3 perovskite-type oxides for the production of hydrogen through steam reforming and oxidative steam reforming of ethanol. Appl. Catal. A Gen. 2010, 377, 181–190. [Google Scholar] [CrossRef]
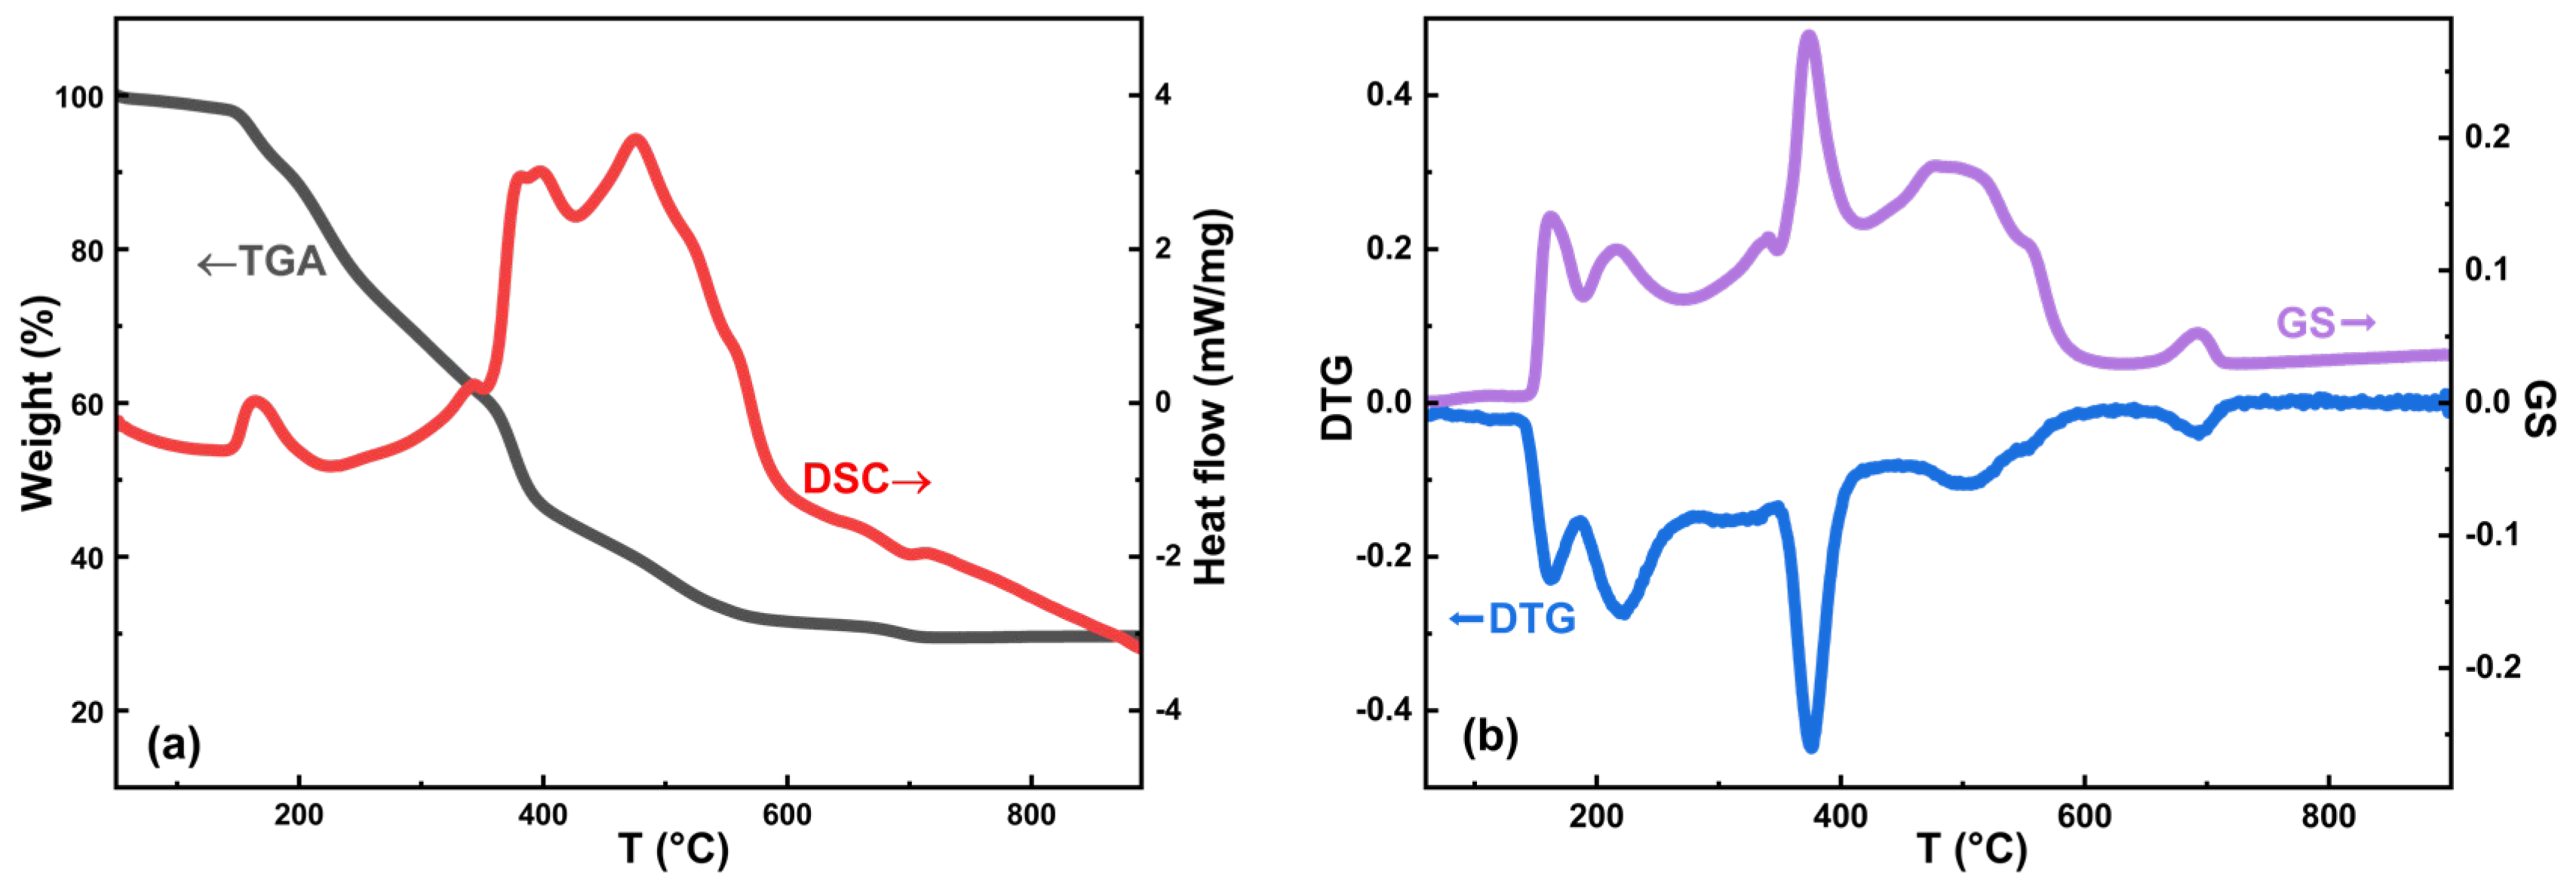
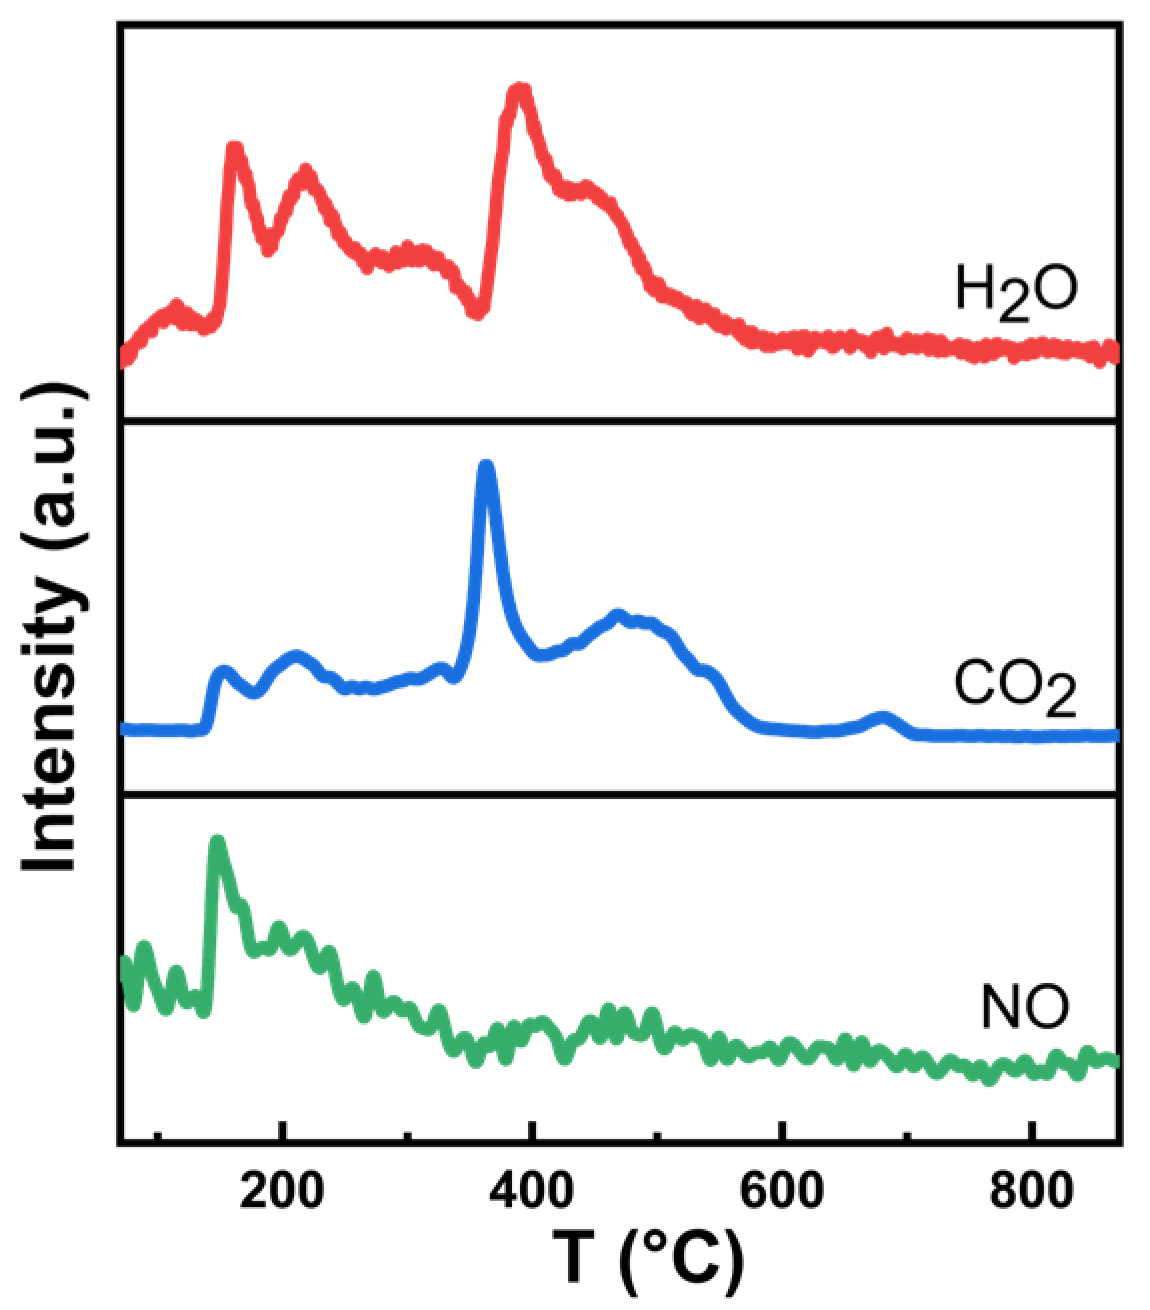
Figure 1. Simultaneous thermal analysis of gel precursor during heating in air: (a) TGA-DSC curve (endo down); (b) DTG-GS curve.
Catalysts 13 00356 g001
Figure 2. Evolution concentration of gas products with temperature during heating in air.
Catalysts 13 00356 g002
Figure 3. In situ XRD patterns of gel precursor during heating in air: diffractograms taken from 300 to 600 °C from bottom to top (♦-LaNiO3; ○-NiO; ☆-La2O2CO3).
Catalysts 13 00356 g003
Figure 4. XRD patterns of LaNiO3 samples calcined at different temperatures (○-NiO).
Catalysts 13 00356 g004
Figure 5. N2 adsorption–desorption isotherms of LaNiO3 samples calcinated at different temperatures.
Catalysts 13 00356 g005
Figure 6. H2-TPR profiles of LaNiO3 samples calcined at different temperatures.
Catalysts 13 00356 g006
Figure 7. In situ XRD patterns of LNO-C800 during heating in H2 atmosphere: diffractograms taken from 100 °C to 600 °C from bottom to top (♦-LaNiO3; ■-LaNiO2.7; ▼-LaNiO2.5; ●-Ni; ∗-La2O3; ⊗-intrinsic signal from instrument).
Catalysts 13 00356 g007
Figure 8. Evolution of nickel crystal size during heating in H2 atmosphere.
Catalysts 13 00356 g008
Figure 9. XRD patterns of different samples reduced in H2 at 850 °C (♠-La(OH)3; ●-Ni; ∗-La2O3).
Catalysts 13 00356 g009
Figure 10. TEM images of reduced catalysts: (a) LNO-C600; (b) LNO-C700; (c) LNO-C800; (d) LNO-C900.
Catalysts 13 00356 g010
Figure 11. Local Ni crystal grain supported on La2O3 oxide of reduced LNO-C800 catalyst: (a) the lattices of Ni crystal and La2O3 support; (b) spherical Ni metal crystal grain.
Catalysts 13 00356 g011
Figure 12. EDS mappings of reduced LNO-C800 catalyst involving La, Ni, and O elements.
Catalysts 13 00356 g012
Figure 13. (a) The relationship between methane conversion and the TC of LaNiO3 at different TR. Reaction conditions: TR from 700 to 900 °C, S/C = 1.5, atmospheric pressure, GHSV = 20 L·gcat−1·h−1; (b) the relationship between the methane conversion of reduced LNO-C800 and S/C at different TR. Reaction conditions: TR from 700 to 900 °C, atmospheric pressure, GHSV = 20 L·gcat−1·h−1; (c) the relationship between the methane conversion of reduced LNO-C800 and reaction space velocity at different TR. Reaction conditions: TR from 700 to 900 °C, atmospheric pressure, S/C = 1.5.
Catalysts 13 00356 g013
Figure 14. XRD patterns of used LNO-C800 samples after reaction at different S/C (●-Ni; ○-NiO; ☆-La2O2CO3; ♠-La(OH)3; ∗-La2O3).
Catalysts 13 00356 g014
Figure 15. TEM images of carbon deposition generated through the SRM reaction of LNO-C800 at S/C = 1: (a) catalyst and coexisting filamentous carbon deposition; (b,c) Ni grains lifted from the support; (d,e) graphene layers of graphite-like structures.
Catalysts 13 00356 g015
Figure 16. Comparison of the carbon deposition of different samples after 4 h of SRM reaction under the condition of S/C = 1: (a) Raman; (b) TPO.
Catalysts 13 00356 g016
Table 1. The thermal events of the dry gel during heating in air atmosphere.
T (°C)Weight Loss (%)Gas ProductsHeat EffectThermal Events
Step 130–1402H2ODehydration
Step 2140–36038CO2, H2O, NODecomposition of nitrate; oxidation of organic groups
Step 3360–57028CO2, H2O+Oxidation of organic components; LaNiO3 crystallization
Step 4570–7002CO2Decomposition of lanthanum oxycarbonate; LaNiO3 crystallization
Step 5700–9000NoneLaNiO3 crystallization
(+): exothermic; (−): endothermic.
Table 2. Summary of significant properties of calcinated and reduced samples.
SampleSSABET/m2·g−1D(LaNiO3)/nmDistorted Rhombohedral
Symmetry
D(Ni0)/nmT (Reduction Peak)/°C
a/Åc/ÅV/Å3
LNO-C60010.79610.05.4746.738169.8430.0305; 349; 514
LNO-C7008.03313.95.4536.636169.2026.5370; 526
LNO-C8004.57915.85.4406.585168.7922.8387; 536
LNO-C9002.54417.95.4305.579168.1519.8387; 545
Table 3. Carbon deposition of different catalysts after 4 h of the SRM reaction under the condition of S/C = 1.
Catalystsmg C/mg Catalyst (%)T (Carbon Elimination Peak)/°C
LNO-C60018.56610
LNO-C7009.85580
LNO-C8000.56498
LNO-C9000.50497
Disclaimer/Publisher’s Note: The statements, opinions and data contained in all publications are solely those of the individual author(s) and contributor(s) and not of MDPI and/or the editor(s). MDPI and/or the editor(s) disclaim responsibility for any injury to people or property resulting from any ideas, methods, instructions or products referred to in the content.

