2.1. Crystalline and Spectroscopic Characterization of Carbon-Derived Materials
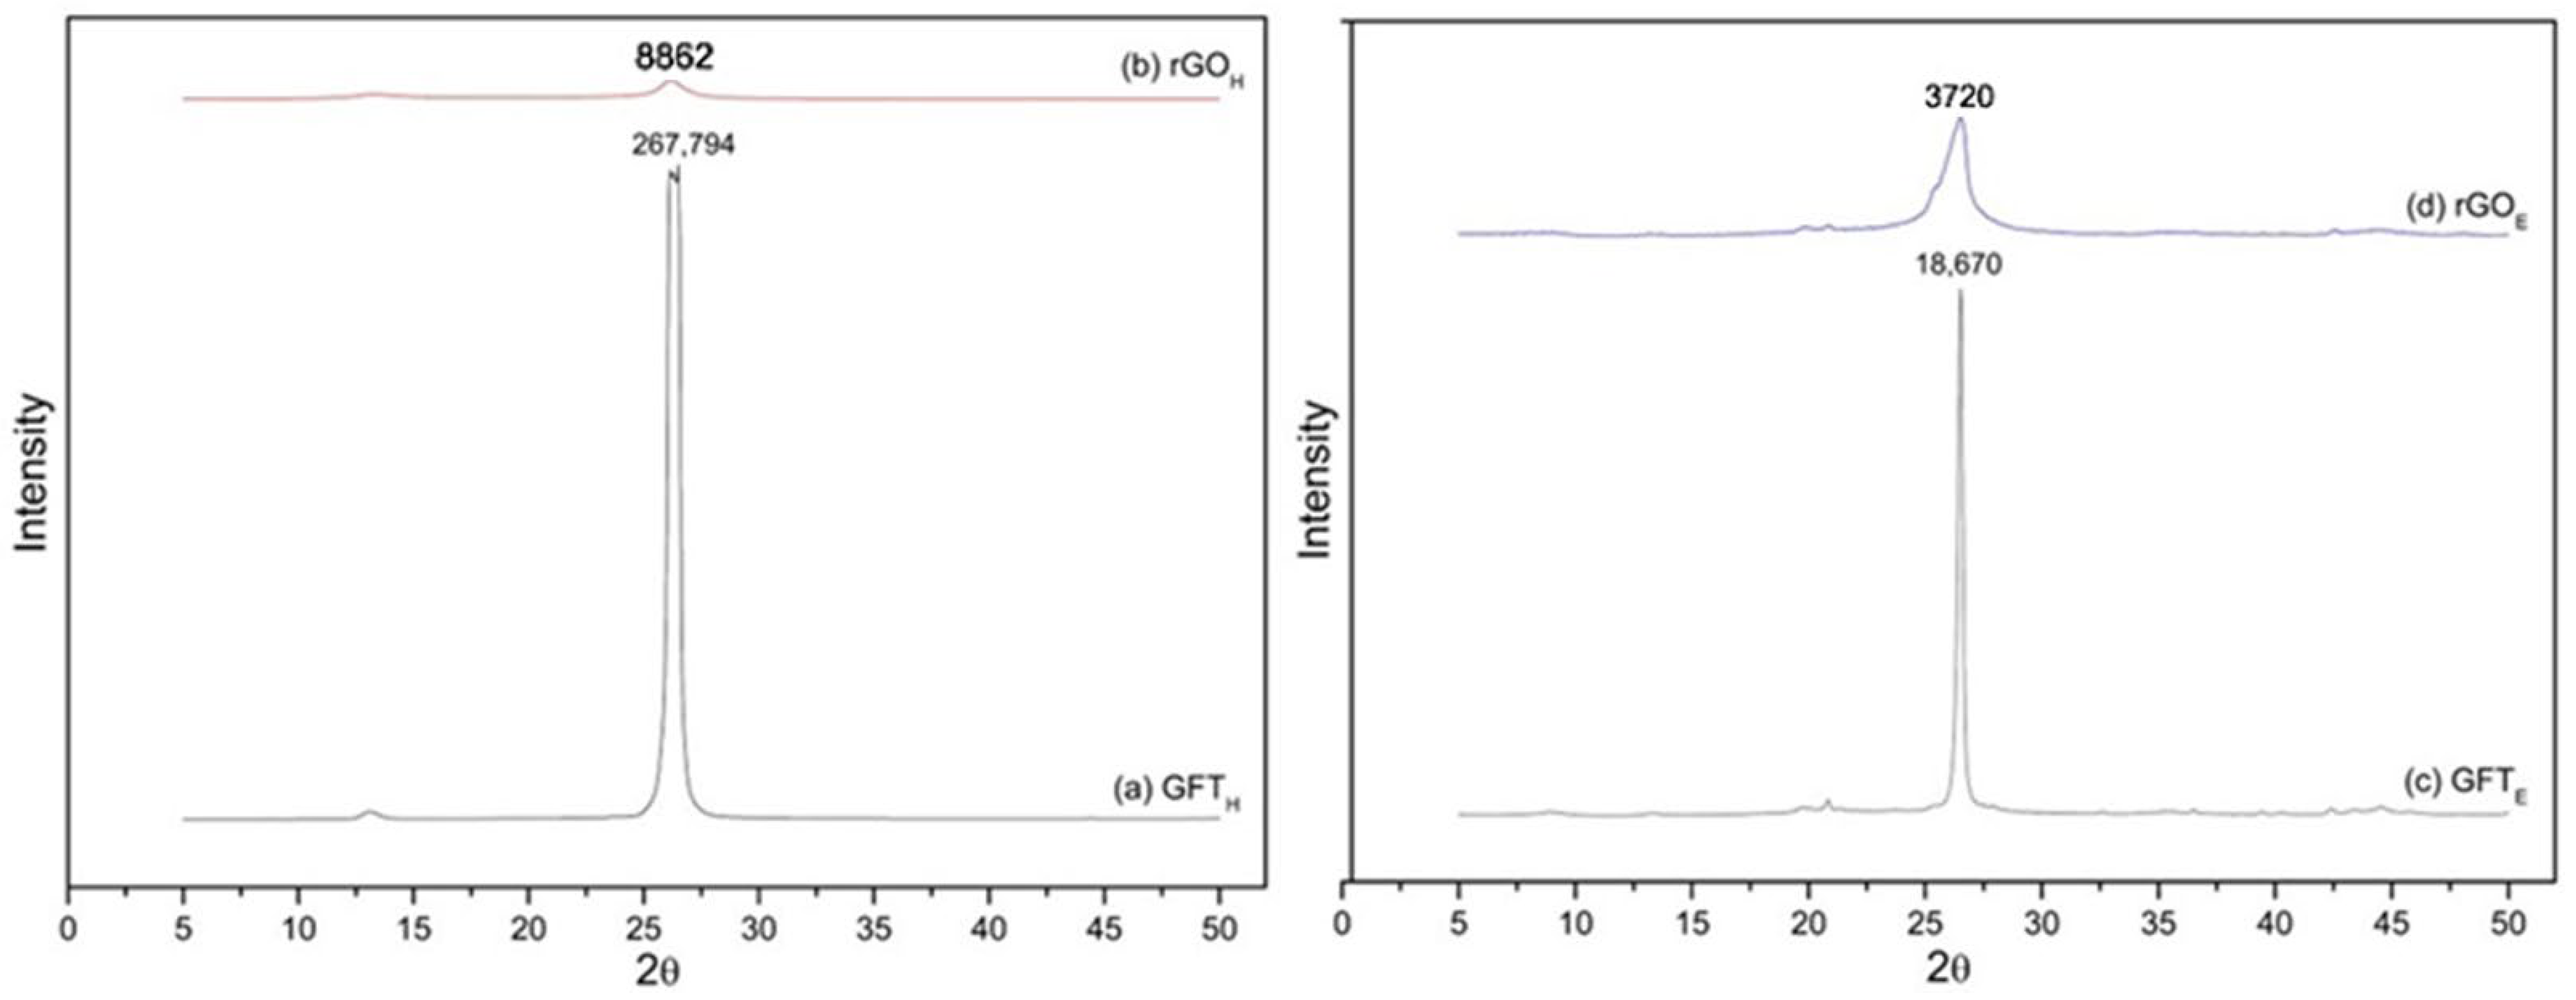
Figure 1 shows the diffractograms obtained for the GFT
H, rGO
H, GFT
E, and rGO
E materials. The X-ray diffractogram of GFT
H (graphite flakes), in
Figure 1a, shows a peak at 2θ = 26.32° with high intensity, indicating high crystallinity in the material [
17]. On the other hand, the diffractogram of rGO
H (reduced graphene oxide Hummers method), in
Figure 1b, exhibits a significant reduction in this peak intensity compared to graphite, suggesting a considerable loss of crystallinity in the material, highlighting the efficiency of the graphite exfoliation process in forming rGO
H. The lower peak intensity at 2θ = 13.29° in rGO
H indicates low efficiency in the samples’ oxidative processes, suggesting minimal material oxidation and direct formation of reduced graphene oxide [
18].
The graphite from the carpenter’s pencil (GFT
E), in
Figure 1c, exhibits a characteristic graphite peak diffracted at 2θ = 26.51° in the (001) plane with high intensity, indicating high crystallinity for this material. After the oxidative exfoliation process, in
Figure 1d (rGO
E), the peak shifted slightly to 2θ = 26.29°, and there was a significant loss of crystallinity and structural disorganization when compared to its starting material (GFT
E), indicating the efficiency of the exfoliation process [
19].
Through XRD analysis, important information was obtained, which enabled the determination of distances between layers using Bragg’s Law, average crystallite sizes through Scherrer’s Equation, and the number of stacked layers in the materials GFT
H, rGO
H, GFT
E, and rGO
E, as shown in
Table S1 [
20,
21,
22,
23,
24].
Table S1 shows a slight increase in the distance difference between the layers of the carbon-based materials, indicating the low degree of graphite oxidation. However, there was a high exfoliation of 44 layers in the GFT
H precursor material and 17 layers in the rGO
H, respectively. The exfoliation via the electrochemical method proved to be more efficient than the Hummers method, with 91 layers in the GRFT
E precursor and 15 layers in rGO
E. There was also a significant decrease in the crystallite size of the precursor materials GFT
H and GFT
E (15 and 31 nm, respectively) when compared with the size of the crystallites of the rGO
H and rGO
E (5 nm).
Next, Raman spectroscopy was utilized to enhance comprehension of the oxidation processes. Generally, in the Raman spectra of graphite and reduced graphene oxide, two characteristic bands can be observed: The D Band (defects in the structure), with A
1g symmetry, located between 1350 and 1360 cm
−1 [
25,
26,
27], attributed to oxygenated groups in the basal plane of the graphene derivatives’ structure [
26] during sp
3 hybridization of carbon in the layers [
28]. The G Band is present in ordered graphene networks (E
2g symmetry), with high intensity located between 1580 and 1610 cm
−1 [
25,
26,
27], attributed to sp
2 hybridization [
27].
Figure 2 presents the Raman spectra for the GFT
H, rGO
H, GFT
E, and rGO
E materials.
Figure 2a presents the D band of GFT
H, corresponding to the vibrational mode of sp
3 hybridized carbon atoms with a minimum intensity at 1341 cm
−1, which occurs due to the high organization of carbon atoms with sp
2 hybridization [
27,
29,
30]. Conversely, the D band of rGO
H, in
Figure 2b, shows an increase in intensity at 1347 cm
−1, attributed to structural disorganization after the exfoliation–oxidation process. However, this increase in the intensity of the D band indicates the rupture of C=C bonds during the oxidation of GFT
H to rGO
H and an increase in sp
3 hybridized carbon atoms [
27,
29,
30]. This is due to imperfections created via the insertion of oxygenated groups in the basal plane of the carbon layers, leading to partial structural disorder [
27,
29,
30]. The G band decreased with the oxidation of GFT
H, seen in
Figure 2a, located at 1583 cm
−1, while for rGO
H, seen in
Figure 2b, it was observed at 1580 cm
−1. The rGO
H structure resulted in a higher I
D/I
G intensity ratio due to defects in GFT
H (I
D/I
G = 0.14), and after the exfoliation–oxidation process due to rGO
H (I
D/I
G = 0.98) [
27,
29,
30]. The Raman spectrum of GFT
E presented a D band of graphite with low intensity at 1354 cm
−1 (sp
3 hybridized carbon atoms) due to the high organization of carbon atoms with sp
2 hybridization.
On the other hand, this band in rGO
E displayed an increase in intensity due to structural disorganization after the exfoliation of GFT
E via the electrochemical method. This increase is attributed to imperfections created via the insertion of oxygenated groups in the basal plane of the carbon layers, leading to partial structural disorder. The G band, corresponding to the vibrational mode of sp
2 hybridized carbon atoms, decreased in the GFT
E material after its exfoliation to produce rGO
E [
30]. The analyses of the I
D/I
G results for the rGO
H and rGO
E materials and a comparison of them with their precursor materials showed a structural rearrangement in the formation of reduced graphene oxides [
30], corroborating the XRD results.
The 2D or ‘G’ band, ranging between 2600 cm
−1 and 2800 cm
−1, is a broad hump associated with the interplanar stacking order, the number of layers, and even the in-plane order of the crystallite size for graphene materials. According to Malard and coworkers [
31], the presence of the 2D (G′) band is attributed to second-order two-phonon processes of the sp
2 carbon structure. A broader 2D band implies an increased number of graphene layers.
The broader 2D region for rGOH shows a lower intensity when compared with rGOE. This indicates that the exfoliation of rGOH results in more pronounced overlapping GO layers when compared with rGOE. On the other hand, the higher intensity of the G peak compared to the D peak for rGOE when compared with rGOH suggests that there is more graphene oxide than graphene sheets or graphite.
To determine the oxygenated groups introduced to the graphites after the exfoliation–oxidation process, infrared spectroscopy was utilized.
Figure S2 presents the infrared spectra obtained for the GFT
H, rGO
H, GFT
E, and rGO
E materials. The spectrum of GFT
H graphite, seen in
Figure S2a, exhibits bands related to the vibrations of C sp
2 bonds in the graphene layers that constitute the graphite. A low-intensity band at 3488 cm
−1 is attributed to –OH group bonds, and a band at 1409 cm
−1 indicates the presence of –COOH bonds from the carboxyl group, suggesting that GFT
H has a low degree of oxidation. In the spectrum of rGO
H, in
Figure S1b, a band appeared at 3338 cm
−1, corresponding to –OH group bonds. This indicates the insertion of –OH groups into the GFT
H structure during graphite’s exfoliation/oxidation process. Additionally, in
Figure S2b, the insertion of oxygenated groups into the graphite structure is observed, including carbonyls (1578 cm
−1); carboxyls (1409 cm
−1); alcohols and phenols (1388 cm
−1, 1247 cm
−1); and epoxide groups (1076 cm
−1), as reported in the literature [
20,
25,
28,
32,
33,
34,
35,
36,
37].
The spectrum of GFT
E graphite, in
Figure S2c, exhibits bands related to the vibrations of C sp
2 bonds in the graphene layers in the graphite structure. A low-intensity band at 3369 cm
−1 is attributed to –OH group bonds, and a band at 1158 cm
−1 indicates the presence of C–O bonds of alcohols and phenols, suggesting that GFT
E presents some degree of oxidation. In the spectrum of rGO
E, in
Figure S2d, an intense peak appears at 3360 cm
−1, corresponding to –OH group bonds, indicating the insertion of –OH groups into the GFT
E structure during the exfoliation process of graphite.
Figure S2d shows that the oxygenated groups inserted into the graphite structure after the exfoliation/oxidation process via the electrochemical method include carbonyls (1538 cm
−1); carboxyls (1444 cm
−1); alcohols and phenols (1365 cm
−1, 1234 cm
−1, 1204 cm
−1, 1158 cm
−1, and 1121 cm
−1); and epoxide groups (1051 cm
−1), as reported in the literature [
20,
25,
27,
28,
32,
33,
34,
35,
36,
37,
38]. Also,
Table S2 shows the assignments of the prominent bands in the infrared spectra for the GFT
H, rGO
H, GFT
E, and rGO
E materials.
2.2. Thermal and Textural Characterization of Carbon-Derived Materials
Thermogravimetric analyses (TGAs) were employed to assist in the study of the insertion of oxygenated groups into the structures of commercial graphites to form rGOs.
Figure 3 presents the weight loss curves of the materials for the GFTH, rGOH, GFTE, and rGOE materials.
The GFT
H presented two weight loss events. The first, between 25 and 470 °C, was attributed to the loss of water molecules adsorbed on the surface and trapped between the layers of the material, resulting in a mass loss of 0.60%. The second event was assigned to decompose the more stable graphite layers (formed via sp
2 hybridized carbon), leading to a mass loss of 22.95%. GFT
H was the most stable among the materials, with a total mass loss of 23.55% [
21,
28,
33,
34,
38,
39]. Its reduced graphene-oxide-derived material also presented six weight loss events, with the first at 107 °C, which was attributed to the loss of surface-adsorbed water, resulting in a mass loss of 3.88%. At 228 °C, the second event was assigned to decomposing less stable functional groups in the rGO structure, with a weight loss of 12.07%. The third, at 367 °C, was attributed to the decomposition of more stable functional groups in the rGO structure, with a weight loss of 7.27%. The fourth, at 450 °C, was also assigned to decomposing more stable functional groups in the rGO structure, resulting in a weight loss of 6.65%. At 507 °C, the fifth event was attributed to the decomposition of less stable rGO layers (formed via sp
3 hybridized carbon); the most prominent weight loss event was 66%. Finally, at 663 °C, the sixth event was attributed to the decomposition of the more stable rGO layers (formed via sp
2 hybridized carbon), resulting in a weight loss of 2.71%. At the end of the analysis, only 0.69% of the original mass remained, indicating almost complete degradation of the rGO
H. The carpenter pencil presented four events, as seen in
Figure 3c. The first, at 83 °C, was attributed to the loss of water molecules adsorbed on the surface of the graphite, with a weight loss of 0.28%. The second, at 150 °C, was assigned to the loss of water trapped between the layers of the graphite, resulting in a weight loss of 3.20%. The third, at 292 °C, was attributed to the pyrolysis of less stable and partially oxidized graphite layers, releasing CO, CO
2, and H
2O, with a mass loss of 6.80%. This result agrees with the infrared spectrum of GFT
E, seen in
Figure 3c. The last thermal event, at 640 °C, was assigned to decomposing the more stable graphite layers (formed via sp
2 hybridized carbon), resulting in the most significant weight loss of 39.12%. However, the total mass loss of the GFT
E was 49.22%, making it the most stable compared to the other studied materials. In addition, the rGO
E material presented six events, seen in
Figure 3d. The first, at 195 °C, was attributed to the loss of water molecules adsorbed on the surface of rGO
E, with a weight loss of 3.86%. At 258 °C, the second was assigned to decomposing less stable oxygenated functional groups in the rGO structure, with a weight loss of 1.67%. The third, at 308 °C, was attributed to the decomposition of more stable oxygenated functional groups in the rGO structure, resulting in a weight loss of 1.93%. The fourth, at 593 °C, was assigned to decomposing more stable functional groups in the rGO structure, leading to a weight loss of 12.65%. The fifth, at 615 °C, was attributed to the continuation of the decomposition of more stable functional groups in the rGO
E structure and sp
3 carbons, with a mass loss of 21.30%. The sixth and final event, at 703 °C, was assigned to the decomposition of rGO layers (sp
2 carbons), resulting in the most extensive mass loss of 34.68%. rGO
E showed a total weight loss of 76.09% of its initial mass [
21,
28,
33,
34,
38,
39].
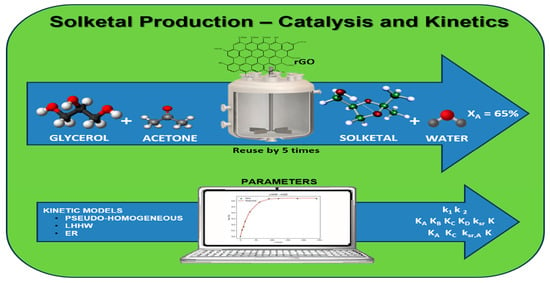
To test rGO
H and rGO
E as catalysts for the glycerol ketalization reaction [
40], these materials and their precursors were also characterized via textural and porosity analysis using the B.E.T., t-plot, and B.J.H. methods, as well as via morphological analysis through scanning electron microscopy (SEM).
Table 1 presents the results from the textural characterization for the GFTH, rGOH, GFTE, and rGOE materials via N
2 sorption analysis.
2.3. Morphological Characterization of Carbon-Derived Materials
The specific surface areas of GFT
H and GFT
E were 5.1 and 4.3 m
2 g
−1, respectively, which are very close to the values found in the literature, ≈4 m
2 g
−1 [
41,
42]. The rGO
H showed a specific surface area of 31.0 m
2 g
−1; in rGO
E, this area was 21.3 m
2 g
−1. The electrochemical process typically produces rGO with a lower specific surface area than the exfoliation–oxidation carried out via the traditional Hummers method [
43,
44]. Both rGO
H and rGO
E exhibited larger specific surface areas than their precursor materials, suggesting that the exfoliation process was effective. This exfoliation is better verified with the aid of morphological analyses conducted using scanning electron microscopy, as shown in
Figure 4, which displays the micrographs of the GFT
H, rGO
H, GFT
E, and rGO
E materials.
Figure 4a,c display the SEM images of GFT
H and GFT
E, respectively, illustrating the morphology of graphite flake and carpenter’s pencil graphite. These images reveal a morphology consisting of densely packed graphene sheets. Upon oxidation and exfoliation processes to form rGO
H and rGO
E, as shown in
Figure 4b,d, there was an observable increase in spacing and disorganization between these sheets. In a morphological analysis conducted by Basso and coworkers [
20], they observed similar morphology changes during the transition from graphite to rGO due to oxidation [
20].
Energy Dispersive X-ray Spectroscopy (EDS) analyses were conducted during SEM analysis to investigate the materials’ surface chemical compositions. The results of the surface chemical compositions of the materials are presented in
Table 2.
rGOH exhibited an oxygen content of 19.6%, whereas its precursor material showed only 2%, thus indicating a low oxidation level of commercial graphite. In contrast, the commercial GRFE already had a high oxidation level, with 21.0% oxygen on its surface. After its exfoliation/oxidation, the oxygen content increased to approximately 5% in rGOE, representing 24.9%. Both rGOE and GFTE exhibited impurities like Si and Al. The rGOH material and rGOE showed 0.8% and 0.5% sulfur content, respectively, attributed to the sulfuric acid used in both rGO production processes.
Considering these characteristics, acidity tests were also conducted on rGO
H and rGOE. However, due to their low thermal stability, acidity was determined through acid–base titration, as presented in
Table S3. These values indicate that the exfoliation/oxidation process used to obtain rGO
H and rGO
E makes these materials significantly acidic for application as catalysts in the glycerol ketalization reaction with acetone for solketal production.
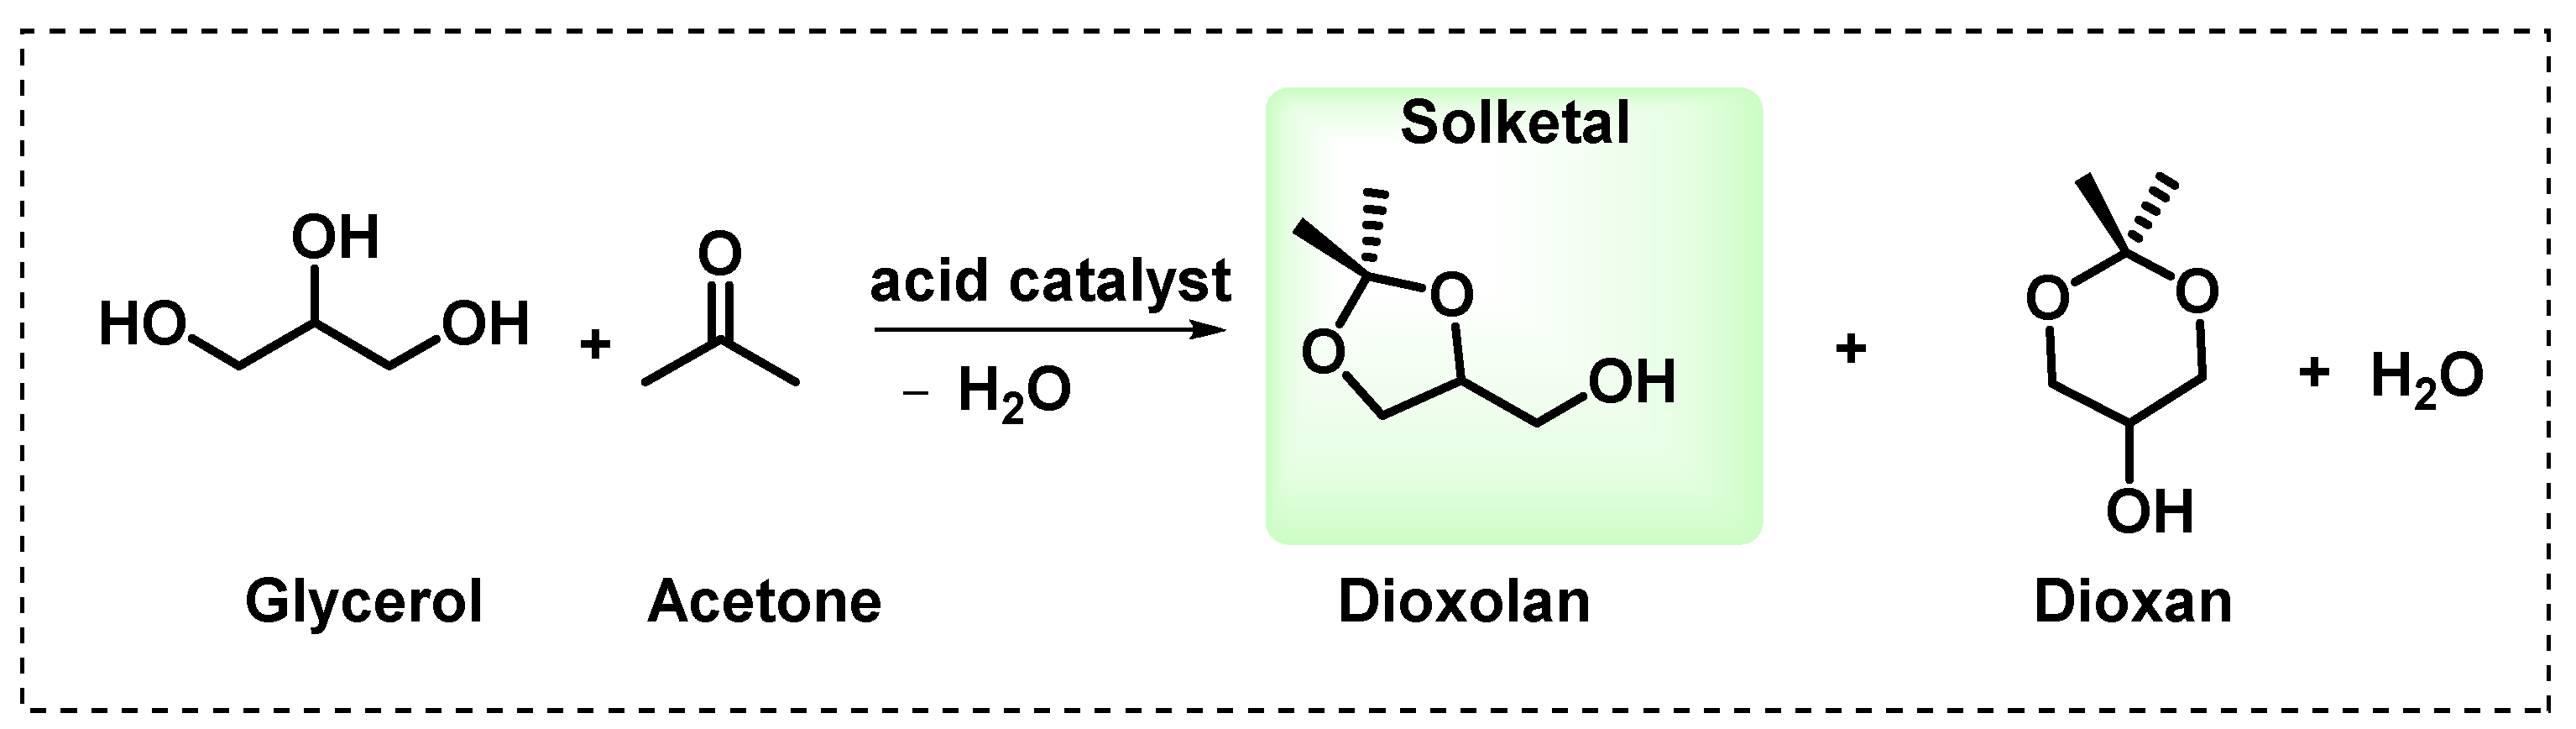
2.4. Catalytic Activity and Kinetic Studies of Glycerol Ketalization
Table 3 presents the results obtained from preliminary catalytic tests, including control (blank/no catalyst), the homogeneous
p-Toluenesulfonic acid (PTSA) catalyst, and the heterogeneous rGO
H and rGO
E catalysts, in terms of glycerol conversion (X
A).
The influence of an acidic catalyst on the glycerol ketalization reaction with acetone is evident from the negligible glycerol conversion (XA = 0.20%) in the control reaction. The homogeneous PTSA catalyst exhibited low activity for solketal conversion (35.45%) but high selectivity towards solketal (97.71%). However, the heterogeneous catalysts showed increased activity, with 66.18% and 63.97% conversion rates for rGOH and rGOE, respectively. Nonetheless, the rGOE catalyst synthesized using the electrochemical method showed lower selectivity towards solketal (80.73%) than the other catalysts, where the selectivity for rGOH and PTSA was 98.38% and 97.71%, respectively. However, it is essential to note that PTSA is a homogeneous catalyst that causes equipment corrosion and waste generation. In addition, the conventional graphene-derived material rGOH is prepared via a non-sustainable procedure and produces much waste. The electrochemically produced graphene-derived material rGOE, despite presenting lower solketal selectivity, must be highlighted for its greener production.
The TOF values for PTSA, rGO
H, and rGO
E are presented in
Table 3. The number of acid sites for the heterogeneous catalysts was obtained through the acidity determination via the acid–base titration technique (
Table S3). The highest TOF value was 57.44 h
−1, achieved with the rGO
E catalyst after 2 h of reaction. The lowest TOF value was 1.80 h
−1, obtained with the PTSA catalyst. No significant difference was observed when comparing the TOF value for the heterogeneous catalysts, highlighting the potential application of rGO
E as a more sustainable catalyst.
Figure 5 presents the results obtained for glycerol conversion tests (X
A%) over time using the homogeneous PTSA catalyst and the heterogeneous rGO
H and rGO
E catalysts.
It can be observed that the rGOH catalyst exhibited higher initial conversion values, converting approximately 19% of the glycerol in the first 10 min of the reaction. For comparison, rGOE converted about 16% of the available glycerol simultaneously. Meanwhile, the homogeneous catalyst PTSA transformed 9% during the initial 10 min of the reaction. After 90 min of reaction, the glycerol conversion stabilized for the heterogeneous catalysts. This suggests that the reaction reached a steady state, with 66% and 64% conversion for rGOH and rGOE, respectively. The homogeneous catalyst PTSA was constant after 120 min of reaction.
Two approaches were considered to estimate kinetic parameters (k1 and k2) for the glycerol ketalization reaction in the presence of acidic catalysts: the pseudo-homogeneous and heterogeneous kinetic models.
The pseudo-homogeneous model showed a good fit for all three reaction systems where PTSA, rGO
H, and rGO
E were used as catalysts, as shown in
Figure 6. Based on the values of the rate constants, forward (k
1) and reverse (k
2), as presented in
Table 4, it is possible to suggest that this reaction tends to shift the equilibrium towards forming the reactants. The constant k
1 is related to the formation of solketal, and k
2 is associated with the reversibility of the reaction, with k
2 > k
1, meaning that the rate of product formation is slower than the rate that signifies the reversibility of the reaction towards the formation of the reactants. However, the difference in the equilibrium constant (K) values indicates that the reaction had not yet reached equilibrium, as evident when examining the calculated X
Aeq values from Equation (S9). The squared residuals (Q) below 0.01 indicate a low deviation between the experimentally obtained X
A data and the values of X
A calculated by the model; X
A EXP and X
A CAL are very close, validating the applied kinetic model. The determination coefficient values (R
2) being close to 1 indicate that the pseudo-homogeneous model can describe the experimentally obtained results, as shown in
Figure 6.
The reversible model simplifies the complex kinetics of heterogeneous reactions by reducing the parameters so that k1 and k2 encompass all kinetic terms for the products and reactants, respectively. The pseudo-homogeneous model fits well with the heterogeneous rGOH and rGOE catalysts, but this does not imply that the catalysis is genuinely homogeneous. This happens because the surface of the heterogeneous catalyst is saturated with one of the reactants, in this case, acetone, as it is the excess reagent (glycerol/acetone molar ratio = 1:4). When there is an excess of reactant in the reactor, this excess can be much higher on the catalyst’s surface. Thus, the model can be called pseudo-homogeneous. The literature has limited examples of modeling and kinetic studies using homogeneous or pseudo-homogeneous models for the glycerol ketalization reaction with acetone, and these are only for heterogeneous catalysts.
However, Esteban and coworkers [
45] proposed a pseudo-homogeneous model and concluded that the reaction of k
2 > k
1 uses sulfonated resin as a catalyst. We observed the same conclusions regarding k
2 > k
1 in a study involving H-BEA zeolites in 2017, using a pseudo-homogeneous model programmed in Fortran, utilizing R2W [
9].
The second approach used was heterogeneous kinetic modeling, aiming to gain insights into the rate-controlling step of the glycerol ketalization reaction with acetone (adsorption, chemical reaction, or desorption) when using heterogeneous catalysts of the rGOH and rGOE types. Once again, the reaction was considered to be of a bimolecular and reversible type. Dioxan was also disregarded in this study in an attempt to simplify the already complex heterogeneous model.
However, before proceeding with the modeling to estimate the kinetic parameters, some catalytic tests were conducted to determine whether the reaction was exclusively under kinetic control and free from external and internal diffusion limitations under the employed reaction conditions. The agitation (rpm) was varied, and glycerol conversion was monitored after 120 min of reaction, as shown in
Figure 7.
Figure 7 shows that between 400 and 800 rpm, glycerol conversion is free from external diffusion limitations. Additionally, internal diffusion limitations can also be disregarded within the agitation range of 500 rpm, as the kinetic diameters of the reactants and products of this reaction [
9] are between 0.43 and 0.51 nm, and the average pore diameter of the catalysts used is around 10 nm, as indicated in
Table 1.
The results of
Figure 5 can be used to proceed with heterogeneous kinetic modeling using the rGO
H and rGO
E catalysts. In Nanda’s studies (2014), for the same reaction, it was also observed that above 400 rpm, there was no influence of mass transfer [
46]. The kinetic parameter results for each mechanism and the created models (Equations (S11)–(S23)) were estimated using Python programming language and the data from
Figure 5.
Using Google Colab/Python language, it was possible to estimate the values for the rate constants, thermodynamic equilibrium constants, and the adsorption equilibrium constants of the reactants, as well as the desorption constants for the products, for two different catalytic systems (rGO
H and rGO
E). The estimated values are shown in
Table 5 and
Table 6; LHHW and ER models, respectively.
The parameters’ physical realism estimated through nonlinear regression was first considered to assess the proposed models’ adequacy. This means that models that yielded negative values for any parameter and/or models that did not converge were discarded. To validate the model, the method chosen was the minimization of the sum of squared residuals (Q); see Equation (S10).
Upon observing
Table 5 and
Table 6, it was found that the heterogeneous models created could only describe the kinetics of the heterogeneous reaction for the rGO
H and rGO
E catalysts. Only one model was validated for each mechanism, as the other models resulted in one or more negative parameter values or did not converge and were thus discarded.
For the Langmuir-Hinshelwood-Hougen-Watson (LHHW) mechanism [
47,
48], the rate-controlling step of the reaction was the chemical reaction between the adsorbed reactants (A) glycerol and (B) acetone on the catalyst surface (R
2 = 0.9979; Q = 0.0017 for rGO
H and R
2 = 0.9985; Q = 0.0008 for rGO
E). This step can be considered a plausible rate-controlling step for the glycerol ketalization reaction with acetone.
As for the Eley-Rideal (ER) mechanism [
45,
49,
50], the rate-controlling step of the reaction was the chemical reaction with only (B) acetone being adsorbed on the catalyst surface (R
2 = 0.9971; Q = 0.0017 for rGO
H and R
2 = 0.9985; Q = 0.0008 for rGO
E), which can also be considered a plausible rate-controlling step for the glycerol ketalization reaction with acetone. It is worth noting that the heterogeneous kinetic models were employed to predict which step serves as the rate-determining step for each of the mechanisms (LHHW and ER) used in the glycerol ketalization with an acetone reaction, not to estimate the value of each parameter involved physically.
It can be said that Model 3 (LHHW), Equation (S15), Model 8 (ER), and Equation (S20) all showed good fits for both the rGO
H and rGO
E catalysts. The squared residuals (Q) below 0.01 indicate a low deviation between the experimentally obtained X
A data and the X
A values calculated using the model. X
A EXP and X
A CAL are very close, validating the applied kinetic model. The values of the determination coefficients (R
2) very close to 1 indicate that the heterogeneous models can be employed to describe the experimentally obtained results, as shown in
Figure 8.
The application of computational molecular modeling to study the mechanism of the glycerol ketalization reaction with acetone, using rGO
H and rGO
E as catalysts, would enable the confirmation of the mechanism and the rate-controlling step for this case. Studies on the kinetics of the glycerol ketalization reaction with acetone using heterogeneous catalysts were conducted by the research group led by Nanda (2014) and by the group led by Esteban (2015) [
45]. Nanda (2014) used Amberlyst 35 resin as the catalyst and employed the LHHW model to describe the glycerol ketalization reaction with acetone, with the chemical reaction as the rate-limiting step, which, with the adaptation of the data presented in this work, represents a plausible model [
46]. On the other hand, the Esteban group (2015) concluded that the Eley–Rideal mechanism describes the glycerol ketalization reaction with acetone, with the chemical reaction involving the adsorption of only one of the reactants as the rate-limiting step of the reaction [
45].


 ,
, 


