
A Novel Application of Photocatalysis: A UV-LED Photocatalytic Device for Controlling Diurnal Evaporative Fuel Vapor Emissions from Automobiles
 and
and
Abstract
:1. Introduction
1.1. ORVR and Diurnal Evaporative Fuel Vapor Emissions
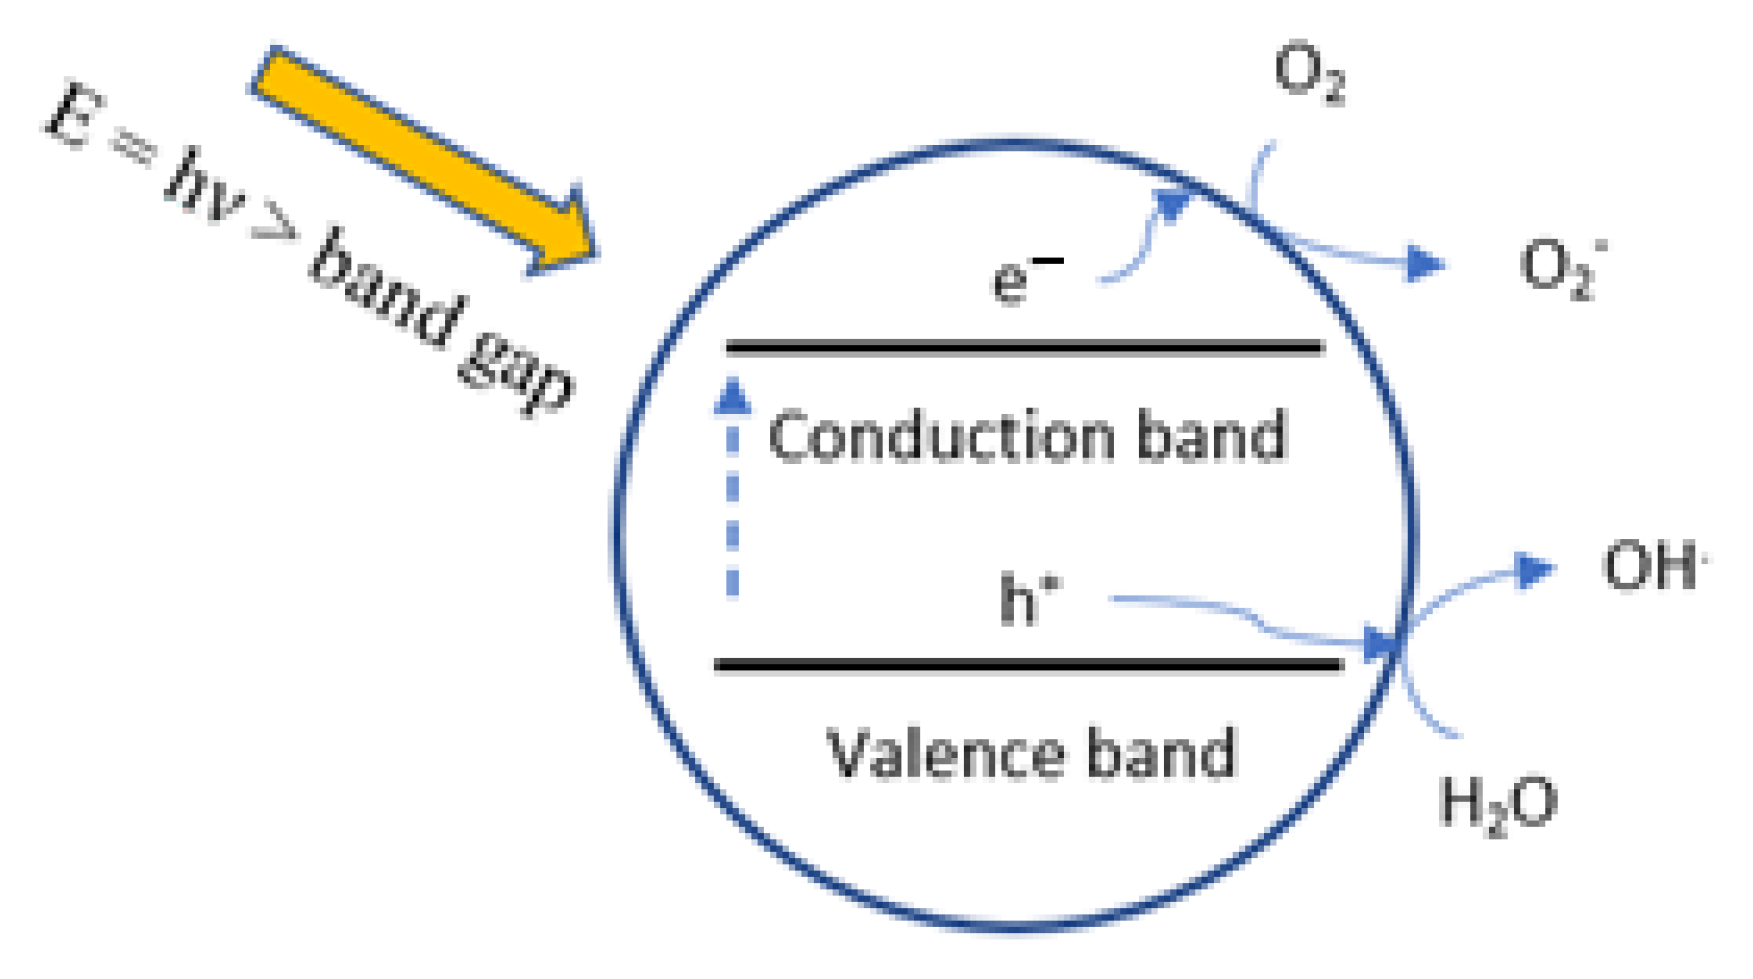
1.2. Photocatalysis
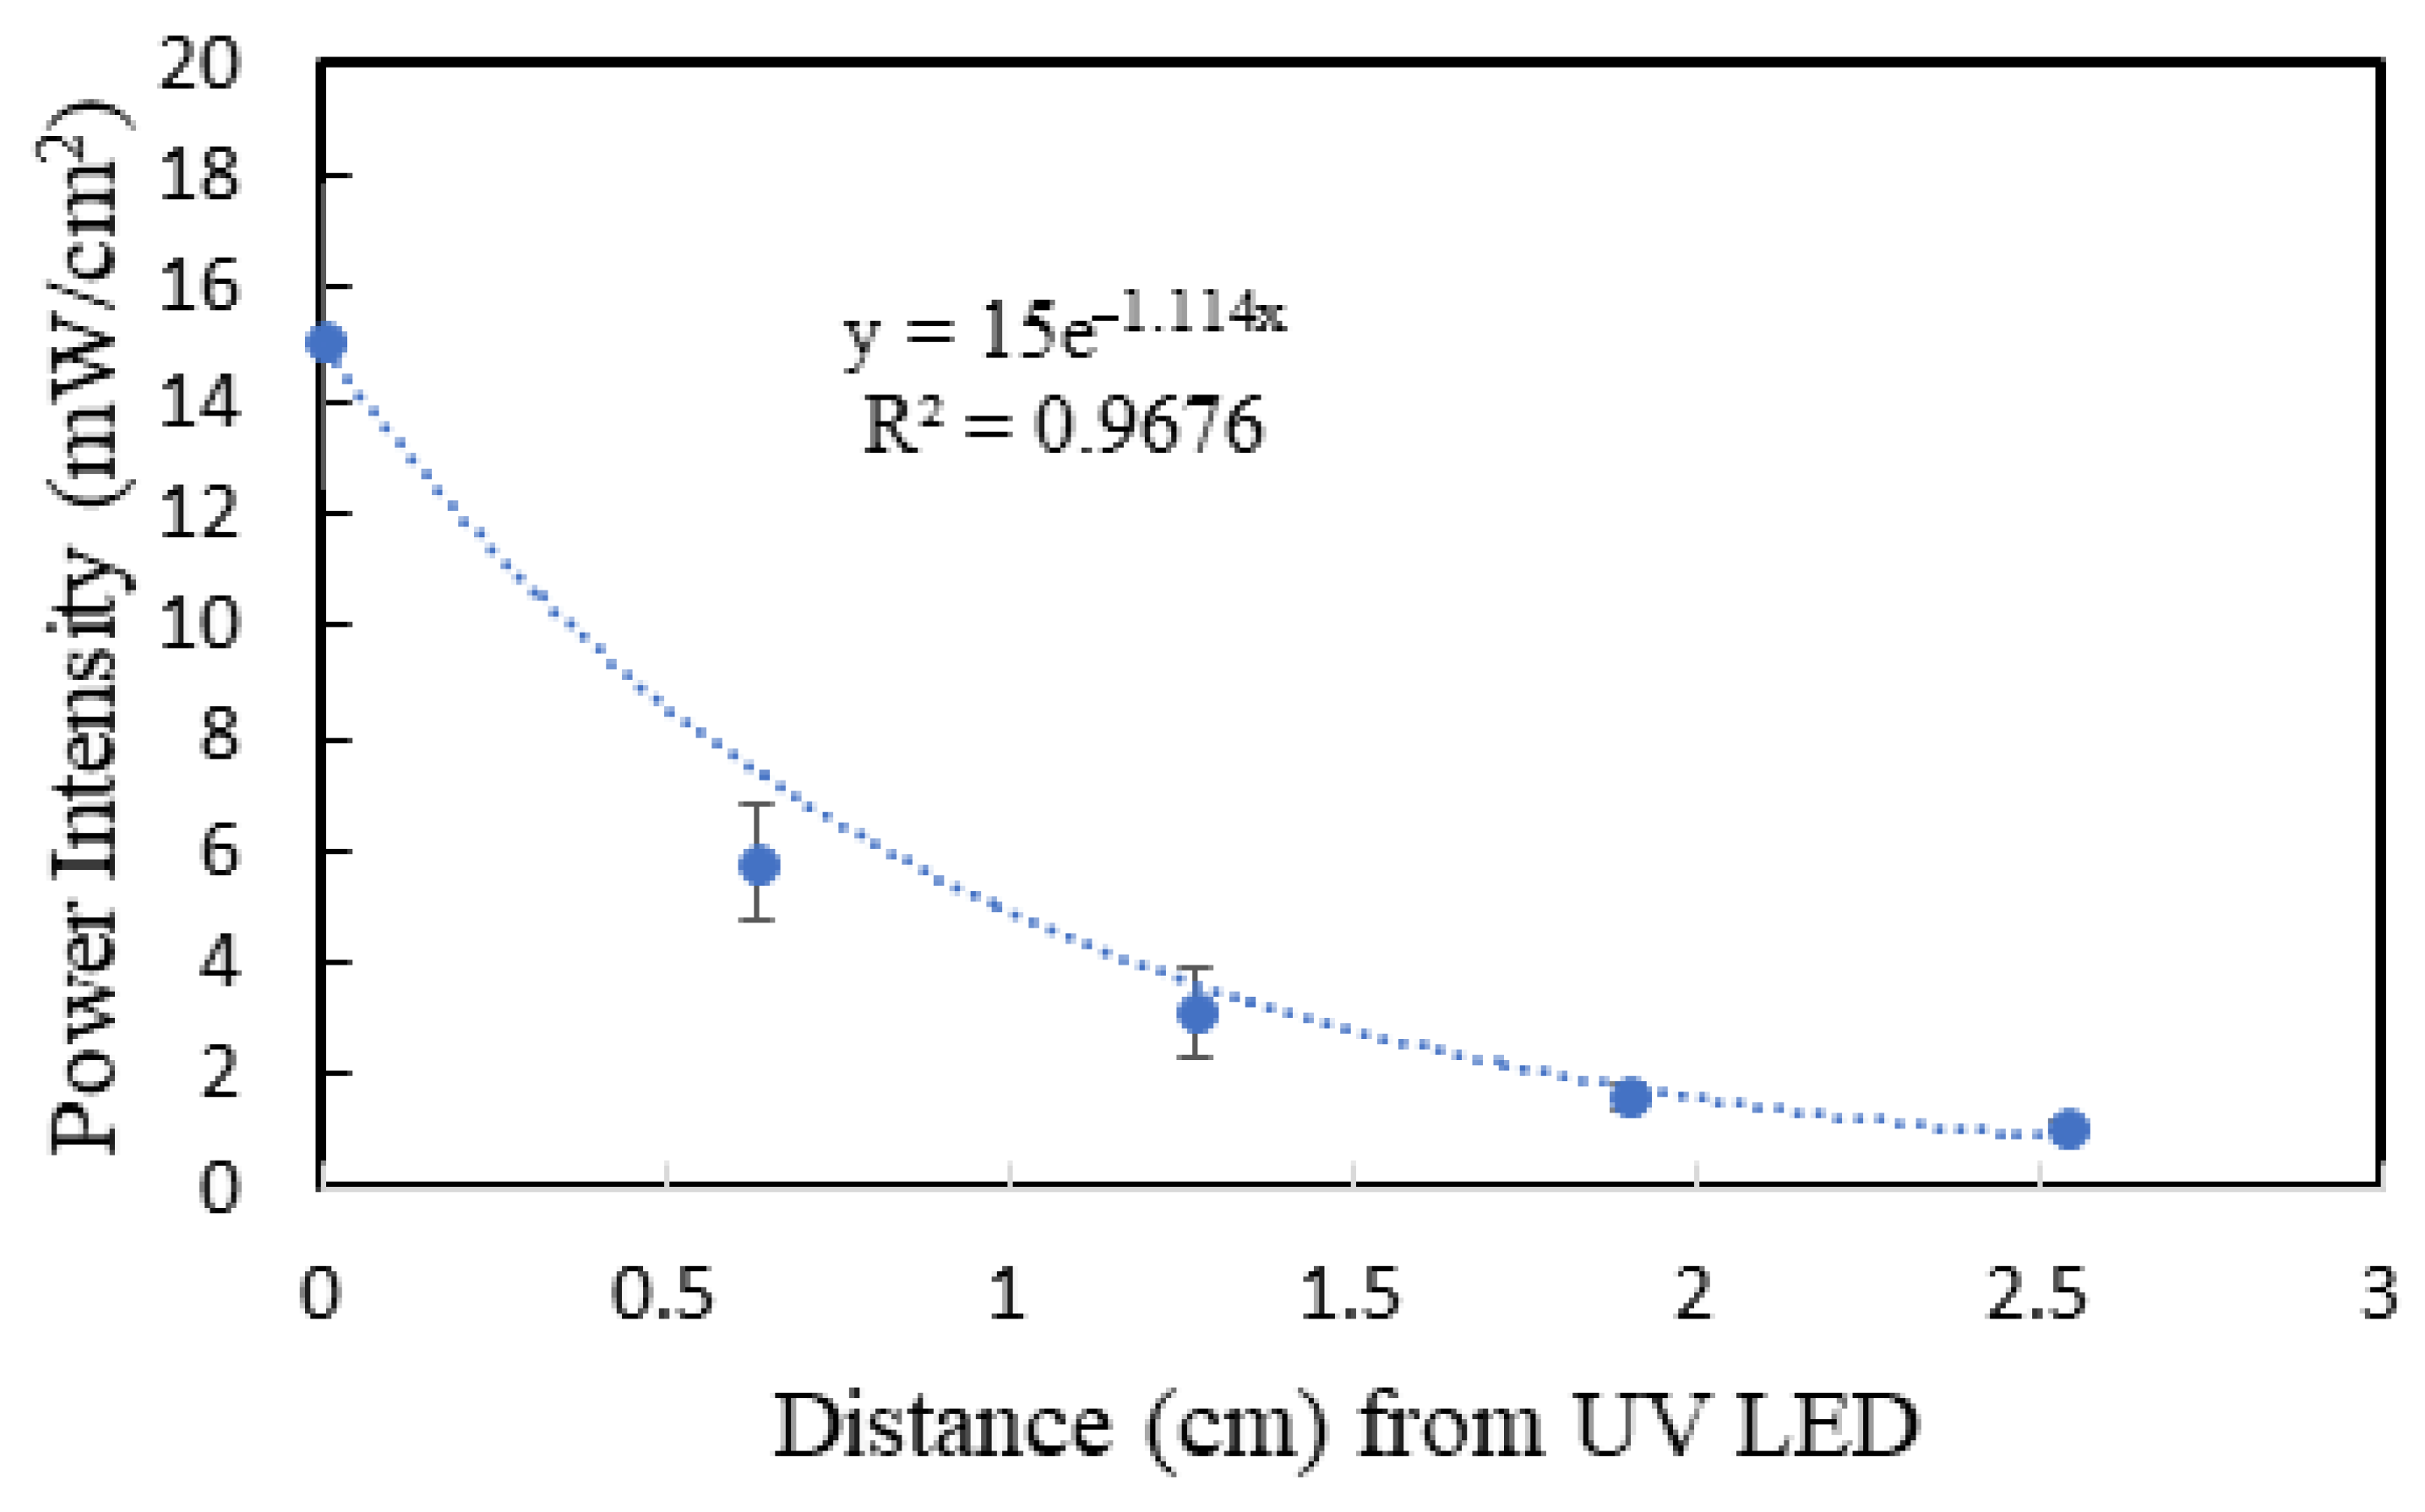
1.3. Ultraviolet Light Emitting Diodes (UV LEDs)
2. Results
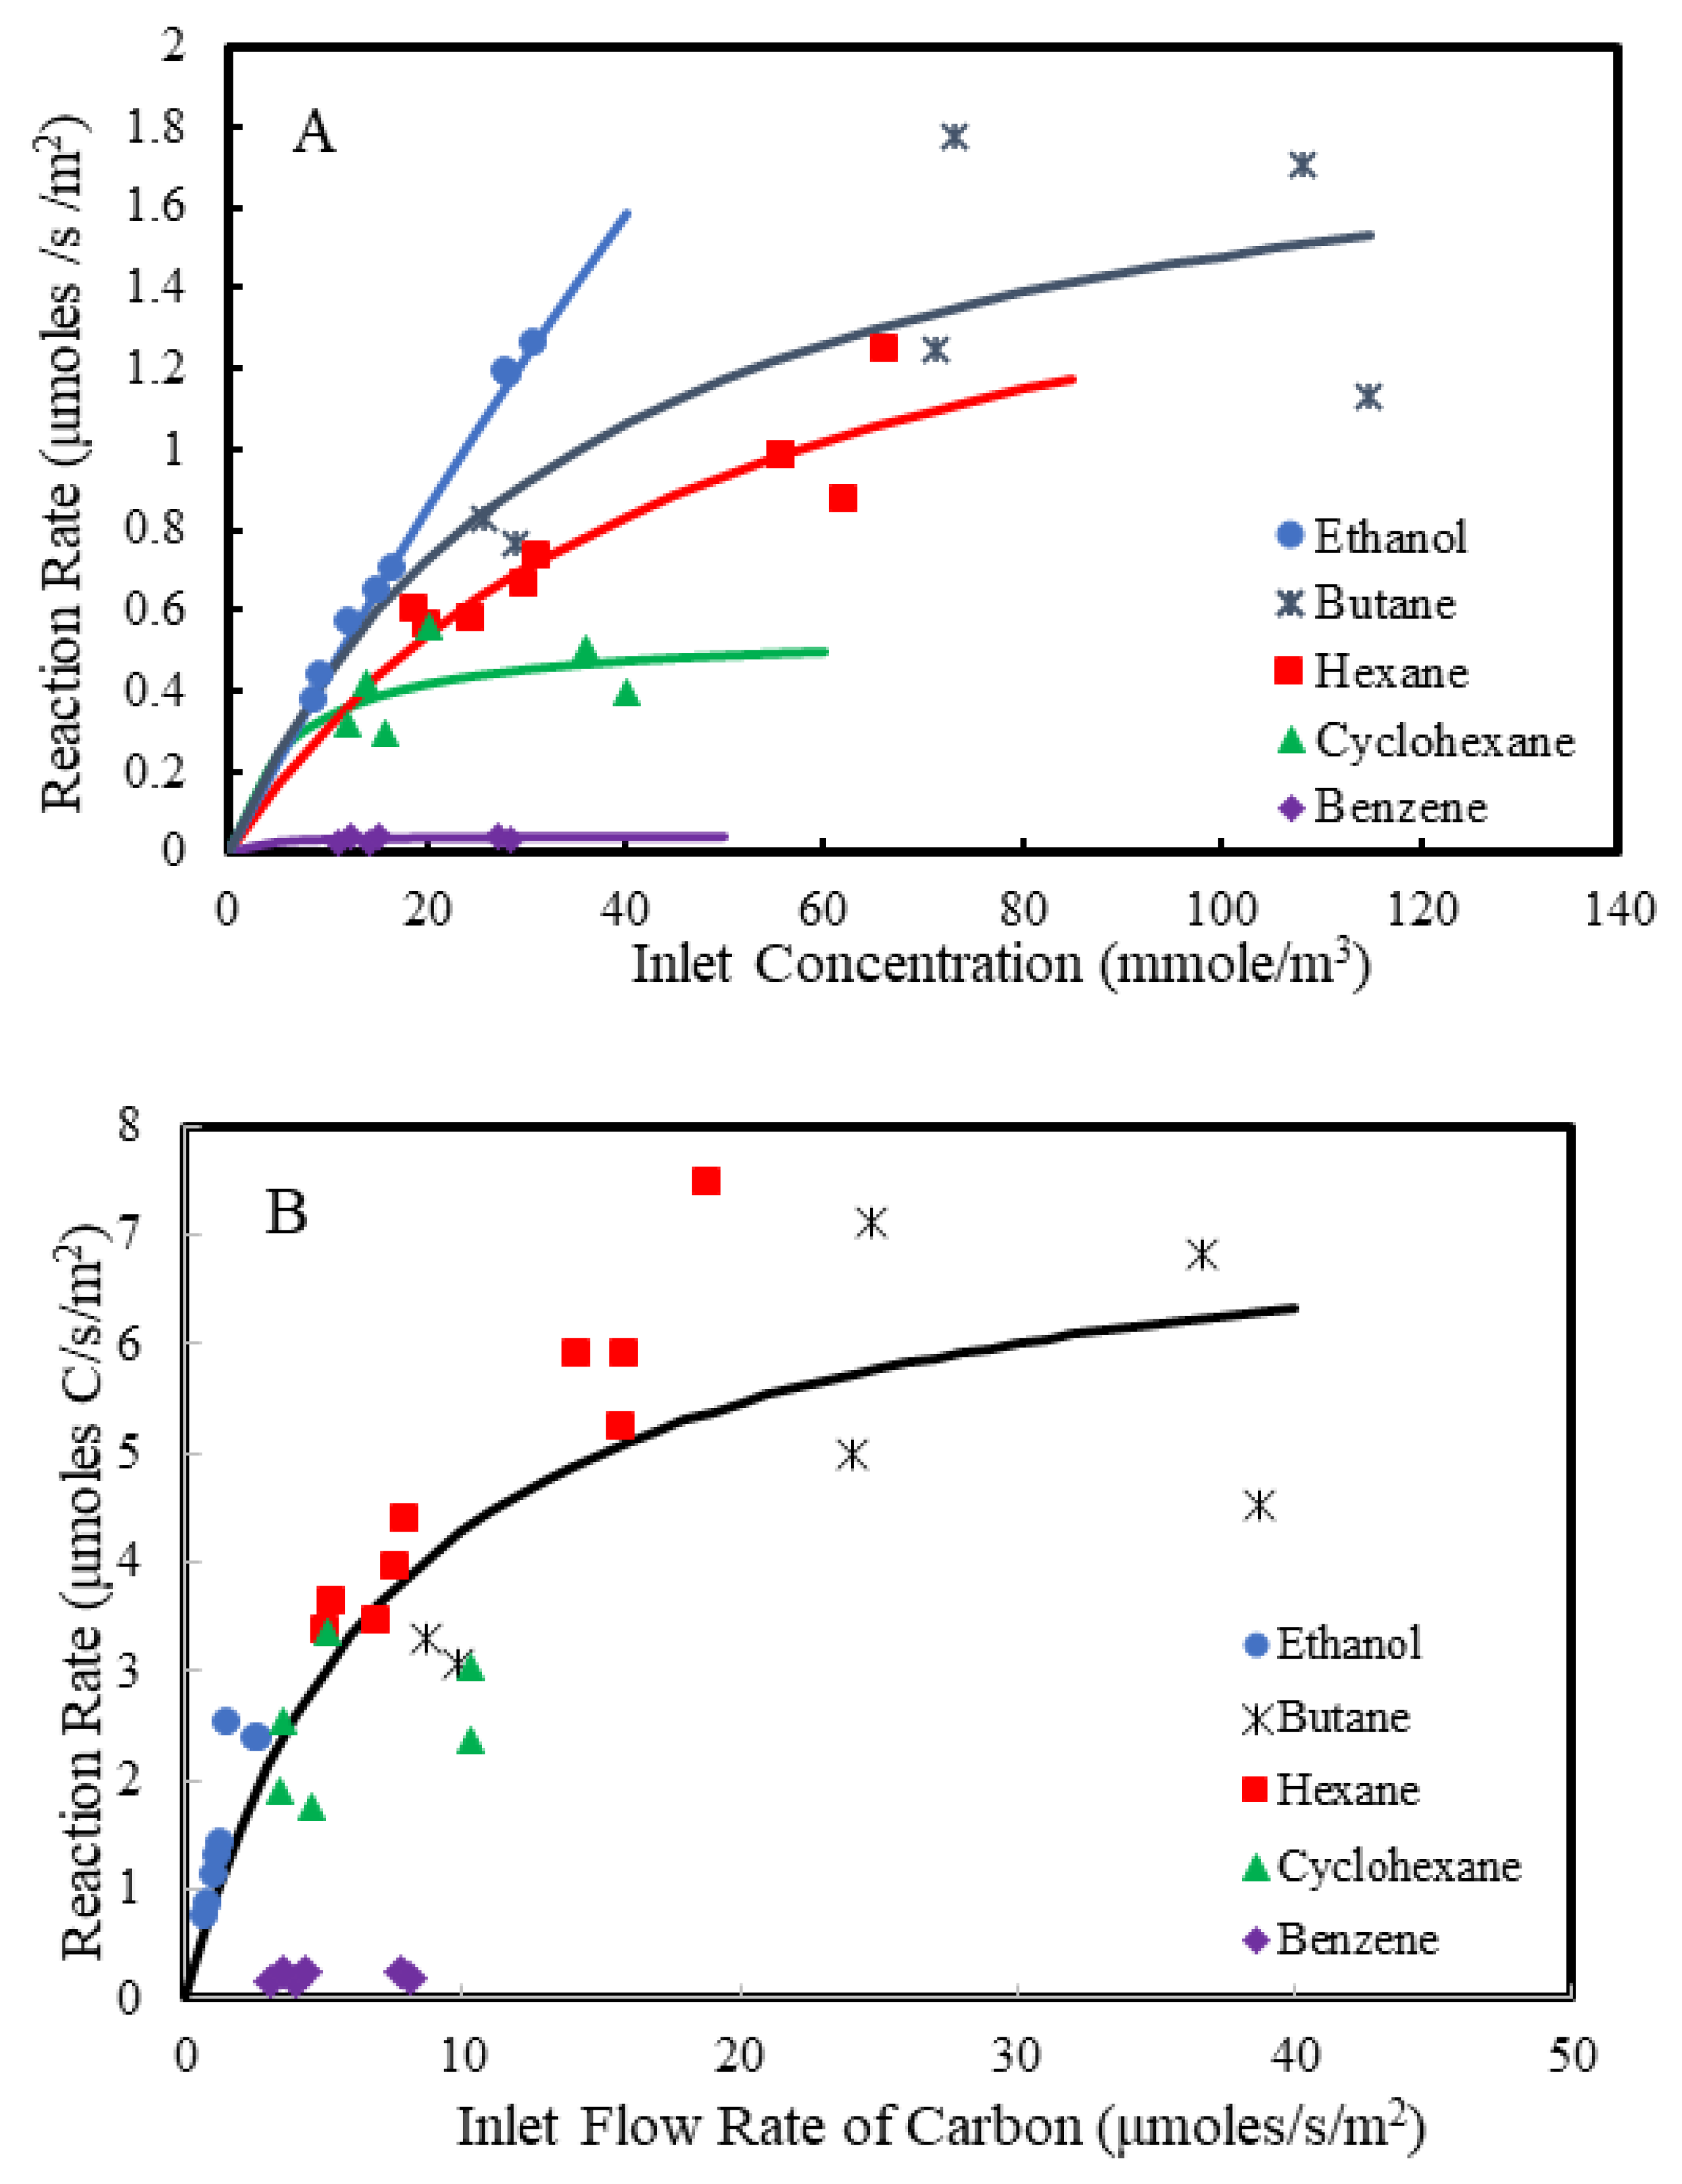
- Ethanol.
- n-Butane.
- n-Hexane.
- Cyclohexane.
- Benzene.
- Standard ORVR Tests with Gasoline
3. Discussion
4. Materials and Methods
4.1. Materials
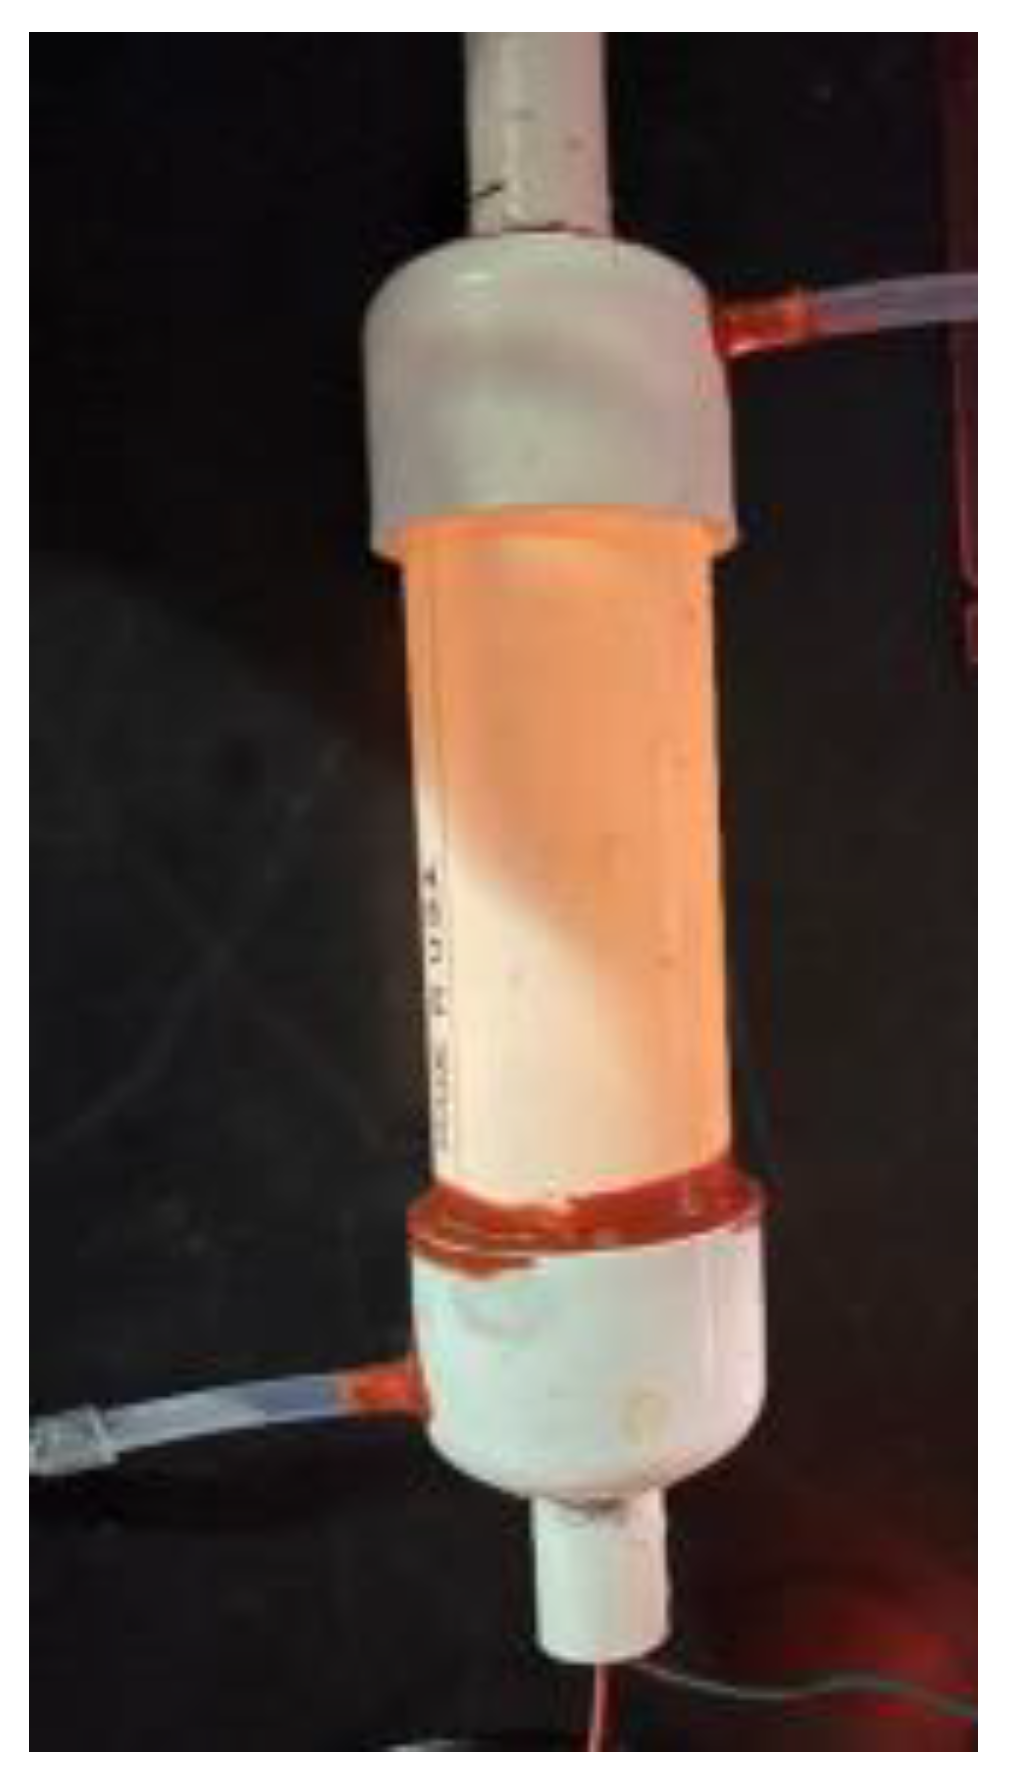
4.2. Design and Construction of the Photocatalytic Device
4.3. Photocatalytic Films
4.4. Test Systems
4.4.1. Laboratory Test System
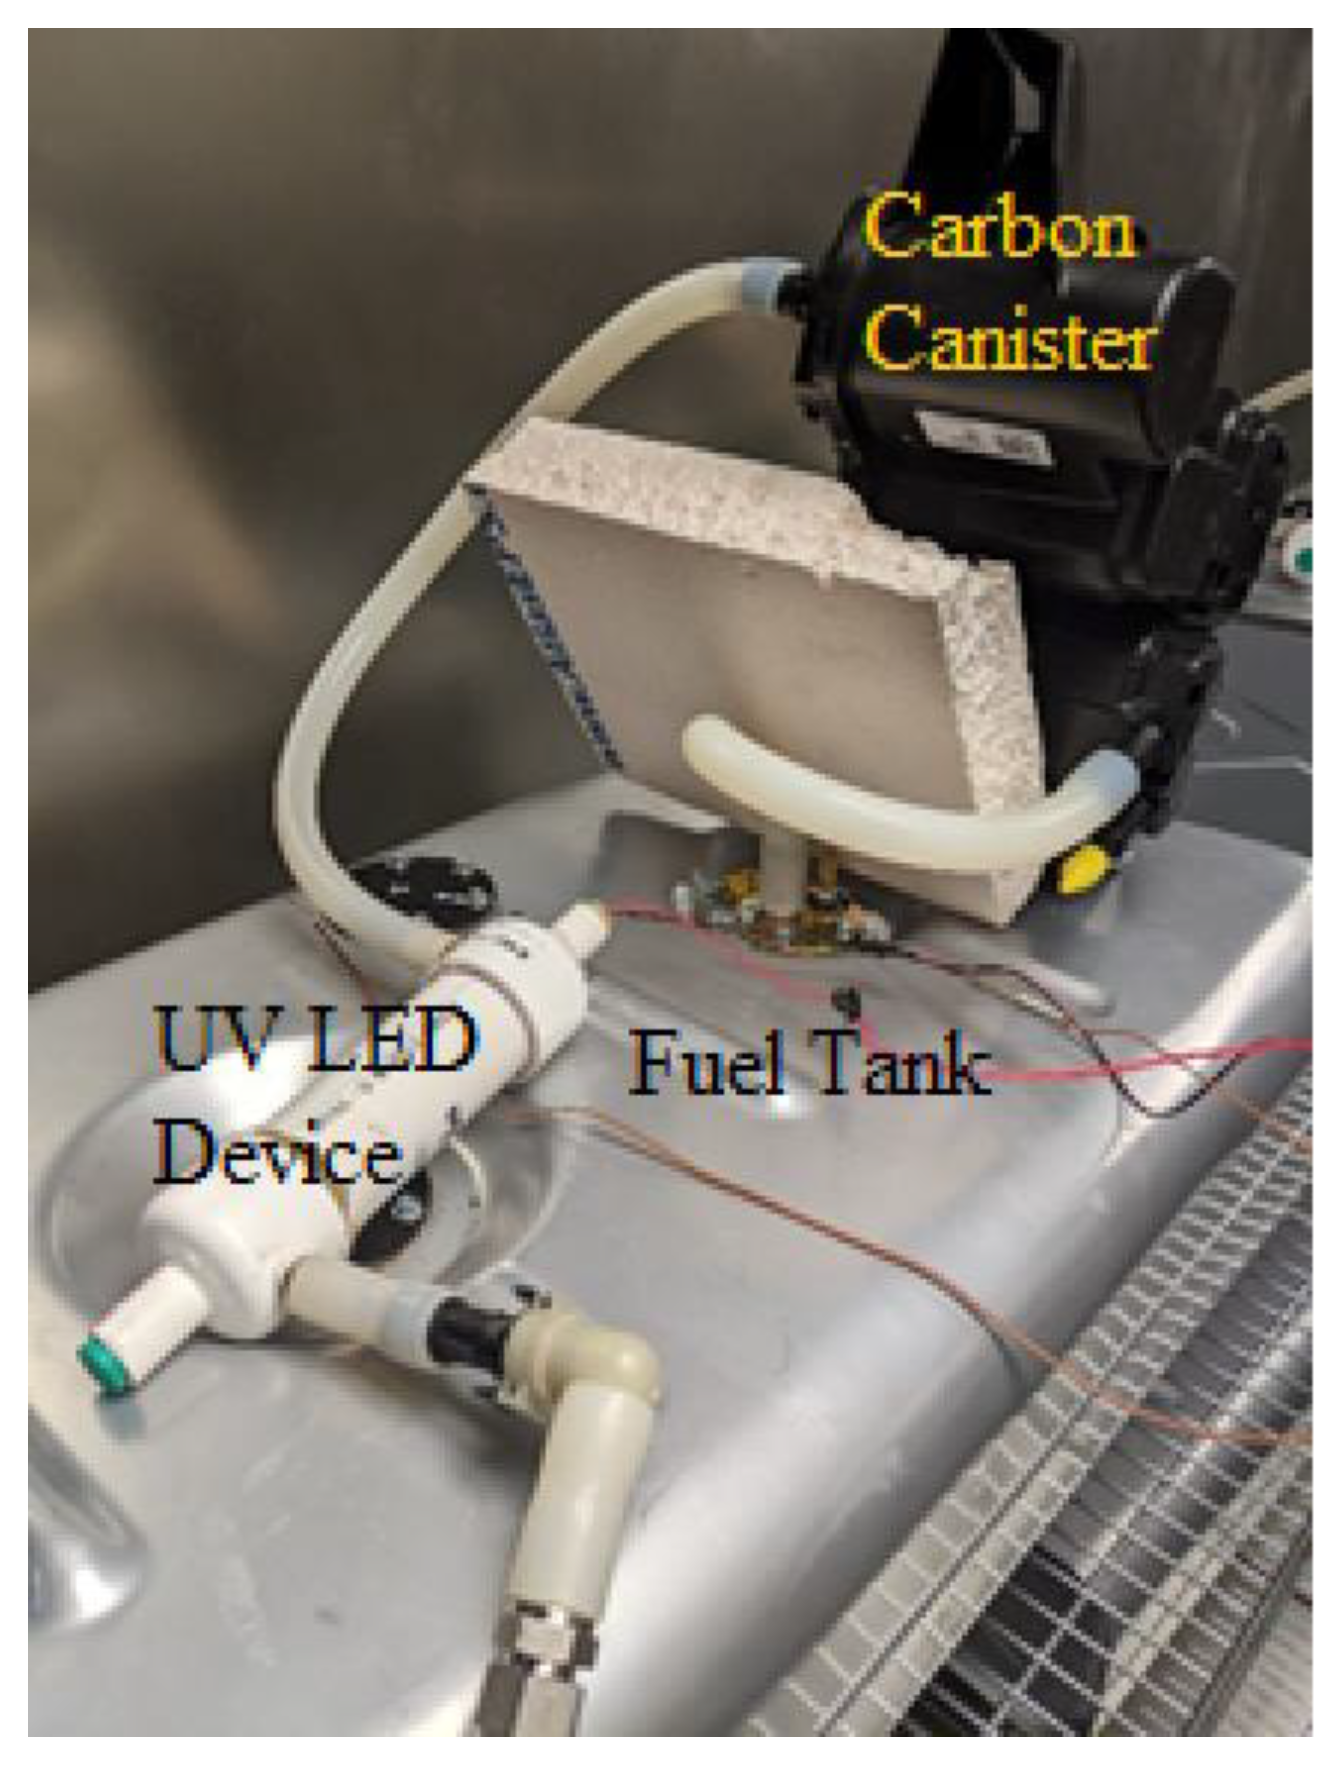
4.4.2. Standard ORVR Test System
5. Conclusions
Author Contributions
Funding
Data Availability Statement
Acknowledgments
Conflicts of Interest
References
- Vehicle Emissions. Available online: https://esa21.kennesaw.edu/activities/smog-cars/doe-veh-pollutants.pdf (accessed on 11 September 2022).
- Onboard Refueling Vapor Recovery. Available online: https://en.wikipedia.org/wiki/Onboard_refueling_vapor_recovery (accessed on 11 September 2022).
- Evaporative Emission Regulations and EVAP Systems. Available online: https://www.automotive-iq.com/exhaust/articles/evaporative-emission-regulations-and-evap-systems (accessed on 11 September 2022).
- Atkinson, S. Suite of technologies developed to reduce fuel vapour emissions. Seal. Technol. 2021, 9, 9–10. Available online: https://www.sciencedirect.com/science/article/pii/S1350478921002804 (accessed on 30 December 2022). [CrossRef]
- Ritter, S. What’s that stuff? Gasoline. Sci. Technol. 2005, 83, 37. Available online: https://pubsapp.acs.org/cen/whatstuff/stuff/8308gasoline.html (accessed on 30 December 2022).
- Chin, J.Y.; Batterman, S.A. VOC composition of current motor vehicle fuels and vapors, and collinearity analyses for receptor modeling. Chemosphere 2012, 86, 951–958. [Google Scholar] [CrossRef] [PubMed] [Green Version]
- Doskey, P.V.; Porter, J.A.; Scheff, P.A. Source fingerprints for volatile non-methane hydrocarbons. J. Air Waste Manag. Assoc. 1992, 42, 1437–1445. [Google Scholar] [CrossRef]
- US EPA. Hydrocarbon composition of gasoline vapor emissions from enclosed fuel tanks. Draft. In Assessment and Standards Division, Office of Transportation and Air Quality, and Human Exposure & Atmospheric Sciences Division; US Environmental Protection Agency: Washington, DC, USA, 2010; EPA-420-D-10-001. Available online: https://nepis.epa.gov/Exe/ZyNET.exe/P100FI6K.txt?ZyActionD=ZyDocument&Client=EPA&Index=2006%20Thru%202010&Docs=&Query=&Time=&EndTime=&SearchMethod=1&TocRestrict=n&Toc=&TocEntry=&QField=&QFieldYear=&QFieldMonth=&QFieldDay=&UseQField=&IntQFieldOp=0&ExtQFieldOp=0&XmlQuery=&File=D%3A%5CZYFILES%5CINDEX%20DATA%5C06THRU10%5CTXT%5C00000033%5CP100FI6K.txt&User=ANONYMOUS&Password=anonymous&SortMethod=h%7C-&MaximumDocuments=1&FuzzyDegree=0&ImageQuality=r75g8/r75g8/x150y150g16/i425&Display=hpfr&DefSeekPage=x&SearchBack=ZyActionL&Back=ZyActionS&BackDesc=Results%20page&MaximumPages=1&ZyEntry=2 (accessed on 30 December 2022).
- Yang, W. Organic Gas Speciation Profile for E10 Winter-Grade Gasoline Fuel (OG694) (ca.gov). Organic Gas Speciation Profile for Headspace Vapor of E10 Winter Gasoline Fuel (OG695) (ca.gov). 2015. Available online: https://ww2.arb.ca.gov/consolidated-list-speciation-profiles (accessed on 9 November 2022).
- Huang, Y.; Ho, S.S.; Lu, Y.; Niu, R.; Xu, L.; Cao, J.; Lee, S. Removal of indoor volatile organic compounds via photocatalytic oxidation: A short review and prospect. Molecules 2016, 21, 56. [Google Scholar] [CrossRef] [PubMed] [Green Version]
- Shah, K.W.; Li, W. A review on catalytic nanomaterials for volatile organic compounds (VOC) removal and their applications for healthy buildings. Nanomaterials 2019, 9, 910. [Google Scholar] [CrossRef] [Green Version]
- Lin, L.; Chai, Y.; Zhao, B.; Wei, W.; He, D.; He, B.; Tang, Q. Photocatalytic oxidation for degradation of VOCs. Open J. Inorg. Chem. 2013, 3, 14–25. [Google Scholar] [CrossRef] [Green Version]
- Alberici, R.M.; Jardim, W.F. Photocatalytic destruction of VOCs in the gas-phase using titanium dioxide. Appl. Catal. B Environ. 1997, 14, 55–68. [Google Scholar] [CrossRef]
- Zhao, J.; Yang, X. Photocatalytic oxidation for indoor air purification: A literature review. Build. Environ. 2003, 38, 645–654. [Google Scholar] [CrossRef]
- Mironyuk, I.F.; Soltys, L.M.; Tatarchuk, T.R.; Tsinurchyn, V.I. Ways to improve the efficiency of TiO2-based photocatalysts (Review). Phys. Chem. Solid State 2020, 21, 300–311. [Google Scholar] [CrossRef]
- Ochiai, T.; Fujishima, A. Photoelectrochemical properties of TiO2 photocatalyst and its applications for environmental purification. J. Photochem. Photobiol. C Photochem. Rev. 2012, 13, 247–262. [Google Scholar] [CrossRef]
- Tseng, T.K.; Lin, Y.S.; Chen, Y.J.; Chu, H. A review of photocatalysts prepared by sol-gel method for VOCs removal. Int. J. Mol. Sci. 2010, 11, 2336–2361. [Google Scholar] [CrossRef] [Green Version]
- Yang, H.; Yang, B.; Chen, W.; Yang, J. Preparation and photocatalytic activities of TiO2-based composite catalysts. Catalysts 2022, 12, 1263. [Google Scholar] [CrossRef]
- Xu, Z.; Ren, Y.; Deng, X.; Xu, M.; Chai, W.; Qian, X.; Bian, Z. Recent developments on gas-phase volatile organic compounds abatement based on photocatalysis. Adv. Energy Sustain. Res. 2022, 3, 2200105. [Google Scholar] [CrossRef]
- Dhanabalan, S.S.; Avaninathan, S.R.; Rajendran, S.; Carrasco, M.F. Photocatalysts for indoor air pollution: A brief review. In Green Photocatalysts for Energy and Environmental Process. Environmental Chemistry for a Sustainable World; Rajendran, S., Naushad, M., Ponce, L., Lichtfouse, E., Eds.; Springer: Berlin/Heidelberg, Germany, 2020; Volume 36. [Google Scholar] [CrossRef]
- Tsang, C.J.A.; Li, K.; Zeng, Y.; Zhao, W.; Zhang, T.; Zhan, Y.; Xie, R.; Leung, D.Y.C.; Huang, H. Titanium oxide based photocatalytic materials development and their role of in the air pollutants degradation: Overview and forecast. Environ. Int. 2019, 125, 200–228. [Google Scholar] [CrossRef]
- Shayegan, Z.; Lee, C.-S.; Haghighat, F. TiO2 photocatalyst for removal of volatile organic compounds in gas phase–A review. Chem. Eng. J. 2018, 334, 2408–2439. [Google Scholar] [CrossRef] [Green Version]
- Mamaghani, A.H.; Haghighat, F.; Lee, C.-S. Photocatalytic oxidation technology for indoor environment air purification: The state-of-the-art. Appl. Catal. B Environ. 2017, 203, 247–269. [Google Scholar] [CrossRef]
- Hernandez-Alonso, M.D.; Fresno, F.; Suarez, S.; Coronado, J.M. Development of alternative photocatalysts to TiO2: Challenges and opportunities. Energy Environ. Sci. 2009, 2, 1231–1257. [Google Scholar] [CrossRef]
- Ayeb, K.; Moussa, N.; Nsib, M.F. ZnO modified by urea-hydrogen peroxide adduct as photocatalyst for 2-propanol photooxidation in the gas phase under different irradiations. React. Kinet. Mech. Catal. 2020, 129, 1103–1113. [Google Scholar] [CrossRef]
- Saucedo-Lucero, J.O.; Arriaga, S. Study of ZnO-photocatalyst deactivation during continuous degradation of n-hexane vapors. J. Photochem. Photobiol. A–Chem. 2015, 312, 28–33. [Google Scholar] [CrossRef]
- Anandan, S.; Miyauchi, M. Ce-doped ZnO (CexZn1-xO) becomes an efficient visible-light-sensitive photocatalyst by co-catalyst (Cu2+) grafting. Phys. Chem. Chem. Phys. 2011, 13, 14937–14945. [Google Scholar] [CrossRef] [PubMed]
- Jing, L.Q.; Wang, B.Q.; Xin, B.F.; Li, S.D.; Shi, K.Y.; Cai, W.M.; Fu, H.G. Investigations on the surface modification of ZnO nanoparticle photocatalyst by depositing Pd. J. Solid State Chem. 2004, 177, 4221–4227. [Google Scholar] [CrossRef]
- Rangkooy, H.A.; Jahani, F.; Faroji, D.A.; Pour, M.N. Photocatalytic activity of synthetic ZnO/WO3 nanocomposites immobilized on a Y-zeolite in removal of gas-phase styrene. J. Environ. Health Sci. Eng. 2021, 19, 181–191. [Google Scholar] [CrossRef] [PubMed]
- Murillo-Sierra, J.C.; Hernández-Ramírez, A.; Hinojosa-Reyes, L.; Guzmán-Mar, J.L. A review on the development of visible light-responsive WO3-based photocatalysts for environmental applications. Chem. Eng. J. Adv. 2021, 5, 100070. [Google Scholar] [CrossRef]
- Fukushi, D.; Sasaki, A.; Hirabayashi, H.; Kitano, M. Effect of oxygen vacancy in tungsten oxide on the photocatalytic activity for decomposition of organic materials in the gas phase. Microelectron. Reliab. 2017, 79, 1–4. [Google Scholar] [CrossRef]
- Wicaksana, Y.; Liu, S.; Scott, J.; Amal, R. Tungsten trioxide as a visible light photocatalyst for volatile organic carbon removal. Molecules 2014, 19, 17747–17762. [Google Scholar] [CrossRef]
- Szilagyi, I.M.; Forizs, B.; Rosseler, O.; Szegedi, A.; Nemeth, P.; Kiraly, P.; Tarkanyi, G.; Vajna, B.; Varga-Josepovits, K.; Laszlo, K.; et al. WO3 photocatalysts: Influence of structure and composition. J. Catal. 2012, 294, 119–127. [Google Scholar] [CrossRef] [Green Version]
- Asadzadeh-Khaneghah, S.; Habibi-Yangjeh, A. g-C3N4/carbon dot-based nanocomposites serve as efficacious photocatalysts for environmental purification and energy generation: A review. J. Clean. Prod. 2020, 276, 124319. [Google Scholar] [CrossRef]
- Muramoto, Y.; Kimura, M.; Nouda, S. Development and future of ultraviolet light-emitting diodes: UV-LED will replace the UV lamp. Semicond. Sci. Technol. 2014, 29, 084004. [Google Scholar] [CrossRef] [Green Version]
- California Environmental Protection Agency, Air Resources Board. California evaporative emission standards and test procedures for 2001 and subsequent model motor vehicles. Adopted 5 August 1999. Amended 2 September 2015. Available online: https://ww2.arb.ca.gov/sites/default/files/2020-01/evap_tps_clean_complete_10-15_accessible.pdfs (accessed on 30 December 2022).
- 40 CFR 86.133-96 Diurnal Emission Test. Available online: https://www.govinfo.gov/content/pkg/CFR-2012-title40-vol19/pdf/CFR-2012-title40-vol19-sec86-133-96.pdf (accessed on 26 September 2022).
- Ethanol Blends. Available online: https://afdc.energy.gov/fuels/ethanol_blends.html (accessed on 11 September 2022).
- Ollis, D.F. Kinetics of photocatalyzed reactions: Five lessons learned. Front. Chem. 2018, 6, 378. [Google Scholar] [CrossRef]
- Bettoni, M.; Falcinelli, S.; Rol, C.; Rosi, M.; Sebastiani, G.V. Gas-phase TiO2 photosensitized mineralization of some VOCs: Mechanistic suggestions through a Langmuir–Hinshelwood kinetic approach. Catalysts 2021, 11, 20. [Google Scholar] [CrossRef]
- Hay, S.O.; Obee, T.; Luo, Z.; Jiang, T.; Meng, Y.; He, J.; Murphy, S.C.; Suib, S. The viability of photocatalysis for air purification. Molecules 2015, 20, 1319–1356. [Google Scholar] [CrossRef] [Green Version]
- Almquist, C.B.; O’Hare, I.; Garza, L.; Badahman, A.; Jung, W.; Hanzel, S.; Neal, J. UV-LED Photocatalytic Device for the Oxidation of Ethanol and Hexane Vapors in Air. Chem. Proc. 2021, 6, 4. [Google Scholar] [CrossRef]
- Sola, A.C.; Garzón Sousa, D.; Araña, J.; González Díaz, O.; Doña Rodríguez, J.M.; Ramírez de la Piscina, P.; Homs, N. Differences in the vapour phase photocatalytic degradation of ammonia and ethanol in the presence of water as a function of TiO2 characteristics and the presence of O2. Catal. Today 2016, 266, 53–61. [Google Scholar] [CrossRef]
- Sauer, M.L.; Ollis, D.F. Photocatalyzed oxidation of ethanol and acetaldehyde in humidified air. J. Catal. 1996, 158, 570–582. [Google Scholar] [CrossRef]
- Coronado, J.M.; Kataoka, S.; Tejedor-Tejedor, I.; Anderson, M.A. Dynamic phenomena during the photocatalytic oxidation of ethanol and acetone over nanocrystalline TiO2: Simultaneous FTIR analysis of gas and surface species. J. Catal. 2003, 219, 219–230. [Google Scholar] [CrossRef]
- Nimlos, M.R.; Wolfrum, E.J.; Brewer, M.L.; Fennell, J.A.; Bintner, G. Gas-phase heterogeneous photocatalytic oxidation of ethanol: Pathways and kinetic modeling. Environ. Sci. Technol. 1996, 30, 3102–3110. [Google Scholar] [CrossRef]
- Muggli, D.S.; McCue, J.T.; Falconer, J.L. Mechanism of the photocatalytic oxidation of ethanol on TiO2. J. Catal. 1998, 173, 470–483. [Google Scholar] [CrossRef]
- Takeuchi, M.; Deguchi, J.; Sakai, S.; Anpo, M. Effect of H2O vapor addition on the photocatalytic oxidation of ethanol, acetaldehyde and acetic acid in the gas phase on TiO2 semiconductor powders. Appl. Catal. B Environ. 2010, 96, 218–223. [Google Scholar] [CrossRef]
- Piera, E.; Ayllón, J.A.; Doménech, X.; Peral, J. TiO2 deactivation during gas-phase photocatalytic oxidation of ethanol. Catal. Today 2002, 76, 259–270. [Google Scholar] [CrossRef]
- Brigden, C.T.; Poulston, S.; Twigg, M.V.; Walker, A.P.; Wilkins, A.J.J. Photo-oxidation of short-chain hydrocarbons over titania. Appl. Catal. B Environ. 2001, 32, 63–71. [Google Scholar] [CrossRef]
- Twesme, T.M.; Tompkins, D.T.; Anderson, M.A.; Root, T.W. Photocatalytic oxidation of low molecular weight alkanes: Observations with ZrO2– TiO2 supported thin films. Appl. Catal. B Environ. 2006, 64, 153–160. [Google Scholar] [CrossRef]
- Štengl, V.; Henych, J.; Szatmáry, L.; Kormunda, M. Photocatalytic oxidation of n-butane by titania after reductive annealing. J. Mater. Sci. 2014, 49, 4161–4170. [Google Scholar] [CrossRef]
- Saucedo-Lucero, J.O.; Arriaga, S. Photocatalytic degradation of hexane vapors in batch and continuous systems using impregnated ZnO nanoparticles. Chem. Eng. J. 2013, 218, 358–367. [Google Scholar] [CrossRef]
- Boulamanti, A.K.; Philippopoulos, C.J. Photocatalytic degradation of C5–C7 alkanes in the gas–phase. Atmos. Environ. 2009, 43, 3168–3174. [Google Scholar] [CrossRef]
- Zhang, P.; Liu, J. Photocatalytic degradation of trace hexane in the gas phase with and without ozone addition: Kinetic study. J. Photochem. Photobiol. A 2004, 167, 87–94. [Google Scholar] [CrossRef]
- Fujimoto, T.M.; Ponczek, M.; Rochetto, U.L.; Landers, R.; Tomaz, E. Photocatalytic oxidation of selected gas-phase VOCs using UV light, TiO2, and TiO2/Pd. Environ. Sci. Pollut. Res. 2017, 24, 6390–6396. [Google Scholar] [CrossRef]
- Zheng, C.; Li, X.; Zhao, Q.; Qu, Z.; Quan, X. Photo-oxidation of gas-phase cyclohexane species over nanostructured TiO2 fabricated by different strategies. Sep. Purif. Technol. 2009, 67, 326–330. [Google Scholar] [CrossRef]
- Marchiori, L.A.; Doubek, Ú.L.R.; Ribeiro, B.M.B.; Fujimoto, T.M.; Tomaz, E. Photodegradation of cyclohexane and toluene using TiO2/UV/O3 in gas phase. Environ. Sci. Pollut. Res. 2019, 26, 4234–4241. [Google Scholar] [CrossRef]
- Almeida, A.R.; Moulijn, J.A.; Mul, G. Photocatalytic oxidation of cyclohexane over TiO2: Evidence for a Mars-van Krevelen mechanism. J. Phys. Chem. C 2011, 115, 1330–1338. [Google Scholar] [CrossRef]
- Korologos, C.A.; Nikolaki, M.D.; Zerva, C.N.; Philippopoulos, C.J.; Poulopoulos, S.G. Poulopoulos, Photocatalytic oxidation of benzene, toluene, ethylbenzene and m-xylene in the gas-phase over TiO2-based catalysts. J. Photochem. Photobiol. A Chem. 2012, 244, 24–31. [Google Scholar] [CrossRef]
- Einaga, H.; Ibusuki, T.; Futamura, S. Photocatalytic Oxidation of Benzene in Air. J. Sol. Energy Eng. 2004, 126, 789–793. [Google Scholar] [CrossRef]
- Einaga, H.; Futamura, S.; Ibusuki, T. Heterogeneous photocatalytic oxidation of benzene, toluene, cyclohexene and cyclohexane in humidified air: Comparison of decomposition behavior on photoirradiated TiO2 catalyst. Appl. Catal. B Environ. 2002, 38, 215–225. [Google Scholar] [CrossRef]
- Zhu, Z.; Li, X.; Zhao, Q.; Qu, Z.; Hou, Y.; Zhao, L.; Liu, S.; Chen, G. FTIR study of the photocatalytic degradation of gaseous benzene over UV-irradiated TiO2 nanoballs synthesized by hydrothermal treatment in alkaline solution. Mater. Res. Bull. 2010, 45, 1889–1893. [Google Scholar] [CrossRef]
- Liu, X.; Zhang, Y.; Matsushima, S.; Hojo, H.; Einaga, H. Photocatalytic oxidation process for treatment of gas phase benzene using Ti3+ self-doped TiO2 microsphere with sea urchin-like structure. Chem. Eng. J. 2020, 402, 126220. [Google Scholar] [CrossRef]
- Bathla, A.; Vikrant, K.; Kukkar, D.; Kim, K.-H. Photocatalytic degradation of gaseous benzene using metal oxide nanocomposites. Adv. Colloid Interface Sci. 2022, 305, 102696. [Google Scholar] [CrossRef]
- Long, B.; Huang, J.; Wang, X. Photocatalytic degradation of benzene in gas phase by nanostructured BiPO4 catalysts. Prog. Nat. Sci. Mater. Int. 2012, 22, 644–653. [Google Scholar] [CrossRef] [Green Version]
- Zhong, J.; Wang, J.; Tao, L.; Gong, M.; Zhimin, L.; Chen, Y. Photocatalytic degradation of gaseous benzene over TiO2/Sr2CeO4: Preparation and photocatalytic behavior of TiO2/Sr2CeO4. J. Hazard. Mater. 2007, 140, 200–204. [Google Scholar] [CrossRef]
- IR Spectrum Table & Chart. Available online: https://www.sigmaaldrich.com/US/en/technical-documents/technical-article/analytical-chemistry/photometry-and-reflectometry/ir-spectrum-table (accessed on 10 November 2022).
- EPA Finalizes Tier 3 Fuel and Emissions Standards. Available online: https://www.greencarcongress.com/2014/03/20140303-tier3.html (accessed on 10 November 2022).
- Tier 3 Motor Vehicle Emission and Fuel Standards. Available online: https://www.everycrsreport.com/reports/R43497.html#_Ref383527191 (accessed on 10 November 2022).
- Lin, H.; Xu, Z.; Wang, X.; Long, J.; Su, W.; Fu, X.; Lin, Q. Photocatalytic and antibacterial properties of medical-grade PVC material coated with TiO2 film. J. Biomed. Mater. Res. 2008, 87B, 425–431. [Google Scholar] [CrossRef]
- Tier 3 Motor Vehicle Emission and Fuel Standards. Available online: https://theicct.org/sites/default/files/publications/ICCTupdate_Tier3_NPRM.pdf (accessed on 10 November 2022).
- Battery Ratings. Available online: https://www.allaboutcircuits.com/textbook/direct-current/chpt-11/battery-ratings/ (accessed on 10 November 2022).
- What is the Difference Between 365 nm and 395 nm UV LED Lights? Available online: https://www.waveformlighting.com/tech/what-is-the-difference-between-365-nm-and-395-nm-uv-led-lights (accessed on 11 September 2022).
- Nargiello, M.; Herz, T. Physical-Chemical Characteristics of P-25 making it extremely suited as the catatalyst in photodegradation of organic compounds. In Photocatalytic Purification and Treatment of Water and Air; Ollis, D., Al-Ekabi, H., Eds.; Elsevier Science Publishers: Amsterdam, The Netherlands, 1993. [Google Scholar]
- Ohtani, B.; Prieto-Mahaney, O.; Li, D.; Abe, R. What is Degussa (Evonik) P25? Crystalline composition analysis, reconstruction from isolated pure particles and photocatalytic activity test. J. Photochem. Photobiol. A Chem. 2010, 216, 179–182. [Google Scholar] [CrossRef]
- Suttiponparnit, K.; Jiang, J.; Sahu, M.; Suvachittanont, S.; Charinpanitkul, T.; Biswas, P. Role of Surface Area, Primary Particle Size, and Crystal Phase on Titanium Dioxide Nanoparticle Dispersion Properties. Nanoscale Res. Lett. 2011, 6, 27. [Google Scholar] [CrossRef] [PubMed] [Green Version]
- Almquist, C.B.; Biswas, P. Role of Synthesis Method and Particle Size of Nanostructured TiO2 on Its Photoactivity. J. Catal. 2002, 212, 145–156. [Google Scholar] [CrossRef]
- Uddin, M.J.; Cesano, F.; Chowdhury, A.R.; Trad, T.; Cravanzola, S.; Martra, G.; Mino, L.; Zecchina, A.; Scarano, D. Surface Structure and Phase Composition of TiO2 P25 Particles After Thermal Treatments and HF Etching. Front. Mater. 2020, 7, 192. [Google Scholar] [CrossRef]
- Han, E.; Vijayarangamuthu, K.; Youn, J.S.; Park, Y.K.; Jung, S.C.; Jeon, K.J. Degussa P25 TiO2 modified with H2O2 under microwave treatment to enhance photocatalytic properties. Catal. Today 2018, 303, 305–312. [Google Scholar] [CrossRef]


| k (105 moles/s/m2) 1 | K (m3/mole) | R2 | |
|---|---|---|---|
| Ethanol | 11 | 4.23 | 0.997 |
| N-butane | 2.0 | 28.3 | 0.553 |
| Hexane | 1.9 | 20.4 | 0.836 |
| Cyclohexane | 0.55 | 157 | 0.232 |
| Benzene | 0.04 | 347 | 0.087 |
| Figure 2B | 0.77 |
| Dimension | Value |
|---|---|
| Inner diameter of the outer tube | 3.8 cm |
| Outer diameter of the inner tube | 2 cm |
| Length | 19 cm |
| Illuminated surface area | 200 cm2 |
| Open volume | 160 cm3 |
| Mass of system | 300 g |
Disclaimer/Publisher’s Note: The statements, opinions and data contained in all publications are solely those of the individual author(s) and contributor(s) and not of MDPI and/or the editor(s). MDPI and/or the editor(s) disclaim responsibility for any injury to people or property resulting from any ideas, methods, instructions or products referred to in the content. |
© 2022 by the authors. Licensee MDPI, Basel, Switzerland. This article is an open access article distributed under the terms and conditions of the Creative Commons Attribution (CC BY) license (https://creativecommons.org/licenses/by/4.0/).
Share and Cite
Almquist, C.B.; Kocher, J.; Saxton, K.; Simonson, L.; Danciutiu, A.; Nguyen, P.J.; Bain, J. A Novel Application of Photocatalysis: A UV-LED Photocatalytic Device for Controlling Diurnal Evaporative Fuel Vapor Emissions from Automobiles. Catalysts 2023, 13, 85. https://doi.org/10.3390/catal13010085
Almquist CB, Kocher J, Saxton K, Simonson L, Danciutiu A, Nguyen PJ, Bain J. A Novel Application of Photocatalysis: A UV-LED Photocatalytic Device for Controlling Diurnal Evaporative Fuel Vapor Emissions from Automobiles. Catalysts. 2023; 13(1):85. https://doi.org/10.3390/catal13010085
Chicago/Turabian StyleAlmquist, Catherine B., Julia Kocher, Kylie Saxton, Lauryn Simonson, Alex Danciutiu, Phat John Nguyen, and Jack Bain. 2023. "A Novel Application of Photocatalysis: A UV-LED Photocatalytic Device for Controlling Diurnal Evaporative Fuel Vapor Emissions from Automobiles" Catalysts 13, no. 1: 85. https://doi.org/10.3390/catal13010085