Article

Multipollutant Abatement through Visible Photocatalytic System

1
Institute of Chemical Sciences, Bahauddin Zakariya University, Multan 60800, Pakistan
2
Department of Chemical Engineering, University College London, Torrington Place, London WC1E 7JE, UK
3
IQS School of Engineering, Universitat Ramon Llull, Via Augusta 390, 08017 Barcelona, Spain
4
Institute of Botany, Bahauddin Zakariya University, Multan 60800, Pakistan
5
Research Institute of Sciences and Engineering (RISE), University of Sharjah, Sharjah 272722, United Arab Emirates
6
Faculty of Pharmacy, Bahauddin Zakariya University, Multan 60800, Pakistan
7
Department of Chemistry, Government Sadiq College Women University, Bahawalpur 63100, Pakistan
*
Authors to whom correspondence should be addressed.
Catalysts 2023, 13(1), 65; https://doi.org/10.3390/catal13010065
Submission received: 27 October 2022 / Revised: 12 December 2022 / Accepted: 15 December 2022 / Published: 29 December 2022
(This article belongs to the Section Photocatalysis)

Abstract

:
Water pollution damages the aquatic environment due to the presence of organic contaminants, which in turn is distressing to the ecosystem. Photocatalytic activity is a greener and promising method to degrade these organic contaminants. In this research, we present the degradation of diverse water pollutants through zinc/iron oxide nanoparticles serving as photocatalysts. The photocatalyst was studied for its efficiency to photodegrade congo red, brilliant green and para nitro phenol. Moreover, it also presented an antibacterial activity against the bacterium E. coli. Photocatalyst was characterized via X-ray diffraction, scanning electron microscopy-energy dispersive X-ray spectroscopy, and fourier-transform infrared spectroscopy. Tauc plot was used to measure the optical band gap (1.84 eV). The effect of various parameters such as catalyst dose, contact time, dye dose/concentration and pH were also investigated to determine the optimum point of maximum degradation through response surface methodology. A face-centered composite design was used, and a quadratic model was followed by congo red, brilliant green dyes and para nitrophenol. The maximum photodegradation efficiencies were 99%, 94.3%, and 78.5% for congo red, brilliant green and phenol, respectively. Quantum yield for congo red, brilliant green and para-nitrophenol were 9.62 × 10⁻⁸, 1.17 × 10⁻⁷ and 4.11 × 10⁻⁷ molecules/photons, while the reaction rates were 27.1 µmolg−1h−1, 29.61 µmolg−1h−1 and 231 µmolg−1h−1, respectively.

1. Introduction

The vital explanation for environmental pollution is industrialization in developing countries. In recent years, the requirement for human needs has increased dramatically, with a higher demand for a variety of chemical products that could be used in industries and can cause environmental pollution. In water, some of these chemicals like synthetic dyes, phenols, etc., usually exhibit a reduction reaction, leading to the development of mutagenic compounds or carcinogenic products that threaten the sustainability of aquatic life, the ecosystem, and microorganisms. In addition, this polluted water impacts the human body’s immune system, central nervous, respiratory system, eye skin irritation, and lung edema [1]. Due to this, the availability of clean water has become a critical issue, especially in underdeveloped countries. To abate these organic contaminants, various chemicals, and biological and physical methods (precipitation, adsorption, ion exchange, reverse osmosis, and advanced oxidation processes (AOPs)) have been studied in detail [2]. These all have their own advantages and drawbacks; however, they are not capable of completely eliminating all the contaminants. Heterogeneous photocatalysis tends to be an imperative technique for this method and can be efficiently implemented for the degradation of different organic pollutants and pigments released into the atmosphere as a result of anthropogenic activities [3,4,5].
Para nitro phenol (PNP), a toxic pollutant is found predominantly in waste from the medical, oil, and coating/painting industries [6]. Phenol due to its bio-recalcitrant nature and toxicity is associated with extreme diseases such as blood cancer and certain significant human tissue defects. For phenol removal, numerous technologies are being used, such as extraction method, adsorption, chemical oxidation, decomposition, microbial treatment, and photocatalysis [7]. The maximum biodegradation of PNP also takes a long time, even though a number of microbes are reported to be capable of adsorbing PNP. Conversely, methods of photocatalytic degradation have been shown to be successful for PNP degradation [8].
Another ecological contaminant that pollutes the landscape is the numerous infectious agents that are detrimental to human health. Microorganism-contaminated water is the main reason for waterborne diseases [9]. Among the various methods used for water remediation, the adsorption process has been found to be one of the most effective and inexpensive water treatment technologies. However, with the advancement in technology, the nanoparticles are gaining more fame in water remediation, and their antibacterial activities are being investigated in detail [10].
Dyes are also the key organic compounds of water pollution. Though they have beneficial social uses in daily activities, for instance, up to 80 percent of the total dyes are obtained by the clothing, paper, rubber, and textile industries yet the largest community of worldwide water contaminants includes synthetic dye products and their intermediates. Ultimately, about 1 to 15 percent of the synthetic fabric dyes are discarded in the water channels [11]. For the handling and treatment of dye-contaminated wastewater, certain conventional, or traditional physicochemical methods were used. Photocatalysis has emerged as a desirable wastewater treatment technology in the treatment of dyes too, and has been considered an innovative, environmentally friendly, and cost-effective tool for solving environmental pollution problems [12]. Various doped materials like Ba-Cd-Sr-Ti doped Fe2O3 nanoparticles have been designed to degrade the dyes under UV/visible light sources [13].
The state-of-the-art technology demands the designing of such nanoparticles, which can simultaneously abate the diverse pollutants from contaminated water. Though zinc ferrite nanoparticles have been studied for their ability to degrade methylene blue dye [14], their potential to eliminate many other pollutants of serious concern has not been explored. In this present work, we attempted to evaluate the applicability of zinc/iron oxide as a photocatalyst to photodegrade congo red dye, brilliant green, and para nitro phenol. Response surface methodology was used to optimize the experimental parameters.

2. Results and Discussion

Metal-mediated photocatalysis has been granted greater distinction by the multiple advanced oxidation processes (AOPs) because of its potential to degrade a wide variety of organic and inorganic contaminants with no adverse by-products at ambient temperatures and pressures. Moreover, such photocatalysts are easy to regenerate, affordable, stable, and show catalytic properties for treating wastewater with less chemical waste and low global warming. Zn-based nanoparticles are considered to possess chemical stability, robustness, thermal tolerance, and long shelf life, compared to respective bulk oxide [15].

2.1. Characterization

The synthetic scheme followed by Mowlika et al. was adopted for the preparation of nanoparticles. The authors have described the XRD analysis of Zn/iron oxide NPs to determine crystallinity and phase. According to them, these nanoparticles possess spinal cubic arrangement with a clear crystalline appearance and particle size of approximately 36 nm [16].

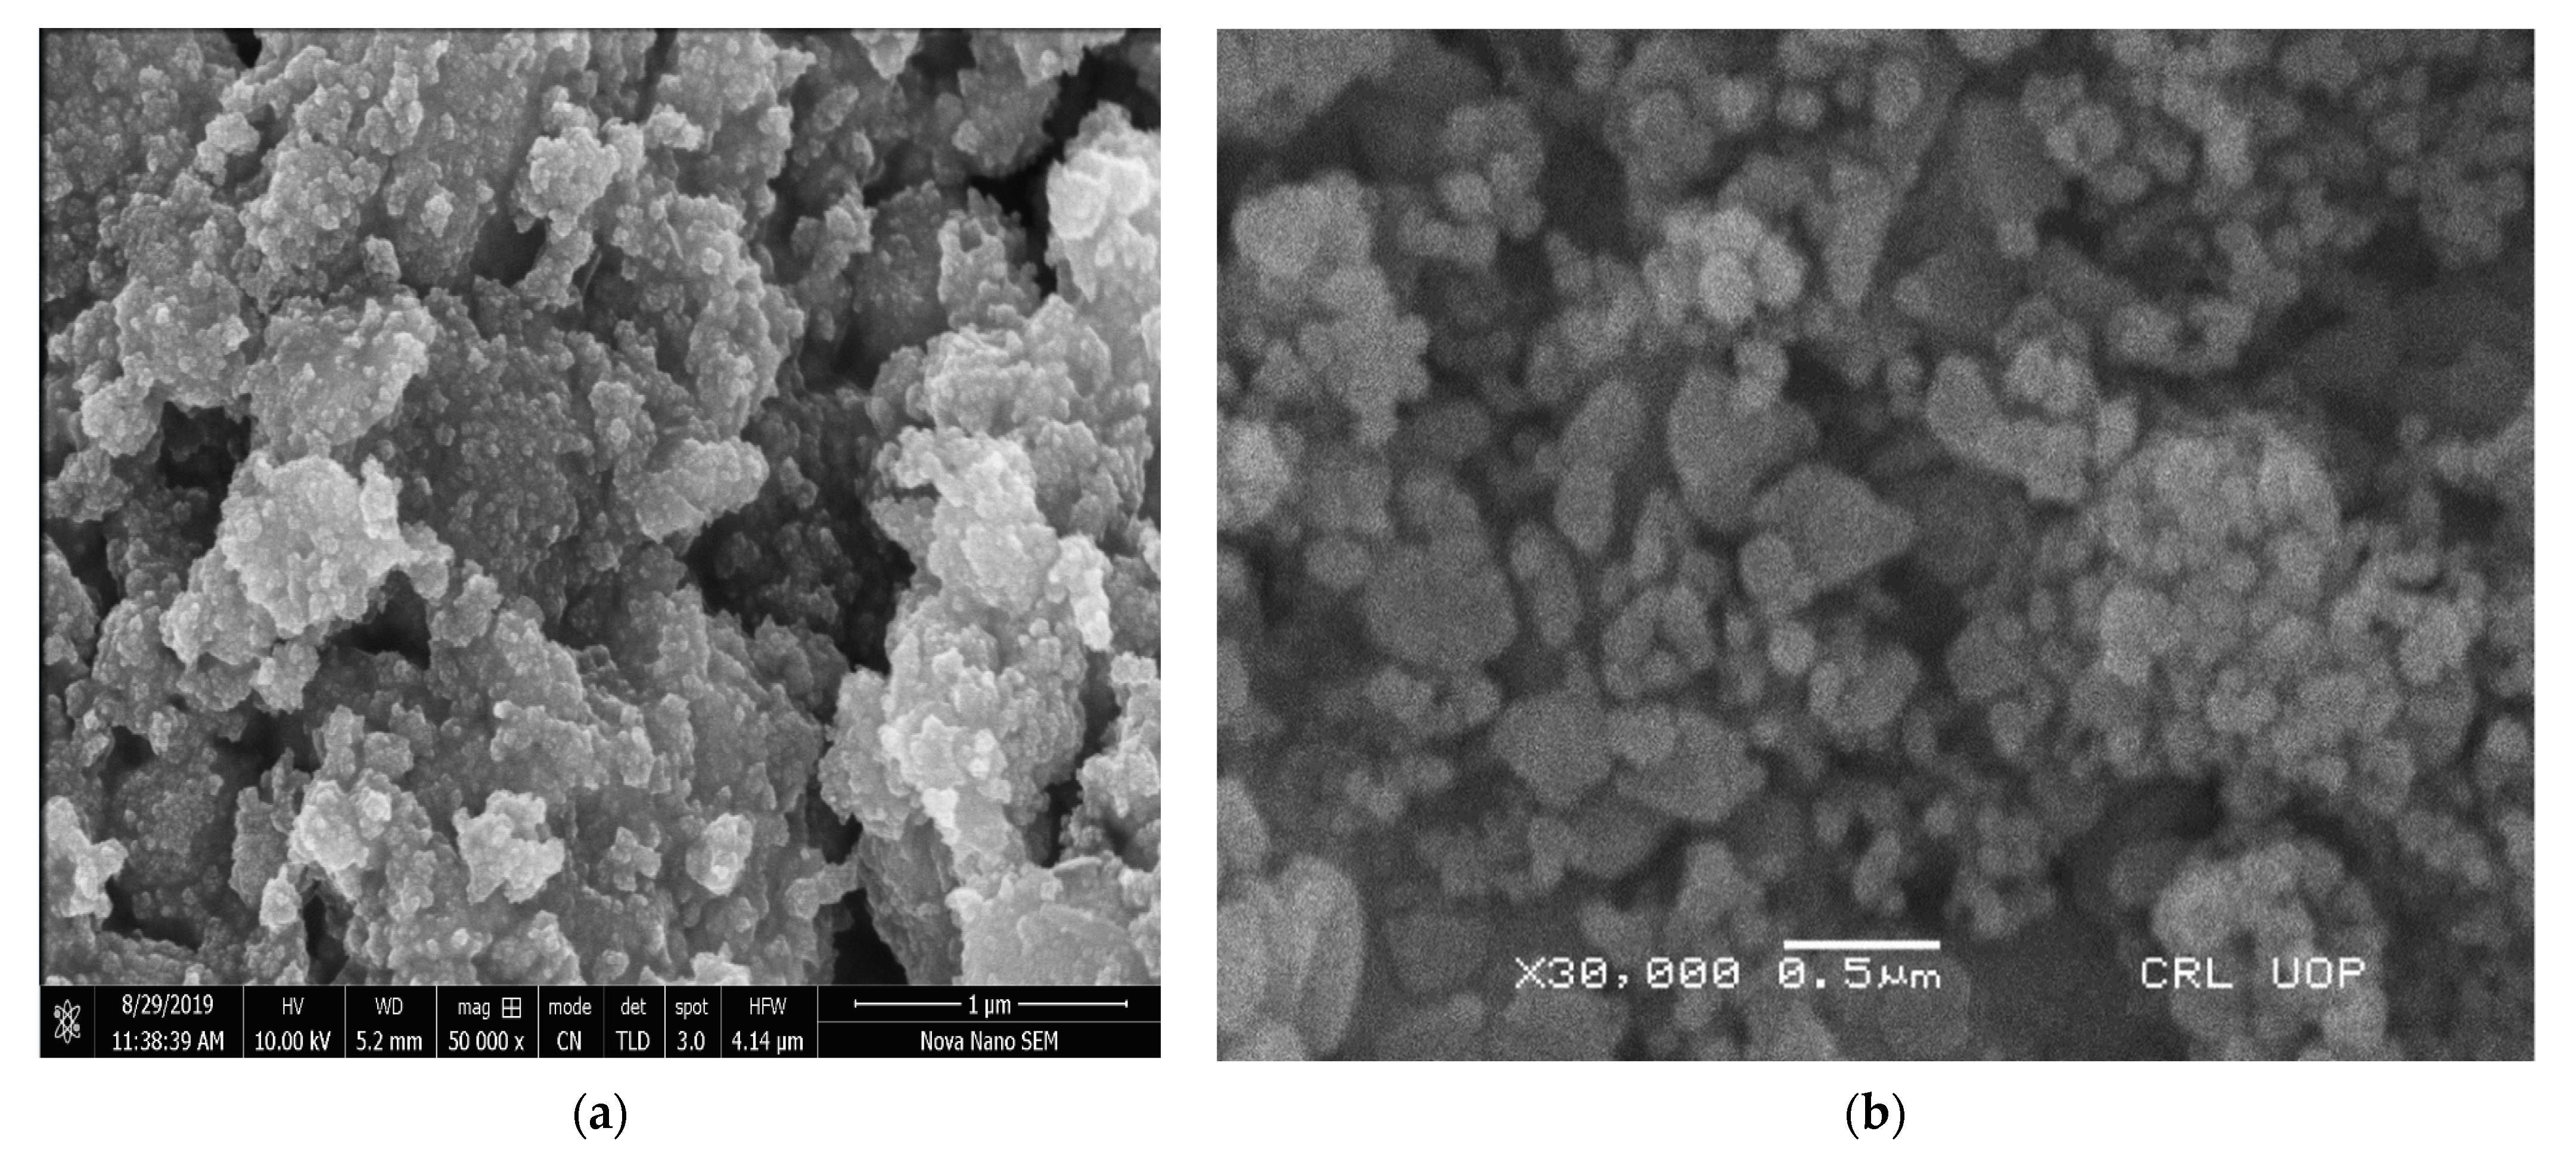
2.1.1. Scanning Electron Microscopy (SEM)

The SEM technique was performed to examine the morphology of Zn/iron oxide nanostructures. The surface morphology and SEM micrographic images of Zn/iron oxide are shown in Figure 1. SEM images depict a varying particle distribution of Zn with a roughly spherical shape. It further revealed that aggregation also occurred in the catalyst. A closer look at the particles’ shape given in Figure 1b at 0.5 µm scale further clarifies the appearance of particles.

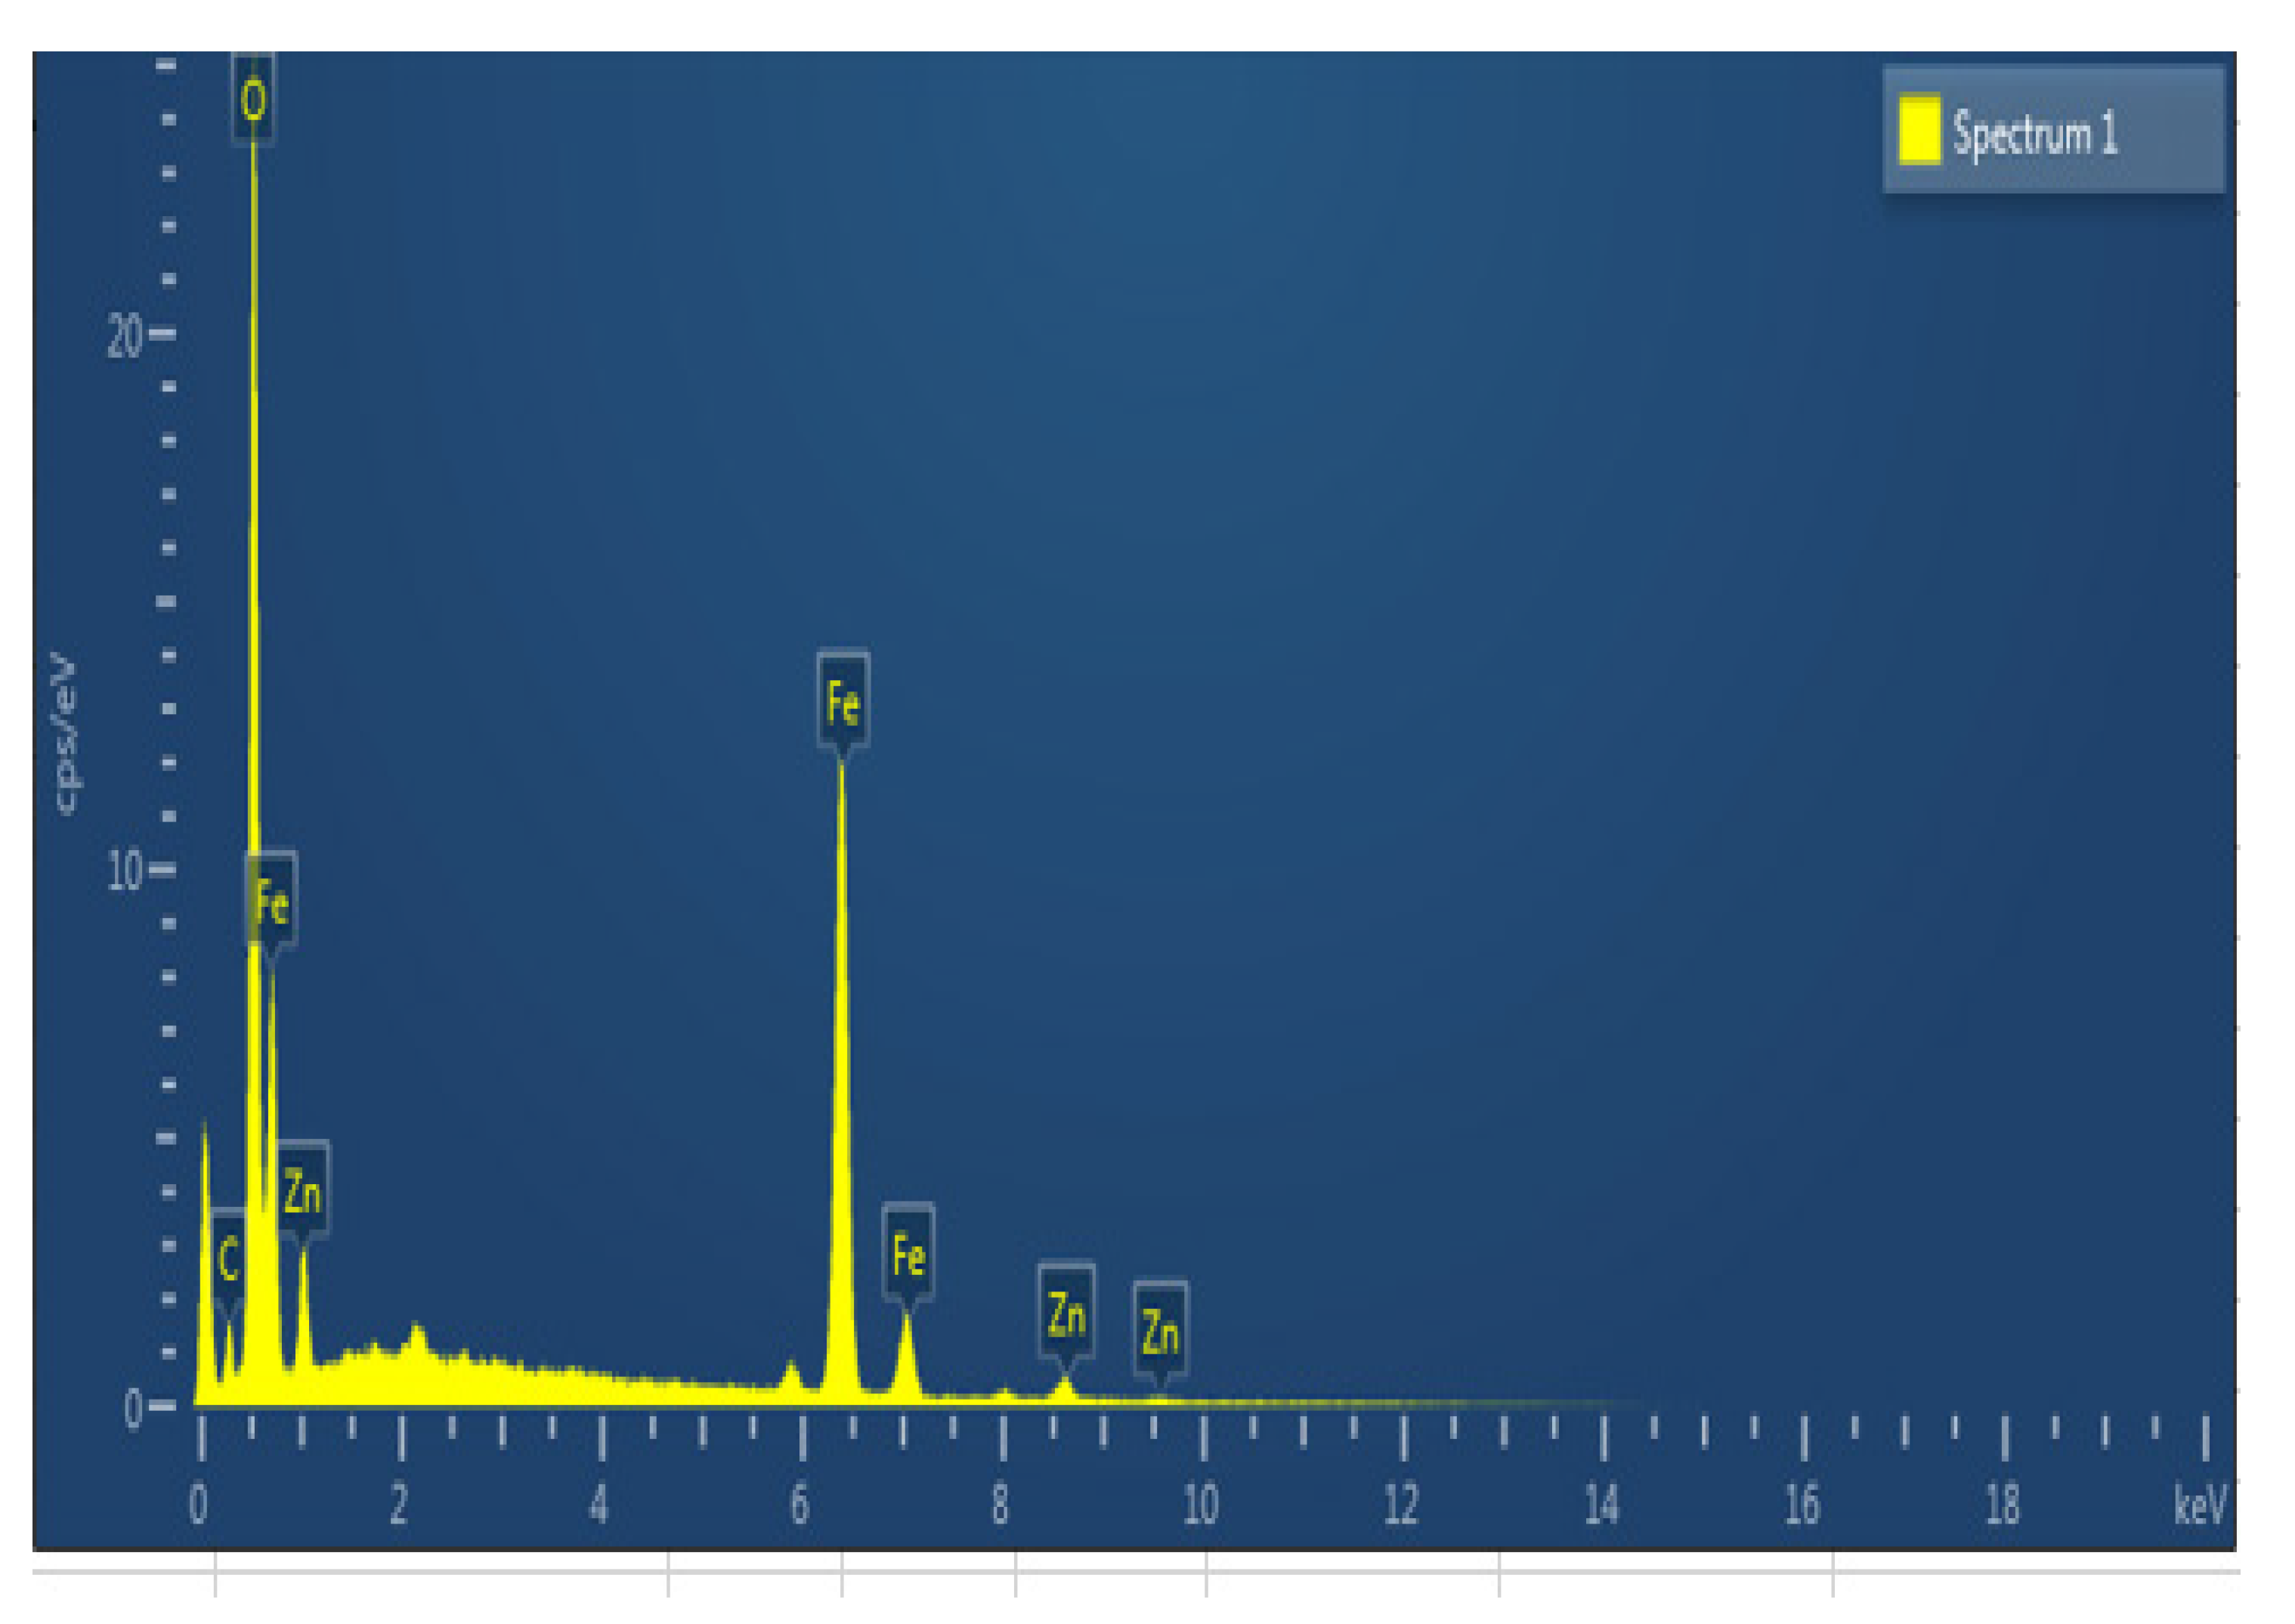
2.1.2. Energy Dispersive X-ray Spectroscopy (EDX)

EDX is considered a well-established technique for the chemical mapping of compounds and provides sufficient information regarding their elemental composition. EDX analysis was performed to quantify the elemental composition of the NPs in terms of the weight percentage of different metals. In the spectrum, different peaks were observed rendering Fe (58.07%), Zn (08%), and O (30%), which confirms the presence of expected elements in the catalyst (Figure 2).

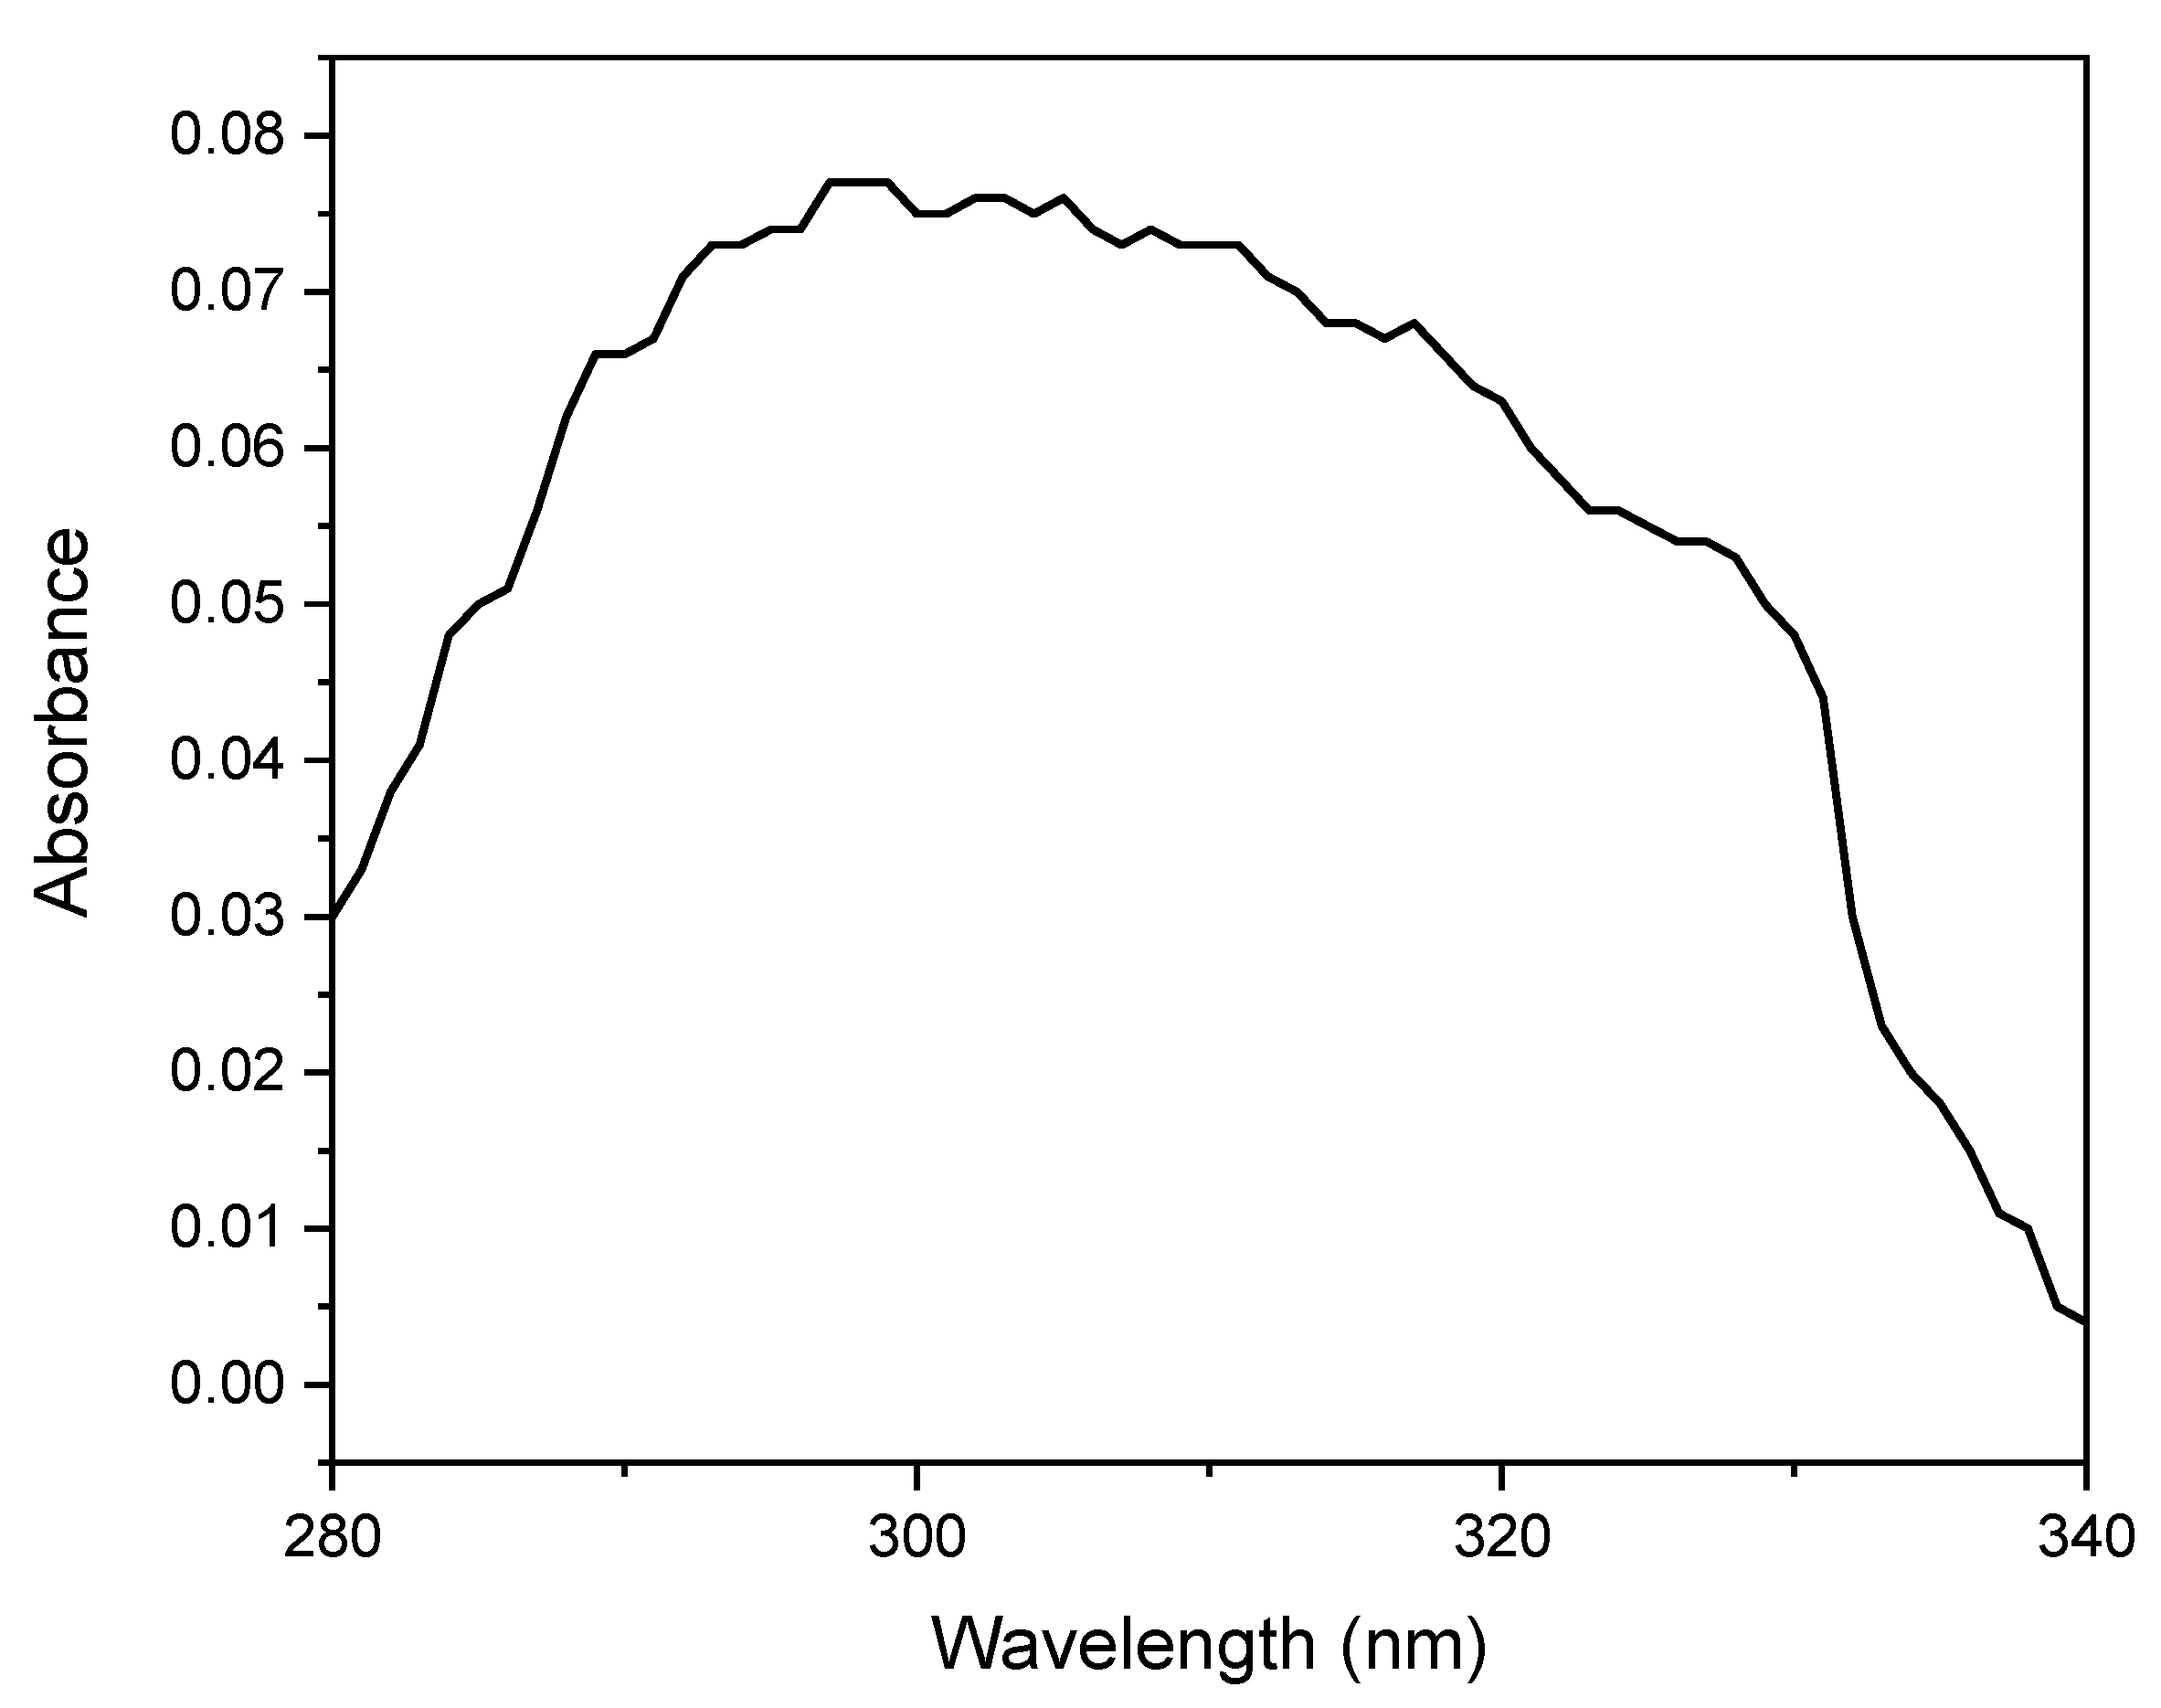
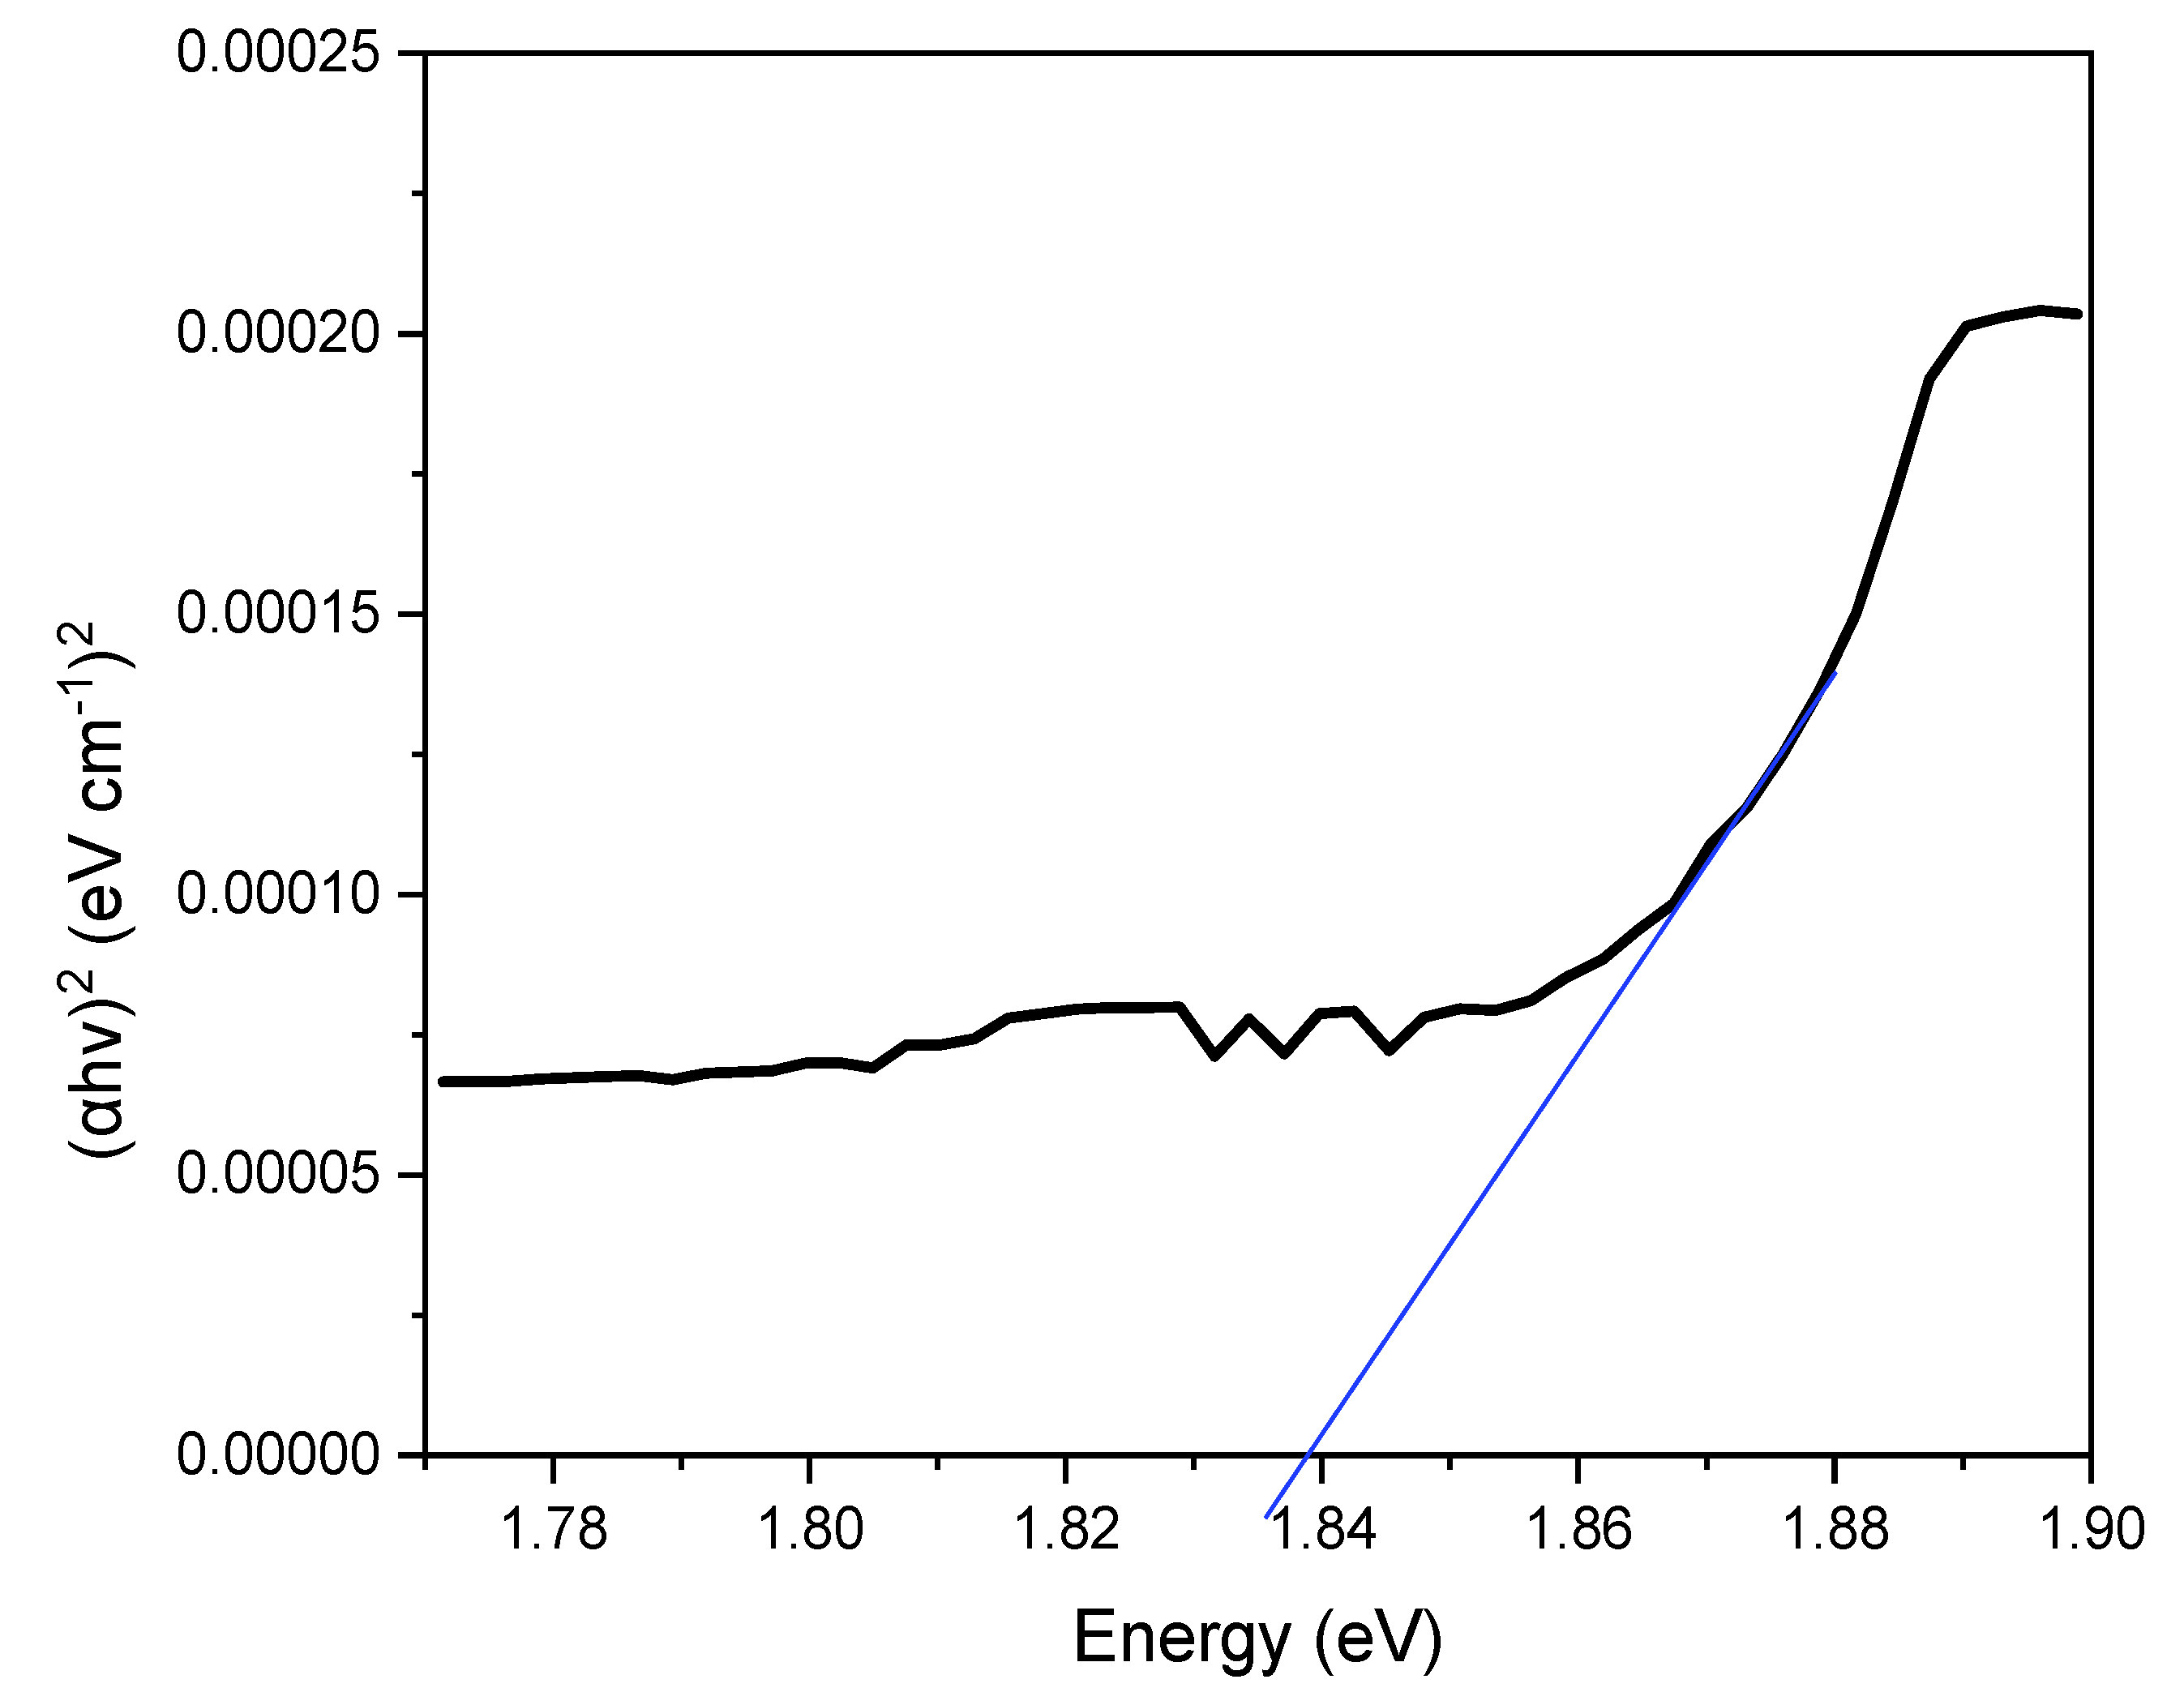
2.1.3. UV-Visible Spectrum and Tauc Plot

The UV-Visible spectrum of the Zn/iron oxide was obtained to investigate its optical properties, as shown in Figure 3. The Zn/iron oxide exhibited the maximum absorbance at 300 nm. Previous studies describe the maximum absorbance of particles with varying values in the range of 280 nm to 367 nm based on the design of synthesis and use of chemicals [17].
The band gap energy (Eg) of a photocatalyst is its pivotal characteristic while evaluating its catalytic activity. It helps to predict the region of electromagnetic radiation that is required for the photocatalytic degradation of a pollutant. More commonly Tauc plot is drawn to calculate the energy difference between the valence band and the conduction band. It is done by drawing a Tauc line to the steepest part of the spectrum that intersects the x-axis (photon energy) [18]. The relationship between “Eg” and “α” (absorption coefficient) is described in Equation (1):
α v =   C 1 ( hv   E g ) n  
C1 in Equation (1) presents a proportionality constant while the incident photon’s energy is equivalent to hv, n describes the coefficient based on electronic transition [19].
The synthesized photocatalyst’s (Zn/iron oxide) band gap was calculated to be 1.84 eV. Thus, from this value of the band gap, the light source for photocatalytic degradation was selected. As the value of the band gap obtained from the graph is 1.84, so visible light was used for the photodegradation of organic pollutants. The graph plotted between (αhv)2 vs. hυ (eV) has been used for calculating the energy band gap, as given in Figure 4.
Further the valence and conduction band positions can be calculated using Mott-Schottky plot. Behera et al., plotted the Mott-Scottky graph for Zn/iron oxide photocatalyst and determined its flat band potential which was found to be −0.09 eV (vs Reversible Hydrogen Electrode) [20]. Our case study shows a band gap value of 1.84 eV and thus the valence band position was calculated as 1.75 eV which is quite close to the values mentioned previously in literature [20].

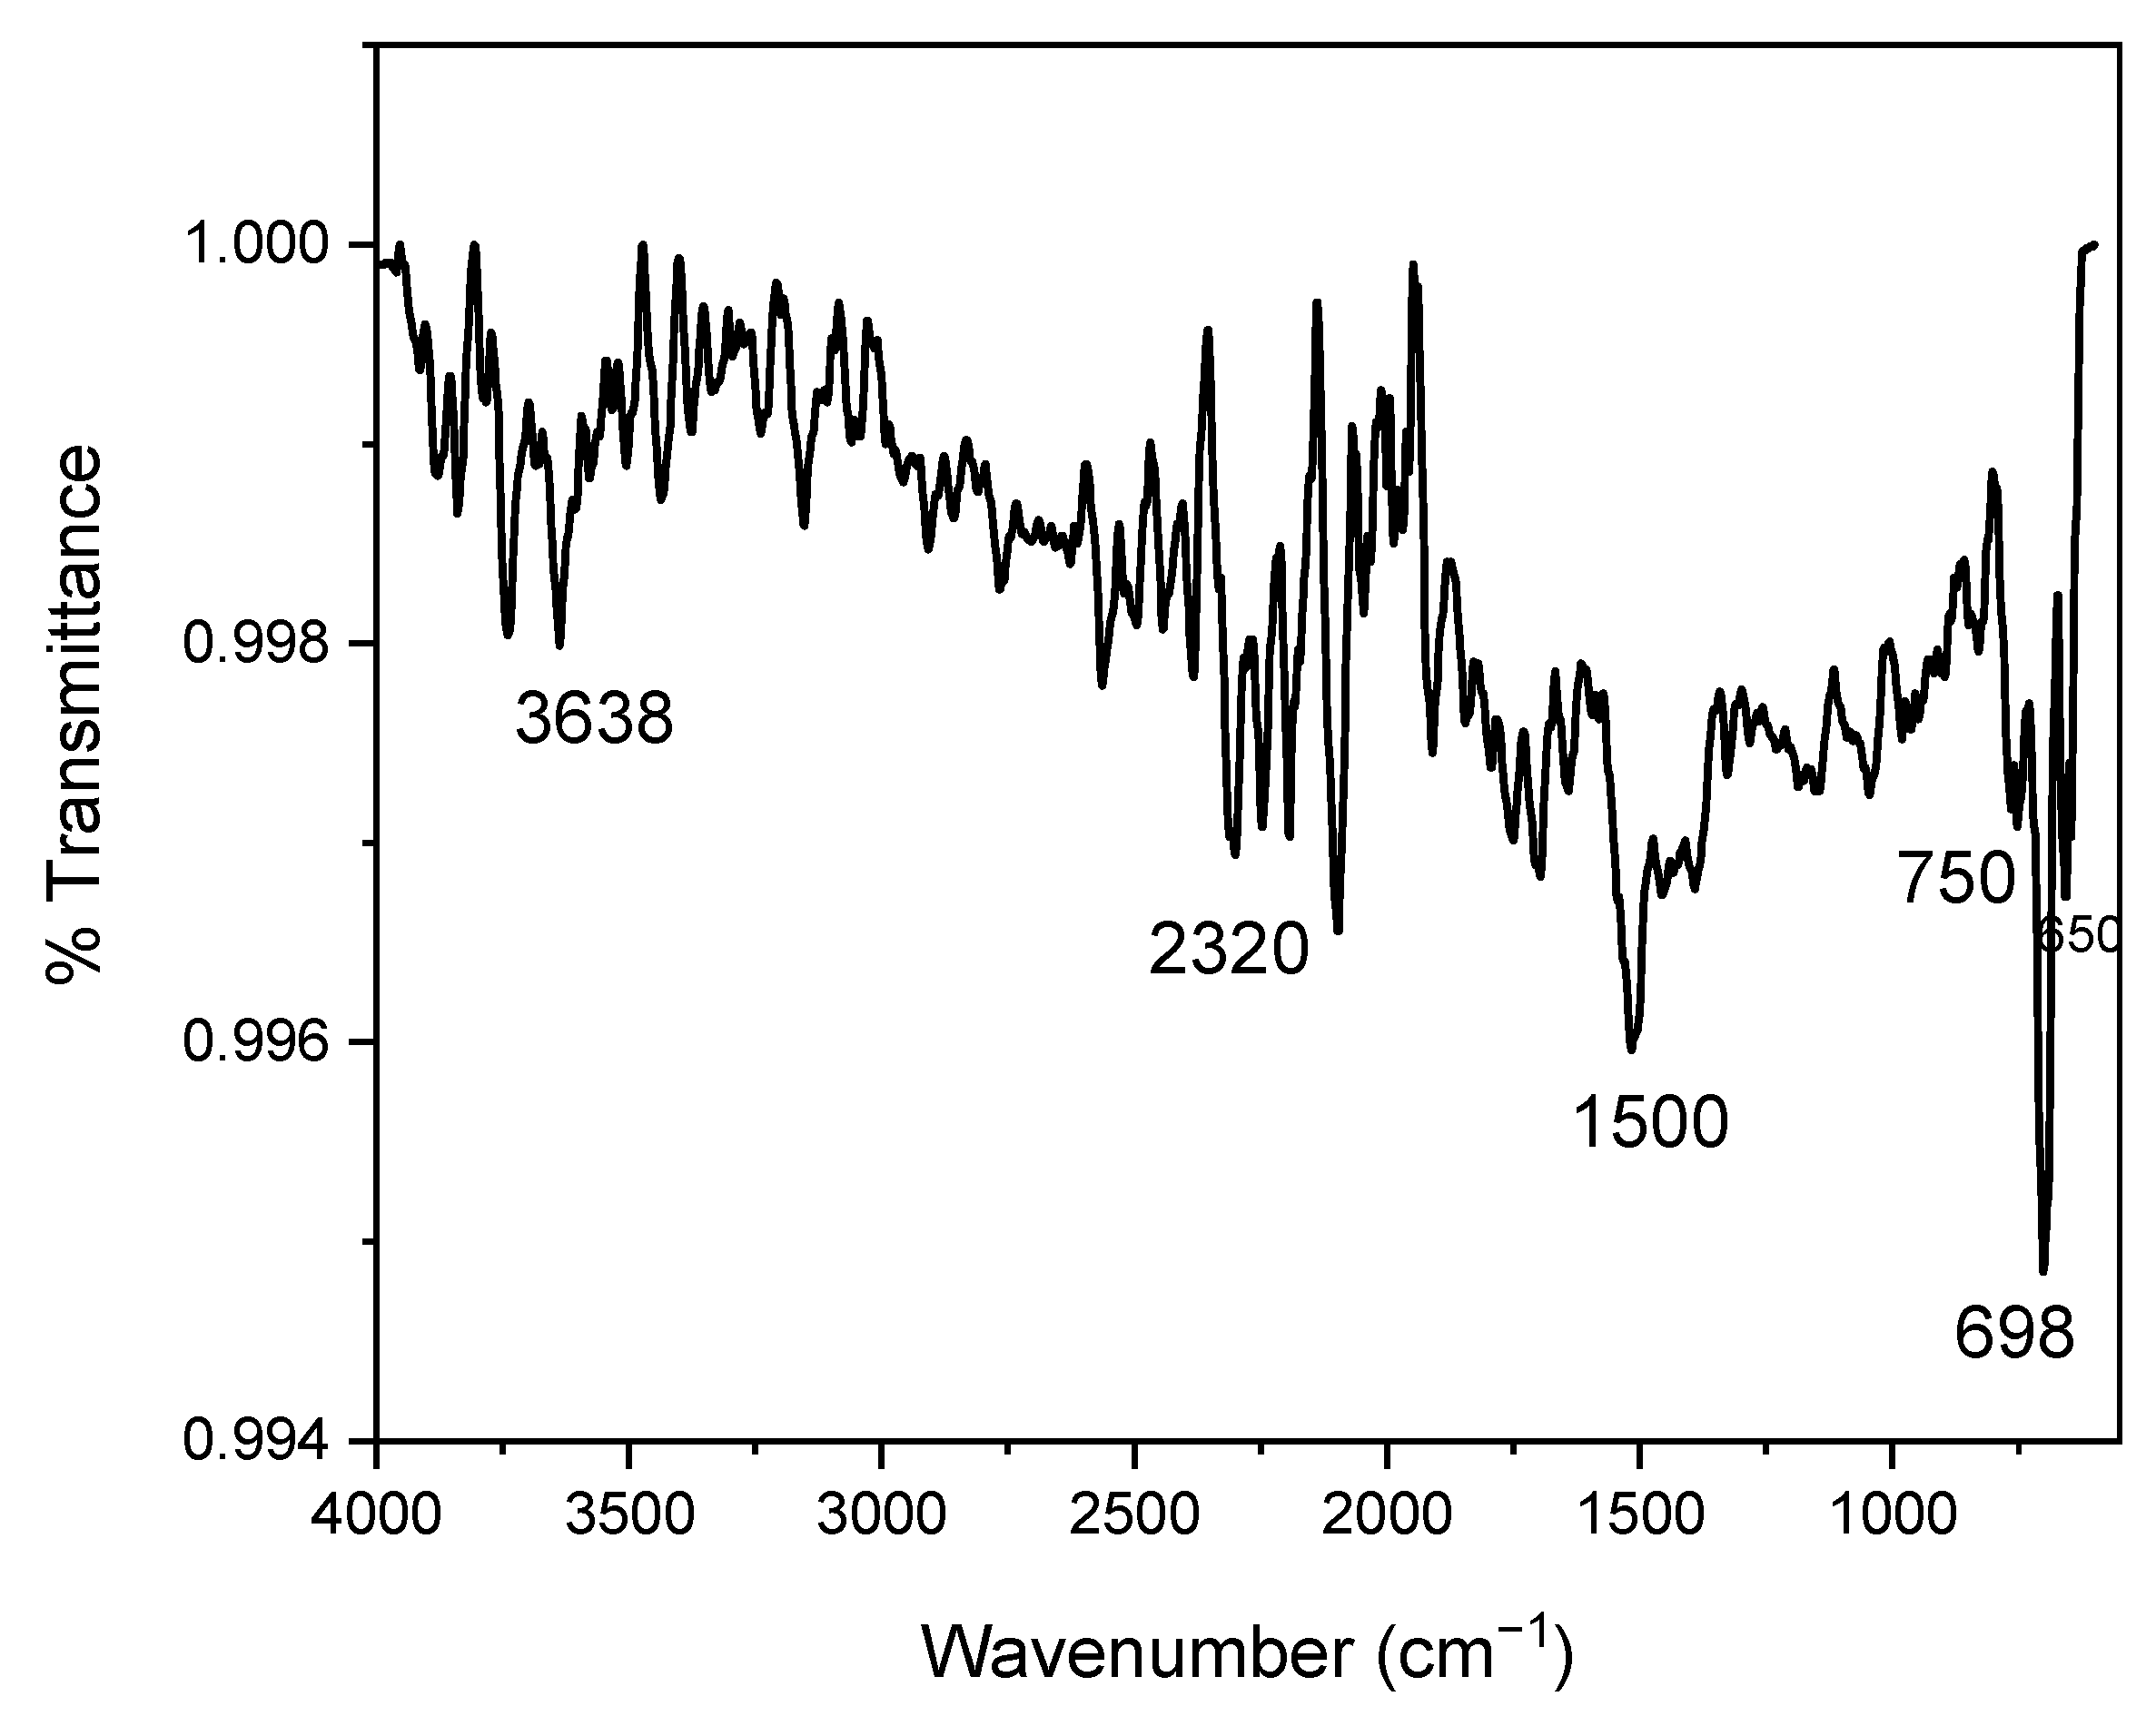
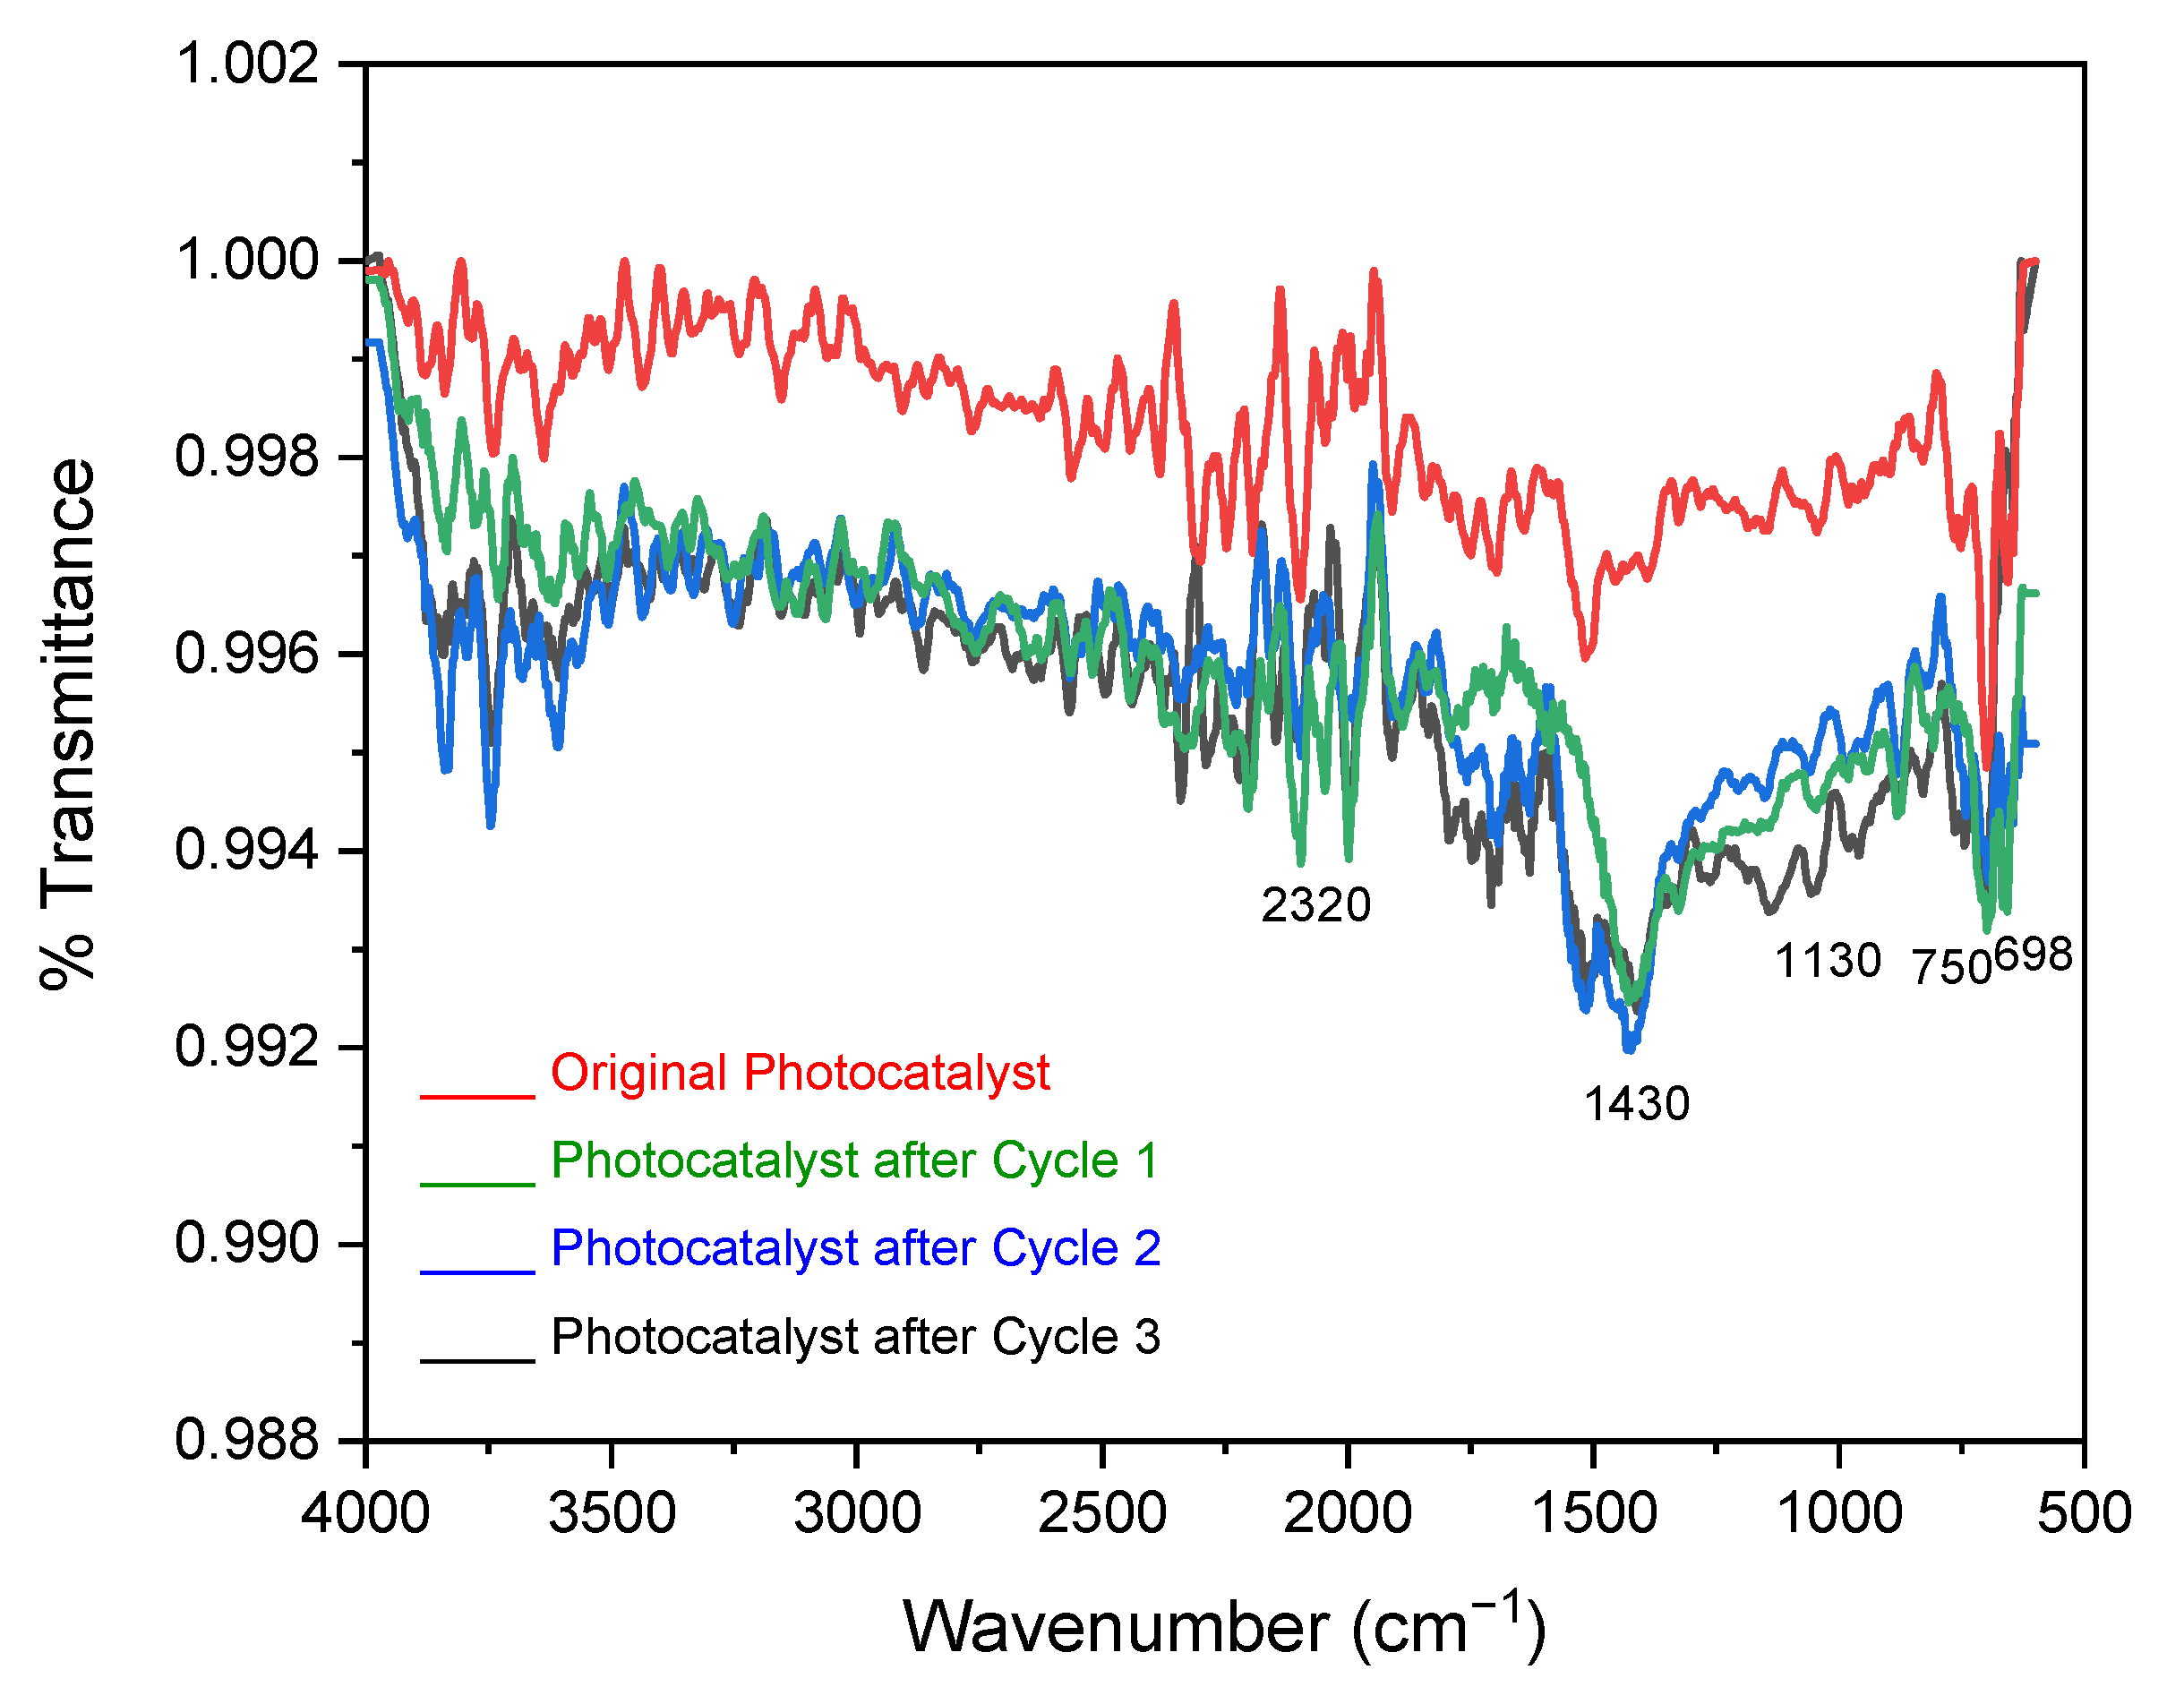
2.1.4. Fourier Transform Infrared Spectroscopic Analysis

The evaluation of chemical interaction between zinc, iron, and oxygen was performed using the FTIR spectrum. The spectrum (Figure 5) possessed three prominent bands within the range of 550 to 750 nm at positions 750, 698, and 650 nm that describe the interaction of zinc with oxygen and the vibrational mode of ferrite in a tetrahedral lattice [17,21]. A sharp band at 2320 cm−1 is generally due to the carbon dioxide in antisymmetric stretching. Non-bonded hydroxyl groups adsorbed on the surface present band 3650–3600 cm−1 and deformation vibration in the region of 1650–1500 cm−1 [20,22].

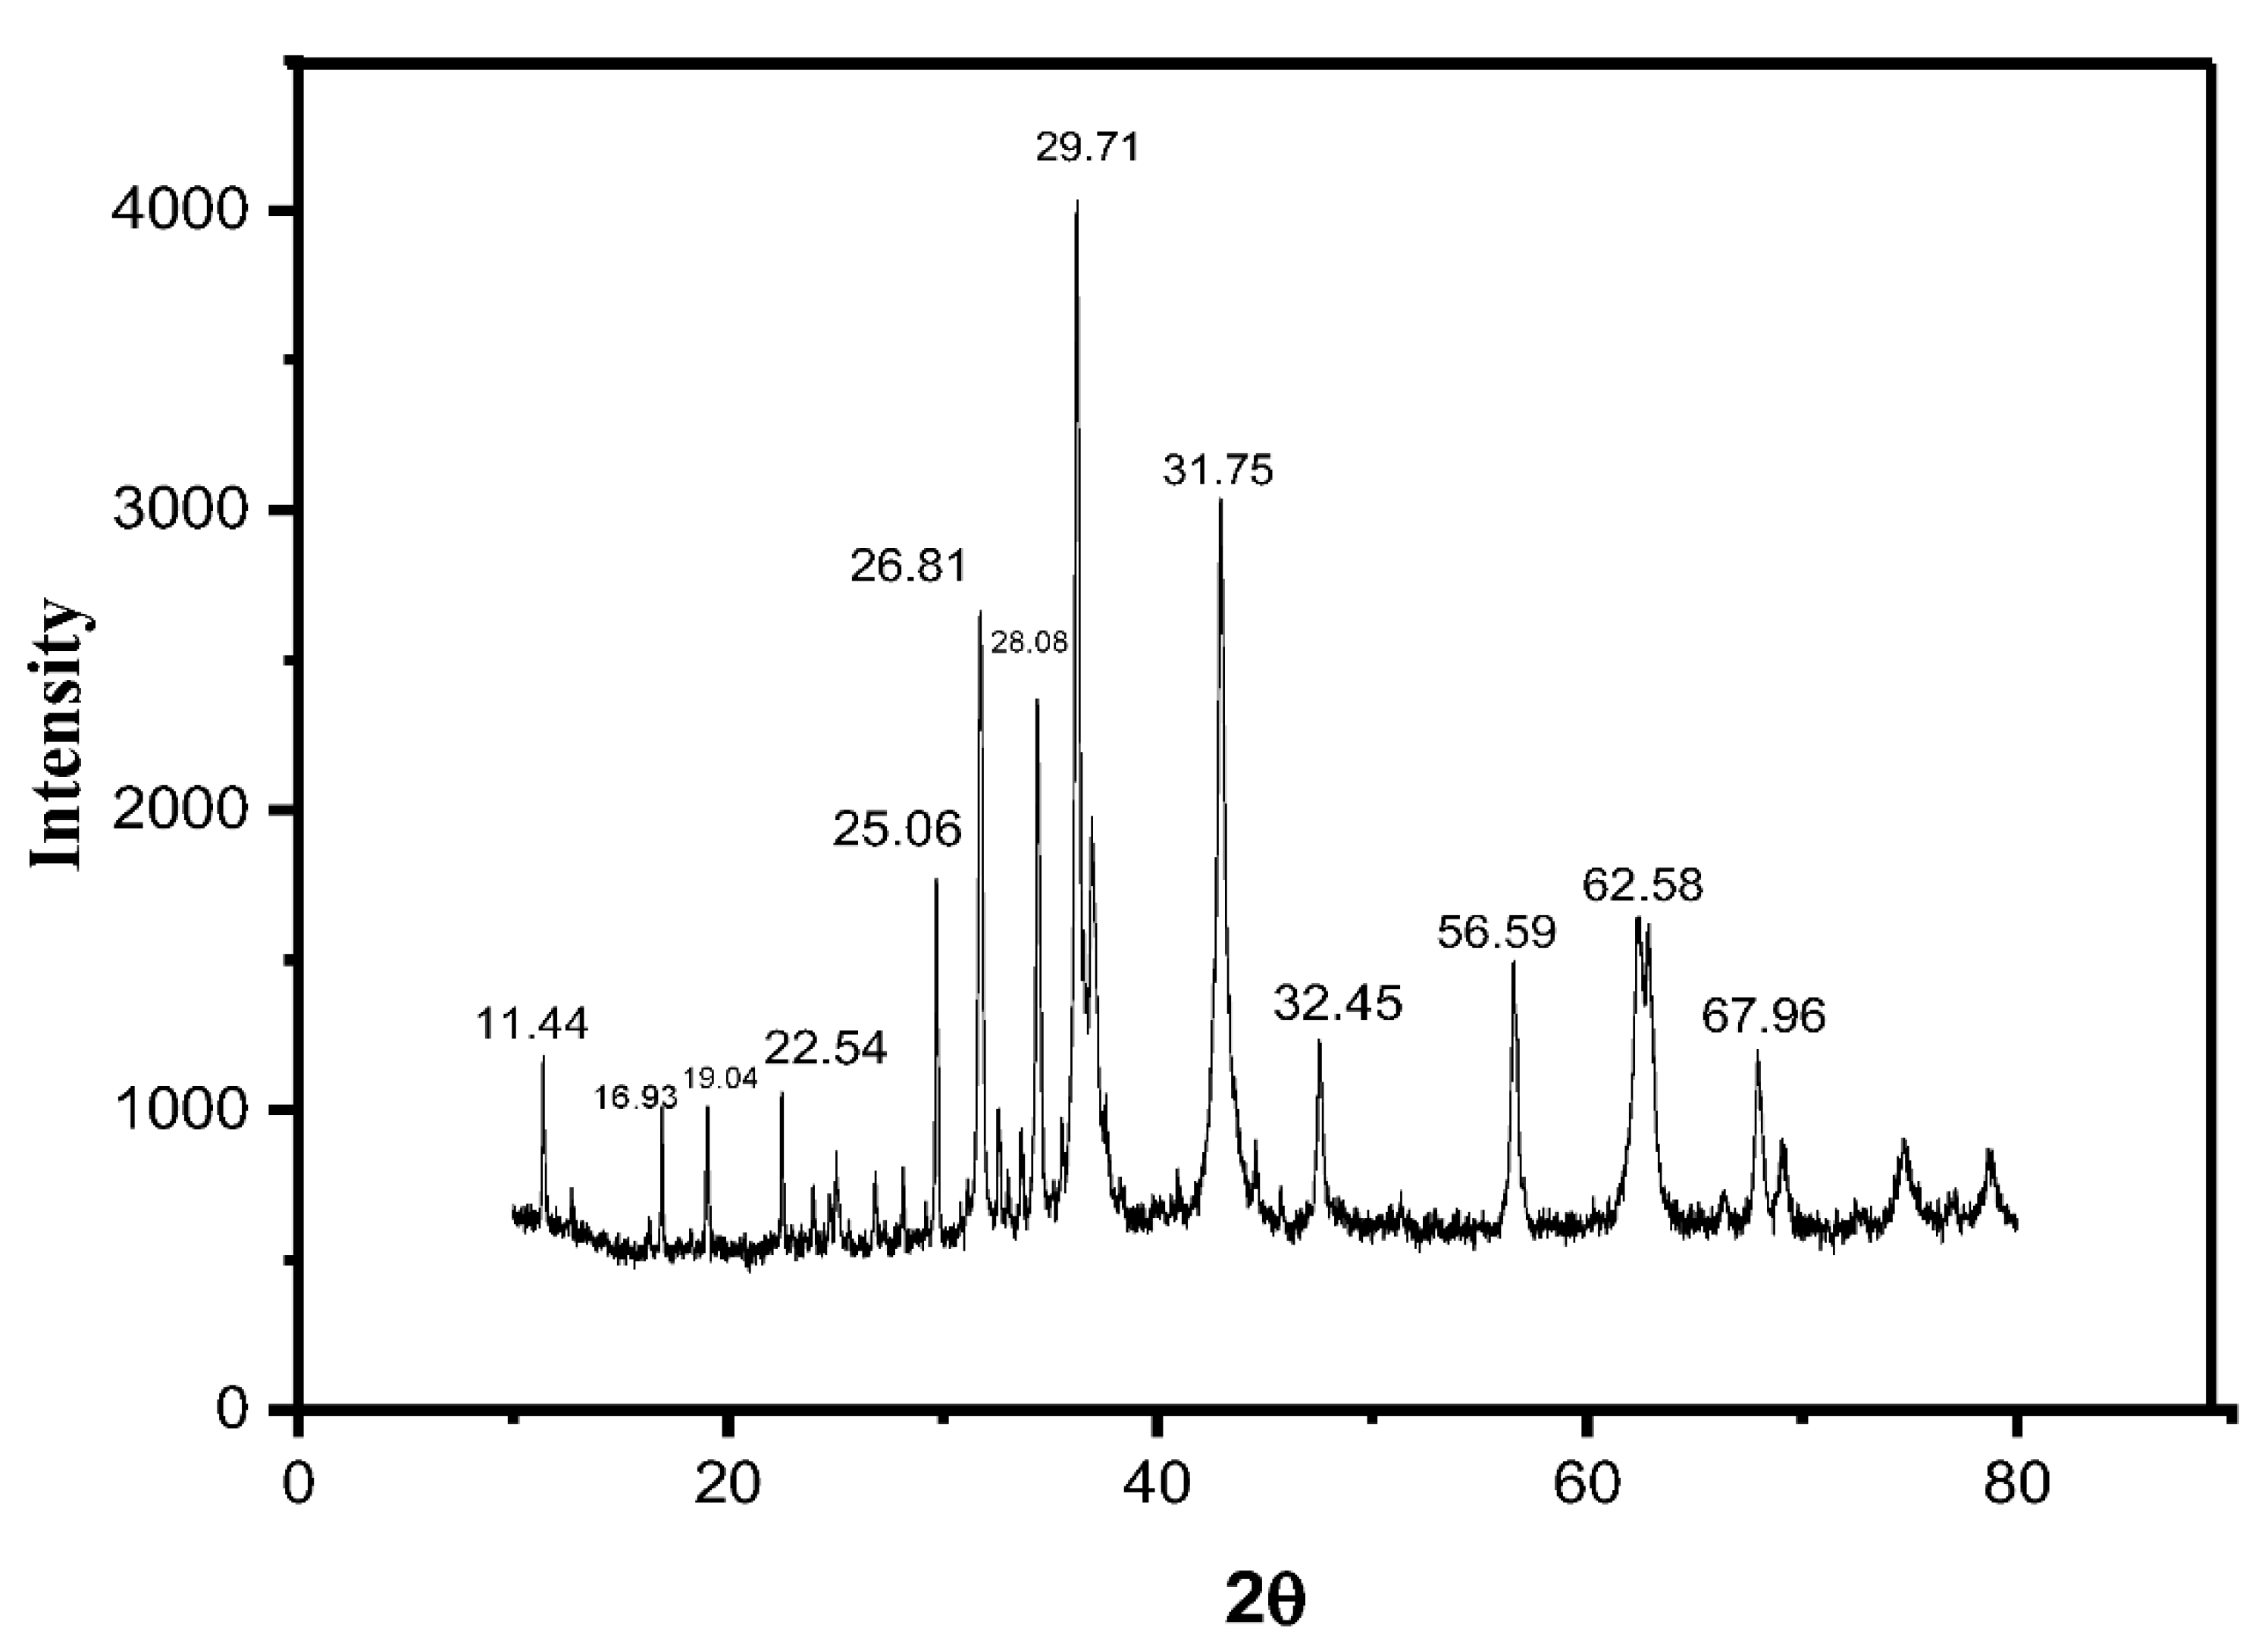
2.1.5. X-ray Diffraction Studies

The XRD spectrum in Figure 6 shows defined sharp peaks of the annealed catalyst presenting its crystalline nature. The well-defined peaks corresponding to the 2θ were 11.44° 16.93°, 19.04°, 22.54°, 25.06°, 26.81°, 28.08°, 29.71°, 31.75°, 32.45°, 56.59°, 62.58°, and 67.96°. These peaks were in accordance with the previously reported literature [23,24] having crystalline plane at 100, 101, 311,110, 440, and lattice constants a = b = 0.314 nm and c = 0.511 nm (JPCDS card number: 36-4926) [25].
The average particle size of the developed catalyst was calculated to be 20.31 nm, using FWHM of the most intense peak corresponding to 100 planes located at 29.71° using Scherrer’s formula [26].
Debye-Scherrer formula = (d) = Diameter of nanoparticle = 0.89λ/βcosθ
where 0.89 = Scherrer’s constant, λ = wavelength of X-rays, θ = Bragg diffraction angle, and β is the full width at half-maximum (FWHM) of the diffraction peak corresponding to plane <101>.
Data were matched for crystal-phase identification and smoothed for background using X’Pert High Score Plot Software, zinc oxide was found in cubic planes while octahedral symmetry was observed for iron oxide particles. These results are in accordance with EDX in terms of elements present as well shown in Figure 2.

2.2. Optimization of Experimental Parameters for Pollutants

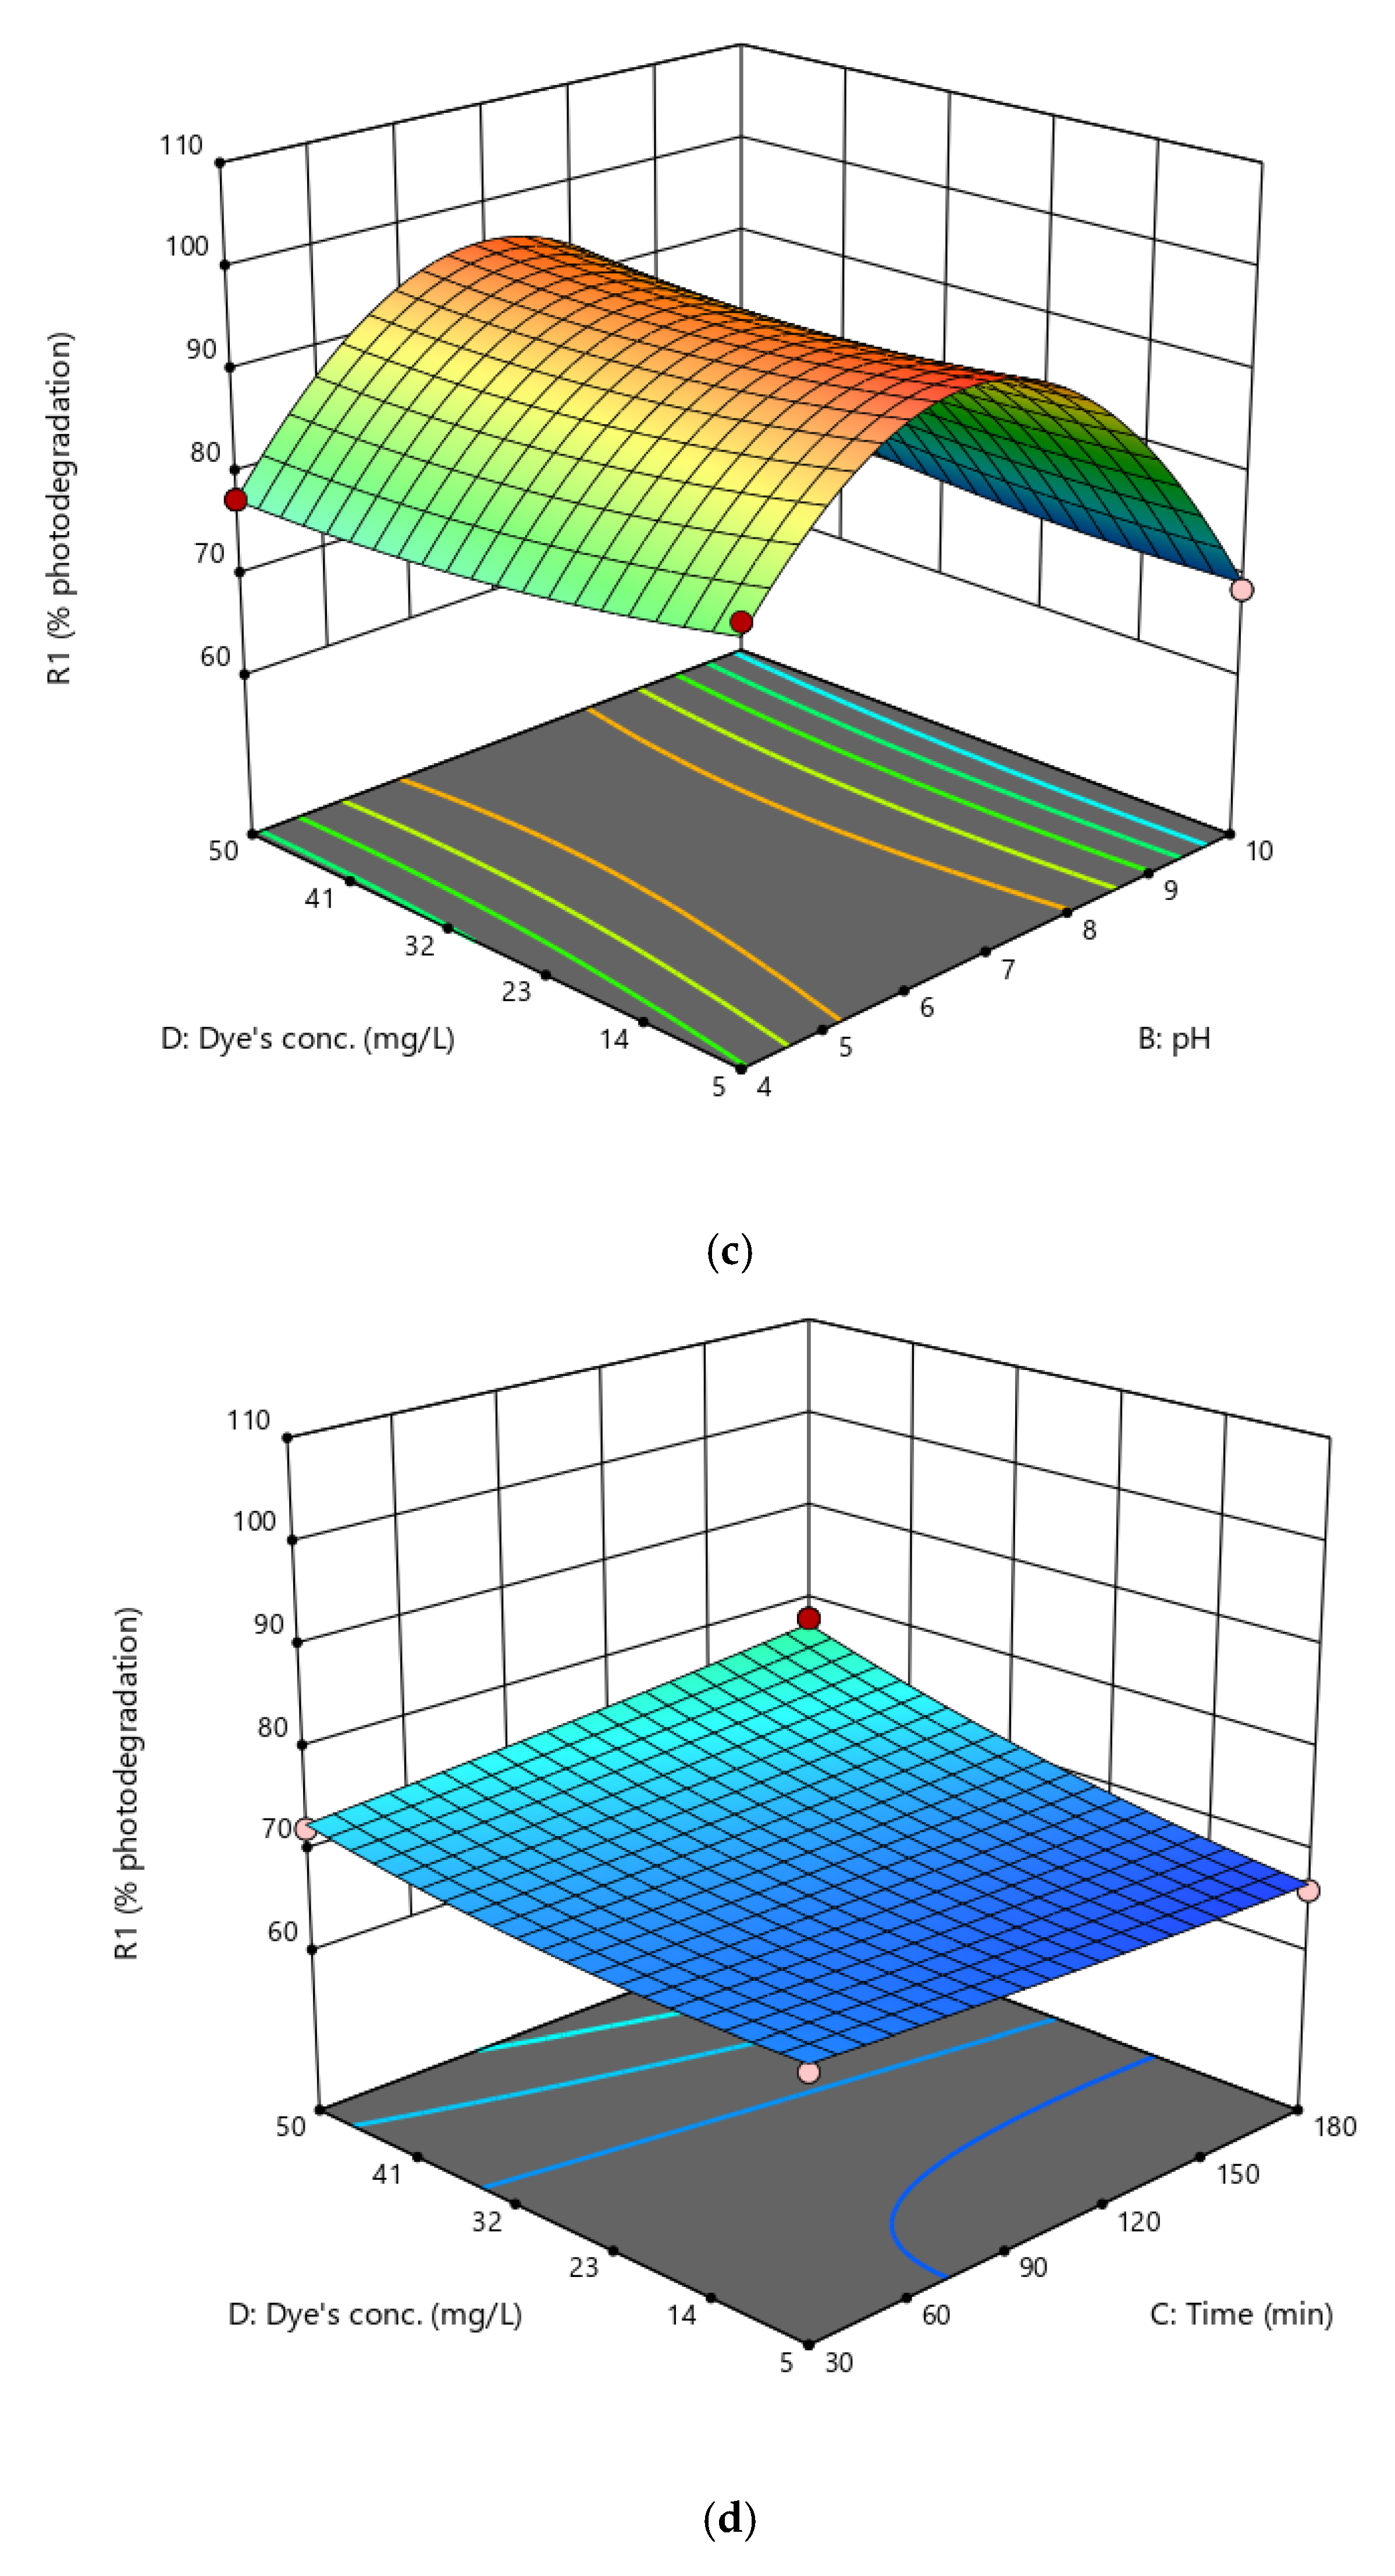
2.2.1. Response Surface Methodology of Brilliant Green (BG) Dye

Response surface methodology (RSM) is based on fitting mathematical models (linear, square polynomial functions, and others) to experimental results from a designed set of experiments and statistically validating the model. The primary goal of RSM is to obtain the system’s optimal operational conditions or to acquire a region that meets the operating specifications. Six steps are involved in the simulation and optimization of physicochemical processes using RSM: (1) screening of independent factors and selection of desired responses, (2) selecting an experimental design strategy, (3) conducting the experiments and gathering the results, (4) fitting the obtained mathematical model to experimental data, (5) verifying the model using graphs and analysis of variance, and (6) determining the optimal conditions [27].
Response surface methodology was used in this study to assess photodegradation efficiency (dependent variable) and to increase the experiment’s cost-effectiveness. Four different parameters were chosen, including concentrations (conc.) between 10 and 50 mgL−1, pH values between 4 and 10, the time between 5 and 100 min, and catalyst doses between 100 and 120 mg for brilliant green dye.
The quadratic model was followed by the regression analysis.
Y = β 0 + i = 0 n β i X i + i = 0 n β i i X i 2 + i i = 1 n β i j X i X j + ε
In the above model equation, “Y” represents the predicted response, β 0 = intercept, while β i , β i i , β i j , and ε are linear, quadratic, interactive model coefficients and random error, respectively.
Equation of the model in terms of coded parameters is shown (Equation (3)):
Sqrt (R1) = +9.43 − 0.0285 × A + 0.8991 × B + 0.0904 × C + 0.0215 × D + 0.0425 × AB − 0.0297 × AC − 0.0451 × AD − 0.0735 × BC + 0.0301 × BD + 0.0033 × CD + 0.0079 × A2 − 0.7822 × B2 − 0.0137 × C2 + 0.0079 × BD2
Equation of the model in terms of actual parameters (Equation (4)):
Sqrt (R1) = +2.80384 − 0.000745 × catalystdose + 1.52120 × pH + 0.004435 × t − 0.000776 × conc. + 0.000210 × catalystdose × pH − 5.87195 × 10⁻³ × catalyst dose × t − 0.000030 × catalyst dose × conc. − 0.000327 × pH × t + 0.000445 × pH × conc. + 1.92617 × 10⁻⁶ × t × conc. + 1.73860 × 10⁻⁶ × catalystdose2 − 0.086912 × pH2 −2.43540 × 10⁻⁶ × t2 + 0.000016 × conc.2
The quadratic model’s applicability was confirmed by an ANOVA statistical analysis with a Fisher’s F-value of 121.96 and a p-value of <0.0001. The lack of fit was not significant with a p-value of 0.5117. Less than 0.05 p-values indicate that the terms are significant, while values greater than 0.1 indicate that the parameter is not significant. A low p-value and a high F-value were used to select the significant terms in the model [28].
The predicted value of R2 (0.9484) agreed with the adjusted R2 value (0.9849), and the difference between both values was less than 0.2. R2 values above 0.8 indicated the agreement between the empirical data and the results of the relevant equations [29].
The optimum values of the parameters calculated from the model were as: pH 7.9, time 111.1, catalyst dose 25.6, concentration of dye 45.5, and the predicted percentage photodegradation of brilliant green dye was 94.31%. The predicted value of binding capacity was compared with the experimental value (93%) and found quite close to each other as shown in Table 1.
Regression equations are graphically represented by 3D response surface plots (Figure 7). The primary objective of the response surface is to efficiently search for the variable values that will maximize the response. The two test variables that are maintained at their respective zero levels for the other two in each contour curve represent a number of combinations. The surface contained within the contour diagram’s smallest ellipse represents the maximum predicted value [30].

2.2.2. RSM of Congo Red Dye

The optimization of experimental parameters to obtain maximum photodegradation of congo red dye was also performed in a similar fashion to BG dye. Four different parameters with the same ranges were selected i.e., concentration ranging from 10 to 50 mgL−1, pH ranging from 4 to 10, time ranging from 5 to 100 min, and catalyst dose ranging from 100 to 120 mgL−1 (Table 2). The experimental set, in this case, followed the quadratic model too as described in Section 2.2.1.
The final equation of the model in terms of coded parameters is described by Equation (5).
Sqrt (R1) = +9.78 + 0.0068 × A − 0.3632 × B + 0.1012 × C + 0.0774 × D − 0.0478 × AB + 0.0224 × AC − 0.0076 × AD − 0.0513 × BC + 0.1224 × BD + 0.1095 × CD + 0.0455 × A2 − 1.14 × B2 + 0.0164 × C2 + 0.0786 × D2
The equation of the quadratic model in terms of actual parameters (Equation (6)):
Sqrt(R1) = +4.63739 − 0.000219 × catalyst dose + 1.64955 × pH + 0.000184 × t − 0.024195 × dye conc. − 0.000236 × catalyst dose × pH + 4.42349 × 10⁻⁶ catalyst dose × t − 4.98361 × 10⁻⁶ × catalyst dose × dye conc. − 0.000228 × pH × t + 0.001813 × pH × dye conc. + 0.000065 × t × dye conc. + 9.97854 × 10⁻⁶ × catalystdose2 − 0.126933 × pH2 + 2.90903 × 10⁻⁶ × t2 + 0.000155 × dye conc.2
An ANOVA statistical analysis with a Fisher’s F-value of 105.5 and a p-value of <0.0001 confirmed the applicability of the quadratic model. The lack of fit was not statistically significant, with a p-value of 0.052. p-values less than 0.05 show that the terms are significant, while values higher than 0.1 show that the parameter is not significant. The terms are considered significant if they have a low p-value and a high F-value [31]. The difference between the adjusted R2 value (0.9825) and the predicted R2 value (0.9479) is less than 0.2, and both values are in agreement with each other.
The model’s optimized parameters were pH 6.9, time 105.3 min, catalyst dose 25.2 mg, and dye concentration 48.5 mgL−1. The dye’s predicted percentage photodegradation was 99%. 3D surface plots representing the relationship between the significant terms of the model are given in Figure 8.

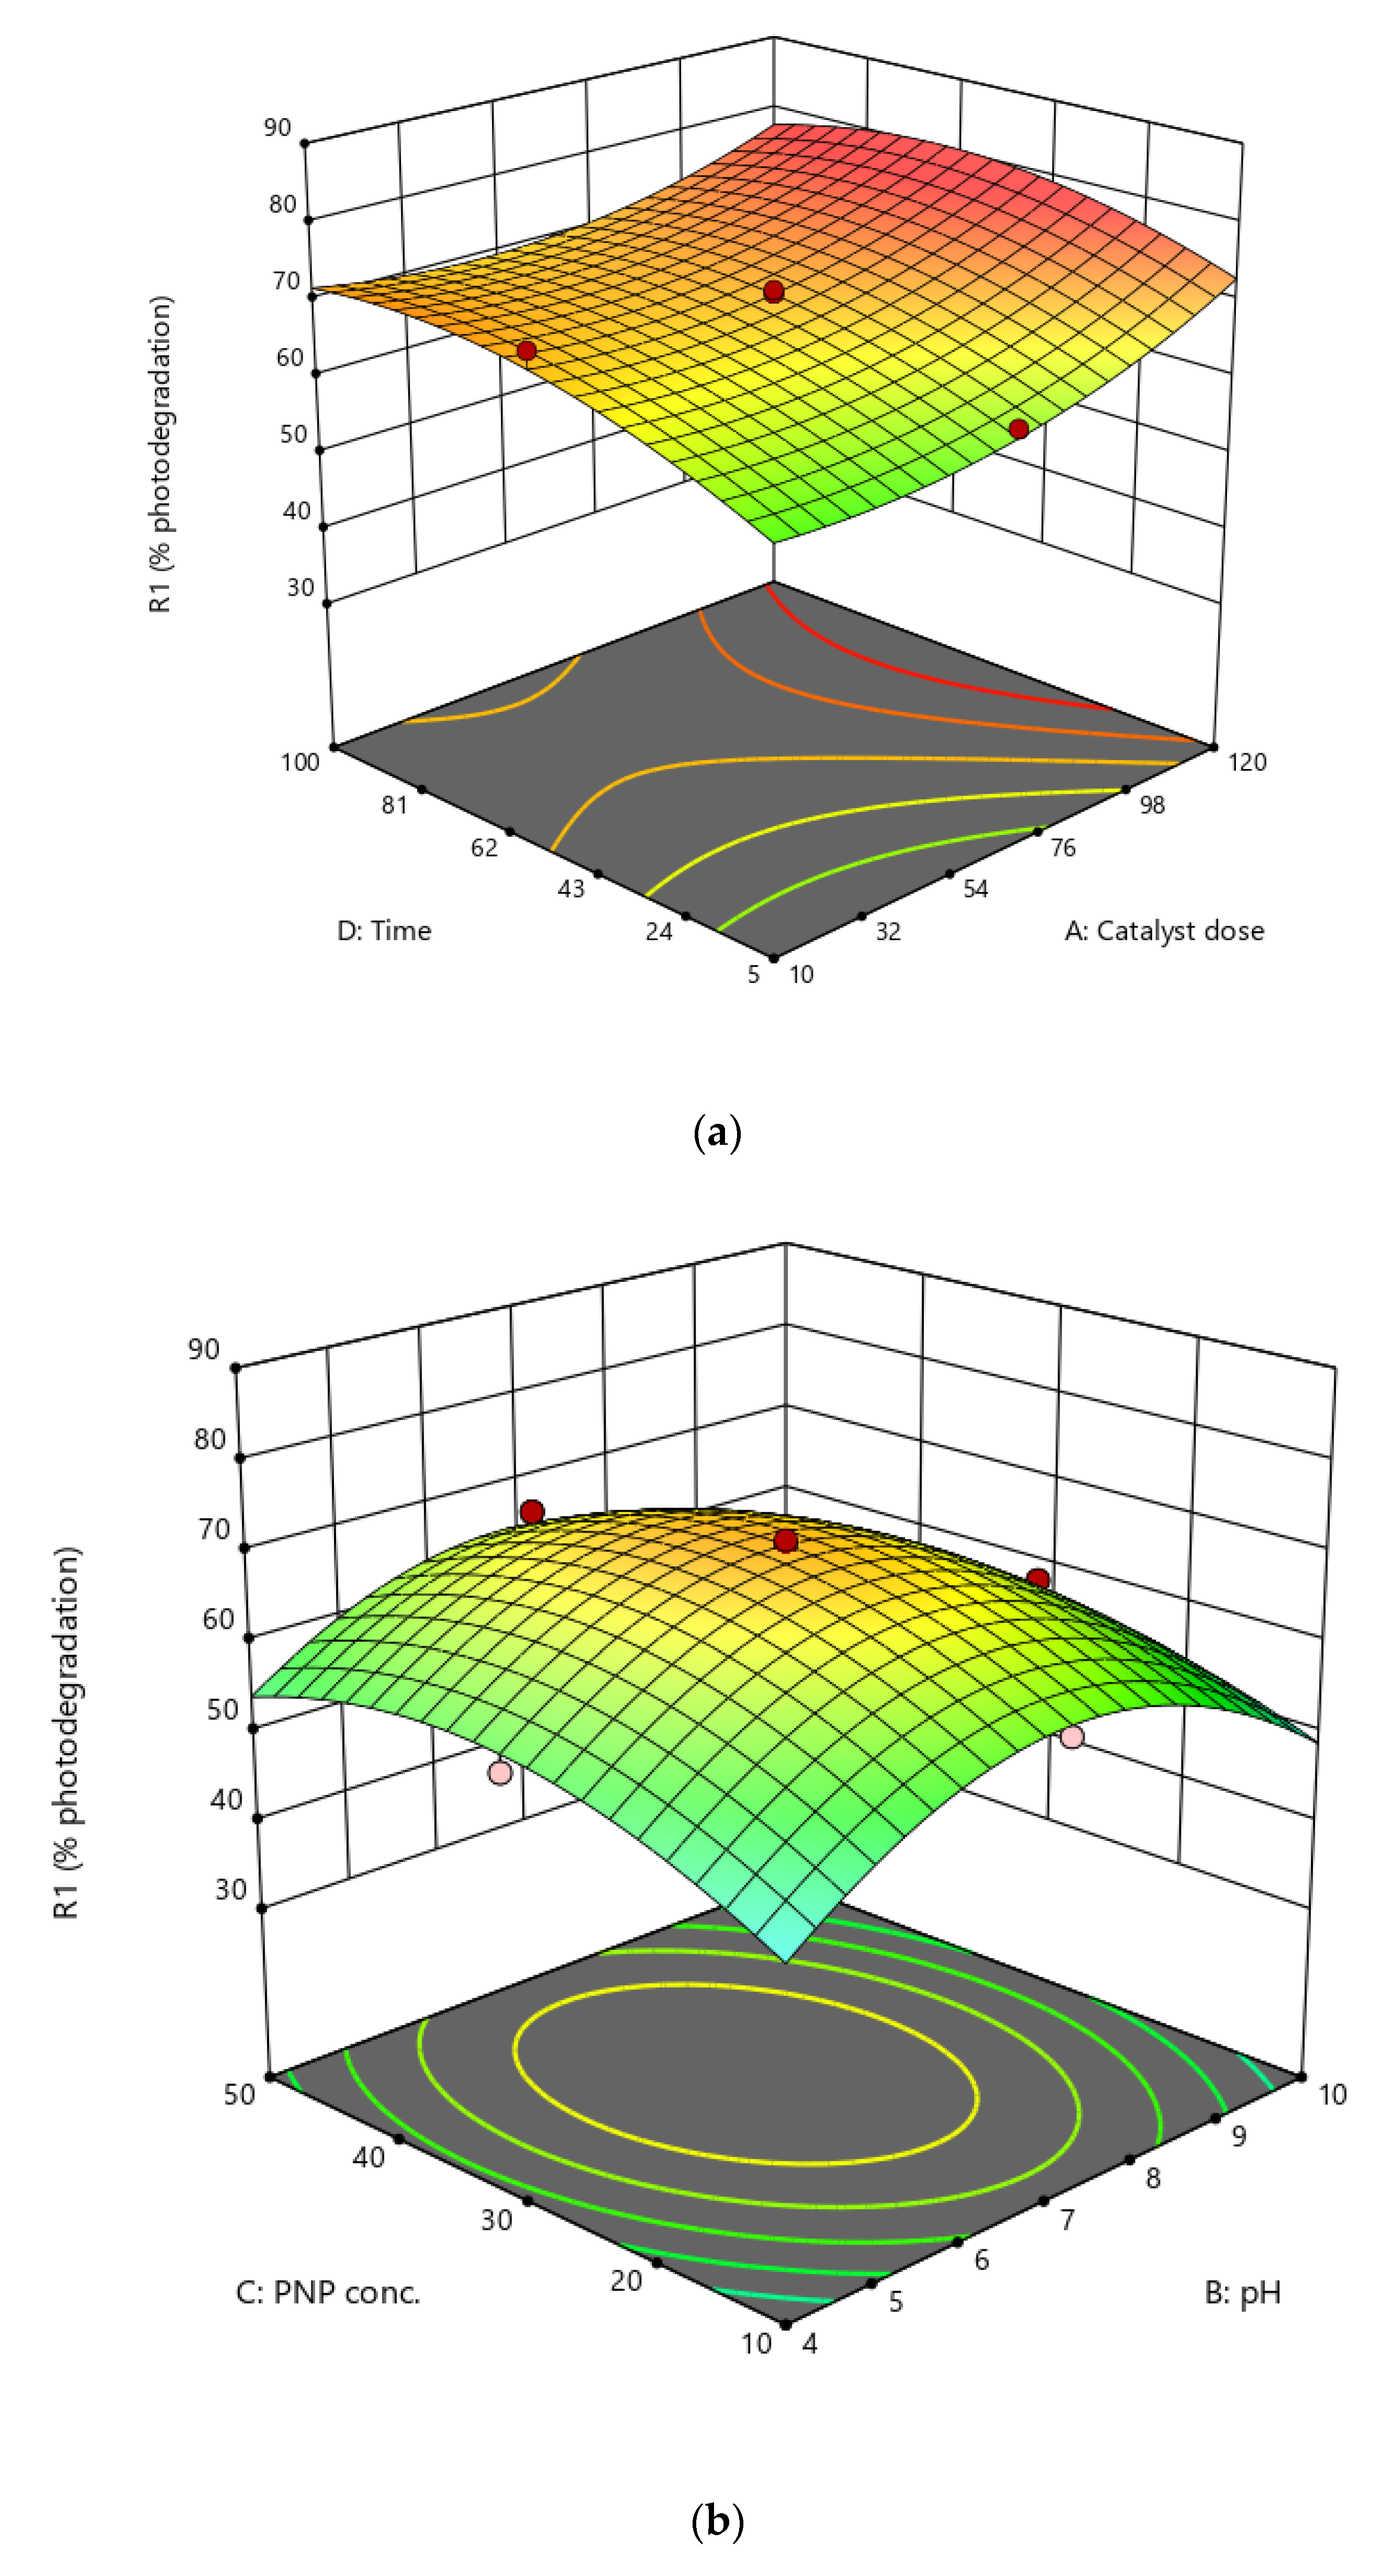
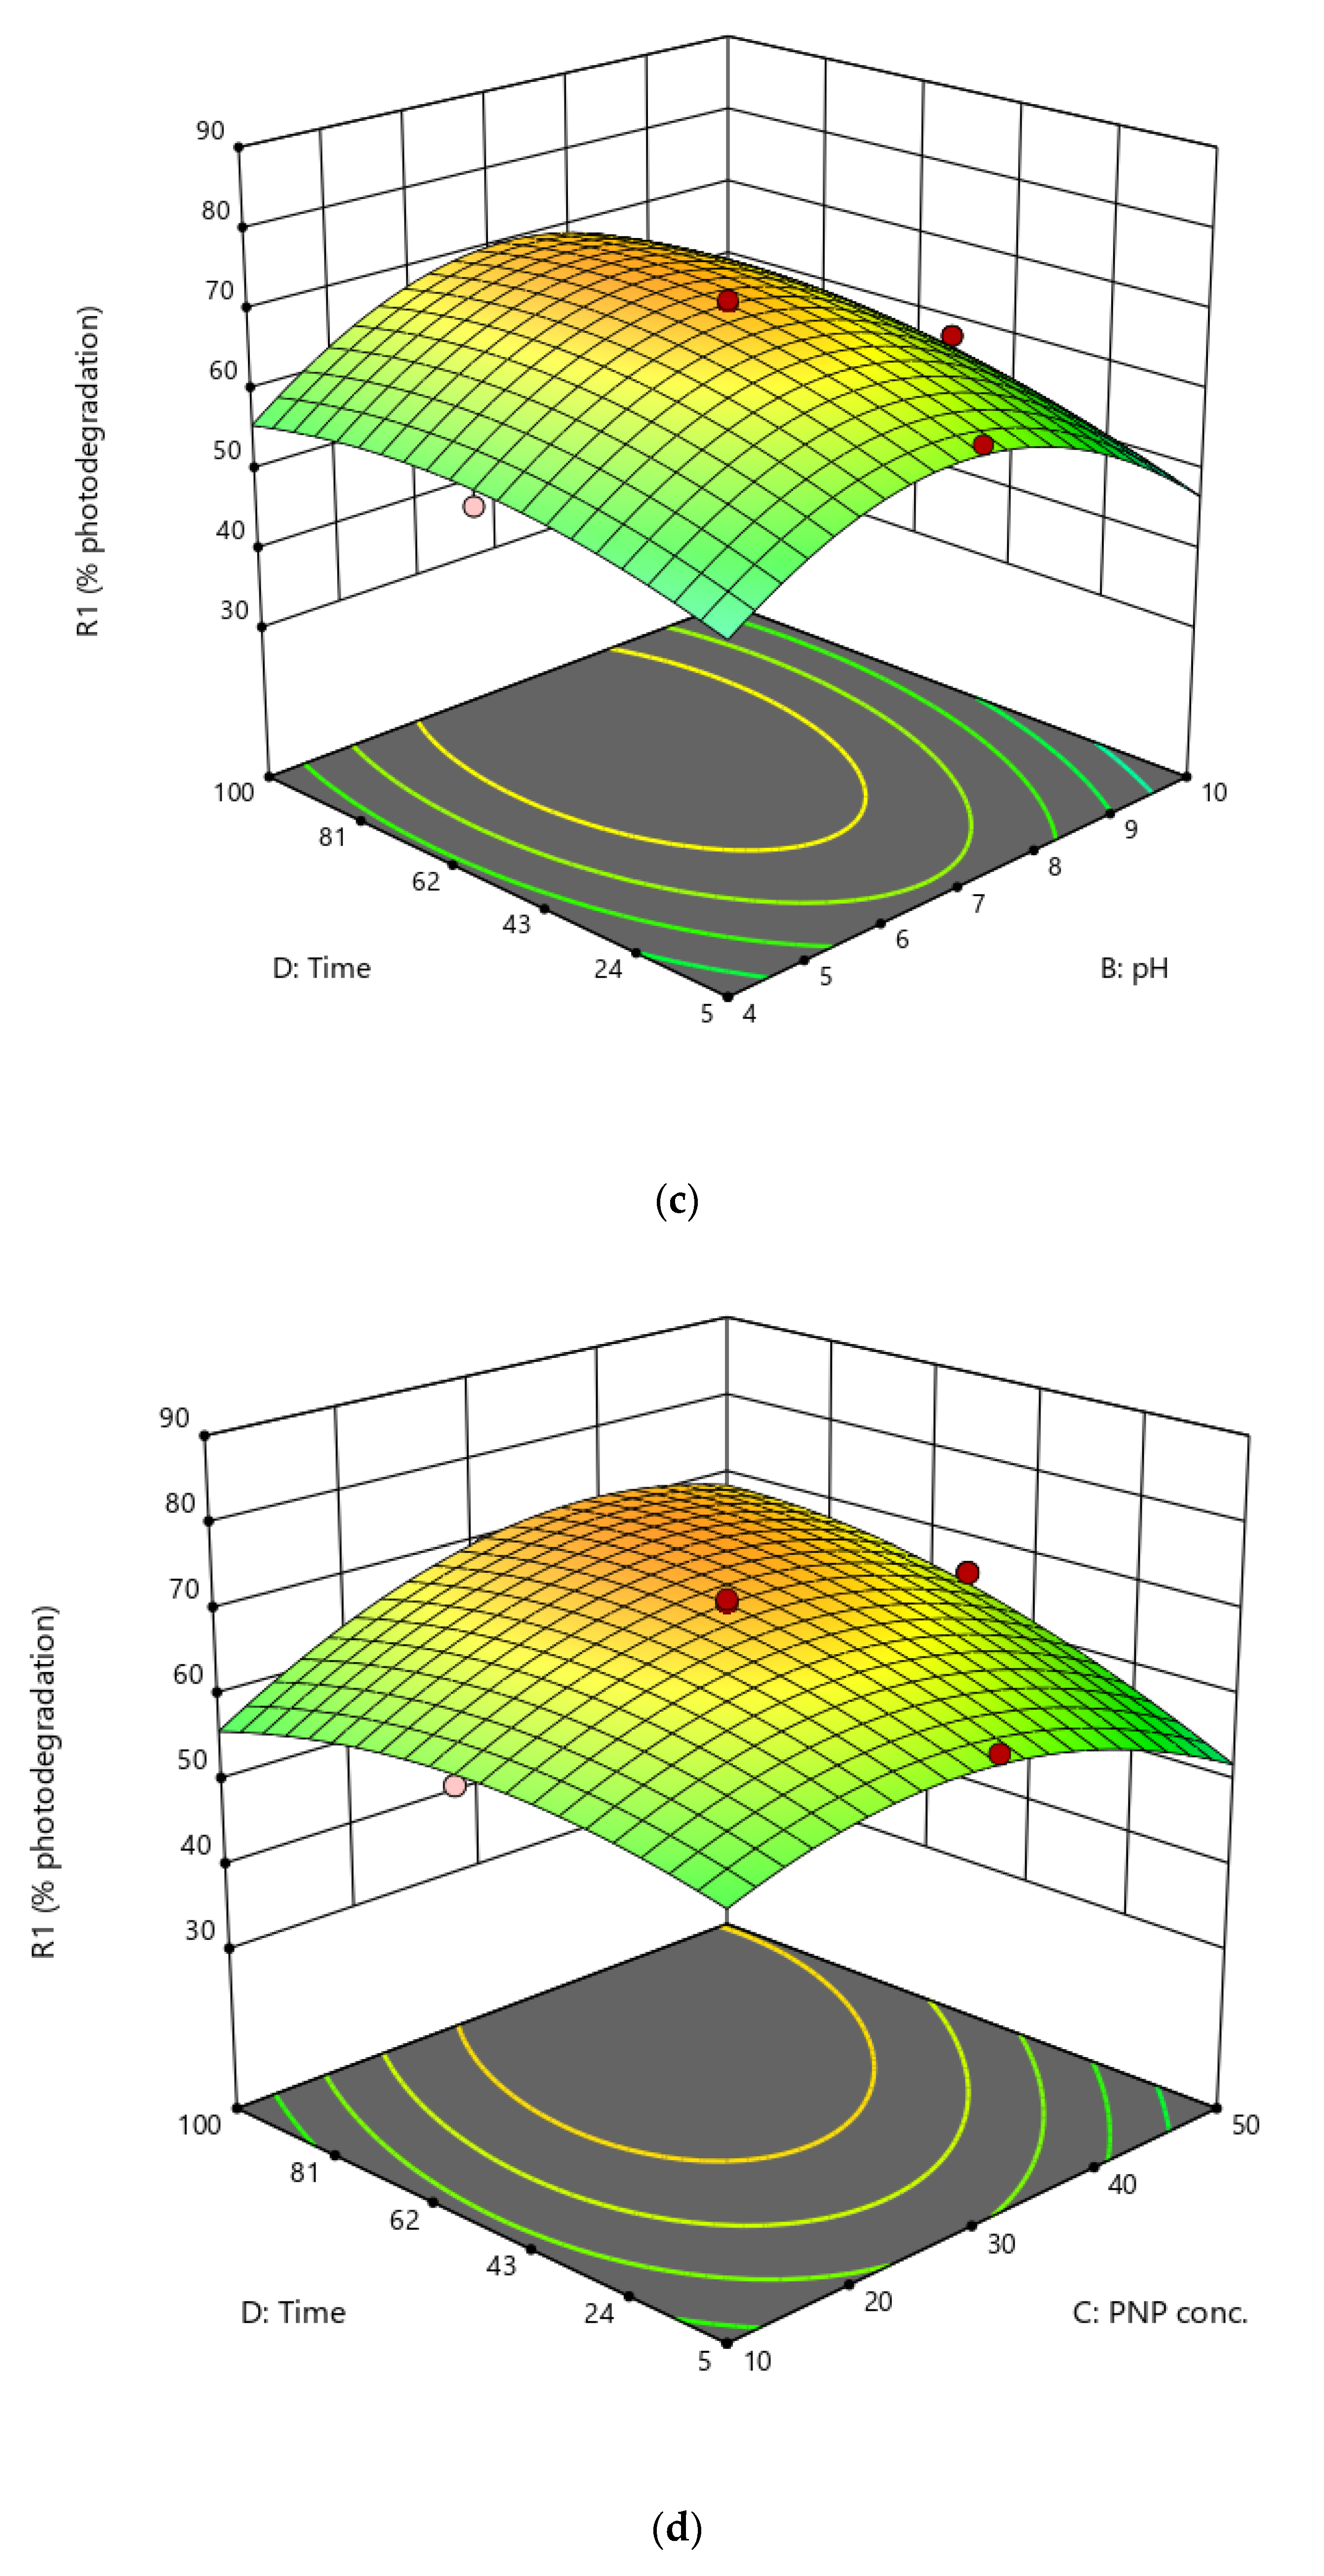
2.2.3. RSM of Para Nitro Phenol (PNP)

Response surface methodology was applied for the optimization of experimental conditions in the case of PNP degradation with the goals of designing, predicting, and optimizing the response (% degradation) affected by certain factors. RSM can be used to achieve its goals by developing an equation that includes the relationship between the independent variables (inputs) and the response (output) [29]. Four different parameters were selected such as concentration ranging from 10–50 mgL−1, pH in the ranges of 4–10, time in the ranges of 5–100 min, and catalyst dose ranging from 100–120 mg (Table 3). The quadratic model was followed by the regression analysis.
The Equation (7) of the model in terms of coded factors is described
Sqrt(R1) = +0.2 + 0.2771 × A − 0.0732 × B + 0.108 × C + 0.2420 × D + 0.0582 × AB − 0.0011 × AC − 0.1048 × AD − 0.1134 × BC + 0.1069 × BD + 0.2900 × CD + 0.2641 × A2 − 0.8676 × B2 − 0.4888 × C2 − 0.2861 × D2
Equation (8) in terms of actual parameters is given as
Sqrt(R1) = +0.241160 − 0.006643 × catalystdose + 1.31956 × pH + 0.076011 × PNP conc. + 0.006608 × t + 0.000353 × catalystdose × pH − 1.00719 × 10⁻⁶ × catalystdose × PNP conc. − 0.000040 × catalystdose × t − 0.001891 × pH × PNP conc. + 0.000750 × pH × t + 0.000305 × PNPconc. × t + 0.000087 × catalystdose2 − 0.096395 × pH2 − 0.001222 × PNPconc.2 − 0.000127 × t2
ANOVA statistical analysis confirmed the applicability of the quadratic model with Fisher’s F-value of 41.07 and p-value of <0.0001. The predicted value of R2 was 0.8548, which agreed with the adjusted value (0.9557) of R2 because the difference is less than 0.2. R2 greater than 0.8 indicated that the empirical data agreed with the one obtained using the relevant equations [32].
The lack of fit was not-significant, with a p-value of 0.0659. 3-dimensional RSM contour plots depict the inter-parameter interactions (Figure 9). The third parameter was maintained at its optimum value to find the interaction effects between each pair of variables and their optimum values were shown by using 3D surface plots. The model-derived optimal values for the four parameters were pH 7.1, time (t) 94 min, catalyst dose 112.5 mg, and dye concentration 39.5 mgL−1. Phenol’s predicted percentage photodegradation was 78.1. The experimental value (79.8) and the predicted value of binding capacity were compared and found closely related.

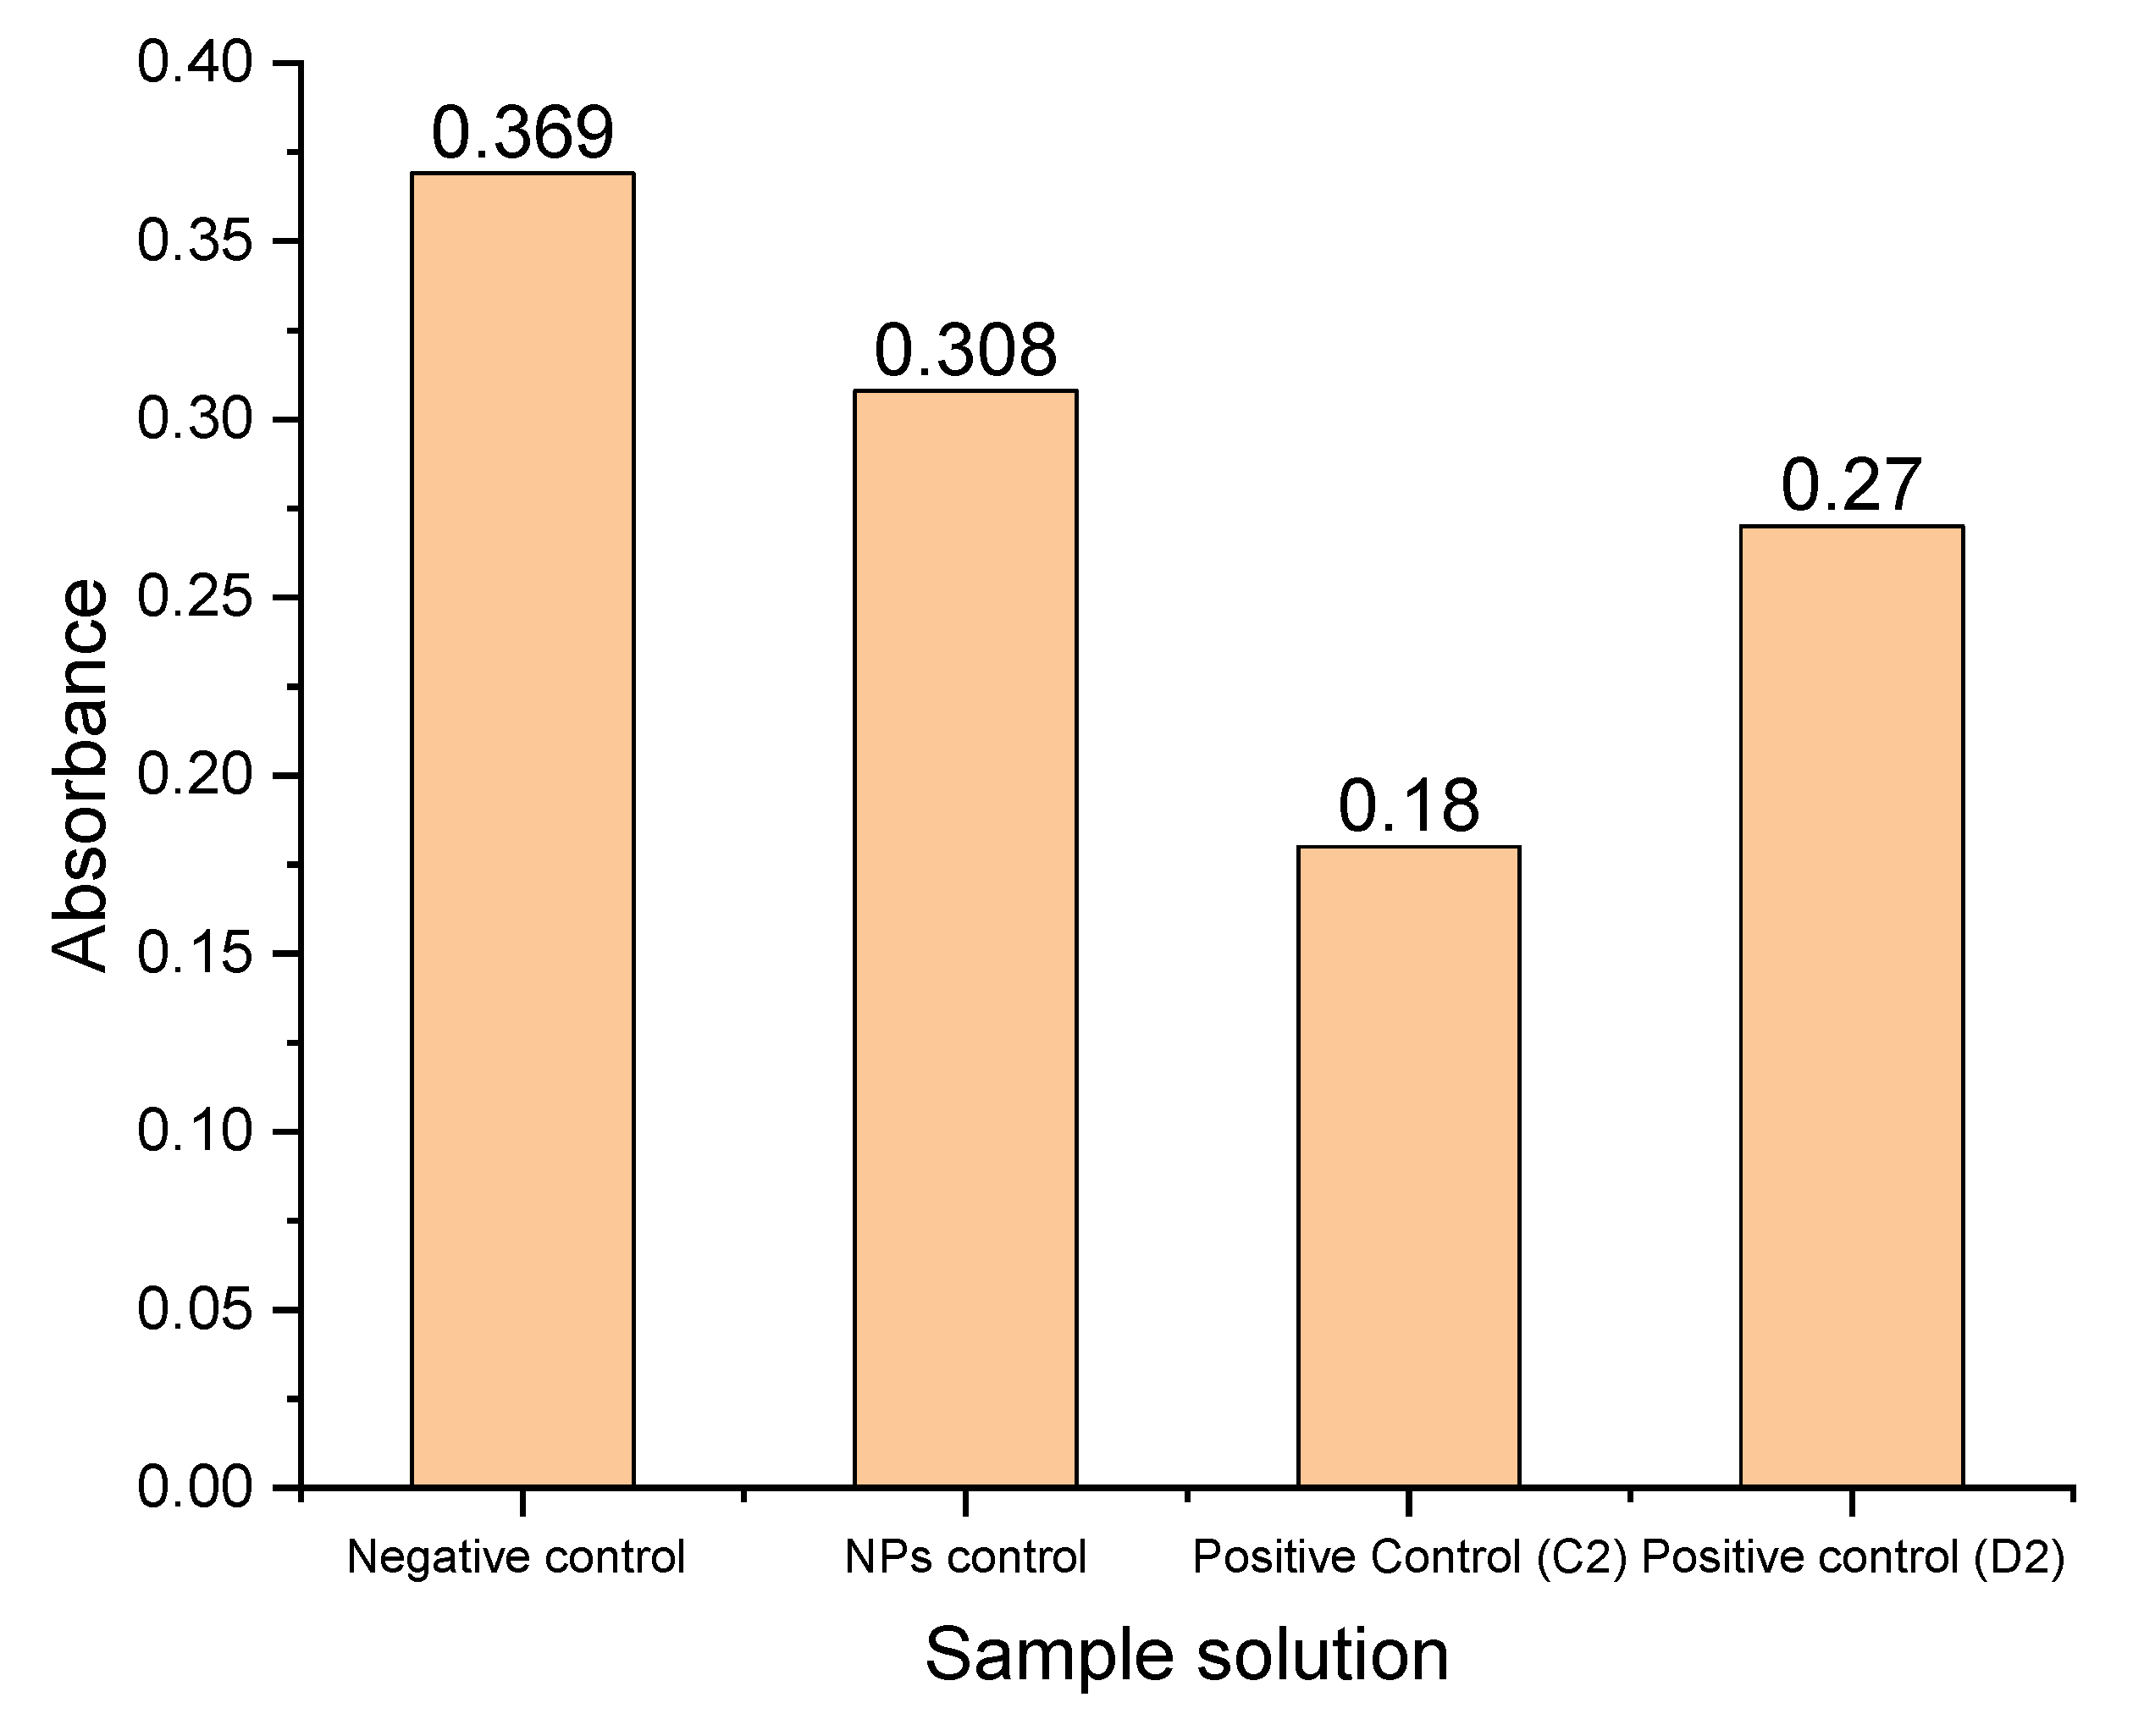
2.3. Antibacterial Activity

The highest level of bacterial growth was observed in the flask without any NP (negative control). The color of the media turned milky, and the absorbance (0.369) of this culture was recorded at 600 nm was the highest among all samples. While the lowest level of bacterial growth was noted in the flask with 50 µg Amoxicillin, followed by the flask with 50 µg Ampicillin (positive controls). The absorbance of the bacterial culture in these two flasks was measured as 0.188 and 0.275, respectively, which indicated significant inhibition of bacterial growth by these antibiotics.
These observations validated the experimental conditions of antimicrobial assays by the suspension method.
The treatment with photocatalyst caused a decrease in bacterial growth. The absorbance of this bacterial culture was measured as 0.308, which is lower than that of the negative control (0.3690) (Figure 10).

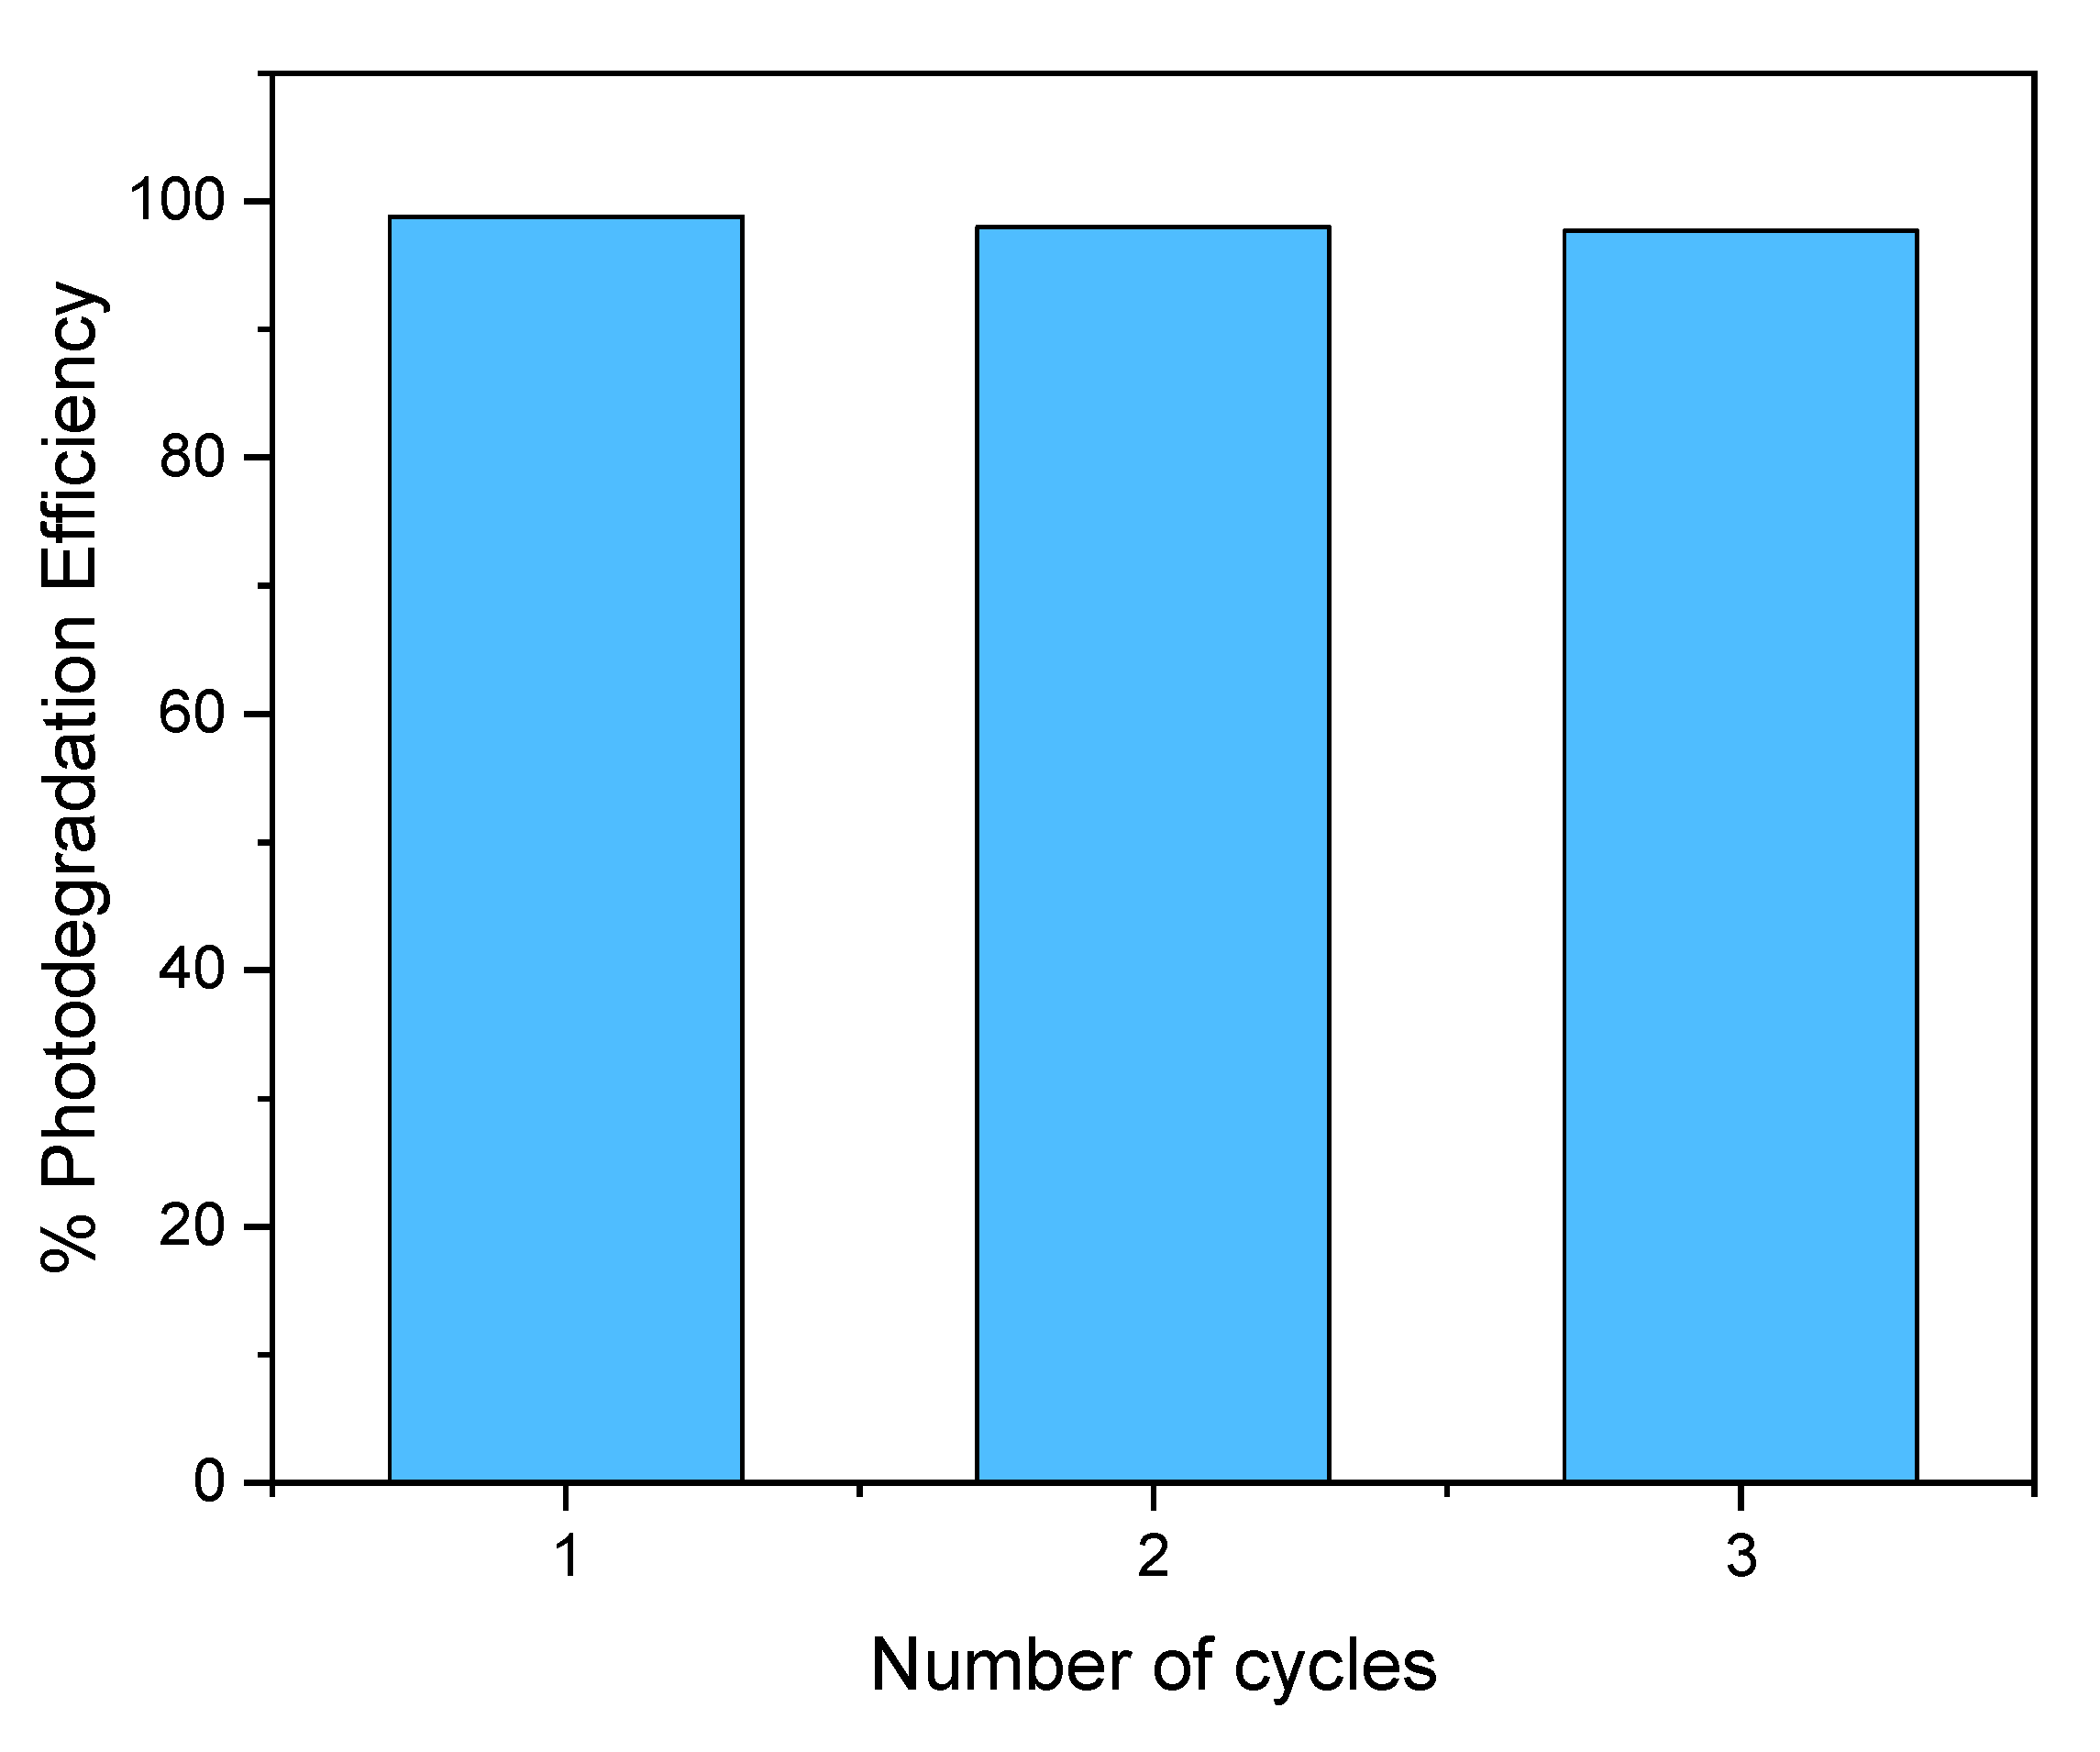
2.4. Long-Term Cycling Experiments
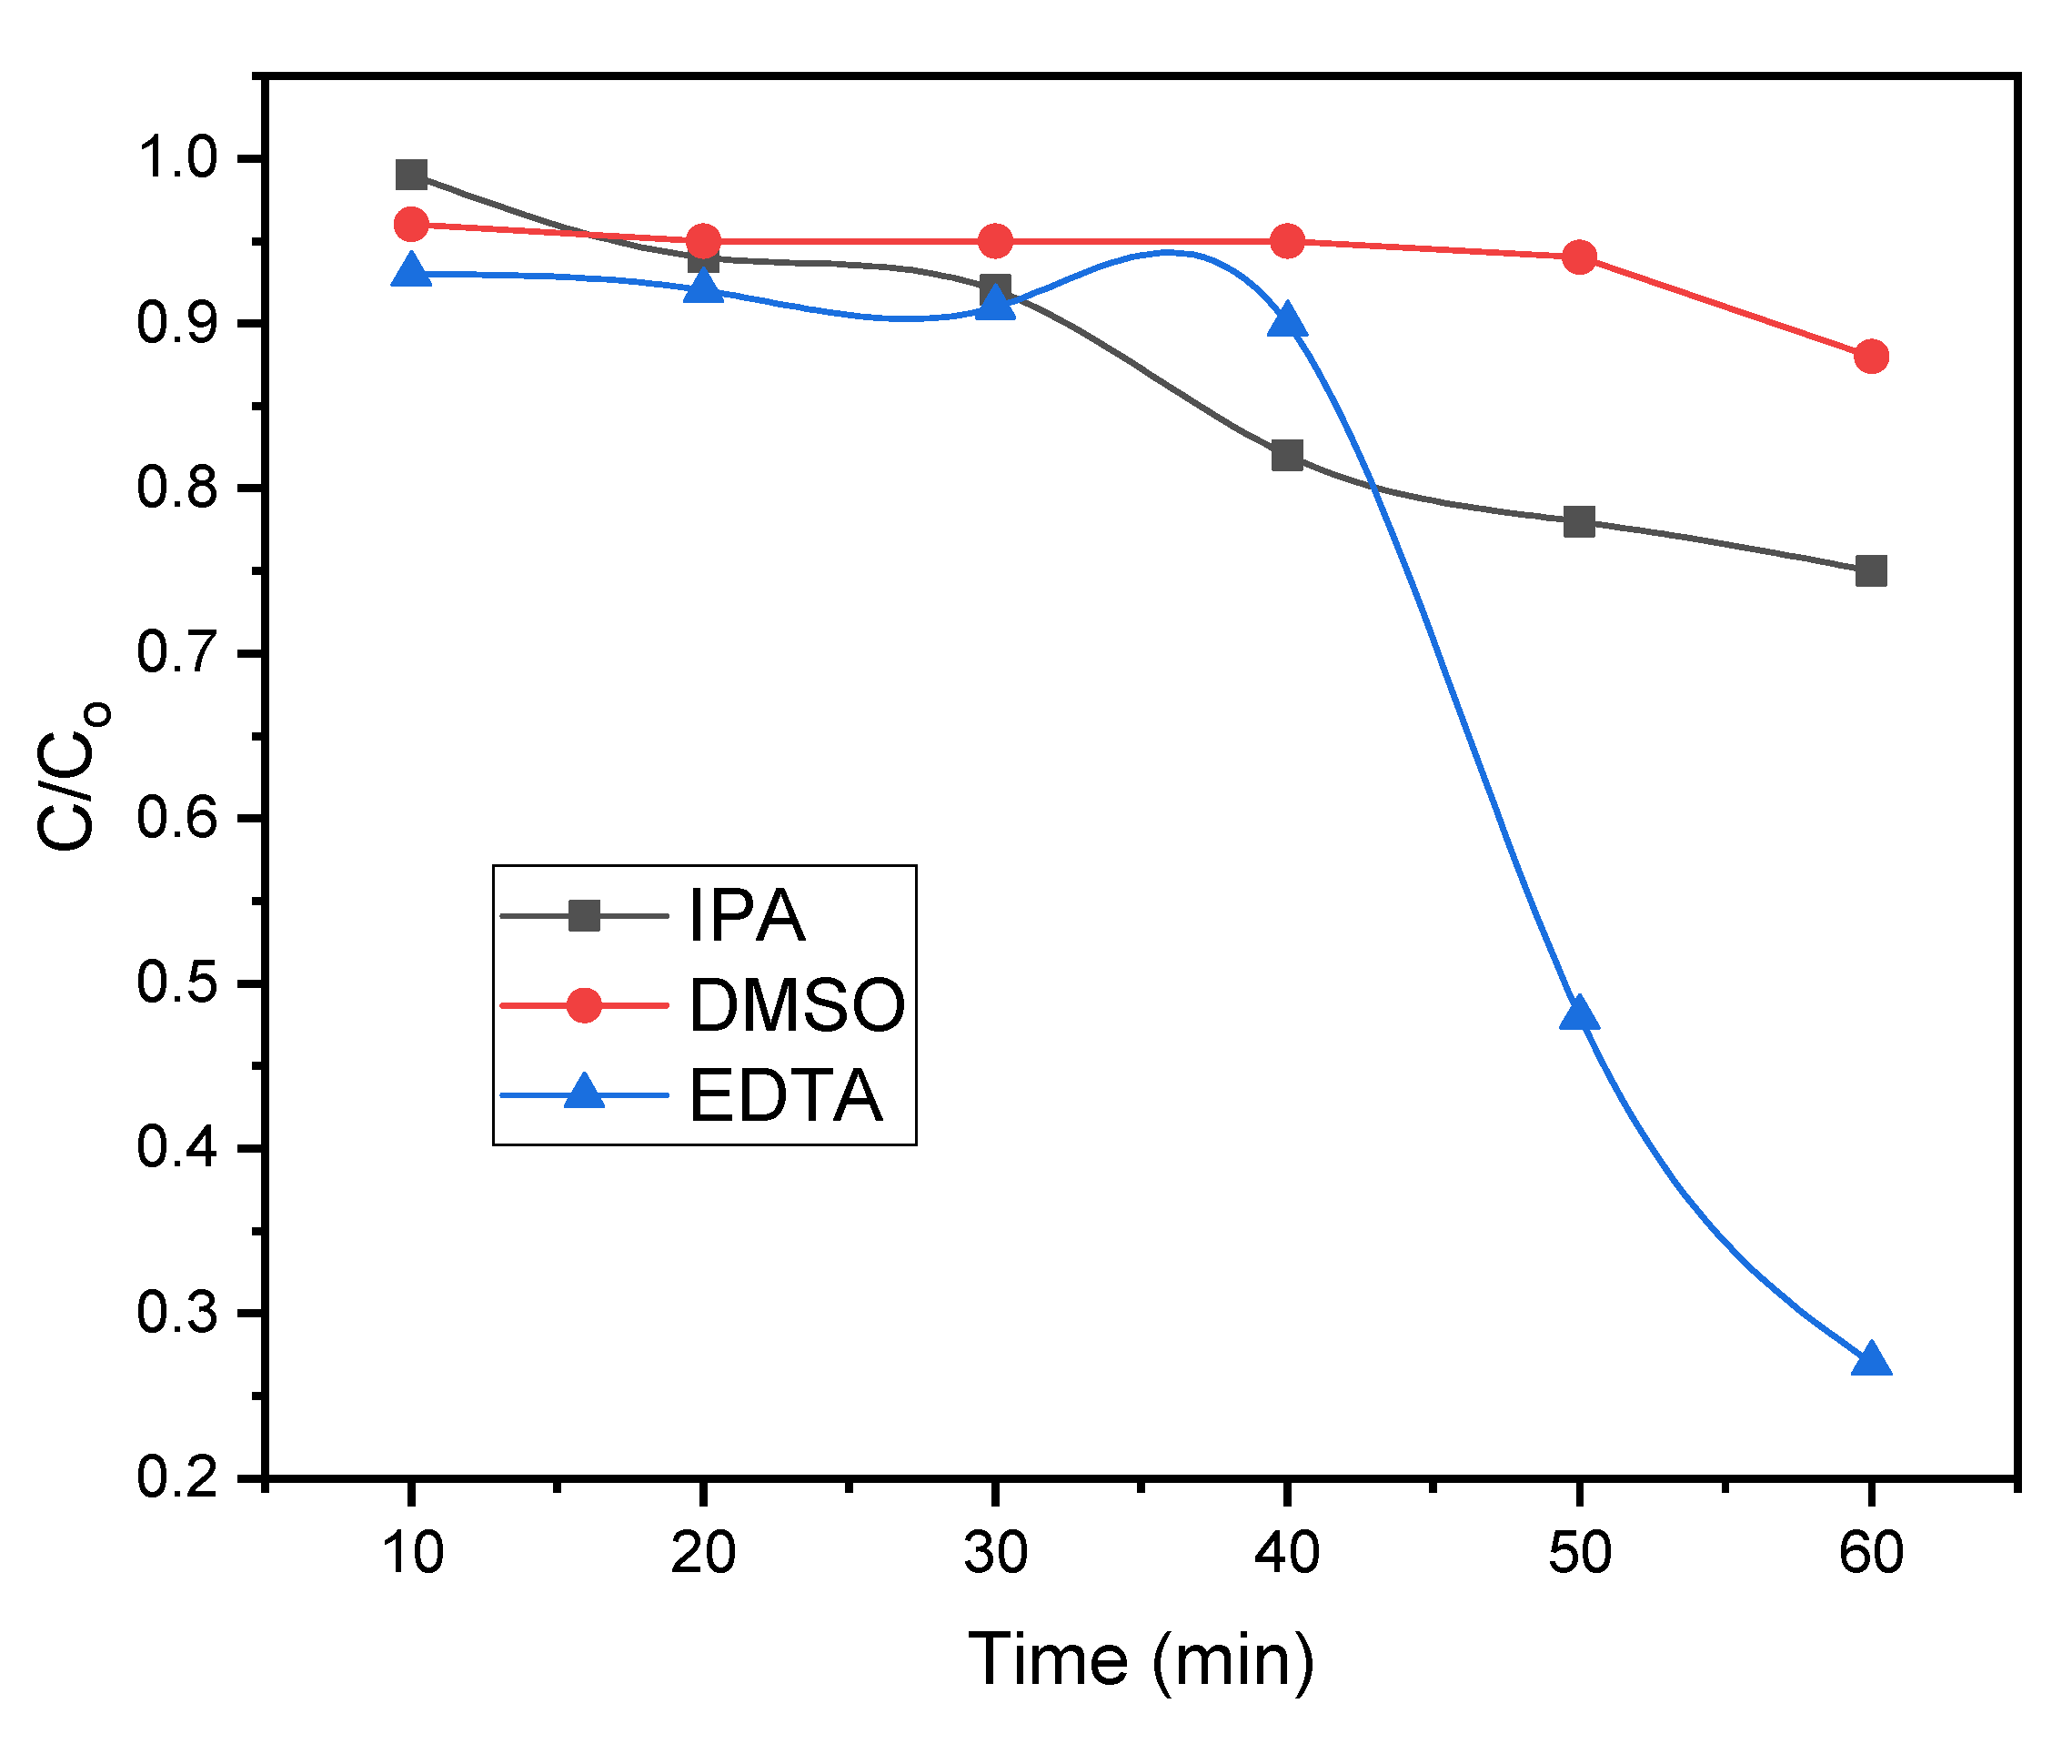
As a common approach, a long-term cycling experiment is performed to evaluate the stability and degradation efficiency of the catalyst during its multiple reuses. The synthesized photocatalyst was regenerated for three consecutive cycles and FTIR after each analysis was taken. A careful study of spectra showed similar bands as present in the spectrum of unused photocatalysts (Figure 5) confirming the retention of basic structure. Some additional bands at positions 1430 corresponding to −NH bending [33] and 1130 cm−1 (stretching vibration of SO(SO3H)) [22], were observed that could possibly be due to the residues of pollutant (Congo red) left on the catalyst’s surface (Figure 11).
Moreover, the ability to degrade during repeating cycles was determined by calculating the percentage degradation efficiency under optimum conditions described in Section 2.2. Figure 12 shows the degradation trend among the three cycles, and it can be clearly observed that only a minute decrease in percentage degradation occurred after the third cycle (97.7%).

2.5. Scavenger Test

The oxidation reactions are started by photocatalysts in a photocatalytic degradation process. They absorb light energy and create hole (h+)-electron (e) pairs which can produce free radicals like hydroxyl (OH•) radicals. These free radicals oxidize organic pollutants in the environment. Therefore, a source of light in the visible or UV spectrum or solar energy is needed for photocatalytic oxidation reactions. However, a semiconductor catalyst must be able to absorb light energy equal to or greater than its bandgap energy in order to produce the h+ and e pairs [34].
In the case of the Zn/iron oxide catalyst, dimethyl sulfoxide (DMSO) presented the maximum scavenging ability (Figure 13). It is a well-known scavenger of OH•. OH• Scavengers react strongly to e as well. Only 50–54% of e species survive the DMSO reactions at high scavenger concentrations [35]. It is obvious that the photodegradation efficiency is strongly dependent on the amount of DMSO because it is a typical radical OH• scavenger in photocatalytic systems [36]. Pollutants are directly attacked by OH• radicals. The reaction rate should be slowed down in the presence of DMSO. The predicted mechanism of free radical formation in the H2O2/DMSO system presupposed that hydroxyl radical and superoxide anion was produced during the breakdown of hydrogen peroxide, and that methyl radical was produced during the hydroxyl radical’s breakdown of DMSO. Alkaline may encourage this reaction. As contaminated trace iron acts as a catalyst in the conversion of superoxide anion to hydroxyl radical, the amount of hydroxyl radical is comparatively higher than that of superoxide anion [37].
The hydroxyl radical (OH•), which was responsible for separating the CR, was formed when the oxygen and water particles in the CR reacted with the e/h+. Hydrogen peroxide (H2O2) is formed when the oxygen (O2) reacts with the energized electrons (e) and separates hydrogen atoms (H+) from water molecules. The hydrogen peroxide was created under visible light, and it further degraded into hydroxyl radicals and hydroxide ions. The hydroxyl radicals worked to degrade the CR.
Catalyst + hv → catalyst (e + h+)
2e + O2 +2H+ → H2O2
e + H2O2 → OH• + OH
OH• + CR → Intermediates → Degradation
The degradation products in the case of CR could be determined based on mass fragments resulting due to C-S, C-C, and C-N bond cleavage along with benzene ring opening [38]. Similarly, the degradation study of brilliant green performed by Khan et al. presented 22 degradation products based on the removal of the alkyl group, decarboxylation, formation of epoxide, etc. [39].
In the case of nitrophenols decomposition, the expected possible mechanism may be based on the attacking of OH• radical on the aromatic ring. The -NO2 is electron-withdrawing and strongly deactivating and m-directing, and the phenolic group -OH is electron-donating and increases the electron density at the o- and p-positions. The OH• attack will occur preferentially in the o-position with respect to -OH because −NO2 of PNP is present at the p-position of −OH resulting in ortho OH-adducts. The decomposition products as reported in literature have been expected to be carbon dioxide and water [40].

2.6. Performance Evaluation

For the photodegradation of water pollutants, various types of photocatalysts made by doping metal ions have been described in the literature. Viewing a photocatalyst’s overall catalytic activity or performance is crucial when considering many photocatalysts that have been previously introduced. This enables to discover those with powerful catalytic properties (e.g., in terms of fabrication and applicability) [26]. The effectiveness of various photocatalysts was assessed by taking into account the energy usage during CR, BG, and PNP degradation. Table 4. Show the Quantum yields (QY) and reaction kinetics for these pollutants’ degradation were computed for this reason.

3. Materials and Methods

3.1. Reagents

The analytical-grades chemicals Zinc sulfate (99.0%), Ferric chloride (97%), Ferrous sulfate (99%), Ammonia (99.9%), Sodium hydroxide (97%), Brilliant Green dye (99%), Congo red dye (99%) Amoxicillin (99.9%), Ampicillin (99.9%), and P-Nitrophenol (99%) were purchased from Sigma Aldrich. Hydrochloric acid (99.9%), Ethanol (99.9%), Methanol (99.9%), Sodium Hydroxide (98%), and p-nitrophenol (99%) were bought from Merck, Darmstadt, Germany while Nutrient broth (99%) was obtained from HiMedia laboratories.

3.2. Photocatalyst’s Synthesis

A Zinc/iron oxide-based photocatalyst was prepared for the photocatalytic degradation of dye using co-precipitation method reported in literature [16]. 0.1 M solutions of ferric nitrate and zinc nitrate were prepared in 100 mL of deionized water and isopropyl alcohol (80:20 v/v). Solutions were mixed in a round bottom flask, followed by the addition of 0.01 M urea, and heated at 60 °C with continuous stirring. Next, the pH was adjusted to 12–13 by dropwise addition of NaOH, which resulted in the formation of particles. The particles formed during the process were separated from the rest of the solution through centrifugation and washed extensively with deionized water. The washed particles were calcined at 800 °C.

3.3. Characterization

The band gap of the photocatalyst prepared by the co-precipitation technique was found by Tauc-plot, and the obtained value of the band gap for this photocatalyst was used to decide the light source in the photodegradation process. The surface morphology of the catalyst was examined through a scanning electron microscope (SEM) (model Hitachi 3000H). EDX was used to analyze the elemental composition of prepared nanomaterial. The crystalline phase of the developed catalyst was determined by X-ray diffraction analysis at wavelength 1.54060 at room temperature operating at 40 kv and 35 mA at 2 thetas (0.02/s).

3.4. Abatement of Water Pollutants

3.4.1. Photodegradation of Dyes (Congo Red and Brilliant Green)

Zinc/iron oxide nano particles (Zn-Nps) were tested against Congo red (CR), Brilliant green (BG) dyes, and P-nitrophenol (PNP), for their photocatalytic degradation capacity. For this reason, a freshly prepared aqueous solution of both dyes and PNP were used.
The solutions were firstly kept in the dark, and the absorbance was measured using a UV/Visible spectrophotometer (Perkin Elmr) at λmax 500 nm and 625 nm for Congo red and Brilliant green, respectively. The solution was then irradiated through visible light using a tungsten bulb (500 Watts). In the next step, an aliquot from each solution was picked and analyzed for the concentration of dye left after degradation by measuring the absorbance via a UV/Visible spectrophotometer. Equation (1) was used to quantify the photocatalytic percentage degradation (%D) of CR, BG dyes, and P-nitrophenol.
Percentage   Photodegradation = ( A o     A t ) A o × 100
where Ao is the initial absorbance before irradiation and At is the final absorbance of the sample irradiated for “t” min.
The optimized experimental parameters were determined through response surface methodology using Design Expert (version 13; Stat Ease, MN, USA) software. Four independent variables, i.e., pH, time, concentration, and catalyst dose were selected to study their combined effect on photodegradation efficiency (dependent variable). A face-centered central composite design was selected to study the influence of selected variables and an experimental set of 27 runs was performed for all the analytes.
Similarly, the correlation between the increasing reaction time and percentage degradation of both dyes and P-nitrophenol have also been investigated for the purpose of evaluating the kinetic models.

3.4.2. Antibacterial Activity Assay by Suspension Method

The Gram-negative bacterial strain Escherichia coli fresh culture was made in an LB-Agar plate by streaking from the preserved glycerol stock culture in a biosafety cabinet (RBSCA Class-II Type A2, Robus Technologies, London, UK). The plates were incubated at 28 °C overnight in a bench-top incubator. From this plate, a single colony was picked to inoculate 5.0 mL LB-broth media in a culture tube that was incubated at 28 °C in a shaking incubator (Wis-20, Witeg, Wertheim, Germany) for 2 h. 1.0 mL of this bacterial culture was used for antibacterial activity assays.
The NPs suspension was prepared by mixing 9.0 mg NPs and 90 mg of Sodium chloride (NaCl) in 9 mL of sterile double distilled water in a 100 mL Erlenmeyer flask along with 1.0 mL of the E. coli fresh culture.
The antibiotics Amoxicillin and Ampicillin (50 µg each) were used separately as positive control while only NaCl was used as a negative control for bacterial growth inhibition.
Each Erlenmeyer flask was incubated at 28 °C in a shaking incubator for 24 h and then absorbance was measured at 600 nm wavelength by using UV-VIS double beam spectrophotometer (U-2900 Hitachi High-Tech Global, Japan).

3.4.3. Scavenger Test

The three common scavengers: isopropyl alcohol for OH• and H• radicals, DMSO as scavengers for OH• radicals and Ethylene diammine tetraacetic acid (EDTA) for holes were selected [35,46,47].
A scavenger test was conducted to identify the scavenging species that quench the reactive radicals involved in the photodegradation process of the dyes. 5 mM solutions of each tested scavenging species were used. Congo red was selected as a template for the described purpose. EDTA, isopropyl alcohol (IPA), and DMSO were added to the dye solution (Congo red) and divided into three flasks containing photocatalyst and dye solution. Following that, the dye solution was exposed to visible light for 105 min, and successive aliquots were taken to determine the dye concentration.

4. Conclusions

Zinc/iron oxide NPs were designed using the co-precipitation approach. Using a catalyst is considered comparatively a long-term and environmentally safe method for degrading a wide range of toxic organic pollutants. Zn/iron oxide NPs were used to degrade the congo red, brilliant green dye, and para nitrophenol under visible light. To optimize the degradation various parameters were investigated, including catalyst dose, pH, organic pollutant concentration (dyes and PNP), and contact time. Based on the optical band gap value of 2.58 eV, the visible light source was selected for the degradation process. The maximum photodegradation efficiencies for congo red, brilliant green and para-nitrophenol were 99%, 94.3%, and 78.5%, respectively. Quantum yields were 9.62 × 10⁻⁸, 1.17 × 10⁻⁷ and 4.11 × 10⁻⁷ moleculesphotons−1, while reaction rates were 27.1 µmolg−1h−1, 29.61 µmolg−1h−1 and 231 µmolg−1h−1 for congo red, brilliant green, and PNP respectively. The photocatalyst was highly effective against the Gram-negative bacterial strain E. coli. In studies on pollutant degradation (CR, BG, and PNP), the designed catalyst proved highly effective in their abatement.

Author Contributions

Conceptualization, S.M. (Suryyia Manzoor), M.I.K., J.F.G. and K.H.S.; methodology, A.I., S.M. (Suryyia Manzoor) and K.H.S.; formal analysis, N.A., M.H. and S.M. (Shamroza Mubarik); investigation, N.A., M.H., H.R., A.Y. and A.I.; resources, A.S. and A.Y.; writing—original draft preparation, S.M. (Suryyia Manzoor), M.I.K., J.F.G. and A.I.; writing—review and editing, N.A., A.S. and S.M. (Shamroza Mubarik); visualization, H.R., S.M. (Shamroza Mubarik) and N.A.; supervision, S.M. (Suryyia Manzoor), M.I.K., J.F.G. and K.H.S. All authors have read and agreed to the published version of the manuscript.

Funding

The project was funded by Institute of Chemical Sciences, Bahauddin Zakariya University, Multan, Pakistan, University College London, IQS-School of Engineering and Higher Education Commission collaborative programme within project HEC-DD-2017.31025. The authors are further grateful for providing the laboratory facilities.

Data Availability Statement

Not applicable.

Conflicts of Interest

The authors declare no conflict of interest.

References

  1. Jankowska, A.; Ejsmont, A.; Galarda, A.; Goscianska, J. The outcome of human exposure to environmental contaminants. Importance of water and air purification processes. In Sustainable Materials for Sensing and Remediation of Noxious Pollutants; Elsevier: Amsterdam, The Netherlands, 2022; pp. 15–37. [Google Scholar]
  2. Kiran, S.; Nosheen, S.; Abrar, S.; Anjum, F.; Gulzar, T.; Naz, S. Advanced approaches for remediation of textile wastewater: A comparative study. Adv. Funct. Text. Polym. Fabr. Process. Appl. 2019, 201–264. [Google Scholar] [CrossRef]
  3. Fei, L.; Bilal, M.; Qamar, S.A.; Imran, H.M.; Riasat, A.; Jahangeer, M.; Ghafoor, M.; Ali, N.; Iqbal, H.M. Nano-remediation technologies for the sustainable mitigation of persistent organic pollutants. Environ. Res. 2022, 211, 113060. [Google Scholar] [CrossRef] [PubMed]
  4. Liu, C.; Mao, S.; Wang, H.; Wu, Y.; Wang, F.; Xia, M.; Chen, Q. Peroxymonosulfate-assisted for facilitating photocatalytic degradation performance of 2D/2D WO3/BiOBr S-scheme heterojunction. Chem. Eng. J. 2022, 430, 132806. [Google Scholar] [CrossRef]
  5. Liu, C.; Mao, S.; Shi, M.; Wang, F.; Xia, M.; Chen, Q.; Ju, X. Peroxymonosulfate activation through 2D/2D Z-scheme CoAl-LDH/BiOBr photocatalyst under visible light for ciprofloxacin degradation. J. Hazard. Mater. 2021, 420, 126613. [Google Scholar] [CrossRef]
  6. Yadav, N.; Garg, V.K.; Chhillar, A.K.; Rana, J.S. Detection and remediation of pollutants to maintain ecosustainability employing nanotechnology: A review. Chemosphere 2021, 280, 130792. [Google Scholar] [CrossRef]
  7. Gilea, D.; Lutic, D.; Carja, G. Heterostructures of silver and zinc based layered double hydroxides for pollutant removal under simulated solar light. Environ. Eng. Manag. J. 2019, 18, 1765–1772. [Google Scholar]
  8. Viswanathan, V.P.; Divya, K.; Dubal, D.P.; Adarsh, N.N.; Mathew, S. Ag/AgCl@ MIL-88A (Fe) heterojunction ternary composites: Towards the photocatalytic degradation of organic pollutants. Dalton Trans. 2021, 50, 2891–2902. [Google Scholar] [CrossRef]
  9. Ahmed, J.; Wong, L.P.; Chua, Y.P.; Channa, N.; Mahar, R.B.; Yasmin, A.; VanDerslice, J.A.; Garn, J.V. Quantitative microbial risk assessment of drinking water quality to predict the risk of waterborne diseases in primary-school children. Int. J. Environ. Res. Public Health 2020, 17, 2774. [Google Scholar] [CrossRef]
  10. Arshad, H.; Sadaf, S.; Hassan, U. De-novo fabrication of sunlight irradiated silver nanoparticles and their efficacy against E. coli and S. epidermidis. Sci. Rep. 2022, 12, 1–10. [Google Scholar] [CrossRef]
  11. Yusuf, M. Synthetic dyes: A threat to the environment and water ecosystem. Text. Cloth. 2019, 11–26. [Google Scholar] [CrossRef]
  12. Nasir, A.M.; Awang, N.; Jaafar, J.; Ismail, A.F.; Othman, M.H.D.; Rahman, M.A.; Aziz, F.; Yajid, M.A.M. Recent progress on fabrication and application of electrospun nanofibrous photocatalytic membranes for wastewater treatment: A review. J. Water Process Eng. 2021, 40, 101878. [Google Scholar] [CrossRef]
  13. Manikandan, A.; Thanrasu, K.; Dinesh, A.; Raja, K.K.; Durka, M.; Almessiere, M.; Slimani, Y.; Baykal, A. Photocatalytic Applications of Magnetic Hybrid Nanoalloys and Their Nanocomposites. In Handbook of Magnetic Hybrid Nanoalloys and Their Nanocomposites; Springer: Berlin/Heidelberg, Germany, 2022; pp. 1–33. [Google Scholar]
  14. Lakshmi Ranganatha, V.; Pramila, S.; Nagaraju, G.; Surendra, B.; Mallikarjunaswamy, C. Cost-effective and green approach for the synthesis of zinc ferrite nanoparticles using Aegle Marmelos extract as a fuel: Catalytic, electrochemical, and microbial applications. J. Mater. Sci. Mater. Electron. 2020, 31, 17386–17403. [Google Scholar] [CrossRef]
  15. Naseem, T.; Waseem, M. A comprehensive review on the role of some important nanocomposites for antimicrobial and wastewater applications. Int. J. Environ. Sci. Technol. 2022, 19, 2221–2246. [Google Scholar] [CrossRef]
  16. Mowlika, V.; Sivakumar, A.; Martin Britto Dhas, S.; Naveen, C.; Phani, A.; Robert, R. Shock wave-induced switchable magnetic phase transition behaviour of ZnFe2O4 ferrite nanoparticles. J. Nanostruct. Chem. 2020, 10, 203–209. [Google Scholar] [CrossRef]
  17. Husain, S.; Yusup, M.; Haryanti, N.; Saukani, M.; Arjo, S.; Riyanto, A. Characteristics of zinc ferrite nanoparticles (ZnFe2O4) from natural iron ore. IOP Conf. Ser. Earth Environ. Sci. 2021, 758, 012001. [Google Scholar] [CrossRef]
  18. Jubu, P.; Yam, F.; Igba, V.; Beh, K. Tauc-plot scale and extrapolation effect on bandgap estimation from UV-vis-NIR data-a case study of β-Ga2O3. J. Solid State Chem. 2020, 290, 121576. [Google Scholar] [CrossRef]
  19. Escobedo-Morales, A.; Ruiz-López, I.; Ruiz-Peralta, M.d.; Tepech-Carrillo, L.; Sánchez-Cantú, M.; Moreno-Orea, J. Automated method for the determination of the band gap energy of pure and mixed powder samples using diffuse reflectance spectroscopy. Heliyon 2019, 5, e01505. [Google Scholar] [CrossRef]
  20. Behera, A.; Kandi, D.; Majhi, S.M.; Martha, S.; Parida, K. Facile synthesis of ZnFe2O4 photocatalysts for decolourization of organic dyes under solar irradiation. Beilstein J. Nanotechnol. 2018, 9, 436–446. [Google Scholar] [CrossRef]
  21. Patil, R.; Delekar, S.; Mane, D.; Hankare, P. Synthesis, structural and magnetic properties of different metal ion substituted nanocrystalline zinc ferrite. Results Phys. 2013, 3, 129–133. [Google Scholar] [CrossRef]
  22. Bartošová, A.; Blinová, L.; Sirotiak, M.; Michalíková, A. Usage of FTIR-ATR as non-destructive analysis of selected toxic dyes. Ved. Práce Mater. Fak. Slov. Tech. Univerzity V Bratislave So Sídlom V Trnave 2017, 25, 103. [Google Scholar] [CrossRef]
  23. Khoshhesab, Z.M.; Sarfaraz, M.; Asadabad, M.A. Preparation of ZnO nanostructures by chemical precipitation method. Synth. React. Inorg. Met.-Org. Nano-Met. Chem. 2011, 41, 814–819. [Google Scholar] [CrossRef]
  24. Awwad, A.M.; Salem, N.M. A green and facile approach for synthesis of magnetite nanoparticles. Nanosci. Nanotechnol. 2012, 2, 208–213. [Google Scholar] [CrossRef]
  25. Devi, R.S.; Gayathri, R. Green synthesis of zinc oxide nanoparticles by using Hibiscus rosa-sinensis. Int. J. Curr. Eng. Technol 2014, 4, 2444–2446. [Google Scholar]
  26. Abbas, N.; Rubab, N.; Kim, K.-H.; Chaudhry, R.; Manzoor, S.; Raza, N.; Tariq, M.; Lee, J.; Manzoor, S. The photocatalytic performance and structural characteristics of nickel cobalt ferrite nanocomposites after doping with bismuth. J. Colloid Interface Sci. 2021, 594, 902–913. [Google Scholar] [CrossRef] [PubMed]
  27. Karimifard, S.; Moghaddam, M.R.A. Application of response surface methodology in physicochemical removal of dyes from wastewater: A critical review. Sci. Total Environ. 2018, 640, 772–797. [Google Scholar] [CrossRef]
  28. Jaafari, J.; Barzanouni, H.; Mazloomi, S.; Farahani, N.A.A.; Sharafi, K.; Soleimani, P.; Haghighat, G.A. Effective adsorptive removal of reactive dyes by magnetic chitosan nanoparticles: Kinetic, isothermal studies and response surface methodology. Int. J. Biol. Macromol. 2020, 164, 344–355. [Google Scholar] [CrossRef]
  29. Bai, J.; Chen, X.; Dobermann, A.; Yang, H.; Cassman, K.G.; Zhang, F. Evaluation of NASA satellite- and model-derived weather data for simulation of maize yield potential in China. Agron. J. 2010, 102, 9–16. [Google Scholar] [CrossRef]
  30. Tanyildizi, M.S.; Özer, D.; Elibol, M. Optimization of α-amylase production by Bacillus sp. using response surface methodology. Process Biochem. 2005, 40, 2291–2296. [Google Scholar] [CrossRef]
  31. Baligidad, S.M.; Chandrasekhar, U.; Elangovan, K.; Shankar, S. RSM optimization of parameters influencing mechanical properties in selective inhibition sintering. Mater. Today Proc. 2018, 5, 4903–4910. [Google Scholar] [CrossRef]
  32. Medasani, B.; Park, Y.H.; Vasiliev, I. Theoretical study of the surface energy, stress, and lattice contraction of silver nanoparticles. Phys. Rev. B 2007, 75, 235436. [Google Scholar] [CrossRef]
  33. Lafi, R.; Montasser, I.; Hafiane, A. Adsorption of congo red dye from aqueous solutions by prepared activated carbon with oxygen-containing functional groups and its regeneration. Adsorpt. Sci. Technol. 2019, 37, 160–181. [Google Scholar] [CrossRef]
  34. Alshabanat, M.N.; AL-Anazy, M.M. An experimental study of photocatalytic degradation of congo red using polymer nanocomposite films. J. Chem. 2018, 2018, 9651850. [Google Scholar] [CrossRef]
  35. Nguyen, J.; Ma, Y.; Luo, T.; Bristow, R.G.; Jaffray, D.A.; Lu, Q.-B. Direct observation of ultrafast-electron-transfer reactions unravels high effectiveness of reductive DNA damage. Proc. Natl. Acad. Sci. USA 2011, 108, 11778–11783. [Google Scholar] [CrossRef] [PubMed]
  36. Gao, P.; Liu, J.; Sun, D.D.; Ng, W. Graphene oxide-CdS composite with high photocatalytic degradation and disinfection activities under visible light irradiation. J. Hazard. Mater. 2013, 250, 412–420. [Google Scholar] [CrossRef] [PubMed]
  37. Yamaguchi, F.; Yoshimura, Y.; Nakazawa, H.; Ariga, T. Free radical scavenging activity of grape seed extract and antioxidants by electron spin resonance spectrometry in an H2O2/NaOH/DMSO system. J. Agric. Food Chem. 1999, 47, 2544–2548. [Google Scholar] [CrossRef]
  38. Fowsiya, J.; Madhumitha, G.; Al-Dhabi, N.A.; Arasu, M.V. Photocatalytic degradation of Congo red using Carissa edulis extract capped zinc oxide nanoparticles. J. Photochem. Photobiol. B Biol. 2016, 162, 395–401. [Google Scholar] [CrossRef]
  39. Khan, Z.U.H.; Shah, N.S.; Iqbal, J.; Khan, A.U.; Imran, M.; Alshehri, S.M.; Muhammad, N.; Sayed, M.; Ahmad, N.; Kousar, A. Biomedical and photocatalytic applications of biosynthesized silver nanoparticles: Ecotoxicology study of brilliant green dye and its mechanistic degradation pathways. J. Mol. Liq. 2020, 319, 114114. [Google Scholar] [CrossRef]
  40. Shaoqing, Y.; Jun, H.; Jianlong, W. Radiation-induced catalytic degradation of p-nitrophenol (PNP) in the presence of TiO2 nanoparticles. Radiat. Phys. Chem. 2010, 79, 1039–1046. [Google Scholar] [CrossRef]
  41. Taghavi Fardood, S.; Moradnia, F.; Ramazani, A. Green synthesis and characterisation of ZnMn2O4 nanoparticles for photocatalytic degradation of Congo red dye and kinetic study. Micro Nano Lett. 2019, 14, 986–991. [Google Scholar] [CrossRef]
  42. Chen, C.-C.; Lu, C.-S.; Fan, H.-J.; Chung, W.-H.; Jan, J.-L.; Lin, H.-D.; Lin, W.-Y. Photocatalyzed N-de-ethylation and degradation of Brilliant Green in TiO2 dispersions under UV irradiation. Desalination 2008, 219, 89–100. [Google Scholar] [CrossRef]
  43. Taneja, P.; Sharma, S.; Umar, A.; Mehta, S.K.; Ibhadon, A.O.; Kansal, S.K. Visible-light driven photocatalytic degradation of brilliant green dye based on cobalt tungstate (CoWO4) nanoparticles. Mater. Chem. Phys. 2018, 211, 335–342. [Google Scholar] [CrossRef]
  44. Wang, C.; Shen, J.; Chen, R.; Cao, F.; Jin, B. Self-assembled BiOCl/Ti3C2Tx composites with efficient photo-induced charge separation activity for photocatalytic degradation of p-nitrophenol. Appl. Surf. Sci. 2020, 519, 146175. [Google Scholar] [CrossRef]
  45. Sánchez, U.A.; Chen, L.; Wang, J.A.; Noreña, L.E.; Asomoza, M.; Solis, S.; Zhou, X.; Song, Y.; Liu, J. One-pot synthesis of W-TiO2/SiO2 catalysts for the photodegradation of p-Nitrophenol. Int. J. Photoenergy 2019, 2019, 5748586. [Google Scholar] [CrossRef]
  46. Jalil, A.A.; Sapawe, N.; Triwahyono, S. Photodecolorization of methylene blue over EGZrO2/EGZnO/EGFe2O3/HY photocatalyst: Effect of radical scavenger. Malays. J. Fundam. Appl. Sci. 2013, 9, 67–73. [Google Scholar] [CrossRef]
  47. Agbe, H.; Raza, N.; Dodoo-Arhin, D.; Chauhan, A.; Kumar, R.V. H2O2 rejuvenation-mediated synthesis of stable mixed-morphology Ag3PO4 photocatalysts. Heliyon 2018, 4, e00599. [Google Scholar] [CrossRef] [PubMed]
Figure 1. SEM images of Zn/iron oxide NPs. (a) 1 µm (b) 0.5 µm scales.
Catalysts 13 00065 g001
Figure 2. EDX spectrum of Zn/iron oxide NPs.
Catalysts 13 00065 g002
Figure 3. Spectral characteristics of photocatalyst.
Catalysts 13 00065 g003
Figure 4. Calculation of band gap using Tauc plot.
Catalysts 13 00065 g004
Figure 5. FTIR spectrum of designed photocatalyst depicting its characteristic functional groups.
Catalysts 13 00065 g005
Figure 6. XRD spectrum of the designed photocatalyst.
Catalysts 13 00065 g006
Figure 7. 3D surface plots representing the relationship between different variables and percentage photodegradation in case of BG dye.
Catalysts 13 00065 g007
Figure 8. 3D surface plots representing the relationship between different variables (a) pH, catalyst dose (b) time, pH (c) Dye’s conc., (d) Dye’s conc., time, and percentage photodegradation in case of congo red dye.
Catalysts 13 00065 g008aCatalysts 13 00065 g008b
Figure 9. 3D surface plots representing the relationship between different variables (a) catalyst dose, time (b) pH, PNP conc. (c) pH, time (d) time, PNP and percentage photodegradation in case of PNP.
Catalysts 13 00065 g009aCatalysts 13 00065 g009b
Figure 10. Absorbance rate of E. coli strain.
Catalysts 13 00065 g010
Figure 11. FTIR spectra of catalyst after repetitive degradation cycles.
Catalysts 13 00065 g011
Figure 12. Recyclability evaluation of catalyst for 3 repeated experiments.
Catalysts 13 00065 g012
Figure 13. Evaluation of effect of EDTA, IPA and DMSO as scavengers in photodegradation studies (C is the final concentration and C0 is the initial concentration in mgL−1).
Catalysts 13 00065 g013
Table 1. Experimental sets to evaluate inter parameter dependence using face centered approach of CCD.
RunCatalyst Dose
(mg) (A)
pH
(B)
Time (min)
(C)
Concentration (mgL−1)
(D)
Percentage Photodegradation
182.57105589.2
282.5718027.590.4
31541805067.1
4154180562.5
582.5410527.560.2
682.5710527.590.7
7154305058.4
815430557.1
91510180589.8
1082.5710527.587.3
111510305091
121504180563.4
13150430557.5
1415101805092.8
15150710527.589.5
1615710527.588.7
1782.51010527.591
18150101805093.2
1982.5710527.588.2
2082.573027.587
2182.571055089
22151030590.4
231504305057
2415010180590.1
2515041805057.5
2615010305091.8
271501030590.1
Table 2. Experimental runs for the prediction of optimum parameters using central composite design.
RunCatalyst Dose (mg)
(A)
pH
(B)
Time (min)
(C)
Concentration (mgL−1)
(D)
Percentage Photodegradation
1151030568.6
21510305072.2
382.51010527.570.1
4150101805076.2
5150430582.7
6154305077.6
715010180565.4
815101805078
91510180566
1082.5410527.579
1182.5710527.595.4
1215041805088.7
13150710527.595.5
141504305080.1
1582.5710527.596.2
161541805086
1782.573027.592.9
1882.5710527.595.7
19154180583
201501030568.6
2182.5718027.598.8
2215010305069.9
2315710527.597.3
2482.571055097.7
2515430584.1
2682.57105596.4
271504180588.2
Table 3. Experimental runs for the prediction of optimum parameters for PNP degradation using central composite design.
RunCatalyst Dose
(A)
pH
(B)
PNP Conc.
(C)
Time
(D)
Percentage Photodegradation
112041010045
21201050543.3
310101010046
41073052.573
56575052.566
61041010046
710450542
86573010069
9120101010054
1065103052.558
1112045010064
1212073052.578
13101050536.7
14120105010062
156573052.571.5
166571052.560
176543052.556.2
186573052.571
196573052.570
2010105010052.4
21120410556
22120450553
2365730563.5
241045010058
2510410545
26101010540
271201010555
Table 4. Comparative evaluation of the studied photocatalytic system with the reported ones.
PollutantsCatalystsReaction Kinetics
(µmolg−1h−1)
Quantum Efficiency (MoleculesPhoton−1)References
Congo redZnMn2O4 NPs183.78.73 × 10−7[41]
ZnFe2O4 NPs27.19.62 × 10−8Current study
Brilliant greenTiO21504.58 × 10−4[42]
CoWO429.21 × 10−7[43]
ZnFe2O4 NPs29.61.17 × 10−7Current study
Para nitrophenolBiOCl/Ti3C2Tx4698.44 × 10−6[44]
W−TiO2/SiO2443.75 × 10−4[45]
ZnFe2O4 NPs234.11 × 10−7Current study
Disclaimer/Publisher’s Note: The statements, opinions and data contained in all publications are solely those of the individual author(s) and contributor(s) and not of MDPI and/or the editor(s). MDPI and/or the editor(s) disclaim responsibility for any injury to people or property resulting from any ideas, methods, instructions or products referred to in the content.

