Article

Visualizing Hydrophobic and Hydrophilic Enzyme Interactions during Immobilization by Means of Infrared Microscopy

1
ZHAW Zürcher Hochschule für Angewandte Wissenschaften, ICBT Institut für Chemie und Biotechnologie, CH-8820 Wädenswil, Switzerland
2
Purolite Ltd., Unit D Llantrisant Business Park, Llantrisant CF72 8LF, UK
*
Author to whom correspondence should be addressed.
Catalysts 2022, 12(9), 989; https://doi.org/10.3390/catal12090989
Submission received: 18 July 2022 / Revised: 16 August 2022 / Accepted: 22 August 2022 / Published: 1 September 2022
(This article belongs to the Special Issue Biocatalysis in Non-conventional Media)

Abstract

:
A novel Fourier transform infrared (FT-IR) microscopy method was developed and used to analyze the diffusion of lipase CalB in two different resins during immobilization. The method consisted of a streamlined sample preparation process and an automated transmission FT-IR microscopic measurement using a commercial benchtop device. The immobilization of CalB was performed on a hydrophobic resin containing aromatic groups (ECR1030M based on divinylbenzene) and on a hydrophilic resin containing ester groups and thus oxygen (ECR8204M based on methacrylate) and FT-IR revealed that the kinetic of immobilization and the distribution of the enzyme on the two resins were completely different. Furthermore, the technique revealed that CalB was immobilized on the external surface only in the case of the hydrophobic ECR1030M in a layer of about 50–70 µm, whereas when immobilized on the hydrophilic carrier ECR8204M the interaction of the enzyme with the carrier was uniform over the full diameter of the polymer bead. The enzyme activity however was higher on the hydrophobic support ECR1030M.

Graphical Abstract

1. Introduction

The use of enzymes as catalysts in industrial applications is very attractive especially in terms of chemoselectivity, enantioselectivity, and energy demand [1,2], while the combination of bio- and chemocatalysis offers additional advantages [3]. For the fast implementation of such catalytic processes, the cooperation of organic chemists with specialists from neighboring disciplines such as biocatalysis, industrial chemistry, and process analytical technologies are especially helpful.
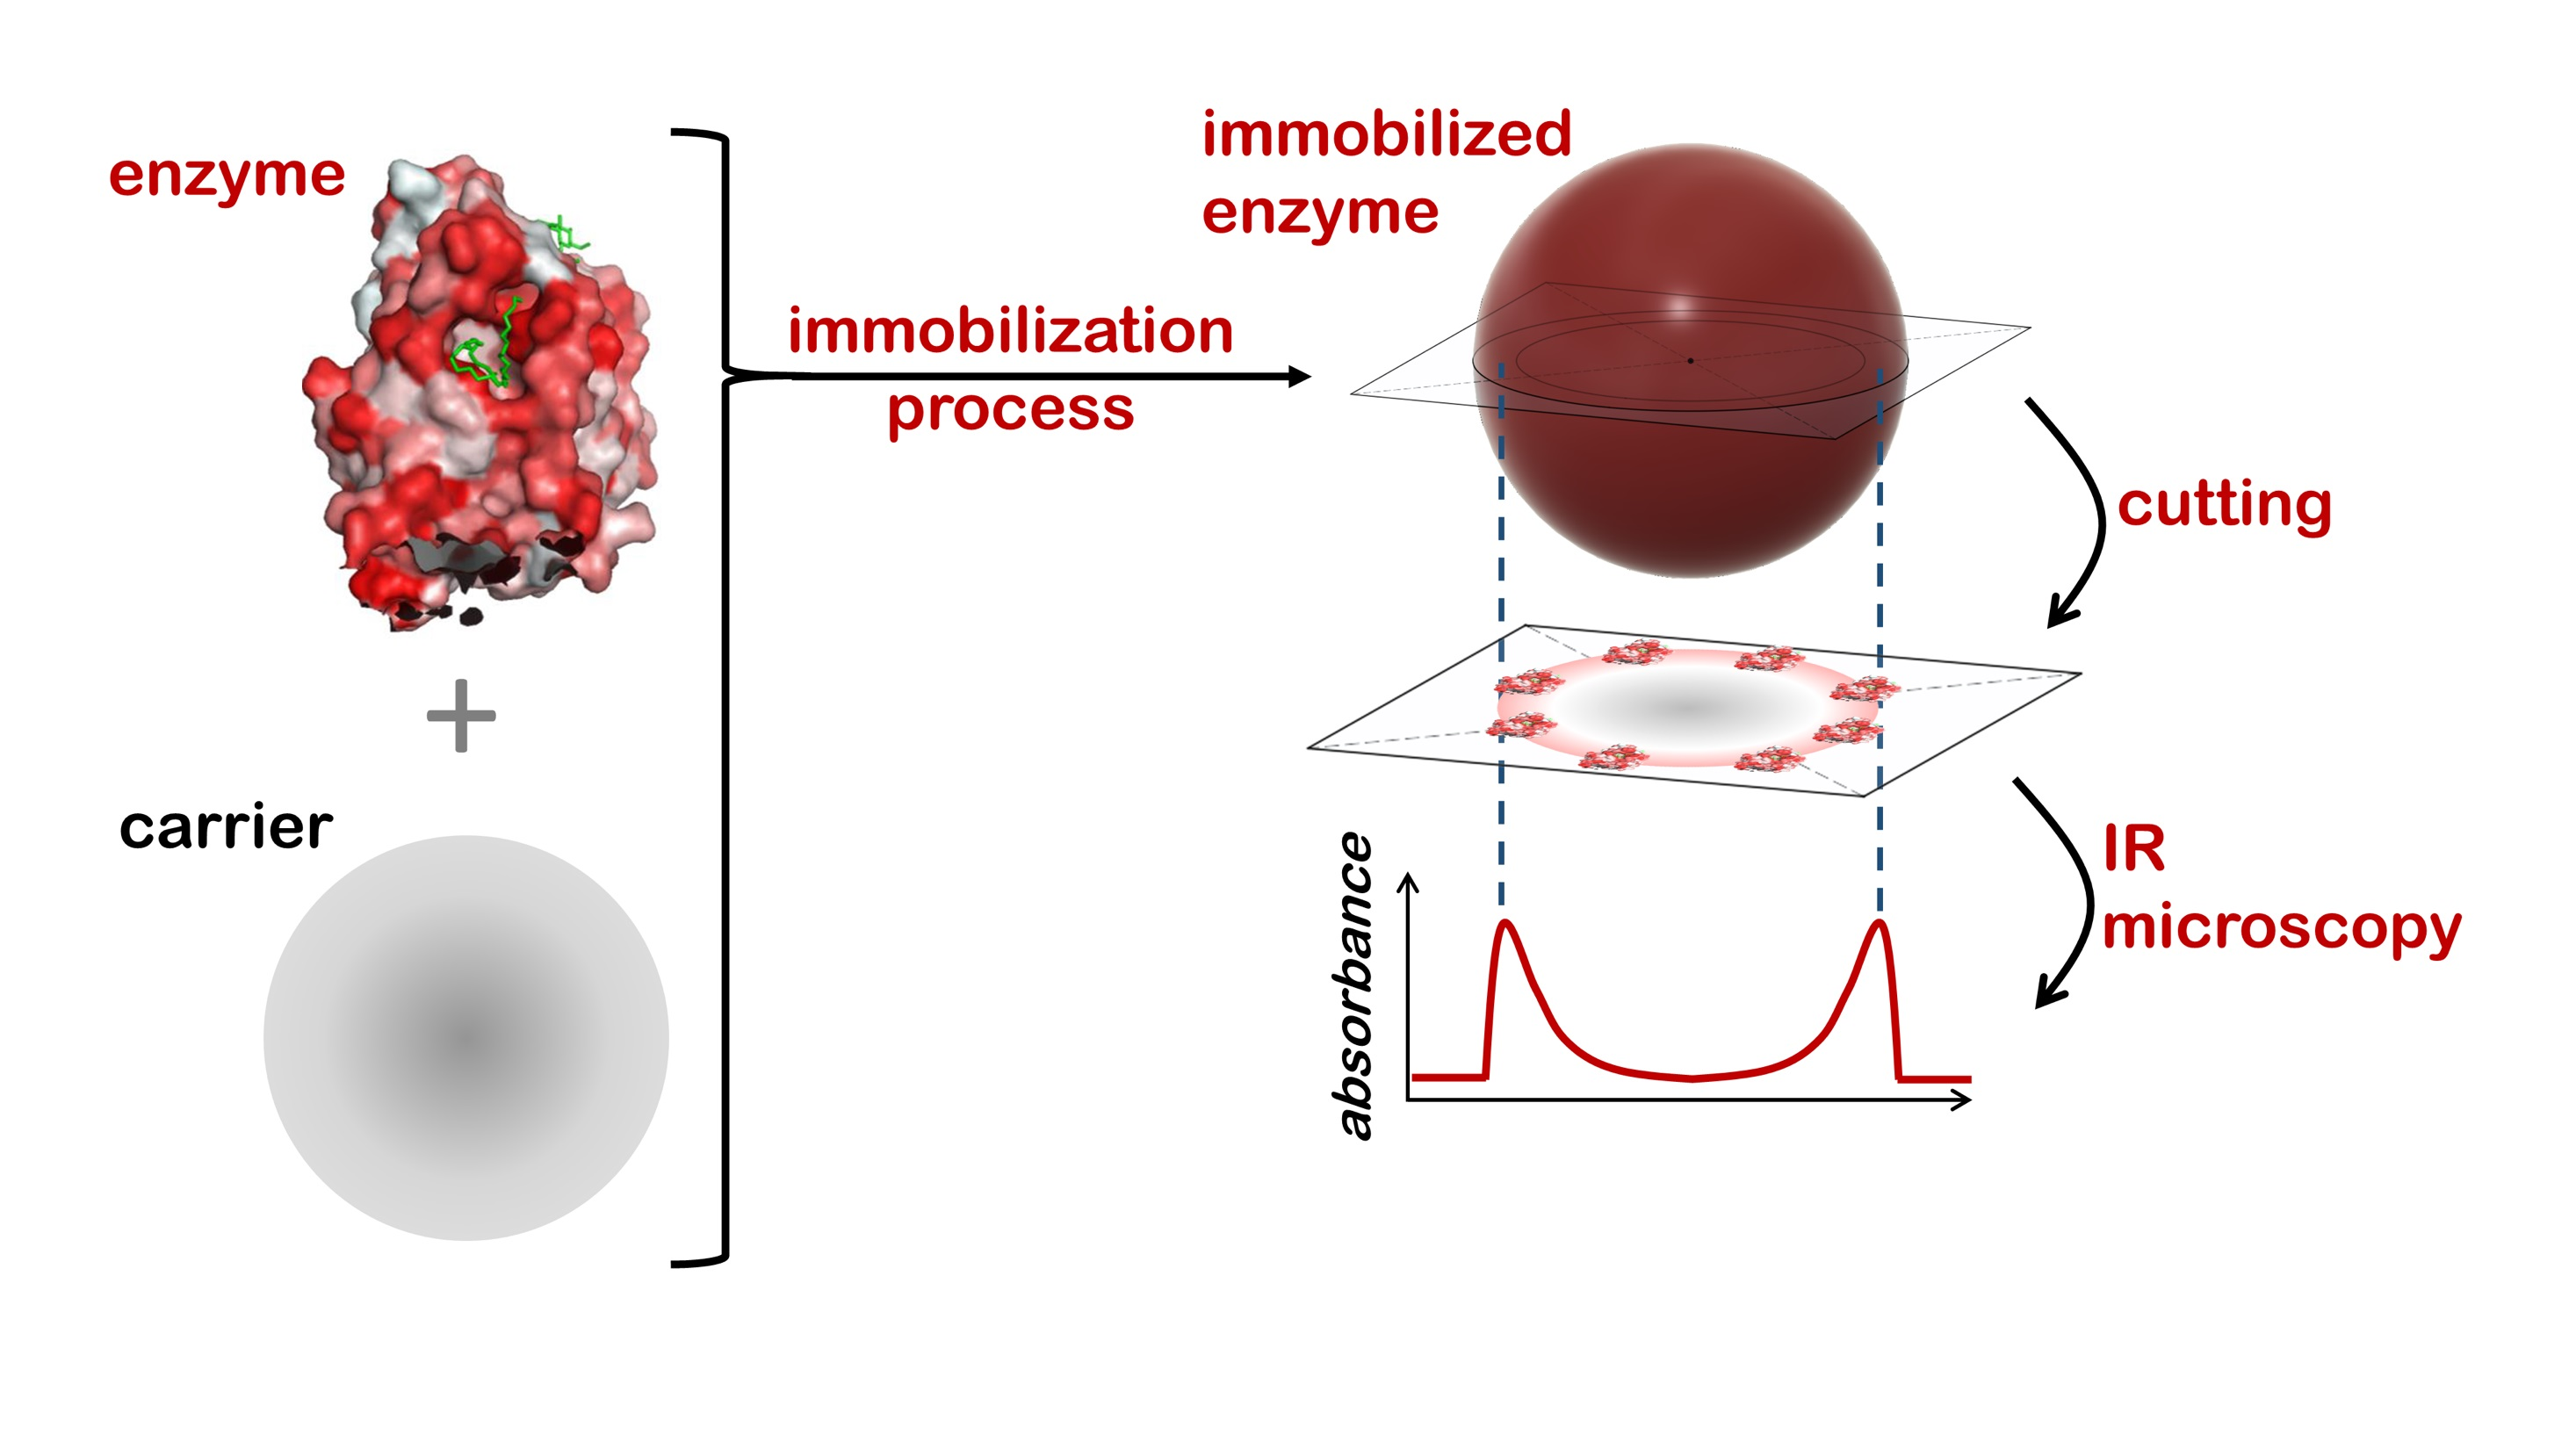
The use of enzymes in an industrial context often requires their immobilization for easy recycling and simple downstream processing. A variety of materials ranging between natural and synthetic origins are available for immobilization and their nature and properties are shown to influence the interaction with the enzymes as well as their activity, specificity, and performance in the respective applications.
For this reason, a critical parameter that can help understanding the performance of an immobilized enzyme is the spatial distribution of the enzyme and substrate within an immobilization carrier. The enzyme distribution has been obtained experimentally by coupling microscopic techniques with staining [4,5], radioactive labeling [5,6,7], or fluorescence labeling [8,9,10]. Methods relying on staining or labelling have the inherent drawback of requiring additional steps during sample preparation and carry a risk of influencing the enzyme distribution, e.g., the solvents used in the labelling process penetrating into the carrier and causing a further diffusion of the enzyme. Infrared (IR) microscopic methods are label-free and are therefore not affected by these problems. IR spectroscopy is also quantitative, allowing conclusions about enzyme concentration to be drawn based on the absorbance of light.
In previous studies by Sinigoi et al. [11] and Mei et al. [12], synchrotron-coupled IR microscopes were used to investigate Synbeads and immobilized enzymes, respectively. While synchrotron light is well suited for this application, access to such specialized infrastructure is often highly restricted and requires special training and careful planning. In comparison, the benchtop infrared microscope employed for this work uses a conventional IR light source, making it far more accessible and easier to operate.
In this paper, sample preparation was streamlined, enabling the time-efficient processing of a batch of 5–10 samples through the use of novel, disposable, 3D-printed microscope slides. The immobilized enzyme beads were embedded in commercial histology-grade paraffin wax, cut into thin slices (sections) using a rotary microtome, and the sections mounted on the aforementioned slides. The paraffin wax used in this study offers considerable advantages over epoxy polymers [11] or glycerin-based embedding media [13] used in other studies, which require special slicing equipment and cryogenic temperatures, respectively. The 3D-printed slides are considerably (approx. a factor of 3000) cheaper than the barium fluoride disks conventionally used for sample mounting in transmission IR microscopy [12].
Chen et al. (2008) demonstrated in a previous paper, that Candida antarctica lipase B (CalB) was immobilized on the external surface of the resin Lewatit® VP OC1600, with an enzyme layer thickness of 80–100 µm on beads with a particle size of about 650 µm [14].
Nielsen et al. (2014) examined the activity and spatial distribution of CalB on polystyrene (PS) and polymethylmethacrylate (PMMA) carriers using fluorescence microscopy. They observed an enzyme layer thickness of 50–85 µm on PMMA beads and 10–20 µm on PS beads with particle sizes between 500–850 µm [13].
In the present paper, we studied the effect of interaction of lipase CalB on two different resins by means of FT-IR microscopy. In one case the resin was a hydrophobic methacrylate-divinyl benzene resin (ECR1030M), and in the other case a hydrophilic methacrylic resin (ECR8204M).
The copolymer of ECR1030M contains aromatic rings that favor van der Waals interaction. ECR8204M resin contains only methacrylate functionalized with epoxide groups and thus favors covalent bonds with the -NH2 groups present on the enzyme as well as hydrogen bonds. The target of the study was to develop a streamline sample preparation used in combination with the FT-IR to verify the interaction of the enzyme with the polymeric structure in the case of predominantly hydrophobic interactions and in the case of predominantly hydrophilic and covalent interactions.

2. Results

For the present study we immobilized lipase CalB on two different polymers, one hydrophobic and one hydrophilic, with the aim to understand the interaction of the enzyme with the matrix and the effect on enzyme activity. The two resins selected had very similar porosity and surface area and were selected to have the same mean diameter to avoid artefacts due to different size. The features of the polymers used are reported in Table 1.
ECR1030M is a highly hydrophobic polymer based on methyl methacrylate, butyl methacrylate, and divinylbenzene. Due to the hydrophobic structure of ECR1030M it is particularly suitable for enzyme immobilization by adsorption. CalB was immobilized on ECR1030M using already reported protocols [15].
On the contrary, ECR8204M is a hydrophilic polymer which does not contain any aromatic groups and immobilization occurs via covalent binding through the epoxy groups.
The porosity of both resins is optimal for the immobilization of lipase CalB, which is a small enzyme of 33 kDa, characterized by a highly hydrophobic surface [16].

2.1. Penetration of the Enzyme into the Hydrophobic Carrier Beads (ECR1030M) during the Immobilization Procedure

In order to visualize the interaction of CalB with the two different polymers and the effect of the polymer structure on the penetration of the enzyme into the polymer bead, a comprehensive IR microscopy study was done. During the immobilization of CalB on ECR1030M, samples at 0 h (blank), 0.25 h, 0.5 h, 1 h, 2 h, 4 h, 6 h, and 24 h of the immobilization process were taken. After washing and drying, the beads were embedded in paraffin wax and cut into 10 µm thick sections using a rotary microtome. The sections were then mounted on 3D-printed microscopy slides (Figures S1 and S2, 3D model in the SI) and analyzed by IR microscopy to monitor the enzyme penetration depth. Full transmission IR spectra (spectral range 4000–600 cm−1) of an area of 10 µm × 10 µm were recorded in sequential steps of 10 µm along the diameter of the carrier bead (Figures S3 and S4). In these spectra, the presence of enzyme was monitored through the presence of the amide bond, measured through the absorbance of light at 1658 cm−1 (amide I band). The amide I band, caused by stretching of the amide C=O group, is generally the strongest absorbance band in infrared spectra of proteins, and so well suited to this application. A single-point background was taken at an absorbance-free region of the spectrum at 1800 cm−1. During subsequent data processing, the background-corrected IR absorbance at the amide I band of each spectrum was recorded as a function of the acquisition location along the diameter of the carrier bead. The diameter of the carrier bead was presented as a percentage of the full diameter to ensure comparability between sections with different bead diameters. The resulting absorbance profiles (background-corrected amide I absorbance versus location along relative bead diameter) were used for the penetration depth studies presented in this work. Data processing is explained in detail in Figure S5, and a representative IR spectrum of ECR1030M is shown in Figure S6. Considerations regarding sample selection are also detailed in the SI, with a special focus on particle diameter (Figure S7, Table S1). Single determinations for IR microscopy were deemed sufficient for this study after an evaluation of the measurement repeatability (Figure S8).
Figure 1 shows an overlay of absorbance profiles for all CalB-immobilized samples of ECR1030M (A), and an overlay of the profiles zoomed to the left border of the particle (up to 20% relative bead diameter) at the first hour of immobilization (B). The horizontal arrows indicate the width at half maximum (WHM), which is plotted in (D) as a function of immobilization time. It is evident that the width of the enzyme-containing region in the resin increases with the immobilization time. The integral of the IR absorbance at the amide I band across the entire bead diameter follows the same trend (C). It appears that most of the immobilization process takes place within the first hour, reaching 80% enzyme penetration (WHM) and 74% absorbance integral relative to the sample taken at 24 h. It is apparent that the center of the ECR1030M particles, apart from a slightly elevated background signal, contains no absorbing species, indicating the absence of enzyme.
Figure 2 shows three-dimensional plots of the spectral region 1800–1500 cm−1 of ECR1030M without enzyme (A) and after a 24 h immobilization (B) and the corresponding two-dimensional heatmaps (C, D). The three-dimensional plots show the IR absorbance (height on vertical axis, color) as a function of wavenumber and location along the absolute diameter of the bead. The two-dimensional plots show the IR absorbance (color) as a function of wavenumber (y-axis) and location along the absolute diameter of the bead (x-axis). The strong absorbance band at approx. 1740 cm−1 is caused by the carbonyl bond of the polymer. In the enzyme-containing sample, the weak amide II band at 1540 cm−1 can be seen faintly at the fringes of the bead, confirming the presence of enzyme, together with the stronger absorption at the amide I band.

2.2. Penetration of the Enzyme into the Hydrophilic Carrier Beads (ECR8204M) during the Immobilization Procedure

The same studies as described in Section 2.1 were performed for samples of ECR8204M carrier beads taken at 0 h (blank), 0.25 h, 0.5 h, 1 h, 2 h, 4 h, 6 h, and 24 h of the CalB immobilization process, to monitor the enzyme penetration depth.
Figure 3 shows an overlay of absorbance profiles for all samples of ECR8204M (A), and an overlay of the profiles zoomed to the left border of the particle (up to 20% relative diameter) of the first hour of immobilization (B). Unlike with ECR1030M, there is a significant background signal in the amide I region caused by the constituents of the resin. In addition, there seems to be no clear border region where the enzyme is exclusively located. The enzyme concentration towards the edges of the particle is slightly higher after the first hour of immobilization, forming a U-shaped profile. The absorbance then becomes more homogeneous over the diameter of the particle as immobilization time progresses. Contrary to ECR1030M, the enzyme appears to be present throughout the entire particle after 24 h of immobilization, with only a slightly higher concentration at the edges of the bead. The integral of IR absorbance at the amide I band across the entire diameter depicted in Figure 3C shows a shape of the curve similar to that of ECR1030M. After 1 h, 72% absorbance integral relative to the sample taken at 24 h is reached.
Figure 4 shows three-dimensional plots of ECR8204M without enzyme (A) and after 24 h of immobilization (B) and the corresponding two-dimensional heatmaps (C, D). In the enzyme-containing sample, the amide II band at 1540 cm−1 can be seen faintly; however, the constituents of the resin also seem to lead to interference in this region.

2.3. Immobilized CALB Activity and Retention on Carriers

The CalB activity on both resins was measured using two different activity assays (Figure 5A,B). The propyl laurate test (PLU/g) is based on the esterification of lauric acid and 1-propanol whereas the 1-phenylethyl acetate test (U/g) is based on the transesterification of 1-phenylethanol and vinyl acetate. The main goal behind this set of experiments was to verify if there was an effect of the size and type of substrates and products on the enzyme activity at different immobilization times. In the PLU reaction a large aliphatic ester is produced with water as by-product while in the transesterification reaction a smaller aromatic compound is produced with vinyl alcohol as by-product. Interestingly, the activity was always higher when the enzyme was immobilized on ECR1030M, regardless of the activity assay (Figure 5A,B). Moreover, maximum activities were obtained within the first 30 min of immobilization on ECR1030M, but it took longer (1–2 h) to get maximum activities for the immobilization on ECR8204M.
The liquid fractions before and after the immobilization were analyzed by SDS-PAGE and the CalB activity was measured to further understand the differences observed (Figure 6). The SDS-PAGE showed that CalB (33 kDa) was preferentially retained on all immobilizations while the other proteins present in the initial enzyme solution were retrieved in the liquid after the immobilization (Figure 6A). These results were confirmed by the pNPB assay (Figure 6B), indicating that almost all the initial CalB (>97%) was retained in the beads under all conditions, and after 2 h of immobilization, all samples had a very similar amount of enzyme (>99%). Despite the loading after 2 h being very similar in all samples, it seemed that CalB had a stronger affinity towards ECR1030M than for ECR8204M in the initial immobilization times (Figure 6B).
To better understand the main interactions that took place during the immobilizations whether they are hydrophobic, ionic or covalent, the immobilized samples were incubated with 1% Triton X-100 solution and the liquid fractions were analyzed by SDS-PAGE and the pNPB activity was measured (Figure 7A,B). The SDS-PAGE results clearly showed that the main interaction between CalB and ECR1030M was hydrophobic and most of the enzyme was removed by the treatment with a surfactant as Triton X-100 (Figure 7A). Moreover, the incubation with the surfactant removed only CalB (33 kDa) confirming that this was the only enzyme retained during the immobilization from the initial enzyme solution which contained several other proteins (Figure 6A). On the contrary, only a very small amount of CalB was removed from the ECR8204M, confirming that the CalB was covalently bonded to the resin beads via the epoxy functional groups.
The SDS-PAGE results from Figure 7A were confirmed by the CalB activity results obtained using the pNPB assay (Figure 7B), showing that the entire CalB activity was recovered from the immobilization on ECR1030M and only minimal activities were recovered from the covalent immobilizations on ECR8204M.

3. Discussion

The study showed that when CalB was immobilized on a hydrophobic resin as ECR1030M, we encountered a behavior similar to what was observed by Chen et al. (2008) for Novozyme 435 [14], but a different behavior was observed for the hydrophilic resin ECR8204M. In this work, we also showed that on ECR1030M, the enzyme was immobilized only in the external shell of the polymer, in a section of about 50–70 µm. A similar behavior could be observed with Lewatit® VP OC 1600, which has a similar chemical structure to ECR1030M [15]. However, CalB fully penetrated the resin beads when immobilized on the hydrophilic resin ECR8204M. This contrasts with the observations from Chen et al., where the enzyme distribution on Amberzyme PMMA (similar hydrophilicity, same functional groups to ECR8204M) was not homogeneous, with the enzyme only present on the surface of the matrix [14]. The pore size of Amberzyme (220 Å) was half of the pore size in ECR8204M (519 Å), which may explain the differences.
The main differences between the two enzyme distribution patterns found in this work is related to the hydrophobicity of the beads and the interaction that occurred between the enzyme and the resin. The interaction between CalB and ECR1030M is mainly hydrophobic and occurs rapidly in the first 15–60 min from the immobilization, and the loading front is narrower than in ECR8204M. As suggested by others [14,17], epoxy-activated resins would have a two-step immobilization mechanism where firstly the enzyme is adsorbed onto the bead surface and then the covalent bond is formed. In this case, the interaction takes more time, and this allows the enzyme to diffuse deeper inside the resin. Another hypothesis from Gross’s group [12,14,18] points out that there could be repulsive interactions between the immobilized and free CalB forms, and this repulsion would be stronger with hydrophobic resins given the hydrophobic nature of CalB [12] and would contribute to the binding profile differences between hydrophobic and hydrophilic resins.
The very interesting result is the measurement of the enzyme interaction with the resin during the immobilization process. We analyzed the enzyme diffusion in the beads over a period of 24 h, by analyzing after 0.25 h, 0.5 h, 1 h, 2 h, 4 h, 6 h, and 24 h of immobilization.
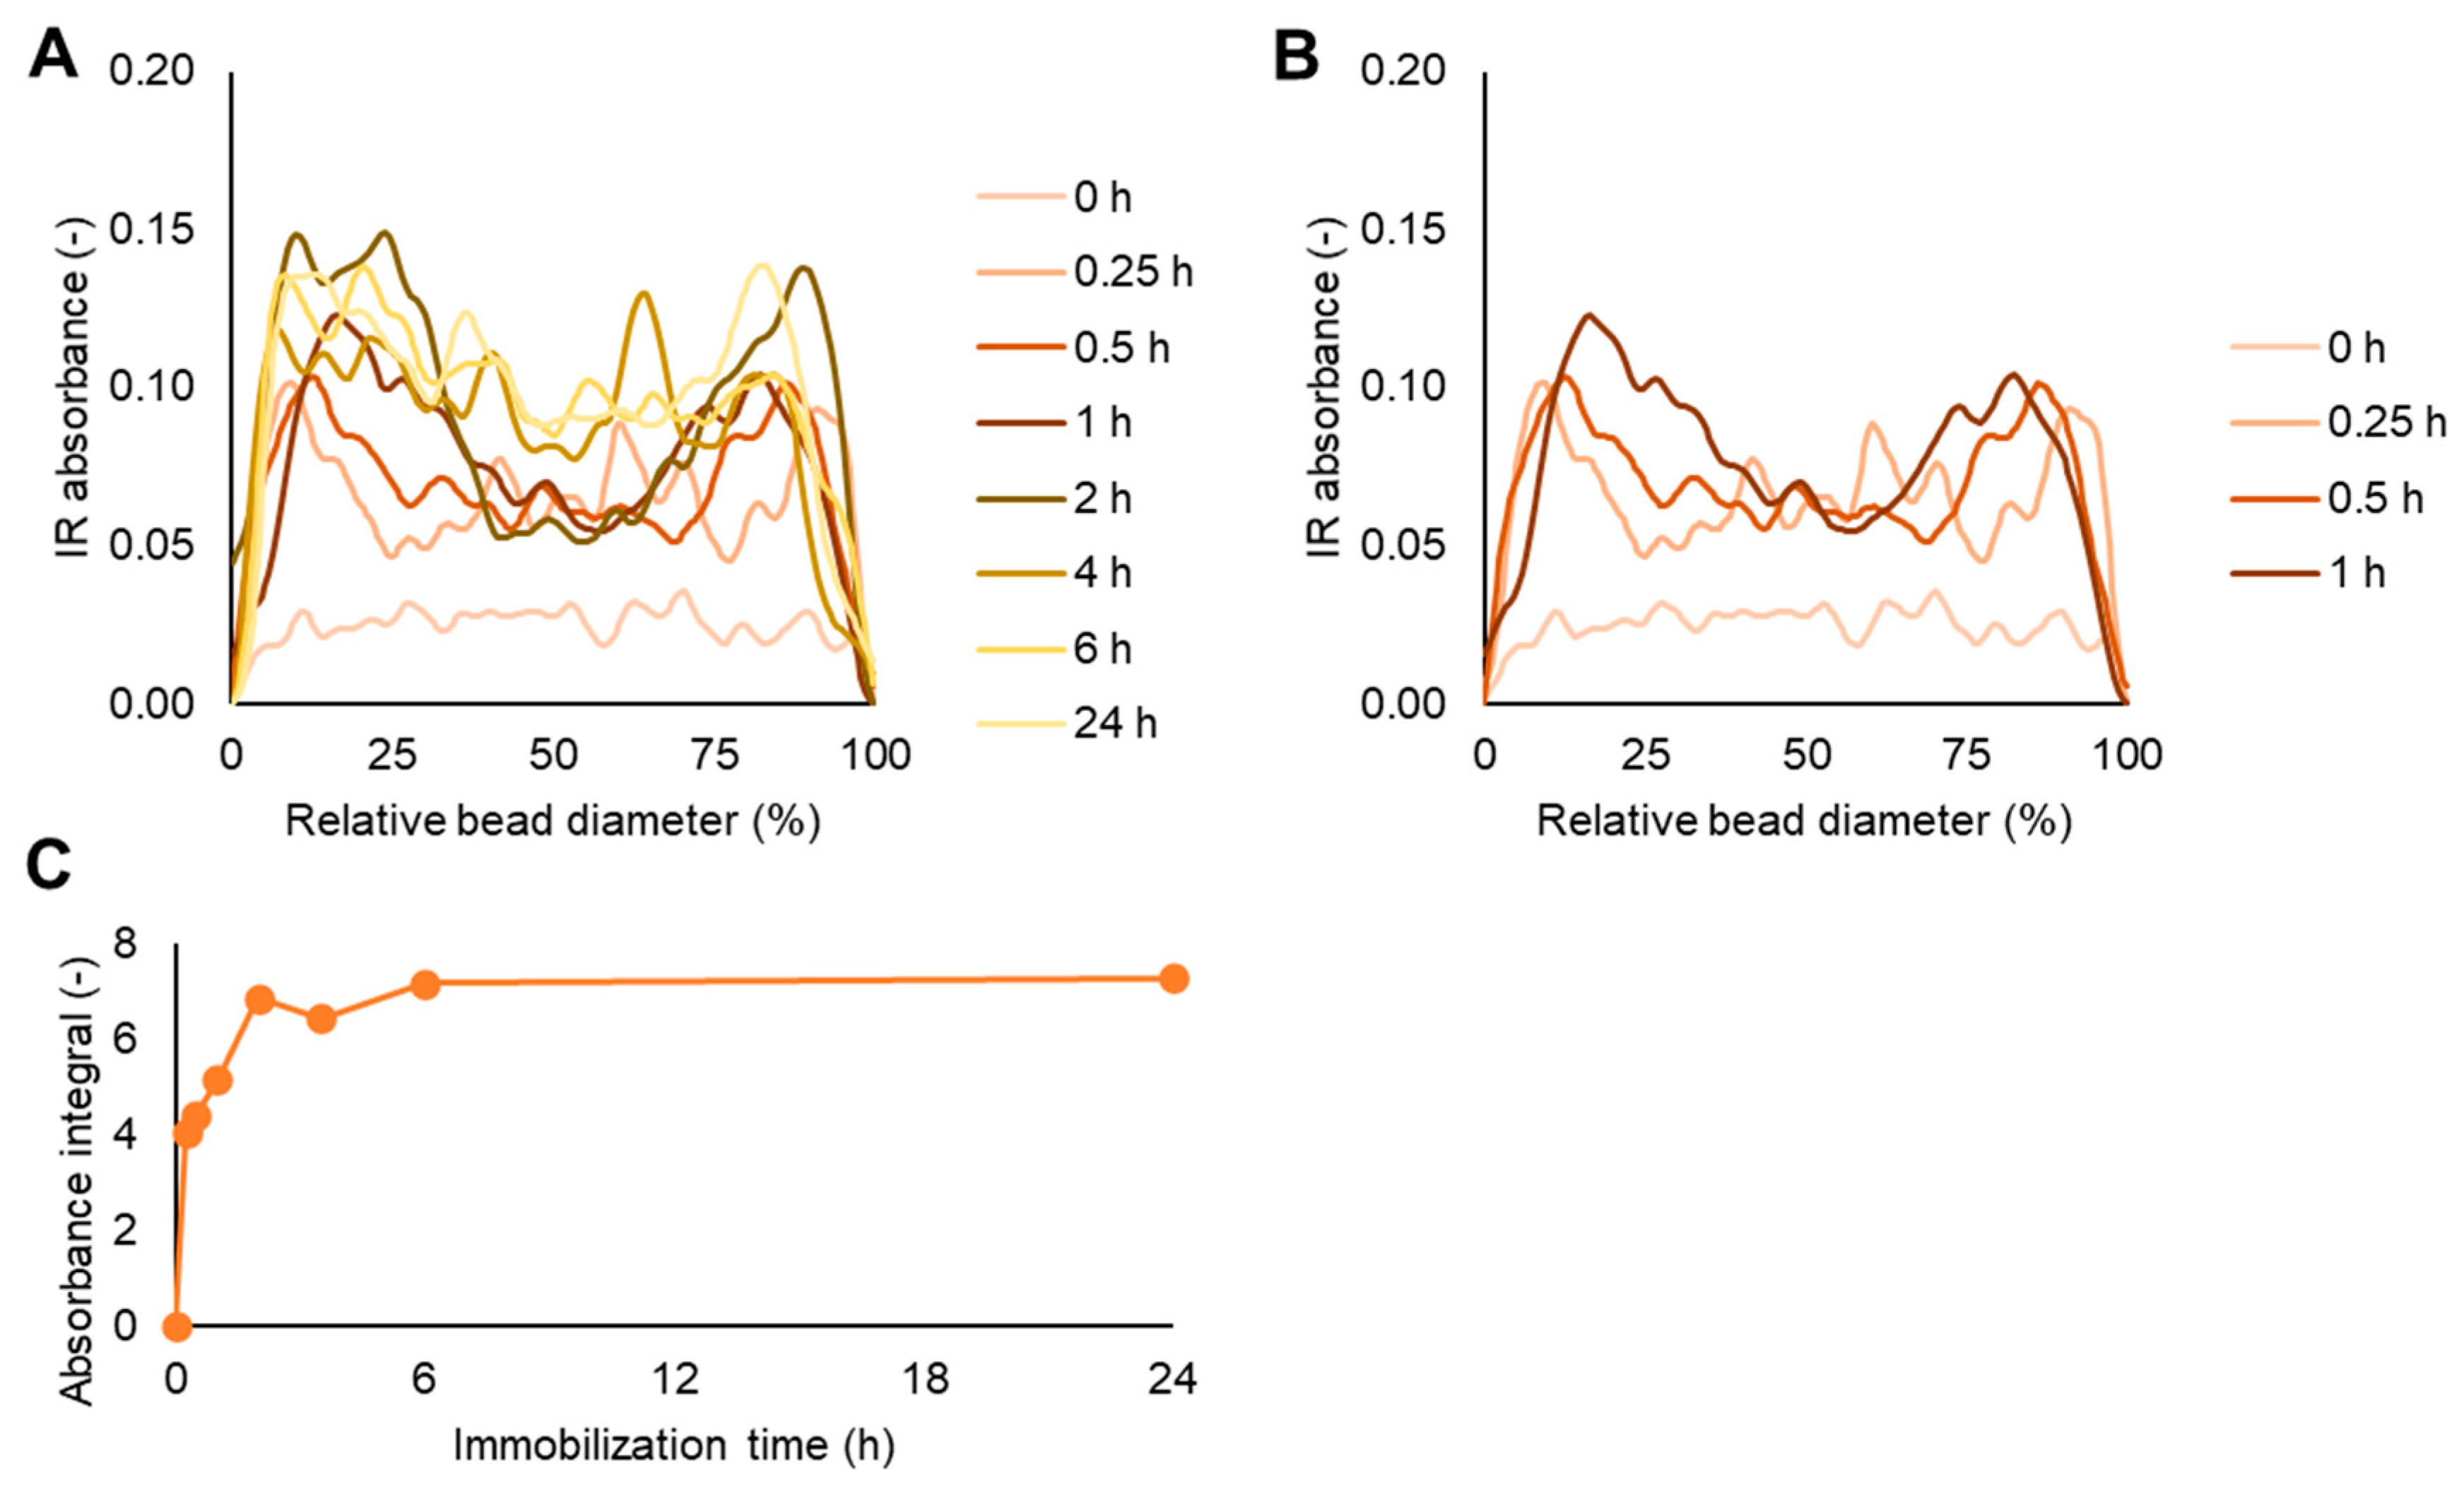
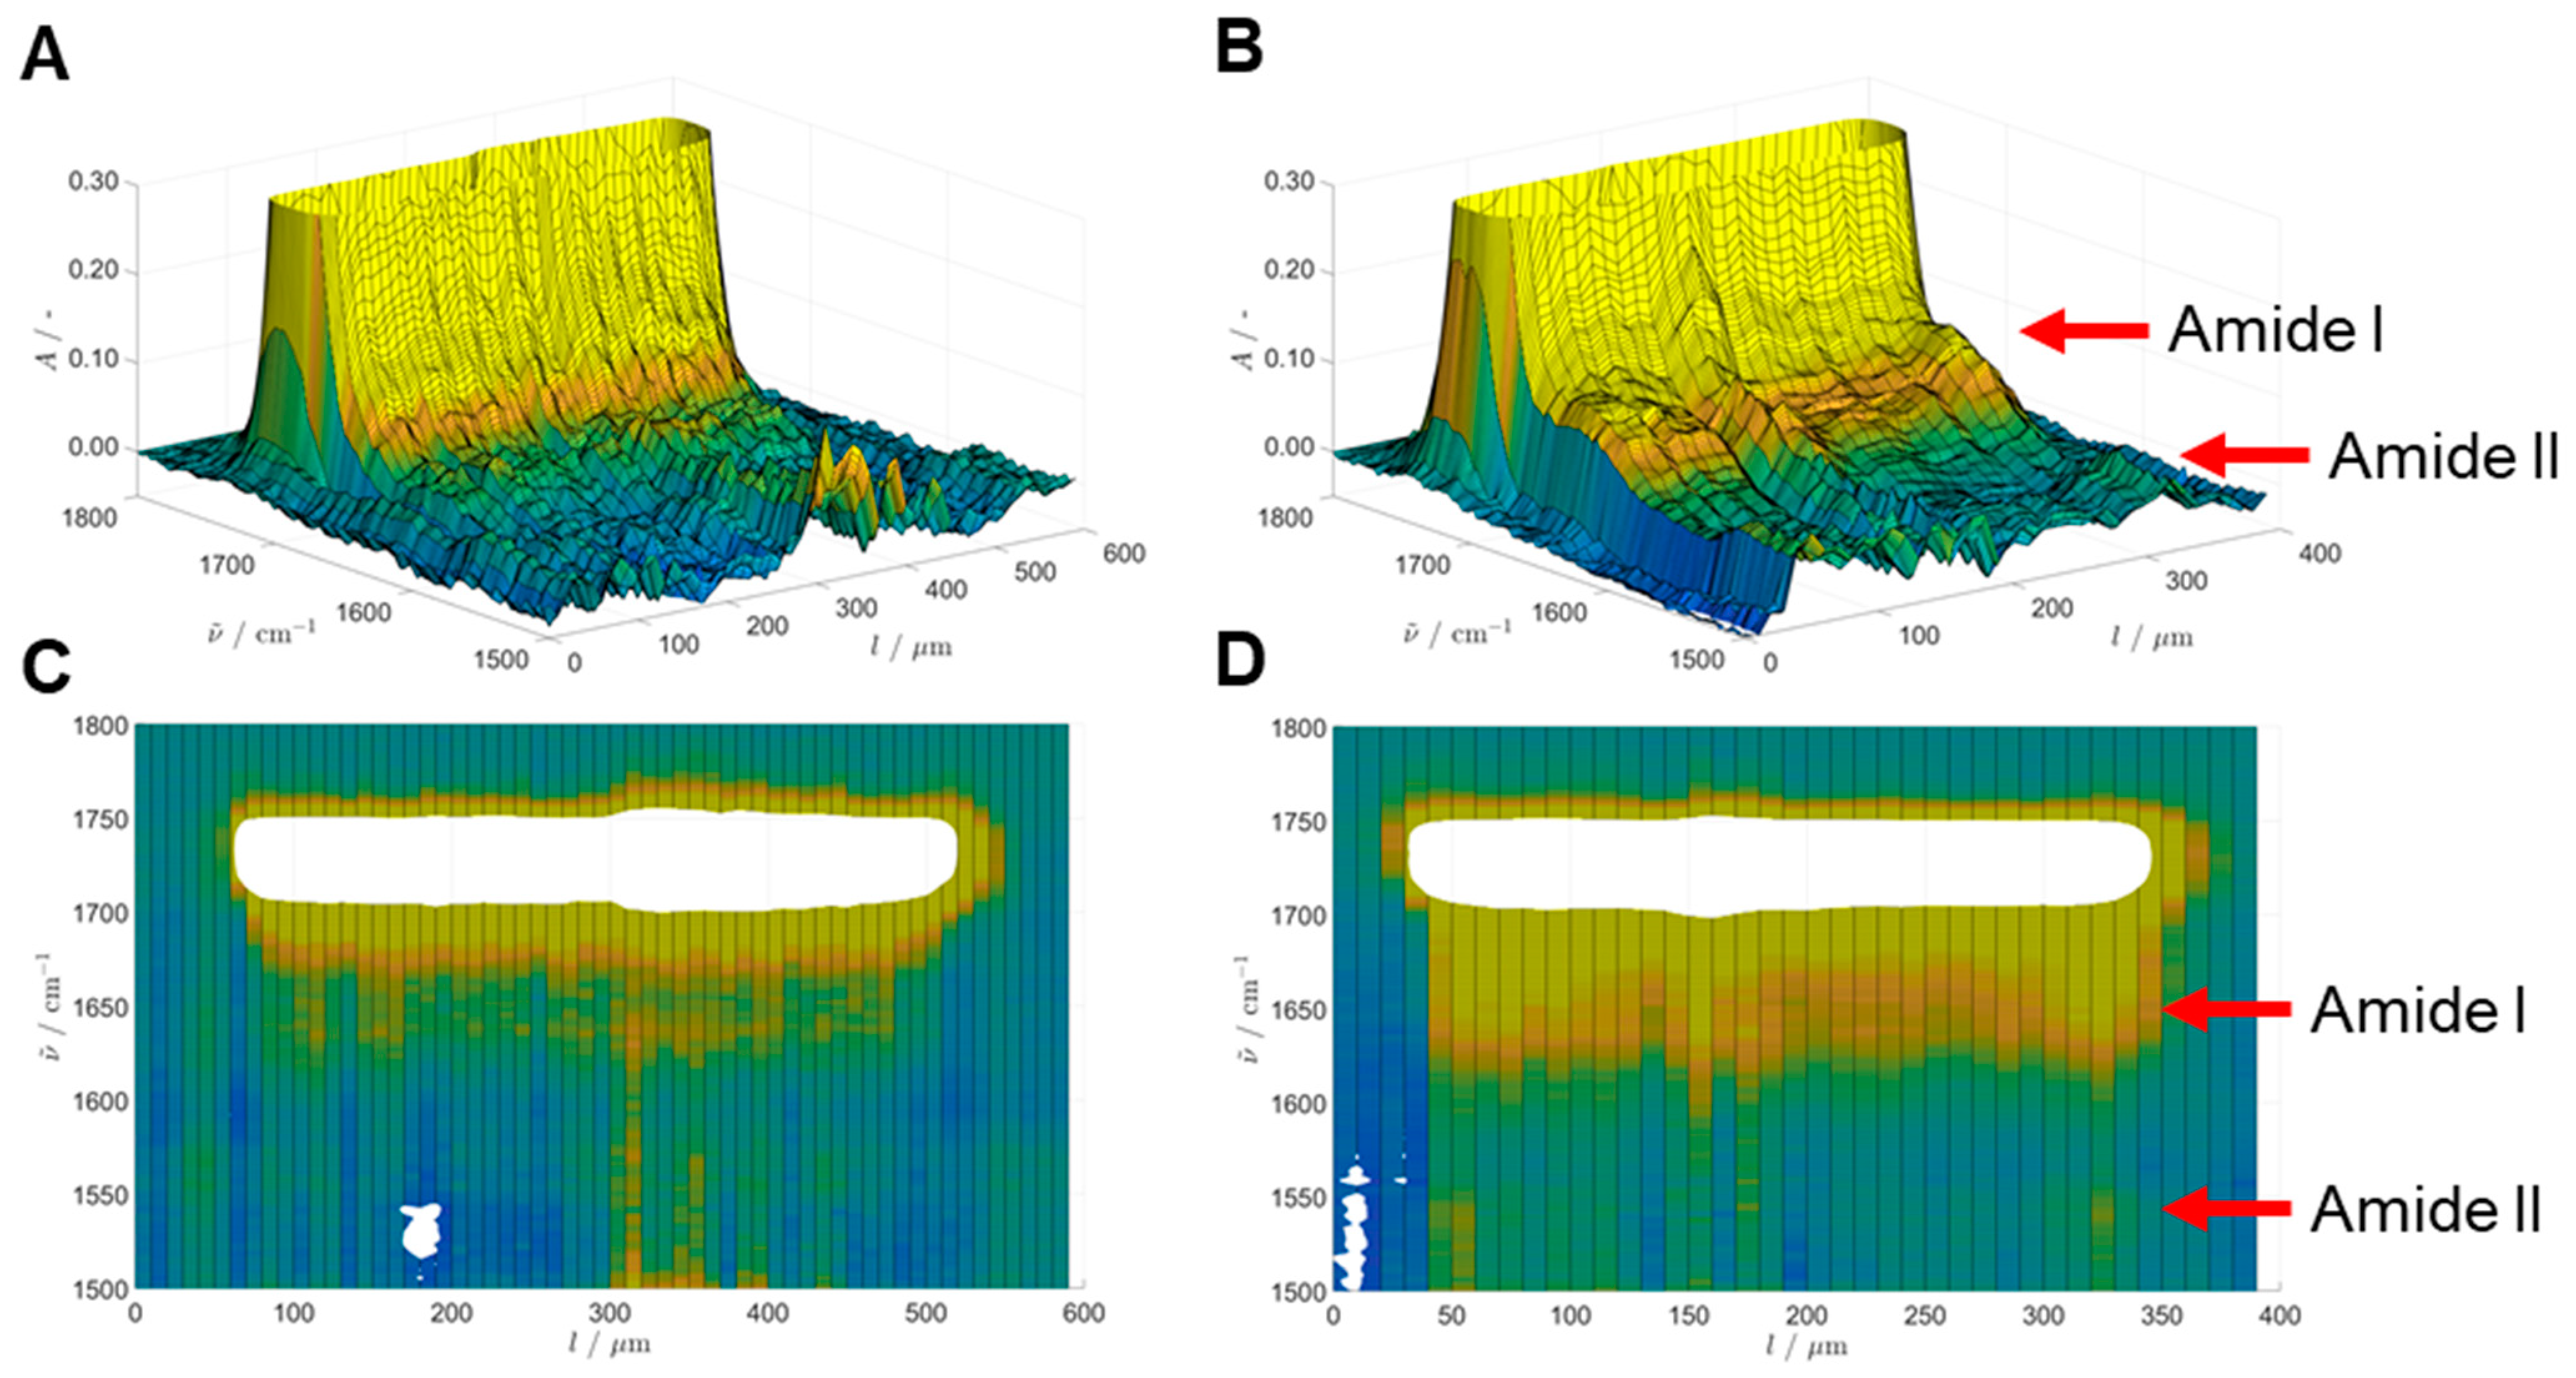
When CalB was immobilized on a hydrophilic resin such as ECR8204M (Figure 3) the diffusion started on the external part of the bead and the majority of the enzyme was concentrated after 1 h immobilization in the 30 µm range. Over time, the enzyme diffused towards the center of the bead and 24 h were required to complete the immobilization and reach the center of the beads (Figure 3).
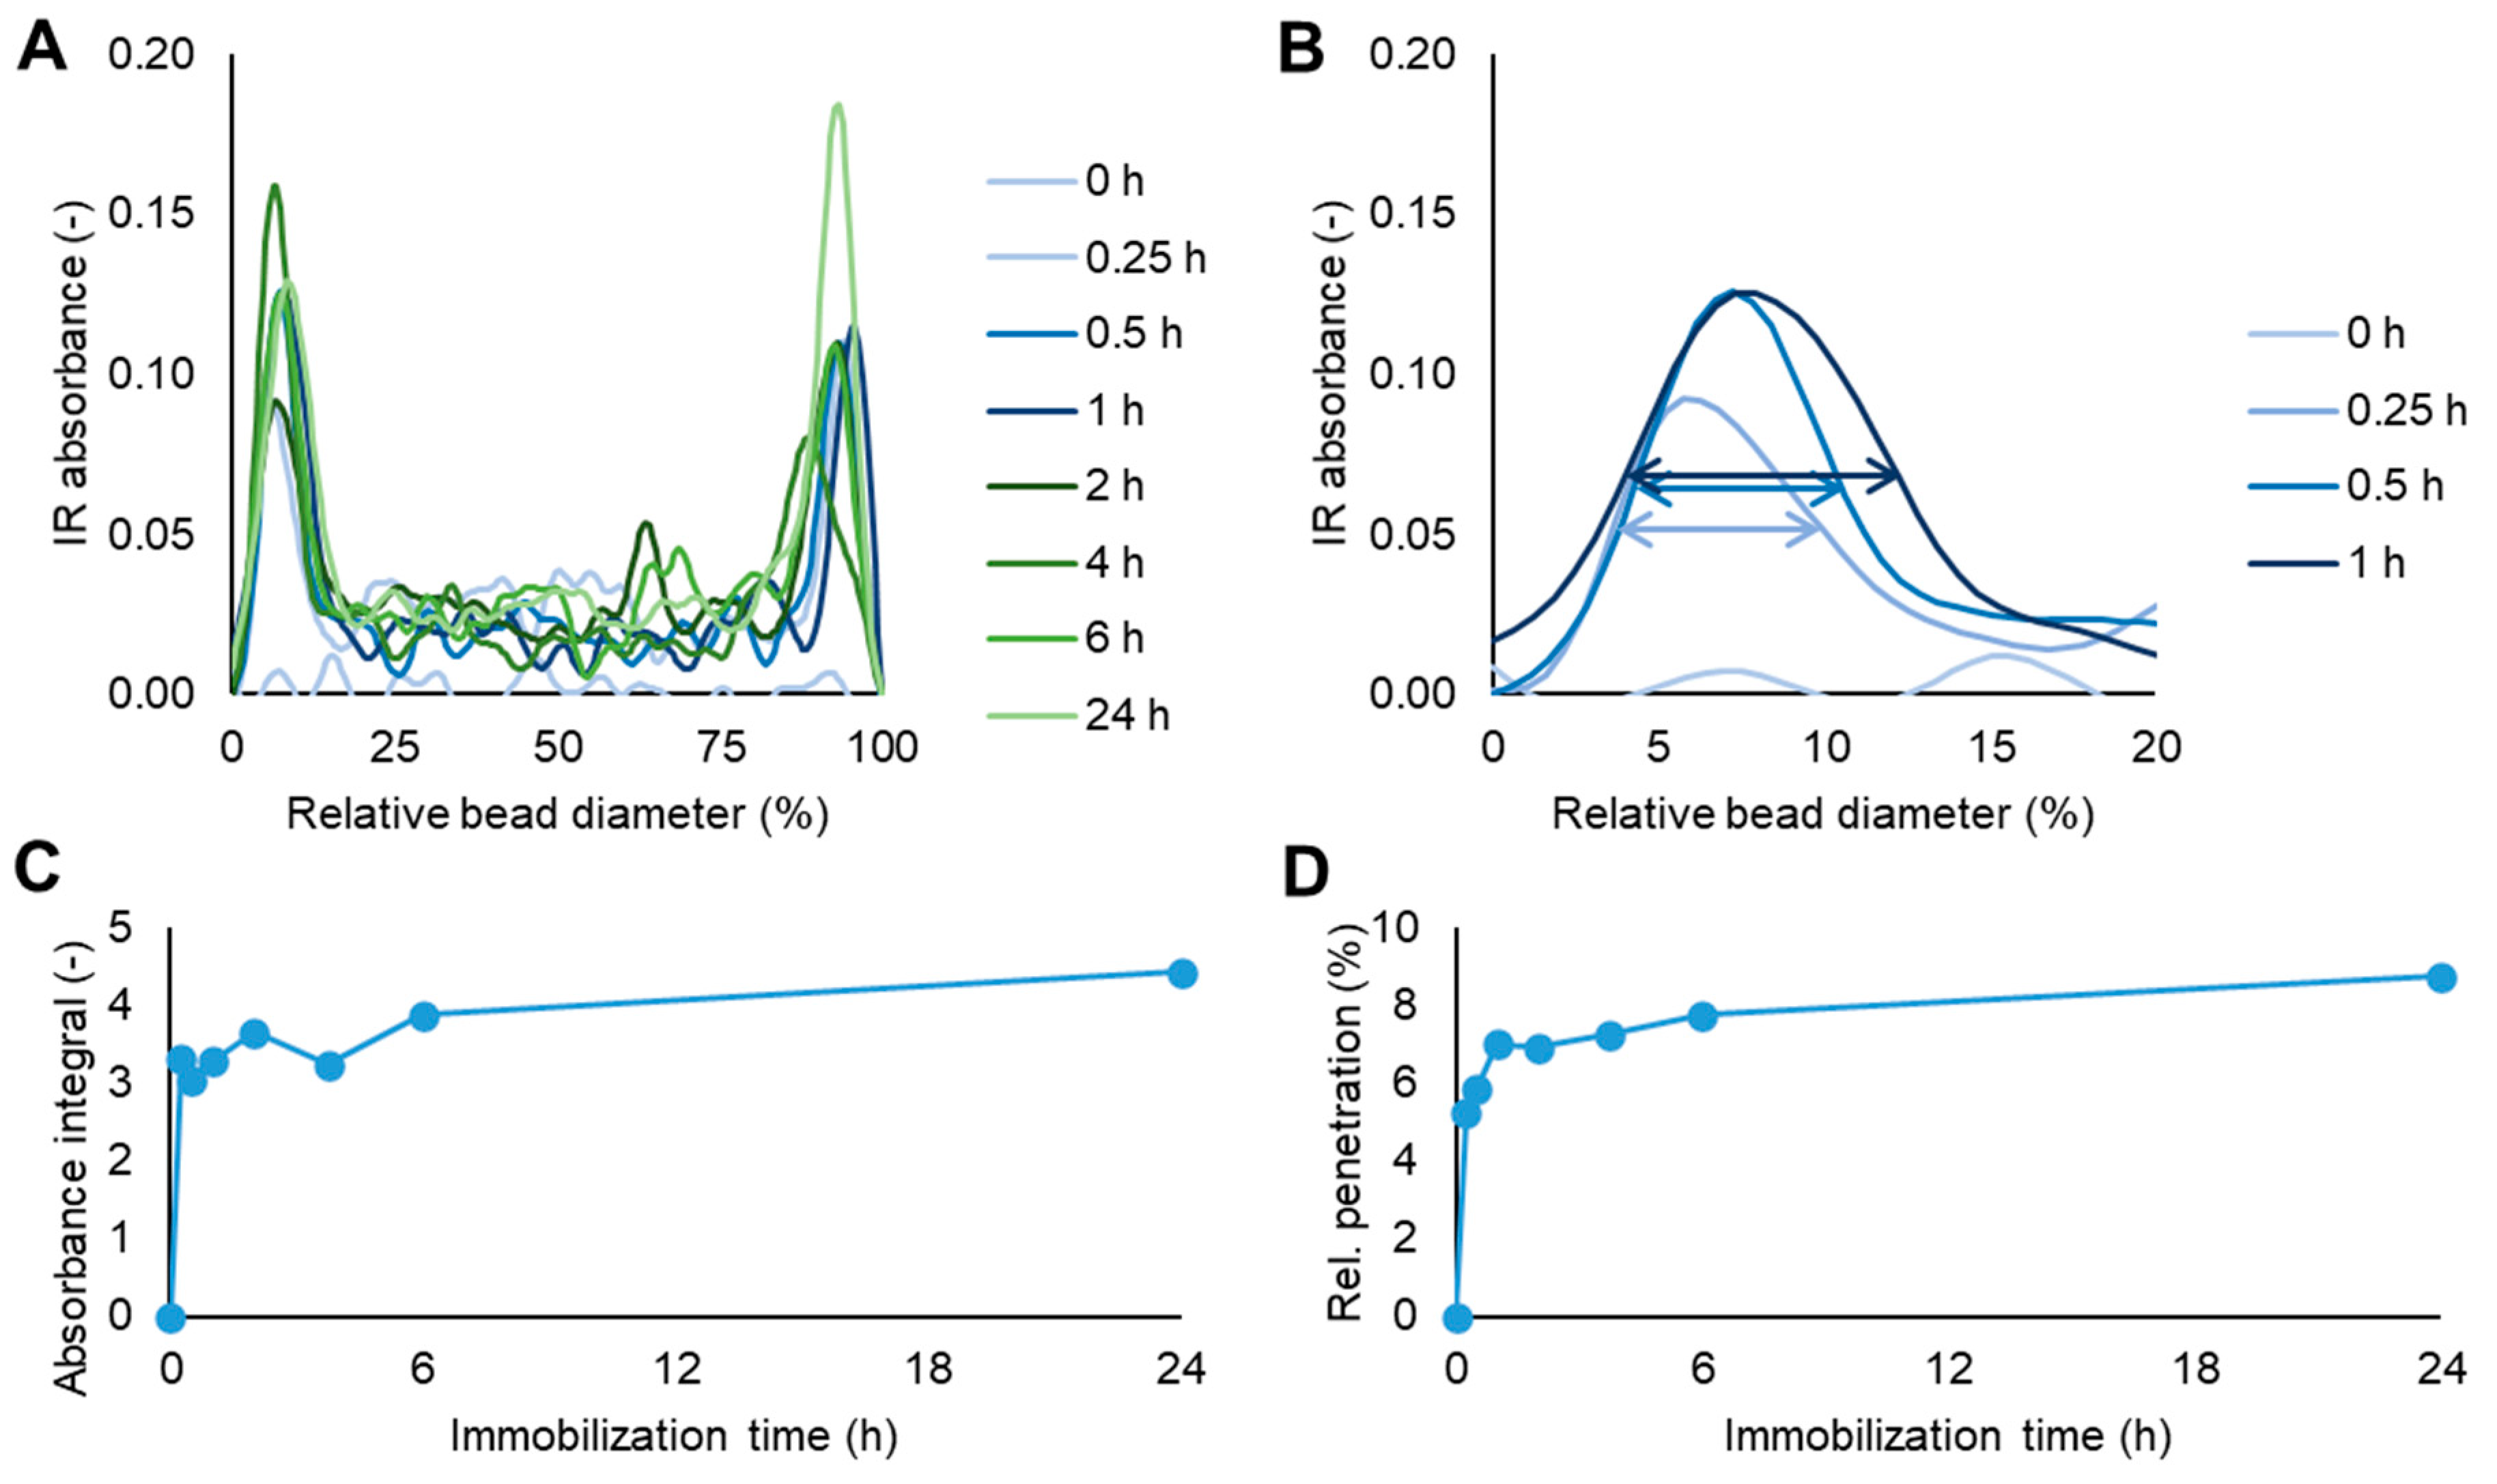
When CalB was immobilized on the hydrophobic resin ECR1030M the interaction proceeded in a completely different pattern. Although there was no linear correlation between the absolute or relative CalB penetration in ECR1030M depending on the bead size, the data obtained showed that the enzyme penetration within the first hour of immobilization was the most efficient, reaching approx. 30 µm (7%) from the surface of the beads, the additional immobilization time up to 6 h only increased the CalB migration inside the beads by another 10 µm, and the extended immobilization time to 24 h was only increasing the enzyme penetration to approx. 50 µm from the bead surface (Figure 1). These FT-IR microscope values are a confirmation of the fast hydrophobic interaction between CalB and the enzyme carrier ECR1030M.
The findings of the IR measurements were correlated with the measurements of enzyme activity over time.
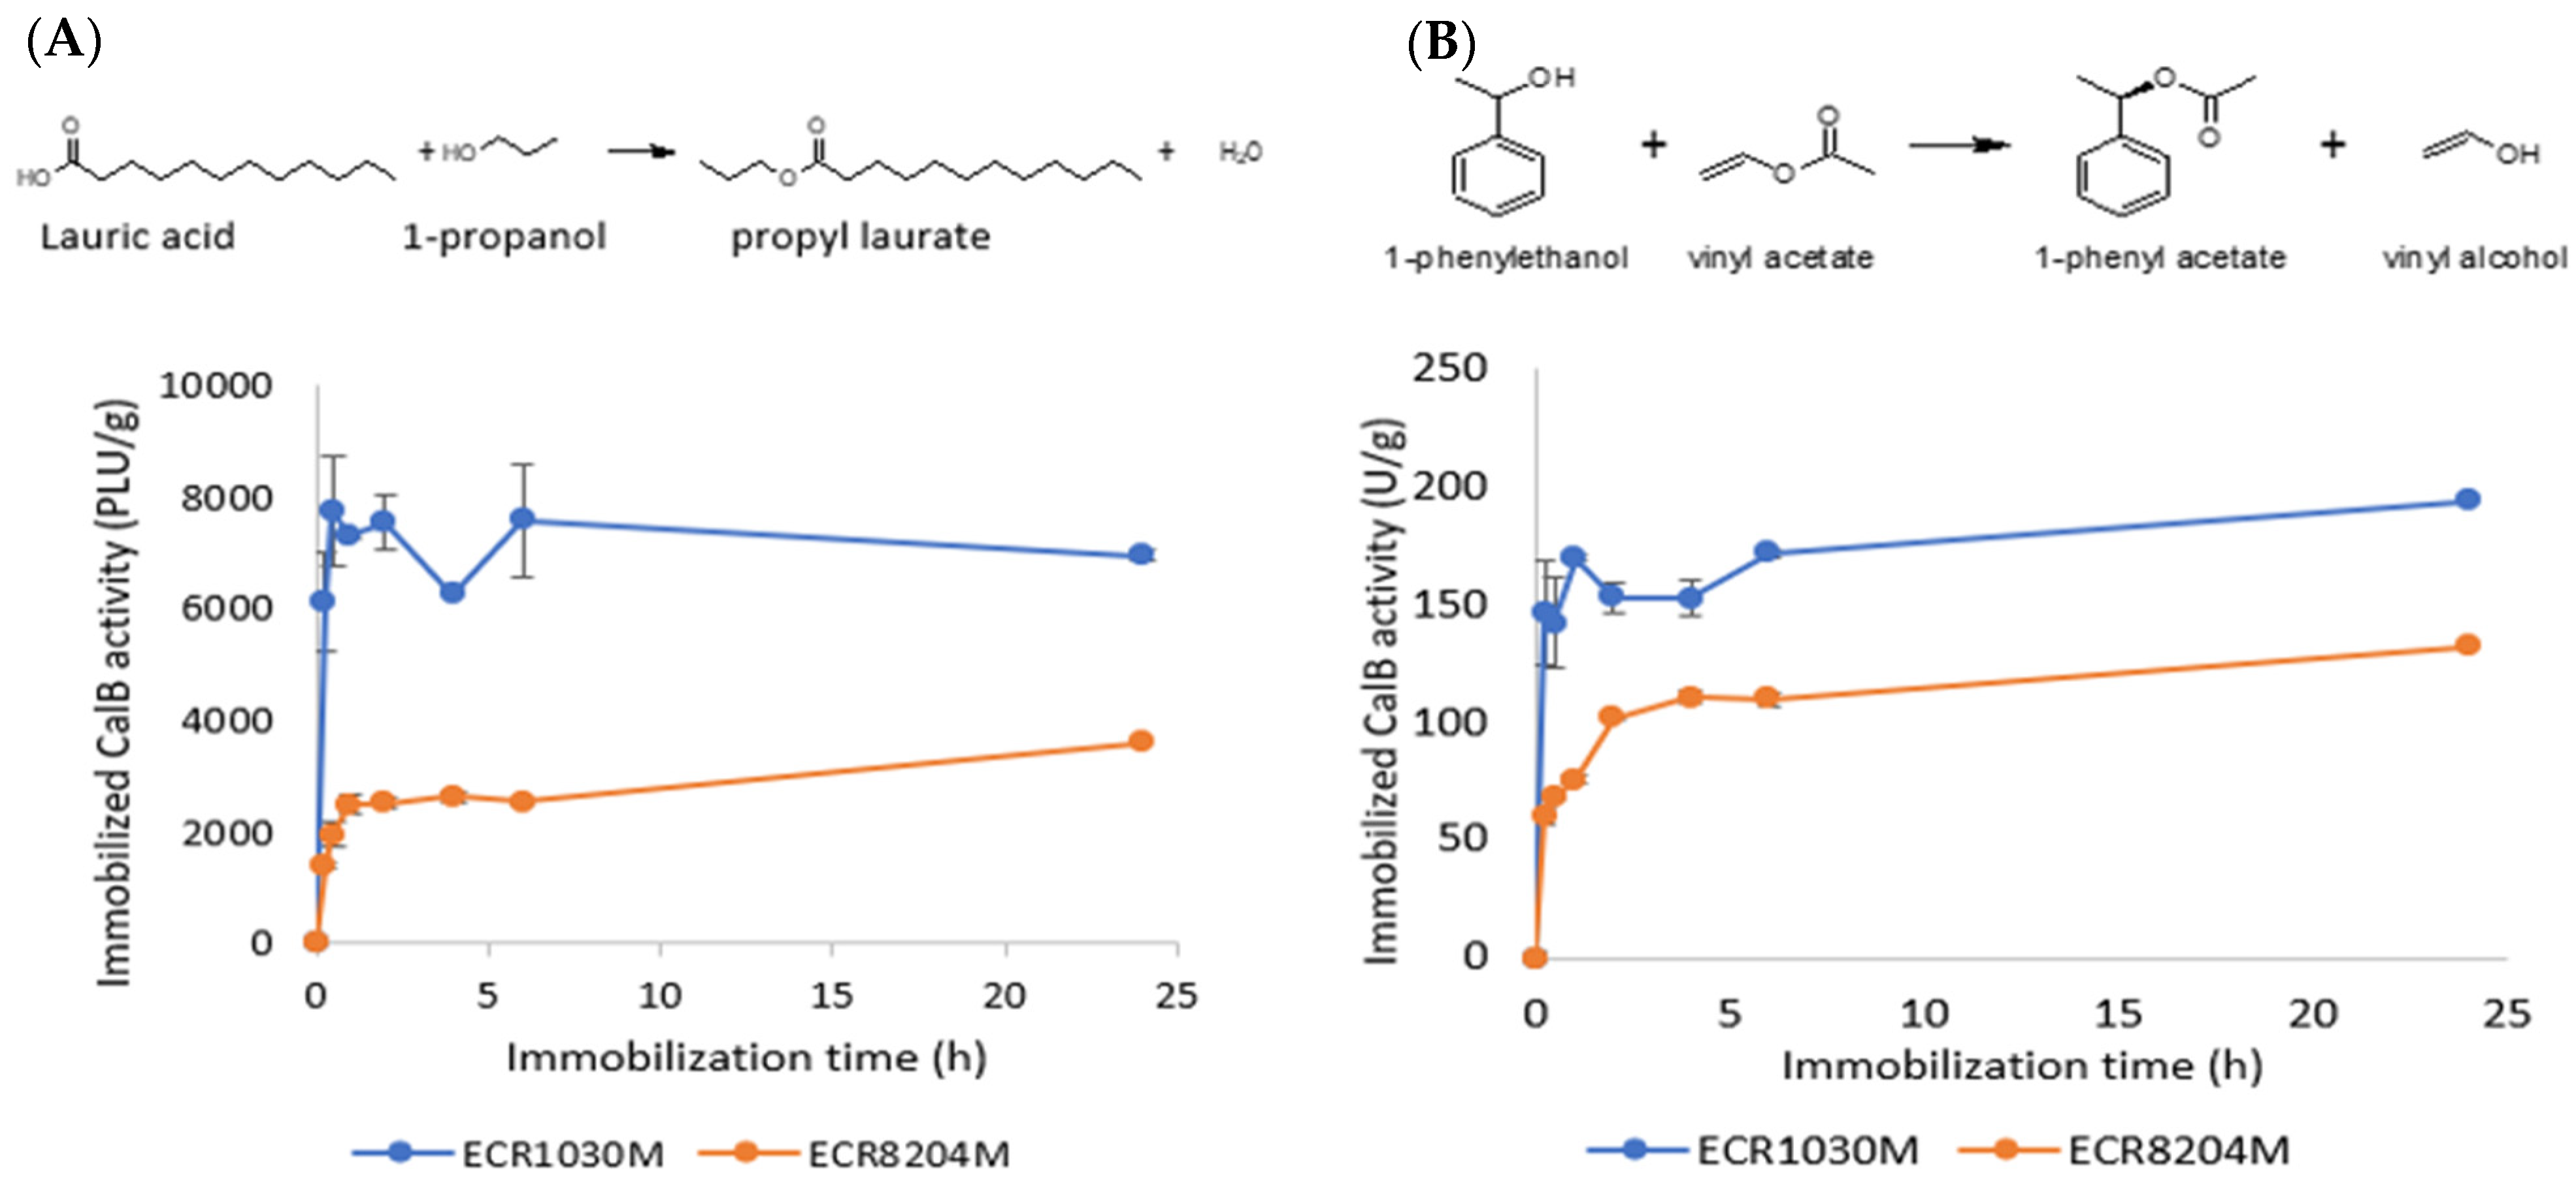
The enzyme activities on ECR1030M were always higher than on ECR8204M (3.2 ± 0.8 times higher in the PLU test and 1.8 ± 0.4 times higher in the 1-phenylethyl acetate test) for all immobilization times and activity test methods (
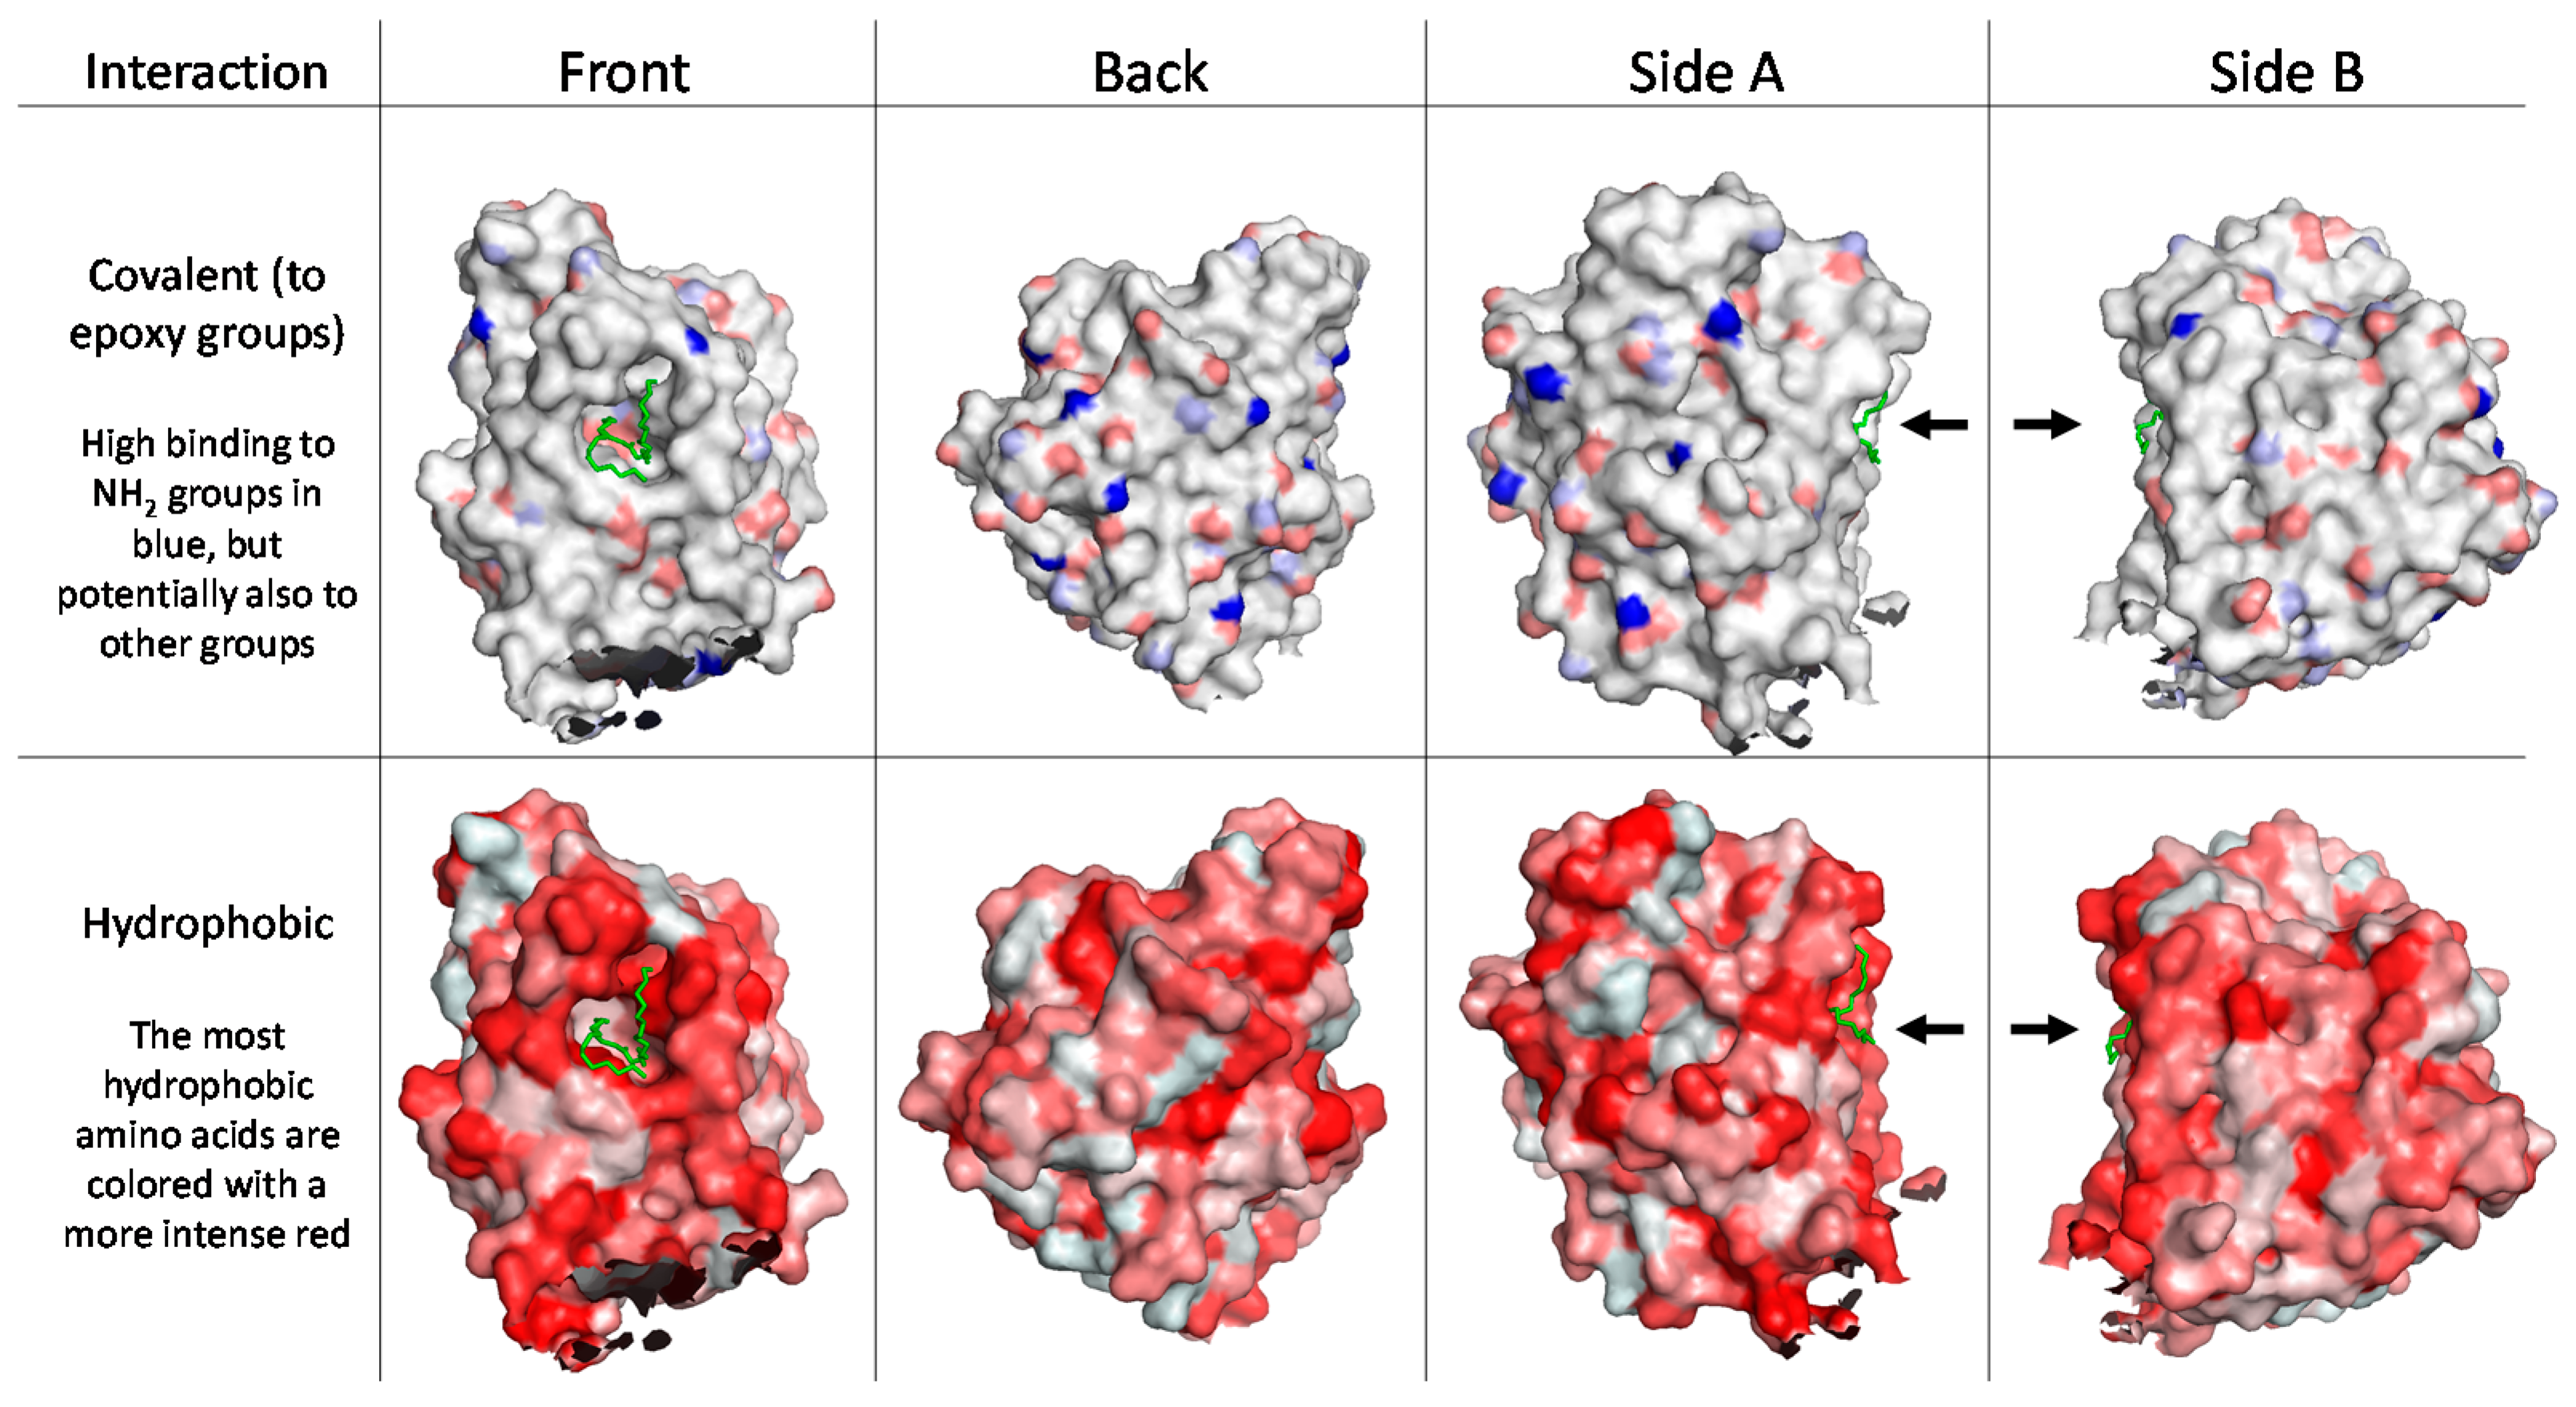
Figure 5). These results can be explained by analyzing the surface of the lipase CalB. In the paper from Basso et al. (2007) [16] the computational analysis of the surface of CalB showed that although the interfacial activation through the “lid” opening was absent, the enzyme evolved to act at the lipid/water interface. This is clearly demonstrated by the distribution of the hydrophilic and hydrophobic regions on the protein surface (Figure 8). In the case of CalB, it is interesting to note how a broad hydrophilic area is present opposite to the active site. This suggests that the orientation and even the conformation of CalB can change significantly when adsorbed on carriers that differ in hydrophilicity, confirming such behavior previously reported [19,20].
Moreover, the FT-IR and activity data supported the hypothesis that most of the activity came from the enzyme immobilized closer to the surface. For example, the loading front advanced in ECR8204M over the 24 h immobilization when the entire bead was almost saturated by the enzyme (Figure 3A,C). However, the enzyme activities were quite constant from 1–2 h up to 24 h (Figure 5) for CalB immobilized on both ECR1030M and ECR8204M. Moreover, despite the fact that CalB had a more uniform distribution throughout ECR8204M compared to ECR1030M, the enzyme activity was much higher on ECR1030M, indicating that the substrate and product diffusion through the diameter of the ECR8204M was not fast enough to give optimal activity. Additionally, when studying the potential binding sites at the surface of the enzyme towards the epoxy groups of the ECR8204M resin, it is likely that most of the enzyme is in a well-oriented form with many binding sites opposite to the catalytic center (Figure 8). [21] Nonetheless, the enzyme is covalently immobilized on ECR8204M, which renders the enzyme more rigid and could contribute to a lower activity. On the other hand, looking at the density of hydrophobic areas at the enzyme surface (Figure 8), it is likely that the active center of CalB, when immobilized on ECR1030M, is not exposed towards the reaction media (Figure 8); however, when CalB is in contact with hydrophobic media, it experiences the so-called interfacial activation [22], leading to higher activities. Moreover, the hydrophobic immobilization typically leads to a more dynamic enzyme conformation and not as restricted as when covalently bound to the resin. Hence, even though the orientation of the enzyme on ECR8204M might be better than on ECR1030M, the activity is not optimal, regardless of the substrate/products bulkiness or type of reaction, which leads to the conclusion that for CalB, the interfacial activation may lead to a higher activity than a good enzyme orientation.
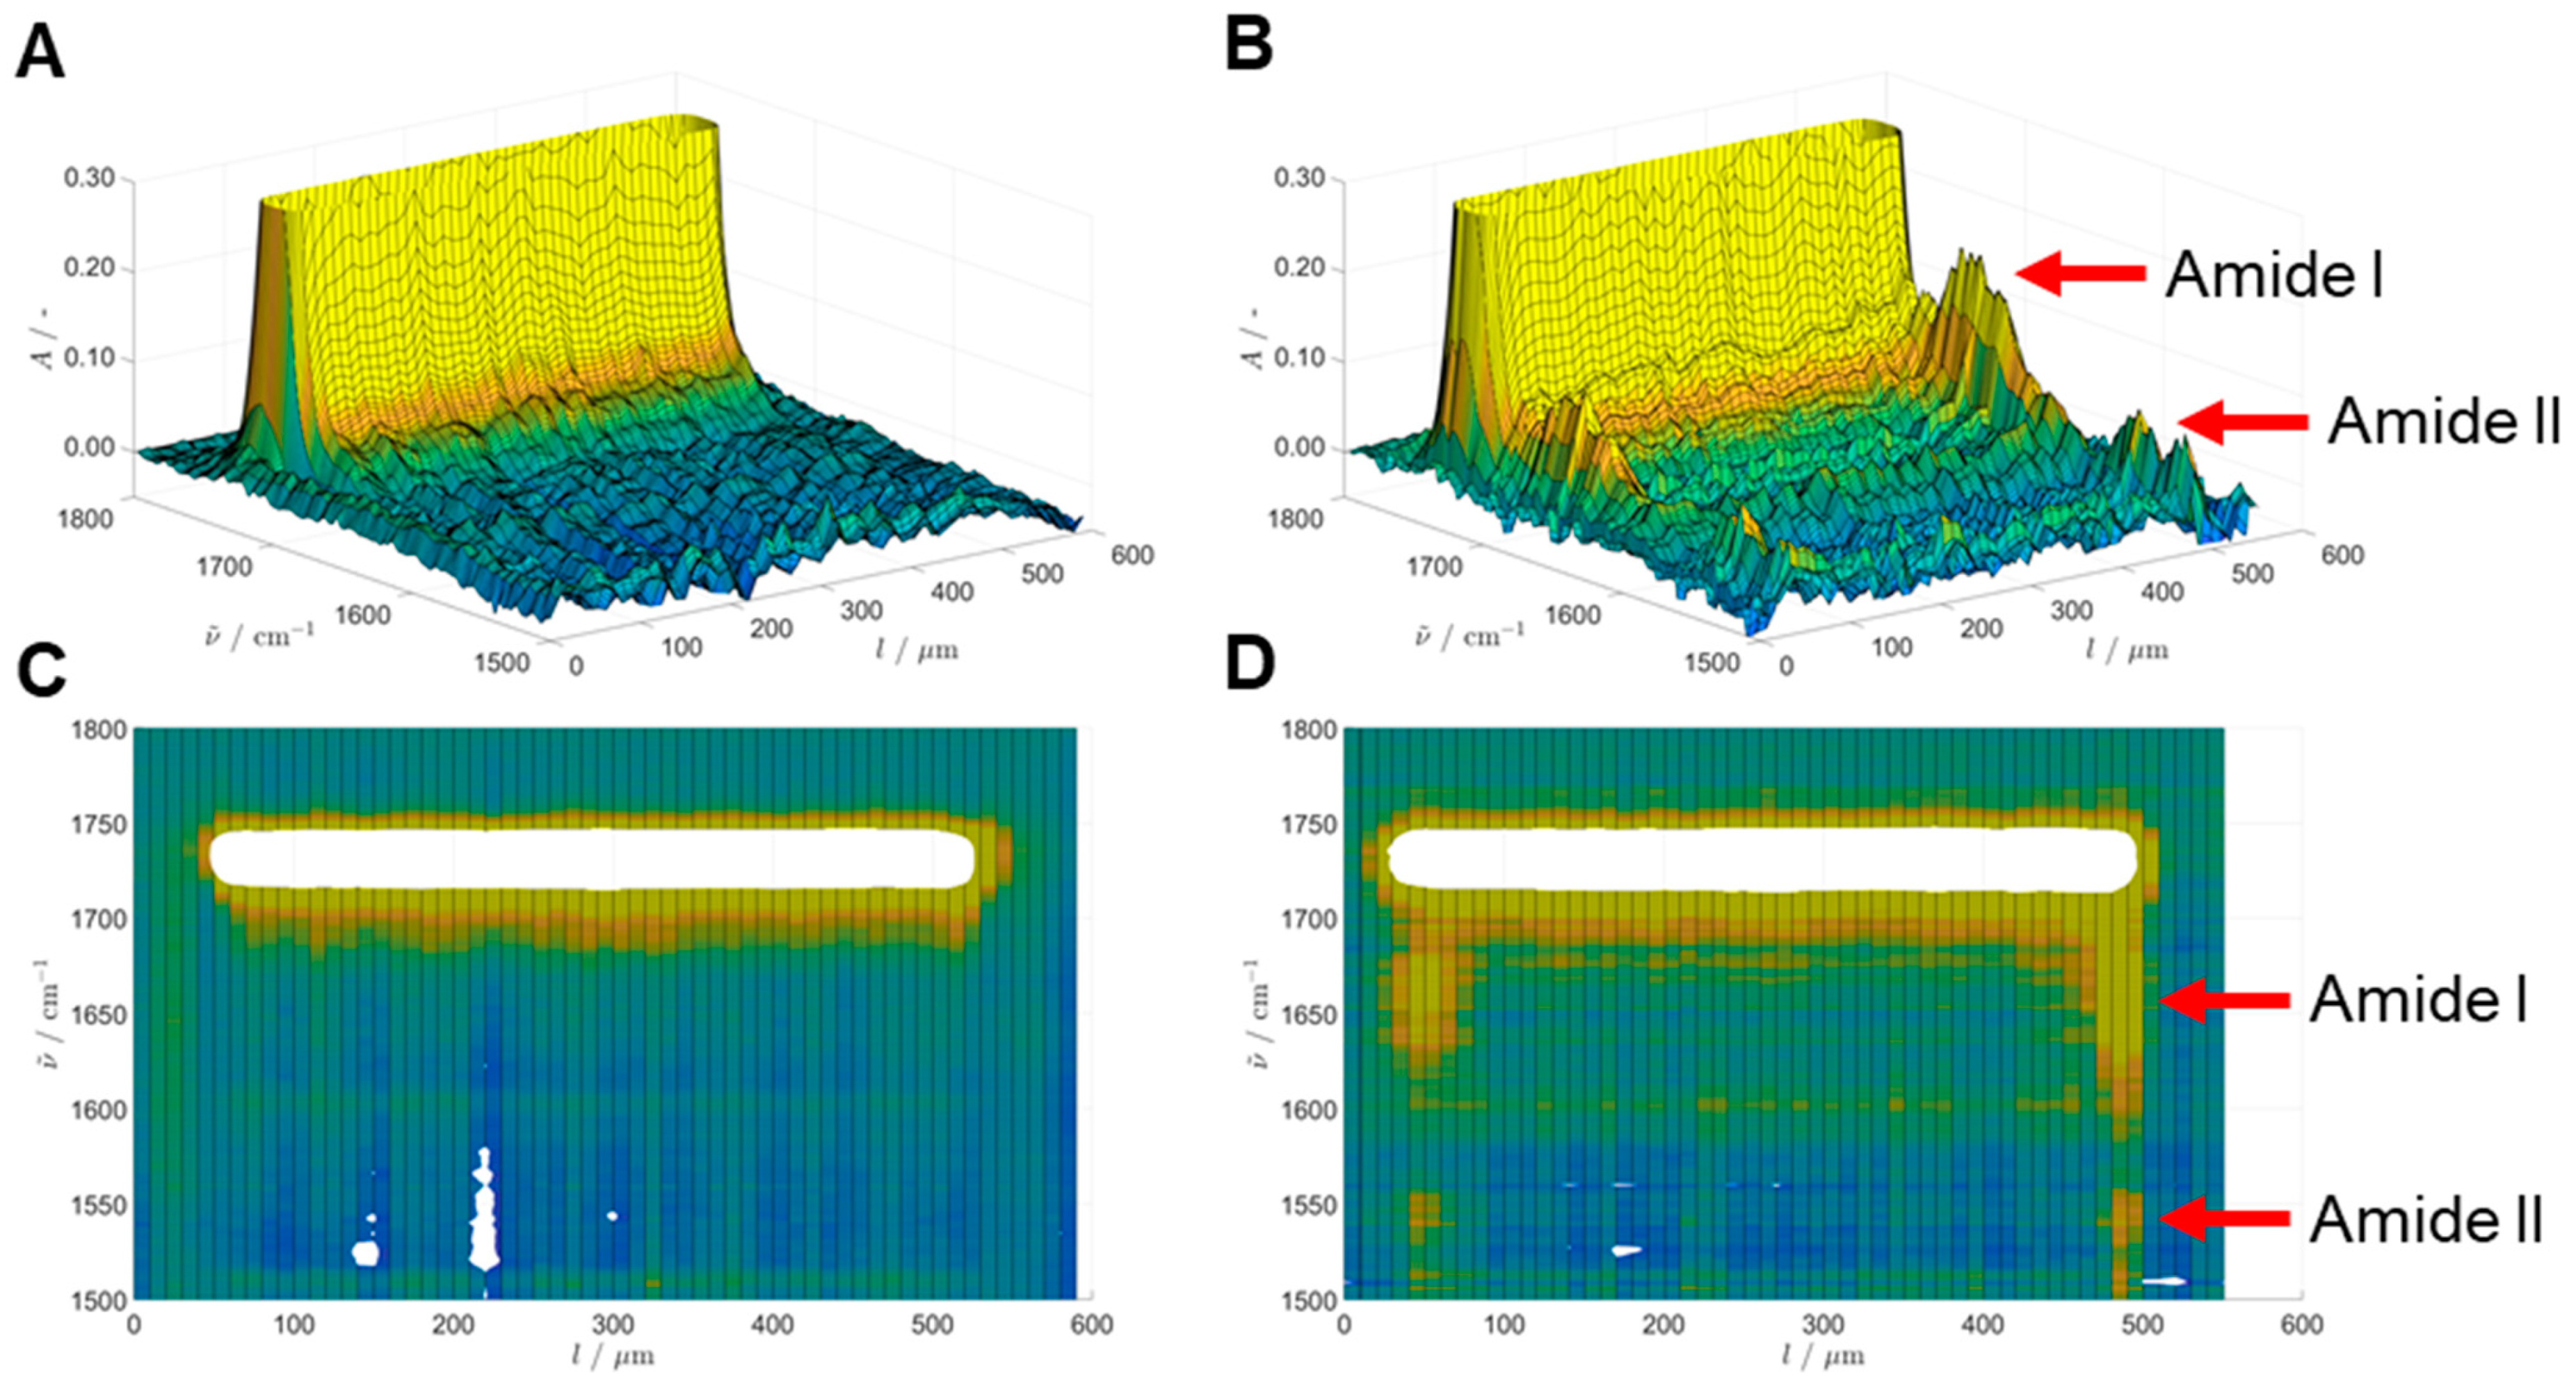
There was also a good correlation between the IR absorbance at the amide I band across the diameter of the beads (Figure 1C and Figure 3C) and the activities obtained (Figure 5A,B) and it can be concluded that the immobilization on ECR1030M occurred within the first 30 min, while it took up to 2 h on ECR8204M. The apparent dip in enzyme activity at the 4 h timepoint on ECR1030M, seen in Figure 5A, was also seen as a slightly lower amide I integral in Figure 1C, suggesting these were not measurement artifacts, but rather a difference caused by the immobilization procedure or workup. These data show that FT-IR can be a meaningful tool not only to study the secondary structure of an immobilized enzyme, as recently seen by Mangiagalli et al. [22], but also to study the enzyme distribution pattern within a support.
The fact that the CalB activity on ECR1030M was high using both substrates indicates that despite CalB not penetrating to the center of the particles, it is unlikely that the diffusion was hindered by size exclusion. The pore sizes of the particles used were more than 10 times larger than the size of CalB (30 Å × 40 Å × 50 Å) [23], and this should not have been a limitation for CalB to diffuse throughout the carrier bead. This links to observations made by Mei et al. (2003) [12], where it was proved that despite the enzyme being located on the surface of the particle, there were larger molecules that could diffuse across the beads.
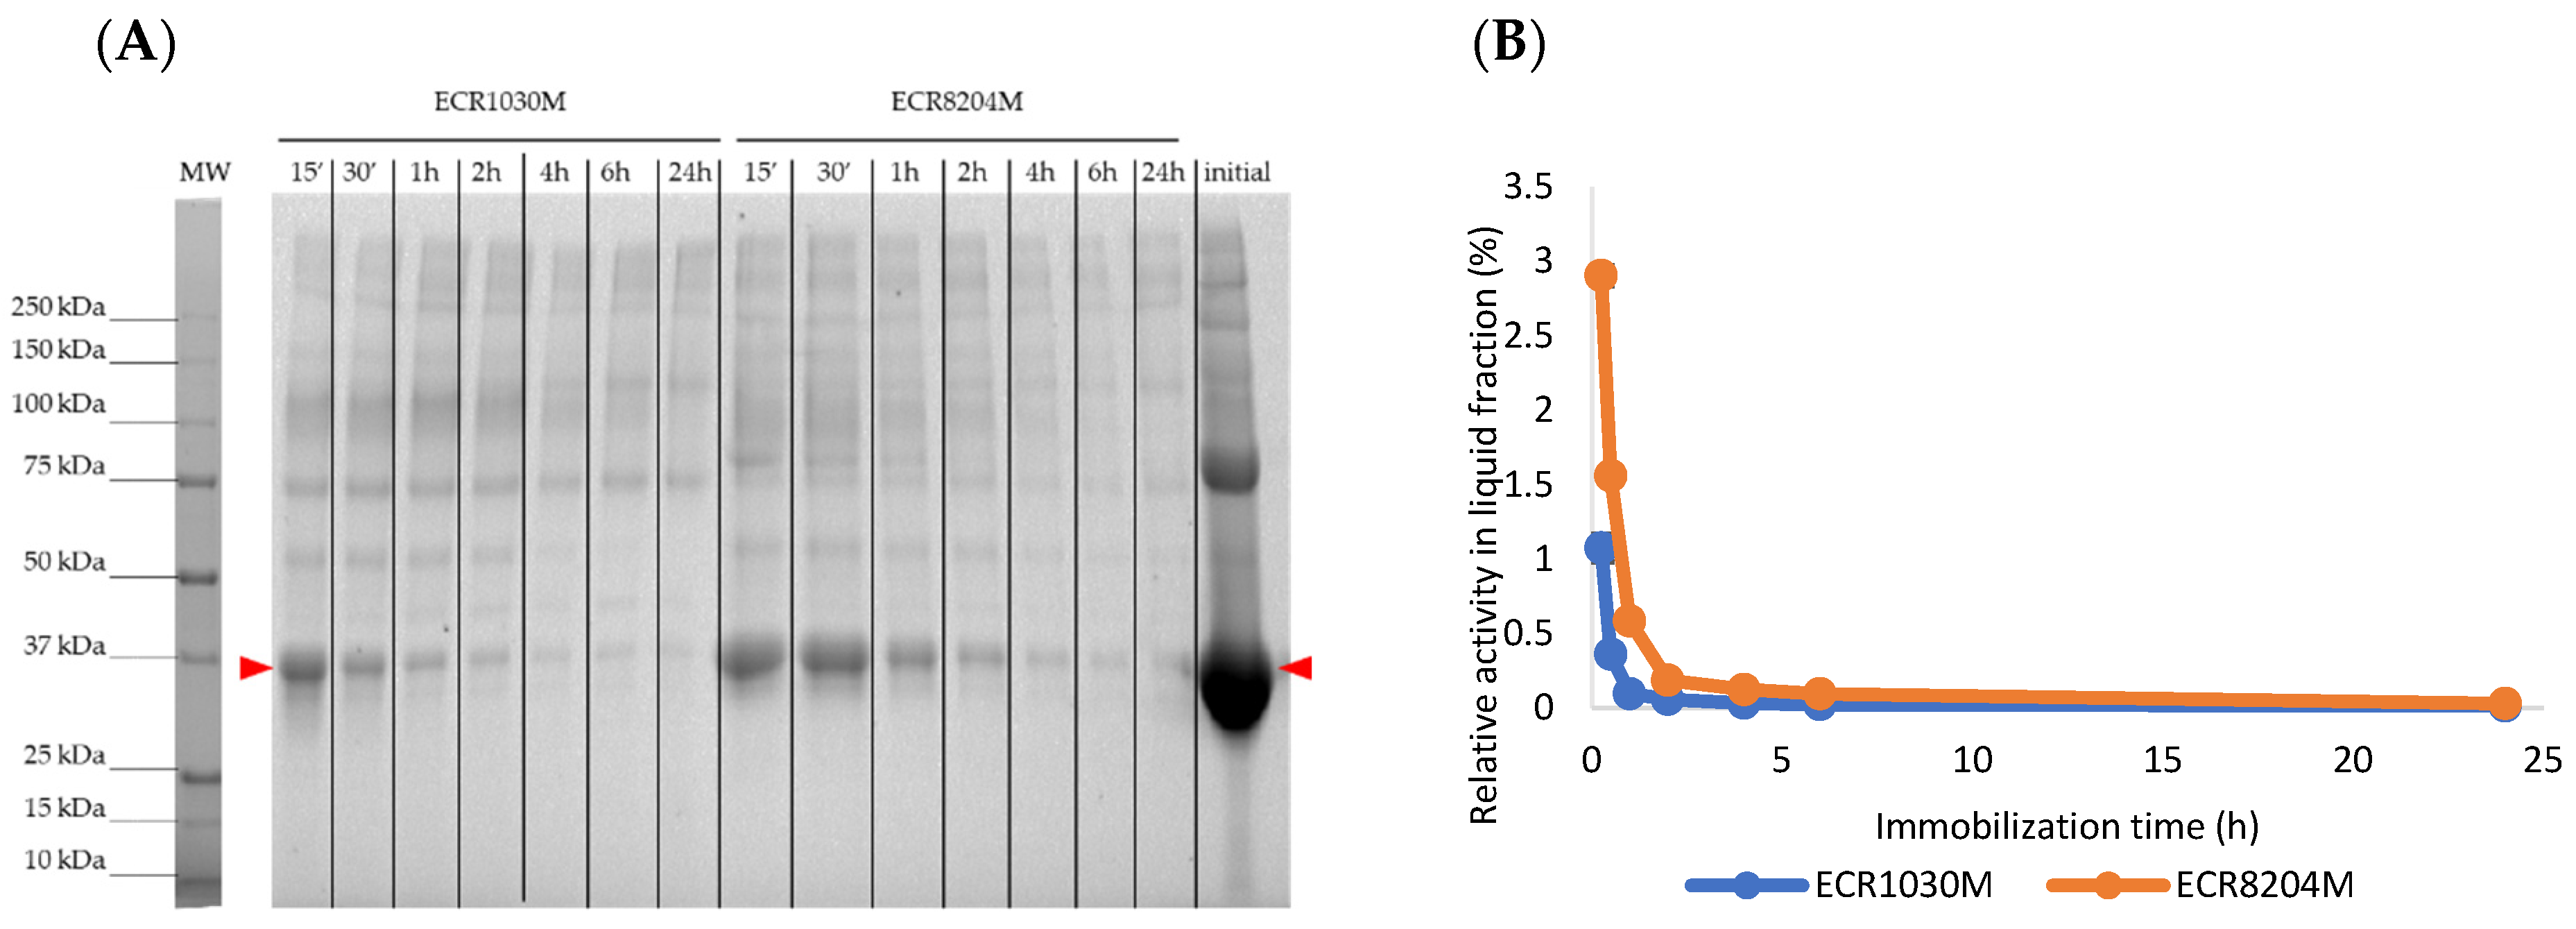
As shown by the SDS-PAGE analysis after the immobilizations (Figure 6), there was a higher CalB affinity for ECR1030M at initial immobilization times, but after 2 h, a very similar amount of enzyme was immobilized in both resins; this somehow correlates with the rather constant activities after 1–2 h found in Figure 5.
The results obtained in this work confirm previous reports describing immobilization mechanism and enzyme distribution patterns [24,25,26,27,28]. In this way, the enzyme diffuses into the particle forming a loading front with a high enzyme concentration, where most of the times it does not reach the center of the porous material. In order to fully load the particles, long interaction times are needed [14], or a competing compound could be used [28,29]. Generally, if the distribution is nonuniform (U-shaped, with the enzyme concentrated on the surface), the activities are higher than if the enzyme is well distributed along the particle diameter. However, a more uniform distribution is more suitable for reactions that suffer from inhibition kinetics [26,27]. Thus, for CalB, if there is no inhibition, a short immobilization time is recommended. This would be approx. 6 h for ECR8204M and 1 h for ECR1030M, as suggested by the enzyme distribution profile (Figure 1 and Figure 2) and the activity data (Figure 5) and SDS-PAGE analysis (Figure 6).
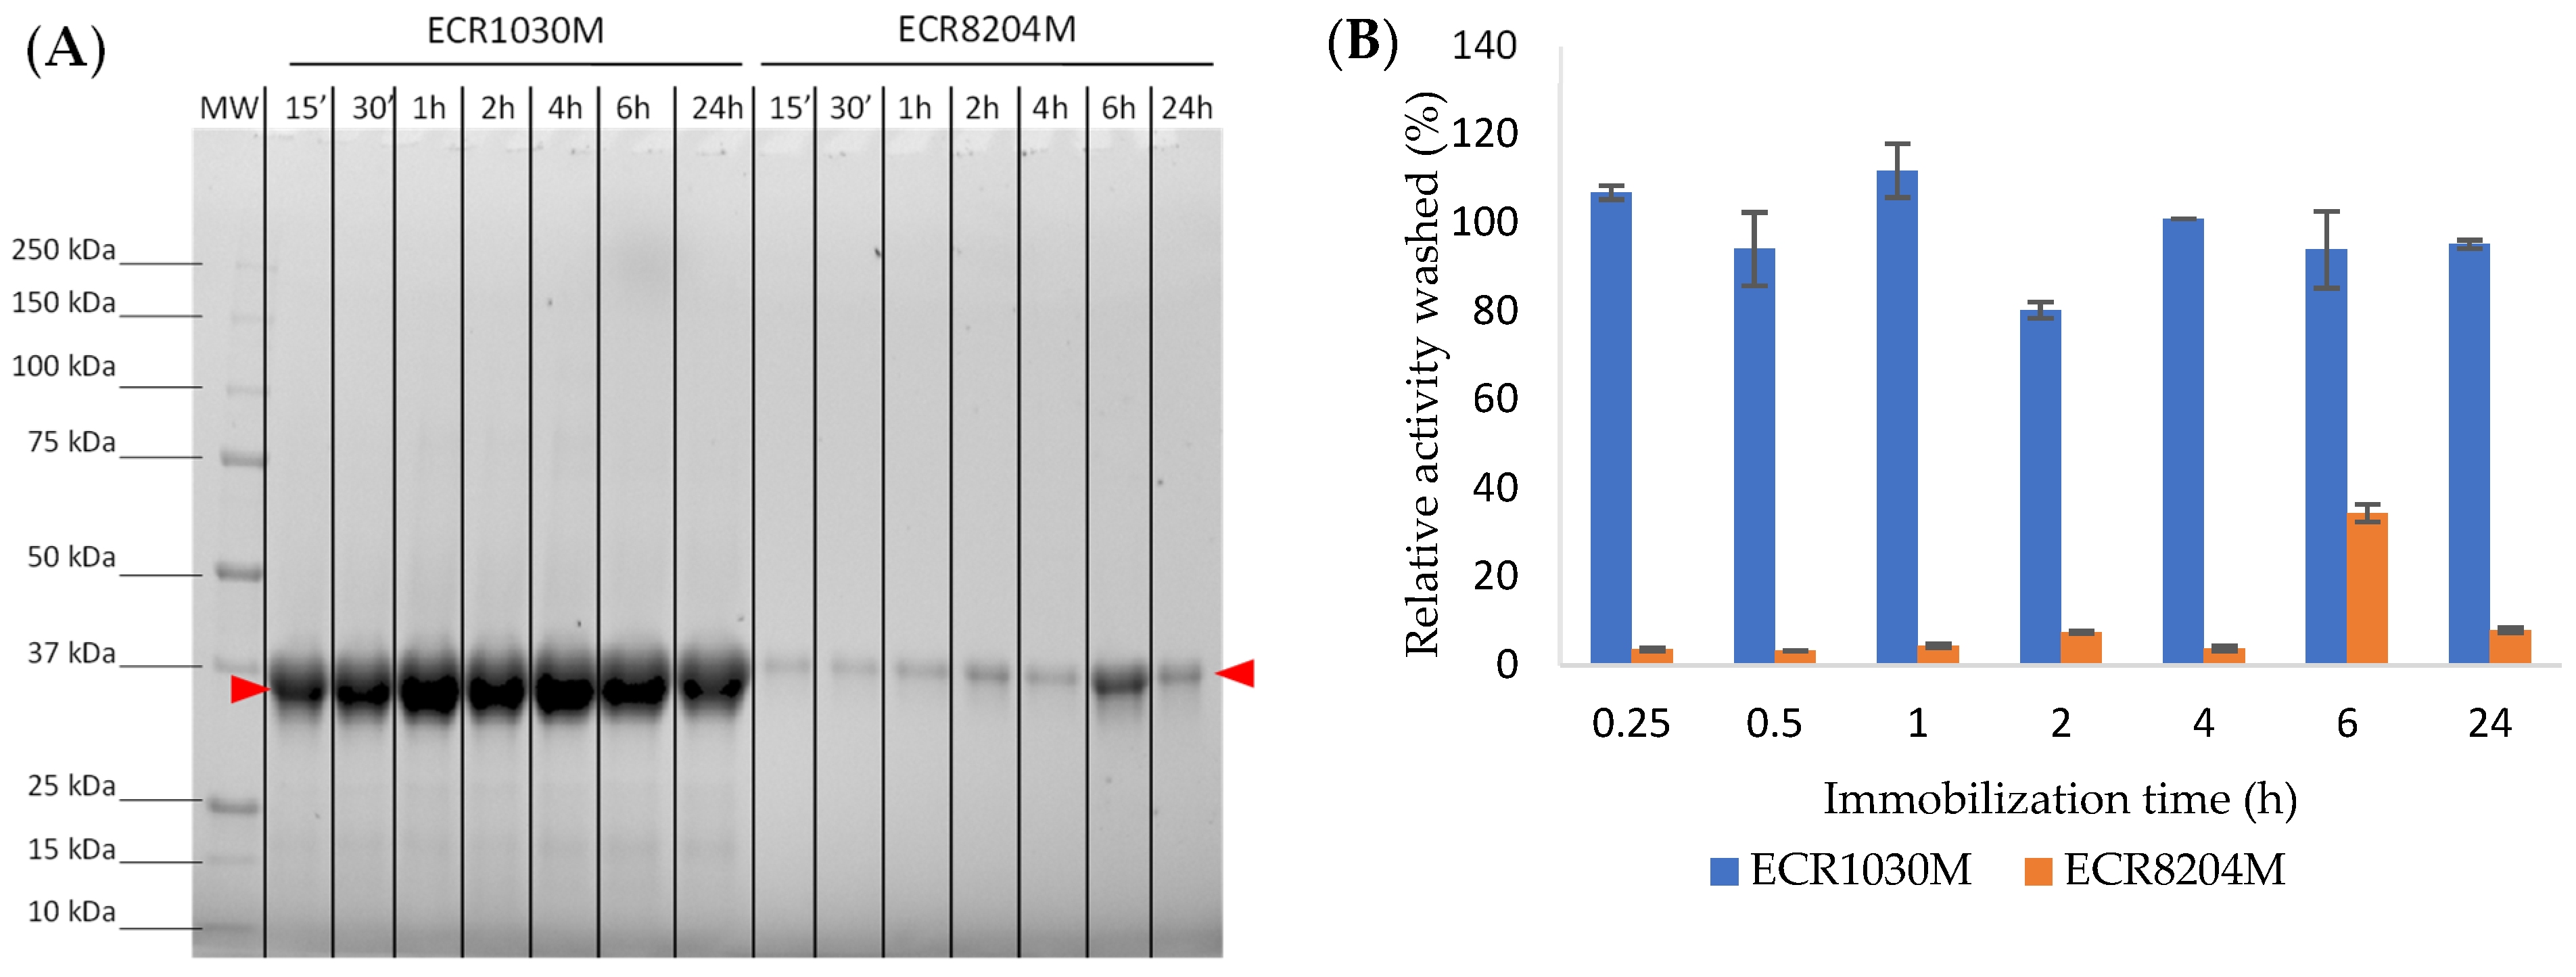
Another important aspect that we wanted to confirm was the type of interaction between the CalB and each enzyme carrier which was done by treating the immobilized enzyme samples with a surfactant (Figure 7). The leaching of CalB from ECR1030M happened in the presence of the anionic surfactant Triton X-100 that was able to disrupt the hydrophobic interactions between the aromatic groups of the resin and the surface of the enzyme. Since such interaction could lead to a decrease in enzyme activity when used over multiple cycles, we verified the reusability of the preparation. In a separate experiment (data not shown), we observed that CalB immobilized on ECR1030M was very robust and could be recycled for multiple cycles without any loss of enzyme activity (99% recovered activity over 10 cycles using PLU test). Moreover, the commercial preparation of CalB immobilized on ECR1030M (CalB immo Plus) is also used in many industrial applications for multiple cycles and long times, one example being published by Brown et al. [30].

4. Materials and Methods

All chemicals were laboratory grade and of suitable purity and were purchased from Sigma Aldrich (Merck), UK. Enzyme lipase CalB was provided in liquid form by c-Lecta GmbH (Leipzig, Germany). Embedding and microtomy supplies were purchased from Biosystems AG, Switzerland.

4.1. Characterization of Enzyme Carriers

The enzyme carriers ECR1030M and ECR8204M were of synthetic backbone, produced and provided by Purolite Llantrisant, UK and are commercially available. The pore diameter and porosity were measured by mercury intrusion using Thermo Scientific Pascal 140 and Thermo Scientific Pascal 240 instruments, Waltham, MA, USA. Particle sizes were determined by dynamic image analysis using QICPIC instrument by Sympatec GmbH, Ramlingen, Germany. The total moisture of the enzyme carriers and immobilized enzymes was measure using an IR balance set at 105 °C (Sartorius).

4.2. Enzyme Immobilization in Batch Mode

Two enzyme immobilization techniques were used as described below. For all preparations, the initial enzyme loading was at 2500 pNPB units per gram of dry resin. After immobilization, the supernatants were collected by filtration for protein and activity analysis. The immobilization procedures are described at 1 g scale, but the same procedures were used to make tens of grams of immobilized products by proportionally scaling up. All immobilizations were performed at room temperature (RT), under rotary mixing (20 rpm) (Stuart rotator). The immobilization time varied from 15 min to 24 h.
In the covalent immobilization on an epoxy functionalized resin, the final enzyme solution containing 0.5 M potassium phosphate, a pH 7.0 buffer was mixed in a ratio of 1.5:1 with the ECR8204M enzyme carrier for specified periods of time.
In the hydrophobic immobilization on nonfunctionalized resin, the final enzyme solution containing 0.02M potassium phosphate, a pH 7.0 buffer was mixed in a ratio of 1:1 with the ECR1030M enzyme carrier for specified periods of time.
The liquid obtained after each immobilization was analyzed by SDS-PAGE to qualitatively identify the presence or absence of CalB and compared to the initial CalB solution used for immobilization. For this purpose, a Mini-PROTEAN vertical electrophoresis instrument from Bio-Rad, Watford, UK was used following the method described by Laemmli (1970) [31].
Following the immobilization, the carriers were washed 4 times with demineralized water in a ratio resin/water of 1:4 (wt:wt). The immobilized enzyme was then filtered to remove excess liquid and stored at 2–8 °C.

4.3. Enzyme Activity Assays

To quantify the activity of the immobilized enzyme, two different test methods were used.
The analysis of the CalB-catalyzed ester formation (PLU activity) was performed using immobilized CalB and following the same method as described by Basso et al. (2016) [32]. PLU refers to the amount (µmol) of propyl laurate synthesized by the enzyme per minute under the reaction conditions.
The performance of the immobilized CalB (100 mg) was also assessed following the transesterification between 1-phenylethanol (0.6 mL, 4.97 mmol) and vinyl acetate (2.4 mL, 26 mmol) at 25 °C, in the absence of solvents under vigorous mixing over 30 min reaction time. Briefly, 10 µL of the reaction mixture was diluted with 990 µL of acetonitrile and the formation of 1-phenylethyl acetate was quantified by HPLC using a Columbus C18, 5 µm 110A, 250 mm × 4.6 mm column at 25 °C, mobile phase: 60:40 of H2O:CH3CN, 1 mL/min, λ = 260 nm.
The esterase activity of free CalB, from liquid samples before and after the immobilizations and after the Triton X-100 wash, was measured using 2 mM p-nitrophenyl butyrate (pNPB) as a substrate in 0.1% Triton X-100, 50 mM potassium phosphate buffer, pH 8.0. The formation of p-nitrophenol was followed at 405 nm for 1 min. One pNPB unit is defined as micromoles of p-nitrophenol produced per minute at room temperature at pH 8.0.
All activity measurements were done in duplicate.
Following the CalB immobilization, with the purpose to confirm whether the enzyme was attached to the beads covalently or by hydrophobic interactions, 50 mg of immobilized preparations was incubated with 0.5 mL 1% Triton X-100 for 2 h at RT. Then, the liquid fractions were collected and analyzed by SDS-PAGE.

4.4. Paraffin Embedding Procedure

A small quantity of sample was taken out of the original container (stored at 5 °C) and allowed to reach room temperature prior to embedding. The single-use polyethylene molds (15 × 15 × 6 mm, Biosystems AG) used for embedding were preheated to approximately 60 °C in the embedding workbench (Thermo Microm EC 350-1, Thermo Scientific, Germany). Molten paraffin wax (Leica Paraplast Plus, Leica Biosystems, Germany, melting point 58 °C) was poured approx. 2 mm high into a preheated mold. Onto this bed of paraffin, a small amount of sample was dropped with a single-use spatula. The mass was allowed to cool and solidify partially for approximately 30 s, before the embedding cassette (40 × 28 × 6 mm, Biosystems AG) was placed on top of the mold and the mold filled completely with paraffin. The filled molds were left to harden at 5 °C for a minimum of 4 h and kept at this temperature until further processing.

4.5. Microtome Slicing Procedure

The solidified paraffin blocks were allowed to reach room temperature prior to cutting. The blocks were removed from the molds and cut into 10 µm thickness slices using a rotary microtome with section transfer system (Carl Zeiss Hyrax M40 with Epredia STS, Carl Zeiss, Germany). The section transfer system is filled with ultrapure water at 35 °C and enables a gentle collection of paraffin slices through a type of water slide. The 3D-printed microscope slides were dipped into the collection pool of the section transfer system to mount the paraffin sections floating therein. The hydrophobic nature of the paraffin and the slides led to a quick and secure attachment. The adhering water was left to evaporate, and the so-prepared samples were stored at room temperature.

4.6. Spectra Collection

The samples were analyzed using a PerkinElmer Spotlight 200 FT-IR microscope (PerkinElmer, Waltham, MA, USA). The microscope was operated in transmission mode with the rectangular aperture set to 10 µm × 10 µm. The spectral range was set to 4000–600 cm−1 with a resolution of 4 cm−1. A total of 256 integrations were acquired for all measurements. The measurements were programmed using PerkinElmer Spectrum (Version 10.5.1.581, PerkinElmer, Waltham, MA, USA, 2015), using the “Line Scan” feature to draw a line of adjacent squares across the diameter of the particle section as observed in visible-light mode. The spectra of these 10 µm × 10 µm squares was then automatically acquired in sequence, using the motorized high-precision sample positioning table of the microscope. An air background was measured prior to every line scan sequence.

4.7. Data Analysis

The raw data files (x- and y-location, wavenumber, absorbance) were processed using RStudio (Version 2021.09.1, RStudio, Boston, MA, USA, 2021), MATLAB (Version R2020a, The MathWorks, Natick, MA, USA, 2020), and Microsoft Excel (Version 2108, Microsoft, Redmond, WA, USA). The presence of enzyme was monitored through observation of the amide I band at 1658 cm−1, while a single point baseline was taken at 1800 cm−1. Information regarding the calculation can be found in the supporting information (SI).

4.8. Three-Dimensional Printing of Microscope Slides

The microscope slides were designed by O.P. and printed in-house with a commercial Ultimaker S5 (Ultimaker, Utrecht, the Netherlands) fused deposition modelling (FDM) 3D printer using clear polylactide (PLA) filament purchased from Ultimaker as feedstock. The slides had the same outside dimensions as commercial glass microscope slides. Three evenly spaced holes with a diameter of 5 mm allowed the unhindered passage of IR radiation while sufficiently supporting the paraffin sections. The 3D model is available in the SI.

5. Conclusions

With the present paper we showed, using FT-IR and a new analytical workflow, the effect of a hydrophobic (ECR1030M) and a hydrophilic (ECR8204M) carrier on the diffusion of a lipase within the bead and the effect on enzyme activity upon immobilization. Lipase CalB is characterized by a hydrophobic surface due to its physiological role of lipid modification. By using an automated benchtop IR microscope with a rapid embedding and cutting procedure, we were able to precisely determine the position of the enzyme across the bead section by measuring the presence of the amide I bond at 1658 cm−1, which is typical of the enzyme. The amide I band, caused by the stretching of the amide C=O group, is generally the strongest absorbance band in infrared spectra of proteins, and so well suited to this application.
The IR analysis coupled with enzyme activity measurements showed clearly that lipase CalB preferred the immobilization on a hydrophobic carrier, showing a high enzyme activity with the enzyme located in the external section of the bead. When a more hydrophilic resin was used (ECR8204M), the CalB was able to penetrate deeper in the core of the resin beads, thus minimizing the hydrophobic interaction at the cost of a lower enzyme activity. These results are supporting the theory that the hydrophobic interfacial activation of the lipase can lead to better enzyme activity while a covalent immobilization in a more rigid conformation on a hydrophilic support leads to a lower CalB activity.

Supplementary Materials

The following are available online at https://www.mdpi.com/article/10.3390/catal12090989/s1, Figure S1: Left: Schematic of the novel transmission IR microscopy sample holder. Right: Image of the sample holder, printed in clear (natural) PLA, Figure S2: Sample holder with paraffin sections applied to two holes, Figure S3: Left: Sketch of the sampling process on ECR1030M. Right: Light microscopic image of bead section taken prior to IR microscopic sampling, Figure S4: Close-up of the sampling process, Figure S5: Simplified schematic of data processing for penetration-depth measurements, Figure S6: Representative spectra (ECR1030M, 1 h) from the surrounding paraffin and the edge and middle of the sectioned bead, Figure S7: Sketch of a particle sliced exactly through its equator (1) and higher (2), Table S1: Influence of cutting height on apparent penetration depth and section diameter, Figure S8: Absolute enzyme penetration of five repeat measurements of independent sections of ECR1030M after 1 h of immobilization.

Author Contributions

Conceptualization, O.P., A.E., A.C.-I., A.B. and S.S.; methodology, O.P., A.C.-I.; software, O.P.; validation, A.E., A.B. and S.S; formal analysis, O.P., A.E., A.C.-I., A.B. and S.S.; investigation, O.P., A.E., A.C.-I., A.B., S.S.; resources, A.C.-I.; data curation, O.P., A.C.-I.; writing—original draft preparation, O.P., A.C.-I., S.S.; writing—review and editing, A.E., A.B.; visualization, O.P., A.C.-I.; supervision, A.E., A.B., S.S.; project administration, S.S.; funding acquisition, A.B. All authors have read and agreed to the published version of the manuscript.

Funding

This research received no external funding.

Data Availability Statement

The data presented in this study is available on request from the corresponding author.

Conflicts of Interest

The authors declare no conflict of interest.

References

  1. Wu, S.; Snajdrova, R.; Moore, J.C.; Baldenius, K.; Bornscheuer, U.T. Biocatalysis: Enzymatic Synthesis for Industrial Applications. Angew. Chem. Int. Ed. 2021, 60, 88–119. [Google Scholar] [CrossRef] [PubMed]
  2. Alcántara, A.R.; Domínguez de María, P.; Littlechild, J.A.; Schürmann, M.; Sheldon, R.A.; Wohlgemuth, R. Biocatalysis as Key to Sustainable Industrial Chemistry. ChemSusChem 2022, 15, e202102709. [Google Scholar] [CrossRef]
  3. Hönig, M.; Sondermann, P.; Turner, N.J.; Carreira, E.M. Enantioselective Chemo- and Biocatalysis: Partners in Retrosynthesis. Angew. Chem. Int. Ed. 2017, 56, 8942–8973. [Google Scholar] [CrossRef]
  4. Carleysmith, S.W.; Eames, M.B.L.; Lilly, M.D. Staining Method for Determination of the Penetration of Immobilized Enzyme into a Porous Support. Biotechnol. Bioeng. 1980, 22, 957–967. [Google Scholar] [CrossRef]
  5. Mosbach, K. Enzymes Bound to Artificial Matrixes. Sci. Am. 1971, 224, 26–33. [Google Scholar] [CrossRef]
  6. David, G.S.; Chino, T.H.; Reisfeld, R.A. Binding of Proteins to CNBr-Activated Sepharose 4B. FEBS Lett. 1974, 43, 264–266. [Google Scholar] [CrossRef]
  7. Stage, D.E.; Mannik, M. Covalent Binding of Molecules to CNBr-Activated Agarose: Parameters Relevant to the Activation and Coupling Reactions. Biochim. Biophys. 1974, 343, 382–391. [Google Scholar] [CrossRef]
  8. Lasch, J.; Kühnau, R. Evaluation of Enzyme Distribution in Spherical Supports by Computed Fluorescence Tomography. Enzyme Microb. Technol. 1986, 8, 115–119. [Google Scholar] [CrossRef]
  9. Mullon, C.J.-P.; Saltzman, W.M.; Langer, R. Computer Based Visualization for Quantitative and Qualitative Analysis of the Distribution of Matrix-Bound Proteins. Nat. Biotechnol. 1988, 6, 927–929. [Google Scholar] [CrossRef]
  10. Ladero, M.; Santos, A.; Garca-Ochoa, F. Diffusion and Chemical Reaction Rates with Nonuniform Enzyme Distribution: An Experimental Approach. Biotechnol. Bioeng. 2001, 72, 458–467. [Google Scholar] [CrossRef]
  11. Sinigoi, L.; Bravin, P.; Eberit, N.; D’Amelio, C.; Vaccari, L.; Ciccarelli, L.; Cantone, S.; Basso, A.; Gardossi, L. Synbeads Porous-Rigid Methacrylic Support: Application to Solid Phase Peptide Synthesis and Characterization of the Polymeric Matrix by FTIR Microspectroscopy and High Resolution Magic Angle Spinning NMR. J. Comb. Chem. 2009, 11, 835–845. [Google Scholar] [CrossRef] [PubMed]
  12. Mei, Y.; Miller, L.; Gao, W.; Gross, R.A. Imaging the Distribution and Secondary Structure of Immobilized Enzymes Using Infrared Microspectroscopy. Biomacromolecules 2003, 4, 70–74. [Google Scholar] [CrossRef] [PubMed]
  13. Nielsen, A.V.F.; Andric, P.; Nielsen, P.M.; Pedersen, L.H. Activity and Spatial Distribution of Candida Antarctica Lipase b Immobilized on Macroporous Organic Polymeric Adsorbents. Langmuir 2014, 30, 5429–5434. [Google Scholar] [CrossRef]
  14. Chen, B.; Hu, J.; Miller, E.M.; Xie, W.; Cai, M.; Gross, R.A. Candida Antarctica Lipase B Chemically Immobilized on Epoxy-Activated Micro- and Nanobeads: Catalysts for Polyester Synthesis. Biomacromolecules 2008, 9, 463–471. [Google Scholar] [CrossRef] [PubMed]
  15. Basso, A.; Froment, L.; Hesseler, M.; Serban, S. New Highly Robust Divinyl Benzene/Acrylate Polymer for Immobilization of Lipase CALB. Eur. J. Lipid Sci. Technol. 2013, 115, 468–472. [Google Scholar] [CrossRef]
  16. Basso, A.; Braiuca, P.; Cantone, S.; Ebert, C.; Linda, P.; Spizzo, P.; Caimi, P.; Hanefeld, U.; Degrassi, G.; Gardossi, L. In Silico Analysis of Enzyme Surface and Glycosylation Effect as a Tool for Efficient Covalent Immobilisation of CalB and PGA on Sepabeads. Adv. Synth. Catal. 2007, 349, 877–886. [Google Scholar] [CrossRef]
  17. Mateo, C.; Abian, O.; Fernandez-Lafuente, R.; Guisan, J.M. Increase in Conformational Stability of Enzymes Immobilized on Epoxy-Activated Supports by Favoring Additional Multipoint Covalent Attachment. Enzyme Microb. Technol. 2000, 26, 509–515. [Google Scholar] [CrossRef]
  18. Chen, B.; Miller, E.M.; Miller, L.; Maikner, J.J.; Gross, R.A. Effects of Macroporous Resin Size on Candida Antarctica Lipase B Adsorption, Fraction of Active Molecules, and Catalytic Activity for Polyester Synthesis. Langmuir 2007, 23, 1381–1387. [Google Scholar] [CrossRef]
  19. Veum, L.; Hanefeld, U. Enantioselective Formation of Mandelonitrile Acetate: Investigation of a Dynamic Kinetic Resolution II. Tetrahedron Asymmetry 2004, 15, 3707–3709. [Google Scholar] [CrossRef]
  20. Veum, L.; Kanerva, L.T.; Halling, P.J.; Maschmeyer, T.; Hanefeld, U. Optimisation of the Enantioselective Synthesis of Cyanohydrin Esters. Adv. Synth. Catal. 2005, 347, 1015–1021. [Google Scholar] [CrossRef]
  21. Fernandez-Lorente, G.; Cabrera, Z.; Godoy, C.; Fernandez-Lafuente, R.; Palomo, J.M.; Guisan, J.M. Interfacially Activated Lipases against Hydrophobic Supports: Effect of the Support Nature on the Biocatalytic Properties. Process Biochem. 2008, 43, 1061–1067. [Google Scholar] [CrossRef]
  22. Mangiagalli, M.; Ami, D.; Divitiis, M.; Brocca, S.; Catelani, T.; Natalello, A.; Lotti, M. Short-chain Alcohols Inactivate an Immobilized Industrial Lipase through Two Different Mechanisms. Biotechnol. J. 2022, 17, 2100712. [Google Scholar] [CrossRef] [PubMed]
  23. Uppenberg, J.; Hansen, M.T.; Patkar, S.; Jones, T.A. The Sequence, Crystal Structure Determination and Refinement of Two Crystal Forms of Lipase B from Candida Antarctica. Structure 1994, 2, 293–308. [Google Scholar] [CrossRef]
  24. Do, D.D.; Clark, D.S.; Bailey, J.E. Modeling Enzyme Immobilization in Porous Solid Supports. Biotechnol. Bioeng. 1982, 24, 1527–1546. [Google Scholar] [CrossRef] [PubMed]
  25. Dennis, K.E.; Clark, D.S.; Bailey, J.E.; Cho, Y.K.; Park, Y.H. Immobilization of Enzymes in Porous Supports: Effects of Support–Enzyme Solution Contacting. Biotechnol. Bioeng. 1984, 26, 892–900. [Google Scholar] [CrossRef] [PubMed]
  26. Juang, H.-D.; Weng, H. Performance of Biocatalysts with Nonuniformly Distributed Immobilized Enzyme Hor-Da. Biotechnol. Bioeng. 1984, 26, 623–626. [Google Scholar] [CrossRef]
  27. Cao, L. Carrier-Bound Immobilized Enzymes: Principles, Application and Desing; Wiley: Hoboken, NJ, USA, 2005. [Google Scholar] [CrossRef]
  28. Guisan, J.M.; Bolivar, J.M.; López-Gallego, F.; Rocha-Martín, J. Immobilization of Enzymes and Cells, 4th ed.; Guisan, J.M., Bolivar, J.M., López-Gallego, F., Rocha-Martín, J., Eds.; Methods in Molecular Biology; Springer: New York, NY, USA, 2020; Volume 2100. [Google Scholar] [CrossRef]
  29. Bolivar, J.M.; Hidalgo, A.; Sánchez-Ruiloba, L.; Berenguer, J.; Guisán, J.M.; López-Gallego, F. Modulation of the Distribution of Small Proteins within Porous Matrixes by Smart-Control of the Immobilization Rate. J. Biotechnol. 2011, 155, 412–420. [Google Scholar] [CrossRef]
  30. Brown, M.S.; Caporello, M.A.; Goetz, A.E.; Johnson, A.M.; Jones, K.N.; Knopf, K.M.; Kulkarni, S.A.; Lee, T.; Li, B.; Lu, C.V.; et al. Streamlined Synthesis of a Bicyclic Amine Moiety Using an Enzymatic Amidation and Identification of a Novel Solid Form. Org. Process Res. Dev. 2021, 25, 1419–1430. [Google Scholar] [CrossRef]
  31. Laemmli, U.K. Cleavage of Structural Proteins during the Assembly of the Head of Bacteriophage T4. Nature 1970, 227, 680–685. [Google Scholar] [CrossRef]
  32. Basso, A.; Hesseler, M.; Serban, S. Hydrophobic Microenvironment Optimization for Efficient Immobilization of Lipases on Octadecyl Functionalised Resins. Tetrahedron 2016, 72, 7323–7328. [Google Scholar] [CrossRef]
Figure 1. Monitoring of the penetration depth during CalB immobilization on ECR1030M: overlay of the absorbance profiles (background-corrected amide I absorbance versus location along relative bead diameter (%)) depending on immobilization time (A); zoomed overlay of the left border of the particles (up to 20% relative diameter) for the first hour of enzyme immobilization (B); integral of the IR absorbance at the amide I band across the entire bead diameter (C); average width at half maximum of the left and right enzyme-containing border of the particles over time (D).
Catalysts 12 00989 g001
Figure 2. Three-dimensional FT-IR spectra in the spectral region 1800–1500 cm−1 (the third dimension being the location on a straight line through the diameter of the particle, where the spectrum was taken, in µm) of ECR1030M without CalB (A) and with CalB after 24 h of immobilization (B). The 2D heatmaps (C,D) are projections of the 3D data shown above in A and B, respectively.
Catalysts 12 00989 g002
Figure 3. Monitoring of the penetration depth during immobilization of CalB on ECR8204M: overlay of absorbance profiles (background-corrected amide I absorbance versus location along relative bead diameter (%)) depending on immobilization time (A); zoomed overlay of the left border of the particles (up to 20% relative diameter) for the first hour of enzyme immobilization (B); integral of the IR absorbance at the amide I band across the entire bead diameter (C).
Catalysts 12 00989 g003
Figure 4. Three-dimensional FT-IR spectra in the spectral region 1800–1500 cm−1 (the third dimension being the location on a straight line through the diameter of the particle, where the spectrum was taken, in µm) of ECR8204M without CalB (A) and with CalB after 24 h of immobilization (B). The 2D heatmaps (C,D) are projections of the 3D data shown above in A and B, respectively.
Catalysts 12 00989 g004
Figure 5. Variation of the CalB activity as a function of the immobilization time for preparations made from the two carriers ECR1030M and ECR8204M. Propyl laurate (PLU) reaction and activity data (A); 1-phenylethyl acetate reaction and activity data (B). All activity measurements were done in duplicate, but some error bars are not visible due to very small variations between data points.
Catalysts 12 00989 g005
Figure 6. Protein and activity analysis of the liquid fractions after the immobilizations. The SDS-PAGE shows the protein profile of the sample before the immobilization (last line in the gel) and after the immobilizations (the CalB band at 33 kDa is indicated by red arrows) (A). The enzyme activity (pNPB assay) remaining in the liquid fractions was also measured (100% activity is considered the initial activity before the immobilization, not included) (B).
Catalysts 12 00989 g006
Figure 7. Triton X-100 wash to samples of CalB immobilized on ECR1030M and ECR8204M at different incubation times. After the wash, the liquid samples were collected and analyzed by SDS-PAGE (red arrows indicate the CalB band at 33 kDa) (A) and the pNPB activity was measured (B). The CalB activity at immobilization time zero corresponds to 100%.
Catalysts 12 00989 g007
Figure 8. Potential binding sites on CalB structure (PDB ID: 1LBT). The model substrate is represented in green to indicate where the catalytic site is. The arrows also indicate the position of the substrate in the structure.
Catalysts 12 00989 g008
Table 1. Physical characteristics of the ECR1030M and ECR8204M.
CharacteristicECR1030MECR8204M
Composition Methyl methacrylate, butyl methacrylate, divinylbenzeneEpoxy methacrylate
Particle size range (µm)300–710300–710
Median particle size (µm)550–650<500
Pore diameter (Å) 220–340300–600
Functional groupsNone Epoxy
Immobilization typeHydrophobic adsorptionCovalent
Publisher’s Note: MDPI stays neutral with regard to jurisdictional claims in published maps and institutional affiliations.

