Article

Improved Oxygen Reduction on GC-Supported Large-Sized Pt Nanoparticles by the Addition of Pd

by
Jelena Golubović
1,
Lazar Rakočević
2,
Dana Vasiljević Radović
3 and
Svetlana Štrbac
1,*
1
Department of Electrochemistry, Institute of Chemistry, Technology and Metallurgy, University of Belgrade, Njegoševa 12, 11000 Belgrade, Serbia
2
INS Vinca, Department of Atomic Physics, University of Belgrade, Mike Alasa 12-14, 11001 Belgrade, Serbia
3
Department of Microelectronic Technologies, Institute of Chemistry, Technology and Metallurgy, University of Belgrade, Njegoševa 12, 11000 Belgrade, Serbia
*
Author to whom correspondence should be addressed.
Catalysts 2022, 12(9), 968; https://doi.org/10.3390/catal12090968
Submission received: 3 August 2022 / Revised: 19 August 2022 / Accepted: 25 August 2022 / Published: 29 August 2022

Abstract

:
PdPt bimetallic nanoparticles on carbon-based supports functioning as advanced electrode materials have attracted attention due to their low content of noble metals and high catalytic activity for fuel cell reactions. Glassy carbon (GC)-supported Pt and PdPt nanoparticles, as promising catalysts for the oxygen reduction reaction (ORR), were prepared by the electrochemical deposition of Pt and the subsequent spontaneous deposition of Pd. The obtained electrodes were examined using X-ray Photoelectron Spectroscopy (XPS), Atomic Force Microscopy (AFM), and electroanalytical techniques. An XPS analysis of the PdPt/GC with the highest ORR performance revealed that the stoichiometric ratio of Pd: Pt was 1:2, and that both Pt and Pd were partially oxidized. AFM images of PdPt2/GC showed the full coverage of GC with PdPt nanoparticles with sizes from 100–300 nm. The ORR activity of PdPt2/GC in an acid solution approached that of polycrystalline Pt (E1/2 = 0.825 V vs. RHE), while exceeding it in an alkaline solution (E1/2 = 0.841 V vs. RHE). The origin of the improved ORR on PdPt2/GC in an alkaline solution is ascribed to the presence of a higher amount of adsorbed OH species originating from both PtOH and PdOH that facilitated the 4e-reaction pathway.

1. Introduction

The oxygen reduction reaction (ORR) is one of the most studied fundamental reactions in electrochemistry due to its application in energy-converting devices such as batteries and fuel cells [1]. Pt-group metals are the most commonly used catalysts for cathode fuel cell reactions, among which platinum has shown the highest ORR activity [2,3,4,5], and the mechanism of which was studied in detail on Pt single crystals [6,7,8] and polycrystalline platinum, Pt(poly) [9,10], in acidic and alkaline solutions.
Although platinum is the most active metal for oxygen reduction, it has disadvantages, such as a low stability and a high price. Reducing the amount of pure platinum in a catalyst and at the same time improving its catalytic performance is the major challenge for its commercial use. A promising route to achieve this goal is the synthesis of electrocatalysts consisting of various Pt nanoparticles supported by cheaper electro-conductive material [11,12,13]. Among the different supports [14], carbon-based materials such as glassy carbon, carbon black, carbon nanotubes, and graphene are widely used [15,16,17]. Apart from a low cost, their advantages include a good electrical conductivity, chemical stability, tunable size, shape, and porosity. The ORR activity and durability of such catalysts can be improved by tuning the morphology, composition, surface structure, and the size of Pt nanoparticles [11,12,13]. Among the various methods for nanostructured Pt-based catalysts’ preparation [18,19,20,21], electrochemical deposition has been widely explored because of its simplicity [22,23]. The main parameters that influence the amount and structure of the Pt-catalyst are the deposition potential, the time and temperature, the type of the depositing solution and its concentration, and the type of carbon-based support [3,23,24,25]. Pt catalysts obtained by the electrochemical deposition of Pt nanoparticles on GC exhibit a higher catalytic activity with respect to ORR than a commercial Pt/C electrode [23]. Pt-nanostructured catalysts with octahedral, tetrahedral, or isohedral shapes have showed high ORR performances in perchloric acid solution [26], which indicated the necessity of adjusting the conditions to obtain Pt nanoparticles with a controlled shape [3,13,26,27]. Pt nanoparticles supported by carbon-based materials were synthesized using various methods to develop a highly active and durable ORR catalyst [28]. For instance, Pt/CTD, and Pt NPs with 30 wt% Pt loading, supported on different carbons, exceeded the ORR activity of commercial Pt/C and achieved a high efficiency and an enhanced durability in proton-exchange membrane fuel cells (PEMFC) [29,30].
Although Pt/C electrodes are the most efficient ORR catalysts, their activity can be improved by the addition of another metal [5]. Palladium is a good candidate considering that in the Volcano plot for ORR activity, it is next to Pt and its activity approaches that of Pt [2]. Moreover, there are reports that the activity of Pd(100) exceeds that of Pt(110) [31], and that with the addition of thin palladium films on Pt(111) the ORR activity is enhanced in alkaline solution [32]. Therefore, the knowledge of the electrochemical performance of single crystals is an important link to catalysts based on nanoparticles. PdPt bimetallic nanoparticles supported by carbon-based materials have recently attracted attention with respect to the ORR. By reducing Pt salt with Pd nanoseeds, the obtained Pd-Pt bimetallic nanodendrites were two and a half times more active regarding the ORR (based on equivalent Pt mass) than the commercial Pt/C [33]. A highly durable and active catalyst consisting of Pt skin on PdPt alloy nanoparticles achieved almost three times higher ORR activity and better stability when compared to the commercial state-of-the-art Pt/C catalyst [34]. PdPt nanoflowers exhibited improved electrocatalytic ORR activity compared to commercial Pt and Pd black catalysts [35], while PdPt alloy nanocubes showed enhanced electrocatalytic activity towards the ORR compared to Pd nanocubes [36]. Hierarchical porous carbon-PtPd catalysts, with different macropore sizes, showed a synergistic effect between PtPd nanoparticles and porous carbon supports with a high performance with respect to ORR activity [37].
Recently, PdPt nanoparticles supported either by carbon-based or by other materials have been increasingly studied as catalysts for fuel cell applications as well as sensor development. PdPt nanoparticles combined with ceria nanorods have shown high ORR efficiency in direct ethanol fuel cells [38]. Core–shell Pd@PdPt nanoparticles supported by a monodispersed Pd template showed a good electrocatalytic performance towards the methanol oxidation reaction [39]. In addition, a PdPt bimetallic alloy catalyst dispersed in an ionic liquid and immobilized on nanoclay [40], and DNA-modulated PdPt nanoparticles [41], have been successfully applied in the development of biosensors with a potential for their application in electrochemical analysis [40,41].
In this work, we investigated the electrochemical deposition of Pt nanoparticles on a GC substrate at various applied potentials and at different times. The Pt/GC electrode that showed the highest catalytic performance was examined in detail and used for a further modification with Pd nanoparticles. Spontaneous deposition at the open circuit potential (OCP) was used for the subsequent Pd deposition to obtainin PdPt/GC electrodes. The most active Pt/GC and PdPt/GC electrodes were characterized by X-Ray Photoelectron Spectroscopy (XPS) and Atomic Force Microscopy (AFM). The electrochemical deposition was followed using Chronoamperometry (CA), while the electrochemical characterization was performed using Cyclic Voltammetry (CV). Linear Sweep Voltammetry (LSV) with a rotating disc electrode (RDE) was used to investigate the electrochemical performance of the Pt/GC and PdPt/GC electrodes towards the oxygen reduction reaction in acidic and alkaline solutions.

2. Results and Discussion

2.1. The Electrochemical Deposition of Pt on GC

The electrochemical deposition of Pt on the GC substrate involves the reduction of Pt(IV) to Pt(0), which includes two steps: Pt(IV) in the form of [PtCl6]2− is first reduced to Pt(II) according to the Equation (1). After that, Pt(II) in the form of [PtCl4]2− is reduced to Pt(0) according to the Equation (2).
[PtCl6]2− + 2e = [PtCl4]2− + 2Cl     EΘ = 0.68 V
[PtCl4]2− + 2e = Pt0 + 4Cl       EΘ = 0.73 V
The overall reduction process occurs with the exchange of 4e according to Equation (3):
[PtCl6]2− + 4e = Pt0 + 6Cl        EΘ = 0.70 V
where EΘ is the standard equilibrium potential (the values are taken from ref. [42]).
According to the Nernst equation, for 10−4 M H2PtCl6, 0.05 M H2SO4 (pH = 1), and EΘ = 0.70 V, the calculated Nernst equilibrium potential for Pt deposition is 0.64 V vs. RHE.
Figure 1 shows the CV of the bare GC electrode in 10−4 M H2PtCl6 + 0.05 M H2SO4 solution recorded in the potential range from 0.97 V to −0.07 V and the chronoamperometry (CA) curves recorded at three different applied potentials over 30 min.
By scanning the potential in the cathodic direction, shown in Figure 1a, the processes originating from the Pt(IV) reduction and hydrogen adsorption/desorption on the deposited Pt nanoparticles take place simultaneously. The low-intensity current density peak that appears in the potential region around 0.35 V corresponds to the reduction of [PtCl6]2− to [PtCl4]2− (reaction 1). At the potential of approx. 0.27 V, the current density increases and reaches the maximum value at approx. 0.12 V, giving rise to the second reduction peak corresponding to the reduction of [PtCl4]2− to Pt0 (reaction 2) and the simultaneous hydrogen adsorption on the already-deposited Pt nanoparticles. At more negative potentials, a hydrogen evolution reaction on the deposited Pt nanoparticles begins. These results are consistent with other studies [43,44].
The Pt/GC electrodes were prepared by applying three different potentials over different deposition times. The deposition potentials were chosen from the first scan in the cathodic direction as shown in Figure 1a, in the potential range of the increased current density associated with Pt deposition. Figure 1b shows the chronoamperometry curves recorded at different applied potentials (0.22 V, 0.12 V, and 0.09 V) for the deposition time of 30 min. Based on the Nernst equilibrium potential, the electrochemical deposition of platinum occurs in the overpotential deposition (OPD) region in all cases. A sharp increase in the current density at the beginning of the deposition process corresponds to platinum nucleation. After that, an increase in the current density corresponds to the further growth of independent nuclei or the formation of new nucleation sites, while the current density decrease corresponds to the overlapping of nucleus diffusion zones and the coalescence of the growth centers [22,45]. After a few minutes, the current density reaches a constant value, meaning that the Pt deposition occurs at the same rate. The differences in the current density profiles correspond to the different types of nucleation and particle growth [22]. Namely, when the nucleation occurs instantaneously with the formation of a small number of nuclei that grow slowly (for the deposition potentials of 0.09 V and 0.12 V), this leads to a smaller number of larger and thicker nanoparticles. On the other hand, a progressive nucleation with a fast growth rate and many new nuclei (for the deposition at 0.22 V) leads to a large number of smaller and thinner nanoparticles.

2.1.1. The Electrochemical Performance of Pt/GC Electrodes

After the electrochemical deposition of platinum on the GC substrate by applying different deposition potentials and times, the cyclic voltammetry characterization of the obtained Pt/GC electrodes, and their ORR activity testing results, are illustrated in Figure 2.
The cyclic voltammograms in 0.1 M HClO4 of the Pt/GC electrodes obtained at three different applied deposition potentials (0.22 V, 0.12 V, and 0.09 V) for the same time of 30 min and the corresponding polarization curves for ORR are shown in Figure 2a,b, respectively. Figure 2a shows that the CVs of different Pt/GC electrodes all have peaks characteristic of Pt electrodes [6,10], including hydrogen adsorption/desorption, which occurs in the potential range from 0.09 V to 0.40 V; the double-layer region from 0.40 V to 0.60 V; and the subsequent Pt oxide formation/reduction at higher potentials. All cyclic voltammograms show a cathodic peak at around 0.80 V originating from the reduction of Pt(IV). The Pt/GC electrode prepared at a potential of 0.22 V shows the most pronounced reduction peak, indicating that under these conditions, the highest amount of Pt is deposited on the GC substrate.
The electrochemically active surface area (ECSA) of the platinum deposited on GC was calculated as the ratio between the charge passed during the reduction of platinum oxide from Pt/GC and polycrystalline platinum (420 μC/cm2), normalized to the geometric surface area of the GC substrate (0.196 cm2). The charges calculated from the PtO reduction peaks (CVs in Figure 2a) for the Pt/GC electrodes obtained at potentials of 0.09 V, 0.12 V, and 0.22 V are: 107 μC/cm2, 150 μC/cm2, and 236 μC/cm2, which yields the ECSA values of 0.05 cm2, 0.07 cm2, and 0.11 cm2, respectively.
Figure 2b shows the corresponding polarization curves for the ORR activity. The Pt/GC electrode obtained at 0.22 V shows the highest ORR activity following the result obtained by cyclic voltammetry, where the intensity of all the peaks depends on the depositing potential and depositing time. Moreover, the OCP values increase sharply from 0.694 V for the bare GC substrate with Pt deposition. The OCP values of the Pt/GC electrodes obtained at the applied potentials of 0.09 V, 0.12 V, and 0.22 V are 0.976 V, 0.976 V, and 0.986 V, respectively. All the OCP values for the Pt/GC electrodes fall within the potential range of Pt oxide formation (see Figure 2a) and at the beginning of oxygen reduction (see Figure 2b). A higher OCP coincides with the higher ECSA and ORR activity for the Pt/GC obtained at 0.22 V.
In order to achieve the full coverage of the GC substrate with deposited Pt at a potential of 0.22 V, the deposition time had to increase. Figure 2c shows the CVs of the Pt/GC electrodes obtained by applying a deposition potential of 0.22 V for the deposition times of 30, 45, and 60 min. With the increasing deposition time, all the characteristic peaks become more pronounced. The charges calculated from the PtO reduction peaks for the deposition of 45 and 60 min are 306 μC/cm2 and 450 μC/cm2, which yields the ECSA values of 0.14 cm2 and 0.21 cm2, respectively. For the deposition of 60 min, the ECSA exceeds the geometric area of the GC substrate, indicating a full coverage with the deposited platinum, which is confirmed by the AFM images (see below). Figure 2d shows the corresponding polarization curves for ORR activity showing that the Pt/GC obtained after Pt deposition for 60 min was the most active regarding the ORR, which is in accordance with the CVs. In addition, the OCP value for this electrode increased to 0.992 V—comparable to the OCP value of 0.998 V obtained for bare Pt(poly)—and coincides with the higher ORR activity. Only the most ORR active Pt/GC electrode obtained at a deposition potential of 0.22 V for 60 min of Pt deposition was characterized and further used for PdPt/GC electrode preparation.

2.1.2. PdPt/GC Electrode Preparation

The PdPt/GC electrodes were prepared by the immersion of the most ORR active Pt/GC electrode into the depositing (1 mM PdSO4 × 2H2O+ 0.05 M H2SO4) solution for various deposition times. The preliminary testing of their ORR performance (not shown) indicated that the spontaneous deposition of Pd for 10 min on previously prepared Pt/GC gives PdPt/GC electrode the highest ORR activity. Lower deposition times have shown no significant contribution of added Pd, while the electrodes obtained for higher Pd deposition times has shown a tendency towards ORR inhibition. Therefore, the material presented below only includes the results for the PdPt/GC electrode prepared by the electrochemical deposition of Pt at 0.22 V for 60 min and an additional spontaneous Pd deposition for 10 min.

2.2. Characterization of the Most Active Pt/GC and PdPt/GC Electrodes

2.2.1. XPS Analysis of Pt/GC and PdPt/GC

Figure 3 shows the survey spectra of Pt/GC and PdPt/GC, as well as the high-resolution spectra of the C 1s line for the glassy carbon substrate electrode. The survey spectra, shown in Figure 3a, confirm the presence of Pt, C, and O on the Pt/GC and Pt, Pd, C, and O on the PdPt/GC electrode surfaces. The other elements that might originate from the traces of impurities during the electrode preparation were not detected.
Figure 3b shows high-resolution spectra of the C 1s line, which are almost identical for both the Pt/GC and PdPt/GC electrodes. The deconvolution of the C 1s line yielded two components: one with a high intensity typical for sp2 carbon in the C-C bond at 284.4 eV [46] and the smaller one at 285.3 eV, corresponding to sp3 carbon in C-C bond [47].
Figure 4 shows the high-resolution spectra recorded for the Pt 4f, Pd 3d overlapped with Pt 4d, and O 1s lines, characteristic of the constituents of the Pd/GC and PdPt/GC electrode. The Pt 4f doublet, consisting of Pt 4f7/2 and Pt 4f5/2 lines, fitted to two components, is almost identical for Pt/GC and PdPt/GC, except that for the later one, the intensities are slightly lower due to the presence of Pd (Figure 4a). For each line, the components at lower binding energies (71.2 eV for Pt 4f7/2 and 74.6 eV for Pt 4f5/2) correspond to the metallic Pt [48], Pt adlayer [49], or Pt nanoparticles [50,51]. The components at higher binding energies (71.7 eV for Pt 4f 7/2 and 75.0 eV for Pt 4f5/2) correspond either to Pt(OH)x or to PtO [48,49,50,51]. The fractions of the two Pt components yield 63.2% of the metallic Pt and 36.8% of the PtO and/or PtOH. The O 1s component at 532.7 eV is associated with adsorbed oxygen or water, while the one at 530.9 eV, Figure 4b, corresponds either to a hydroxyl group associated with the adsorbed OH on the deposited Pt nanoparticles or to PtO [50,51].
Figure 4c shows a Pd 3d doublet consisting of Pd 3d5/2 and Pd 3d3/2 lines, overlapped with Pt 4d3/2 line. Each Pd 3d line is deconvoluted to two components associated with two different oxidation states of palladium. The lines at lower binding energies (Pd 3d5/2 at 335.8 eV and Pd 3d3/2 at 340.9 eV) correspond to the metallic Pd [52,53,54], while the lines at higher binding energies (Pd 3d5/2 at 338.0 eV and Pd 3d3/2 at 342.6 eV) correspond to PdOx or Pd(OH)x [52,53,54]. The fractions of the two Pd components yield 43.7% of the metallic Pd and 56.3% of the oxidized Pd. The O 1s line, in Figure 4d, apart from the two peaks at almost identical positions—as described above for the Pt/GC—consists of a third component at 535.6 eV corresponding to the Pd 3p3/2 peak most likely originating from Pd bond with Pt.
Table 1 shows the atomic percentage of the constitutive elements for Pt/GC and PdPt/GC estimated from the high-resolution spectra. The ratio between the atomic percentages of Pt (1.5 At%) and Pd (0.7 At%) is 2.1 ± 0.1, which gives the stoichiometric Pt:Pd ratio of 2:1. Accordingly, the PdPt/GC electrode that shows the highest ORR activity will be denoted further as PdPt2/GC.

2.2.2. Height and Phase AFM Imaging of Pt/GC and PdPt2/GC

Figure 5 shows the AFM images of the Pt/GC surface (left column) and the PdPt2/GC surface (right column). The height AFM image of the Pt/GC, displayed in Figure 5a and showing the surface topography, reveals that the lateral size of the individual and agglomerated Pt nanoparticles ranged from 50–250 nm, while their height ranged from 20–50 nm.
The estimated average Pt/GC surface roughness is 17.8 nm. In the simultaneously recorded phase AFM image, shown in Figure 5b, the contribution of the GC substrate can be subtracted due to the chemical contrast between the deposit and substrate. As a result, the estimated coverage of the GC surface with the deposited Pt nanoparticles is (96 ± 2)%. The phase angle distribution, shown in Figure 5c, shows a single peak associated with the deposited platinum and a shoulder with the effect of the small, uncovered area of the GC substrate on the chemical properties of the Pt deposit.
Accordingly, the height AFM image of PdPt2/GC, shown in Figure 5d, reveals that the PdPt nanoparticles are larger than in the previous case, concerning both lateral size (100–300 nm) and height (20–70 nm). The average PdPt2/GC surface roughness of 14.6 nm is slightly lower, meaning that the additional spontaneous deposition of Pd on top of the Pt/GC surface has a leveling effect on the surface roughness. The corresponding phase AFM image, in Figure 5e, shows that the GC substrate is fully covered with the PdPt deposit. The phase angle distribution, in Figure 5f, shows the presence of two chemically different components. The clear separation between the two indicates the different chemical nature of the two components. As it is known that the GC surface is covered with the deposit, there is no chemical contribution of the substrate, meaning that these two separate peaks originate from platinum and palladium.

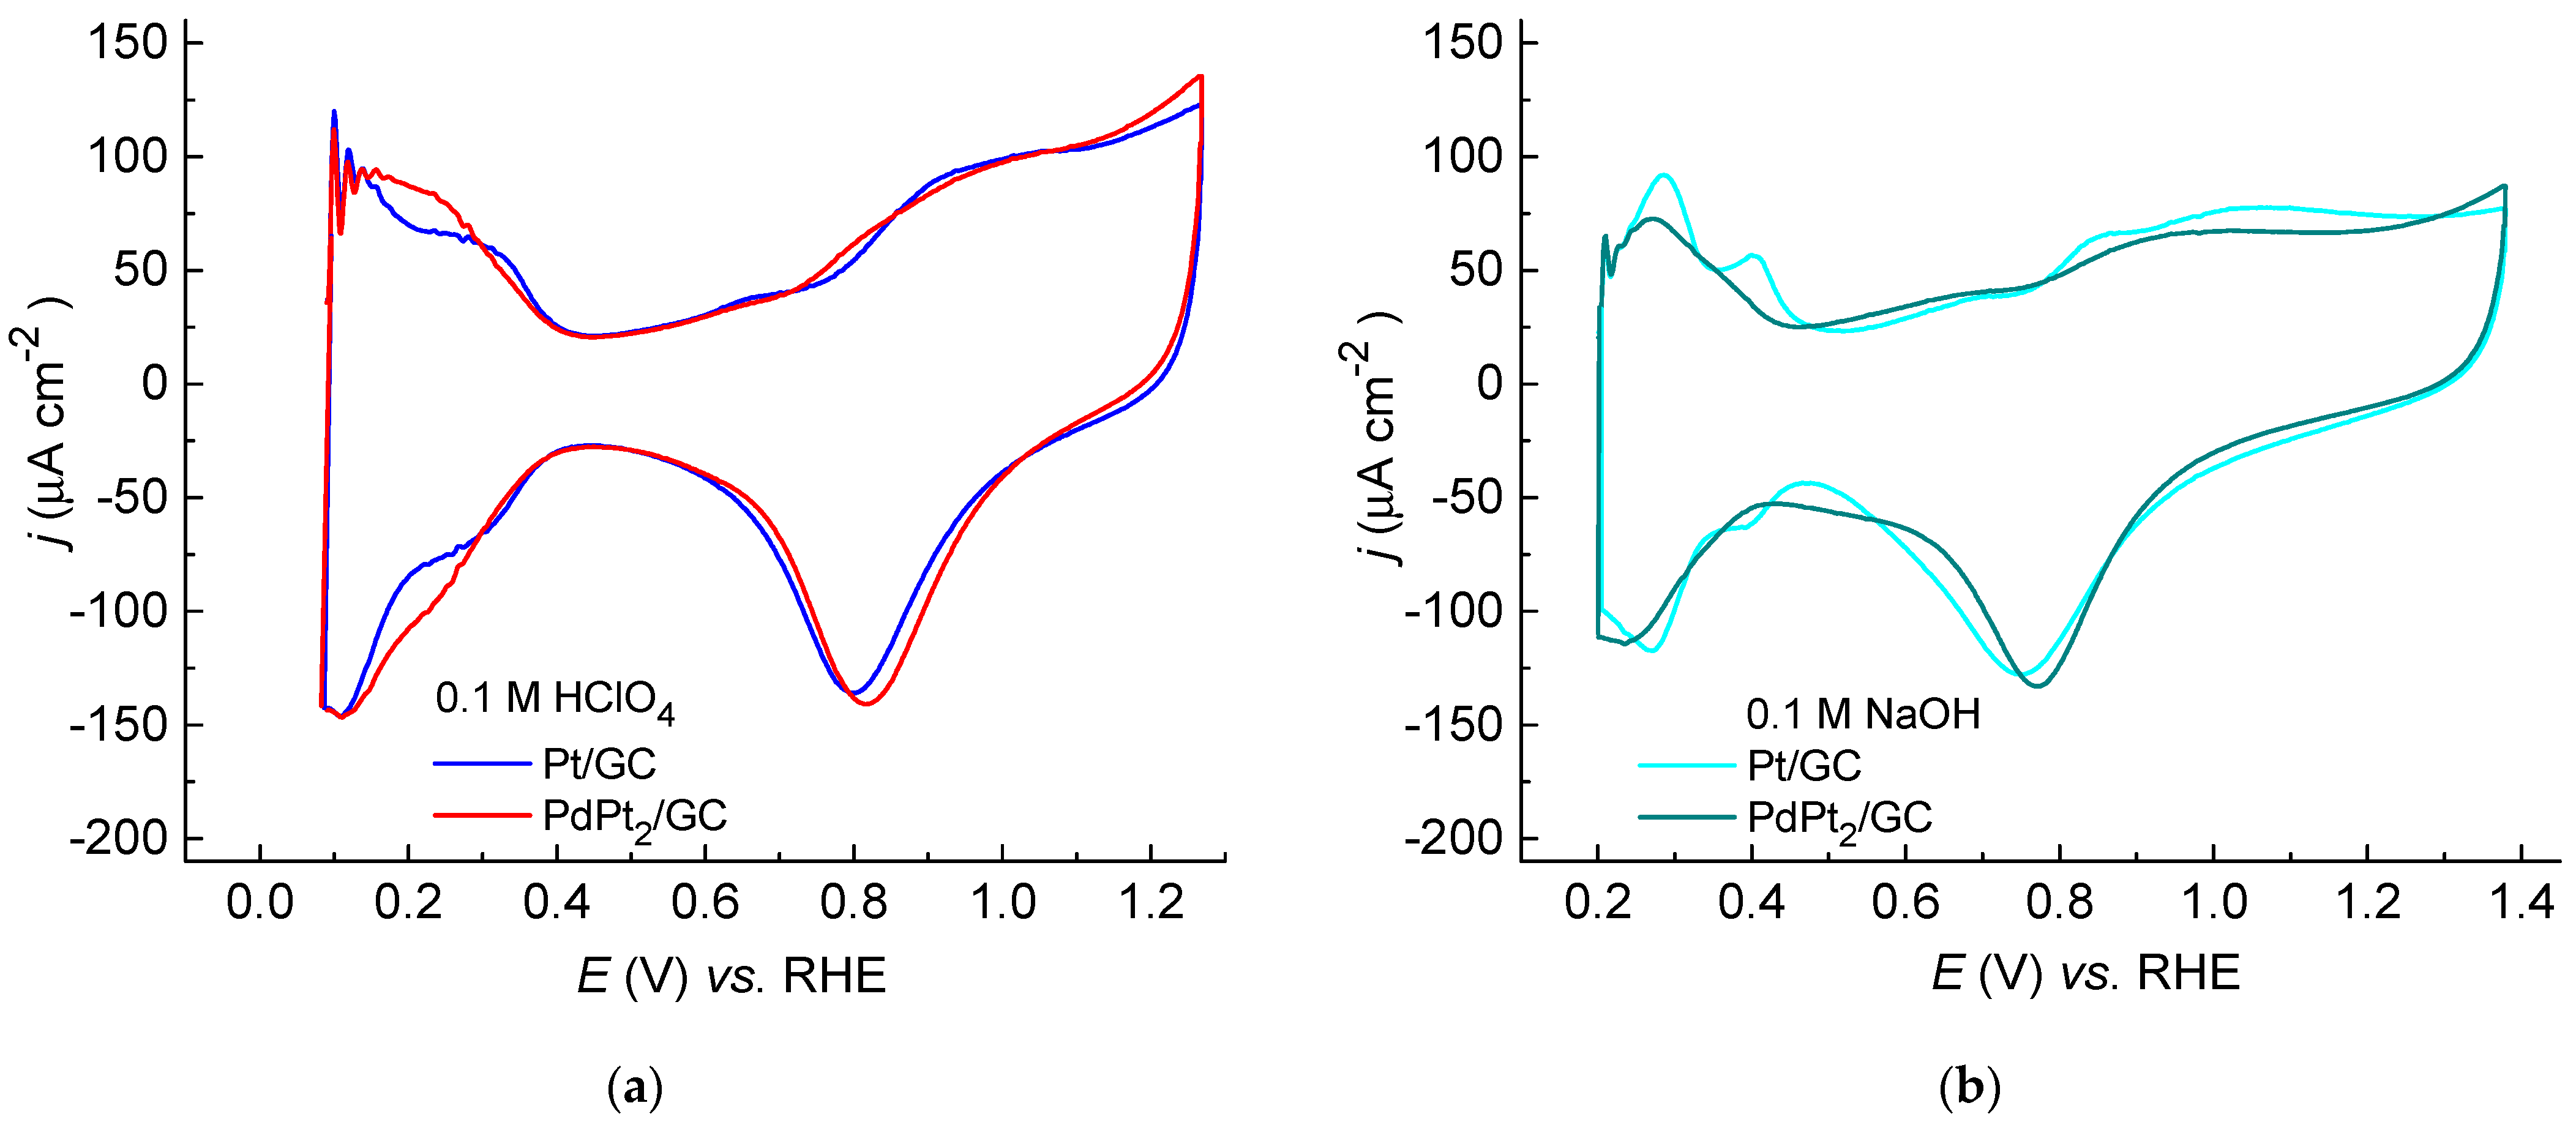
2.2.3. Cyclic Voltammetry of Pt/GC and PdPt2/GC Electrodes

Cyclic voltammograms of Pt/GC and PdPt2/GC electrodes in acidic and alkaline solutions are presented in Figure 6. Figure 6a shows CVs of the Pt/GC and PdPt2/GC electrodes in deaerated 0.1 M HClO4 solution recorded in the potential range from 0.09 V to 1.27 V. The CV of Pt/GC is similar to that of polycrystalline Pt in the perchloric acid solution. The presence of HClO4- anions does not affect any electrochemical process due to its weak adsorption on the surface covered with the platinum deposit [55]. A lower potential limit was chosen to avoid hydrogen evolution. On noble metals such as Pt, Pd’s hydrogen adsorption occurs at potentials more positive than the equilibrium potential for hydrogen evolution. On The Pt/GC electrode, reversible cathodic and anodic peaks originating from weaker and stronger adsorbed hydrogen species can be observed in the potential region from 0.09 V to approx. 0.40, characteristic of Hupd adsorption/desorption on platinum.
At the potential of approx. 0.80 V the formation of PtO begins, preceded by OH adsorption at a lower potential. A higher potential limit (1.27 V) was chosen to avoid oxygen evolution. The main reduction peak occurs at ca. 0.80 V. The CV of the PdPt2/GC electrode shows differences from the CV of Pt/GC. The hydrogen adsorption/desorption processes occur in the same potential range, as on bare palladium, while the double layer region remains the same. The oxide formation begins at a potential of approx. 0.72 V and continues further at higher potentials. The main reduction peak occurs at 0.82 V.
The CVs of Pt/GC and PdPt2/GC electrodes in deaerated 0.1 M NaOH solution are presented in Figure 6b. For The Pt/GC electrode, the CV shows the hydrogen adsorption/desorption process, a wider double layer originating from the adsorption of OH, and platinum oxide formation/reduction. At lower potentials, the hydrogen adsorption/desorption (Hupd) processes correspond to two pairs of reversible cathodic and anodic peaks at ca. 0.28 V and 0.40 V.
Oxide formation begins at 0.77 V, while an oxide reduction peak appears at 0.75 V. In the case of the PdPt2/GC electrode, hydrogen adsorption/desorption occurs at more negative potentials. The two Hupd peaks tend to compress into one with a lower intensity, which is more pronounced in an alkaline solution. The OH- adsorption on the PdPt2/GC occurs at more negative potentials of approx. 50 mV compared to Pt/GC due to the presence of Pd species. On the other hand, the reduction peak appears at the same potential.
The values of the charge calculated from the oxide reduction peaks (CVs in Figure 6a,b) for Pt/GC and PdPt2/GC for the upper potential limit of 1.27 V for 0.1 M HClO4 are 450 μC cm−2, which gives the ECSAs values of 0.21 cm2. In addition, the OCP value of 0.988 V for PdPt2/GC in the acid solution equals that of Pt(poly) and exceeds that of Pt/GC. The OCP values of Pt/GC and PdPt2/GC in alkaline solution are 1.070 V and 1.100 V, respectively. In all cases, the OCP values fall within the potential region of Pt and/or Pd oxide formation (see Figure 6) and coincide with the beginning of oxygen reduction (see below).

2.3. Oxygen Reduction Reaction on Pt/GC and PdPt2/GC Electrodes

The oxygen reduction reaction on the obtained Pt/GC and PdPt2/GC electrodes was studied in acidic and alkaline solutions using the RDE method. The polarization curves for the ORR were recorded for five different rotation rates in the cathodic direction, starting from the positive potential limit of 1.05 in 0.1 M HClO4 and 1.15 V in 0.1 M NaOH solutions.

2.3.1. ORR on Pt/GC and PdPt2/GC in 0.1 M HClO4 Solution

Figure 7 shows the polarization curves for the ORR on the Pt/GC and PdPt2/GC electrodes recorded in oxygen-saturated 0.1 M HClO4 and corresponding Koutecky–Levich (K–L) plots. Comparing the polarization curves from Figure 7a,c with the CVs from Figure 6a, it is evident that on the Pt/GC and PdPt2/GC electrodes the oxygen reduction reaction begins in the potential region of Pt and Pd oxide formation, respectively.
The ORR polarization curves were analyzed using the Koutecky–Levich equation:
1 j = 1 j k + 1 j l = 1 j k + 1 B ω 1 / 2
where j is the measured, jk the kinetic, and jl the diffusion-limited current densities. B is a constant, expressed as:
B = 0.62 n F C O 2 D O 2 2 / 3 ν 1 / 6
where n is the total number of electrons exchanged; F is Faraday’s constant (96,485 C mol−1); C O 2 is the oxygen solubility (1.26 × 10⁻³ mol L−1 [56]); D O 2 is the oxygen diffusivity (1.93 × 10⁻⁵ cm2 s−1 [56]) in 0.1 M HClO4 solution; and ν is the kinematic viscosity (0.01 cm2 s−1 [56]) of the solution.
The Koutecky–Levich plots, shown in Figure 7b,d, were constructed using the data from the polarization curves (Figure 7a,c), where the inverse current density (1/j) was plotted as a function of the inverse of the square root of the rotation rate (ω1/2). The K–L plots obtained from the polarization curves in 0.1 M HClO4 for both the PdPt2/GC and Pt/GC electrodes are linear, indicating first-order kinetics with respect to molecular oxygen. They are not parallel, meaning that the number of exchanged electrons changes with the potential.
The total number of exchanged electrons calculated from Equation (5) using the experimental values from K–L plots is four for both the PdPt2/GC and Pt/GC electrodes. The ORR activity also proceeds through a four-electron reaction pathway on various Pt single crystals [57] and polycrystalline Pt [9,58].
Figure 8 shows the polarization curves for the ORR on the PdPt2/GC and Pt/GC electrodes recorded in oxygen-saturated 0.1 M HClO4 with the same rotation rate of 1600 rpm and corresponding Tafel slopes. For comparison, the polarization curve for Pt(poly) is also shown.
In Figure 8a, the current densities are given relative to the geometric surface area. The initial potentials for the ORR (jk = 0) are 1.02 V and 1.05 V for the PdPt2/GC and Pt/GC electrodes, respectively. Concerning the initial potentials, the addition of Pd contributes to a slight decrease in the Pt/GC activity. The ORR activity of the Pt/GC exceeds that of Pt(poly) for 50 mV, while the activity of PdPt2/GC exceeds that of Pt(poly) for 20 mV. Figure 8b shows kinetic currents in the activation control region, which are given relative to the ECSA.
The Tafel slopes for the ORR on the Pt/GC and PdPt2/GC electrodes (insert in Figure 8b) in the activation control region are −69 mV dec−1 and −70 mV dec−1, respectively. These slopes are close to the value of −60 mV dec−1 for the Pt electrodes in 0.1 M HClO4 solution [55,57,59,60]. The value of −60 mV dec−1 was also obtained for different Pt/C catalysts [61], indicating that the transfer of the first electron to the O2 adsorbed on the surface is the rate-determining step [57,58]. Similarly, the Tafel slope of −60 mV dec−1 was obtained for PdAu/GC, prepared by the electrochemical deposition of Au, followed by spontaneous Pd deposition [62].
The specific activity (SA) for the ORR at a given potential is calculated according to the following equation:
SA = Ik/ECSA,
where Ik is the kinetic current at a given potential, and ECSA is the electrochemically active surface area of the electrode.
The overall four-electron pathway in which O2 is reduced into two H2O molecules can be described as follows:
O2 + 4e +4H+ → 2H2O      EΘ = 1.23 V
where EΘ is the standard potential (for 1 M [H+] corresponding to pH = 0) vs. SHE [63]. The correction for 0.1 M HClO4 (pH = 1.1) using the Nernst equation yields the equilibrium reduction potential of 1.17 V vs. SHE and 1.22 V vs. RHE.
The exchange current density, jo, was obtained from the Tafel plot by extrapolating the current density to its intercept with the ORR equilibrium potential (vs. RHE), while the charge transfer coefficient, α, was calculated from Tafel slope. Table 2 provides the half-wave potential, specific activity at 0.93 V, and kinetic parameters for the ORR on the Pt/GC and PdPt2/GC electrodes in 0.1 M HClO4 solution at 1600 rpm.

2.3.2. ORR on Pt/GC and PdPt2/GC in 0.1 M NaOH Solution

Figure 9 shows the polarization curves for the ORR in oxygen-saturated 0.1 M NaOH solution recorded in the cathodic direction for five rotation rates and corresponding Koutecky–Levich plots. The K–L plots are linear, indicating the first-order kinetics with respect to the molecular oxygen ( C O 2 is 1.22 × 10⁻³ mol L−1 [64] and D O 2 is 1.90 × 10⁻⁵ cm2 s−1 [64]). The overall number of exchanged electrons slightly varied with the potential, as indicated by the non-parallelism in THE K–L plots. As in an acid solution, the ORR reduction on both electrodes in an alkaline solution proceeds through a four-electron reaction pathway.
Figure 10a shows the polarization curves for the ORR on the PdPt2/GC and Pt/GC electrodes at the same rotation rate of 1600 rpm, where the current densities are given relative to the geometric area of electrodes. The polarization curve for Pt(poly) is given for comparison.
The ORR initial potentials (for jk = 0) for Pt/GC and PdPt2/GC are 1.09 V and 1.12 V, exceeding the initial potential for polycrystalline Pt (1.00 V vs. RHE) for 90 mV and 120 mV, respectively.
Figure 10b shows the same polarization curves for the ORR in the kinetic control region with current densities relative to the ECSA. The insert shows that the obtained Tafel slope for all three electrodes is close to −60mV dec−1, indicating that the rate-determining step is the exchange of the first electron. The same Tafel slope of −60 mV dec−1 in the activation control region was obtained for the Pt monolayers deposited on single crystals [65], Pt/C catalysts [66,67], and for various Pd-based catalysts [52,68].
The overall four-electron pathway in which O2 is reduced into four OH in an alkaline solution can be described as follows:
O2 + 4e +2H2O → 4OH−      EΘ = 0.40 V
where EΘ is the standard potential (for 1M [OH] corresponding to pH = 14) vs. SHE [63]. For 0.1 M NaOH (pH = 13), the equilibrium reduction potential is 0.46 V vs. SHE and 1.23 V vs. RHE.
Table 3 provides the half-wave potential, the specific activity at 0.91 V, and kinetic parameters for the ORR on the Pt/GC and PdPt2/GC electrodes in 0.1 M NaOH solution at 1600 rpm.

2.3.3. Comparison of the ORR Catalytic Activity of Different Pt/GC and PdPt2/GC

The ORR activity of the representative Pt/GC electrode differs in acidic and alkaline media. This is obvious from the difference between the initial (1.05 V in 0.1 M HClO4 and 1.04 V in 0.1 M NaOH) and equilibrium potentials (1.22 V in 0.1 M HClO4 and 1.23 V in 0.1 M NaOH solutions), which are 0.17 V for acid and 0.19 V for an alkaline solution. This difference indicates the slightly better catalytic activity of the same Pt/GC electrode in an acidic compared to an alkaline solution. These findings are in agreement with the earlier report [6], according to which OHads originating from PtOH has an inhibiting effect on ORRs in both acid and alkaline solutions. A more pronounced inhibiting effect in an alkaline solution was attributed to the higher concentration of OHads on the surface. In this work, the existence of PtOH on the Pt/GC surface was confirmed by XPS analysis. Moreover, according to the presented results, the beginning of the ORR on the Pt/GC coincides with the first step of Pt oxidation, attributed to PtOH formation [6].
The Pd addition to the Pt/GC substrate showed the inhibition of the ORR in the acidic solution. According to the previous reports, the inhibition of the ORR on thin films of Pd on Pt(111) is related to the adsorption of oxygenated species on the Pd surface in an acidic solution, unlike in alkaline, where that contributed to the better catalytic activity [32].
According to the most comprehensive scheme involving all the possible elementary steps during the oxygen reduction reaction [69], OHads could also facilitate the ORR through a 4e-reaction pathway in an alkaline solution, which was confirmed experimentally a little later for the ORR on Au(100) [70]. Namely, OHads could be a participant in one of the elementary steps during the reduction of a hydrogen peroxide anion as an intermediate:
HO2 + H2O + e = 2OH + *OHads
*OHads + e = OH
Here, we also report that with the same amount of Pd, in an alkaline solution, the PdPt2/GC electrode exceeds the catalytic activity for the ORR on Pt(poly) and Pt/GC electrodes, with respect to the initial and half-wave potentials. The remarkable initial potential of 1.12 V exceeds the initial potential for the ORR on the Pt/GC for 30 mV. The higher catalytic activity for the ORR on the PdPt2/GC than on the Pt/GC electrode in an alkaline solution can be explained by the presence of Pd(OH)x on the surface, as revealed by the XPS analysis. Moreover, in the beginning of oxygen reduction, the CVs revealed the presence of OH on the electrode surface’s originating from the oxidation of Pd nanoparticles to PdOH.
The onset potential, half-wave potential, and Tafel slope for the ORR on various Pt and PdPt nanoparticles supported by carbon-based materials, compared to the results obtained in this work, are given in Table 4.
Table 4 shows recently published results on the catalytic activity for the ORR on different Pt nanoparticles supported by various carbon-based materials or commercial Pt/C electrodes compared to the results presented in this work. The highest catalytic activity concerning the onset potential was observed for the Pt/GC electrode in this work and for the Pt/TiO2@CNT catalyst [71], showing the same onset potential of 1.050 V vs. RHE. The Pt/TiO2@CNT showed a higher half-wave potential attributed to the lower oxygen adsorption energy on the Pt nanoparticles caused by the deposition around the TiO2 nanoparticles [71]. Regarding the bimetallic PdPt-based catalyst, the PdPt2/GC catalyst obtained in this work showed the highest catalytic activity for the ORR, concerning the onset and half-wave potentials, but approximately the same Tafel slope in the activation control region.

3. Materials and Methods

3.1. Materials Preparation

GC disc (7 mm diameter, 0.385 cm2) was used as a supporting electrode for AFM and XPS measurements and GC disc (5 mm diameter, 0.196 cm2) embedded in a Teflon holder was used for the electrochemical measurements. The supporting GC electrode was prepared by mechanical polishing, using silicon carbide grinding paper (grit 4000), and then with 1 mm, 0.3 mm, and 0.05 mm alumina slurry on a cloth polishing pad. After rinsing in an ultrasonic milliQ water bath, the electrode was electrochemically activated by a potential cycling in the base 0.1 M HClO4 or 0.1 M NaOH solutions. The functional Pt/GC electrodes were prepared by the electrochemical deposition of platinum from 10−4 M H2PtCl4 + 0.05 M H2SO4 solution at different applied potentials and for various deposition times. PdPt2/GC electrodes were prepared by the additional spontaneous deposition of palladium, which was performed by immersion of previously prepared Pt/GC electrodes into the depositional 1 mM PdSO4 × 2H2O + 0.05 M H2SO4 solution for various times.

3.2. Materials Characterization

Survey XPS spectra (1000–0 eV binding energy) of Pt/GC and high-resolution spectra for Pt 4d +Pt 3d photoelectron lines of PdPt2/GC XPS spectra were recorded and analyzed using SPECS Systems. The spectra were recorded with XP50M X-ray source for Focus 500 and PHOIBOS 100/150, AlKα source (1486.74 eV) at 12.5 kV, and 32 mA at a pressure of 9 × 10⁻⁹ mbar. C 1s peak at 284.5 eV was used as a reference for all peak positions.
AFM images of the Pt/GC and PdPt2/GC were recorded ex situ using an NTEGRA Prima atomic force microscope (NT-MDT, Moscow, Russia) in an intermittent-contact AFM mode. An NT-MDT NSGO1 silicon, n-type, antimony-doped cantilever with Au reflective coating was used. The cantilever driving frequency was around 150 kHz, whereas the nominal force constant of the cantilevers was 5.1 N/m. Height and phase AFM images were recorded simultaneously to observe the morphology and chemical difference of the surface constituents, respectively.

3.3. Electrochemical Measurements

Electrochemical measurements were performed using PINE potentiostat with working Pt/GC and PdPt2/GC electrodes mounted in a Teflon holder. Pt wire was used as a counter and Ag/AgCl, 3 M KCl as a reference electrode. All potential values were recalculated vs. reference hydrogen electrode (RHE) using the Nernst equation: ERHE = EAg/AgCl, 3M KCl + RT/zF × pH + EΘ Ag/AgCl, 3M KCl, where EAg/AgCl, 3M KCl is the measured potential value, EΘ Ag/AgCl, 3M KCl is the standard potential of the Ag/AgCl 3M KCl electrode vs. standard hydrogen electrode at 25 °C (0.209 V), and RT/zF is 0.0592. Consequently, for 0.1 M HClO4 solution (pH 1), the recalculated potential value is E= EAg/AgCl, 3M KCl + 0.268 V, and for 0.1 M NaOH solution (pH 13) it is E = EAg/AgCl, 3M KCl + 0.979 V. The electrochemical characterization of the electrodes was performed using cyclic voltammetry in deaerated 0.1 M HClO4 and NaOH solutions. Their ORR electrocatalytic activities were examined via linear sweep voltammetry using a rotating-disc electrode technique.

3.4. Chemicals

Base solutions were prepared using supra pure H2SO4, HClO4, and NaOH pellets, purchased from Merck, Darmstadt, Germany, and Milli-pure water. H2PtCl6 solution and PdSO4 × 2H2O salt, purchased from Alfa Aesar, Thermo Fisher Scientific, Kandel, Germany, were used for the preparation of the depositing solutions. Working solutions were deaerated by N2 (99.9995%), except for ORR measurements when they were saturated by O2 (99.9995%), both purchased from Messer, Frankfurt, Germany.

4. Conclusions

Pt nanoparticles were deposited electrochemically on glassy carbon from an H2PtCl6 salt solution at different applied deposition potentials and various times. The Pt/GC electrode that showed the highest catalytic activity for the ORR was examined in detail in both acidic and alkaline solutions. The analysis of the AFM images revealed (96 ± 2)% surface coverage with the deposited Pt nanoparticles with sizes ranging from 50–250 nm. Thus, the prepared Pt/GC electrode was used as a substrate for further spontaneous palladium deposition from a PdSO4 salt solution. With the addition of Pd, the AFM analysis showed a full surface coverage and an increase in particle size to 100–300 nm. The analysis of the RDE results revealed that the ORR occurs through a 4e-series reaction mechanism in both solutions for all the prepared electrodes in this work. The PdPt2/GC electrode showed an enhanced catalytic activity for the ORR in alkaline solution compared to the Pt/GC and Pt(poly), which is related to the additional amount of OH originating from PdOH as revealed from the XPS analysis of the as-prepared electrode, and an oxidation peak in the potential region of the beginning of the ORR observed while comparing the LSV and CV results.

Author Contributions

Conceptualization, J.G. and S.Š.; investigation, J.G., L.R. and D.V.R.; writing—original draft preparation, J.G.; writing—review and editing, S.Š.; supervision, S.Š. All authors have read and agreed to the published version of the manuscript.

Funding

This research was funded by the Ministry of Education, Science and Technological Development of the Republic of Serbia (Grant No: 451-03-68/2022-14/200026).

Institutional Review Board Statement

Not applicable.

Informed Consent Statement

Not applicable.

Data Availability Statement

Not applicable.

Conflicts of Interest

The authors declare no conflict of interest.

References

  1. Wang, X.; Li, Z.; Qu, Y.; Yuan, T.; Wang, W.; Wu, Y.; Li, Y. Review of Metal Catalysts for Oxygen Reduction Reaction: From Nanoscale Engineering to Atomic Design. Chem 2019, 5, 1486–1511. [Google Scholar] [CrossRef]
  2. Norskov, J.K.; Rossmeisl, J.; Logadottir, A.; Lindqvist, L. Origin of the Overpotential for Oxygen Reduction at a Fuel-Cell Cathode. J. Phys. Chem. B 2004, 108, 17886–17892. [Google Scholar] [CrossRef]
  3. Sui, S.; Wang, X.; Zhou, X.; Su, Y.; Riffat, S.; Liu, C.J. A comprehensive review of Pt electrocatalysts for the oxygen reduction reaction: Nanostructure, activity, mechanism and carbon support in PEM fuel cells. J. Mater. Chem. A 2017, 5, 1808. [Google Scholar] [CrossRef]
  4. Shao, M.; Chang, Q.; Dodelet, J.P.; Chenitz, R. Recent Advances in Electrocatalysts for Oxygen Reduction Reaction. Chem. Rev. 2016, 116, 3594–3657. [Google Scholar] [CrossRef]
  5. Wang, Y.; Wang, D.; Li, Y. A fundamental comprehension and recent progress in advanced Pt-based ORR nanocatalysts. SmartMat 2021, 2, 56–75. [Google Scholar] [CrossRef]
  6. Markovic, N.; Gasteiger, H.; Ross, P.N. Kinetics of Oxygen Reduction on Pt(hkl) Electrodes: Implications for the Crystallite Size Effect with Supported Pt Electrocatalysts. J. Electrochem. Soc. 1997, 144, 1591. [Google Scholar] [CrossRef]
  7. Wang, J.X.; Markovic, N.M.; Adzic, R.R. Kinetic Analysis of Oxygen Reduction on Pt(111) in Acid Solutions: Intrinsic Kinetic Parameters and Anion Adsorption Effects. J. Phys. Chem. B 2004, 108, 4127–4133. [Google Scholar] [CrossRef]
  8. Gomez-Marin, A.M.; Rizo, R.; Feliu, J.M. Oxygen reduction reaction at Pt single crystals: A critical overview. Catal. Sci. Technol. 2014, 4, 1685. [Google Scholar] [CrossRef]
  9. Štrbac, S. The effect of pH on oxygen and hydrogen peroxide reduction on polycrystalline Pt electrode. Electrochim. Acta 2011, 56, 1597–1604. [Google Scholar] [CrossRef]
  10. Pasti, I.A.; Gavrilov, N.M.; Mentus, S.V. Potentiodynamic Investigation of Oxygen Reduction Reaction on Polycrystalline Platinum Surface in Acidic Solutions: The Effect of the Polarization Rate on the Kinetic Parameters. Int. J. Electrochem. Sci. 2012, 7, 11076–11090. [Google Scholar]
  11. Tian, Z.Q.; Lim, S.H.; Poh, C.K.; Tang, Z.; Xia, Z.; Luo, Z.; Shen, P.K.; Chua, D.; Feng, Y.P.; Shen, Z.; et al. A Highly Order-Structured Membrane Electrode Assembly with Vertically Aligned Carbon Nanotubes for Ultra-Low Pt Loading PEM Fuel Cells. Adv. Energy Mater. 2011, 1, 1205–1214. [Google Scholar] [CrossRef]
  12. Poh, C.K.; Lim, S.H.; Tian, Z.; Lai, L.; Feng, Y.P.; Shen, Z.; Lin, J. Pt-WxC nano-composites as an efficient electrochemical catalyst for oxygen reduction reaction. Nano Energy 2013, 2, 28–39. [Google Scholar]
  13. Nie, Y.; Li, L.; Wei, Z. Recent advancements in Pt and Pt-free catalysts for oxygen reduction reaction. Chem. Soc. Rev. 2015, 44, 2168. [Google Scholar] [CrossRef] [PubMed]
  14. Sharma, S.; Pollet, B.G. Support materials for PEMFC and DMFC electrocatalysts—A review. J. Power Sources 2012, 208, 96–119. [Google Scholar] [CrossRef]
  15. Manikandan, N.; Suresh Kumar, V.P.; Siva Murugan, S.; Rathis, G.; Vishnu Saran, K.; Shabariganesh, T.K. Carbon nanotubes and their properties-The review. Mater. Today Proc. 2021, 47, 4682–4685. [Google Scholar]
  16. Ramesh, M.; Rajeshkumar, L.; Bhoopathi, R. Carbon substrates: A review on fabrication, properties and applications. Carbon Lett. 2021, 31, 557–580. [Google Scholar] [CrossRef]
  17. Wang, J.; Kong, H.; Zhang, J.; Hao, Y.; Shao, Z.; Giucci, F. Carbon-based electrocatalysts for sustainable energy applications. Prog. Mater. Sci. 2021, 116, 100717. [Google Scholar] [CrossRef]
  18. Arenz, M.; Mayrhofer, K.J.J.; Stamenkovic, V.; Blizanac, B.B.; Tomoyuki, T.; Ross, P.N.; Markovic, N.M. The Effect of the Particle Size on the Kinetics of CO Electrooxidation on High Surface Area Pt Catalysts. J. Am. Chem. Soc. 2005, 127, 6819–6829. [Google Scholar] [CrossRef]
  19. Mazzotta, E.; Di Giulio, T.; Mastronardi, V.; Pompa, P.P.; Moglianetti, M.; Malitesta, C. Bare Platinum Nanoparticles Deposited on Glassy Carbon Electrodes for Electrocatalytic Detection of Hydrogen Peroxide. ACS Appl. Nano Mater. 2021, 4, 7650–7662. [Google Scholar] [CrossRef]
  20. Moreira, A.J.; Lopera, S.; Ordonez, N.; Mansano, R.D. Platinum nanoparticle deposition on polymeric membranes for fuel cell applications. J. Phys. Conf. Ser 2012, 370, 012030. [Google Scholar] [CrossRef]
  21. Hang, N.T.N.; Yang, Y.; Nam, N.Q.T.; Nogami, M.; Phuc, L.H.; Long, N.V. Pt-Based Multimetal Electrocatalysts and Potential Applications: Recent Advancements in the Synthesis of Nanoparticles by Modified Polyol Methods. Crystals 2022, 12, 375. [Google Scholar] [CrossRef]
  22. Dominguez-Dominguez, S.; Arias-Pardilla, J.; Berenguer-Murcia, A.; Morallon, E.; Cazorla-Amoros, D. Electrochemical deposition of platinum nanoparticles on different carbon supports and conducting polymers. J. Appl. Electrochem. 2008, 38, 259–268. [Google Scholar] [CrossRef]
  23. Cao, F.; Zang, Z.; Sun, S.; Sun, X.; Li, X.; Liu, T.; Wu, J. The influence of deposited potential on the ORR activity of Pt catalysts on glassy carbon electrode. RSC Adv. 2017, 7, 25429. [Google Scholar] [CrossRef] [Green Version]
  24. Simonov, A.N.; Cherstiouk, O.V.; Vassiliev, S.Y.; Zaikovskii, V.I.; Filatov, A.Y.; Rudina, N.A.; Savinova, E.R.; Tsirlina, G.A. Potentiostatic electrodeposition of Pt on GC and on HOPG at low loadings: Analysis of the deposition transients and the structure of Pt deposits. Electrochim. Acta 2014, 150, 279–289. [Google Scholar] [CrossRef]
  25. Lin-Cai, J.; Pletcher, D. A substrate effect on the catalytic activity of electrodeposited platinum layers. J. Electroanal. Chem. 1983, 149, 237–247. [Google Scholar] [CrossRef]
  26. Guo, S.; Zhang, S.; Sun, S. Tuning Nanoparticle Catalysis for the Oxygen Reduction Reaction. Angew. Chem. Int. Ed. 2013, 52, 8526–8544. [Google Scholar] [CrossRef]
  27. Wang, C.; Daimon, H.; Onodera, T.; Koda, T.; Sun, S. A General Approach to the Size- and Shape-Controlled Synthesis of Platinum Nanoparticles and Their Catalytic Reduction of Oxygen. Angew. Chem. Int. Ed. 2008, 47, 3588–3591. [Google Scholar] [CrossRef]
  28. Ham, K.; Chung, S.; Lee, J. Narrow size distribution of Pt nanoparticles covered by an S-doped carbon layer for an improved oxygen reduction reaction in fuel cells. J. Power Sources 2020, 450, 227650. [Google Scholar] [CrossRef]
  29. Fichtner, J.; Watzele, S.; Garlyyev, B.; Kluge, R.M.; Haimerl, F.; El-Sayed, H.A.; Li, W.J.; Maillard, F.M.; Dubau, L.; Chattot, R.; et al. Tailoring the Oxygen Reduction Activity of Pt Nanoparticles through Surface Defects: A Simple Top-Down Approach. ACS Catal. 2020, 10, 3131–3142. [Google Scholar] [CrossRef]
  30. Lee, W.J.; Bera, S.; Kim, C.M.; Koh, E.K.; Hong, W.P.; Oh, S.J.; Cho, E.A.; Kwon, S.H. Synthesis of highly dispersed Pt nanoparticles into carbon supports by fluidized bed reactor atomic layer deposition to boost PEMFC performance. NPG Asia Mater. 2020, 12, 40. [Google Scholar] [CrossRef]
  31. Kondo, S.; Nakamura, M.; Maki, N.; Hoshi, N. Active Sites for the Oxygen Reduction Reaction on the Low and High Index Planes of Palladium. J. Phys. Chem. C 2009, 113, 12625–12628. [Google Scholar] [CrossRef]
  32. Arenz, M.; Schmidt, T.J.; Wandelt, K.; Ross, P.N.; Markovic, N.N. The Oxygen Reduction Reaction on Thin Palladium Films Supported on a Pt(111) Electrode. J. Phys. Chem. B 2003, 107, 9813–9819. [Google Scholar] [CrossRef]
  33. Lim, B.; Jiang, M.; Camargo, P.H.C.; Cho, E.C.; Tao, J.; Lu, X.; Zhu, Y.; Xia, Y. Pd-Pt Bimetallic Nanodendrites with High Activity for Oxygen Reduction. Science 2009, 324, 1302–1305. [Google Scholar] [CrossRef] [Green Version]
  34. Swami, A.; Patil, I.; Lokanathan, M.; Ingavale, S.; Kakade, B. Enhanced Oxygen Reduction Reaction by Pd-Pt Alloy Catalyst with Stabilized Platinum Skin. ChemistrySelect 2020, 5, 3486–3493. [Google Scholar] [CrossRef]
  35. Zheng, J.N.; He, L.L.; Chen, F.Y.; Wang, A.J.; Xue, M.W.; Feng, J.J. Simple one-pot synthesis of platinum-palladium nanoflowers with enhanced catalytic activity and methanol-tolerance for oxygen reduction in acid media. Electrochim. Acta 2014, 137, 431–438. [Google Scholar] [CrossRef]
  36. Jukk, K.; Kongi, N.; Tammeveski, K.; Solla-Gullon, J.; Feliu, J.M. PdPt alloy nanocubes as electrocatalysts for oxygen reduction reaction in acid media. Electrochem. Commun. 2015, 56, 11–15. [Google Scholar] [CrossRef]
  37. Arias-Pinedo, O.M.; Cardenas Riojas, A.A.; Pastor, E.; López, E.O.; Perez, G.; Archanjo, B.S.; Ponce-Vargas, M.; Planes, G.A.; Baena-Moncada, A.M. Hierarchical Porous Carbon-PtPd Catalysts and Their Activity toward Oxygen Reduction Reaction. ACS Omega 2022, 7, 20860–20871. [Google Scholar] [CrossRef]
  38. Pinheiro, V.S.; Souza, F.M.; Gentil, T.C.; Nascimento, A.N.; Parreira, L.S.; Sairre, M.I.; Batista, B.L.; Santos, M.C. Pd-Pt nanoparticles combined with ceria nanorods for application in oxygen reduction reactions in alkaline direct ethanol fuel cell cathodes. J. Alloys Compd. 2022, 899, 163361. [Google Scholar] [CrossRef]
  39. Zheng, F.; Kwong, T.-L.; Yung, K.-F. Surfactant-Free Monodispersed Pd Nanoparticles Template for Core-Shell Pd@PdPt Nanoparticles as Electrocatalyst towards Methanol Oxidation Reaction (MOR). Nanomaterials 2022, 12, 260. [Google Scholar] [CrossRef]
  40. Pusch, J.M.E.; Brondani, D.; Luza, L.; Dupont, J.; Vieira, I.C. Pt–Pd bimetallic nanoparticles dispersed in an ionic liquid and peroxidase immobilized on nanoclay applied in the development of a biosensor. Analyst 2013, 138, 4898. [Google Scholar] [CrossRef]
  41. Wang, X.; Xu, Y.; Cheng, N.; Zhang, Q.; Yang, Z.; Liu, B.; Wang, X.; Huang, K.; Luo, Y. Pd@Pt nanoparticles: Trienzyme catalytic mechanisms, surface-interface effect with DNA and application in biosensing. Sens. Actuators B Chem. 2022, 364, 131907. [Google Scholar] [CrossRef]
  42. Colon, F. Palladium and Platinum. In Standard Potentials in Aqueous Solutions; Bard, A.J., Parsons, R., Jordan, J., Eds.; Marcel Dekker: New York, NY, USA, 1985; pp. 339–366. [Google Scholar]
  43. Ye, W.; Zhang, X.; Chen, Y.; Du, Y.; Zhou, F.; Wang, C. Pulsed Electrodeposition of Reduced Graphene Oxide on Glass Carbon Electrode as an Effective Support of Electrodeposited Pt Microspherical Particles: Nucleation Studies and the Application for Methanol Electro-Oxidation. Int. J. Electrochem. Sci. 2013, 8, 2122–2139. [Google Scholar]
  44. Wang, S.; Lin, X. Electrodeposition of Pt–Fe(III) nanoparticle on glassy carbon electrode for electrochemical nitric oxide sensor. Electrochim. Acta 2005, 50, 2887–2891. [Google Scholar] [CrossRef]
  45. Montilla, F.; Morallon, E.; Duo, I.; Comninellis, C.; Vazquez, J.L. Platinum particles deposited on synthetic boron-doped diamond surfaces. Application to methanol oxidation. Electrochim. Acta 2003, 48, 3891–3897. [Google Scholar] [CrossRef] [Green Version]
  46. Xie, Y.; Sherwood, P.M.A. Ultrahigh Purity Graphite Electrode by Core Level and Valence Band XPS. Surf. Sci. Spectra 1992, 1, 367–372. [Google Scholar] [CrossRef]
  47. Morar, J.F.; Himpsel, F.J.; Hollinger, G.; Jordan, J.L.; Hughes, G.; McFeely, F.R. C 1s excitation studies of diamond (111). I. Surface core levels. Phys. Rev. B 1986, 33, 1340–1345. [Google Scholar] [CrossRef] [PubMed]
  48. Hammond, J.S.; Winograd, N. XPS spectroscopic study of potentiostatic and galvanostatic oxidation of Pt electrodes in H2SO4 and HClO4. J. Electroanal. Chem. Interfacial Electrochem. 1977, 78, 55–69. [Google Scholar] [CrossRef]
  49. Štrbac, S.; Petrović, S.; Vasilić, R.; Kovač, J.; Zalar, A.; Rakočević, Z. Carbon monoxide oxidation on Au(111) surface decorated by spontaneously deposited Pt. Electrochim. Acta 2007, 53, 998–1005. [Google Scholar] [CrossRef]
  50. Peuckert, M.; Coenen, F.P.; Bonzel, H.P. XPS study of the electrochemical surface oxidation of Platinum in N H2SO4 acid electrolyte. Electrochim. Acta 1984, 29, 1305–1314. [Google Scholar] [CrossRef]
  51. Rakočević, L.; Simatović, I.S.; Maksić, A.; Rajić, V.; Štrbac, S.; Srejić, I. PtAu Nanoparticles Supported by Reduced Graphene Oxide as a Highly Active Catalyst for Hydrogen Evolution. Catalysts 2022, 12, 43. [Google Scholar] [CrossRef]
  52. Golubović, J.; Rakočević, L.; Štrbac, S. The Effect of Sulphate and Chloride Palladium Salt Anions on the Morphology of Electrodeposited Pd Nanoparticles and their Catalytic Activity for Oxygen Reduction in Acid and Alkaline Media. Int. J. Electrochem. Sci. 2022, 17, 220943. [Google Scholar] [CrossRef]
  53. Rakočević, L.; Štrbac, S.; Srejić, I. Hydrogen evolution on Au/GC and PdAu/GC nanostructures in acid solution: AFM, XPS, and electrochemical study. Int. J. Hydrogen Energy 2021, 46, 9052–9063. [Google Scholar] [CrossRef]
  54. Rakočević, L.; Srejić, I.; Maksić, A.; Golubović, J.; Štrbac, S. Hydrogen Evolution on Reduced Graphene Oxide-Supported PdAu Nanoparticles. Catalysts 2021, 11, 481. [Google Scholar] [CrossRef]
  55. Srejić, I.; Smiljanić, M.; Rakočević, Z.; Štrbac, S. Oxygen Reduction on Polycrystalline Pt and Au Electrodes in Perchloric Acid Solution in the Presence of Acetonitrile. Int. J. Electrochem. Sci. 2011, 6, 3344–3354. [Google Scholar]
  56. Wakabayashi, N.; Takeichi, M.; Itagaki, M.; Uchida, H.; Watanabe, M. Temperature-dependence of oxygen reduction activity at a platinum electrode in an acidic electrolyte solution investigated with a channel flow double electrode. J. Electroanal. Chem. 2005, 574, 339–346. [Google Scholar] [CrossRef]
  57. Markovic, N.M.; Adzic, R.R.; Cahan, B.D.; Yeager, E.B. Structural effects in electrocatalysis: Oxygen reduction on platinum low index single-crystal surfaces in perchloric acid solutions. J. Electroanal. Chem. 1994, 377, 249–259. [Google Scholar] [CrossRef]
  58. Tarasevich, M.R.; Sadkovski, A.; Yeager, E. Oxygen Electrochemistry. In Comprehensive Treatise of Electrochemistry; Horsman, P., Conway, B.E., Yeager, E., Eds.; Plenum Press: New York, NY, USA, 1983; Volume 6, pp. 301–398. [Google Scholar]
  59. Perez, J.; Villullas, H.M.; Gonzalez, E.R. Structure sensitivity of oxygen reduction on platinum single crystal electrodes in acid solutions. J. Electroanal. Chem. 1997, 435, 179–187. [Google Scholar] [CrossRef]
  60. Omura, J.; Yano, H.; Watanabe, M.; Uchida, H. Electrochemical Quartz Crystal Microbalance Analysis of the Oxygen Reduction Reaction on Pt-Based Electrodes. Part 1: Effect of Adsorbed Anions on the Oxygen Reduction Activities of Pt in HF, HClO4, and H2SO4 Solutions. Langmuir 2011, 27, 6464. [Google Scholar] [CrossRef]
  61. Hussain, S.; Erikson, H.; Kongi, N.; Sarapuu, A.; Solla-Gullon, J.; Maia, G.; Kannan, A.M.; Alonso-Vante, N.; Tammeveski, K. Oxygen reduction reaction on nanostructured Pt based electrocatalysts: A review. Int. J. Hydrogen Energy 2020, 45, 31775–31797. [Google Scholar] [CrossRef]
  62. Golubović, J.; Srejić, I.; Štrbac, S. Oxygen Reduction on Glassy Carbon-Supported PdAu Nanoparticles in Perchloric Acid Solution. Int. J. Electrochem. Sci. 2021, 16, 210818. [Google Scholar] [CrossRef]
  63. Hoare, J.P. Oxygen. In Standard Potentials in Aqueous Solutions; Bard, A.J., Parsons, R., Jordan, J., Eds.; Marcel Dekker: New York, NY, USA, 1985; pp. 49–66. [Google Scholar]
  64. Zagal, J.; Bindra, P.; Yeager, E. Mechanistic study of O2 reduction on water soluble phthalocyanines adsorbed on graphite electrodes. J. Electrochem. Soc. 1980, 127, 1506–1517. [Google Scholar] [CrossRef]
  65. Lima, F.H.B.; Zhang, J.; Shao, M.H.; Sasaki, K.; Vukmirovic, M.B.; Ticianelli, E.A.; Adzic, R.R. Catalytic Activity-d-Band Center Correlation for the O2 Reduction Reaction on Platinum in Alkaline Solutions. J. Phys. Chem. C 2007, 111, 404–410. [Google Scholar] [CrossRef]
  66. Jiang, L.; Hsu, A.; Chu, D.; Chen, R. Oxygen Reduction Reaction on Carbon Supported Pt and Pd in Alkaline Solutions. J. Electrochem. Soc. 2009, 156, B370–B376. [Google Scholar] [CrossRef]
  67. Tammeveski, K.; Tenno, T.; Claret, J.; Ferrater, C. Electrochemical reduction of oxygen on thin-film Pt electrodes in 0.1 M KOH. Electrochim. Acta 1997, 42, 893–897. [Google Scholar] [CrossRef]
  68. Erikson, H.; Liik, M.; Sarapuu, A.; Kozlova, J.; Sammelselg, V. Oxygen reduction on electrodeposited Pd coatings on glassy carbon. Electrochim. Acta 2013, 88, 513–518. [Google Scholar] [CrossRef]
  69. Anastasijević, N.A.; Vesović, V.; Adzić, R.R. Determination of the kinetic parameters of the oxygen reduction reaction using the rotating ring-disk electrode: Part I. Theory. J. Electroanal. Chem. Interf. Electrochem. 1987, 229, 305–316. [Google Scholar] [CrossRef]
  70. Štrbac, S.; Adzić, R.R. The influence of OH chemisorption on the catalytic properties of gold single crystal surfaces for oxygen reduction in alkaline solutions. J. Electroanal. Chem. 1996, 403, 169–181. [Google Scholar] [CrossRef]
  71. Kong, J.; Qin, Y.-H.; Wang, T.-L.; Wang, C.-W. Photodeposition of Pt nanoparticles onto TiO2@CNT as high-performance electrocatalyst for oxygen reduction reaction. Int. J. Hydrogen Energy 2020, 45, 1991–1997. [Google Scholar] [CrossRef]
  72. Sarapuu, A.; Kasikov, A.; Laaksonen, T.; Kontturi, K.; Tammeveski, K. Electrochemical reduction of oxygen on thin-film Pt electrodes in acid solutions. Electrochim. Acta 2008, 53, 5873–5880. [Google Scholar] [CrossRef]
  73. Holade, Y.; Sahin, N.E.; Servat, K.; Napporn, T.W.; Kokoh, K.B. Recent Advances in Carbon Supported Metal Nanoparticles Preparation for Oxygen Reduction Reaction in Low Temperature Fuel Cells. Catalysts 2015, 5, 310–348. [Google Scholar] [CrossRef]
  74. Li, Z.; Gao, Q.; Zhang, H.; Tian, W.; Tan, Y.; Qian, W.; Liu, Z. Low content Pt nanoparticles anchored on N-doped reduced graphene oxide with high and stable electrocatalytic activity for oxygen reduction reaction. Sci. Rep. 2017, 7, 43352. [Google Scholar] [CrossRef] [PubMed]
  75. Liu, J.; Jiao, M.; Lu, L.; Barkholtz, H.M.; Li, Y.; Wang, Y.; Jiang, L.; Wu, Z.; Liu, D.-J.; Zhuang, L.; et al. High performance platinum single atom electrocatalyst for oxygen reduction reaction. Nat. Commun. 2017, 8, 15938. [Google Scholar] [CrossRef] [PubMed]
  76. Li, Z.; Deng, X.; Zhou, H.; Xuan, W.; Xie, Z.; Liu, F. Preparation of Self-Nitrogen-Doped Porous Carbon Nanofibers and Their Supported PtPd Alloy Catalysts for Oxygen Reduction Reaction. J. Solid State Electrochem. 2020, 24, 195–206. [Google Scholar] [CrossRef]
  77. Li, D.; Fang, H.; Yu, J.; Xu, M.; Li, T.; Wang, J. Porous Carbon Supported PtPd Alloy Nanoparticles Derived from N-Heterocyclic Carbene Bimetal Complex as Efficient Bifunctional Electrocatalysts. Electrochim. Acta 2020, 337, 135855. [Google Scholar] [CrossRef]
Figure 1. The electrochemical deposition of platinum on the GC substrate from 10−4 M H2PtCl6 + 0.05 M H2SO4 solution: (a) CV of bare GC electrode recorded at a scan rate of 50 mV s−1; (b) CA curves recorded at different deposition potentials.
Catalysts 12 00968 g001
Figure 2. Electrochemical characterization of different Pt/GC electrodes in 0.1 M HClO4: (a) CVs of Pt/GC prepared by Pt deposition for 30 min at different applied potentials, and (b) corresponding ORR polarization curves. (c) CVs of Pt/GC prepared by Pt deposition at 0.22 V for different times and (d) corresponding ORR polarization curves. CVs were recorded from deaerated and ORR polarization curves in oxygen-saturated solution at a scan rate of 50 mV s−1.
Catalysts 12 00968 g002
Figure 3. XPS spectra of Pt/GC and PdPt/GC: (a) Survey spectra; (b) High-resolution spectrum of C 1s line characteristic for both electrodes.
Catalysts 12 00968 g003
Figure 4. High-resolution XPS spectra of (a) Pt 4f for both Pt/GC and PdPt/GC; (b) O 1s for Pt/GC; (c) Pd 3d and Pt 4d3/2 for PdPt/GC; and (d) O 1s for PdPt/GC.
Catalysts 12 00968 g004
Figure 5. AFM images of Pt/GC surface obtained by the electrochemical Pt deposition (left column), and PdPt2/GC surfaces obtained by the additional spontaneous Pd deposition (right column): (a,d) height AFM images of Pt/GC (z-scale = 131 nm) and PdPt2/GC (z-scale = 118 nm); (b,e) phase AFM images of Pt/GC (z-scale = 7.2 Deg) and PdPt2/GC (z-scale = 7.2 Deg); (c,f) corresponding phase angle distributions showing the chemical difference between the constituents.
Catalysts 12 00968 g005
Figure 6. Cyclic voltammogrms of PtGC and PdPt2/GC electrodes recorded in: (a) 0.1 M HClO4 solution; (b) 0.1 M NaOH solution. Scan rate 50 mV s−1.
Catalysts 12 00968 g006
Figure 7. Polarization curves for ORR in 0.1 M HClO4 on (a) Pt/GC; (b) Corresponding K–L plot; (c) PdPt2/GC; and (d) Corresponding K–L plot. Scan rate 50 mV s−1.
Catalysts 12 00968 g007
Figure 8. Comparison of the polarization curves for ORR on PdPt2/GC, Pt/GC, and Pt(poly) electrodes in 0.1 M HClO4: (a) Current densities are given with respect to the geometric area of the GC electrode; (b) Current densities in the activation control region are given with respect to the ECSA; insert shows corresponding Tafel plots.
Catalysts 12 00968 g008
Figure 9. Polarization curves for ORR in 0.1 M NaOH on (a) Pt/GC; (b) Corresponding K–L plot; (c) PdPt2/GC; and (d) corresponding K–L plot. Scan rate 50 mV s−1.
Catalysts 12 00968 g009
Figure 10. Comparison of the polarization curves for ORR on PdPt2/GC, Pt/GC, and Pt(poly) electrodes in 0.1 M NaOH: (a) Current densities are given with respect to the geometric area of the GC electrode; (b) Current densities in the activation control region are given with respect to the ECSA; insert shows corresponding Tafel plots.
Catalysts 12 00968 g010
Table 1. Atomic percentage of the elements for Pt/GC and PdPt/GC.
LinePt/GC
At%
PdPt/GC
At%
C 1s86.2 ± 0.185.0 ± 0.1
O 1s12.1 ± 0.112.8 ± 0.1
Pt 4f7/21.7 ± 0.11.5 ± 0.1
Pd 3d5/2 0.7 ± 0.1
Table 2. Half-wave potential, specific activity, and kinetic parameters for ORR on Pt/GC and PdPt2/GC in 0.1 M HClO4 solution, compared to Pt(poly).
CatalystE1/2 (V)SA at 0.93 V (mA cm−2)Tafel Slope
(mV dec−1)
j0 × 10−5
(mA cm−2)
α
Pt(poly)0.823−0.12−670.620.882
Pt/GC0.836−0.25−691.050.844
PdPt2/GC0.825−0.21−701.610.857
Table 3. Half-wave potential, specific activity, and kinetic parameters for ORR on Pt/GC and PdPt2/GC in 0.1 M NaOH solution, compared to Pt(poly).
CatalystE1/2 (V)SA at 0.91 V (mA cm−2)Tafel Slope
(mV dec−1)
j0 × 10−5
(mA cm−2)
α
Pt(poly)0.834−0.10−621.000.953
Pt/GC0.828−0.18−661.870.909
PdPt2/GC0.841−0.28−642.960.923
Table 4. Comparison of the catalytic activity for ORR on various Pt and PdPt nanoparticles supported by carbon-based materials.
CatalystSolutionEonset (V)E1/2 (V)Tafel Slope
(mV dec−1)
Reference
Pt/TiO2@CNT0.1 M HClO41.0500.92764.9[71]
Pt/C0.1 M HClO40.9970.88062.4[71]
10nmPt/GC0.1 M HClO4-0.80964[72]
20 wt% Pt/C0.1 M HClO4-0.85067[73]
20 wt% Pt/C0.1 M NaOH-0.85069[73]
Pt/rGO0.1 M HClO40.8580.710-[74]
Pt/N-rG0.1 M HClO40.9000.740-[74]
Pt1-N/BP0.1 M HClO4-0.760-[75]
Pd36Pt640.5 M H2SO4-0.83062[36]
Pd54Pt460.5 M H2SO4-0.81062[36]
PtPd/f-p-CNF0.1 M HClO40.9500.826-[76]
PtPd/CKN0.1 M KOH0.9000.821-[77]
Pt/GC0.1 M HClO41.0500.83669This work
Pt/GC0.1 M NaOH1.0900.82860This work
PdPt2/GC0.1 M HClO41.0200.82570This work
PdPt2/GC0.1 M NaOH1.1200.84164This work
Publisher’s Note: MDPI stays neutral with regard to jurisdictional claims in published maps and institutional affiliations.

