

High-Temperature Abatement of N2O over FeOx/CeO2-Al2O3 Catalysts: The Effects of Oxygen Mobility

Abstract
:
1. Introduction
2. Results and Discussion
2.1. Phase Composition (XRD)
2.2. Catalytic Activity in N2O Decomposition and NH3 Oxidation
2.3. Microstructure and Morphology
2.3.1. DDPA
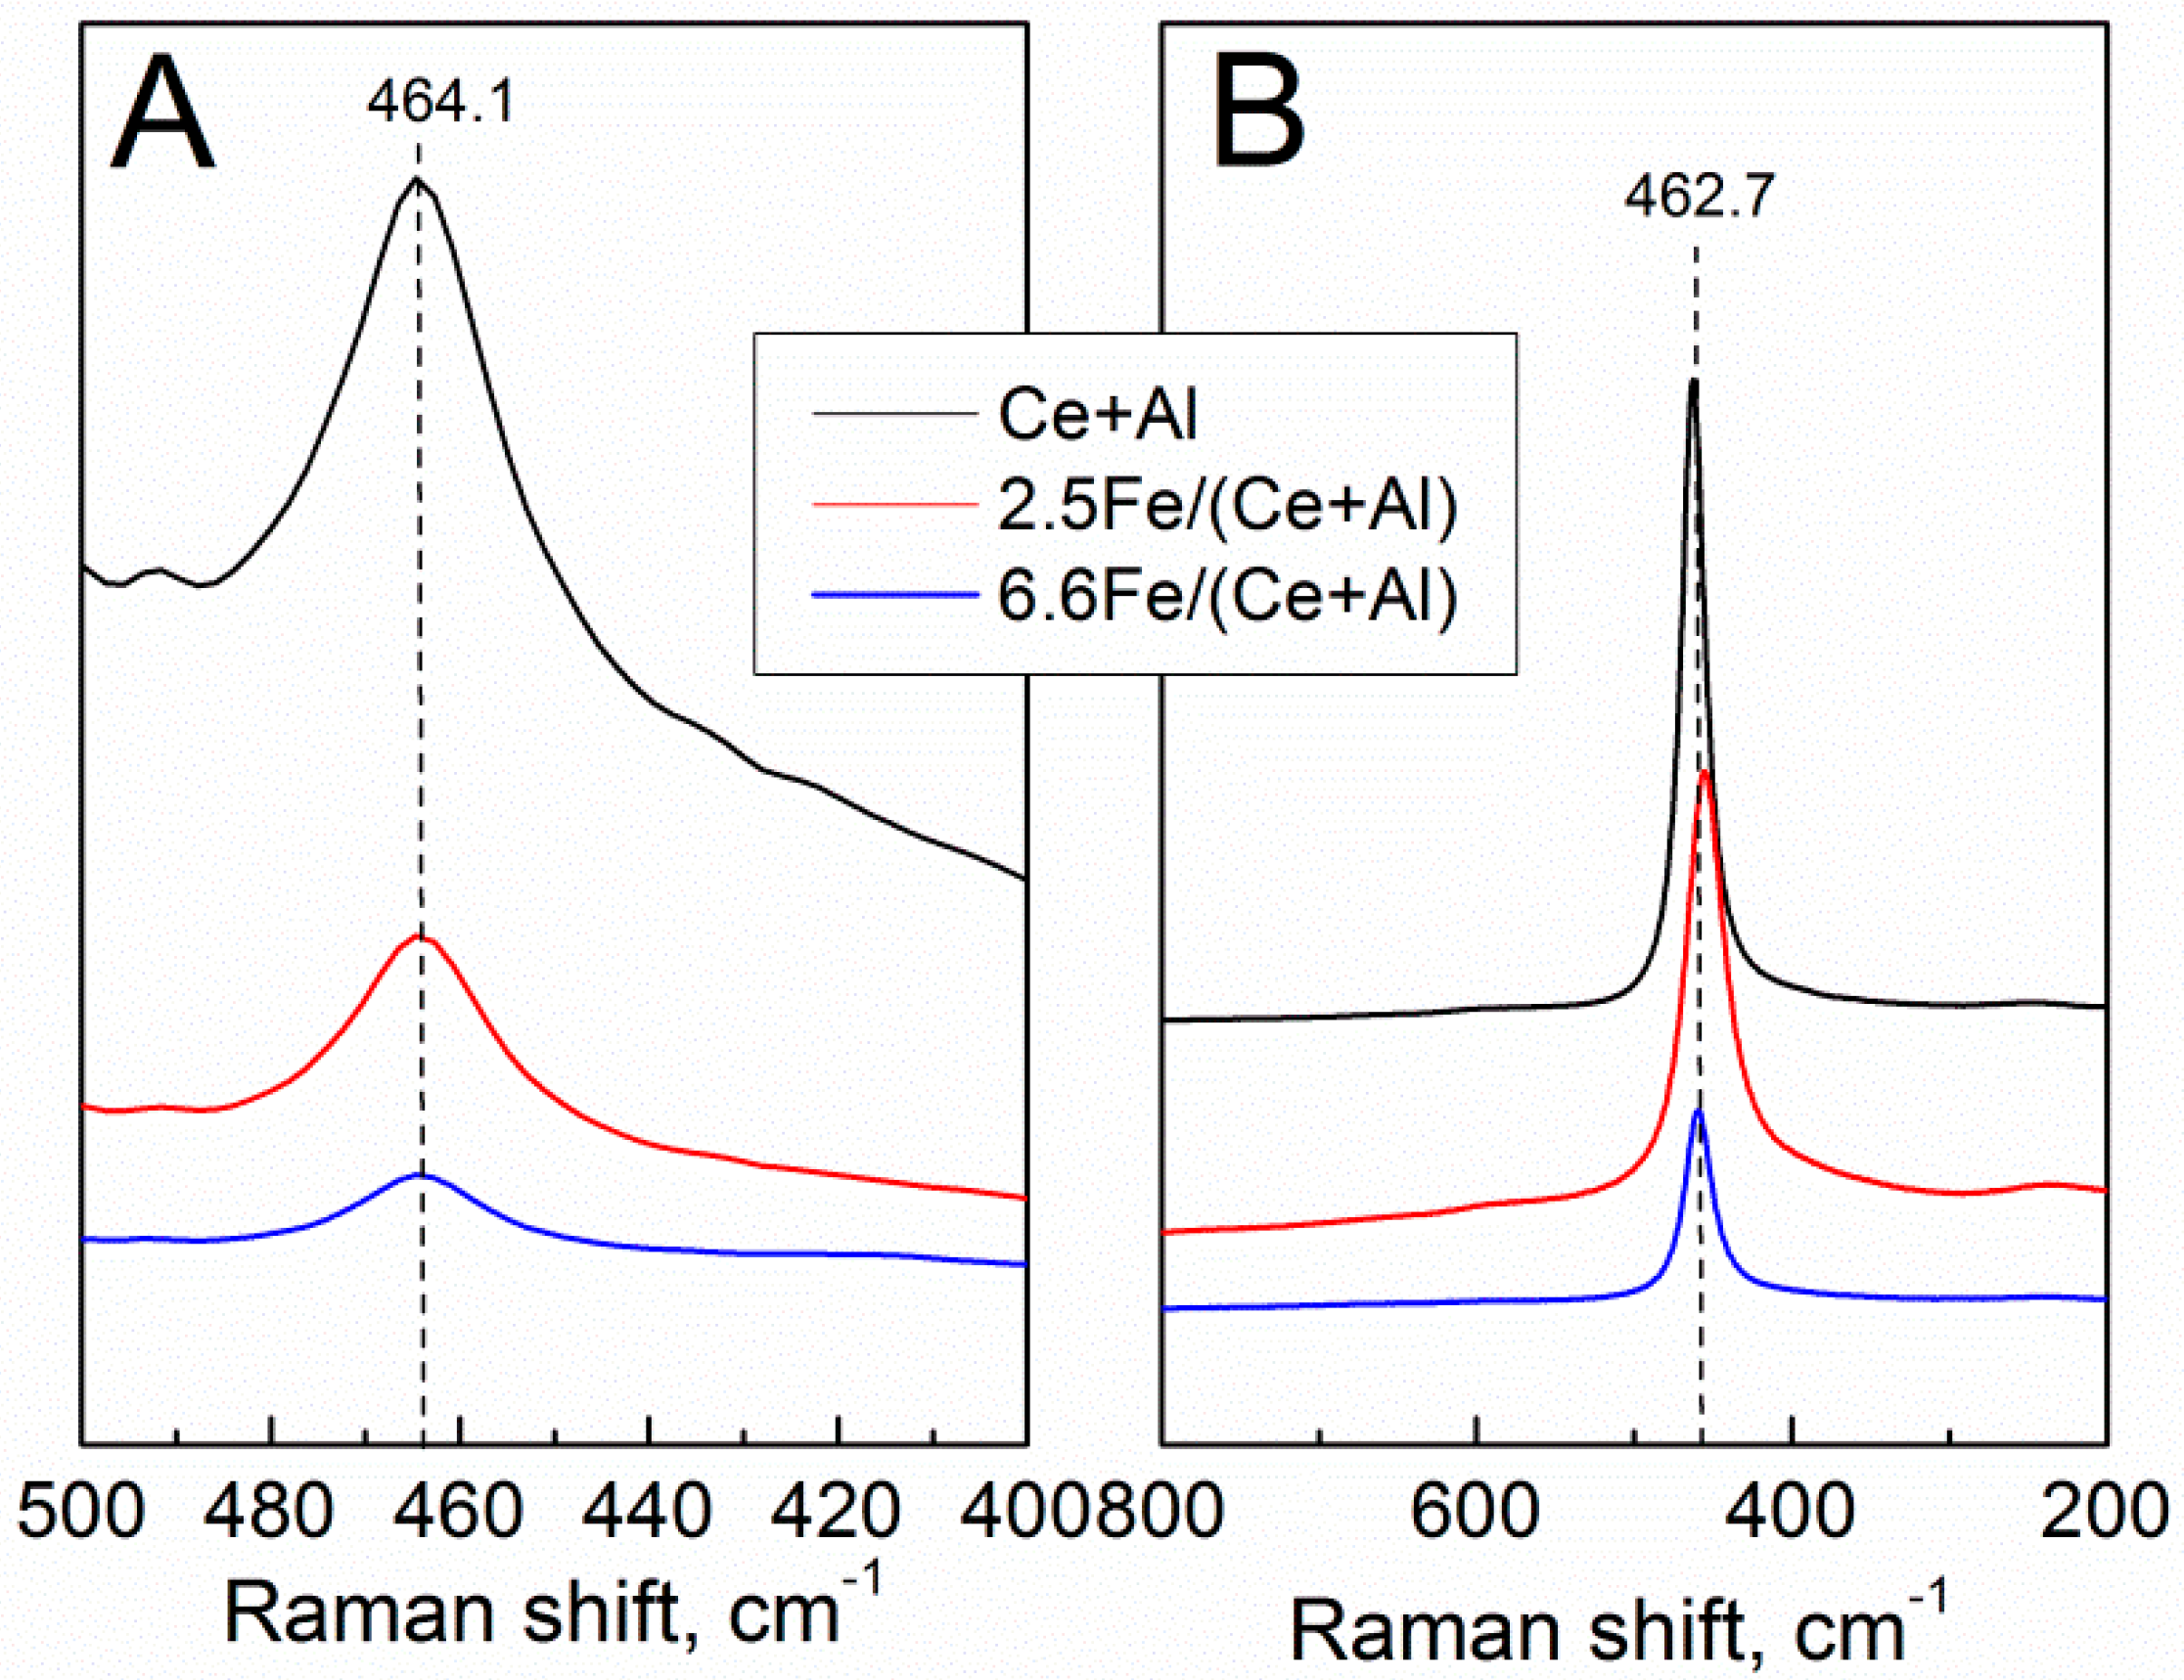
2.3.2. Raman
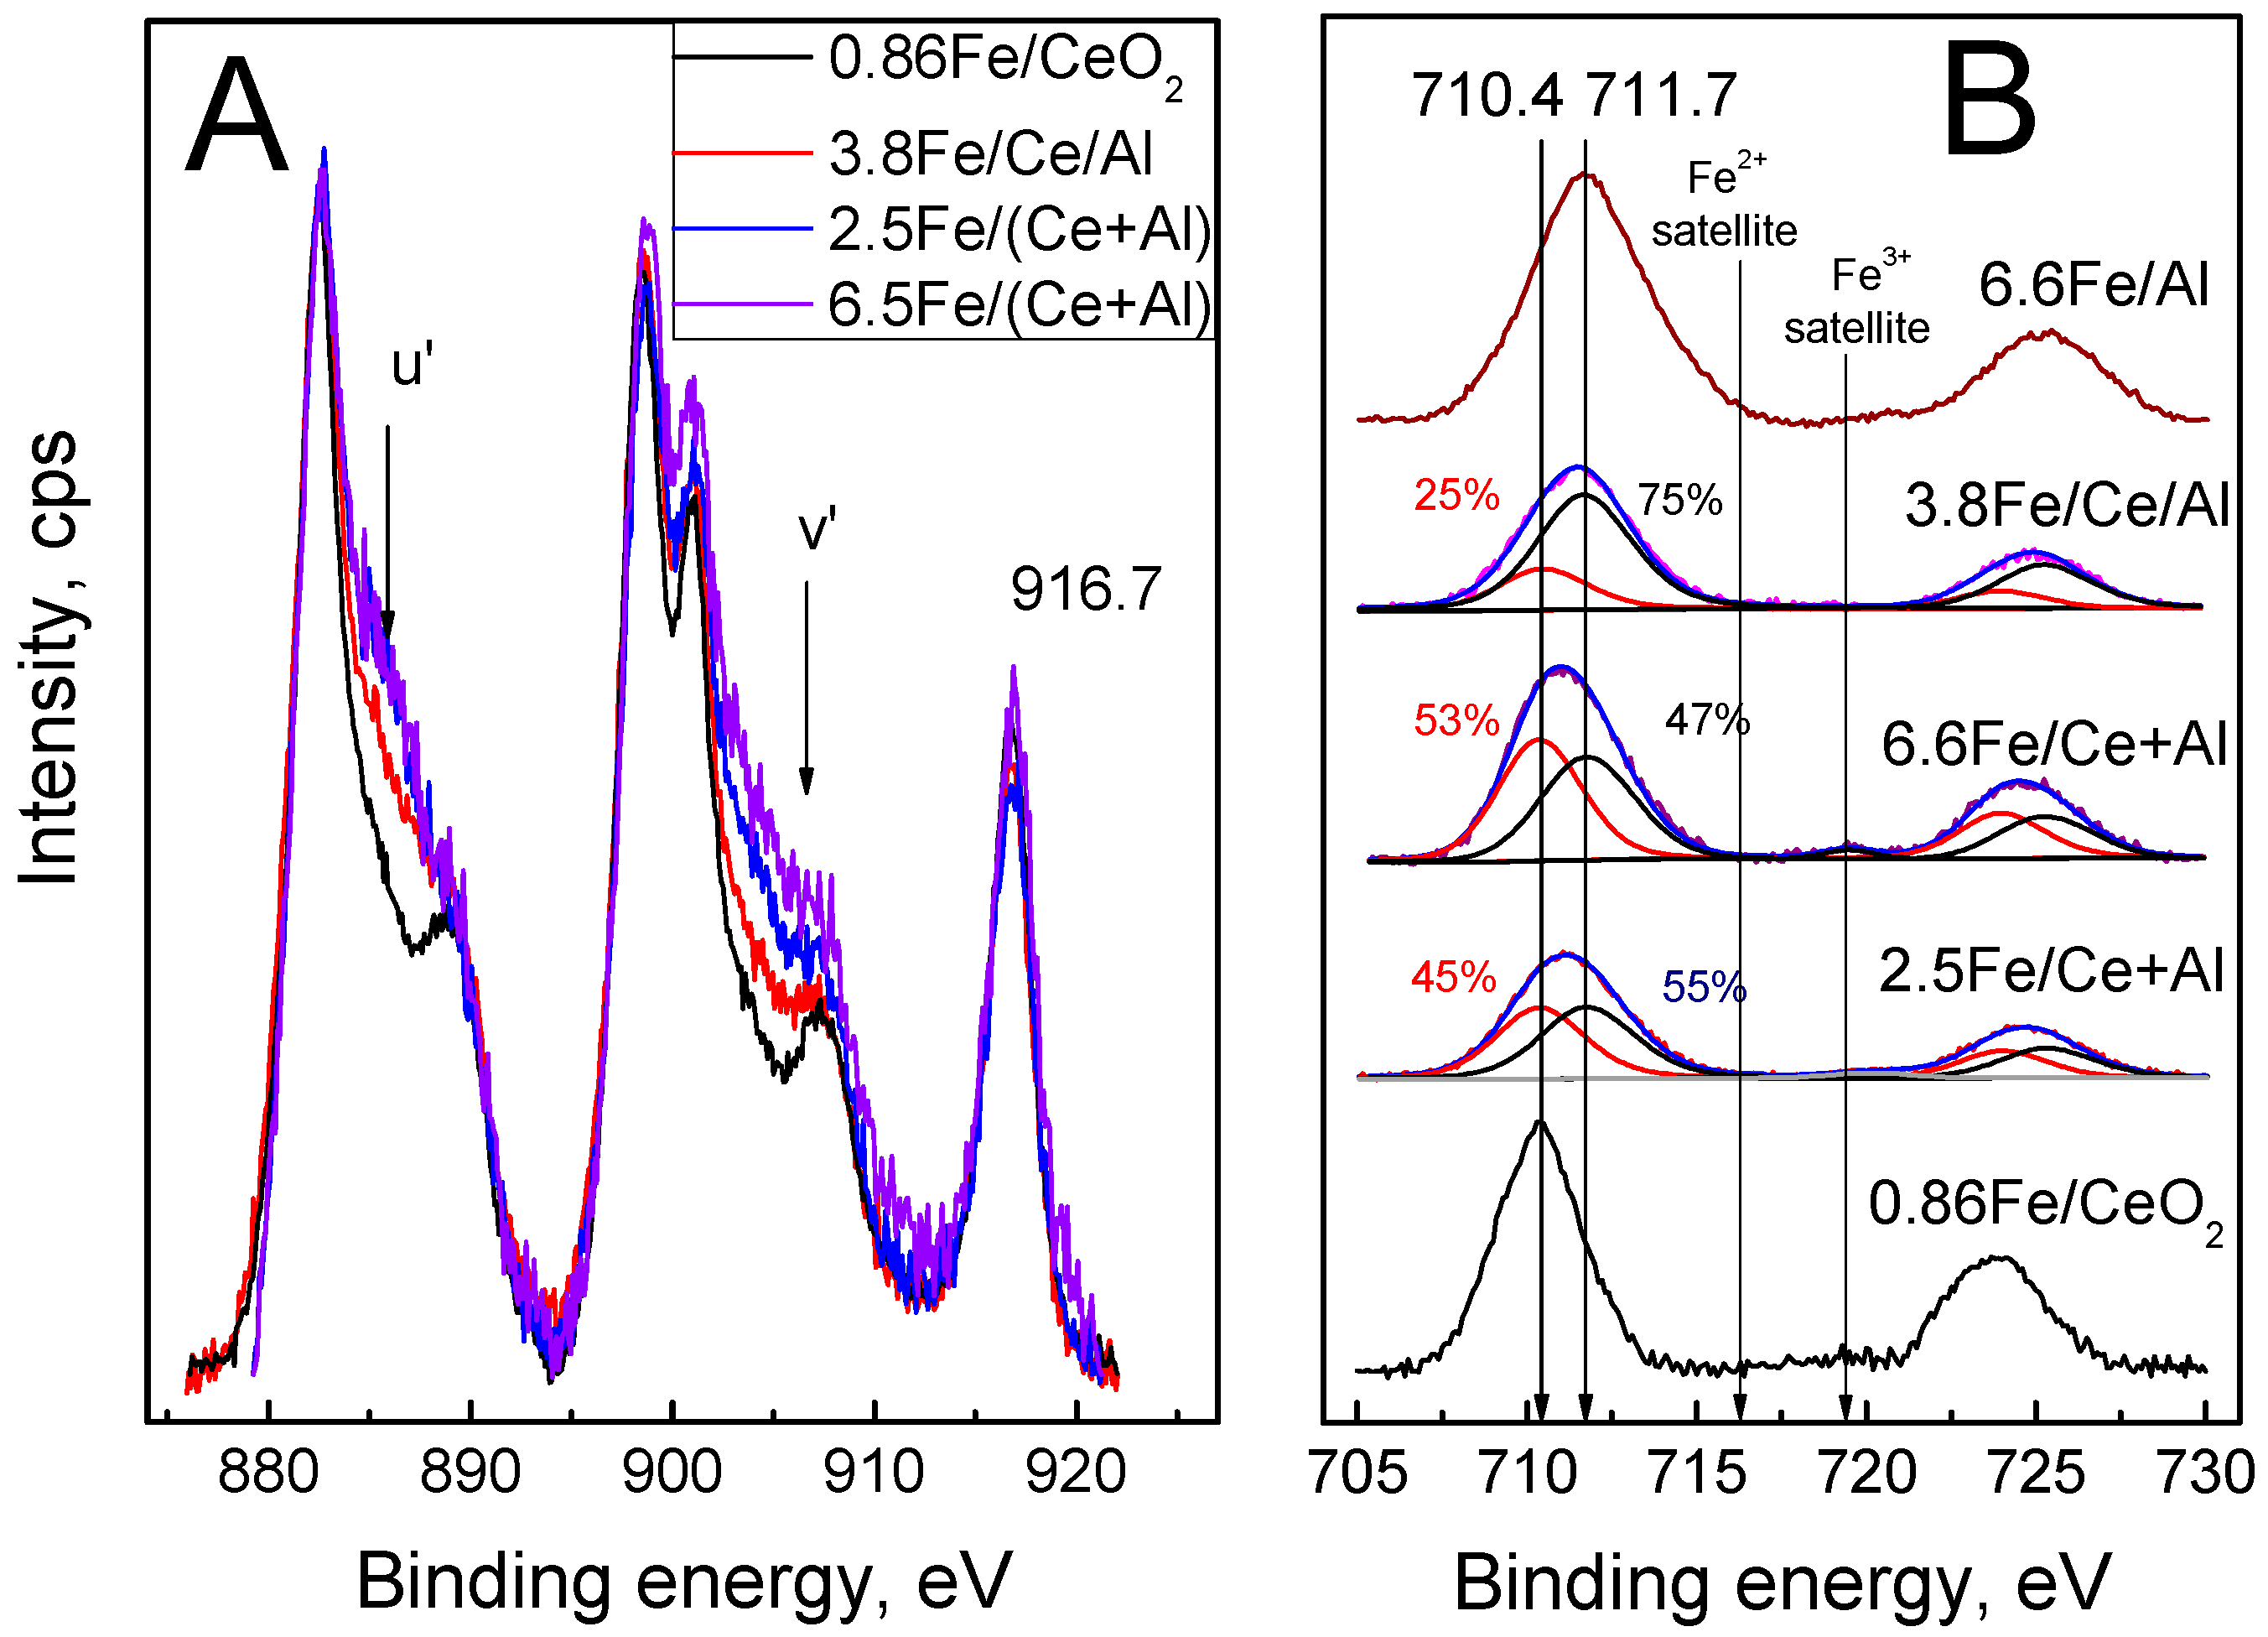
2.4. Surface Composition (XPS)
2.5. O2 Adsorption/Desorption
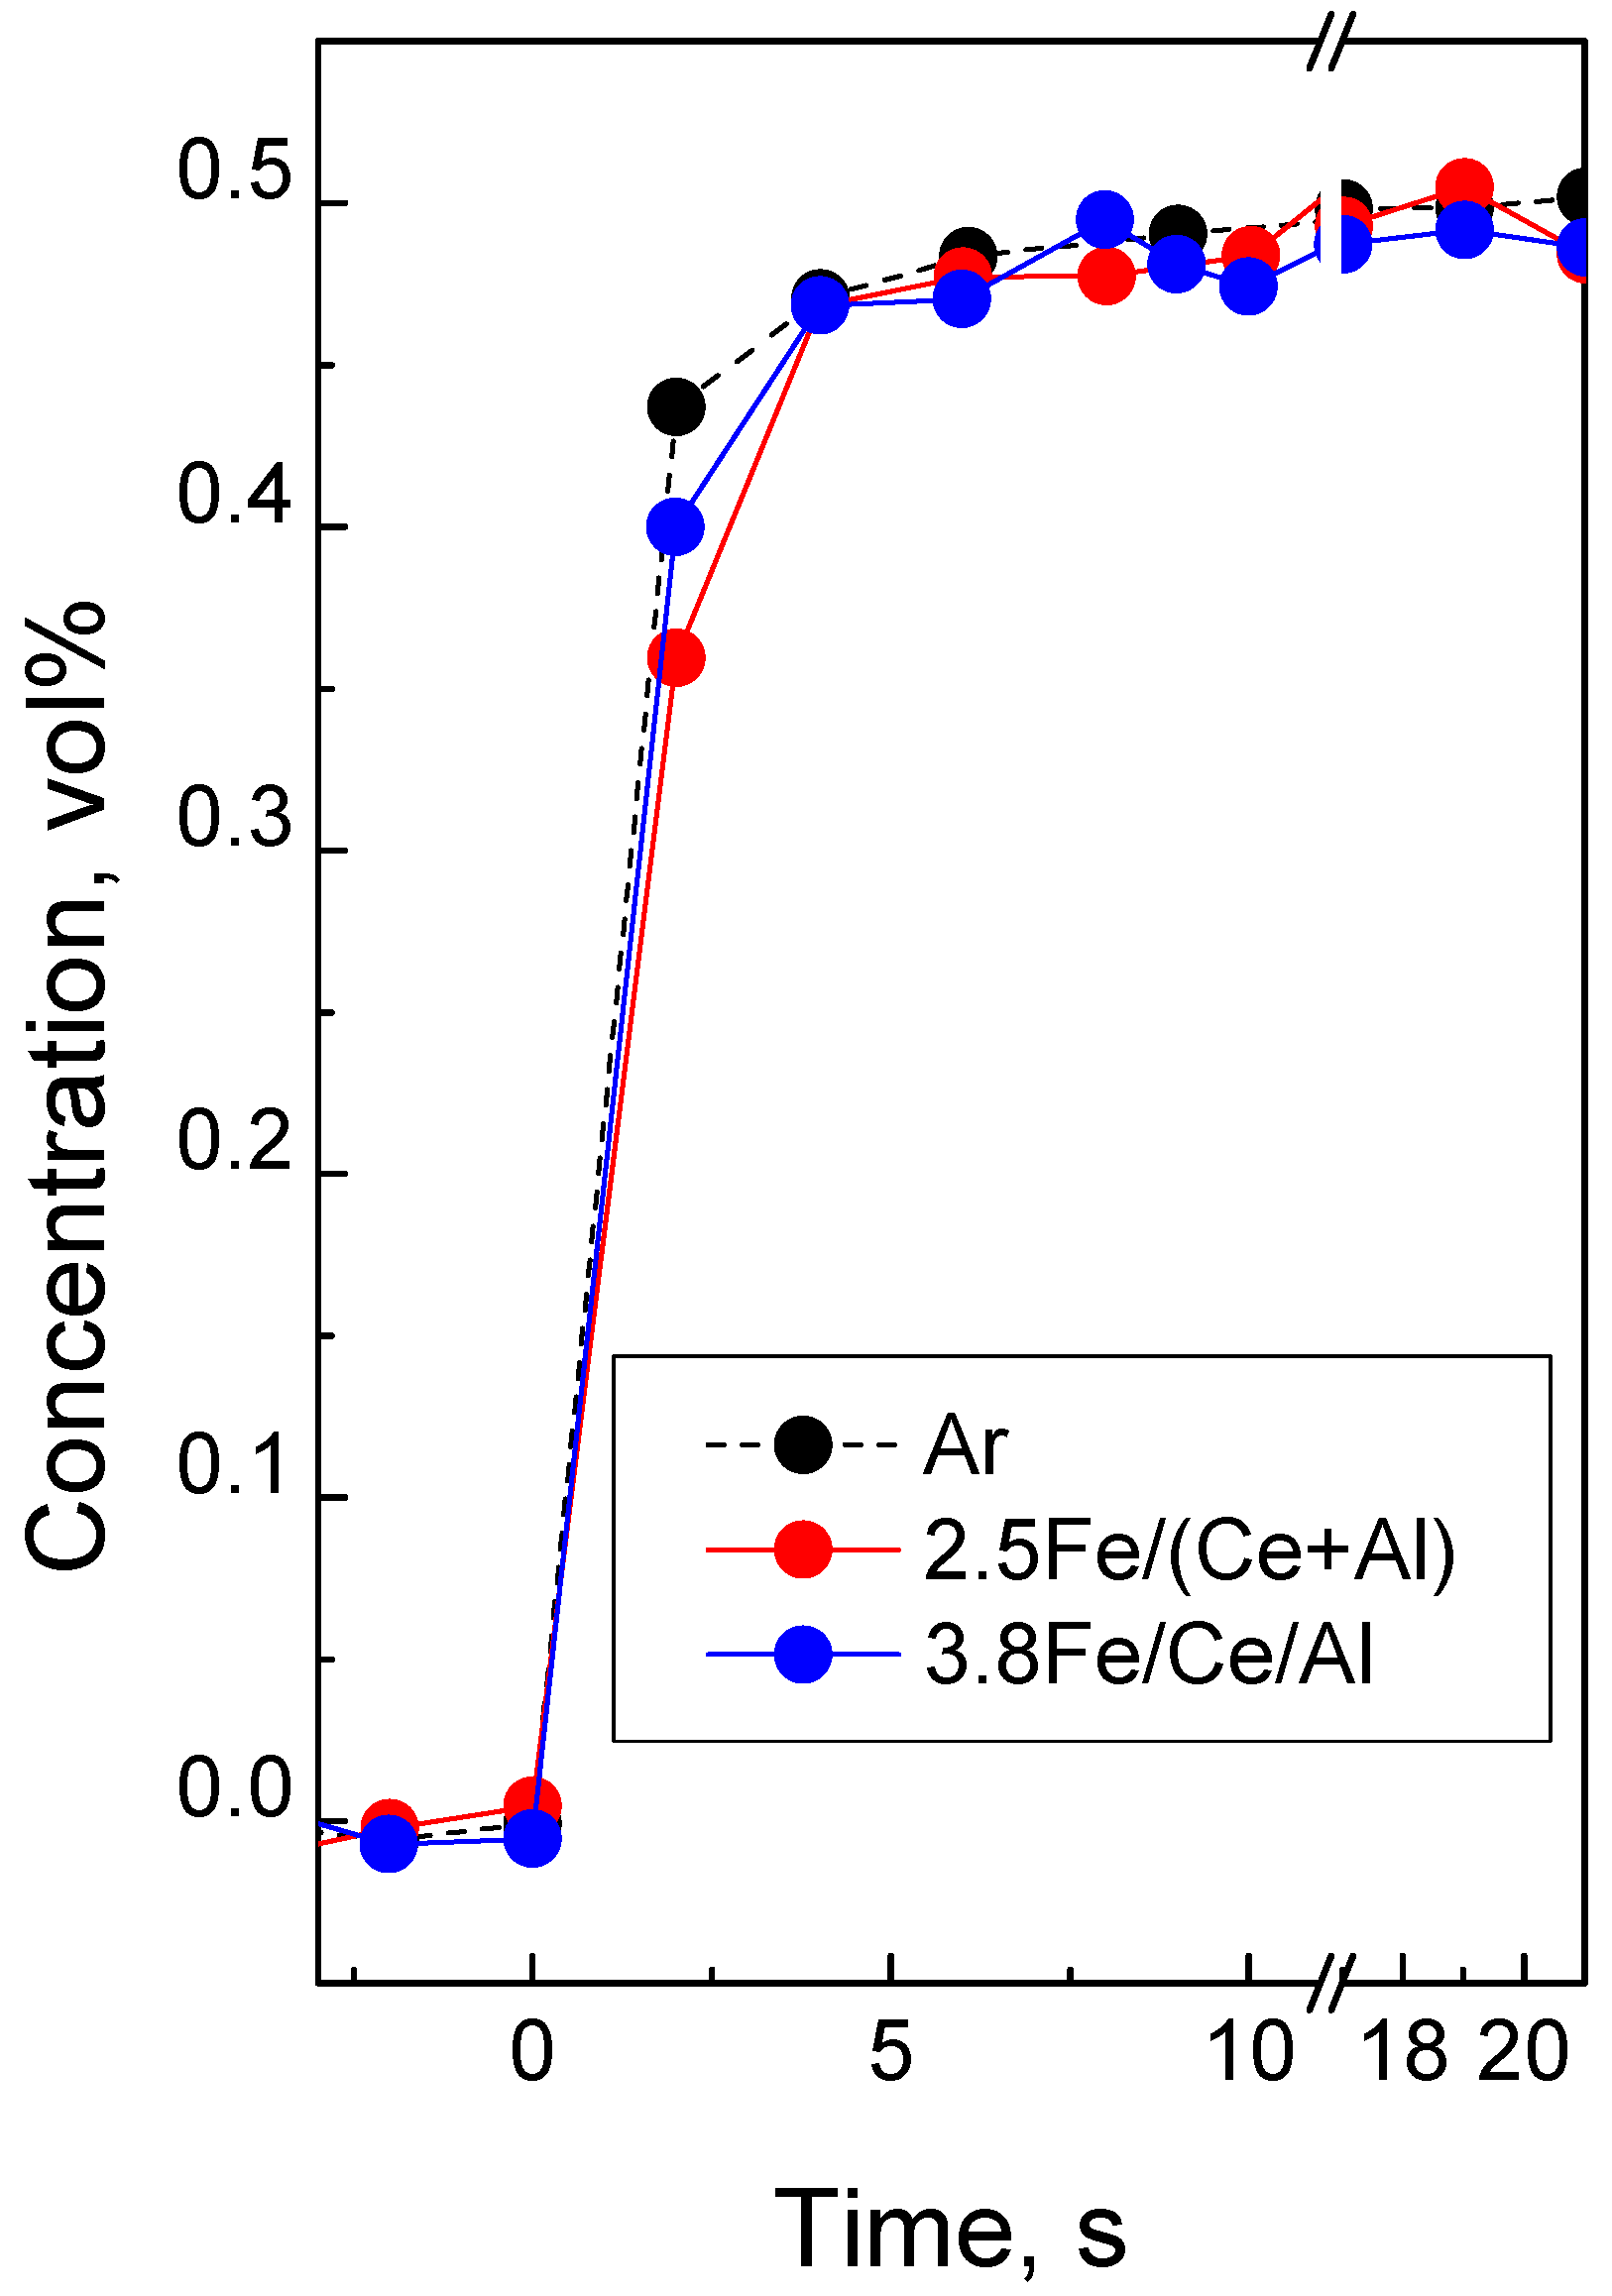
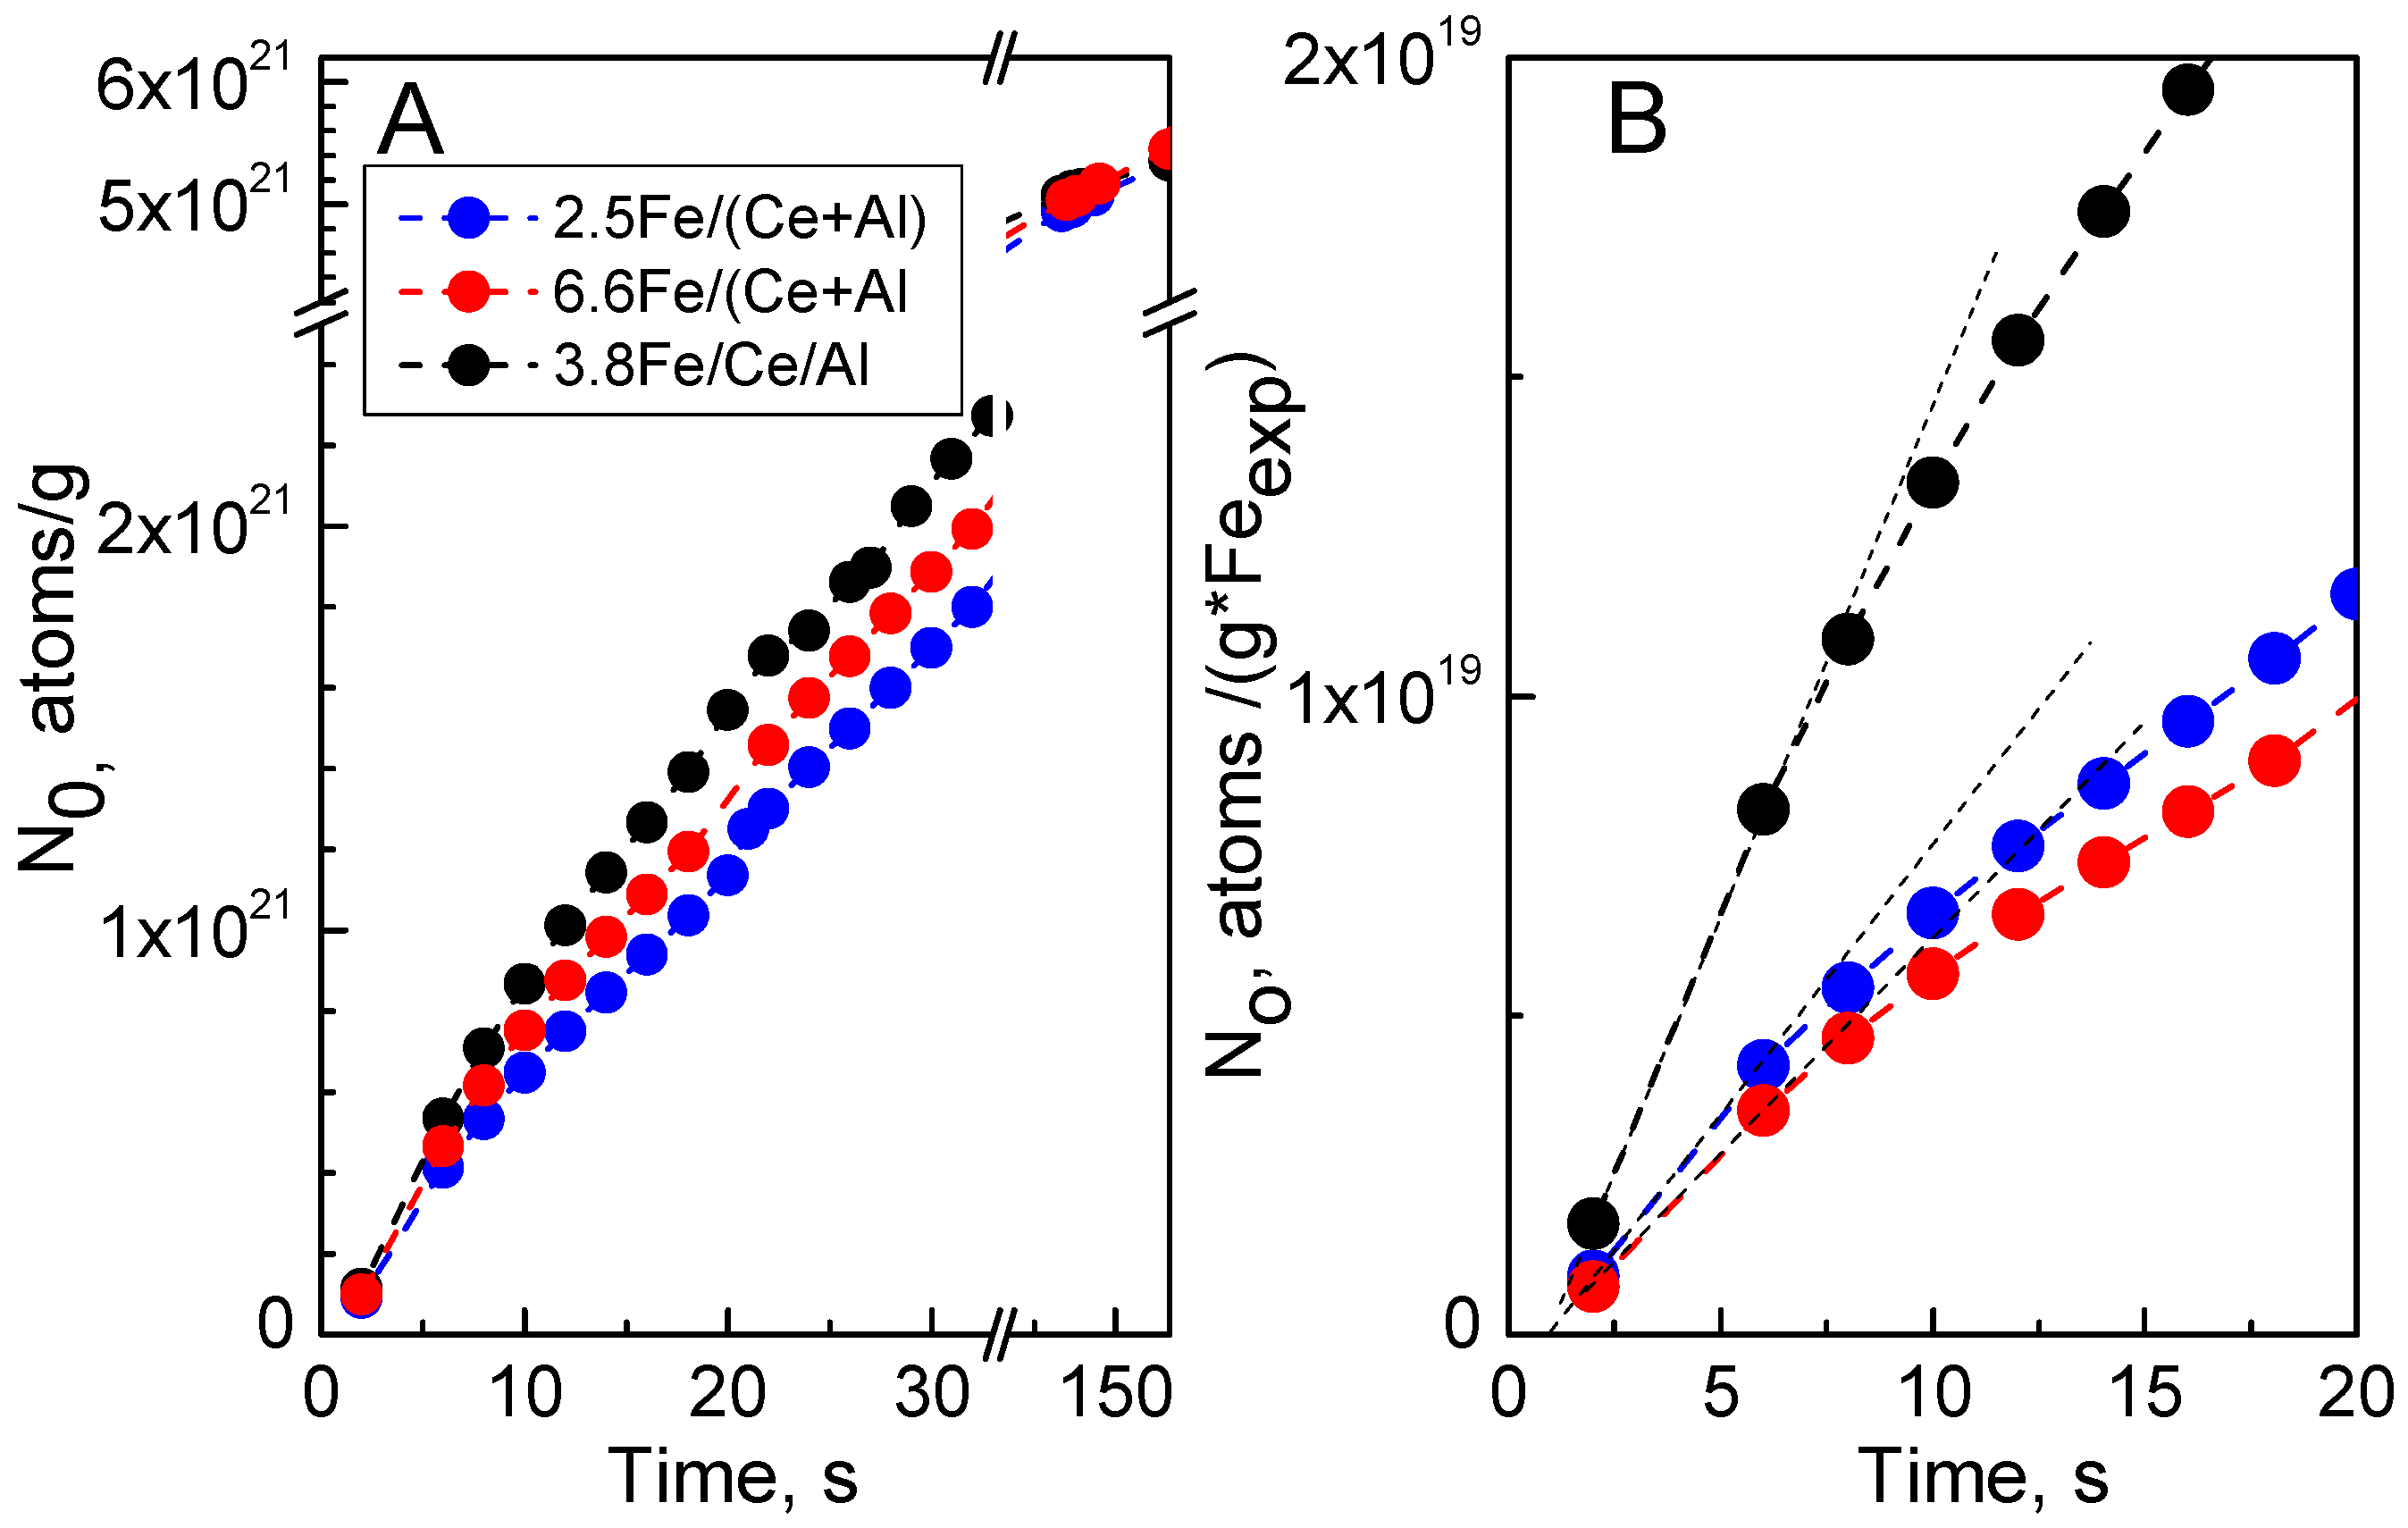
2.6. Oxygen Mobility (18O SSITKA)
2.7. Discussion
3. Materials and Methods
3.1. Catalysts Preparation
3.2. Characterization
3.3. Kinetic Measurements and Catalytic Tests
4. Conclusions
Supplementary Materials
Author Contributions
Funding
Acknowledgments
Conflicts of Interest
References
- Groves, M.C.E.; Sasonow, A. Uhde EnviNOx® technology for NOX and N2O abatement: A contribution to reducing emissions from nitric acid plants. J. Integr. Environ. Sci. 2010, 7, 211–222. [Google Scholar] [CrossRef]
- Pérez-Ramírez, J.; Kapteijn, F.; Schöffel, K.; Moulijn, J.A. Formation and control of N2O in nitric acid production. Where do we stand today? Appl. Catal. B Environ. 2003, 44, 117–151. [Google Scholar] [CrossRef]
- Sadykov, V.A.; Isupova, L.A.; Zolotarskii, I.A.; Bobrova, L.N.; Noskov, A.S.; Parmon, V.N.; Brushtein, E.A.; Telyatnikova, T.V.; Chernyshev, V.I.; Lunin, V.V. Oxide catalysts for ammonia oxidation in nitric acid production: Properties and perspectives. Appl. Catal. A Chem. 2000, 204, 59–87. [Google Scholar] [CrossRef]
- Pinaeva, L.G.; Prosvirin, I.P.; Dovlitova, L.S.; Danilova, I.G.; Sadovskaya, E.M.; Isupova, L.A. MeOx/Al2O3 and MeOx/CeO2 (Me = Fe, Co, Ni) catalysts for high temperature N2O decomposition and NH3 oxidation. Catal. Sci. Technol. 2016, 6, 2150–2161. [Google Scholar] [CrossRef]
- Pinaeva, L.G.; Dovlitova, L.S.; Isupova, L.A. Monolithic FeOx/Al2O3 Catalysts for Ammonia Oxidation and Nitrous Oxide Decomposition. Kinet. Catal. 2017, 58, 167–178. [Google Scholar] [CrossRef]
- Giecko, G.; Borowiecki, T.; Gac, W.; Kruk, J. Fe2O3/Al2O3 catalysts for the N2O decomposition in the nitric acid industry. Catal. Today 2008, 137, 403–409. [Google Scholar] [CrossRef]
- Kruk, J.; Stołecki, K.; Michalska, K.; Konkol, M.; Kowalik, P. The influence of modifiers on the activity of Fe2O3 catalyst for high temperature N2O decomposition (HT-deN2O). Catal. Today 2012, 191, 125–128. [Google Scholar] [CrossRef]
- Sádovská, G.; Tabor, E.; Bernauer, M.; Sazama, P.; Fíla, V.; Kmječ, T.; Kohout, J.; Závěta, K.; Tokarová, V.; Sobalík, Z. FeOx/Al2O3 catalysts for high-temperature decomposition of N2O under conditions of NH3 oxidation in nitric acid production. Catal. Sci. Technol. 2018, 8, 2841–2852. [Google Scholar] [CrossRef]
- Imagawa, H.; Suda, A.; Yamamura, K.; Sun, S. Monodisperse CeO2 Nanoparticles and Their Oxygen Storage and Release Properties. J. Phys. Chem. C 2011, 115, 1740–1745. [Google Scholar] [CrossRef]
- Chen, L.; Fleming, P.; Morris, V.; Holmes, J.D.; Morris, M.A. Size-Related Lattice Parameter Changes and Surface Defects in Ceria Nanocrystals. J. Phys. Chem. C 2010, 114, 12909–12919. [Google Scholar] [CrossRef]
- Iwanek, E.; Krawczyk, K.; Petryk, J.; Sobczak, J.W.; Kaszkur, Z. Direct nitrous oxide decomposition with CoOx-CeO2 catalysts. Appl. Catal. B Environ. 2011, 106, 416–422. [Google Scholar] [CrossRef]
- Grzybek, G.; Stelmachowski, P.; Gudyka, S.; Indyka, P.; Sojka, Z.; Guillén-Hurtado, N.; Rico-Pérez, V.; Bueno-López, A.; Kotarba, A. Strong dispersion effect of cobalt spinel active phase spread over ceria for catalytic N2O decomposition: The role of the interface periphery. Appl. Catal. B Environ. 2016, 180, 622–629. [Google Scholar] [CrossRef]
- Ferreira, A.P.; Zanchet, D.; Rinaldi, R.; Schuchardt, U.; Damyanova, S.; Bueno, J.M.C. Effect of the CeO2 content on the surface and structural properties of CeO2–Al2O3 mixed oxides prepared by sol–gel method. Appl. Catal. A Chem. 2010, 388, 45–56. [Google Scholar] [CrossRef]
- Damyanova, S.; Perez, C.A.; Schmal, M.; Bueno, J.M.C. Characterization of ceria-coated alumina carrier. Appl. Catal. A Chem. 2002, 234, 271–282. [Google Scholar] [CrossRef]
- Boullosa-Eiras, S.; Vanhaecke, E.; Zhao, T.; Chen, D.; Holmen, A. Raman spectroscopy and X-ray diffraction study of the phase transformation of ZrO2–Al2O3 and CeO2–Al2O3 nanocomposites. Catal. Today 2011, 166, 10–17. [Google Scholar] [CrossRef]
- Ge, C.; Liu, L.; Liu, Z.; Yao, X.; Cao, Y.; Tang, C.; Gao, F.; Dong, L. Improving the dispersion of CeO2 on γ-Al2O3 to enhance the catalytic performances of CuO/CeO2/γ-Al2O3 catalysts for NO removal by CO. Catal. Commun. 2014, 51, 95–99. [Google Scholar] [CrossRef]
- Laguna, O.H.; Romero Sarria, F.; Centeno, M.A.; Odriozola, J.A. Gold supported on metal-doped ceria catalysts (M = Zr, Zn and Fe) for the preferential oxidation of CO (PROX). J. Catal. 2010, 276, 360–370. [Google Scholar] [CrossRef]
- Zhang, Z.; Han, D.; Wei, S.; Zhang, Y. Determination of active site densities and mechanisms for soot combustion with O2 on Fe-doped CeO2 mixed oxides. J. Catal. 2010, 276, 16–23. [Google Scholar] [CrossRef]
- Li, K.; Wang, H.; Wei, Y.; Yan, D. Direct conversion of methane to synthesis gas using lattice oxygen of CeO2–Fe2O3 complex oxides. Chem. Eng. J. 2010, 156, 512–518. [Google Scholar] [CrossRef]
- Gupta, A.; Kumar, A.; Waghmare, U.V.; Hegde, M.S. Origin of activation of Lattice Oxygen and Synergistic Interaction in Bimetal-Ionic Ce0.89Fe0.1Pd0.01O2−δ Catalyst. Chem. Mater. 2009, 21, 4880–4891. [Google Scholar] [CrossRef]
- Escribano, V.S.; Amores, J.M.G.; Finocchio, E.; Daturi, M.; Busca, G. Characterization of α-(Fe,Al)2O3 solid-solution powders. J. Mater. Chem. 1995, 5, 1943–1951. [Google Scholar] [CrossRef]
- McBride, J.R.; Hass, K.C.; Poindexter, B.D.; Weber, W.H. Raman and x-ray studies of Ce1−xREXO2−y where RE=La, Pr, Nd, Eu, Gd, and Tb. J. Appl. Phys. 1994, 76, 2435–2441. [Google Scholar] [CrossRef]
- Kosacki, I.; Suzuki, T.; Anderson, H.U.; Colomban, P. Raman scattering and lattice defects in nanocrystalline CeO2 thin films. Solid State Ion. 2002, 149, 99–105. [Google Scholar] [CrossRef]
- Spanier, J.E.; Robinson, R.D.; Zhang, F.; Chan, S.W.; Herman, I.P. Size-dependent properties of CeO2−y nanoparticles as studied by Raman scattering. Phys. Rev. B 2001, 64, 245407. [Google Scholar] [CrossRef]
- Tsunekawa, S.; Ishikawa, K.; Li, Z.Q.; Kawazoe, Y.; Kasuya, Y. Origin of Anomalous Lattice Expansion in Oxide Nanoparticles. Phys. Rev. Lett. 2000, 85, 3440–3443. [Google Scholar] [CrossRef] [PubMed]
- Ojha, A.K.; Ponnilavan, V.; Kannan, S. Structural, morphological and mechanical investigations of in situ synthesized c-CeO2/α-Al2O3 composites. Ceram. Int. 2017, 43, 686–692. [Google Scholar] [CrossRef]
- Porto, S.P.S.; Krishnan, R.S. Raman Effect of Corundum. J. Chem. Phys. 1967, 47, 1009–1012. [Google Scholar] [CrossRef]
- Sudarsanama, P.; Malleshama, B.; Reddy, P.S.; Großmann, D.; Grünert, W.; Reddy, B.M. Nano-Au/CeO2 catalysts for CO oxidation: Influence of dopants (Fe, La and Zr) on the physicochemical properties and catalytic activity. Appl. Catal. B Environ. 2014, 144, 900–908. [Google Scholar] [CrossRef]
- Schilling, C.; Hofmann, A.; Hess, C.; Ganduglia-Pirovano, M.V. Raman Spectra of Polycrystalline CeO2: A Density Functional Theory Study. J. Phys. Chem. C 2017, 121, 20834–20849. [Google Scholar] [CrossRef]
- Reina, T.R.; Ivanova, S.; Centeno, M.A.; Odriozola, J.A. Boosting the activity of a Au/CeO2/Al2O3 catalyst for the WGS reaction. Catal. Today 2015, 253, 149–154. [Google Scholar] [CrossRef] [Green Version]
- Laguna, O.H.; Centeno, M.A.; Boutonnet, M.; Odriozola, J.A. Fe-doped ceria solids synthesized by the microemulsion method for CO oxidation reactions. Appl. Catal. B Environ. 2011, 106, 621–629. [Google Scholar] [CrossRef]
- Perez-Alonso, F.J.; Melián-Cabrera, I.; López Granados, M.; Kapteijn, F.; Fierro, J.L.G. Synergy of FexCe1−xO2 mixed oxides for N2O decomposition. J. Catal. 2006, 239, 340–346. [Google Scholar] [CrossRef]
- Suzuki, S.; Yanagihara, K.; Hirokawa, K. XPS study of oxides formed on the surface of high-purity iron exposed to air. Surf. Interface Anal. 2000, 30, 372–376. [Google Scholar] [CrossRef]
- Grosvenor, A.P.; Kobe, B.A.; Biesinger, M.C.; McIntyre, N.S. Investigation of multiplet splitting of Fe 2p XPS spectra and bonding in iron compounds. Surf. Interface Anal. 2004, 36, 1564–1574. [Google Scholar] [CrossRef]
- Atuchin, V.V.; Vinnik, D.A.; Gavrilova, T.A.; Gudkova, S.A.; Isaenko, L.I.; Jiang, X.; Pokrovsky, L.D.; Prosvirin, I.P.; Mashkovtseva, L.S.; Lin, Z. Flux Crystal Growth and the Electronic Structure of BaFe12O19 Hexaferrite. J. Phys. Chem. C 2016, 120, 5114–5123. [Google Scholar] [CrossRef]
- Yamashita, T.; Hayes, P. Analysis of XPS spectra of Fe2+ and Fe3+ ions in oxide materials. Appl. Surf. Sci. 2008, 254, 2441–2449. [Google Scholar] [CrossRef]
- Merte, L.R.; Gustafson, J.; Shipilin, M.; Zhang, C.; Lundgren, E. Redox behavior of iron at the surface of an Fe0.01Mg0.99O(100) single crystal studied by ambient-pressure photoelectron spectroscopy. Catal. Struct. React. 2017, 3, 95–103. [Google Scholar]
- Sayed, F.N.; Polshettiwar, V. Facile and sustainable synthesis of shaped iron oxide nanoparticles: Effect of iron precursor salts on the shapes of iron oxides. Sci. Rep. 2015, 5, 09733. [Google Scholar] [CrossRef]
- Kapteijn, F.; Rodriguez-Mirasol, J.; Moulijn, J. Heterogeneous catalytic decomposition of nitrous oxide. Appl. Catal. B Environ. 1996, 9, 25–64. [Google Scholar] [CrossRef]
- Ivanov, D.V.; Pinaeva, L.G.; Sadovskaya, E.M.; Isupova, L.A. Isotopic transient kinetic study of N2O decomposition on LaMnO3+δ. J. Mol. Catal. A Chem. 2016, 412, 34–38. [Google Scholar] [CrossRef]
- Malakhov, V.; Boldyreva, N.; Vlasov, A.; Dovlitova, L. Methodology and procedure of the stoichiographic analysis of solid inorganic substances and materials. J. Analyt. Chem. 2011, 66, 458–464. [Google Scholar] [CrossRef]


| Sample | SBET (m2g−1) | Phase Composition (Lattice Parameters) | DXRD (nm) |
|---|---|---|---|
| Ce/Al | 63 | CeO2 (a = b = c = 5.411 Å) (θ + γ)-Al2O3 | 40 - |
| 3.8 Fe/Ce/Al | 50 | CeO2 (a = b = c = 5.411 Å) (θ + γ)-Al2O3 | 41 - |
| 9.9 Fe/Ce/Al | 35 | CeO2 (a = b = c = 5.411 Å) (θ + γ)-Al2O3 α-Fe2O3 (a = b = 5.035 Å, c = 13.741 Å) | 46 - 32 |
| (Ce + Al) | 94 | CeO2 (a = b = c = 5.411 Å) (θ + γ)-Al2O3 | 11 tr. |
| 2.5 Fe/(Ce + Al) | 70 | CeO2 (a = b = c = 5.411 Å) (θ + γ)-Al2O3 | 12 tr. |
| 6.6 Fe/(Ce + Al) | 58 | CeO2 (a = b = c = 5.411 Å) (θ + γ)-Al2O3 α-Fe2O3 (a = b = 5.035Å, c = 13.741 Å) | 14 tr. 39 |
| Sample | Ce + Al | 2.5 Fe/(Ce + Al) | 3.8 Fe/Ce/Al |
|---|---|---|---|
| HCl | Al/1.15 | Fe/0.06 Fe0.05Al/1.30 Fe0.05Ce0.26Al/0.65 | Fe/0.07 Fe0.29Al/0.37 Fe0.19Ce/0.12 |
| Ce0.05Al/0.67 | |||
| HF | Ce0.05Al/7.92 Al/0.45 Ce/0.069 | Fe0.05Ce0.26Al/2.62 Fe0.03Ce0.09Al/8.14 Fe0.02Ce/0.80 | Fe/0.03 Fe0.08Ce0.2Al/2.93 Fe0.04Al/7.47 |
| Insoluble Ce | 2.4 | 0.7 | 2.0 |
| Sample | Position, cm−1 | FWHM, cm−1 | Integral Intensity, arb.unit | |||
|---|---|---|---|---|---|---|
| FT-Raman | Raman | FT-Raman | Raman | FT-Raman | Raman | |
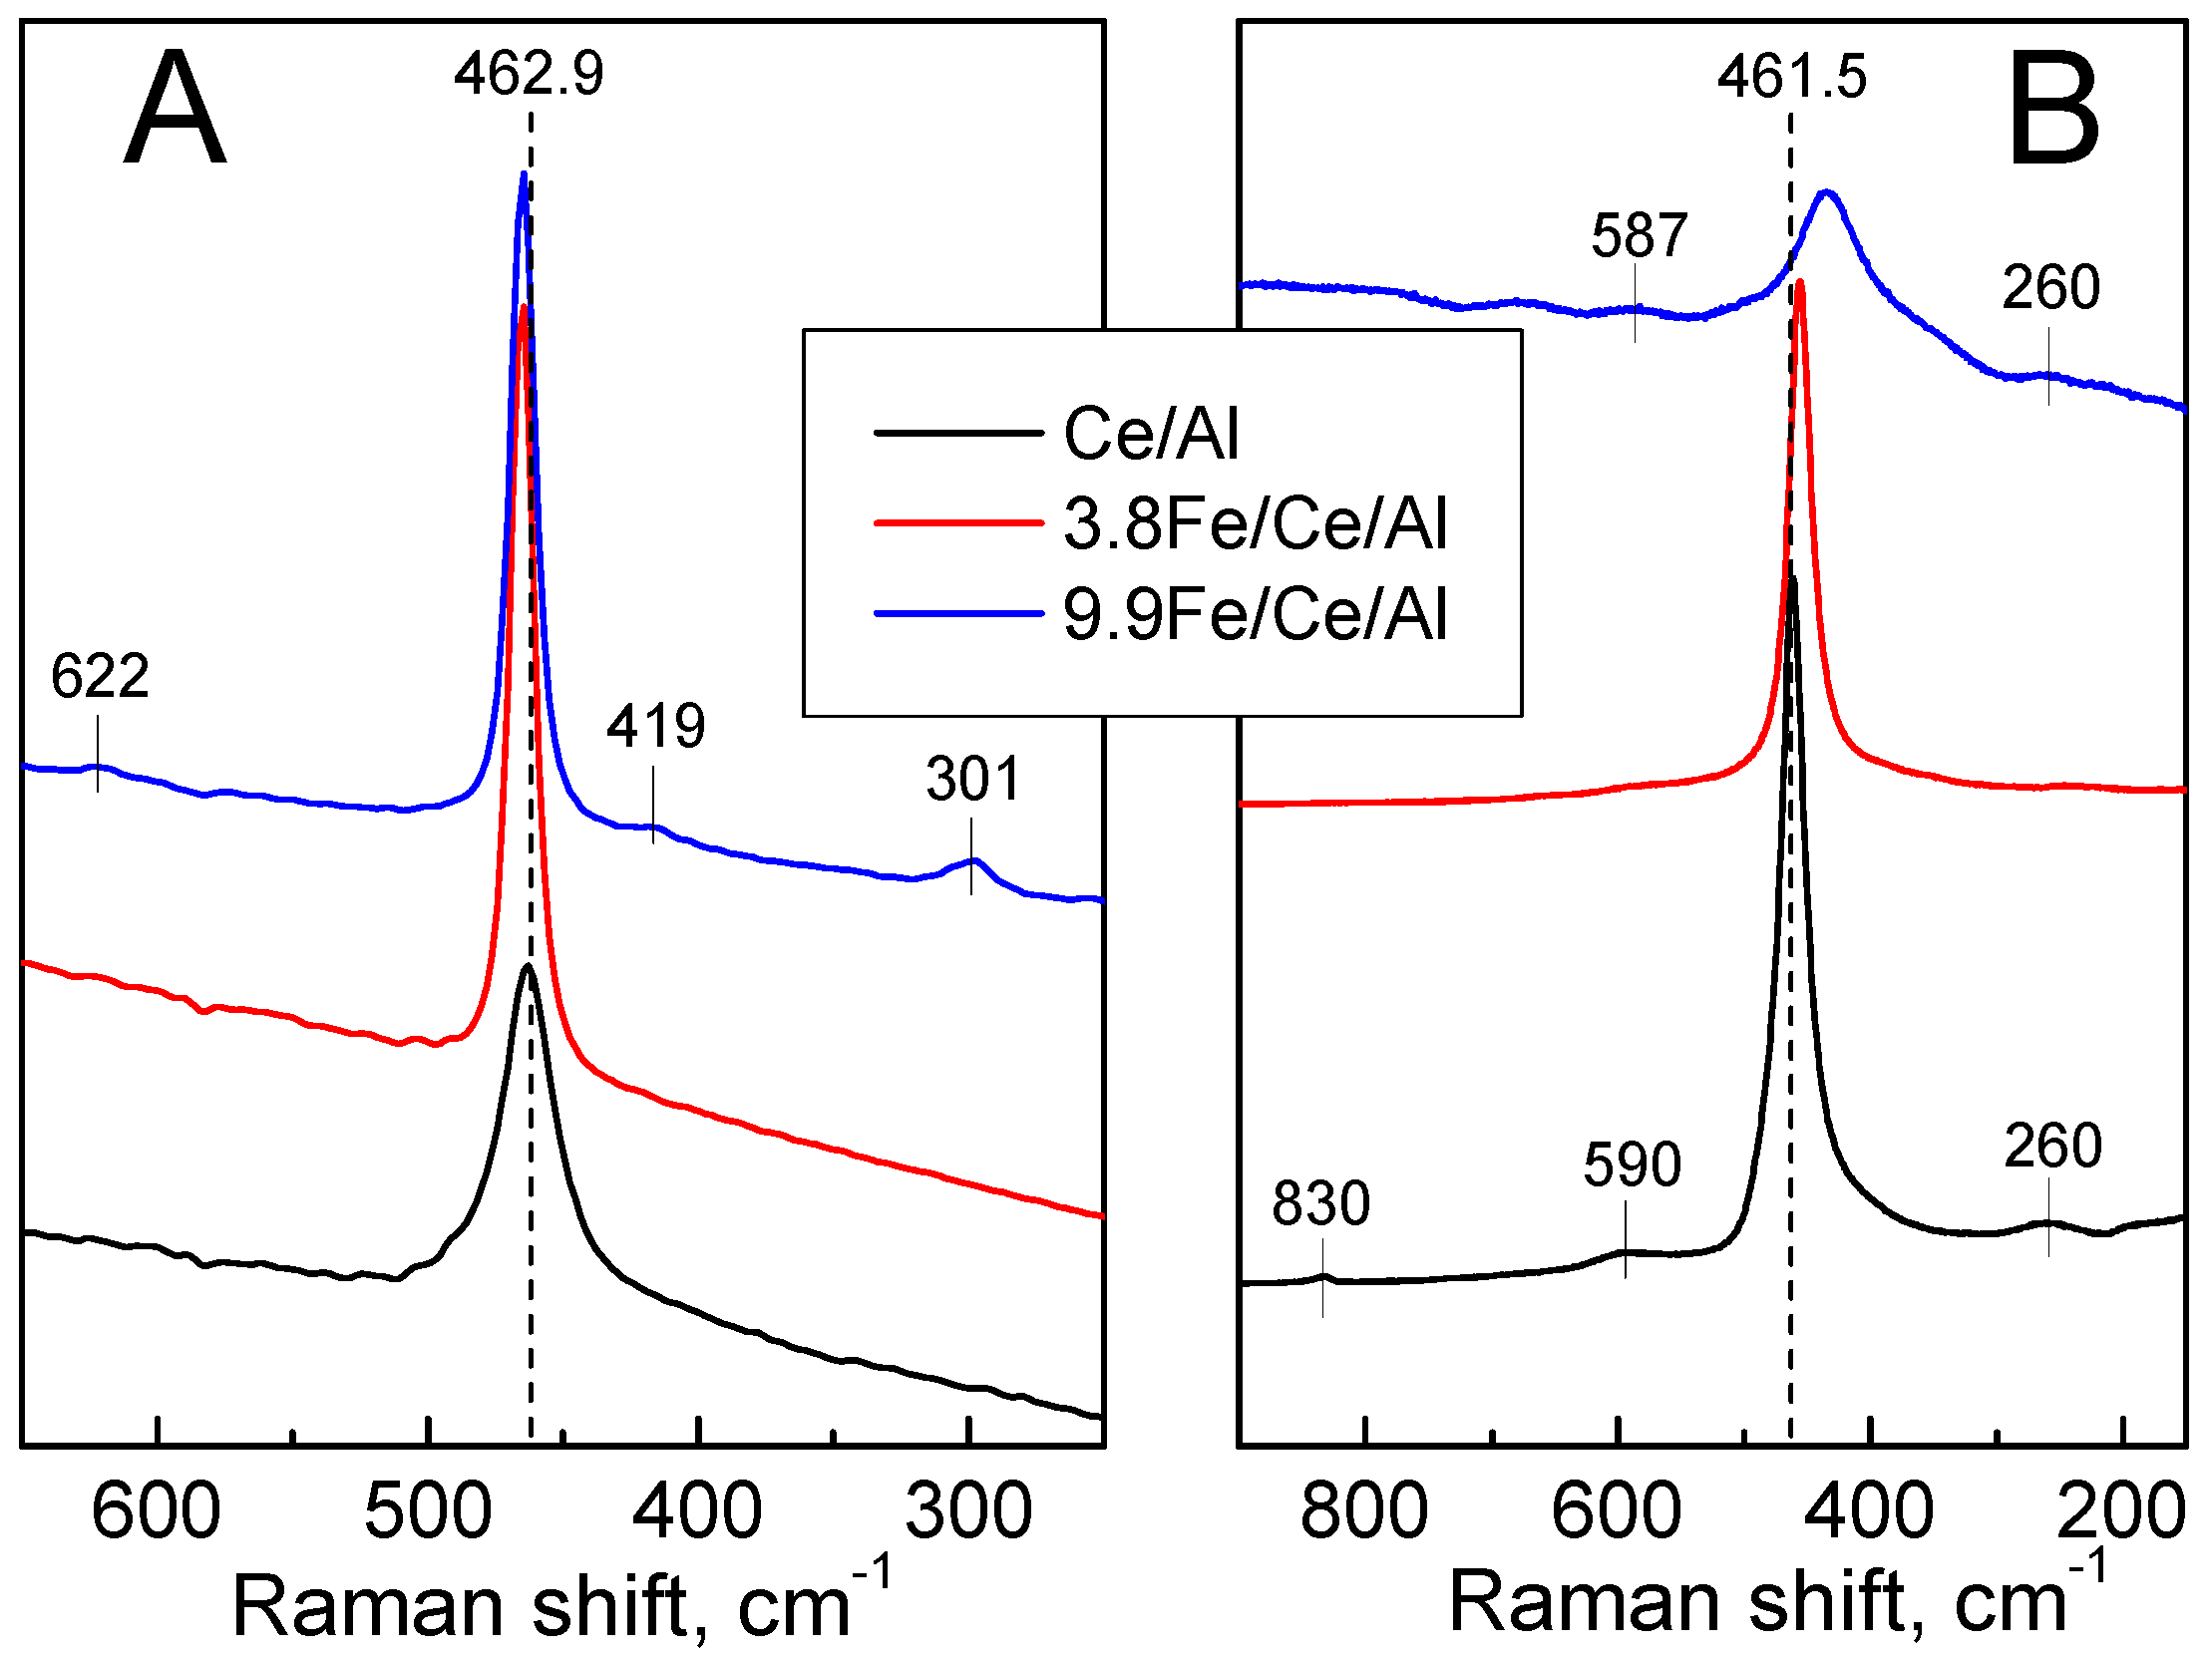
| Ce/Al | 462.9 | 461.5 | 24.5 | 21.2 | 0.101 | 30399 |
| 3.8 Fe/Ce/Al | 465.1 | 455.8 | 10.6 | 21.8 | 0.087 | 27805 |
| 9.9 Fe/Ce/Al | 464.9 | 433.0 | 10.8 | 66.3 | 0.079 | 26155 |
| Ce + Al | 464.1 | 462.7 | 18.3 | 17.0 | 0.219 | 266717 |
| 2.5 Fe/(Ce + Al) | 464.0 | 455.8 | 17.3 | 23.4 | 0.0895 | 34159 |
| 6.6 Fe/(Ce + Al) | 464.0 | 459.6 | 16.3 | 20.0 | 0.0327 | 19715 |
| Sample | Ce3+, % of Total | Ces, a at. % | Ceexp, rel.units b | Ce/Al | Fes a at. % a | Feexp, rel.units b |
|---|---|---|---|---|---|---|
| 3.8 Fe/Ce/Al | 25 | 3.7 | 184 | 0.12 | 1.6 | 80 |
| 2.5 Fe/(Ce + Al) | 31 | 2.4 | 171 | 0.075 | 1.7 | 117 |
| 6.6 Fe/(Ce + Al) | 33 | 2.7 | 159 | 0.096 | 2.7 | 166 |
Publisher’s Note: MDPI stays neutral with regard to jurisdictional claims in published maps and institutional affiliations. |
© 2022 by the authors. Licensee MDPI, Basel, Switzerland. This article is an open access article distributed under the terms and conditions of the Creative Commons Attribution (CC BY) license (https://creativecommons.org/licenses/by/4.0/).
Share and Cite
Pinaeva, L.; Prosvirin, I.; Chesalov, Y.; Atuchin, V. High-Temperature Abatement of N2O over FeOx/CeO2-Al2O3 Catalysts: The Effects of Oxygen Mobility. Catalysts 2022, 12, 938. https://doi.org/10.3390/catal12090938
Pinaeva L, Prosvirin I, Chesalov Y, Atuchin V. High-Temperature Abatement of N2O over FeOx/CeO2-Al2O3 Catalysts: The Effects of Oxygen Mobility. Catalysts. 2022; 12(9):938. https://doi.org/10.3390/catal12090938
Chicago/Turabian StylePinaeva, Larisa, Igor Prosvirin, Yuriy Chesalov, and Victor Atuchin. 2022. "High-Temperature Abatement of N2O over FeOx/CeO2-Al2O3 Catalysts: The Effects of Oxygen Mobility" Catalysts 12, no. 9: 938. https://doi.org/10.3390/catal12090938