Article

Chemical Composition of the Surface and Subsurface of Pt–Pd–Rh–Ru Catalytic Gauzes Used in the NH3 Oxidation with Air at 1133 K

Boreskov Institute of Catalysis SB RAS, 630090 Novosibirsk, Russia
*
Author to whom correspondence should be addressed.
Catalysts 2022, 12(9), 930; https://doi.org/10.3390/catal12090930
Submission received: 20 July 2022 / Revised: 11 August 2022 / Accepted: 17 August 2022 / Published: 23 August 2022
(This article belongs to the Section Catalytic Materials)

Abstract

:
High-temperature oxidation of NH3 on Pt alloy gauzes to NO is widely employed in industry for the production of HNO3, which is used to obtain agricultural fertilizers. Particular attention is paid now to the investigation of the chemical composition of gauzes used in NH3 oxidation. X-ray photoelectron and energy-dispersive X-ray spectroscopies with the depth of analysis ca. 5 nm and ca. 500 nm were applied to investigate the chemical composition of surface and subsurface layers of the new and used in NH3 oxidation with air at T = 1133 K Pt–Pd–Rh–Ru catalytic gauzes (81, 15, 3.5, 0.5 wt.%, respectively). For all the gauzes, adsorption (OHad, COad), graphitic (Cgr) and oxide (Rh2O3) films were found on the surface of the metallic alloy. Under these films, Cab, Nab and Oab atoms absorbed in the subsurface layers were detected on the gauzes used in NH3 oxidation. The obtained data testify to the penetration of Oab and Nab atoms into deeper layers of the alloy during etching with elevation of the catalyst temperature. Oab atoms were accumulated predominantly on dislocations, etch pits and grain boundaries, whereas Nab atoms intercalated mostly into interstitial sites of the alloy lattice.

Graphical Abstract

1. Introduction

High-temperature oxidation of ammonia with air oxygen to nitric oxide on platinum alloy gauzes with the predominant platinum content is applied in the industrial production of nitric acid [1,2,3]. The annual world production of HNO3 is 70–80 million tons. Approximately 80% of the produced acid is employed to obtain mineral fertilizers for agriculture. The other part of HNO3 is used for various purposes, particularly for the production of explosives. Metallic platinum is highly active and selective toward the oxidation of NH3 with oxygen to NO at temperatures 873–1273 K and reagent pressures 1–12 bar. Platinum has suitable mechanical characteristics for operation as gauzes (strength, plasticity, etc.); however, such gauzes lose mechanical strength quite rapidly and are destroyed at high temperatures under the action of reaction mixtures [1,2,3]. This leads to losses of the expensive metal and decreases the NO yield; as a result, a search for Pt alloys with other metals was initiated in order to develop active catalysts that would be more stable in the reaction mixture than neat Pt. To this end, various alloys based on platinum as well as other metals and their compounds have been tested [1,2,3].
Activity and performance of the catalytic gauzes used for NH3 oxidation are facilitated by the addition of Rh, Pd and Ru to platinum [3,4]. The addition of up to 5–10 wt.% Rh to Pt enhances the NO yield at 1073–1173 K by 3.0–5.0% as compared to neat Pt (ca. 94%) [4]. In addition, the introduction of Rh into platinum significantly decreases catalyst losses and increases mechanical strength and operation time of the gauzes. After adding up to 1 wt.% Ru or ca. 7 wt.% Rh or Pd to Pt, the ultimate strength of the alloy increases approximately twofold as compared to neat platinum [3]. Considering the high catalytic activity and mechanical strength of such alloys, a Pt–Pd–Rh–Ru alloy with the composition 81.0, 15.0, 3.5, 0.5 wt.% (used in this work) was developed for the industrial oxidation of NH3 in Russia. At 1273 K, the alloy has a high ultimate strength with a relative elongation equal to 15–20% and a small (ca. 37 nm) grain size, indicating high plasticity and mechanical strength of the alloy at elevated temperatures [3]. It should also be noted that a relatively high content of Pd (15 wt.%) in the alloy will promote the additional trapping of PtO2(gas) in the lower layers of the gauze pack, which is entrained from the upper gauzes during the oxidation of NH3. This will decrease Pt losses and increase the activity of gauzes in the lower part of the pack.
The oxidation of NH3 is accompanied by profound structural rearrangement of the surface layer of catalytic gauzes leading to the formation of a rough layer (catalytic etching) [1,2,3]. According to scanning electron microscopy (SEM) data [5,6,7,8,9,10], during the catalytic etching, a surface layer comprising etch pits, facets, crystals and large “cauliflower” agglomerates is formed on the surface of neat metals (Pt, Rh, Pd, Ag, Ir, Au) and their alloys under laboratory conditions [5,6,7] and also after the operation of Pt–Rh gauzes in industrial reactors [8,9,10]. In [5,6,7], investigation of the morphology of spent catalysts consisting of Pt, Rh, Pd, Ag, Ir and Au neat metals and Pt–Rh, Pt–Ir and Pd–Ni alloys revealed a strong effect of the catalyst composition on its etching. The effect of the Rh concentration on the etching process during NH3 oxidation on Pt–Rh alloys was attributed by the authors of [6] to the formation of local Rh domains on the Pt surface. The oxidation of NH3 with oxygen proceeds on Rh with a higher intensity than on Pt; thus, on Rh domains, the temperature may be higher than on Pt around the domains. At low Rh concentrations in the alloy (5–13 wt.% Rh), Rh domains are separated from each other by platinum. Thus, the intense oxidation of NH3 on Rh, as compared to ambient Pt, may give rise to the “hotspot” sites leading to the formation of temperature gradients. Such gradients may result in etching by the “chemical-vapor-transport” (CVT) mechanism. As the Rh concentration in the alloy increases (>13 wt.% Rh), Rh domains can merge; as a result, “hotspot” sites and temperature gradients do not emerge. Therefore, the mass transfer by the CVT mechanism and etching are less pronounced than at low Rh concentrations.
In [8,9,10], an X-ray photoelectron spectroscopy (XPS) study detected an increased surface concentration of Rh in comparison with the bulk one, and Rh2O3 oxide on Pt–Rh gauzes used in the industrial oxidation of NH3. On the Pt/5(10) wt.% Rh gauzes operated in the NH3 oxidation with air oxygen at 1023–1193 K for 70–218 days, the surface concentration of Rh and the Rh/Pt ratio grew substantially with increasing gauze temperature and reaction mixture pressure [8]. At the reactor pressure of 1.0, 3.5–4.9 and 8.5 bar, the measured Rh/Pt (at.%) values were equal to 0.25, 1.0 and 2.2, respectively. The obtained values substantially exceed the Rh/Pt values (at.%) of 0.1 and 0.2 corresponding to 5.0 and 10.0 wt.% concentrations of Rh uniformly distributed in the Pt–Rh alloy. After the oxidation of NH3 at 1123 and 1223 K for 100 days, the ratio of average surface concentrations Rh/Pt (at.%) in the gauze pack was equal to 1.8 and 10.0, respectively. At low (ca. 1 bar) and medium (3.5–4.9 bar) pressures, Pt and Rh in the metallic state were detected on the catalyst surface; a decrease in activity was attributed to an increased surface concentration of Rh. At high pressures (ca. 8.5 bar), Rh2O3 oxide was detected on the catalyst surface. Spent NH3 gauzes in the pack had different characteristics [8,9]. After NH3 oxidation at P = 4.3 bar and T = 1153 K for 87 days, decreases in the Rh/Pt (at.%) values were observed for gauzes 1, 4 and 8 in the pack (along the gas flow) of 0.82, 0.46 and 0.4, respectively [8]. After the operation of a pack comprising 36 Pt–10 wt.% Rh gauzes in NH3 oxidation for several weeks, “cauliflower” structures were detected on the frontal side of the second gauze, and Rh2O3 oxide crystals on its back side [9]. The crystals were observed on all the gauzes; however, their maximum amount was found at the center of the pack on gauze 16. For gauzes 2, 16, 31 and 36 in this pack, a non-uniform distribution of the Rh/Pt (at.%) ratio was revealed, namely, 0.38, 2.1, 0.67 and 0.53, respectively. The greatest enrichment with rhodium was observed at the center of the pack on gauze 16.
The composition of fresh Pt–Rh and Pt–Pd–Rh gauzes and those used in NH3 oxidation change when surface layers of the catalyst are removed by bombardment with Ar+ ions [10,11]. For the fresh Pt/10 wt.% Rh gauze, the Rh3d3/2/Pt4f7/2 ratio of XPS peaks decreased from ca. 0.2 on the surface to ca. 0.1 at a depth of 10 nm, corresponding to the bulk content of the alloy [10]. After the operation of this gauze in an industrial reactor at T = 1163 K, P = 3.5 bar and 10% NH3 for 2.5 months, the Rh3d3/2/Pt4f7/2 value on the surface was ca. 0.4 and gradually decreased to ca. 0.1 at a depth of ca. 1 µm. On the wire surface, an Rh2O3 oxide film with a thickness below 2 nm was found; it might form upon cooling the gauzes after termination of the process. A decreased concentration of Pt in the subsurface layer was attributed to the formation and entrainment of PtO2 volatile oxide. For 20 gauzes with the composition (wt.%) Pt (92.5)–Pd (4.0)–Rh (3.5) and Pt (93.0)–Rh (7.0), after treatment in different media and NH3 oxidation, Auger electron spectroscopy (AES) revealed changes in the chemical composition from the surface to a depth up to 12 nm [11]. For all the gauzes, the concentrations decreased for C and O and increased for Pt, Pd and Rh from the surface to the depth; the most pronounced changes were observed for C and Pt from the surface to a depth of 4 nm, and then minor changes occurred up to 12 nm. A comparison of C and O concentration profiles for the gauzes pretreated by different reagents with the profiles of gauzes used in NH3 oxidation showed a substantial increase in the C concentration and only a slight change in the O content after NH3 oxidation.
In [12,13,14], investigation of the surface composition and structure of model catalysts in the oxidation of NH3 with oxygen over a wide range of pressures and temperatures revealed a considerable effect of reagent pressure and catalyst temperature on the composition of adsorbed surface layer and NH3 oxidation. During the oxidation of NH3, the surface and gas phase composition was studied under a high vacuum (10−10–10−8 mbar) on a stepped Pt(S)-12(111) × (111) surface [12] at a pressure of 10−4 and 1.0 mbar on Pt(533) [13], and at PNH3 = 3.5 mbar in the Po2 range from 0 to 20 mbar on Pt25Rh75(001) [14]. Upon temperature elevation from 300 to 1000 K, a predominant release of N2 to the gas phase was observed at T ≤ 600–700 K, while at T ≥ 600–700 K, mostly the NO oxide was released [12,13,14]. According to AES data [12], at low temperatures the Pt(S)-12(111) × (111) surface contained mostly the adsorbed Nads and NHx(ads), whereas at high temperatures it contained predominantly the Oads atoms. The authors of [12] think that at T ≤ 700 K, N2 molecules are formed in the course of the reaction between O2(gas) and Nads, while at T ≥ 700 K, NO are produced by the reaction of NH3(gas) with Oads. Investigation of the chemical composition of the Pt(533) surface in an O2/NH3 atmosphere by in situ XPS using synchrotron radiation showed that at temperatures ≤ 500 K, the adsorbed surface layer comprised nitrogen-containing fragments NC, Nad, NHx (x = 1–2) and NH3, and Oads, Cads atoms and Oox atoms associated with SiO2 oxide impurities [13]. At T~500 K, a sharp decrease in the concentrations of all the adsorbed states was observed, while at T > 600 K, only minor concentrations of Nad and NC were detected. It should be noted that NOads and OHads were not observed, and the formation of Pt oxides was not detected under the indicated conditions. An operando study on the structure and surface composition of the Pt25Rh75(001) catalyst using near-ambient pressure X-ray photoemission spectroscopy (NAP-XPS) and surface X-ray diffraction (SXRD) demonstrated that upon NH3 oxidation at a low temperature (ca. 450 K), the catalyst surface was in the metallic state and was covered with Nads atoms, while at a high temperature (ca. 650 K), the catalyst contained the RhO2 surface oxide layer [14]. Note that the surface composition of model catalysts was examined at low pressures and temperatures (≤20 mbar and ≤1000 K) [12,13,14] as compared to NH3 oxidation in industrial reactors (P~1–12 bar and T~873–1273 K) [1,2,3].
Particular attention is paid now to the development of efficient catalysts for the industrial high-temperature oxidation of NH3 to NO, which are represented by a pack of gauzes made mostly of Pt–Rh or Pt–Pd–Rh alloys with a predominant Pt content [15,16,17]. The catalyst efficiency can be enhanced by decreasing the content of expensive platinum metals in the catalyst, lowering the losses of metals during NH3 oxidation and extending the operation time of the pack at a high NO yield (90–97%) over the entire service time of the gauze pack [15]. To solve such problems, it is very important to obtain reliable quantitative data on the composition of surface and subsurface layers of catalytic gauzes used in the oxidation of NH3. The literature data on the surface composition of such gauzes deal mostly with the content of metals. The oxide and adsorption surface films formed in air on the gauzes used in NH3 oxidation strongly affect the quantitative data concerning the content of metals and other elements on the catalyst surface. Data on the chemical composition and structure of the catalyst surface upon oxidation of NH3 are reported only in a few works. It should be noted also that the reported data were obtained at lower temperatures and pressures of reagents as compared to the conditions in industrial reactors and describe mostly the surface composition of model catalysts. This limits the possibility to elucidate the effect exerted by the chemical composition of catalyst on the etching process. In addition, the literature does not provide quantitative data on the surface and subsurface composition of the etched layer on catalytic gauzes, which also makes it difficult to reveal the mechanism of catalytic etching initiated by the oxidation of NH3.
Our earlier publications [18,19,20,21,22] describe mostly the results of studying the morphology and microstructure of the rough surface layer, which is formed upon catalytic etching of the Pt–Pd–Rh–Ru gauze during NH3 oxidation. In this paper, we report data on the chemical composition of surface and subsurface layers on the fresh Pt–Pd–Rh–Ru gauze and also on the back and frontal sides of such gauze after the oxidation of NH3 with air at T = 1133 K. The study aimed to obtain new reliable quantitative data on the content of both the metals and C, N, O on the surface and in subsurface layers of the catalyst. The obtained data on the composition of the etched layer of the Pt–Pd–Rh–Ru gauze can be used to estimate the chemical composition of surface and subsurface layers of the catalyst during the oxidation of NH3 with air oxygen, which will allow us to comprehensively analyze the process of catalytic etching initiated by the oxidation of NH3.

2. Results

2.1. Surface Morphology of Pt–Pd–Rh–Ru Gauzes Used in the Oxidation of NH3

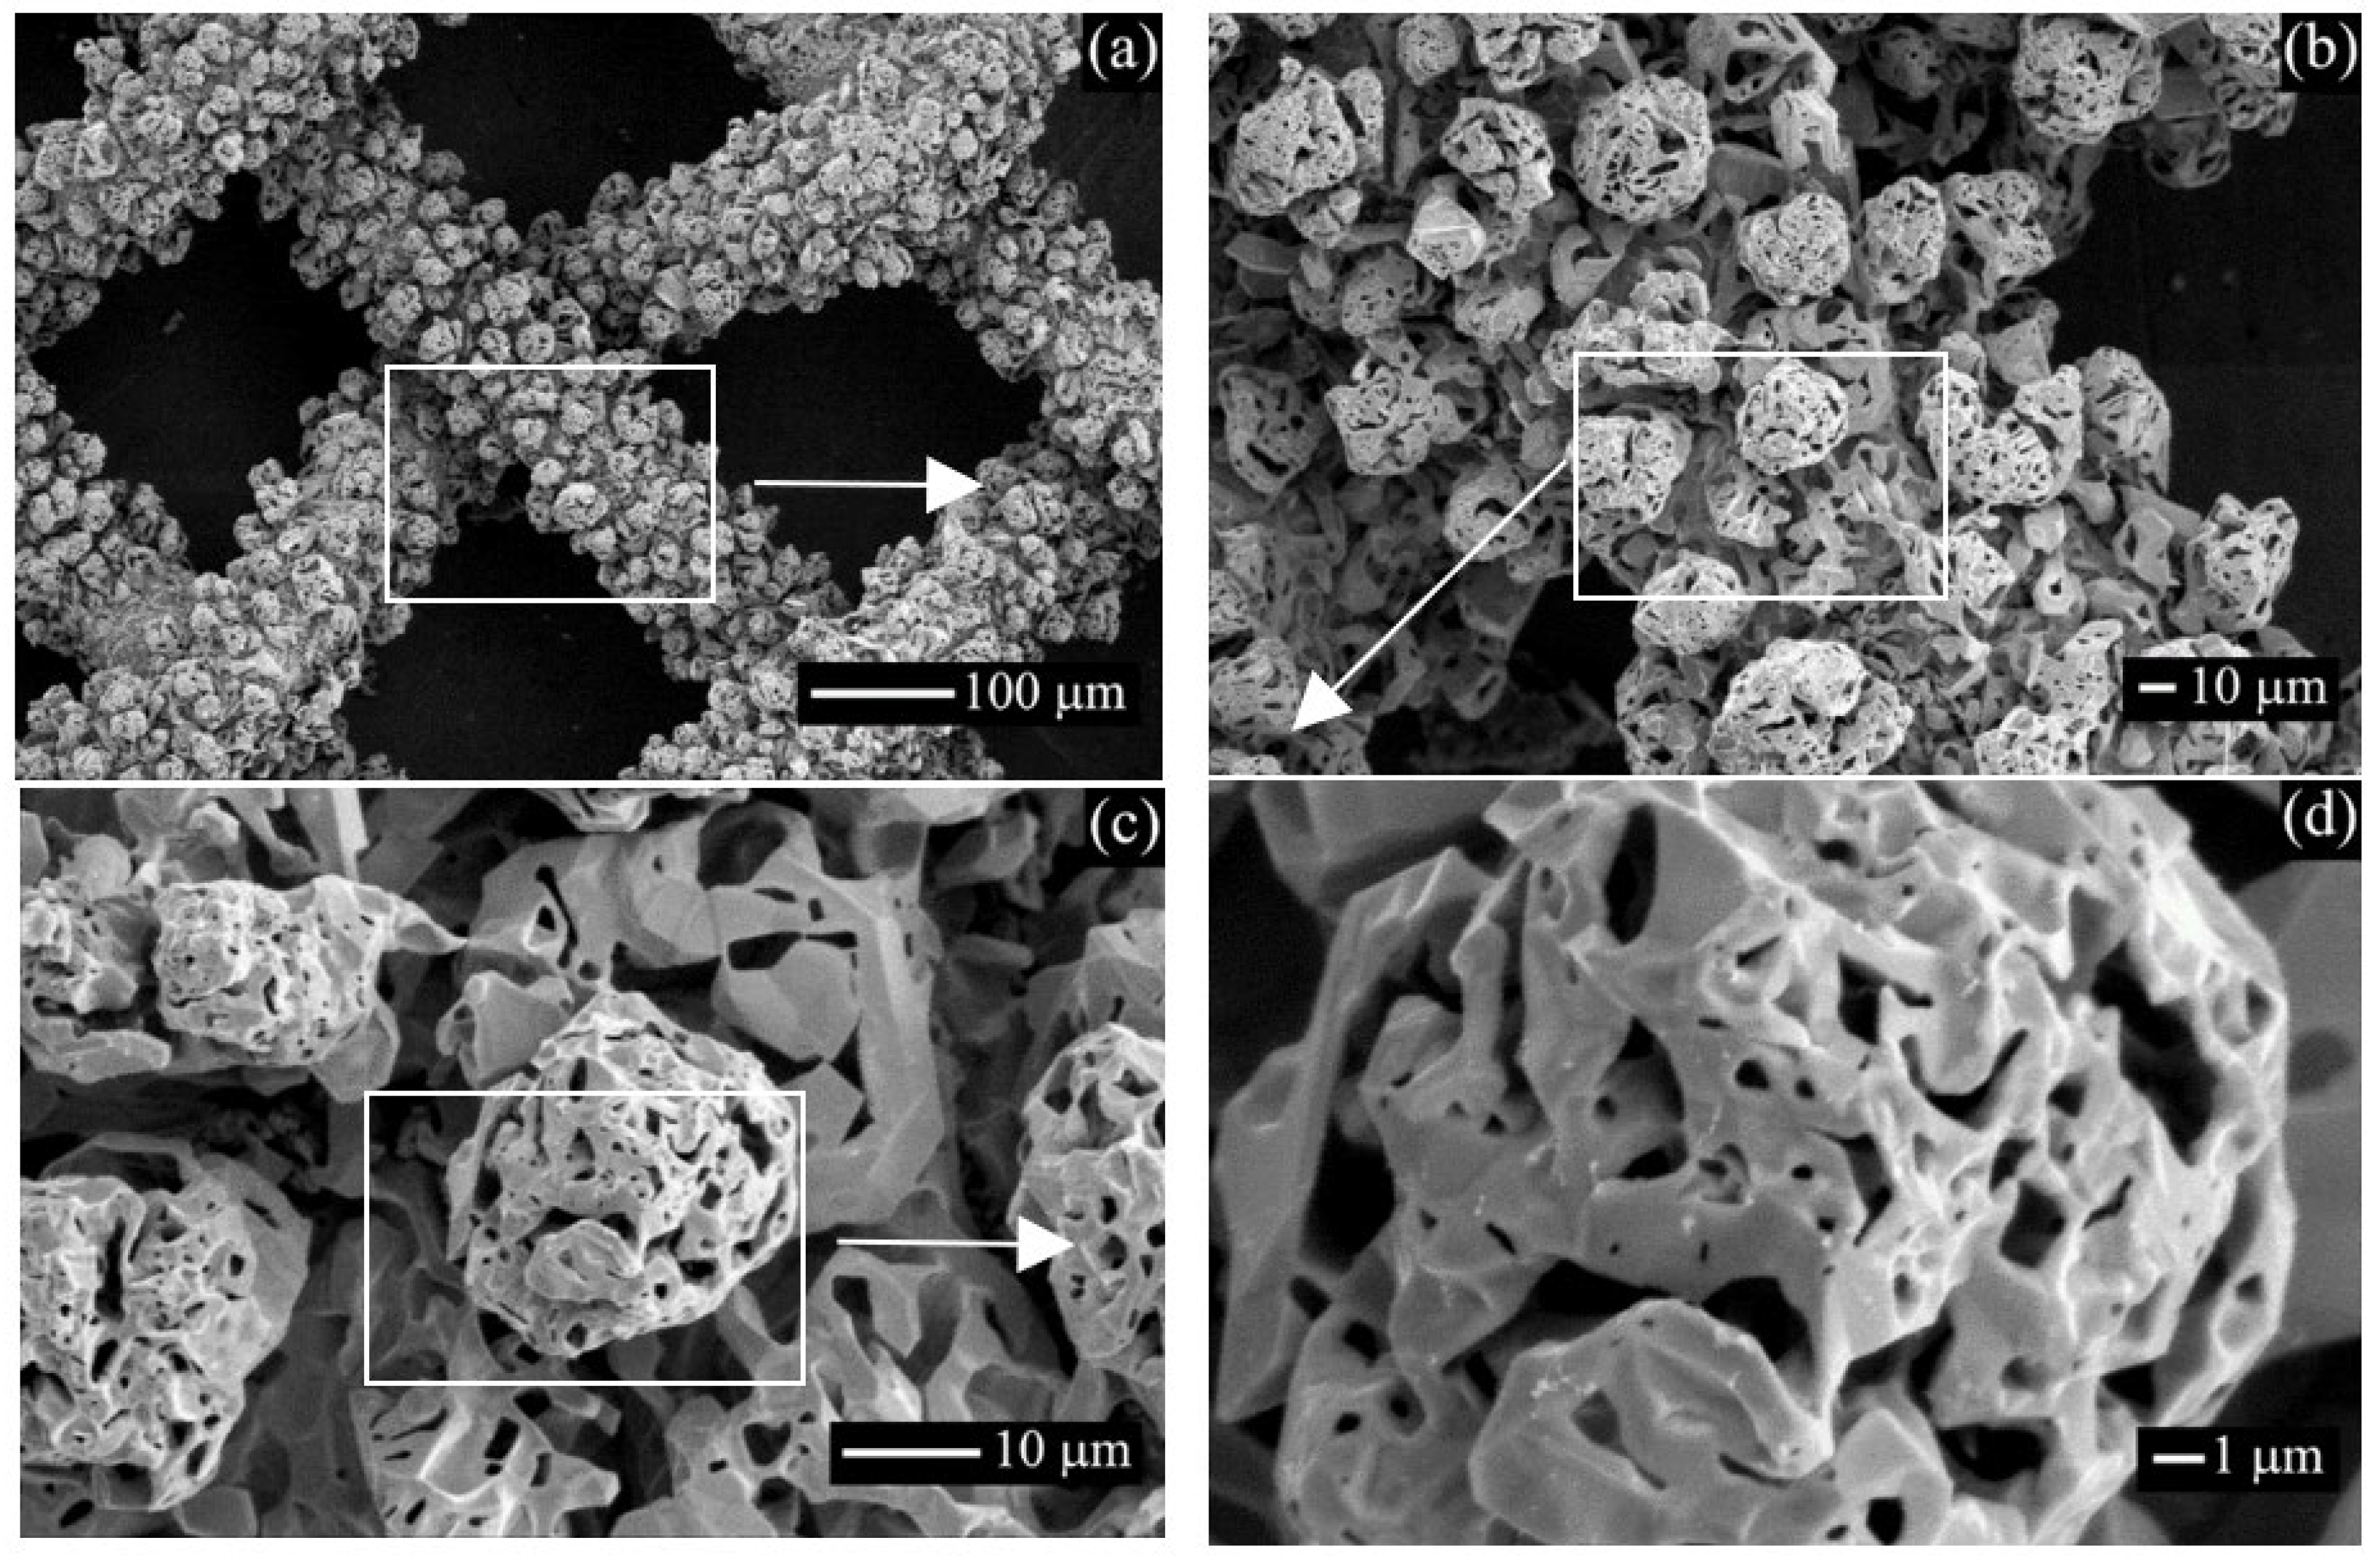
Figure 1 displays SEM images of a fragment of the Pt–Pd–Rh–Ru gauze and wire surface after NH3 oxidation in an industrial reactor at ca. 1173 K and ca. 7.0 bar for 3000 h. One can see that the gauze is covered with a continuous etched layer of porous crystal agglomerates (“cauliflowers”) with the size of ca. 25–50 µm (Figure 1a,b). The “cauliflowers” have a porous structure with a pore sizes of 0.1–2.0 µm (Figure 1c,d). Porous crystal structures of different shape and size are detected between “cauliflowers” (Figure 1b,c). Images in Figure 1 indicate a strong catalytic etching initiated by the oxidation of NH3. Such “cauliflowers” were also detected on the surface of Pt–Rh gauzes after the oxidation of NH3 in industrial reactors [8,9,10].
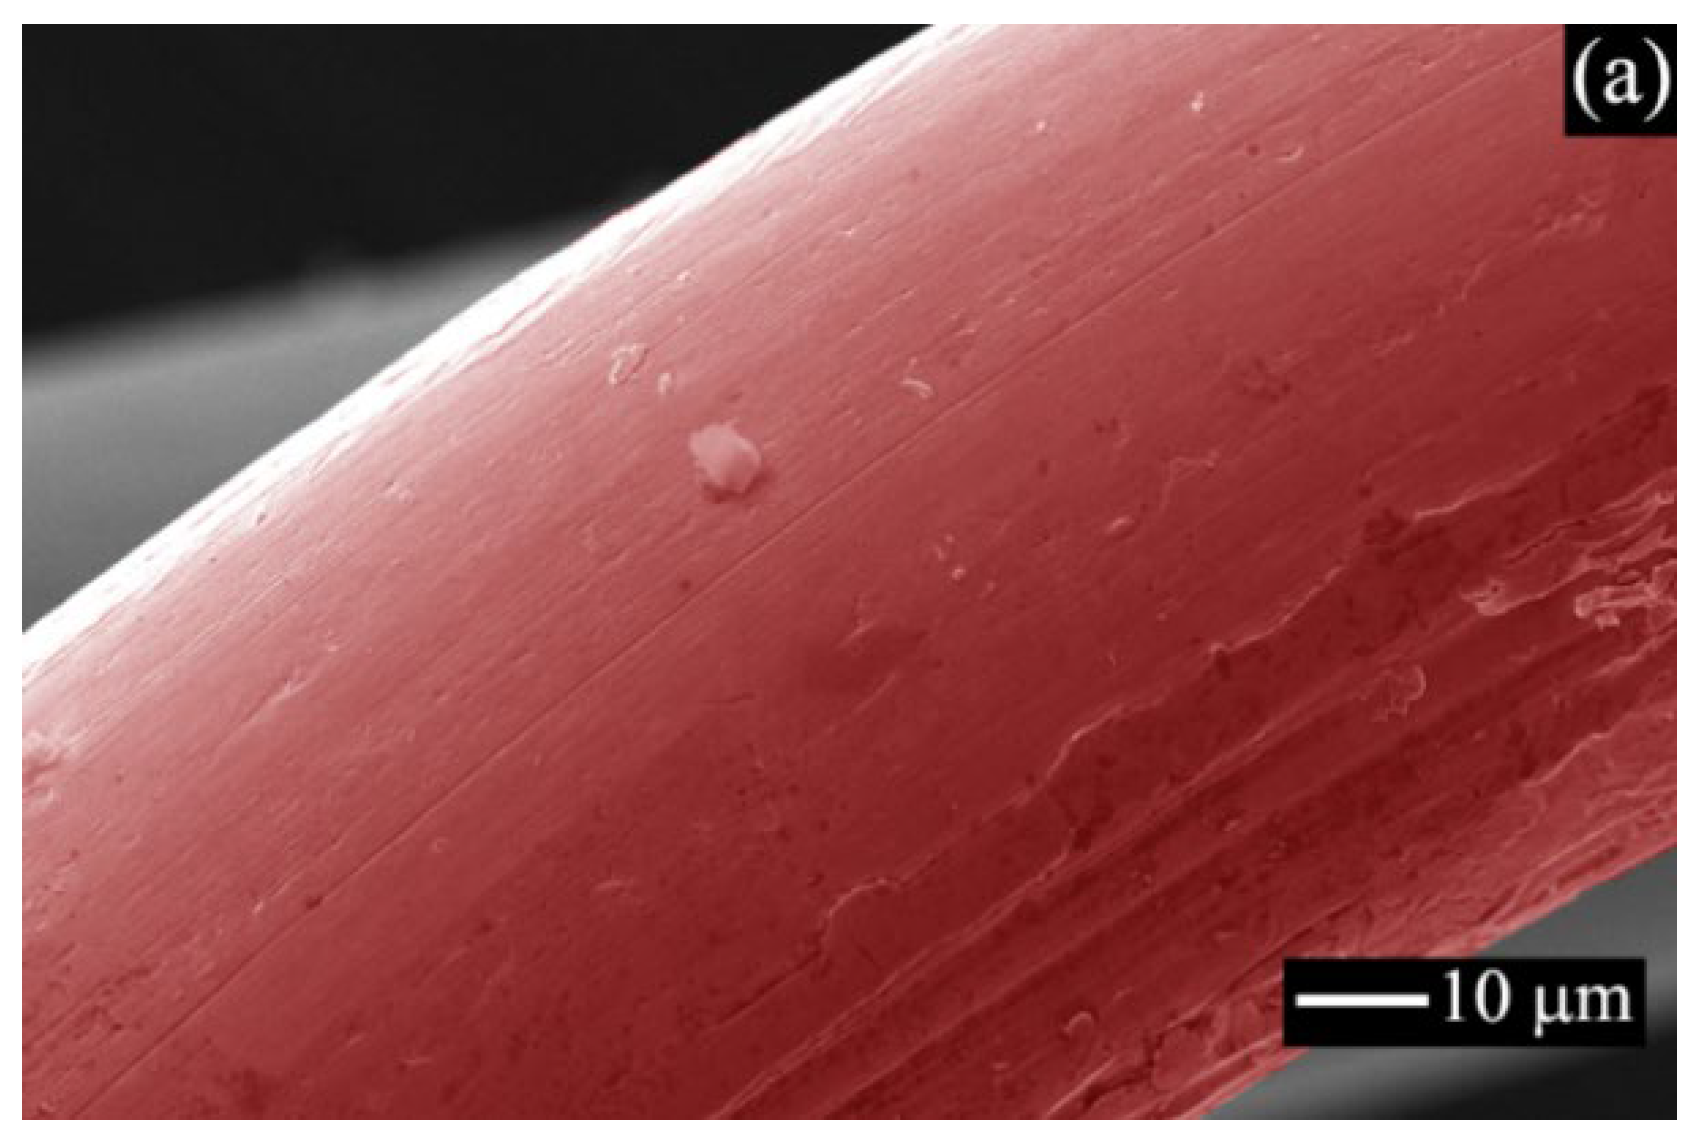
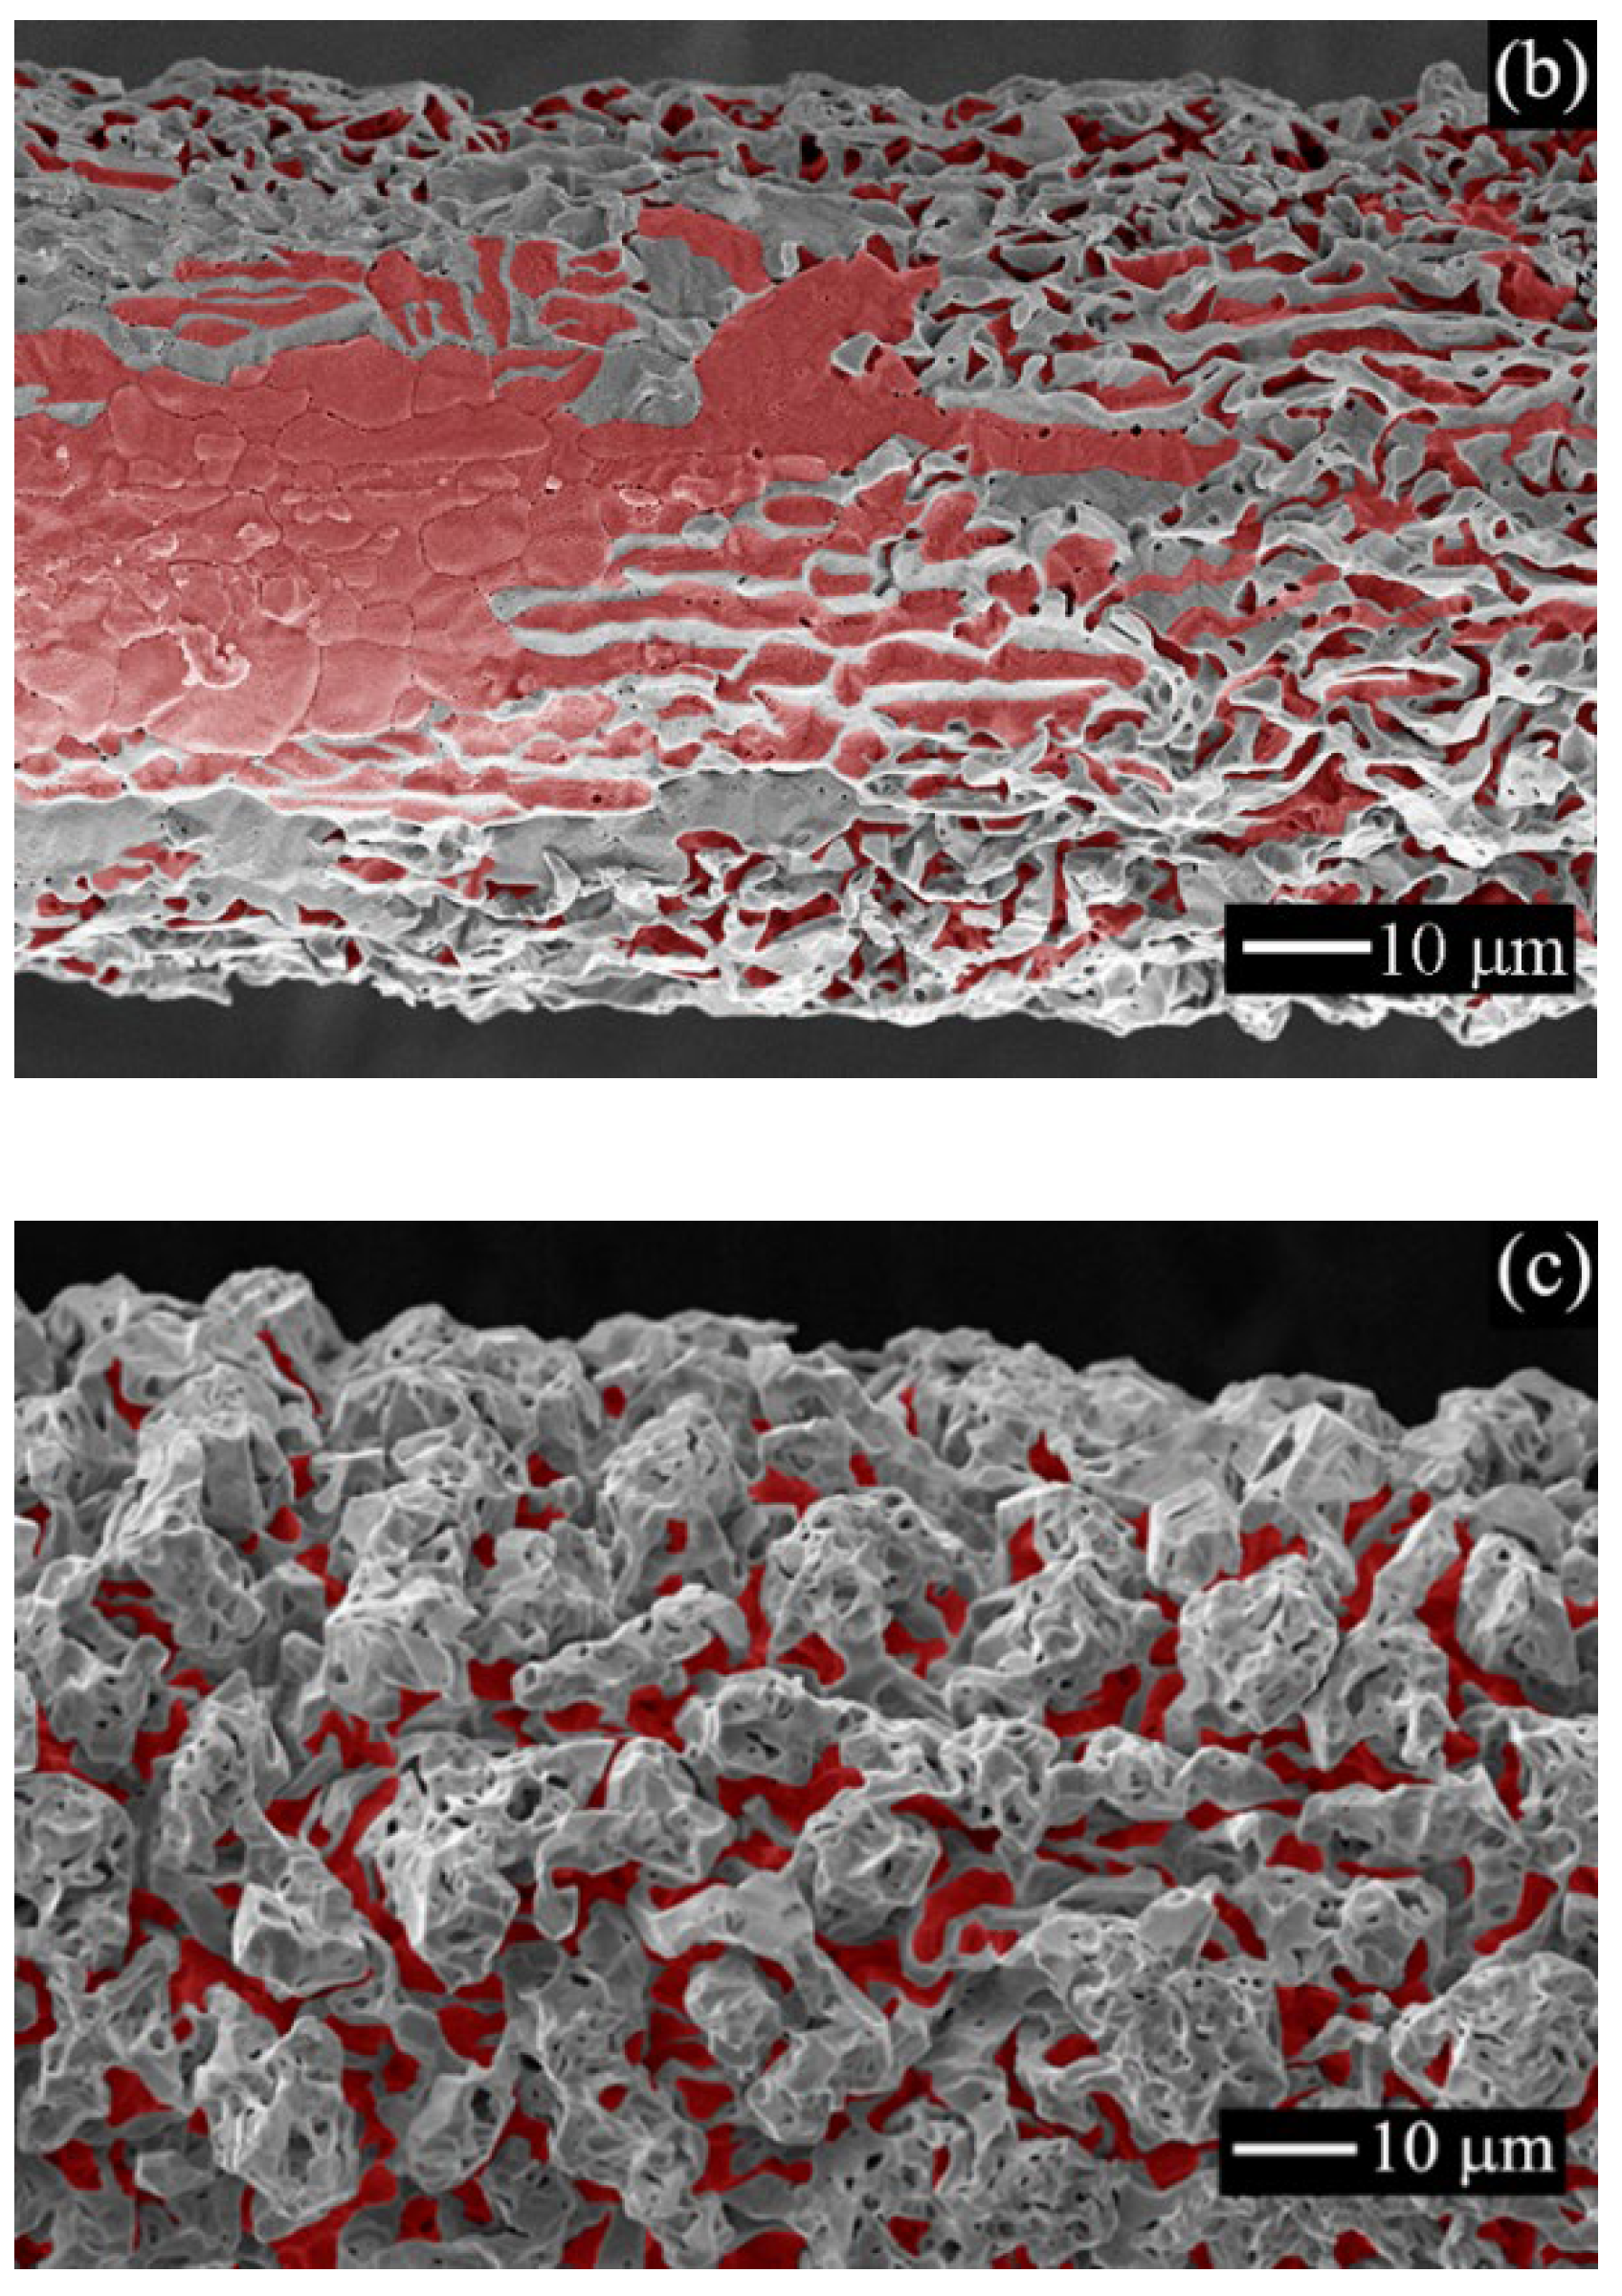
Figure 2 shows SEM images of typical regions of the wire surface on the fresh Pt–Pd–Rh–Ru gauze (a), as well as on the back (b) and frontal (c) sides of the first gauze along the gas flow after its operation in NH3 oxidation at 1133 K for 50 h in a laboratory reactor. Images of the indicated gauze regions were presented in our earlier study [21]. To show the etching degree of the wire surface layer, a smooth surface of the wire, on which the etched structures (protrusions, crystal fragments and “cauliflowers”) reside, is marked in red (Figure 2a–c). For the unused gauze, mostly the smooth surface regions are observed (Figure 2a), whereas on both sides of the spent gauze there are crystal structures of different shapes and sizes. The back side of the gauze has a non-uniform etched layer with smooth regions and various crystals (Figure 2b). The frontal side of the gauze has a continuous etched layer of “cauliflowers” (Figure 2c), as on such gauze after its industrial operation (Figure 1a,b).
In our studies [18,19,20,21], SEM and X-ray diffraction (XRD) were used to investigate the morphology and microstructure of the Pt–Pd–Rh–Ru gauze with the same composition as in this study after treatment at T = 1133 K for 50 h in air or ammonia, and also after the oxidation of NH3 with air. It was shown that the treatment medium produced a considerable effect on the morphology and microstructure of the gauze surface. The new gauze had mostly a smooth surface (Figure 2a) and its specific surface area was equal to 26.0 cm2·g−1. After treatment of the gauzes in NH3 and in air, grains with smooth and microfaceted surface were detected [18], while after NH3 oxidation, deep etching of the gauze surface was observed [19,20,21]. After the oxidation of NH3, on the back side of the first gauze along the gas flow we observed a non-uniform etched layer with the specific surface area of 52 cm2·g−1, which includes regions 100–200 µm in size with a smooth surface and with ca. 3 µm crystals [19]. In Figure 2b, such a region is represented by the smooth regions marked in red (left part of the image) and by the regions with protrusions and crystals (central and right parts of the image), respectively. On the frontal side of the spent gauze, there was a continuous etched layer of porous “cauliflowers” with a size of ca. 10 µm and specific surface area of 260 cm2·g−1 (Figure 2c) [20]. For the fresh gauze and both sides of the used gauze, the fcc lattice parameter (a) and the size of coherent scattering region (D) had close values equal to 3.903, 3.900 and 3.902 Å and 51, 74 and 39 nm, respectively [21]. The obtained a and D values testified to the absence of both the dissolution of the detected C, O and N atoms in the alloy lattice with the formation of interstitial solutions and the significant merging of subgrains during the catalytic etching initiated by NH3 oxidation. The highly exothermic oxidation of NH3 led to the formation of “hotspot” etching sites on etch pits, which generated temperature gradients both on the surface [6] and in the layer of agglomerates [20]. The appearance of such gradients may have resulted in the mass transfer of metals from “hot” to “cold” regions of the catalyst during the surface diffusion of metal atoms or evaporation and condensation of volatile oxides such as PtO2 and others, leading to deep etching of the surface with the formation of a rough layer of “cauliflowers”.
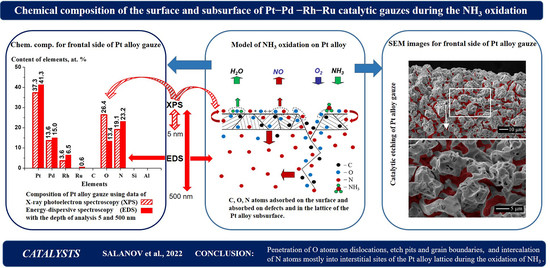
The surface and subsurface composition of the etched layer on the Pt–Pd–Rh–Ru gauze after its operation in NH3 oxidation was investigated using XPS and energy-dispersive X-ray spectroscopy (EDS). SEM, EDS and XPS, which strongly differ in the effective depth of analysis [23,24], were applied to analyze the chemical composition of a ca. 5 nm-thick surface layer and the subsurface region to a depth up to ca. 500 nm on Pt–Pd–Rh–Ru gauzes used in the oxidation of NH3 (see below Materials and Methods).

2.2. Chemical Composition of the New Pt–Pd–Rh–Ru Gauze according to XPS and EDS Data

Figure 3 displays XPS (a) and EDS (b) spectra for the new Pt–Pd–Rh–Ru gauze as well as the concentrations of elements (c) derived from these spectra. In Figure 3a, the XPS spectrum obtained for a 1 × 1 mm region of the gauze contains XPS peaks of Pt4f, C1s, Rh3d+Pt4d, Pd3d, Rh3p and O1s. Concentrations of elements in the surface layer of gauzes were estimated using areas of XPS peaks and atomic sensitivity factors of the elements [25]. In Figure 3b, the EDS spectrum contains X-ray peaks for C, O and Al (K series); for Pt at the energy < 2.5 keV (M series); and for Ru, Rh and Pd at the energy of 2.5–3.5 keV (L series), which were used for standard quantitative analysis of elements in the alloy. EDS spectra were obtained for the wire region with the size of 60 × 200 µm2 for 150 s. Figure 3c displays the concentrations of metals in the alloy used for gauze production according to the manufacturer data (black left bars). In addition, Figure 3c shows the concentrations of all the detected elements, which were obtained by standard quantitative analysis of EDS (red central bars) and XPS data (shaded right bars). According to EDS, the alloy had a low concentration of Al, which may have appeared in the alloy during gauze production; XPS did not detect Ru, which may have resided in the surface layers in a very low concentration, below the detection limit of this method.
Figure 3c demonstrates that the concentrations of metals estimated by EDS were much closer to the manufacturer data than the concentrations obtained by XPS. In addition, the concentrations of Rh, C and O obtained by XPS strongly exceeded the concentrations of these elements estimated by EDS. These differences may have been caused by differences in the surface and subsurface concentrations of these elements and by significantly different depths of analysis performed by these methods: XPS determines the composition of surface layers with a thickness of only 5 nm, while EDS determines the subsurface layers to a depth up to 500 nm. When comparing XPS and EDS data, it is necessary to consider not only the depth of analysis, but also a significant difference in the areas from which information is obtained; in our study, the analysis area had the size of ca. 1 × 1 mm for XPS and 60 × 200 µm for EDS. In addition, it should be taken into account that X-ray quanta from the XPS spectrometer exert virtually no effect on the adsorbed layers, whereas the microscope probe electrons can essentially destroy them, which leads to dissociation and desorption of the adsorbed molecules. According to XPS and EDS data, along with the metals claimed by the manufacturer, only Al, C and O were detected on the initial Pt–Pd–Rh–Ru gauze, while admixtures of other elements were not found. It should be noted that the detection limit of elements for the standard analysis by these methods is ca. 0.1 wt.%, which does not allow for the recording of the admixtures of elements that may be present in the initial gauze in the concentrations ≤0.11 wt.% according to GOST 13498-2010 (see below Materials and Methods).

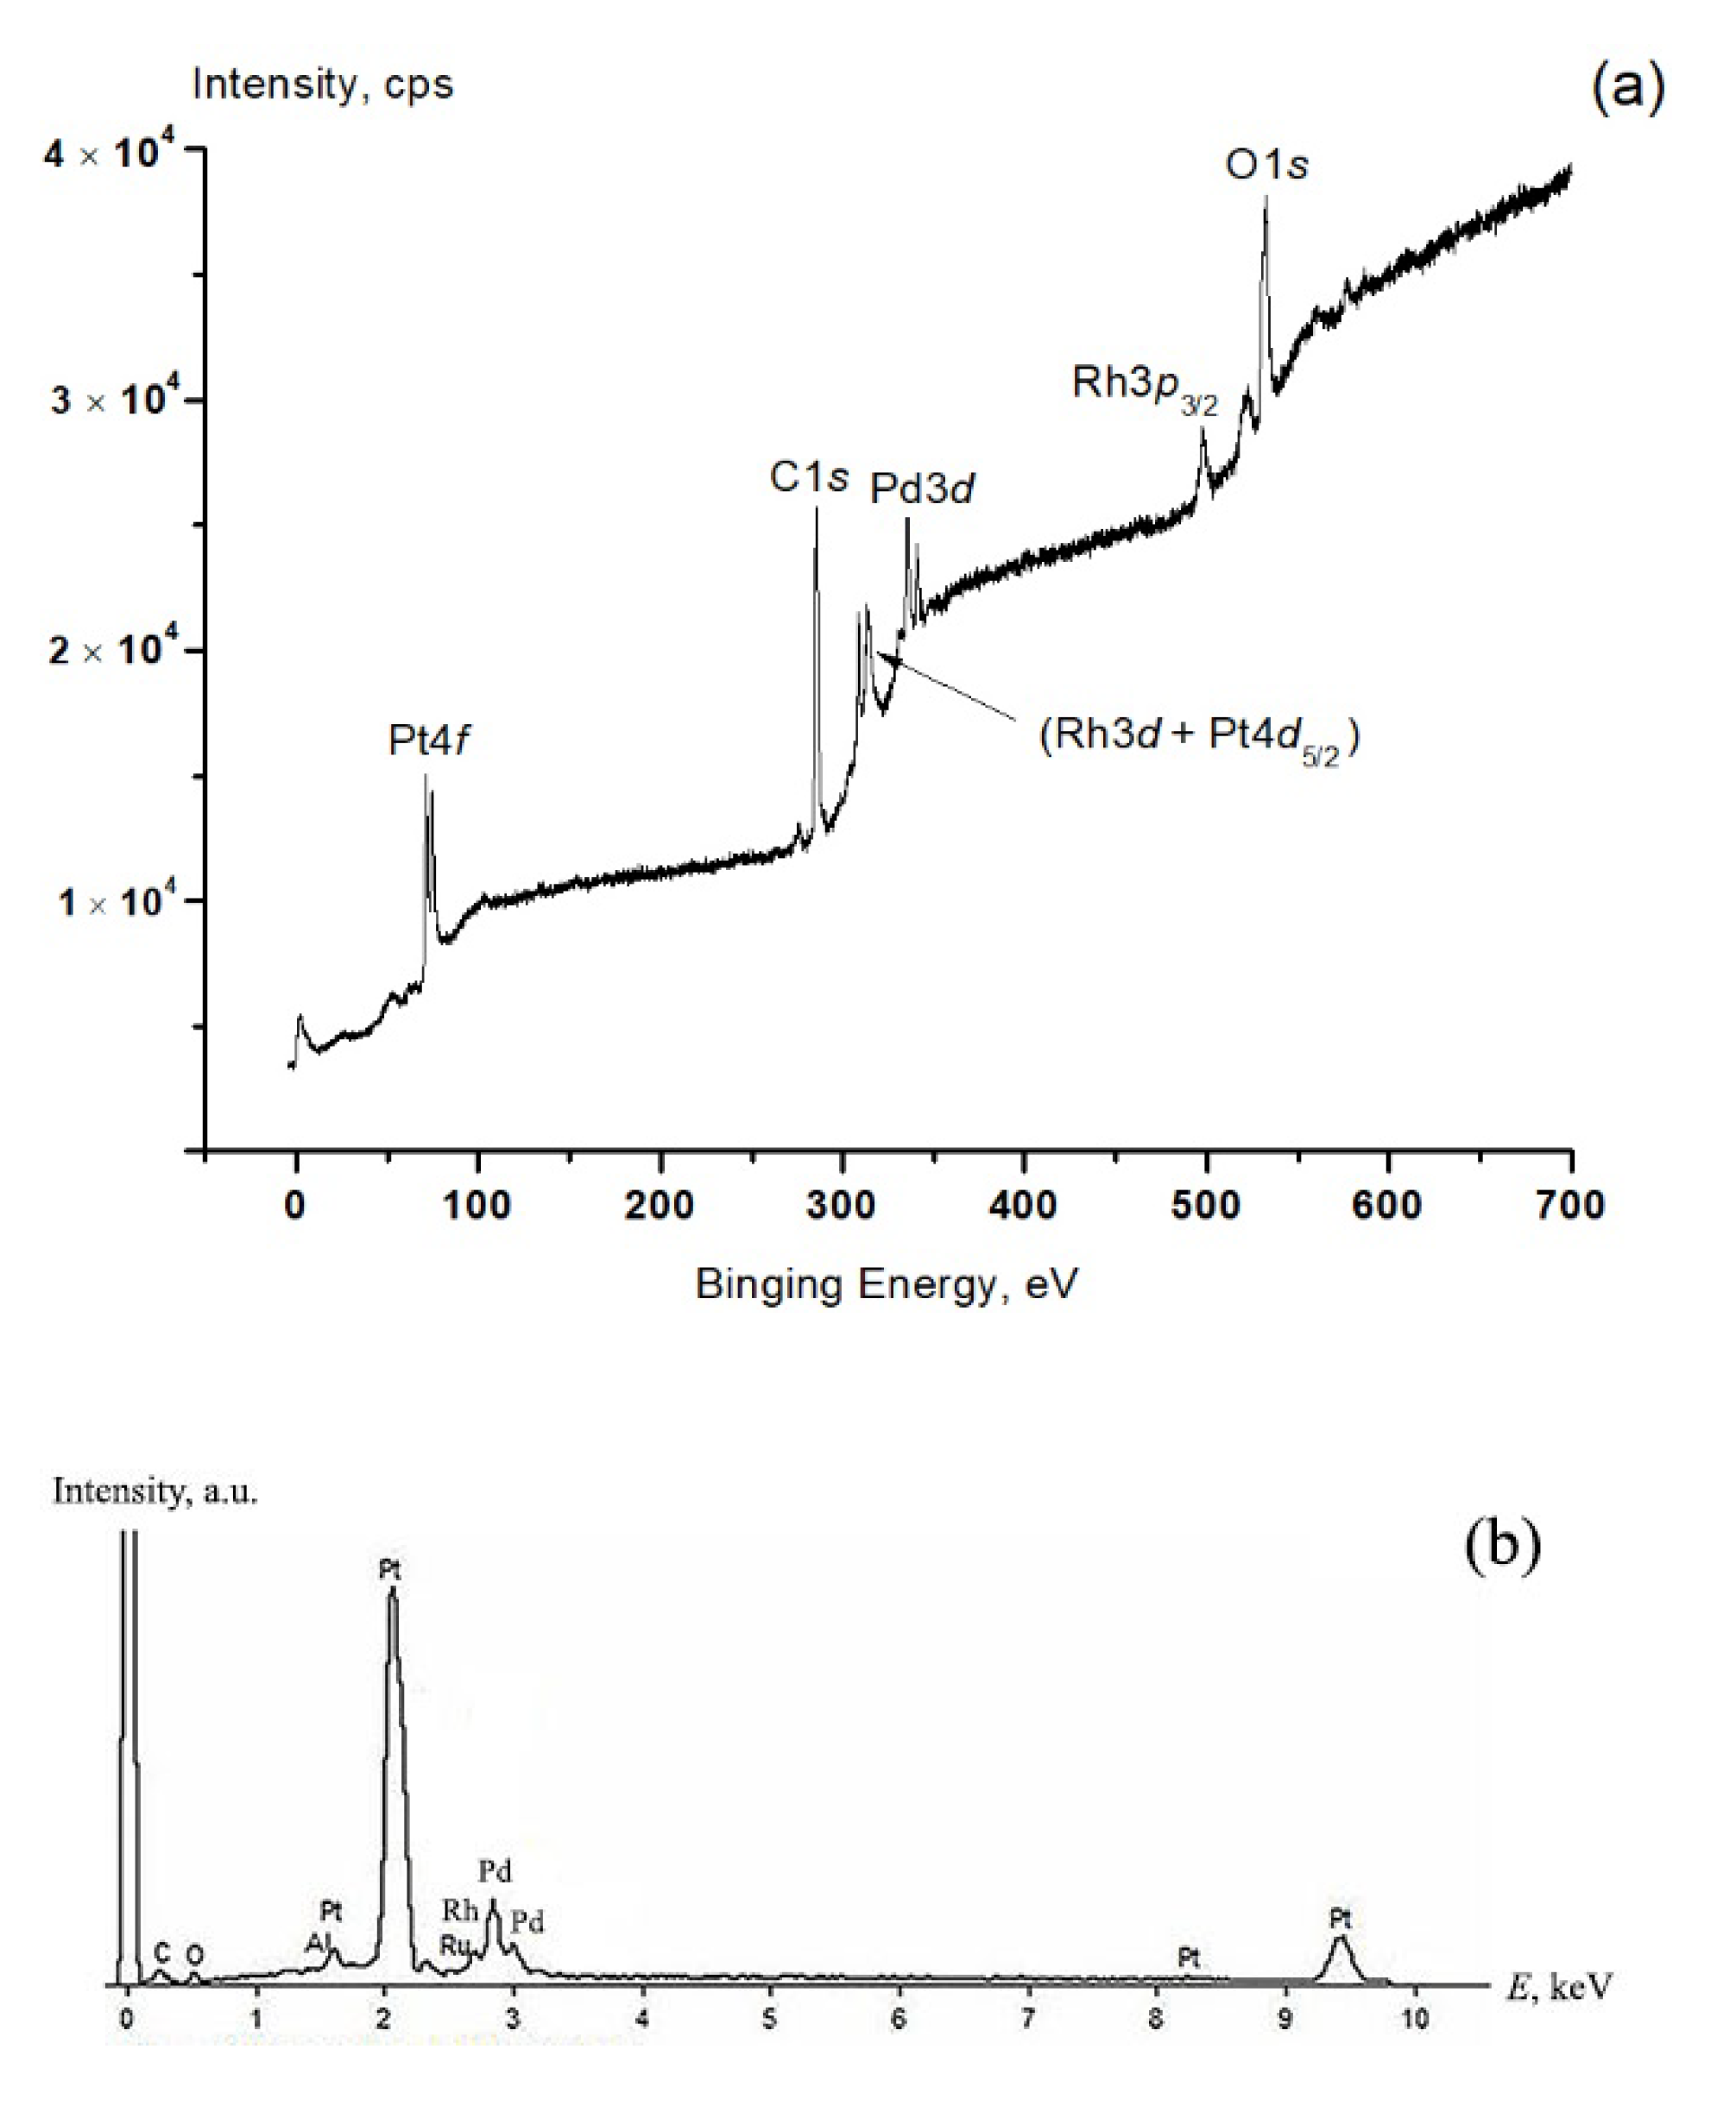
2.3. Spectral Characteristics, Chemical State and Concentration of Elements on the Surface of Fresh Pt–Pd–Rh–Ru Gauze and Both Sides of the Gauze after NH3 Oxidation according to XPS Data

XPS spectra were recorded for the fresh Pt–Pd–Rh–Ru gauze and for both sides of such gauze after NH3 oxidation at 1133 K. The XPS spectrum for the fresh gauze is displayed in Figure 3a; close spectra with additional N and Si peaks were obtained for the spent gauzes. These spectra were used to determine the elemental composition, chemical state of atoms and their concentration in a ca. 5 nm-thick surface layer. On the frontal side of the spent gauze, XPS spectra for Pt, Pd, Rh, C, O, N and Si, corresponding to Pt4f, Pd3d, Rh3d, C1s, O1s, N1s and Si2p electronic levels, respectively, were recorded. XPS peaks of Ru were not detected, probably due to its low concentration in subsurface layers of the alloy, below the detection limit of the XPS method. The recorded spectra were also used to estimate the binding energy (Eb) of Pt4f7/2 (71.1 eV), Pd3d5/2 (335.5 eV), C1s (285.1 eV) and Si2p (102.6 eV) levels. Two peaks were observed in Rh3d5/2, C1s, O1s and N1s spectra, so these spectra were deconvoluted by the Gauss method to distinguish two peaks that are necessary for refining the Eb values and estimating the area of the peaks. 
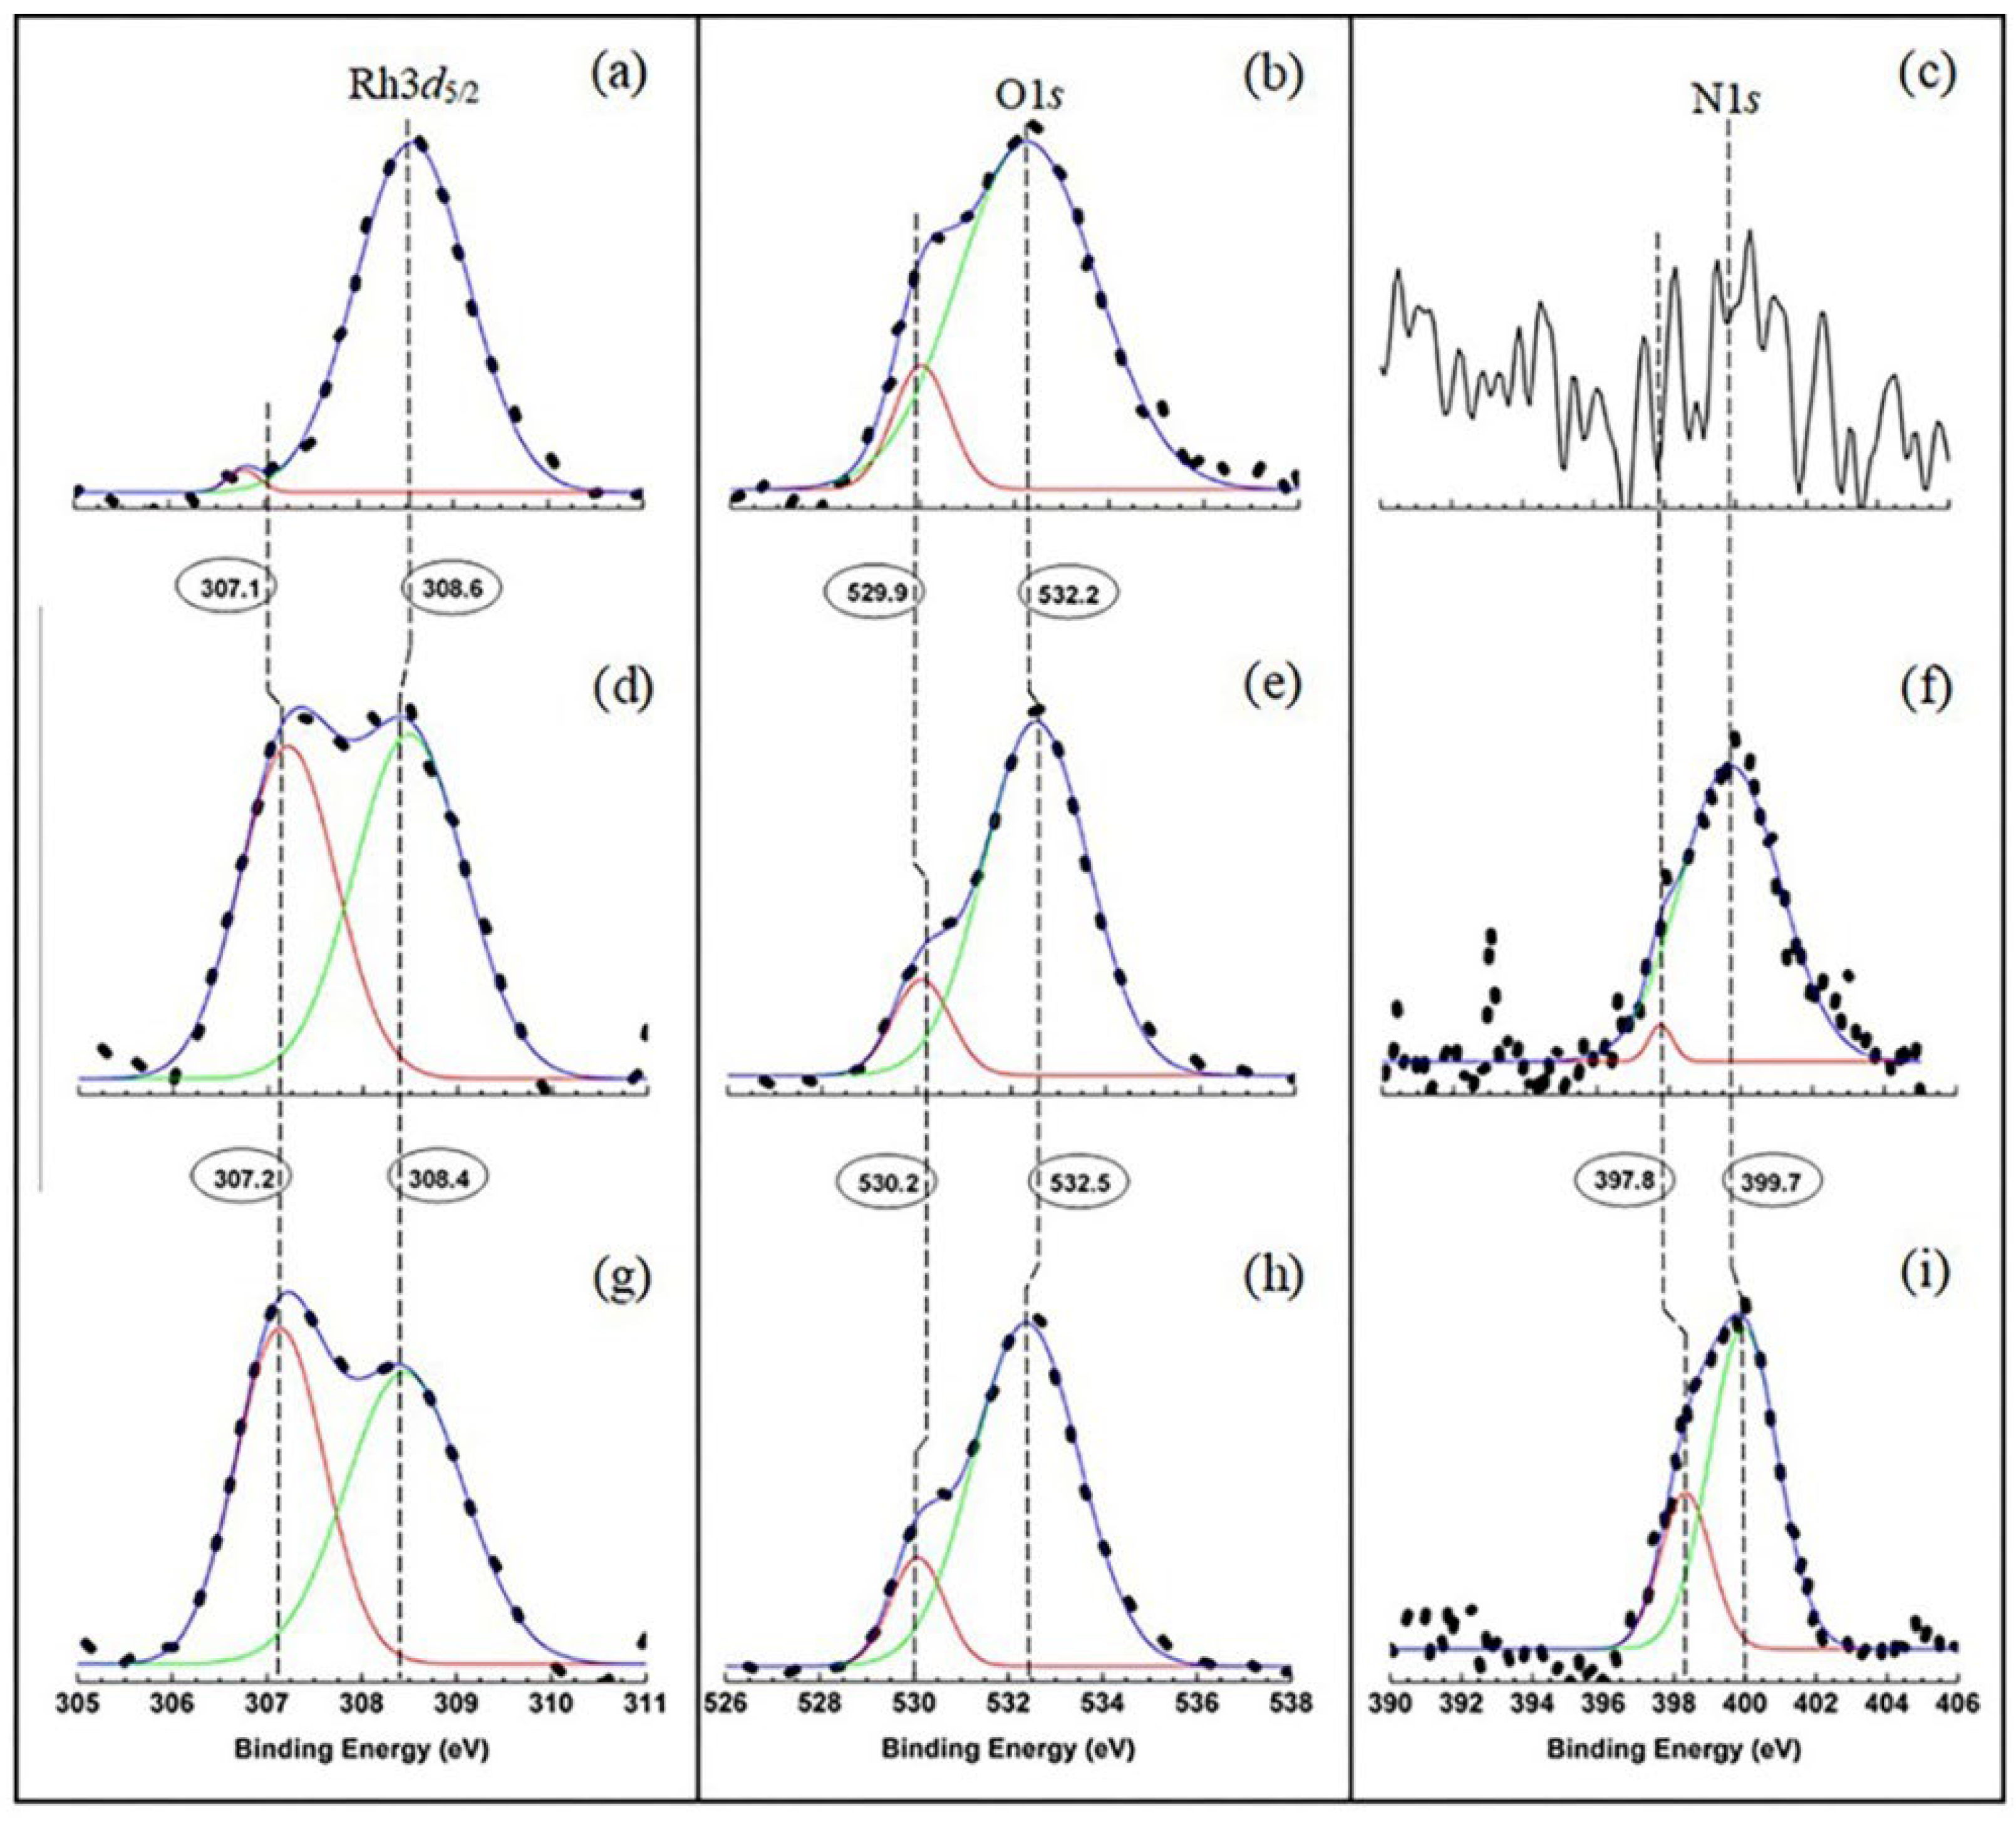
Figure 4 displays XPS spectra of Rh3d5/2 (a,d,g), O1s (b,e,h) and N1s (c,f,i) with the peaks separated by deconvolution of these spectra for the fresh gauze (a,b,c) and also for the back (d,e,f) and frontal (g,h,i) sides of the gauze used in the oxidation of NH3. C1s spectra of the tested gauzes were quite similar to each other, so they are not shown in Figure 4.
For the frontal side of the used gauze, deconvolution of the Rh3d5/2 spectrum gave two peaks with close intensities and Eb values equal to 307.2 and 308.4 eV (Figure 4g). Deconvolution of O1s and N1s spectra gave two peaks with different intensity and Eb values of 530.0 and 532.4 eV and 398.5 and 400.0 eV, as seen in Figure 4h,i, respectively. Taking into account data reported in [25], XPS peaks obtained in this study were used to reveal the chemical state of atoms of the detected elements. For Pt4f7/2, Pd3d5/2 and Rh3d5/2 peaks, the obtained Eb values equal to 71.1, 335.5 and 307.2 eV, respectively, testified to the metallic state of these elements (Pt0, Pd0 and Rh0). According to [25], for neat Pt, Pd and Rh, the Eb values of these peaks are close to 71.2, 335.1 and 307.2 eV, respectively, while in various platinum, palladium and rhodium compounds, Eb is higher than 72.0, 336.0 and 308.0 eV, respectively. The obtained Rh3d5/2 peak with Eb = 308.4 eV (Figure 4g) indicated the Rh3+ ionic state of rhodium, probably as a component of Rh2O3 oxide. The intense C1s peak with Eb = 285.1 eV testified to the graphitic state of carbon because the Eb value for neat carbon falls in the range of 284.0–285.0 eV, while in metal carbides and carbon compounds with other atoms, the value for carbon is Eb ≤ 283.0 and >285.0 eV, respectively [25]. It should be noted that a low-intensity XPS peak was observed in the recorded C1s spectrum at high Eb values (>287.0 eV). Deconvolution of the C1s spectrum gave an intense peak with Eb = 285.1 eV and a low-intensity peak with Eb = 287.3 eV, which was located in the energy range of 284.0–291.0 eV. In [13] it is noted that broad XPS peaks of C1s may correspond to carbon compounds with different atoms. The XPS peak with Eb = 287.3 eV may include the peaks corresponding to (C–O) and (C–N), for which the Eb values are in the ranges of 286.0–291.5 and 285.2–288.2 eV, respectively [25]. Note that the C1s peak with Eb = 287.3 eV could not be associated with the adsorbed carbonate groups, since for them, the Eb value for the C1s peak was higher and fell in the range of 289.0–291.5 eV. For the Si2p peak, the obtained Eb = 102.6 eV was close to the Eb value corresponding to that in SiO2 (103.3 eV). For the O1s peak, the acquired Eb = 530.0 eV (Figure 4h) indicated the O2− ionic state of oxygen in Rh2O3 oxide. The O1s peak with Eb = 532.4 eV (Figure 4h) could be assigned to oxygen in the adsorbed hydroxyl groups (OHad) and carbon oxide molecules (COad) because their Eb value was between 531.0 and 532.0 eV; in addition, this peak may correspond to oxygen in SiO2 particles, where Eb for the O1s peak is between 532.5 and 533.3 eV [25]. Note also that the O1s peak with Eb = 532.4 eV could not be attributed to carbonate groups because their Eb for the O1s peak had a decreased value and fell in the range of 530.5–531.5 eV. The obtained N1s peak with a binding energy 398.5 eV (Figure 4i) could be assigned both to the adsorbed nitrogen atoms (Nad) and to nitrogen in metal nitrides in the alloy because their Eb for the N1s peak ranged from 396.2 to 398.2 eV. The N1s peak with Eb = 400.0 eV (Figure 4i) testified to nitrogen compounds with different atoms, particularly the (C–N)ad groups and (NH3)ad molecules, for which Eb values for the N1s peak were in the ranges of 397.8–400.2 and 398.8–399.7 eV, respectively [25]. The formation of such compounds is quite probable during the oxidation of NH3.
On the fresh Pt–Pd–Rh–Ru gauze and on the back side of the spent gauze, XPS spectra recorded for Pt, Pd, Rh, C and O had peaks corresponding to Pt4f, Pd3d, Rh3d, C1s and O1s electronic levels, respectively; in addition, for the back side, XPS spectra recorded for N and Si had peaks corresponding to N1s and Si2p levels, respectively. For these gauzes, as for the frontal side of the used gauze, spectral characteristics of the detected elements were revealed. XPS spectra of Rh3d5/2, O1s, C1s and N1s also contained two peaks; so these spectra were deconvoluted into two individual peaks, which were necessary for refining the Eb values and estimating the areas of these peaks (Figure 4a–f). C1s spectra of the fresh gauze and back side of the spent one contained not only the intense peaks with Eb~285.0 eV, but also the low-intensity XPS peaks at high Eb values (>287.0 eV). Deconvolution of C1s spectra gave the intense peaks with Eb = 285.4 and 285.1 eV and the low-intensity peaks with Eb = 286.1 and 287.6 eV for the fresh gauze and back side, respectively. Taking into account data for the frontal side of the used gauze, the obtained intense peaks at Eb~285.0 eV were attributed to graphitic carbon, while the low-intensity peaks at Eb~286.0–288.0 eV may have been associated with (C–O) and (C–N) groups.
For the fresh Pt–Pd–Rh–Ru gauze and for both sides of the spent gauze, relative concentrations (at.%) of Pt, Pd, Rh, C, O, N and Si in a ca. 5 nm-thick surface layer of the gauzes were calculated from the measured areas of peaks in XPS spectra of Pt4f, Pd3d, Rh3d5/2, C1s, O1s, N1s and Si2p, respectively, using atomic sensitivity factors of these elements [25]. The 4f7/2, 4f5/2 and 3d5/2, 3d3/2 peaks were used for Pt and Pd, respectively, while for rhodium, only the 3d5/2 peak was used because the Rh3d3/2 peak overlapped the intense Pt4d5/2 peak. In addition, for Rh, O, N and C we used the peaks obtained by deconvolution of Rh3d5/2, O1s, N1s and C1s spectra, respectively, as seen in Figure 4. Table 1 lists the Eb values obtained for individual electronic levels and the concentrations for the detected elements (Pt, Pd, Rh, C, O, N and Si), particularly those calculated from the peaks obtained by deconvolution of Rh3d5/2, O1s, N1s and C1s spectra for the fresh Pt–Pd–Rh–Ru gauze (a,b) and also for the back (c,d) and frontal (e,f) sides of such gauze used in the oxidation of NH3.
Data in Table 1 demonstrated an essential difference in the concentrations of detected elements. For all the gauzes, carbon and oxygen were detected in high concentrations equal to 57.9, 48.4 and 56.3 at.% for C and 29.8, 35.3 and 31.1 at.% for O, whereas the other elements had much lower concentrations ranging from 1.0 to 5.0 at.%. Thus, the XPS study detected Pt, Pd, Rh, C and O in a ca. 5 nm-thick surface layer on the new Pt–Pd–Rh–Ru gauze, whereas Pt, Pd, Rh, C, O, N and Si were observed on both sides (back and frontal) of the spent gauze. Two XPS peaks were revealed for Rh, C, O and N, which indicated different states of atoms for these elements. This suggests that on all the gauzes, the surface layer with a thickness of ca. 5 nm contained the metallic alloy of Pt0, Pd0 and Rh0 atoms, Rh2O3 oxide, graphitic carbon and the adsorbed layer of OHad and COad. The surface layer of the gauzes had high concentrations of carbon and oxygen (48.4–57.9 at.% for C and 29.8–35.3 at.% for O) and low concentrations of the other elements (≤5 at.%). The data obtained were used to elucidate the composition and structure of the surface films on the gauzes under consideration.

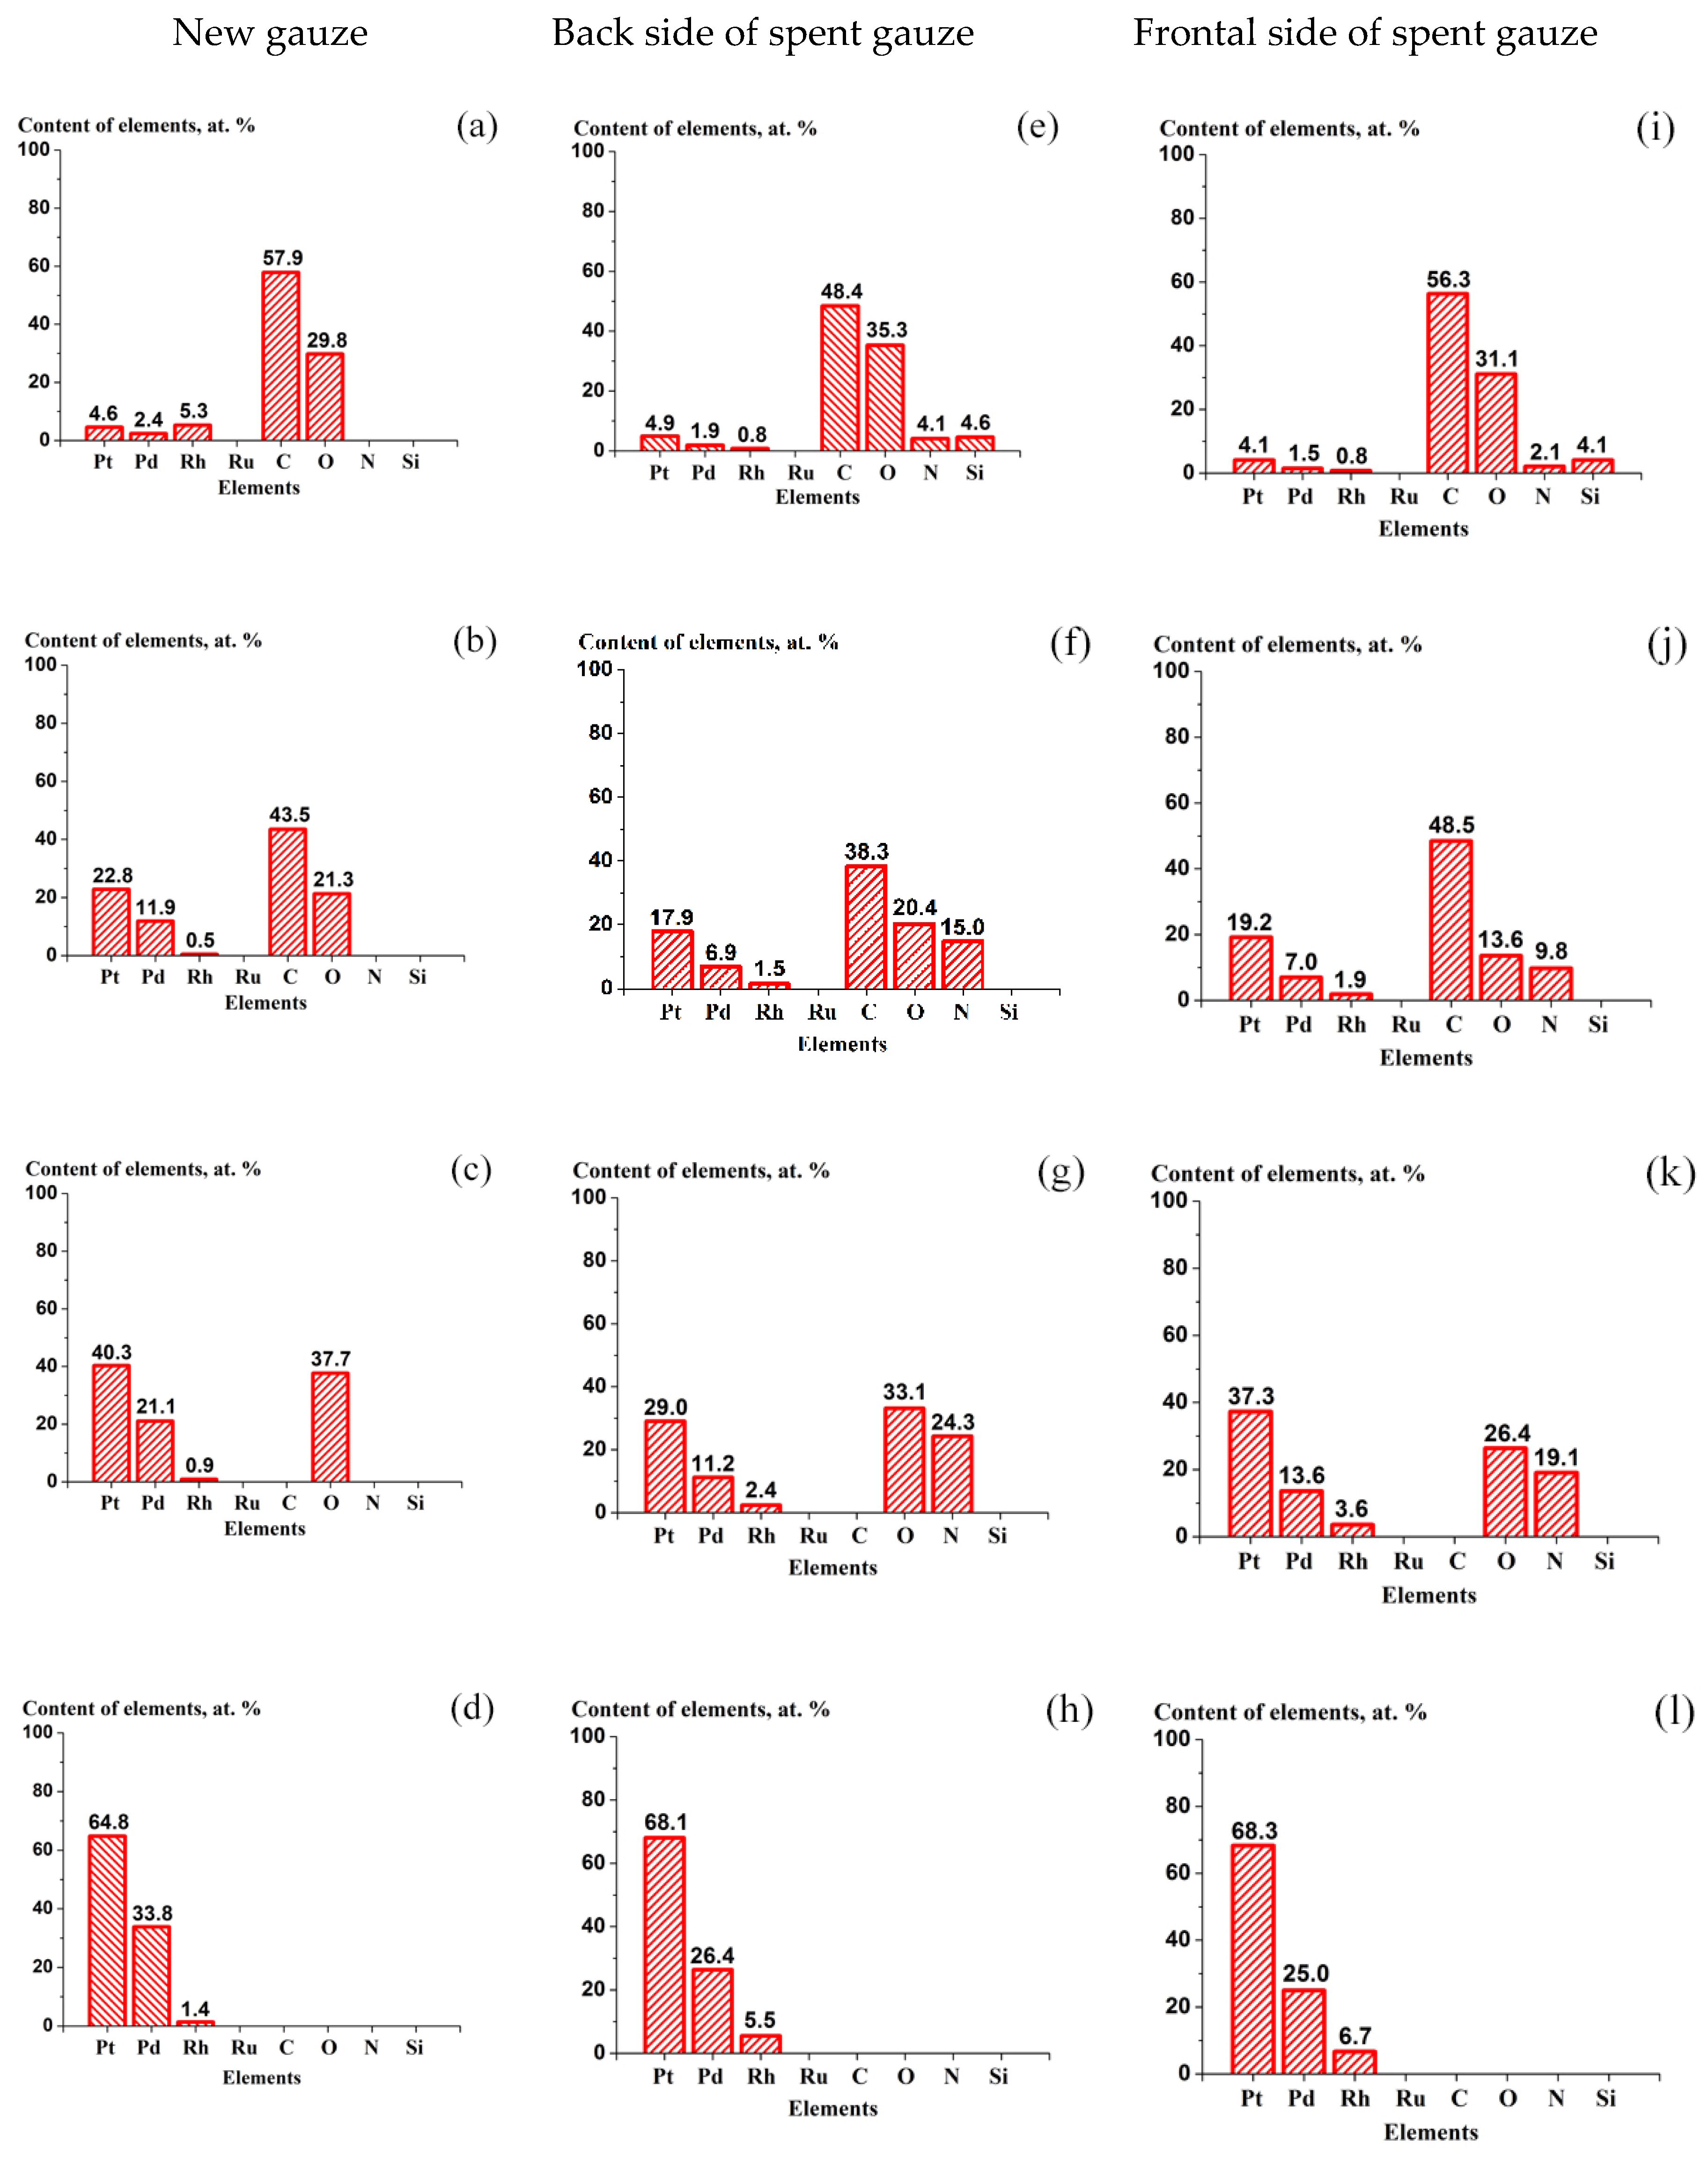
2.4. Composition and Structure of the Surface Films on the Fresh Pt–Pd–Rh–Ru Gauze and Both Sides of the Gauze Used in NH3 Oxidation according to XPS Data

Figure 5 shows the concentrations of elements measured by XPS in a ca. 5 nm-thick surface layer on the new Pt–Pd–Rh–Ru gauze (a–d) and also on the back (e–h) and frontal (i–l) sides of such gauze used in the oxidation of NH3 at 1133 K. Figure 5a,e,i display the concentrations listed in Table 1 of all the detected elements, namely, Pt, Pd, Rh, C and O for the new gauze (Figure 5a) and Pt, Pd, Rh, C, O, N and Si for both sides of the used gauze (Figure 5e,i), respectively. For all the gauzes, XPS peaks corresponding to Ru were not detected, probably due to the low Ru concentration in the surface layers of the tested gauzes. For both sides of the spent gauze, Si was detected in the concentrations of 4.6 and 4.1 at.%, and N–4.1 and 2.1 at.%, respectively (Figure 5e,i). The presence of Si may indicate that SiO2 particles were transferred to gauzes from the quartz reactor, while the presence of N may testify to the accumulation of nitrogen atoms in the catalyst surface layers during the oxidation of NH3.
On the new gauze and on both sides of the gauze after its operation in NH3 oxidation, the following contents of elements were obtained: Pt—4.6, 4.9 and 4.1 at.%; Pd—2.4, 1.9 and 1.5 at.%; and Rh—5.3, 0.8 and 0.8 at.%, respectively (Table 1b,d,f and Figure 5a,e,i). According to XPS spectra, all the detected Pt and Pd atoms and a part of the Rh atoms in the concentrations of 0.1, 0.4 and 0.4 at.% entered the composition of metallic alloy on these gauzes (Table 1b,d,f). The remaining part of the Rh atoms in the ionic form Rh3+ could enter the composition of Rh2O3 oxide. The new gauze had an increased content of rhodium (5.3 at.%) in comparison with both sides of the spent gauze (0.8 and 0.8 at.%, respectively), as seen in Figure 5a,e,i. The surface enrichment of the new gauze with rhodium may be related to the pretreatment of gauzes before mounting in the reactor. The obtained Rh3d5/2 peaks with Eb of 308.4–308.6 eV (Figure 4a,d,g) testified to Rh3+ in the concentrations of 5.2, 0.4 and 0.4 at.% (Table 1b,d,f). The O1s peaks with Eb of 529.9–530.2 eV (Figure 4b,e,h) and concentrations of 5.3, 6.2 and 3.5 at.% (Table 1b,d,f), taking into account the data for Rh3+, may have included O2− ions in the concentrations of 5.3, 0.6 and 0.6 at.% in Rh2O3. The O1s and Rh3d5/2 peaks assigned to O2− and Rh3+ indicated the presence of Rh2O3 oxide film on the alloy surface of all gauzes, which is consistent with the data of Ref. [10]. In this work, the Rh2O3 surface film with a thickness below 2 nm was detected on a Pt–10 wt.% Rh gauze after NH3 oxidation. Such an oxide film can form upon cooling the gauzes after termination of the catalytic process because Rh2O3 oxide becomes unstable under the conditions of NH3 oxidation [10].
A close carbon content equal to 57.9, 48.4 and 56.3 at.%, respectively, was obtained on the tested gauzes (Figure 5a,e,i). The solubility of carbon in platinum with the formation of solid interstitial solutions is extremely low [26]. In this context, close Eb values (285.1–285.4 eV) for C1s peaks in the concentrations of 49.1, 37.9 and 45.9 at.% testified to the surface graphitic state of carbon on all the gauzes (Table 1b,d,f). Carbon detected in the surface layer of the new Pt–Pd–Rh–Ru gauze and Pt(poly), which had Eb = 285.4 and 284.5 eV for C1s, was attributed to surface graphitic films with a thickness of ca. 10 nm [18] and 1–2 nm [27], respectively. XPS data obtained in our study showed the presence of graphitic carbon film (Cgr) with a close thickness of 1–10 nm on all the gauzes under consideration. In addition, it should be noted that the concentrations of carbon indicated in Figure 5a,e,i included not only Cgr, but also other states of carbon: Cab, (C–O)ab and (C–N)ab (see below).
The fresh and spent gauzes (back and frontal sides) were shown to have a close content of oxygen: 29.8, 35.3 and 31.1 at.%, respectively (Figure 5a,e,i). The O1s peak with Eb = 532.2, 532.5 and 532.4 eV (Figure 4b,e,h) corresponded to oxygen in the concentrations of 24.5, 29.1 and 27.6 at.%, respectively (Table 1b,d,f), in the adsorbed surface layer of OHad and COad, particularly in the composition of SiO2. It should be noted that the oxygen concentrations shown in Figure 5a,e,i included, along with the surface layer (OHad, COad and SiO2), oxygen of Rh2O3 oxide and oxygen atoms intercalated on defects (Oab) (see below). It should be noted also that the obtained concentrations of C and O on all the gauzes and N concentrations on the spent gauzes (Figure 5a,e,i) were close to the concentrations of these elements after NH3 oxidation in an industrial reactor for several weeks on a pack of 36 Pt–10 wt.% Rh gauzes [9]. According to XPS, on gauzes 2, 16, 31 and 36 of this pack, the concentrations of C were equal to 49.3, 49.1, 47.1 and 52.5 at.%, for O—25.6, 35.0, 30.5 and 27.7 at.% and for N—5.4, 2.0, 4.2 and 2.8 at.%, respectively.
Thus, according to XPS, the oxide, graphitic carbon and adsorption surface films were detected on the new Pt–Pd–Rh–Ru gauze and on both sides of the spent gauze. On the spent gauzes, the oxide film (Rh2O3) with a thickness ≤2 nm may have formed on the metallic alloy surface upon cooling the reactor. The graphitic carbon film (Cgr) with a thickness from 1 to 10 nm may have formed on the oxide film surface in air. The adsorption surface layer (OHad and COad) formed on the Cgr surface, also in air. Data on the composition and structure of the observed surface films on the platinum alloy gauzes studied in this work were used to reveal the composition of the catalyst surface under such films.

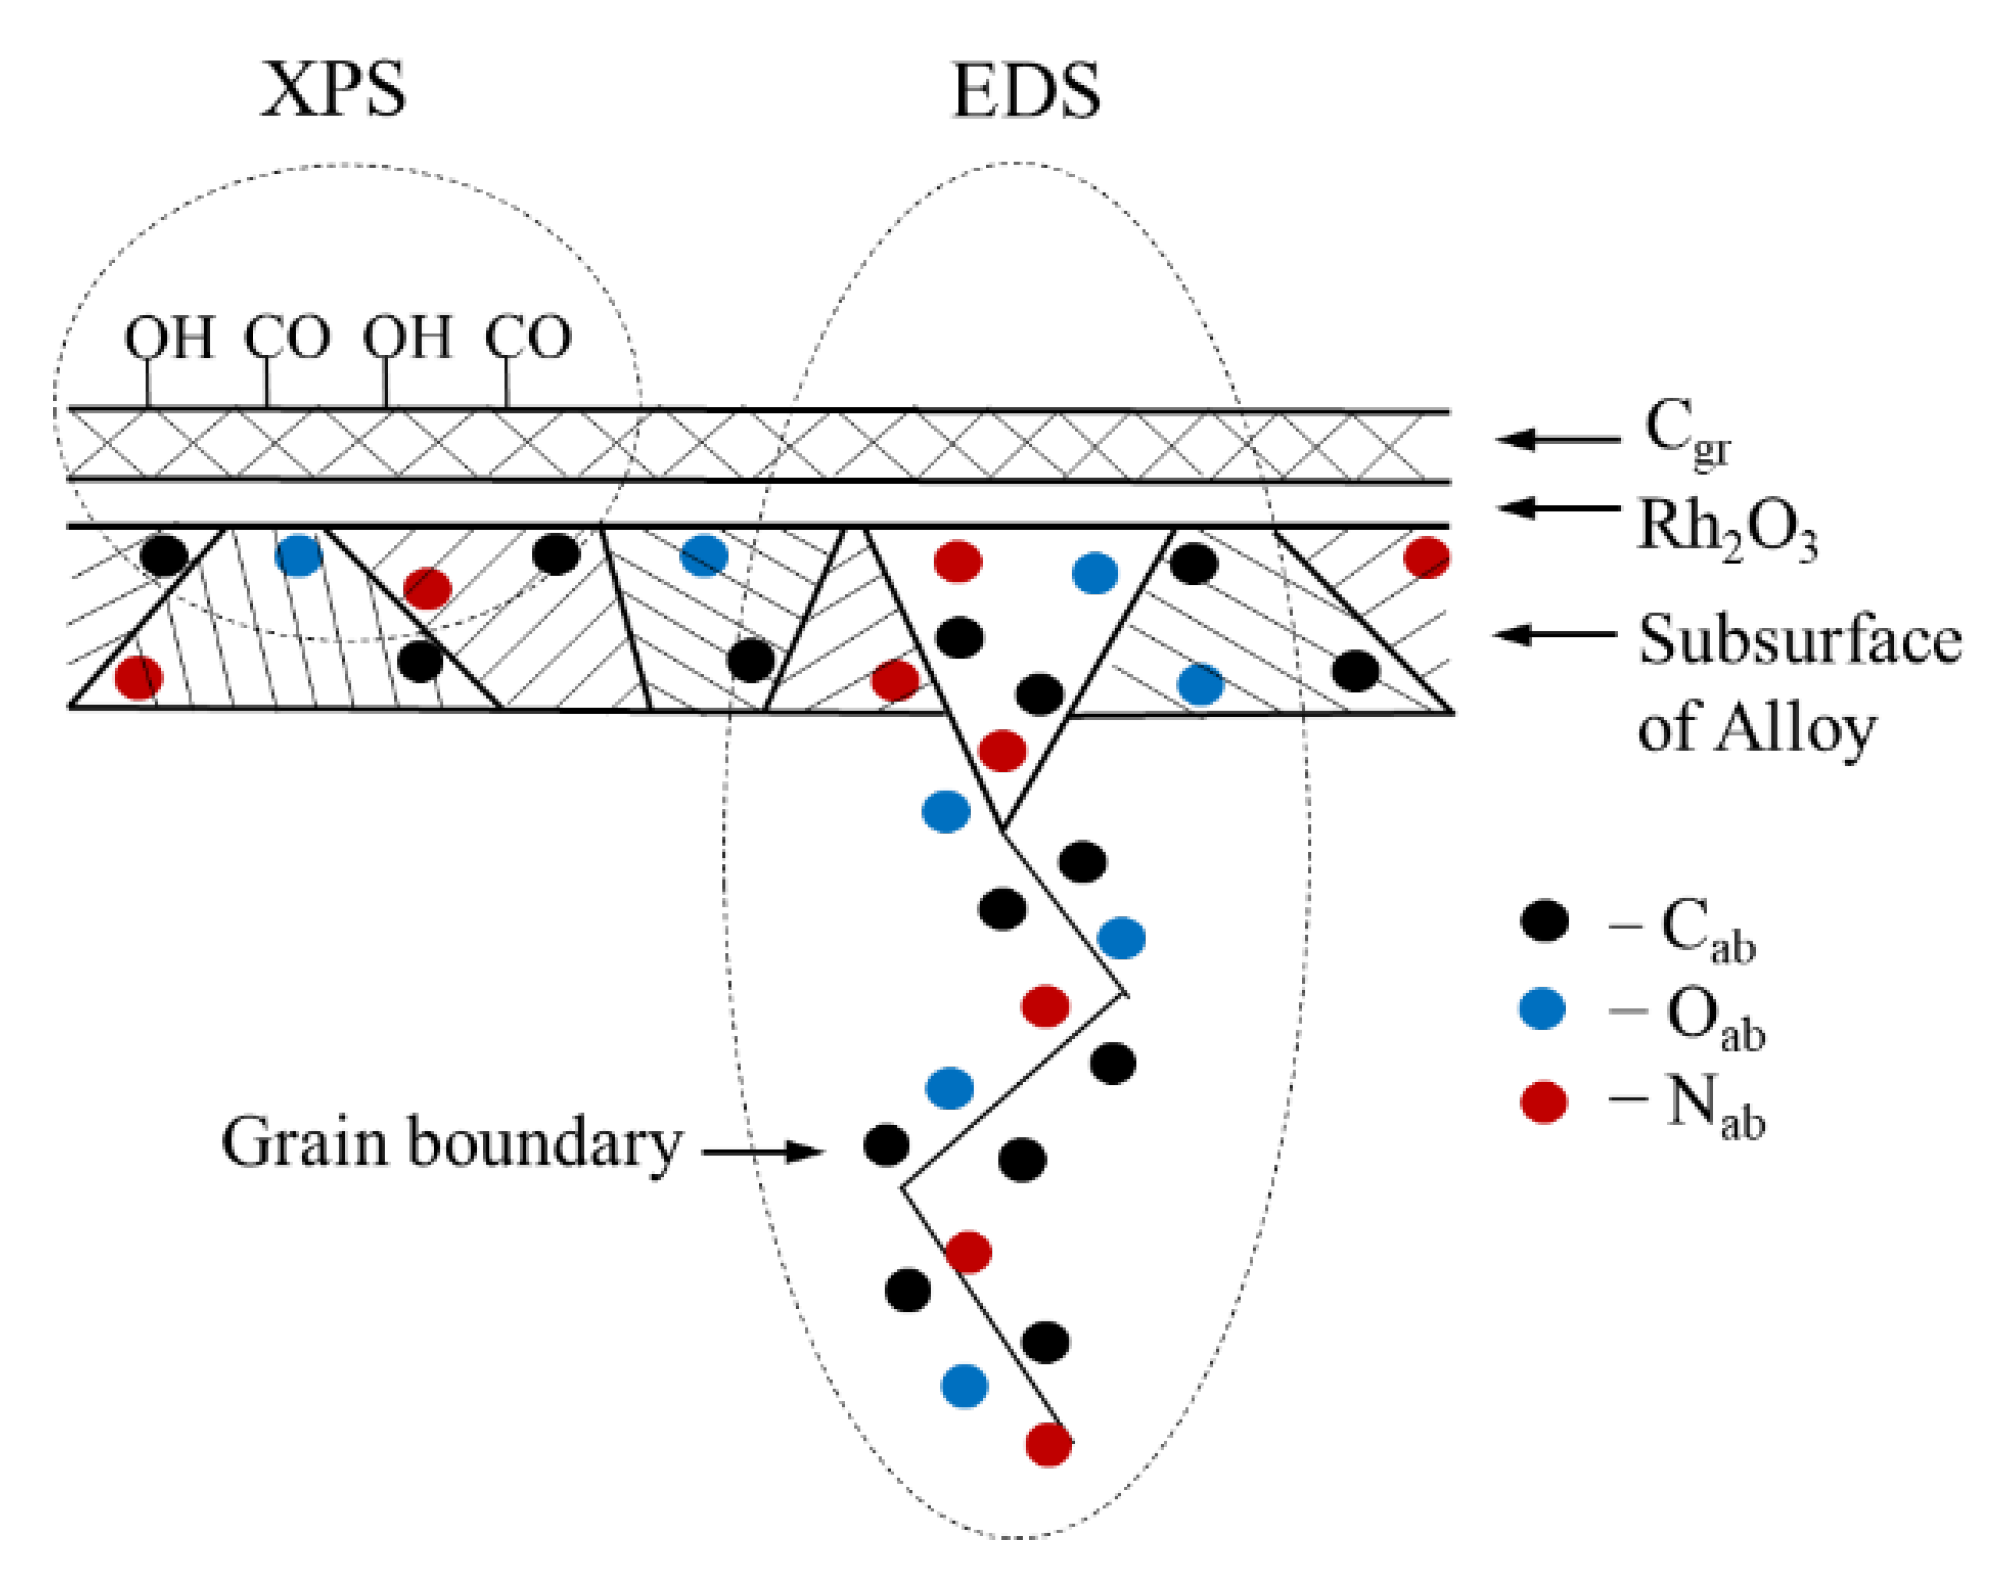
2.5. Chemical Composition of the Catalyst Surface under the Adsorption, Carbon and Oxide Films for Fresh and Spent Pt–Pd–Rh–Ru Gauzes according to XPS Data

Figure 6 displays a scheme of the surface and subsurface layers of the Pt–Pd–Rh–Ru alloy used in the oxidation of NH3. The surface adsorption layer (OHad, COad) as well as the graphitic carbon and oxide films (Cgr, Rh2O3) are indicated on the scheme. In addition, the scheme also shows the Cab, Oab and Nab atoms absorbed on grain boundaries and other defects in the subsurface layer of metallic alloy. Dotted ellipses indicate relative depths of analysis by XPS (ca. 5 nm) and EDS (ca. 500 nm). Moreover, these methods were shown to exert different effects on the adsorption layer (OHad, COad). XPS produced virtually no effect, whereas EDS led to complete destruction of the layer. The surface films (OHad, COad, Cgr, Rh2O3 and SiO2) that were observed on the Pt–Pd–Rh–Ru gauzes examined in this study were formed mostly after the oxidation of NH3 upon cooling the reactor and in air, when the sample was transferred from the reactor to the microscope and spectrometer.
With such films, quantitative analysis of the composition may give a significant deviation of the obtained surface concentrations of elements from their real content. It becomes difficult to estimate the concentrations of elements on the catalyst surface. This suggests that the measured composition of Pt–Pd–Rh–Ru gauzes with the surface films emerging after NH3 oxidation will differ essentially from the surface composition of the catalyst that forms during the oxidation of NH3. In this context, it seems interesting to estimate the surface composition of gauzes under the revealed surface films (OHad, COad, Cgr, Rh2O3 and SiO2; Figure 6). Under these films, the concentrations of elements (Pt0, Pd0, Rh0, Cab, Oab, Nab) in the surface layer of gauzes were calculated from the obtained XPS data, taking into account the XPS peaks resolved by deconvolution of spectra and the stoichiometry of Rh2O3 oxide (Figure 4 and Table 1).
Table 1 lists XPS data on the concentrations of elements in a ca. 5 nm-thick surface layer on the new Pt–Pd–Rh–Ru gauze and both sides (back and frontal) of the spent gauze. All the detected Pt (4.6, 4.9, 4.1 at.%) and Pd (2.4, 1.9, 1.5 at.%) atoms as well as a part of Rh (0.1, 0.4 and 0.4 at.%) atoms entered the composition of the metallic alloy (Table 1b,d,f). These data testified to the presence of metallic alloy (Pt0, Pd0 and Rh0) on the surface of gauzes under the surface films (OHad, COad, Cgr, Rh2O3 and SiO2).
For all the tested gauzes, C1s spectra, along with the intense peaks with Eb = 285.1–285.4 eV corresponding to Cgr film, at high Eb values (286.1–287.6 eV) contained low-intensity XPS peaks. Deconvolution of C1s spectra gave the intense peaks with Eb = 285.4, 285.1, 285.1 eV and the low-intensity peaks with Eb = 286.1, 287.6, 287.3 eV for the new gauze and both sides of the used gauze, respectively. For all the gauzes, C1s peaks obtained with Eb ≥ 286.1 eV for carbon atoms in the concentrations of 8.8, 10.5 and 10.4 at.% (Table 1b,d,f) could be attributed to the absorbed carbon atoms (Cab) and C atoms in the composition of (C–O)ab and (C–N)ab on the surface and in subsurface layers of the alloy under the revealed surface films. Cab atoms can reside on such defects as dislocations and grain boundaries (Figure 6). Unfortunately, it was impossible to separate the peaks corresponding to Cab, (C–O)ab and (C–N)ab; so the concentration of Cab was estimated from C1s peaks with Eb = 286.1, 287.6 and 287.3 eV. As a result, C atoms in the concentrations of 8.8, 10.5 and 10.4 at.% for the fresh and spent gauzes, respectively (Table 1b,d,f), were attributed to the absorbed carbon atoms (Cab) under the surface films in metallic alloy. It should be noted that according to AES data for Pt–Pd–Rh gauzes, carbon was detected on the surface and in subsurface layers at a depth of 4 and 12 nm in the concentrations of 45.8, 7.9 and 4.1 at.% on the new gauze and 58.2, 29.1 and 12.4 at.% on the spent one, respectively [11]. The data obtained in this work at a depth of 4 and 12 nm satisfactorily agreed with our estimates of the Cab concentrations in metallic alloy of the Pt–Pd–Rh–Ru gauze under the surface films.
For all the gauzes under consideration, O1s spectra, along with intense peaks with Eb = 532.2–532.5 eV corresponding to OHad, COad and SiO2, at lower Eb values (529.9–530.2 eV) contained XPS peaks (Figure 4b,e,h) that were assigned to the O2− state in the surface film of Rh2O3 oxide. In addition, this oxygen could be assigned to the atoms chemisorbed on the surface (Oad) or penetrated on dislocations and grain boundaries (Oab) in the metallic alloy under the surface films, because in metal oxides and in the chemisorbed state, Eb for oxygen is ≤531.0 eV [25]. Hence, oxygen in the concentrations of 5.3, 6.2 and 3.5 at.% (Table 1b,d,f) may have included O2− in the Rh2O3 oxide film and Oab atoms on defects in subsurface layers of the catalyst. Taking into account oxygen in Rh2O3 oxide for the back and frontal sides of the used gauze (0.6 and 0.6 at.%), their Oab concentrations became equal to 5.6 and 2.9 at.%. For the new gauze, thick surface oxide and carbon films shielded the metallic alloy, which made it difficult to measure the Oab concentration in its surface layer. In this context, the Oab concentration in the surface metallic alloy of the new gauze was taken to be equal to the average value obtained for both sides of the spent gauze (4.3 at.%). Thus, the O atoms in the concentrations of 4.3, 5.6 and 2.9 at.% were attributed to the absorbed oxygen atoms on defects (Oab) in the metallic alloy under the surface films. In [27], the accumulation of 5–10 at.% oxygen atoms on grain boundaries and other defects of Pt(poly) were observed at T = 600–1400 K and Po2~2 × 10⁴ Pa; dissolution of O atoms in the platinum lattice was not observed. Thus, it can be accepted that O atoms do not dissolve in the lattice of the alloy with the predominant content of Pt, which was examined in our study; these atoms are accumulated mostly on such defects as dislocations and grain boundaries. Moreover, it should be noted that the obtained Oab concentrations were consistent with the data acquired on Pt–Pd–Rh gauzes [11]. According to AES data, the O concentrations on the surface and in subsurface layers of the gauzes at depths of 4 and 12 nm were equal to 17.2, 9.8 and 3.4 at.% for the new gauze, and 5.7, 8.0 and 6.1 at.% for the spent gauze, respectively.
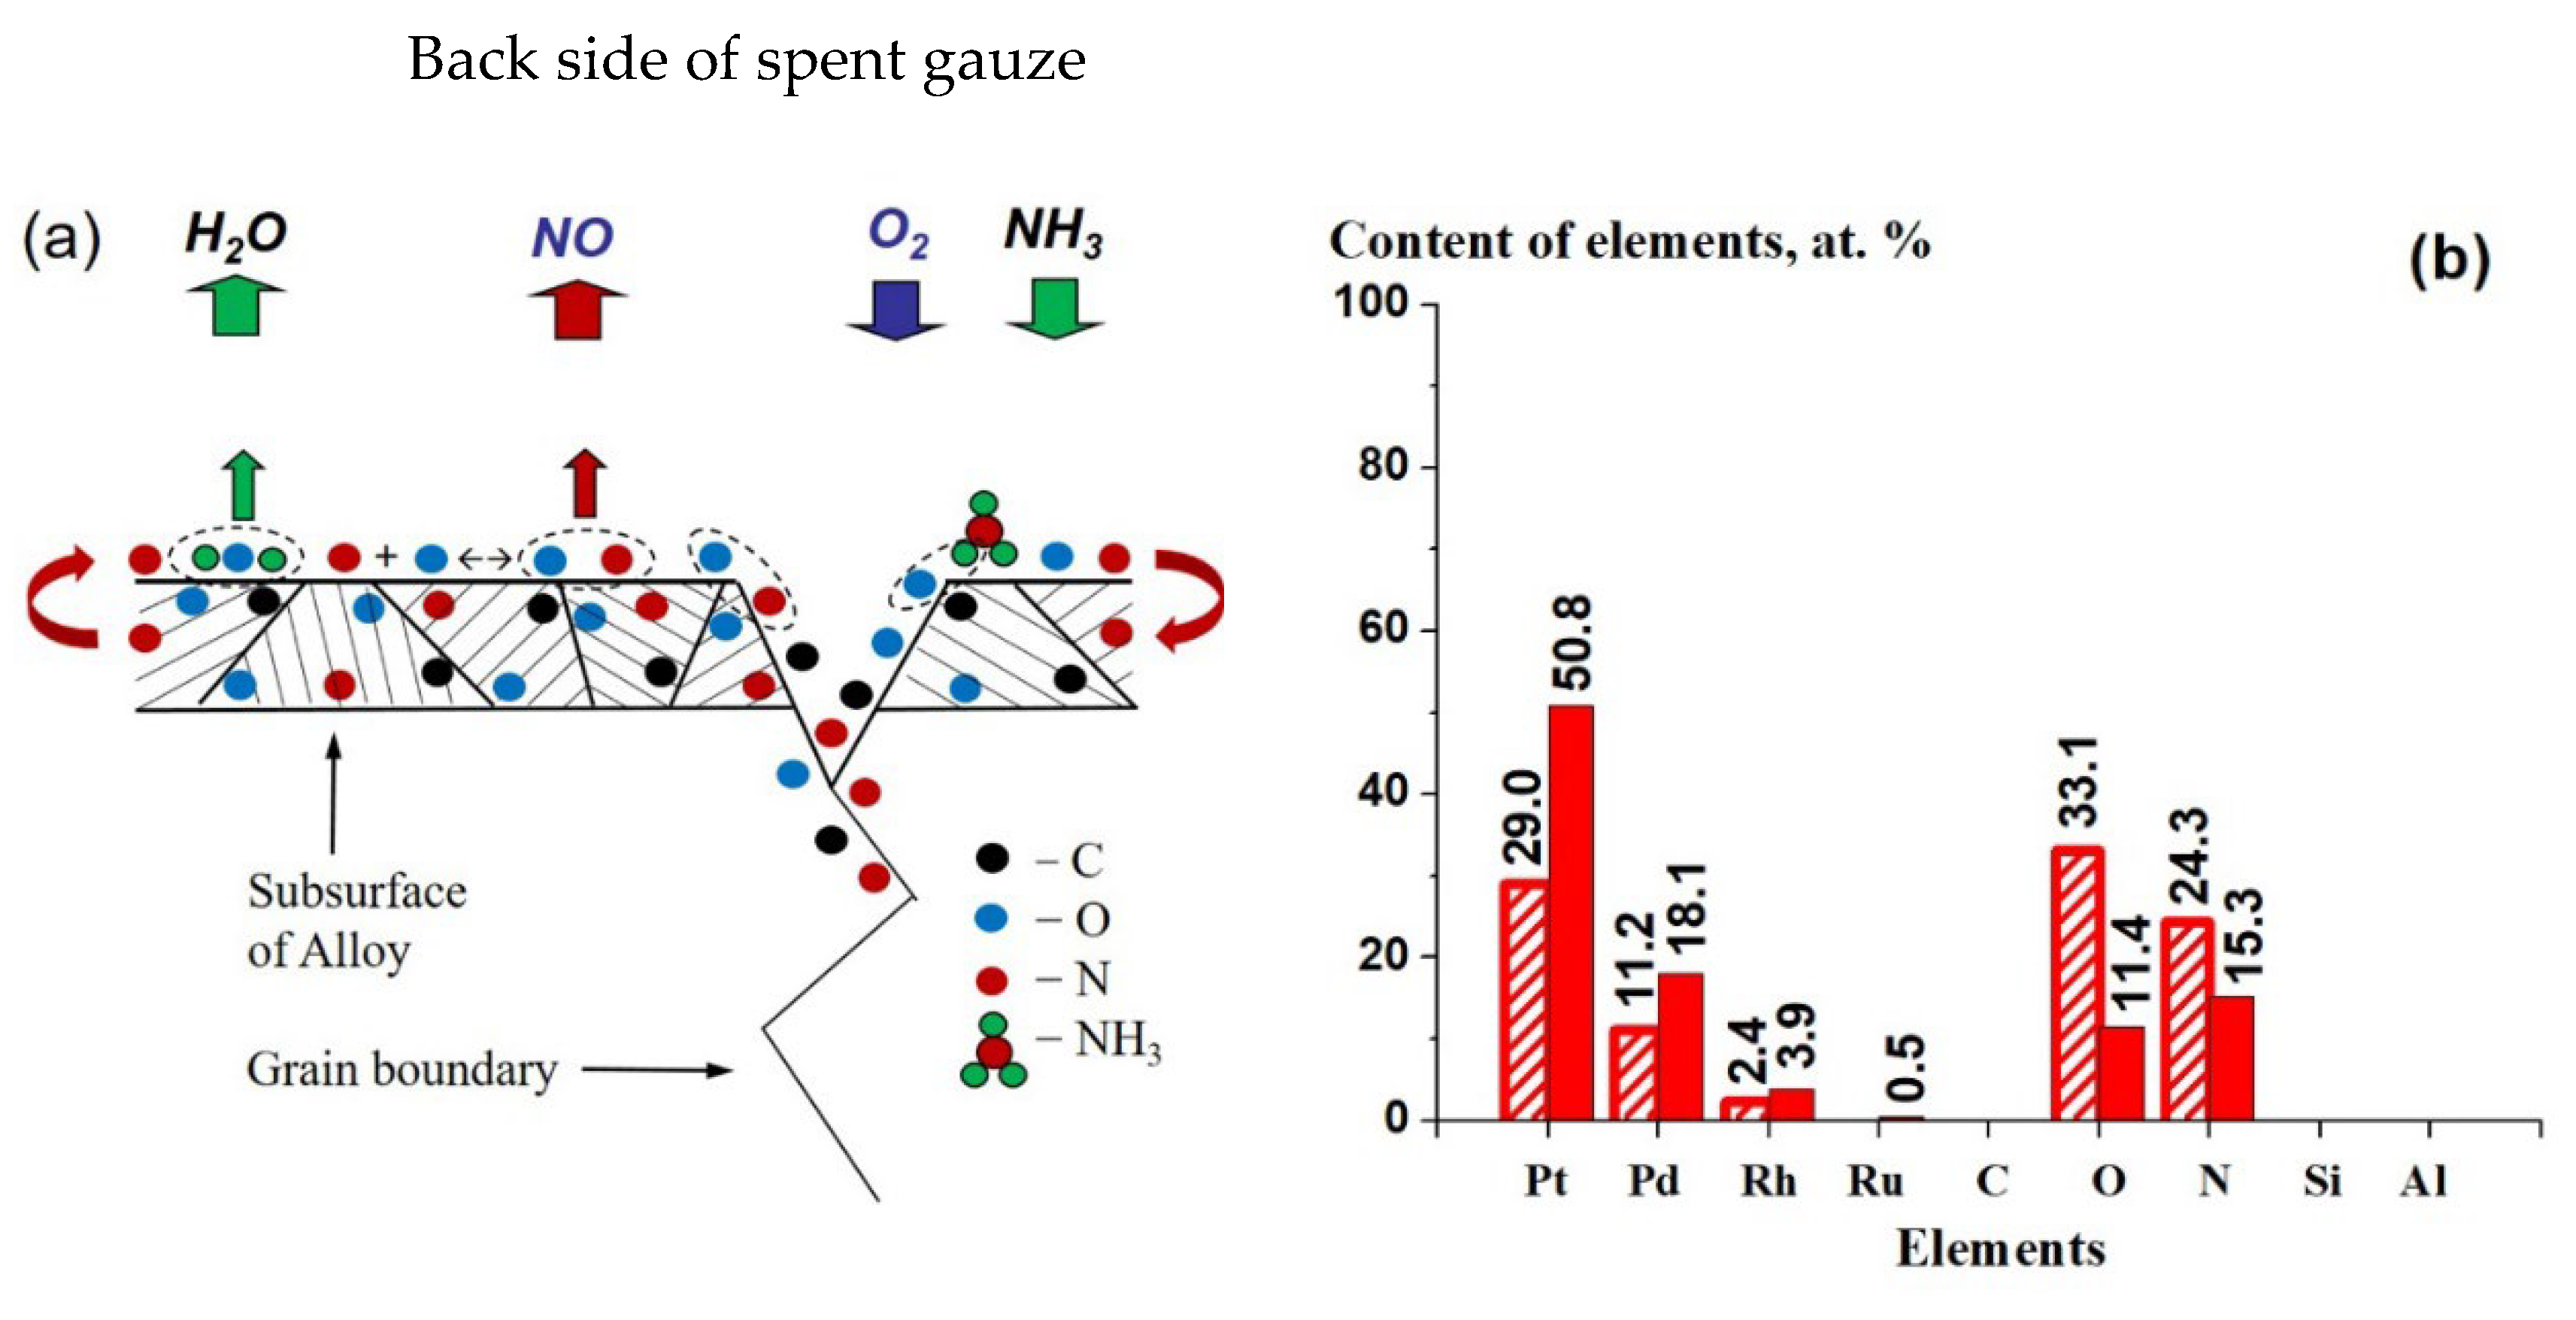
On both sides of the gauze used in NH3 oxidation, nitrogen detected in the concentrations of 4.1 and 2.1 at.% (Figure 5e,i) was characterized by two XPS peaks with Eb equal to 397.8–398.5 eV and 399.7–400.0 eV (Figure 4f,i), respectively. On the new gauze, nitrogen was detected at the noise level (Figure 4c). The obtained N1s peaks could be attributed to nitrogen atoms, particularly in nitrides of the employed metals in the concentrations of 0.2 and 0.8 at.% and in the composition of (C–N), (NHX) and (N–O) groups—3.9 and 1.3 at.%, respectively (Table 1d,f), since the obtained Eb values for the peaks correspond to such compounds [13,25]. Taking into account close Eb values for these states, nitrogen in the concentrations of 4.1 and 2.1 at.% was assigned to the absorbed nitrogen atoms (Nab) in metallic alloy under the surface films on the back and frontal sides of the spent gauze, respectively. During the oxidation of NH3, Nad atoms could penetrate on the defects, gradually accumulate in the surface layers of metallic alloy and form bonds both with metal atoms and with Cab and Oab. It should be noted that the obtained N concentrations on the Pt–Pd–Rh–Ru gauzes were close to the values for gauzes 2, 16, 31 and 36 in a pack of 36 Pt–10 wt.% Rh gauzes after NH3 oxidation in an industrial reactor [9]. According to XPS data, on these gauzes the concentrations of N were equal to 5.4, 2.0, 4.2 and 2.8 at.%, respectively.
The obtained data on the concentrations of metal atoms in the alloy (Pt0, Pd0, Rh0) and absorbed atoms (Cab, Oab, Nab) in such alloy under the surface films were used to calculate new values of the relative concentrations for Pt0, Pd0, Rh0, Cab, Oab and Nab elements on the gauze surface. After excluding the surface films (OHad, COad, Cgr, Rh2O3 and SiO2) (Figure 6) from the calculation, the following concentrations of elements (at.%) in the metallic alloy were obtained: for the new gauze—Pt0 (4.6), Pd0 (2.4), Rh0 (0.1), Cab (8.8), Oab (4.3), Nab (0.0); for the back and frontal sides of the spent gauze—4.9, 1.9, 0.4, 10.5, 5.6, 4.1 and 4.1, 1.5, 0.4, 10.4, 2.9, 2.1, respectively. New values of the relative concentrations of elements under the surface films were calculated from the indicated data (Figure 5b,f,j). For both sides of the used gauze, the concentrations of Cab, Oab and Nab were equal to 38.3, 20.4 and 15.0, and 48.5, 13.6 and 9.8 at.%, respectively (Figure 5f,j). According to AES data, on the fresh Pt–Pd–Rh gauze and on the gauze after the operation in NH3 oxidation, the surface concentrations of C were equal to 45.8 and 58.2 at.%, respectively [11]; these values agreed with the data obtained in our study (Figure 5a,e,i). For the spent gauze, the concentrations of C and O in the subsurface layer at a depth of 4 nm was 29.1 and 8.0 at.%, respectively [11]. These values were somewhat lower than the concentrations obtained in our study under the surface films on the spent gauze (Figure 5f,j). Note that in [11] the effect of the carbon film on the obtained concentrations of elements was not considered; in addition, nitrogen was not detected in it. It seems interesting also that EDS revealed a considerable deviation in the calculated concentrations of C that were obtained on different surface regions of these gauzes (see below). This may have led to a significant deviation of the obtained concentrations of other elements from their real content in the surface layer of the catalyst. Thus, to estimate the concentrations of elements under the surface films, carbon was completely excluded from the list of detected elements. New values of the relative concentrations of elements were derived from the data of Figure 5b,f,j after excluding Cab from the calculation (Figure 5c,g,k). For the back and frontal sides of the spent gauze, the concentrations of Oab and Nab in the metallic alloy without Cab atoms under the surface films were equal to 33.1 and 24.3, and 26.4 and 19.1 at.%, respectively (Figure 5g,k).
Using the data of Figure 5c,g,k and excluding Oab and Nab from the calculation, new values of the relative concentrations of metals under surface films were obtained (Figure 5d,h,l). For the new gauze, we observed a minor decrease in the content of Pt0 (64.8 at.%), a noticeable excess of Pd0 (33.8 at.%), and a considerable deficit of Rh0 (1.4 at.%) in comparison with both sides of the gauze used in NH3 oxidation, for which Pt had concentrations of 68.1 and 68.3 at.%, Pd—26.4 and 25.0 at.% and Rh—5.5 and 6.7 at.%, respectively (Figure 5d,h,l). Presumably, during the pretreatment of new gauzes, Rh0 atoms migrate from subsurface layers to the surface, while Pd0 atoms are segregated from deeper layers of the alloy to subsurface layers. The formation of a thick surface Rh2O3 oxide film is accompanied by depletion with rhodium and enrichment with palladium of the subsurface layer of metallic alloy under the oxide film. For both sides of the used gauze, the surface content of Pt0, Pd0 and Rh0 (Figure 5h,l) virtually coincided with each other and with the data provided by the manufacturer: Pt (69.8), Pd (23.7) and Rh (5.7 at.%).
Thus, the surface composition of Pt–Pd–Rh–Ru gauzes under the surface films (OHad, COad, Cgr, Rh2O3 and SiO2) was estimated from XPS data with a ca. 5 nm depth of analysis. For the spent gauze, a metallic alloy with the composition close to that claimed by the gauze manufacturer was found under such films. The metallic alloy contained Cab, Oab and Nab atoms absorbed on dislocations, grain boundaries and others; their concentrations were 38.3, 20.4 and 15.0 at.% on the back side and 48.5, 13.6 and 9.8 at.% on the frontal side of the spent gauze, respectively. After excluding Cab from the calculation, the concentrations of Oab and Nab in the alloy increased and became equal to 33.1 and 24.3 at.%, and 26.4 and 19.1 at.% on both sides, respectively. These data testified to higher concentrations of Oab atoms as compared to Nab in surface layers of the metallic alloy under the surface films. Data on the catalyst surface composition under the surface films obtained by XPS with the analysis depth of ca. 5 nm were used for comparison with the composition of the catalyst subsurface layers estimated by EDS with the analysis depth of ca. 500 nm.

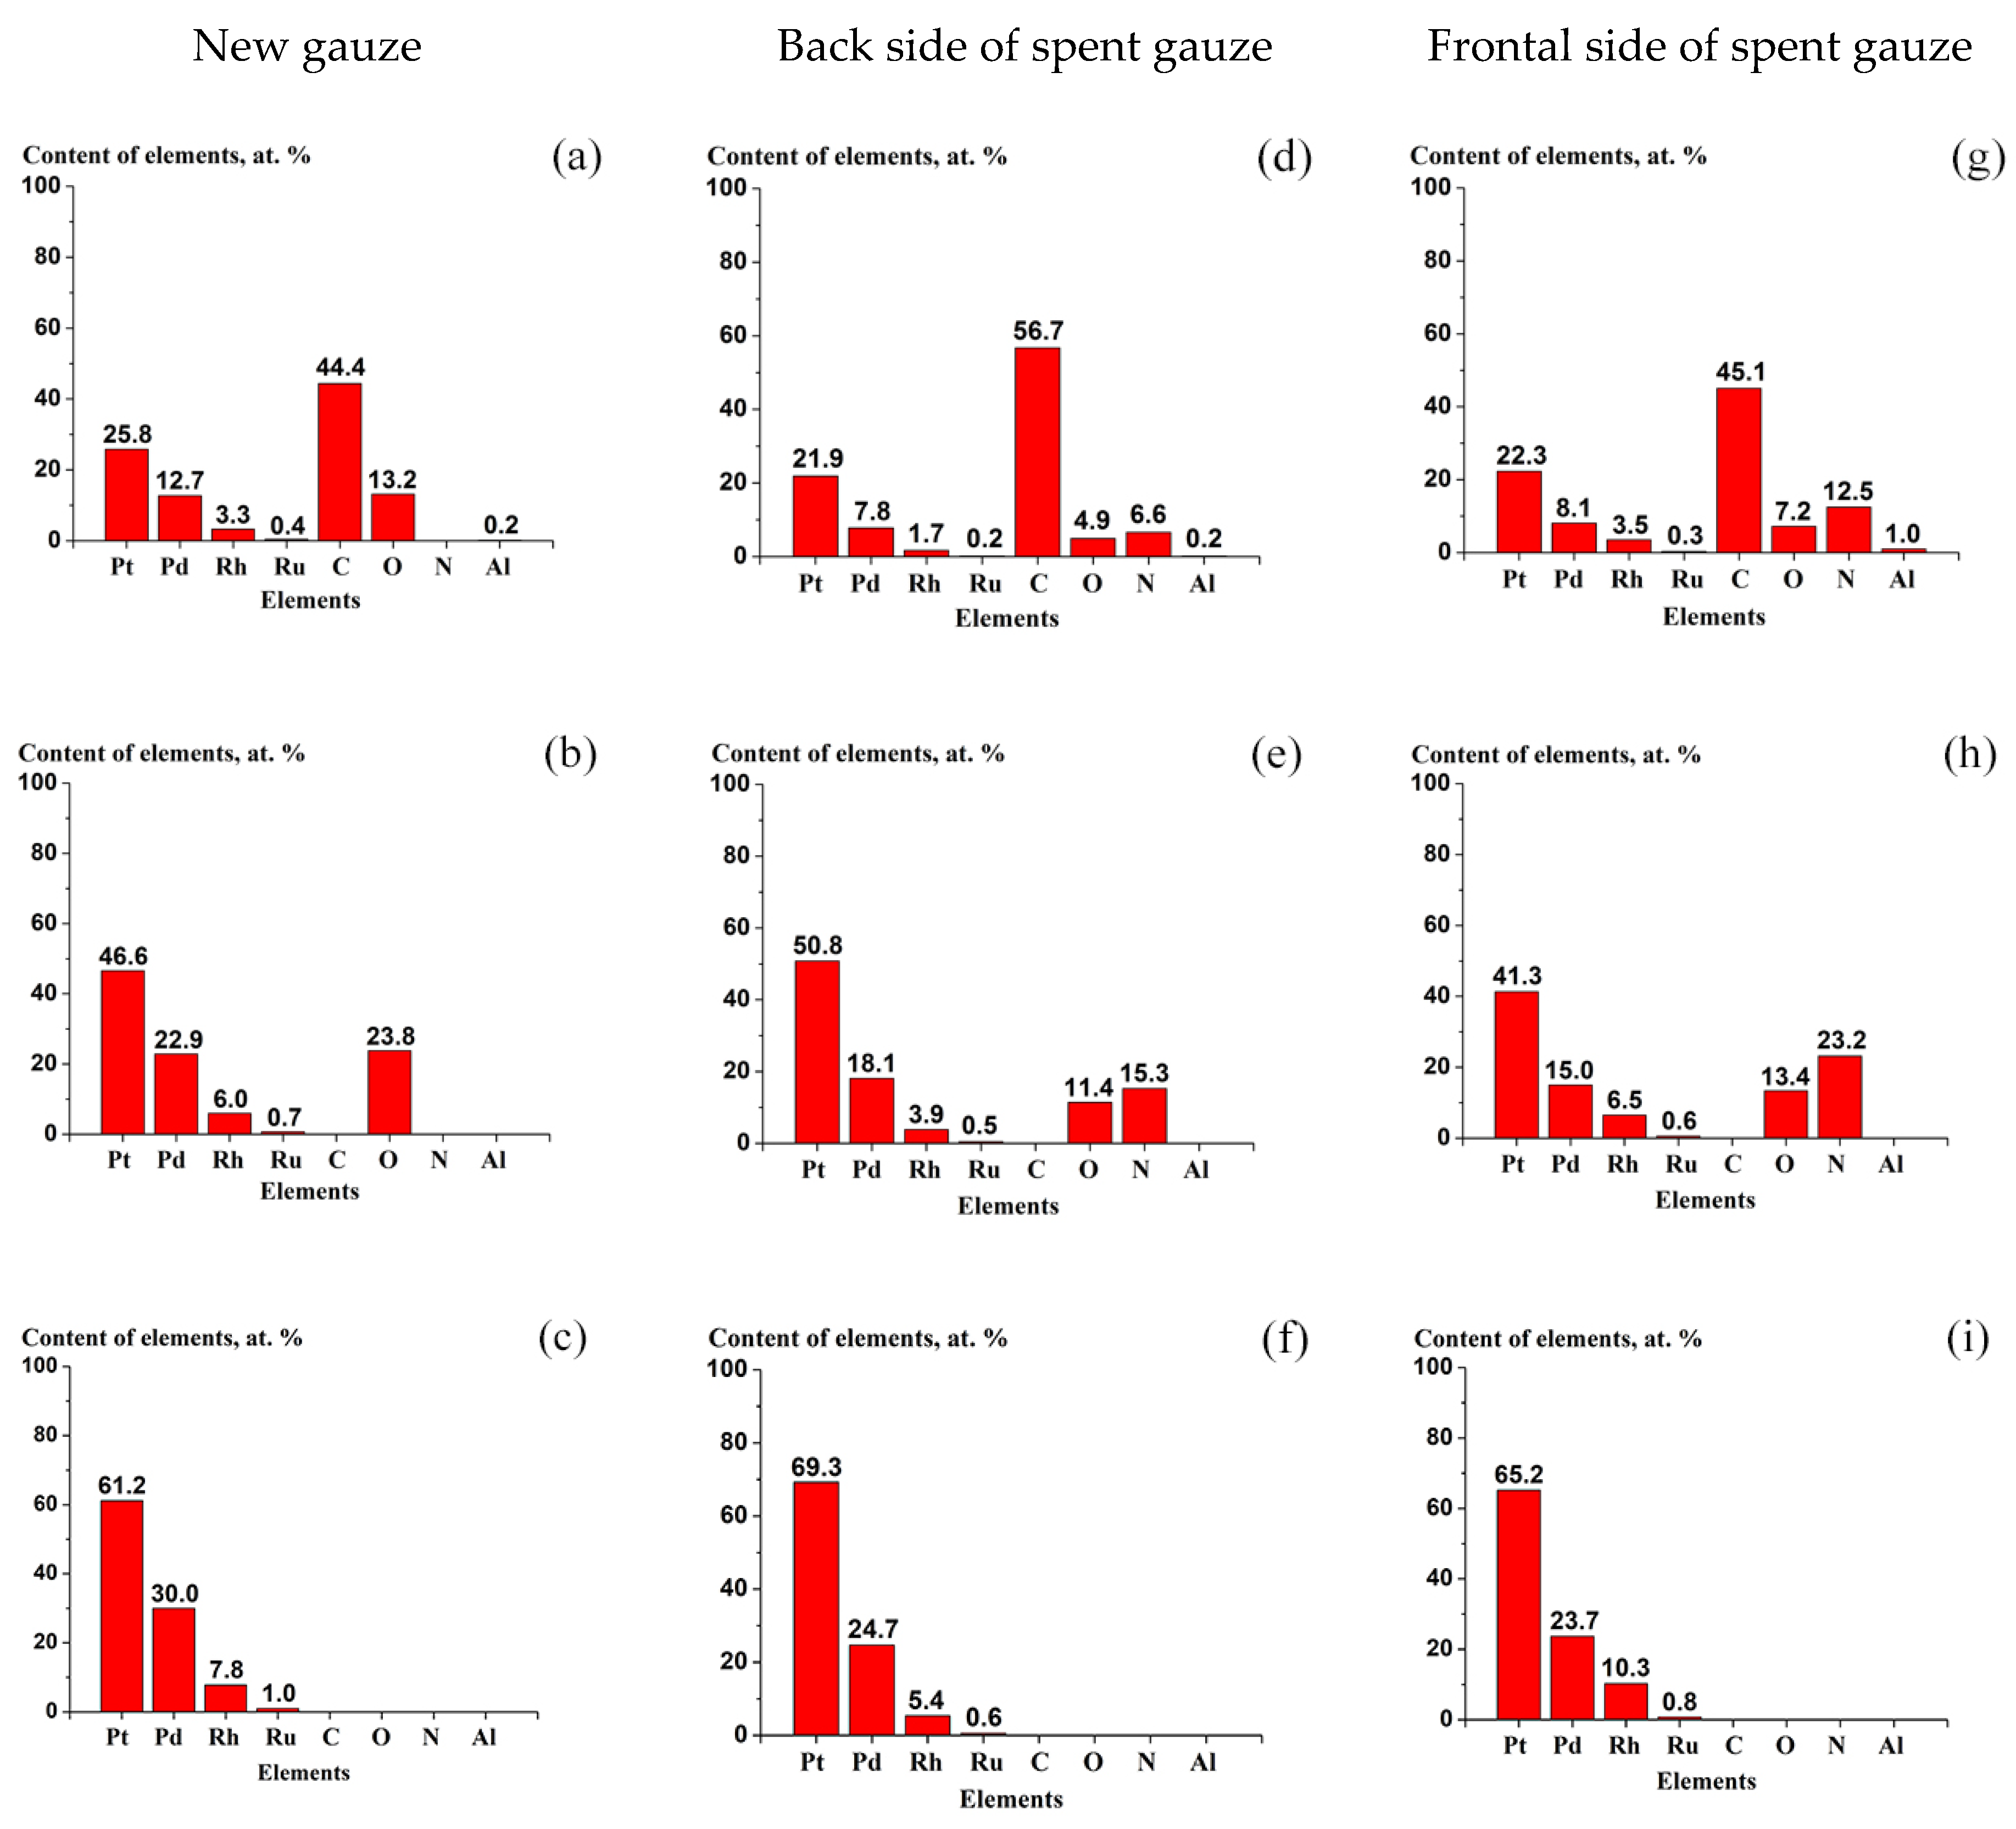
2.6. Chemical Composition of Subsurface Layers of the Fresh and Spent Pt–Pd–Rh–Ru Gauzes according to EDS Data

The EDS method was used to determine the elemental composition of subsurface layers of the wire (to a depth up to ca. 500 nm) for the new Pt–Pd–Rh–Ru gauze and both (back and frontal) sides of the gauze after its operation in the oxidation of NH3 at 1133 K. On all the gauzes, the elemental composition of the subsurface layer was estimated using the wire fragments with a length of ca. 800 µm in three rectangular regions with sizes of 60 × 200 µm. On all the gauzes, Pt, Pd, Rh, Ru, C, O and Al elements were detected; in addition, N was detected on both sides of the spent gauze. On all the gauzes, the concentrations of Al and C widely varied from one region to another, for example, on the frontal side, from 0.5 to 1.3 at.% for Al (the average value of ca. 1.0 at.%), and from 24.4 to 61.9 at.% for C (ca. 45.1 at.%), respectively. Concentrations of other elements in these regions differed from each other to a smaller extent. The average Al and C concentrations on the new gauze and both sides of the used gauze were equal to 0.2, 0.2 and 1.0 at.% for Al and 44.4, 56.7 and 45.1 at.% for C, respectively.
Table 2 lists the average concentrations of elements calculated from EDS measurements on the frontal side (a,b) and according to the data provided by the manufacturer (c). Table 2 indicates the concentrations of all the detected elements (a) and the relative concentrations of metals calculated after exclusion of C, O, N and Al from the list of detected elements (b).
The obtained average concentrations of all the detected elements showed increased concentrations for C (45.1 at.%) and Pt (22.3 at.%) and much lower values for other elements (<12.5 at.%) (Table 2a). After excluding C, O, N and Al from the list of elements, the obtained content of metals (Table 2b) generally approached the bulk composition of the alloy claimed by the manufacturer (Table 2c). An increased concentration of Rh in the tested gauze (10.6 at.%) as compared to the manufacturer data (5.7 at.%) may have resulted from rhodium accumulation in the subsurface layers of the wire during the oxidation of NH3. In [8,9,10], on Pt–Rh gauzes used in the industrial oxidation of NH3, the surface concentration of Rh measured by XPS was higher than its bulk concentration.
According to EDS measurements of the concentrations of elements, Figure 7 shows the content of elements on the fresh Pt–Pd–Rh–Ru gauze (a,b,c) and also on the back (d,e,f) and frontal (g,h,i) sides of the gauze after NH3 oxidation. Figure 7a,d,g indicate the concentrations of all the detected elements on these gauzes.
Figure 7a,d,g show a low content of Ru (0.4, 0.2 and 0.3 at.%) and Al (0.2, 0.2 and 1.0 at.%) for all the gauzes. Ru had a low concentration in the alloy (0.8 at.%, Table 2c) and may have been distributed non-uniformly over the wire volume; small amounts of Al may have appeared in the wire during its production. The detected metals (Pt, Pd, Rh) generally had close concentrations in the tested gauzes: Pt—25.8, 21.9, 22.3 at.%; Pd—12.7, 7.8, 8.1 at.%; and Rh—3.3, 1.7, 3.5 at.%, respectively (Figure 7a,d,g). Only an increased content of Pd was observed on the new gauze (12.7 at.%) in comparison with both sides of the spent gauze (7.8 and 8.1 at.%). For oxygen detected on all the gauzes, the concentration was slightly higher on the fresh gauze (13.2 at.%) than on both sides (4.9 and 7.2 at.%), respectively (Figure 7a,d,g). Taking into account XPS data (see above), a part of the detected oxygen could enter the composition of Rh2O3 oxide film on the surface of metallic alloy. According to XPS data, the oxide film had a much greater thickness on the new gauze as compared to both sides of the used gauze. In this context, the increased concentration of oxygen revealed by EDS on the new gauze may have been associated with the oxide film on the alloy surface. In addition, according to XPS data, a part of the oxygen atoms resided on defects in the subsurface layer of the alloy (Oab). A quite close content of carbon (44.4, 56.7, 45.1 at.%) was observed for all the gauzes (Figure 7a,d,g). These data indicated the presence of the graphitic carbon film (Cgr) revealed by XPS, which was formed on the surface of oxide film when samples were transferred in air from the reactor to the microscope (Figure 6). The adsorbed layer of OHad and COad on the carbon film surface, which was detected by XPS, decomposed to a great extent under the action of the microscope probe electrons, so oxygen in the adsorbed molecules was not detected by EDS. Nitrogen was detected on both sides of the gauze after NH3 oxidation in the concentrations of 6.6 and 12.5 at.% (Figure 7d,g), whereas on the fresh gauze, N was not detected (Figure 7a). This testified to penetration of N atoms in the subsurface layer of the wire during NH3 oxidation. It should be noted also that the elements detected by EDS included all states of these elements. The C atoms detected by EDS entered the composition of graphitic film (Cgr) and resided on defects in subsurface layers of carbon (Cab), and the detected O atoms were present in Rh2O3 oxide and in Oab atoms absorbed on defects. In this context, EDS data could not be used to estimate the concentrations of Cab and Oab in subsurface layers of the alloy separately from Cgr and Rh2O3.
The concentrations of Pt, Pd, Rh, Ru and Oab, as well as Nab, in subsurface layers of the alloy were also calculated from EDS data taking into account the surface films (OHad, COad, Cgr, Rh2O3) detected earlier by XPS (Figure 6). The adsorbed layer (OHad and COad) decomposed under the action of the microscope probe electrons, so its effect on the concentrations of elements on the gauze surface was negligible. The Rh2O3 surface oxide film had a small thickness, especially for the spent gauze (<2 nm), because it had low concentrations of oxygen (4.9 and 7.2 at.% (Figure 7d,g)). The depth of EDS analysis (ca. 500 nm) suggested that such a film could exert only a slight effect on the concentrations of elements measured by EDS. In this context, the oxide film was not taken into account when estimating the concentrations of elements in subsurface region of the catalyst. Thus, the obtained concentrations of oxygen (13.2, 4.9 and 7.2 at.% (Figure 7a,d,g)) were attributed to the O atoms absorbed on defects in subsurface layers of the gauzes (Oab). Graphitic carbon film (Cgr) on the alloy surface strongly affected the results of quantitative analysis of elements because high concentrations of carbon were observed on all the gauzes (44.4, 56.7, 45.1 at.%) (Figure 7a,d,g). Moreover, carbon could additionally accumulate on the surface of this film upon recording the EDS spectra. Note also that quantitative determination of the carbon content with the use of EDS spectra for the tested alloy was hindered by the overlapping of the C Kα1,2 and Mζ peaks for Pd, Rh and Ru used for quantitative analysis. The above listed factors produced considerable deviations in the C concentrations calculated using EDS data from the real content of carbon in the catalyst. This may have exerted a considerable effect on the measured concentrations of other elements. Thus, for quantitative analysis of elements, carbon as the component of Cgr and Cab was excluded from the list of detected elements.
New values of the relative concentrations of Pt, Pd, Rh, Ru, O and N were calculated from the data of Figure 7a,d,g after excluding C and Al. Figure 7b,e,h indicate the obtained concentrations of these elements. In the metallic alloy, Oab and Nab atoms absorbed in the subsurface layer had concentrations of 11.4 and 15.3 at.% on the back side and 13.4 and 23.2 at.% on the frontal side of the spent gauze, respectively (
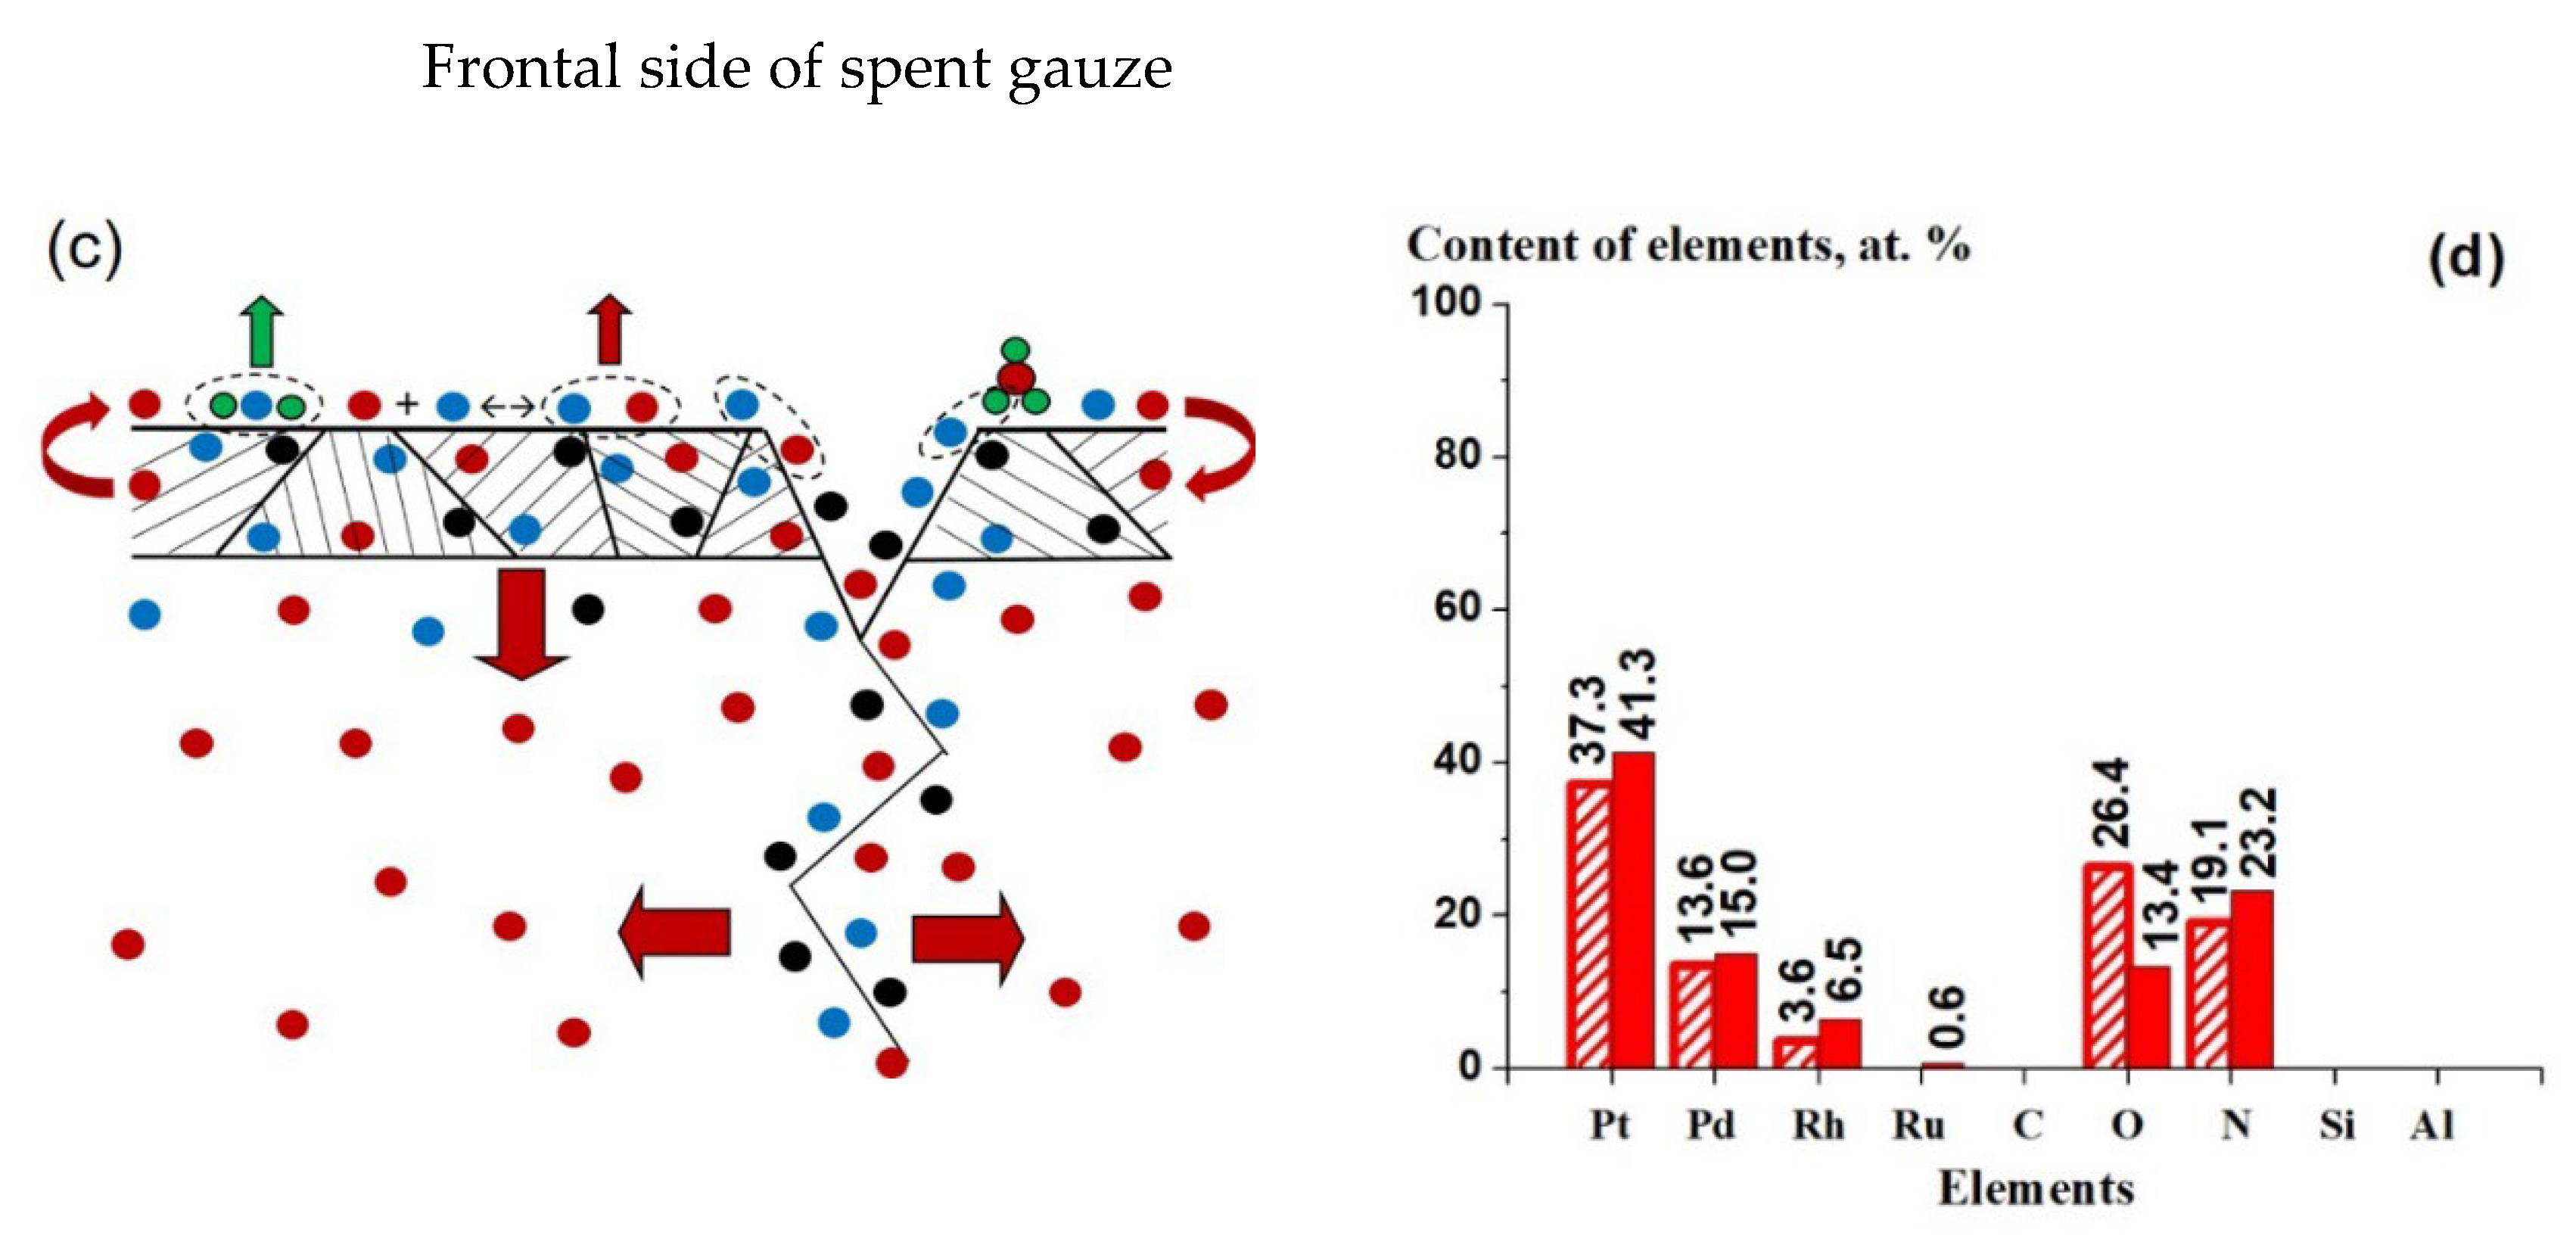
Figure 7e,h). Note that the obtained concentration of N was somewhat higher than that for oxygen; this was most pronounced on the frontal side, for which the N/O ratio was equal to 1.73. This may testify that in comparison with oxygen, N atoms dissolve more intensely in the subsurface layer of metallic alloy during the oxidation of NH3 on both sides of the gauze. Taking into account that EDS detects all of the oxygen, particularly that in the oxide film and Oab, an excess of Nab with respect to Oab may be even greater. Thus, for the frontal side, the N/O ratio may reach ca. 2.0 and even higher values. Relative concentrations of Pt, Pd, Rh and Ru metals were obtained from the data of Figure 7b,e,h after excluding O and N from the calculation (Figure 7c,f,i). For the new gauze, an excess of Pd (30.0 at.%) over the gauze manufacturer data (23.7 at.%, Table 2c) was found. For the back side, the obtained concentrations of metals were close to the contents of these elements claimed by the manufacturer: Pt (69.8), Pd (23.7), Rh (5.7) and Ru (0.8 at.%) (Table 2c). For the frontal side, an increased content of Rh (10.3 at.%) in comparison with the manufacturer data (5.7 at.%) was obtained. The accumulation of Rh in subsurface layers of the alloy may have been related to the temperature elevation due to the more intense oxidation of NH3 on the frontal side of the gauze as compared to its back side. On Pt–Rh gauzes used in the industrial oxidation of NH3, the surface concentration of Rh was higher than its concentration in the bulk [8,9,10].
Thus, EDS with the analysis depth of ca. 500 nm was used to obtain data on the composition of subsurface layers of Pt–Pd–Rh–Ru gauzes taking into account the surface films (Cgr and Rh2O3). After the exclusion of C and Al from the list of elements under consideration, the concentrations of Oab and Nab atoms absorbed in the subsurface region of the alloy became equal to 11.4 and 15.3 at.% on the back side and 13.4 and 23.2 at.% on the frontal side of the spent gauze, respectively. Close concentrations were obtained for Oab and Nab on the back side, while on the frontal side, the concentration of Nab exceeded nearly twofold that of Oab. This indicates a more intense dissolution of N atoms as compared to O in the subsurface region of metallic alloy on the frontal side, which had a higher temperature than the back side. The composition of metallic alloy for the back side coincided with the gauze manufacturer data, whereas for the frontal side, an excess of Rh was observed in comparison with the back side.

3. Discussion

To enhance the efficiency of catalysts for the industrial high-temperature oxidation of NH3 to NO, particular attention is paid now to the catalyst distribution in a pack using different types of gauzes (woven, knitted and other) made of binary and ternary alloys of platinum metals with different compositions [15,16,17]. A pack for NH3 oxidation, which contains three groups of Pt–Pd–Rh alloy warp knitted gauzes (upper, medium and lower along the gas flow) with a gradual decrease in Pt concentration and an increase in Pd ensures additional absorption of PtO2 by the lower gauzes after its entrainment with the flow from the upper gauzes [16]. Such a design of the pack decreases Pt losses during the oxidation of NH3 and increases the activity of the lower gauzes in the final step of catalyst operation. The oxidation of NH3 by oxygen on Pt alloy gauzes results in the formation of the surface etched layers having different morphologies (catalytic etching) [1,2,3,5,6,7,8,9,10,15,16,17,18,19,20,21,22]. To elucidate the effects of different factors, particularly the distribution of metals in a gauze pack, on the efficiency of catalysts for high-temperature oxidation of NH3, it is important to investigate the morphology, structure and chemical composition of the etched layers on catalytic gauzes [15,16,17].

3.1. Chemical Composition of the Surface of Pt and Pt Alloy Catalysts Used for NH3 Oxidation

The chemical composition of Pt alloy gauzes, particularly after their operation in the oxidation of NH3, was studied by XPS and AES methods possessing high surface sensitivity with the analysis depth ≤ 5 nm [8,9,10,11]. According to XPS data, Pt–Rh gauzes have an increased surface concentration of Rh compared to their bulk concentration and contain Rh2O3 oxide [8,9,10]. As the temperature of Pt/5(10) wt.% Rh gauzes and the reaction mixture pressure were increased, the surface concentration of Rh and the Rh/Pt ratio showed an essential growth [8]. At the reactor pressure of 1.0, 3.5–4.9 and 8.5 bar, the measured Rh/Pt values (at.%) were equal to 0.25, 1.0 and 2.2, respectively, whereas for the tested alloys, the Rh/Pt values (at.%) in the bulk were much lower at 0.1 and 0.2, respectively. For gauzes 1, 4 and 8 in the pack (along the gas flow), a decrease in the Rh/Pt ratio was observed (at.%), namely, 0.82, 0.46 and 0.4, respectively [8]. After NH3 oxidation in an industrial reactor for several weeks, on gauzes 2, 16, 31 and 36 in the pack of 36 Pt–Rh pieces, according to XPS data, the concentrations of C became equal to 49.3, 49.1, 47.1 and 52.5 at.%; for O—25.6, 35.0, 30.5 and 27.7 at.%; and for N—5.4, 2.0, 4.2 and 2.8 at.%, respectively [9]. For new and spent Pt–Rh and Pt–Pd–Rh gauzes, the content of Rh decreased with the removal of the catalyst surface layers by bombardment with Ar+ ions [10]. For the fresh Pt–Rh gauze, the bulk content of Rh was achieved at a depth of 10 nm, while for the spent gauze, it was achieved at 1 µm. According to AES data, the contents of C and O in Pt–Pd–Rh gauzes decreased from the surface to subsurface layers at depths of 4 and 12 nm; on the new gauze the concentrations of C were 45.8, 7.9 and 4.1 at.%; and those of O—17.2, 9.8, 3.4 at.%; while on the spent gauze, the concentrations were equal to 58.2, 29,1, 12.4 at.% for C; and 5.7, 8,0, 6.1 at.% for O, respectively [11].
During the oxidation of NH3 on the model catalysts at low pressures (≤20 mbar) and temperatures (≤1000 K), the composition of adsorbed layers on the catalyst surface was studied by the surface-sensitive AES, XPS, NAP-XPS and SXRD methods [12,13,14]. According to AES data [12], the surface of Pt(S)-12(111) × (111) at a low temperature (≤700 K) is covered mostly with Nads and NHx(ads), whereas at a high temperature (≥700 K) it is covered with Oads atoms. Nitrogen-containing adsorbates (NC, Nad, NHx (x = 1–2), NH3) with surface coverage of ca. 0.2 monolayers were detected by in situ XPS on the Pt(533) surface at T < 500 K, while at T > 600 K, only the low concentrations of Nad and NC were found [13]. According to NAP-XPS and SXRD data, Nads atoms were detected on the surface of Pt25Rh75(001) alloy at T~450 K, while at T~650 K the RhO2 oxide layer was observed [14]. It should be noted that in the industrial oxidation of NH3 the catalyst temperature and the pressure of reagents are much higher (873–1273 K and 1–12 bar) [1,2,3]. As a result, in the industrial oxidation of NH3, along with the formation of the adsorption layer containing Cads, Oads and Nads, these atoms can penetrate into the subsurface region of the metallic alloy and gradually accumulate in the catalyst bulk to form their high concentrations. C and O atoms penetrated on defects in the concentrations of 20–40 and 5–10 at.%, respectively, are detected on Pt(poly) after annealing in O2 at 600–1400 K [27]. On fresh platinum alloy gauzes and on the gauzes after their operation in NH3 oxidation, C and O concentrations of 5–30 and 3–6 at.%, respectively, were observed in subsurface layers of the alloy at a depth up to 12 nm [11]. The penetrated atoms can exert a considerable effect on the oxidation of NH3 and the related etching of the catalyst surface. In this context, to elucidate the mechanism of NH3 oxidation and catalytic etching, it is necessary to acquire data on the chemical composition not only on the surface, but also in the subsurface region of the catalyst. In addition, such data can be used to estimate the composition of the catalyst subsurface layers during the oxidation of NH3.
The present work is the first comparative study where the chemical compositions of the fresh Pt–Pd–Rh–Ru gauze and also the back and frontal sides of such gauze after NH3 oxidation at 1133 K were investigated by methods that are highly sensitive to the surface (XPS) and subsurface (EDS) layers. For XPS, the depth of analysis is ca. 5 nm [24], while for EDS this parameter is much higher and equal to ca. 500 nm for the alloy at E0 = 20 keV [18]. According to the data obtained by the indicated methods (Figure 5 and Figure 7), the surface and subsurface layers of the tested Pt–Pd–Rh–Ru gauzes have strongly different concentrations of the detected elements. The adsorption (OHad, COad), graphitic (Cgr) and oxide (Rh2O3) surface films were detected on the fresh gauze and both sides of the spent gauze (see above, Figure 6). These films cover the surface layers of metallic alloy and exert a considerable effect on the concentrations of elements measured by XPS and EDS on the surface and in subsurface layers of the alloy, especially in the case of XPS with a low depth of analysis. To weaken the effect of these films on the measured composition of the catalyst, during the quantitative analysis we excluded elements entering the composition of surface films (OHad, COad, Cgr, Rh2O3) and impurities (Cab, SiO2 and Al) from the list of all the detected elements. The calculated relative concentrations of elements under the surface films in surface and subsurface layers of the alloy for the fresh gauze and both sides of the gauze used in NH3 oxidation are shown in Figure 5c,g,k and 7b,e,h; these values were obtained by XPS and EDS, respectively. The O and N concentrations obtained under the surface films can be used to estimate the concentrations of these elements on Pt alloy gauzes during the oxidation of NH3.

3.2. Composition of Surface and Subsurface Layers on the Back Side of the Pt–Pd–Rh–Ru Gauze Used in NH3 Oxidation, which Is Characterized by Initial Etching

Figure 8 displays the reaction schemes of NH3 oxidation with oxygen and shows the surface and subsurface regions of the catalyst for the back (Figure 8a) and frontal (Figure 8c) sides of the Pt–Pd–Rh–Ru gauze during NH3 oxidation. This scheme is based on XPS and EDS measurements of the concentrations of elements. The adsorbed Oads, Nads and NH3(ads) atoms and molecules are indicated on the surface, while absorbed Cab, Oab and Nab atoms are shown in subsurface regions of the alloy. The oxidation of NH3 does not lead to the formation of surface films (OHad, COad, Cgr, Rh2O3) on the metallic alloy, so they are not shown in Figure 8a,c. To compare the concentrations of Pt, Pd, Rh, Ru, Oab and Nab measured by both methods under the surface films on the back and frontal sides of the spent gauze, these values were combined in Figure 8b,d. They show the calculated elemental composition of Pt–Pd–Rh–Ru gauzes under the surface films according to XPS (shaded bars) and EDS (solid bars) data for the back (b) and frontal (d) sides of the gauze after NH3 oxidation at 1133 K.
The back side of the spent gauze has a non-uniform etched layer containing smooth regions with the size of 100–200 µm and ca. 3 µm crystals of various shape (Figure 2b) [19,21]. This side with the specific surface area of 52 cm2·g−1 demonstrates the onset of the etching process and has an increased concentration of surface defects (dislocations, etch pits and grain boundaries), but a decreased temperature as compared to the frontal side of this gauze [21]. The concentration of 72–85 nm etch pits, which are associated with dislocations, on the grain surface in the region of initial etching on the back side ranges from 2.5 × 10⁸ to 4.2 × 108 cm−2 [19]. The obtained concentrations of etch pits are consistent with the typical densities (107–108 cm−2) of dislocations in the annealed polycrystalline metals [28]. The concentrations of etch pits testify to the high defectiveness of the grain surface at the onset of etching. During the oxidation of NH3, the gas flow with the initial concentrations of reagents first goes to the frontal side of the gauze; as a result, an intense oxidation of NH3 proceeds on this side and decreases the concentrations of reagents. After that, the flow with a decreased content of reagents goes to the back side of this gauze, where the oxidation of NH3 proceeds with a lower intensity than on the frontal side. In consequence, the temperature and degree of etching on the back side become lower than on the frontal side. For the back side, the concentrations of Oab and Nab measured by XPS under the surface films (33.1 and 24.3 at.%) strongly exceed the concentrations of these elements obtained by EDS (11.4 and 15.3 at.%) (Figure 8b). The concentration ratios estimated by XPS and EDS are equal to 2.90 for Oab and 1.59 for Nab. According to XPS data, the concentration of Oab is higher than that of Nab, whereas according to EDS data, on the contrary, the Oab concentration is lower than that of Nab. The local EDS analysis on the frontal side of the spent gauze in the 5 × 5 µm region of initial etching estimates the concentrations of Oab and Nab as 18.6 and 17.1 at.%, respectively [22]. The concentrations of Oab and Nab measured by EDS on such regions satisfactorily agree with the values obtained in our study on the regions with a greater size (60 × 200 µm), while the concentrations of Nab virtually coincide (15.3 and 17.1 at.%, respectively). On the back side of the spent gauze demonstrating the initial step of catalytic etching, the majority of Oab and Nab atoms are uniformly distributed over the wire and concentrated in the catalyst surface layer (Figure 8a), because the concentration of these elements has higher values according to XPS data in comparison with EDS data (Figure 8b).

3.3. Composition of the Surface and Subsurface Layers on the Frontal Side of the Spent Pt–Pd–Rh–Ru Gauze, which Is Characterized by Deep Etching

The frontal side of the gauze used in NH3 oxidation is covered with a continuous etched layer of porous crystal agglomerates (“cauliflowers”) having the linear dimensions from 3 to 18 µm (the average size of ca. 10 µm (Figure 2c)); their concentration is 4.9 × 105 cm−2 [20,21]. Pores with the diameter from 0.1 to 1.7 µm were detected on the surface of “cauliflowers” in the concentration of 4.9 × 107 cm−2. Etch pits associated with dislocations, which characterize surface defectiveness, were not detected on the surface of “cauliflowers”. This side with the specific surface area of 260 cm2·g−1 demonstrates deep etching of the surface and has a lower concentration of surface defects, but a higher temperature compared to the back side of this gauze (see above) [21]. For the frontal side of the spent gauze, the concentrations of Oab and Nab under the surface films according to XPS data are lower (26.4 and 19.1 at.%), but higher according to EDS (13.4 and 23.2 at.%) (Figure 8d) in comparison with the back side of this gauze (Figure 8b). Therewith, the concentration ratio obtained from XPS and EDS data for Oab decreases to 1.97, while for Nab it decreases considerably to 0.82 as compared to the back side (2.90 and 1.59, respectively). As for the back side of the gauze, according to XPS data, the concentration of Oab is higher than that of Nab, but lower according to EDS. The local EDS analysis on the frontal side on the regions with the size of 5 × 5 µm and smaller gives the Oab and Nab concentrations of 7.3 and 16.8 at.% on the surface of “cauliflowers” and 10.4 and 33.6 at.% at the bottom of pore voids between “cauliflowers” [22]. In the present study, the EDS data were obtained on the large regions including “cauliflowers” and pore voids between them. After averaging the local concentrations of Oab and Nab on “cauliflowers” and pore voids, they become equal to 8.9 at.% for Oab and 25.2 at.% for Nab, which are close to the values obtained in this study (Figure 8d). On the frontal side of the spent gauze demonstrating deep etching, the majority of Oab and Nab atoms are uniformly distributed over the wire and concentrated in both the surface and subsurface layers of the catalyst (Figure 8c) because concentrations of these elements have close values according to XPS and EDS data (Figure 8d).
On both sides of the Pt–Pd–Rh–Ru gauze used in the oxidation of NH3, for Oab and Nab concentrations measured by XPS under the surface films in the metallic alloy [Oab] > [Nab], whereas according to EDS data, [Oab] < [Nab] (Figure 8b,d). This means that the Oab concentrations in the surface layer for both sides of the spent gauze are higher compared to Nab, while in the subsurface layer, on the contrary, Oab is lower than Nab. Unfortunately, thickness of the surface and subsurface layers cannot be estimated; however, considering the analysis depth for XPS (ca. 5 nm) and EDS (ca. 500 nm), the thickness of the surface layer can be taken to be equal to ca. 5 nm, and that of the subsurface layer, ca. 5–500 nm. It should be noted that for the back side, the concentrations of Oab and Nab measured by XPS strongly exceed their EDS values: [XPS] > [EDS] (Figure 8b). This testifies to higher concentrations of Oab and Nab in the surface layer of the alloy with a thickness of ca. 5 nm as compared to the subsurface layer (ca. 5–500 nm) on the back side of the gauze. Note that the back side has a high concentration of surface defects, but a decreased temperature [22]. As a result, at the onset of etching, Oab and Nab atoms accumulate in the surface layer during penetration of atoms predominantly on the extended surface defects (dislocations, etch pits, grain boundaries, etc.), whereas the intercalation of atoms into the alloy lattice (interstitial sites, subgrain boundaries, etc.) is essentially limited due to the low temperature of the catalyst. For the frontal side of the spent gauze, [XPS] ≈ [EDS] (except for Oab (EDS)) (Figure 8d). This testifies to close values of [Oab] ≈ [Nab] in a ca. 5 nm-thick surface layer, [Oab] < [Nab] in the subsurface layer of the alloy (ca. 5–500 nm) and close high values of [Nab] in both layers of the catalyst. It should be noted that on the frontal side, the concentration of surface defects is lower, while the temperature is higher than on the back side [22]. The Ea value for intercalation of small atoms (C, N, O) into the lattice of metals and alloys is much higher than for their penetration on the extended defects such as grain boundaries [29]. As a result, elevation of the catalyst temperature will accelerate much more strongly the intercalation of atoms into the lattice of metallic alloy than on the grain boundaries and etch pits [22]. In this context, on the frontal side with elevated temperature, Nab atoms can accumulate in the subsurface layer of the catalyst in a high concentration due to intercalation of the Nab atoms absorbed on extended defects into the alloy lattice, predominantly into the lattice interstitial sites and probably on subgrain boundaries, whereas the Oab atoms will accumulate mostly on the extended defects (dislocations, etch pits, grain boundaries, etc.) because their intercalation into the alloy lattice is essentially limited.
The detected accumulation of O and N atoms in subsurface layers of Pt–Pd–Rh–Ru alloy at different absorption sites may be related also to a substantial difference in the binding energies of these atoms with metals. According to various authors, for Pt, Pd and Rh the bond dissociation energies (BDEs) of N atoms with these metals strongly exceed the values for O [30]. Thus, for Pt-N and Pt-O, the indicated BDEs values are equal to ca. 500 and ca. 330 kJ/mol, respectively. During the oxidation of NH3 on Pt alloy, Oab atoms can accumulate on the extended defects in the subsurface region of the catalyst due to the low BDEs values for O with these metals. On Pt(poly) in the O2 atmosphere, the penetration of O atoms was detected only on the defects in subsurface layers, whereas their intercalation into the metal lattice was not observed [27]. Due to higher BDEs values for N with these metals, Nab atoms can intercalate into the alloy lattice and gradually accumulate in the catalyst bulk. Nevertheless, it should be noted that reliable information on the penetration mechanism of N and O atoms into the bulk of the Pt alloy catalyst, particularly concerning the effect exerted on the process by BDEs values for these atoms with metals, can be derived only after obtaining additional data on the kinetic parameters for these reactions; accordingly, a deeper analysis is required.
The etched layer of “cauliflowers” on the frontal side of Pt–Pd–Rh–Ru gauze after the oxidation of NH3 in a laboratory reactor for 50 h (Figure 2c) is quite similar to the layer detected on such gauze after NH3 oxidation in an industrial reactor for 3000 h (Figure 1). This information and the data reported above suggest that the concentrations of Oab and Nab atoms in subsurface layers of the catalyst Pt alloy during NH3 oxidation may be close to the values for Oab and Nab obtained in our study under the surface films (OHad, COad, Cgr, Rh2O3) in the metallic alloy on the frontal side of Pt–Pd–Rh–Ru gauze (Figure 8d). Thus, during the oxidation of NH3, the concentrations of Oab and Nab in subsurface layers of the catalyst Pt alloy may be equal to 20–25 at.%. The high concentrations of Oab and Nab in the surface and subsurface layers of the catalyst can provide the observed sustainable occurrence of NH3 oxidation to NO for a long time with high efficiency in industrial reactors. To elucidate the effect of Oab and Nab on the oxidation of NH3 over Pt alloy gauzes, it is necessary to simulate reactions that occur during the process both on the catalyst surface and in its bulk using the Langmuir–Hinshelwood (LH), Eley–Ridel (ER) and Mars–van Krevelen (redox) mechanisms, which are commonly employed for the analysis of heterogeneous catalytic reactions [31]. LH and ER mechanisms take into account reactions on the catalyst surface involving both the adsorbed molecules and those from the gas phase. In the redox mechanism, the reactions involving reagents in the catalyst bulk can also be considered. Consideration of the oxidation of CH4 molecules by lattice oxygen in PdO within the redox mechanism made it possible to explain changes in the catalyst activity and structure during the catalytic oxidation of CH4 by oxygen on PdO oxide [32]. NH3 oxidation on Pt alloy at high T and P can also proceed with the participation of Nab and Oab atoms, i.e., by the redox-type mechanism. The quantitative data on the Oab and Nab concentrations in subsurface layers of Pt–Pd–Rh–Ru alloy obtained in our study can serve as an adequate basis for simulation within LH, ER and redox mechanisms of the reactions accompanying the oxidation of NH3 on Pt alloy catalysts.

4. Materials and Methods

The study was performed using 3 X 82 gauzes knitted with wire 82 µm in diameter, produced at the Ekaterinburg Non-Ferrous Metals Processing Plant according to Specs. STO 00195200-014-2007 (factory standard). The gauze wire was made of alloy containing Pt, Pd, Rh and Ru in the concentrations 81, 15, 3.5 and 0.5 wt.%, respectively. According to GOST 13498-2010 (the State standard of Russia), the content of possible Ir, Fe, Au, Pb, Si, Sn and Zn impurities in this alloy should not exceed 0.11 wt.%, which means that admixtures of these elements can be present in the metallic alloy in lower concentrations or can be completely absent. Moreover, according to this GOST, density (ρ) and melting point (Tmelt) of the alloy corresponded to 18.76 g/cm3 and 2053–2073 K, respectively. Considering the indicated ρ value, the specific geometric surface of the initial gauzes was 26.0 cm2·g−1.
The catalytic oxidation of ammonia with air was carried out in a laboratory flow-type quartz reactor with an inner diameter of 11.2 mm, in which a ca. 1 mm-thick pack of four 3 X 82 gauzes was placed. The total weight of the platinum alloy pack was 0.61 g. The linear feed rate of the reaction mixture (ca. 10 vol.% NH3 in air) preheated in a heating mixer up to 700 K was 2.57 m/s; the temperature in the region of gauzes was 1133 ± 5 K; and the total pressure was 3.6 bar. Characteristics of the gauzes, reactor and catalytic process conditions are described in detail elsewhere [18,19,20,21,22]. The chemical composition of the wire surface was studied using the first gauze along the gas flow.
The morphology of the wire surface layer was examined on a scanning electron microscope (SEM) JSM-6460 LV (Jeol, Tokyo, Japan) with a tungsten cathode operated at probe electron energy (E0) values of 16, 20 and 25 keV. The microscope was equipped with an energy-dispersive X-ray spectrometer (EDS) INCAx-sight (Oxford Instruments, Abingdon, England) that allowed for estimation of the chemical composition of the wire subsurface layer. In this study, EDS spectra were recorded at E0 = 20 keV. To calibrate the spectrometer, standards made of neat Si and Co samples were employed. The quantitative analysis was made using INCA Energy-350 system (Oxford Instruments, Abingdon, England), and internal standards from the spectrometer database. The chemical composition of a thin surface layer with a thickness of several monolayers was analyzed using a X-ray photoelectron spectrometer (XPS) (SPECS, Berlin, Germany) with AlKα radiation (hν = 1486.6 eV). To estimate the reliability of the concentrations of elements obtained by XPS, they were compared with the XPS data reported in the literature for such systems (see above).
SEM, EDS and XPS applied in this work have different effective depths of analysis [23,24] because they are based on recording the radiation generated in subsurface layers of different thicknesses. SEM images were obtained in the secondary electron (SE) mode with emission of electrons from the surface layer with a thickness ≤5 nm [23]. XPS spectra recorded photoelectrons with the energy of 500–1400 eV, for which the emission depth from metals is 2–3 nm [24]. EDS spectra recorded X-ray quanta of characteristic X-ray radiation with the energy ≤10 keV, which are emitted from subsurface layers with a thickness up to 1 µm [23,24]. For the alloy employed in the study, the estimated depth of EDS analysis at E0 = 20 keV was 490 nm [18]. Taking into account these data and the complicated composition of the platinum alloy gauzes, the depth of SEM and XPS analysis for such samples could be taken equal to ca. 5 nm, and for EDS, 500 nm.

5. Conclusions

XPS and EDS methods, having strongly different analysis depths of ca. 5 nm and ca. 500 nm, respectively, were used to investigate the chemical composition of the surface and subsurface layers of new Pt–Pd–Rh–Ru gauze with the composition of Pt (81 wt.%), Pd (15 wt.%), Rh (3.5 wt.%) and Ru (0.5 wt.%), as well as the back and frontal sides of such gauze after the oxidation of NH3 with air at T = 1133 K and pressure 3.6 bar for 50 h. According to XPS and EDS data, surface films (OHad, COad, Cgr, Rh2O3), which formed mostly after the oxidation of NH3, were detected on the metallic alloy of all the gauzes. On the gauze used in NH3 oxidation, the absorbed Cab, Nab and Oab atoms were detected under the surface films in the subsurface layers of the alloy. These atoms can be absorbed both on the extended defects (dislocations, etch pits, grain boundaries, etc.) and in the alloy lattice (interstitial voids, subgrain boundaries, etc.) during NH3 oxidation.
On the back and frontal sides of the spent gauze, a non-uniform distribution of Nab and Oab atoms in subsurface region of the alloy under the surface films was found. For both sides, XPS revealed [Oab] > [Nab] in the metallic alloy, whereas according to EDS data, [Oab] < [Nab]. This indicates that the concentration is high in the surface layer of the alloy and low in the subsurface layer for Oab as compared to Nab on both sides of the used gauze.
For the back side, which is characterized by the initial etching step, the concentrations of Oab and Nab atoms measured by XPS (33.1 and 24.3 at.%) are much higher than the corresponding EDS data (11.4 and 15.3 at.%): [XPS] > [EDS]. This testifies to higher concentrations of Oab and Nab in a ca. 5 nm-thick surface layer of the alloy as compared to the subsurface layer (ca. 5–500 nm). At the onset of the etching process, Oab and Nab atoms accumulate mostly in the surface layer during penetration of atoms predominantly on the extended defects. Intercalation of these atoms into the alloy lattice is essentially limited due to the low temperature of the catalyst. For the frontal side with deep etching, the concentrations of Oab and Nab atoms measured by XPS (26.4 and 19.1 at.%) and EDS (13.4 and 23.2 at.%) generally have close values: [XPS] ≈ [EDS] (except for Oab (EDS)). This testifies to close values of [Oab] ≈ [Nab] in a ca. 5 nm-thick surface layer of the alloy, [Oab] < [Nab] in the subsurface layer (ca. 5–500 nm), and close [Nab] values in both layers of the catalyst. On the frontal side with elevated temperature, Nab atoms accumulate in the subsurface layer of the catalyst due to intercalation into the alloy lattice. Oab atoms are concentrated mostly on the extended defects because their intercalation into the alloy lattice is essentially limited.
The concentrations of Oab and Nab atoms in the surface–subsurface layers of the catalyst Pt alloy during the oxidation of NH3 can be close to the concentrations of Oab and Nab obtained in our study under the surface films (OHad, COad, Cgr, Rh2O3) in the metallic alloy on the frontal side of Pt–Pd–Rh–Ru gauze (20–25 at.%). The high concentrations of Oab and Nab atoms in the surface–subsurface layers of the catalyst can ensure the sustainable and highly efficient oxidation of NH3 to NO for a long time despite the pronounced changes in the catalyst surface due to the deep etching initiated by NH3 oxidation.

Author Contributions

A.S. (Aleksei Salanov): Conceptualization, Methodology, Writing—Original draft, Writing—Review and Editing. A.S. (Alexandra Serkova): Formal analysis, Investigation, Visualization. A.K.: Formal analysis, Investigation. L.I.: Conceptualization, Resources, Validation. V.P.: Supervision, Writing—Review and Editing. All authors have read and agreed to the published version of the manuscript.

Funding

This work was supported by the Ministry of Science and Higher Education of the Russian Federation within the governmental order for Boreskov Institute of Catalysis (Project AAAA-A21-121011390053-4).

Acknowledgments

The studies were carried out using facilities of the shared research center “National Center of investigation of catalysts” at Boreskov Institute of Catalysis.

Conflicts of Interest

The authors declare no conflict of interest.

References

  1. Hatscher, S.T.; Fetzer, T.; Wagner, E.; Kneuper, H. Ammonia Oxidation. In Handbook of Heterogeneous Catalysis, 2nd ed.; Ertl, G., Knozinger, H., Schuth, F., Weitkamp, J., Eds.; WILEY-VCH Verlag GmbH & Co. KGaA: Weinheim, Germany, 2008; Volume 5, pp. 2575–2592. [Google Scholar]
  2. Lloyd, L. Handbook of Industrial Catalysis, Fundamental and Applied Catalysis; Twigg, M.V., Spencer, M.S., Eds.; Springer Science+Business Media, LLC: New York, NY, USA, 2011; pp. 119–131. [Google Scholar]
  3. Karavayev, M.M.; Zasorin, A.P.; Kleshchev, N.F. Catalytic Oxidation of Ammonia; Khimia: Moscow, Russia, 1983; pp. 30–122. [Google Scholar]
  4. Handforth, S.L.; Tilley, J.N. Catalysts for Oxidation of Ammonia to Oxides of Nitrogen. Ind. Eng. Chem. 1934, 26, 1287–1292. [Google Scholar] [CrossRef]
  5. Nilsen, O.; Kjekshus, A.; Fjellvag, H. Reconstruction and loss of platinum catalyst during oxidation of ammonia. Appl. Catal. A Gen. 2001, 207, 43–54. [Google Scholar] [CrossRef]
  6. Hannevold, L.; Nilsen, O.; Kjekshus, A.; Fjellvag, H. Reconstruction of platinum-rhodium catalysts oxidation of ammonia. Appl. Catal. A Gen. 2005, 284, 163–176. [Google Scholar] [CrossRef]
  7. Hannevold, L.; Nilsen, O.; Kjekshus, A.; Fjellvag, H. Surface reconstruction of noble-metal catalysts during oxidation of ammonia. Appl. Catal. A Gen. 2005, 284, 185–192. [Google Scholar] [CrossRef]
  8. Fierro, J.L.G.; Palacios, J.M.; Tomas, F. Characterization of catalyst and catchment gauzes used in medium- and low-pressure ammonia oxidation plants. J. Mater. Sci. 1992, 27, 685–691. [Google Scholar] [CrossRef]
  9. Rosenstiel, A.P.v.; Bruis, W.H.J.; van Os, G.H.; Mertens, P.R.; Koeiman, O.A.; Berresheim, K.H. ESCA, SIMS, SEM and XRD investigations of Pt-10%Rh catalysts-gauzes. Fresenius Z. Anal. Chem. 1989, 333, 535–539. [Google Scholar] [CrossRef]
  10. Contour, J.P.; Mouvier, G.; Hoogewys, M.; Leclere, C. X-Ray Photoelectron Spectroscopy and Electron Microscopy of Pt-Rh Gauzes Used for Catalytic Oxidation of Ammonia. J. Catal. 1977, 48, 217–228. [Google Scholar] [CrossRef]
  11. Kozub, P.A.; Gryn, G.I.; Goncharov, I.I. Investigations on Platinum Gauze Surfaces Used in the Manufacture of Nitric Acid. Platinum Met. Rev. 2000, 44, 74–84. [Google Scholar]
  12. Gland, J.L.; Korchak, V.N. Ammonia Oxidation on a Stepped Platinum Single-Crystal Surface. J. Catal. 1978, 53, 9–23. [Google Scholar] [CrossRef]
  13. Gunther, S.; Scheibe, A.; Bluhm, H.; Haevecker, M.; Kleimenov, E.; Knop-Gericke, A.; Schlogl, R.; Imbihl, R. In Situ X-ray Photoelectron Spectroscopy of Catalytic Ammonia Oxidation over a Pt(533) Surface. J. Phys. Chem. C 2008, 112, 15382–15393. [Google Scholar] [CrossRef]
  14. Resta, A.; Hejral, U.; Blomberg, S.; Albertin, S.; Vlad, A.; Garreau, Y.; Chatelier, C.; Venturini, F.; Ferrer, P.; Held, G.; et al. Ammonia Oxidation over a Pt25Rh75(001) Model Catalyst Surface: An Operando Study. J. Phys. Chem. C 2020, 124, 22192–22199. [Google Scholar] [CrossRef]
  15. Ashcroft, J. Optimising Metal Content in Platinum Grup Metal Ammonia Oxidation Catalysts. Johnson Matthey Technol. Rev. 2021, 65, 44–53. [Google Scholar]
  16. Xin, L.; Yongqiang, H.; Husheng, J. Pt-Rh-Pd Alloy Group Gauze Catalysts Used for Ammonia Oxidation. Rare Met. Mater. Eng. 2017, 46, 339–343. [Google Scholar] [CrossRef]
  17. Pura, J.; Waller, D.; Wiecinski, P.; Kwaśniak, P.; Zwolinska, M.; Garbacz, H.; Zdunek, J.; Laskowski, Z.; Gierej, M. Investigation of the degradation mechanism of catalytic wires during oxidation of ammonia process. Appl. Surf. Sci. 2016, 388, 670–677. [Google Scholar] [CrossRef]
  18. Salanov, A.N.; Suprun, E.A.; Serkova, A.N.; Sidelnikova, O.N.; Sutormina, E.F.; Isupova, L.A.; Kalinkin, A.V.; Parmon, V.N. Catalytic corrosion of platinoid gauzes in the oxidation of ammonia with air. Surface reconstruction of platinoid gauzes at 1133 K in air, in ammonia, and in the NH3+O2 reaction medium. Kinet. Catal. 2018, 59, 83–98. [Google Scholar] [CrossRef]
  19. Salanov, A.N.; Suprun, E.A.; Serkova, A.N.; Kochurova, N.M.; Sidelnikova, O.N.; Sutormina, E.F.; Isupova, L.A.; Kalinkin, A.V.; Parmon, V.N. Catalytic etching of platinoid gauzes during the oxidation of ammonia by air. Reconstruction of the surface of a platinoid gauze backside in the course of ammonia oxidation at 1133 K. Kinet. Catal. 2018, 59, 792–809. [Google Scholar] [CrossRef]
  20. Salanov, A.N.; Suprun, E.A.; Serkova, A.N.; Chesnokova, N.M.; Sutormina, E.F.; Isupova, L.A.; Parmon, V.N. Catalytic etching of platinoid gauzes during the oxidation of ammonia by air: Etching of the frontal surface of the platinoid gauze in the course of NH3 oxidation at 1133 K. Kinet. Catal. 2020, 61, 421–443. [Google Scholar] [CrossRef]
  21. Salanov, A.N.; Serkova, A.N.; Chesnokova, N.M.; Isupova, L.A.; Parmon, V.N. Characterization of platinum alloy used in ammonia oxidation. Morphology and microstructure of Pt–Pd–Rh–Ru gauzes after the oxidation of NH3 with air at 1133 K. Mater. Chem. Phys. 2021, 273, 125138–125151. [Google Scholar] [CrossRef]
  22. Salanov, A.N.; Chesnokova, N.M.; Serkova, A.N.; Isupova, L.A. Local Chemical Analysis of the Grain Surface, Cauliflowers, and Pores on Pt-Pd-Rh-Ru Gauzes after the oxidation of NH3 at 1133 K. Kinet. Catal. 2021, 62, 651–663. [Google Scholar] [CrossRef]
  23. Goldstein, J.I.; Newbury, D.E.; Michael, J.R.; Ritchie, N.W.M.; Scott, J.H.J.; Joy, D.C. Scanning Electron Microscopy and X-Ray Microanalysis, 5th ed.; Springer Science+Business Media LLC: New York, NY, USA, 2018; pp. 1–63. [Google Scholar]
  24. Feldman, L.C.; Mayer, J.W. Fundamentals of Surface and thin Film Analysis; Elsevier Science Publishing Co., Inc.: New York, NY, USA, 1986; pp. 129–155. [Google Scholar]
  25. Moulder, J.F.; Stickle, W.F.; Sobol, P.E.; Bomben, K.D. Handbook of X-ray Photoelectron Spectroscopy; Chastain, J., Ed.; Physical Electronic Inc.: Chanhassen, MI, USA, 1995; pp. 37–42, 53–54, 113–116, 177–178. [Google Scholar]
  26. Selman, G.L.; Ellison, P.J.; Darling, A.S. Carbon in platinum and palladium. Platin. Met. Rev. 1970, 14, 14–20. [Google Scholar]
  27. Salanov, A.N.; Kochurova, N.M.; Serkova, A.N.; Kalinkin, A.V.; Isupova, L.A.; Parmon, V.N. Oxidation and Recrystallization of Platinum Group Metals (Pt, Pd, Rh) in Oxygen. Surface and Subsurface Reconstruction of Polycrystalline Platinum During Annealing in the O2 Atmosphere over the Temperature Range of 600–1400 K. Appl. Surf. Sci. 2019, 490, 188–203. [Google Scholar] [CrossRef]
  28. Novikov, I.I. Defekty Kristallicheskogo Stroeniya Metallov (Defects of Crystalline Structure of Metals); Metallurgiya: Moscow, Russia, 1975; pp. 146–154. [Google Scholar]
  29. Gottstein, G. Physical Foundations of Materials Science; Springer: Berlin, Heidelberg, Germany, 2004; pp. 134–165. [Google Scholar]
  30. Luo, Y. Comprehensive Handbook of Chemical Bond Energies; CRC Press, Taylor & Francis Group: New York, NY, USA, 2007; pp. 885–886, 934–935, 947–948. [Google Scholar]
  31. Ross, J.R.H. Contemporary Catalysis, Fundamentals and Current Applications; Elsevier: Amsterdam, The Netherlands, 2019; pp. 161–173. [Google Scholar]
  32. Ciuparu, D.; Lyubovsky, M.R.; Altman, E.; Pfewfferle, L.D.; Datye, A. Catalytic combustion of methane over palladium-based catalysts. Catal. Rev. 2002, 44, 593–649. [Google Scholar] [CrossRef]
Figure 1. SEM images of a fragment of the Pt–Pd–Rh–Ru gauze (a,b) and “cauliflowers” (c,d) after NH3 oxidation with air in an industrial reactor at T~1173 K and P~7.0 bar for ca. 3000 h. Images were obtained at E0 = 16 keV in the secondary electron (SE) mode. Rectangles indicate the regions represented by the images that were obtained at a greater magnification.
Catalysts 12 00930 g001
Figure 2. SEM images of the wire surface obtained at E0 = 25 keV in SE mode for the fresh Pt–Pd–Rh–Ru gauze (a) and for the back (b) and frontal (c) sides of such gauze after NH3 oxidation with air in a laboratory reactor at T~1133 K and P~3.6 bar for 50 h.
Catalysts 12 00930 g002aCatalysts 12 00930 g002b
Figure 3. XPS (a) and EDS (b) spectra obtained for the unused Pt–Pd–Rh–Ru gauze. XPS spectra were recorded on a gauze fragment with the size of 1 × 1 mm and EDS spectra on the wire region with the size of 60 × 200 µm. (c) Composition of the new gauze according to the manufacturer data (black left bars) and according to EDS (red central bars) and XPS (shaded right bars) data acquired in this study.
Catalysts 12 00930 g003aCatalysts 12 00930 g003b
Figure 4. XPS spectra of Rh3d5/2 (a,d,g), O1s (b,e,h) and N1s (c,f,i) with the peaks separated by deconvolution of these spectra for the unused Pt–Pd–Rh–Ru gauze (ac) and also for the back (df) and frontal (gi) sides of such gauze after NH3 oxidation.
Catalysts 12 00930 g004
Figure 5. The content of elements measured by XPS in the surface layers of the new gauze (ad) and also on the back (eh) and frontal (il) sides of the gauze after NH3 oxidation. (a,e,i) Concentrations of all the detected elements in the surface layer of gauzes. (b,f,j) Relative concentrations of elements and metals on the gauze surface under surface films (COad, OHad, Cgr, Rh2O3 and SiO2). (c,g,k) Relative concentrations of elements under surface films obtained from the data of Figure 5b,f,j after excluding Cab carbon from the calculation. (d,h,l) Relative concentrations of metals (Pt, Pd, Rh) obtained from the data of Figure 5c,g,k after excluding all other detected elements from the calculation.
Catalysts 12 00930 g005
Figure 6. A scheme of the surface and subsurface regions of the Pt–Pd–Rh–Ru gauze used in the oxidation of NH3. OHad, COad, Cgr, Rh2O3—the surface adsorption, graphitic and oxide films. Cab, Oab and Nab—the atoms absorbed on grain boundaries and other defects in the subsurface layer of metallic alloy. Ellipses indicate relative depths of analysis for XPS (ca. 5 nm) and EDS (ca. 500 nm). OH and CO designate the adsorbed layer.
Catalysts 12 00930 g006
Figure 7. The content of elements measured by EDS for the new Pt–Pd–Rh–Ru gauze (ac) and also for the back (df) and frontal (gi) sides of the gauze after NH3 oxidation. (a,d,g) Concentrations of all the detected elements in the wire subsurface layer on all the gauzes. (b,e,h) Relative concentrations of elements in the subsurface layer calculated from the data of (a,d,g) after excluding C and Al from the list of detected elements. (c,f,i) Relative concentrations of metals calculated from the data of (b,e,h) after excluding O and N from the list of elements.
Catalysts 12 00930 g007
Figure 8. Reaction schemes of NH3 oxidation with oxygen; the surface with adsorbed Oads, Nads, NH3(ads) and subsurface regions of the catalyst with absorbed Cab, Oab and Nab atoms for the back (a) and frontal (c) sides of the Pt–Pd–Rh–Ru gauze during NH3 oxidation. The elemental composition of gauzes under the surface films (OHad, COad, Cgr, Rh2O3) according to XPS (shaded bars) and EDS (solid bars) for the back (b) and frontal (d) sides of the gauze after NH3 oxidation at 1133 K.
Catalysts 12 00930 g008aCatalysts 12 00930 g008b
Table 1. Spectral characteristics and concentrations of the detected elements according to XPS data, particularly those calculated from the peaks obtained by deconvolution of Rh3d5/2, O1s, N1s and C1s spectra (Figure 4) for the fresh Pt–Pd–Rh–Ru gauze (a,b) and for the back (c,d) and frontal (e,f) sides of the gauze used in NH3 oxidation.
ElementsXPS
Peaks
New GauzeBack Side
of Used Gauze
Frontal Side
of Used Gauze
(a)
Eb, eV
(b)
at.%
(c)
Eb, eV
(d)
at.%
(e)
Eb, eV
(f)
at.%
PtPt4f7/271.14.671.24.971.14.1
PdPd3d5/2335.42.4335.41.9335.51.5
RhRh3d5/2-
307.1
308.6
5.3
0.1
5.2
-
307.2
308.4
0.8
0.4
0.4
-
307.2
308.4
0.8
0.4
0.4
Ru-------
CC1s-57.9-48.4-56.3
OO1s285.4
286.1
-
529.9
532.2
49.1
8.8
29.8
5.3
24.5
285.1
287.6
-
530.2
532.5
37.9
10.5
35.3
6.2
29.1
285.1
287.3
-
530.0
532.4
45.9
10.4
31.1
3.5
27.6
NN1s-
-
-
-
-
-
-
397.8
399.7
4.1
0.2
3.9
-
398.5
400.0
2.1
0.8
1.3
SiSi2p--102.94.6102.64.1
Table 2. Concentrations (at.%) of all the detected elements (a) and values calculated after exclusion of C, O, N and Al (b) in the subsurface layer on the frontal side of the Pt–Pd–Rh–Ru gauze used in NH3 oxidation according to EDS measurements. (c) The content of metals in the gauzes according to the manufacturer data.
Elements(a)(b)(c)
Pt22.364.169.8
Pd8.124.423.7
Rh3.510.65.7
Ru0.30.90.8
C45.1--
O7.2--
N12.5--
Al1--
Publisher’s Note: MDPI stays neutral with regard to jurisdictional claims in published maps and institutional affiliations.

