Article

On the Optimization of Ni/A and Ni/X Synthesis Procedure toward Active and Selective Catalysts for the Production of CH4 from CO2

by
Somkiat Krachuamram
1,
Pinit Kidkhunthod
2,
Yingyot Poo-arporn
2,
Nuntaporn Kamonsutthipaijit
2 and
Kingkaew Chayakul Chanapattharapol
1,*
1
Materials Chemistry Research Center, Department of Chemistry and Center of Excellence for Innovation in Chemistry, Faculty of Science, Khon Kaen University, Khon Kaen 40002, Thailand
2
Synchrotron Light Research Institute, Nakhon Ratchasima 30000, Thailand
*
Author to whom correspondence should be addressed.
Catalysts 2022, 12(8), 823; https://doi.org/10.3390/catal12080823
Submission received: 31 May 2022 / Revised: 19 July 2022 / Accepted: 23 July 2022 / Published: 26 July 2022

Abstract

:
Herein, optimization of zeolite NaA/NaX synthesis conditions in order to obtain the final product with high surface area and pore volume was investigated. An optimal synthesis condition was 5 days aging time and crystallization time of 9 h with the co-addition of cetyltrimethylammonium bromide (CTAB) and heptane. All those optimal synthesis conditions provided mixed phase between zeolite NaA and NaX, and addition of those organic phases improved the surface area and pore volume of the final synthesized zeolite. The role of CTAB and heptane on increasing the surface area of zeolite was studied by in situ small-angle X-ray scattering (SAXS). The SAXS results evidenced that small nucleation precursor was formed upon the addition of organic phase, and this nucleation precursor can provide zeolite with high-characteristic XRD signals of mixed phase of zeolite A and X after the crystallization process. The synthesized zeolite obtained from optimal synthesis condition with high surface area was further used as a catalyst support by impregnating with 5, 10, 15, and 20wt%Ni for catalyzing CO2 methanation reaction. The results found that 15wt%Ni/zeolite expressed the highest catalytic activity with high CH4 selectivity and stability. This was due to high dispersion of Ni species on catalyst surface and high metal-support interaction between Ni and zeolite. These results indicated that the mixed phase zeolite support can be a potential catalyst support for this reaction.

1. Introduction

Recently, the enormous consumption of fossil fuels has led to high emission levels of greenhouse gases, including carbon dioxide (CO2), chlorofluorocarbons, and other pollutants. Carbon dioxide is one of the most crucial greenhouse gasses, and it is the main cause of global warming and climate change. In the last decade, many researchers have been searching for and developing alternative approaches to reduce CO2 emission. There are many methods for reducing and capturing the CO2 emission, such as solid adsorption, liquid absorption, and CO2 capturing membranes [1,2,3,4,5,6]. Besides removing and capturing CO2, many strategies are concerned with utilizing the wasted CO2 by converting it into fuels or other useable materials. The conversion of CO2 into CH4 (CO2 methanation) has been proposed to both reduce CO2 emission and utilize wasted CO2 since CH4 is one of the most important chemicals, which also acts as a fuel or starting material for other products [7,8,9,10]. CO2 methanation is the formation of CH4 by converting CO2 with reducing H2 gas as shown in Equation (1).
CO2 + 4H2 → CH4 + 2H2O ∆H = −165 kJ mol−1
Since this reaction is a highly exothermic process and high kinetic barrier, the catalyst is usually employed to accelerate the reaction rate at low temperature. In the heterogeneous catalyst system, an active species and catalyst support are the main components of catalyst. For active species, precious metals are the most active species for CO2 methanation reaction. Several precious metals, such as ruthenium, rhodium, palladium, osmium, iridium, and platinum, show high catalytic activity for this reaction [11,12,13,14]. However, these metals are expensive and not suitable for the industrials sector. Therefore, many researchers focus on searching for new high-active metals with lower price and more abundance to replace the above precious metals. Among these metals, Ni has become a popular catalyst for CO2 methanation due to its high catalytic activity and low expense [15,16,17,18,19]. However, a rapid deactivation due to the sintering effect and coke deposition of Ni catalyst are the main drawbacks. Therefore, to overcome this problem, Ni catalysts are usually loaded and dispersed on the support. The most important feature of the catalyst support is its basicity as well as high surface area and pore volume for dispersing an active component. Basicity is responsible for adsorption and activation of CO2 while highly dispersing Ni species favor H2 dissociative adsorption. High surface area and pore volume materials, such as silica (SiO2), alumina (Al2O3), and zeolites, are usually used as catalyst supports [20,21,22,23,24,25]. Among them, zeolite is now of interest as a support because it is easily modified. It has been reported that the surface area of zeolite support plays a key role on CO2 methanation since its surface and porous availability for Ni dispersion and a strong-metal-support interaction usually occur on zeolite surface [26,27,28].
In order to enhance the catalytic activity of the reaction, the elementary step of the reaction must be increased. For heterogeneous catalysis, the adsorption of reactant on a catalyst surface is one of the elementary steps, which is usually assigned as an important rate-determining step. For CO2 methanation, enhancing of CO2 and H2 adsorption on the catalyst surface should be an alternative approach for increasing the catalytic activity [29,30,31,32]. H2 usually adsorbs on metallic metal surfaces by dissociative pathway; therefore, increasing the metal area on the catalyst surface can promote the adsorption of H2. To increase the active metal surface area on the support, reducing the crystalline size and increasing the dispersion are usually employed. Therefore, an active component must be highly dispersed and exhibit high surface area on the support in order to enhance the H2 adsorption. Meanwhile, the catalyst support usually affects the adsorption of CO2; thus, an appropriate support should be selected to promote the adsorption of this reactant. Increasing the surface area of support to increase the adsorption possibility is one approach to improve the CO2 adsorption. In the case of zeolite-based support, the addition of some organic substances can increase the surface area and pore volume of zeolite by perturbation of nucleation and/or crystallization process. By increasing the nucleation rate during nucleation process, the zeolite crystalline is reduced, and then the surface area and pore volume is increased. To accelerate the rate of nuclei formation, addition of organic substances during the preparation process is usually employed [33,34,35,36].
In our previous work, modifying the surface properties of zeolite with the addition of organic substances (CTAB and heptane) was studied [37]. We proposed that the addition of CTAB and heptane enhanced the nucleation rate during aging period, which allowed for smaller and uniform zeolite crystalline size and finally obtained a high surface area and pore volume of zeolite with higher CO2 uptake ability. Small angle X-ray scattering (SAXS) was used as an appropriate investigating technique to prove the role of additives on enhancing surface area and pore volume of zeolite. SAXS is a useful tool for monitoring the process of small particle formation in the nanometer range so it is frequently used to observe the formation of nuclei during aging the zeolite gel. Due to the limitations of zeolite gel, we cannot clearly show that the organic substance plays the role in increasing the nucleation rate during the aging process, and then the SAXS technique cannot be used to prove this assumption.
The aim of this work was to optimize the synthesis condition for obtaining mixed phased of zeolite NaA/NaX with high surface area and pore volume and to further use it as a catalyst support for CO2 methanation by impregnating with nickel. Since the report for utilization of mixed phased zeolite for this reaction was lack, this is the first time the zeolite NaA/NaX as a potential catalyst support has been proposed. We expected that higher surface area and pore volume should provide more area for Ni dispersion, and zeolite can also promote the CO2 adsorption. For improving the surface area and pore volume of zeolite, the addition of organic substances (CTAB and heptane) was conducted, and we evidenced the role of those organic phase additions by in situ SAXS experiment. The results of SAXS experiment are the new evidence to prove that CTAB and heptane promote the nucleation precursor formation, which cannot be proven by previous research. Next, the synthesized zeolite obtained from the optimal synthesis condition was used as a support for impregnating Ni species and formed a zeolite-supported Ni catalyst for CO2 methanation reaction. The effect of different zeolite support surface area and pore volume on the catalyst properties (reducibility, Ni dispersion, and CO2 adsorption) was investigated by comparing the Ni impregnated on zeolite with and without organic phase addition catalysts. Moreover, the state of Ni species during CO2 methanation was monitored by in situ X-ray absorption spectroscopy (XAS) to investigate the role of catalyst on enhancing the reaction rate.

2. Results and Discussion

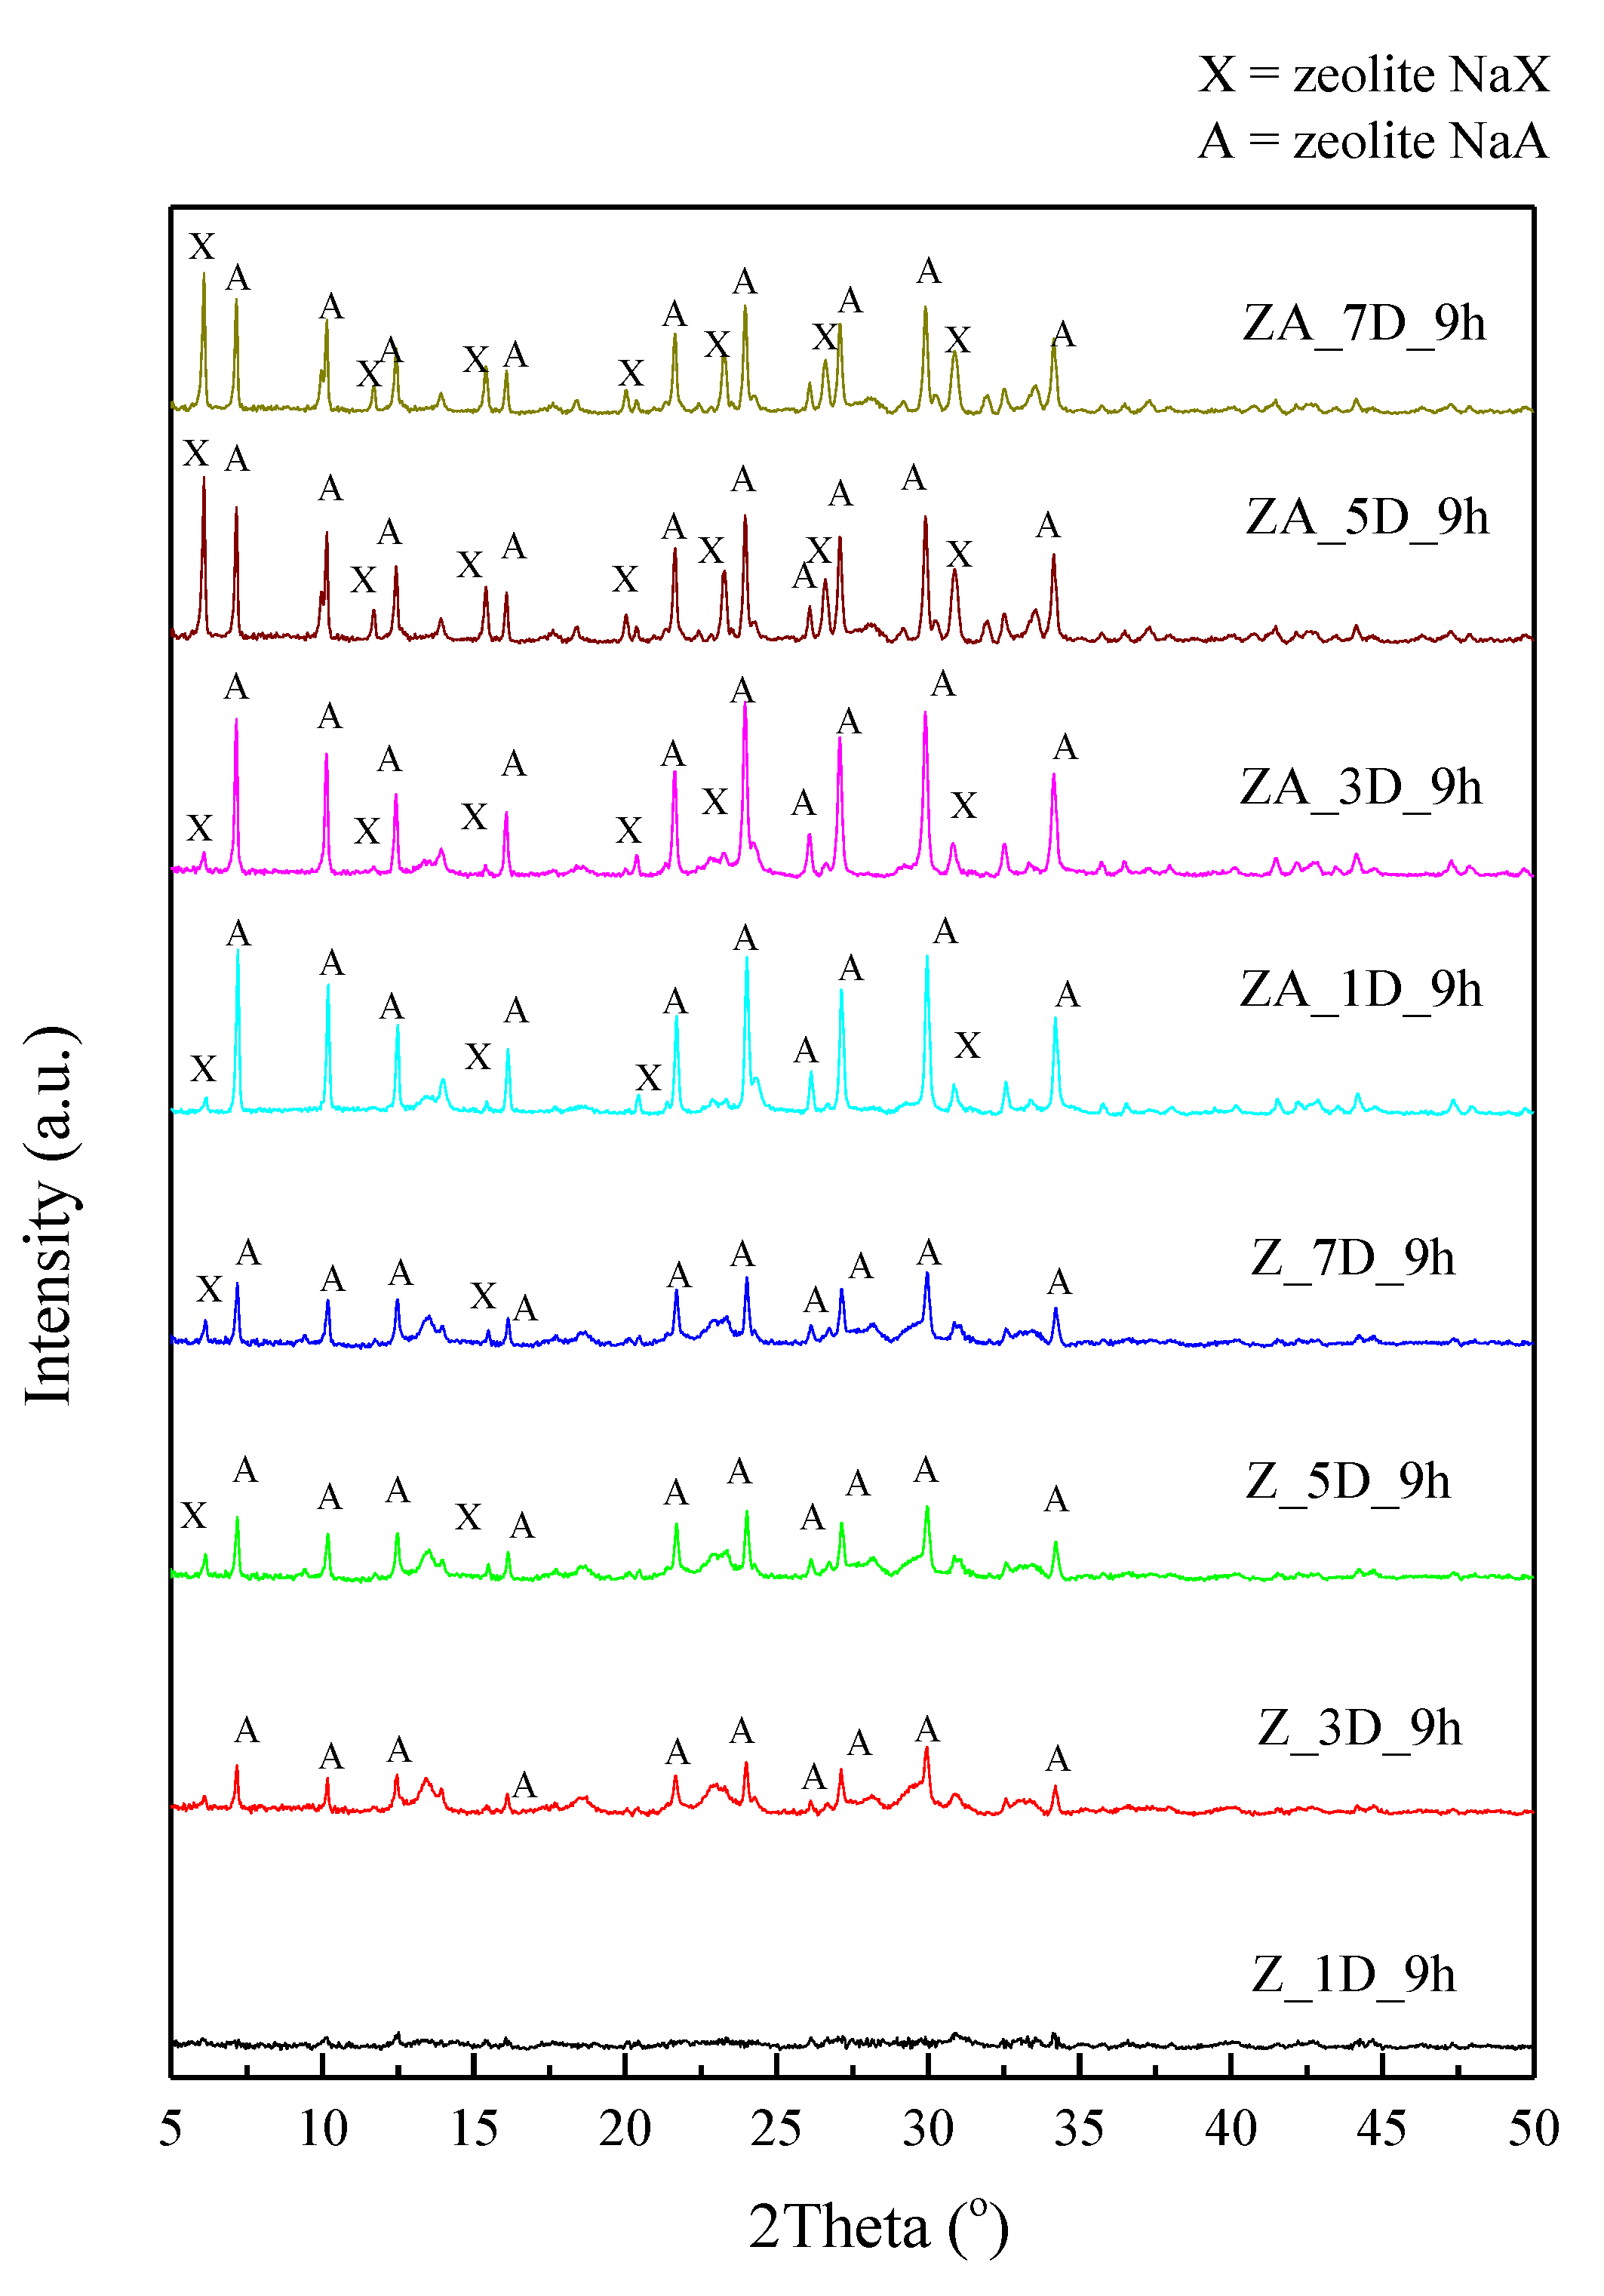
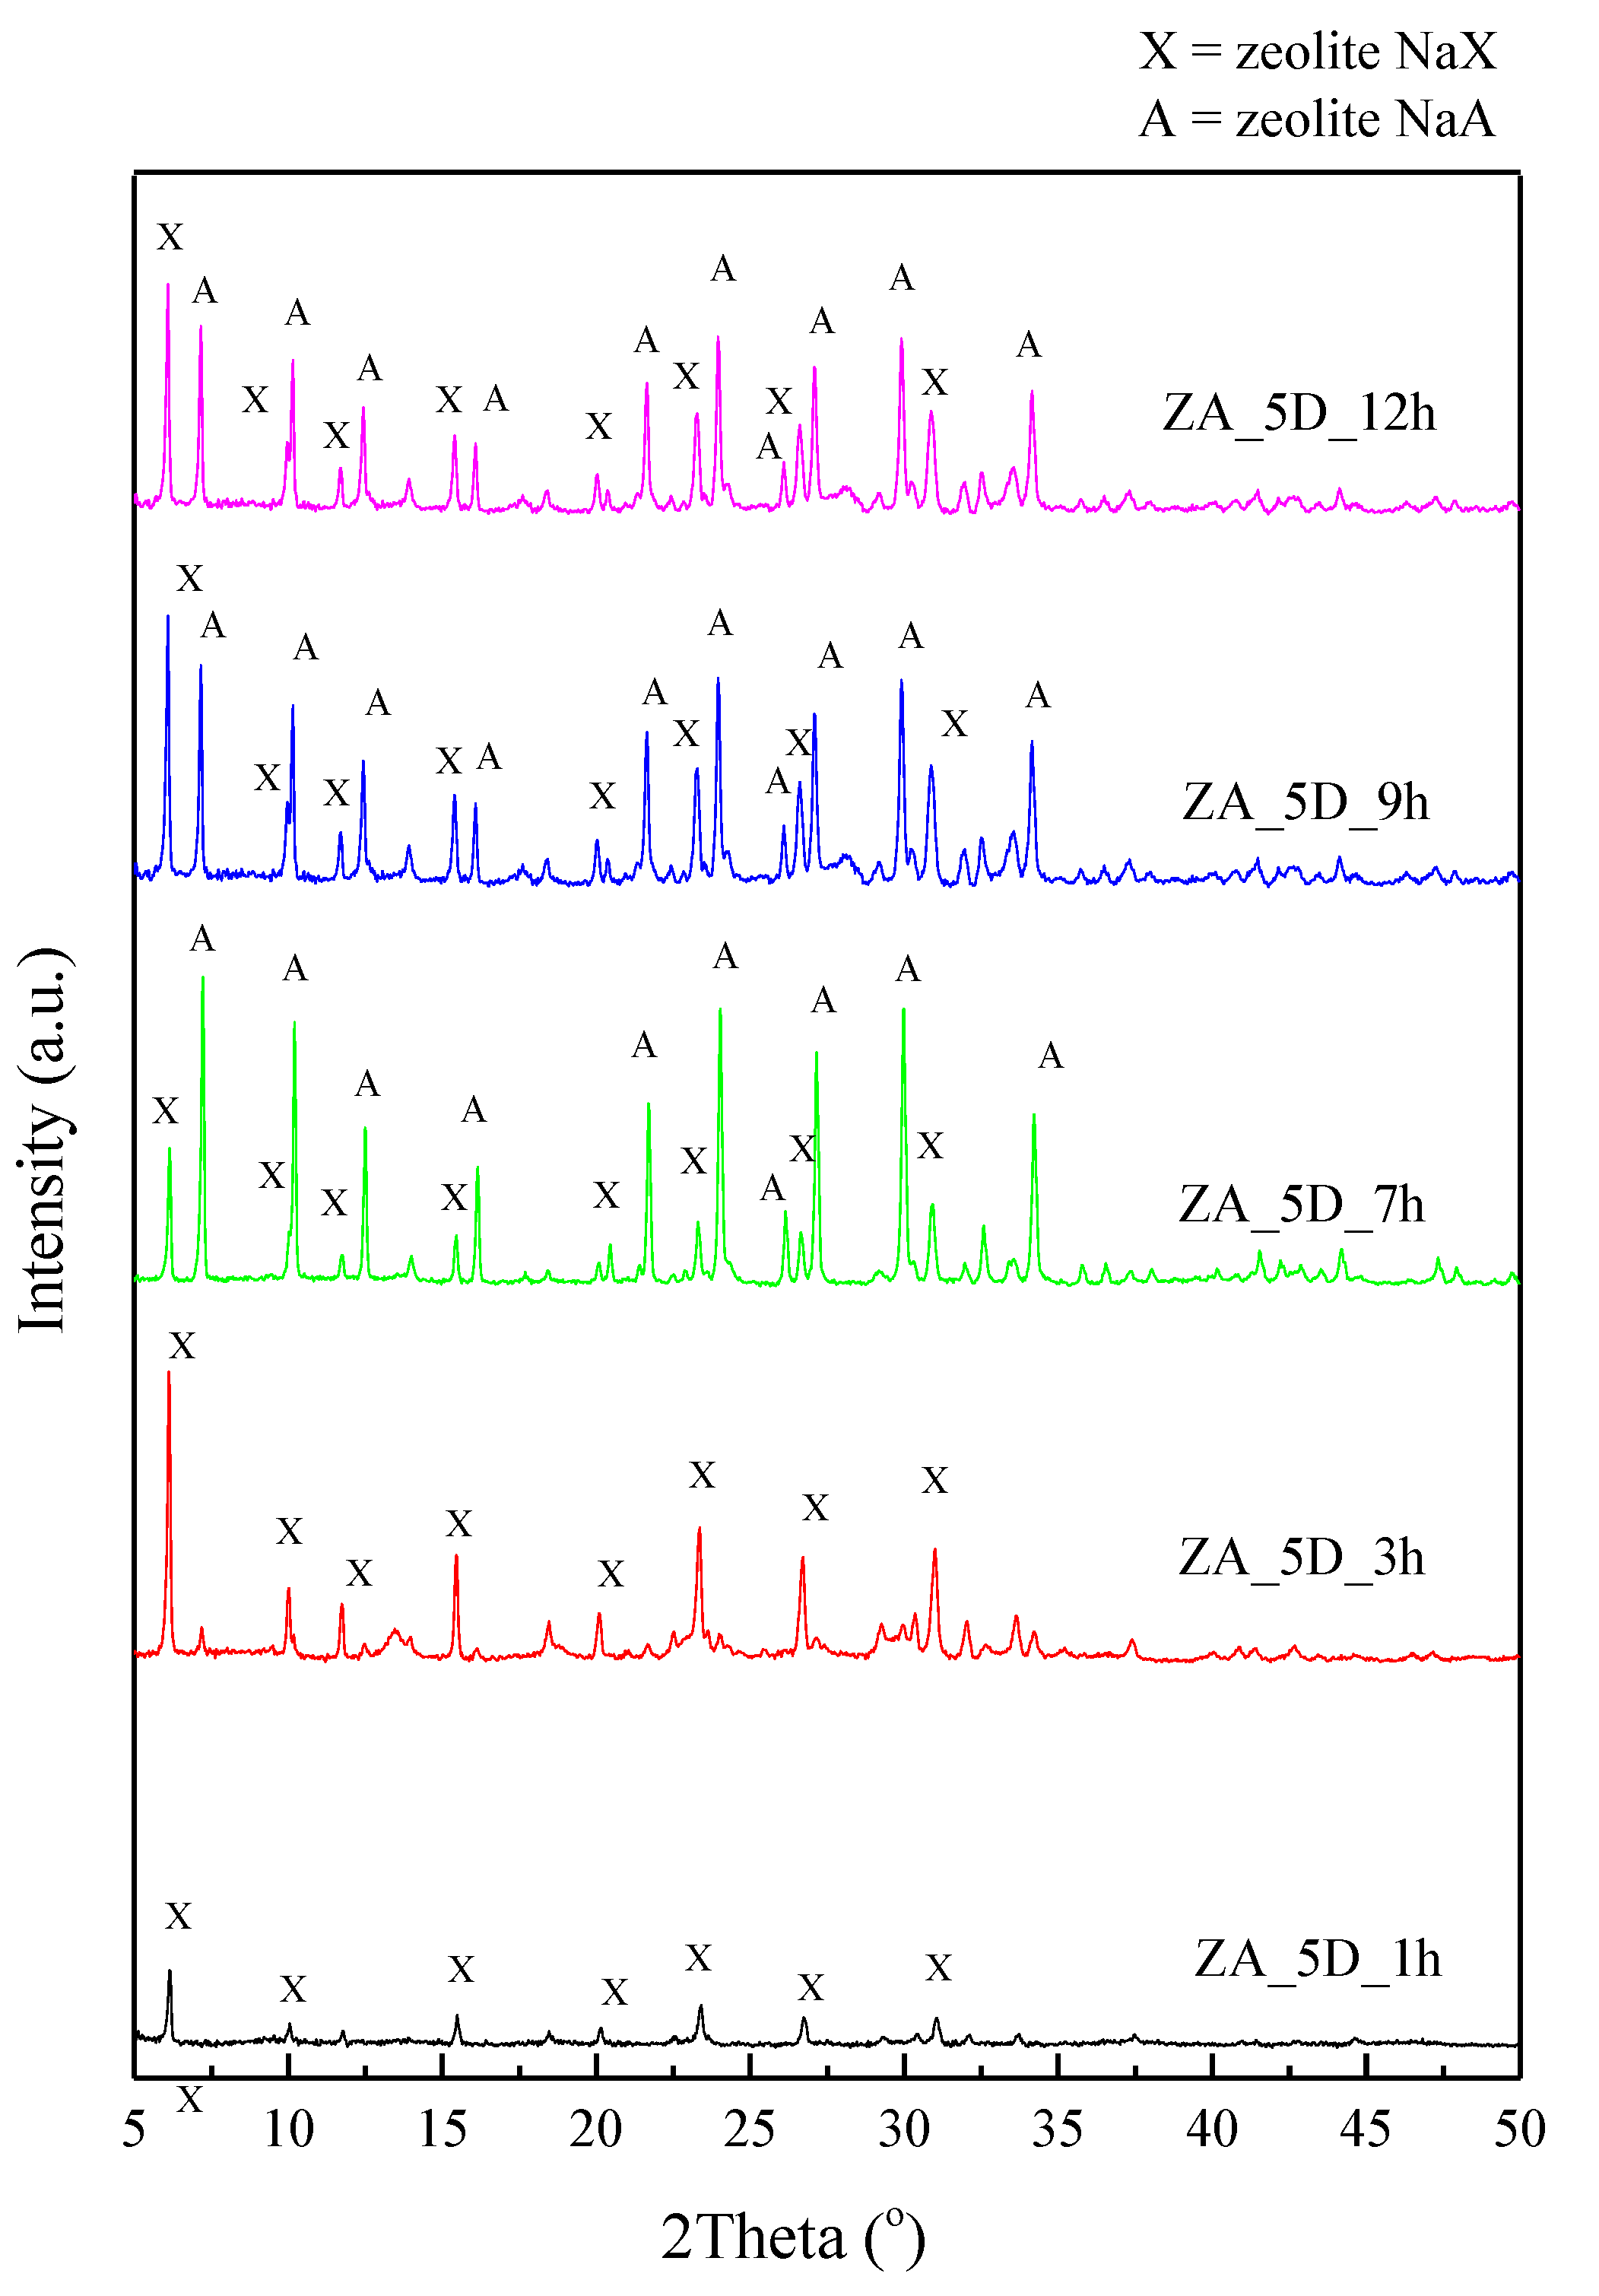
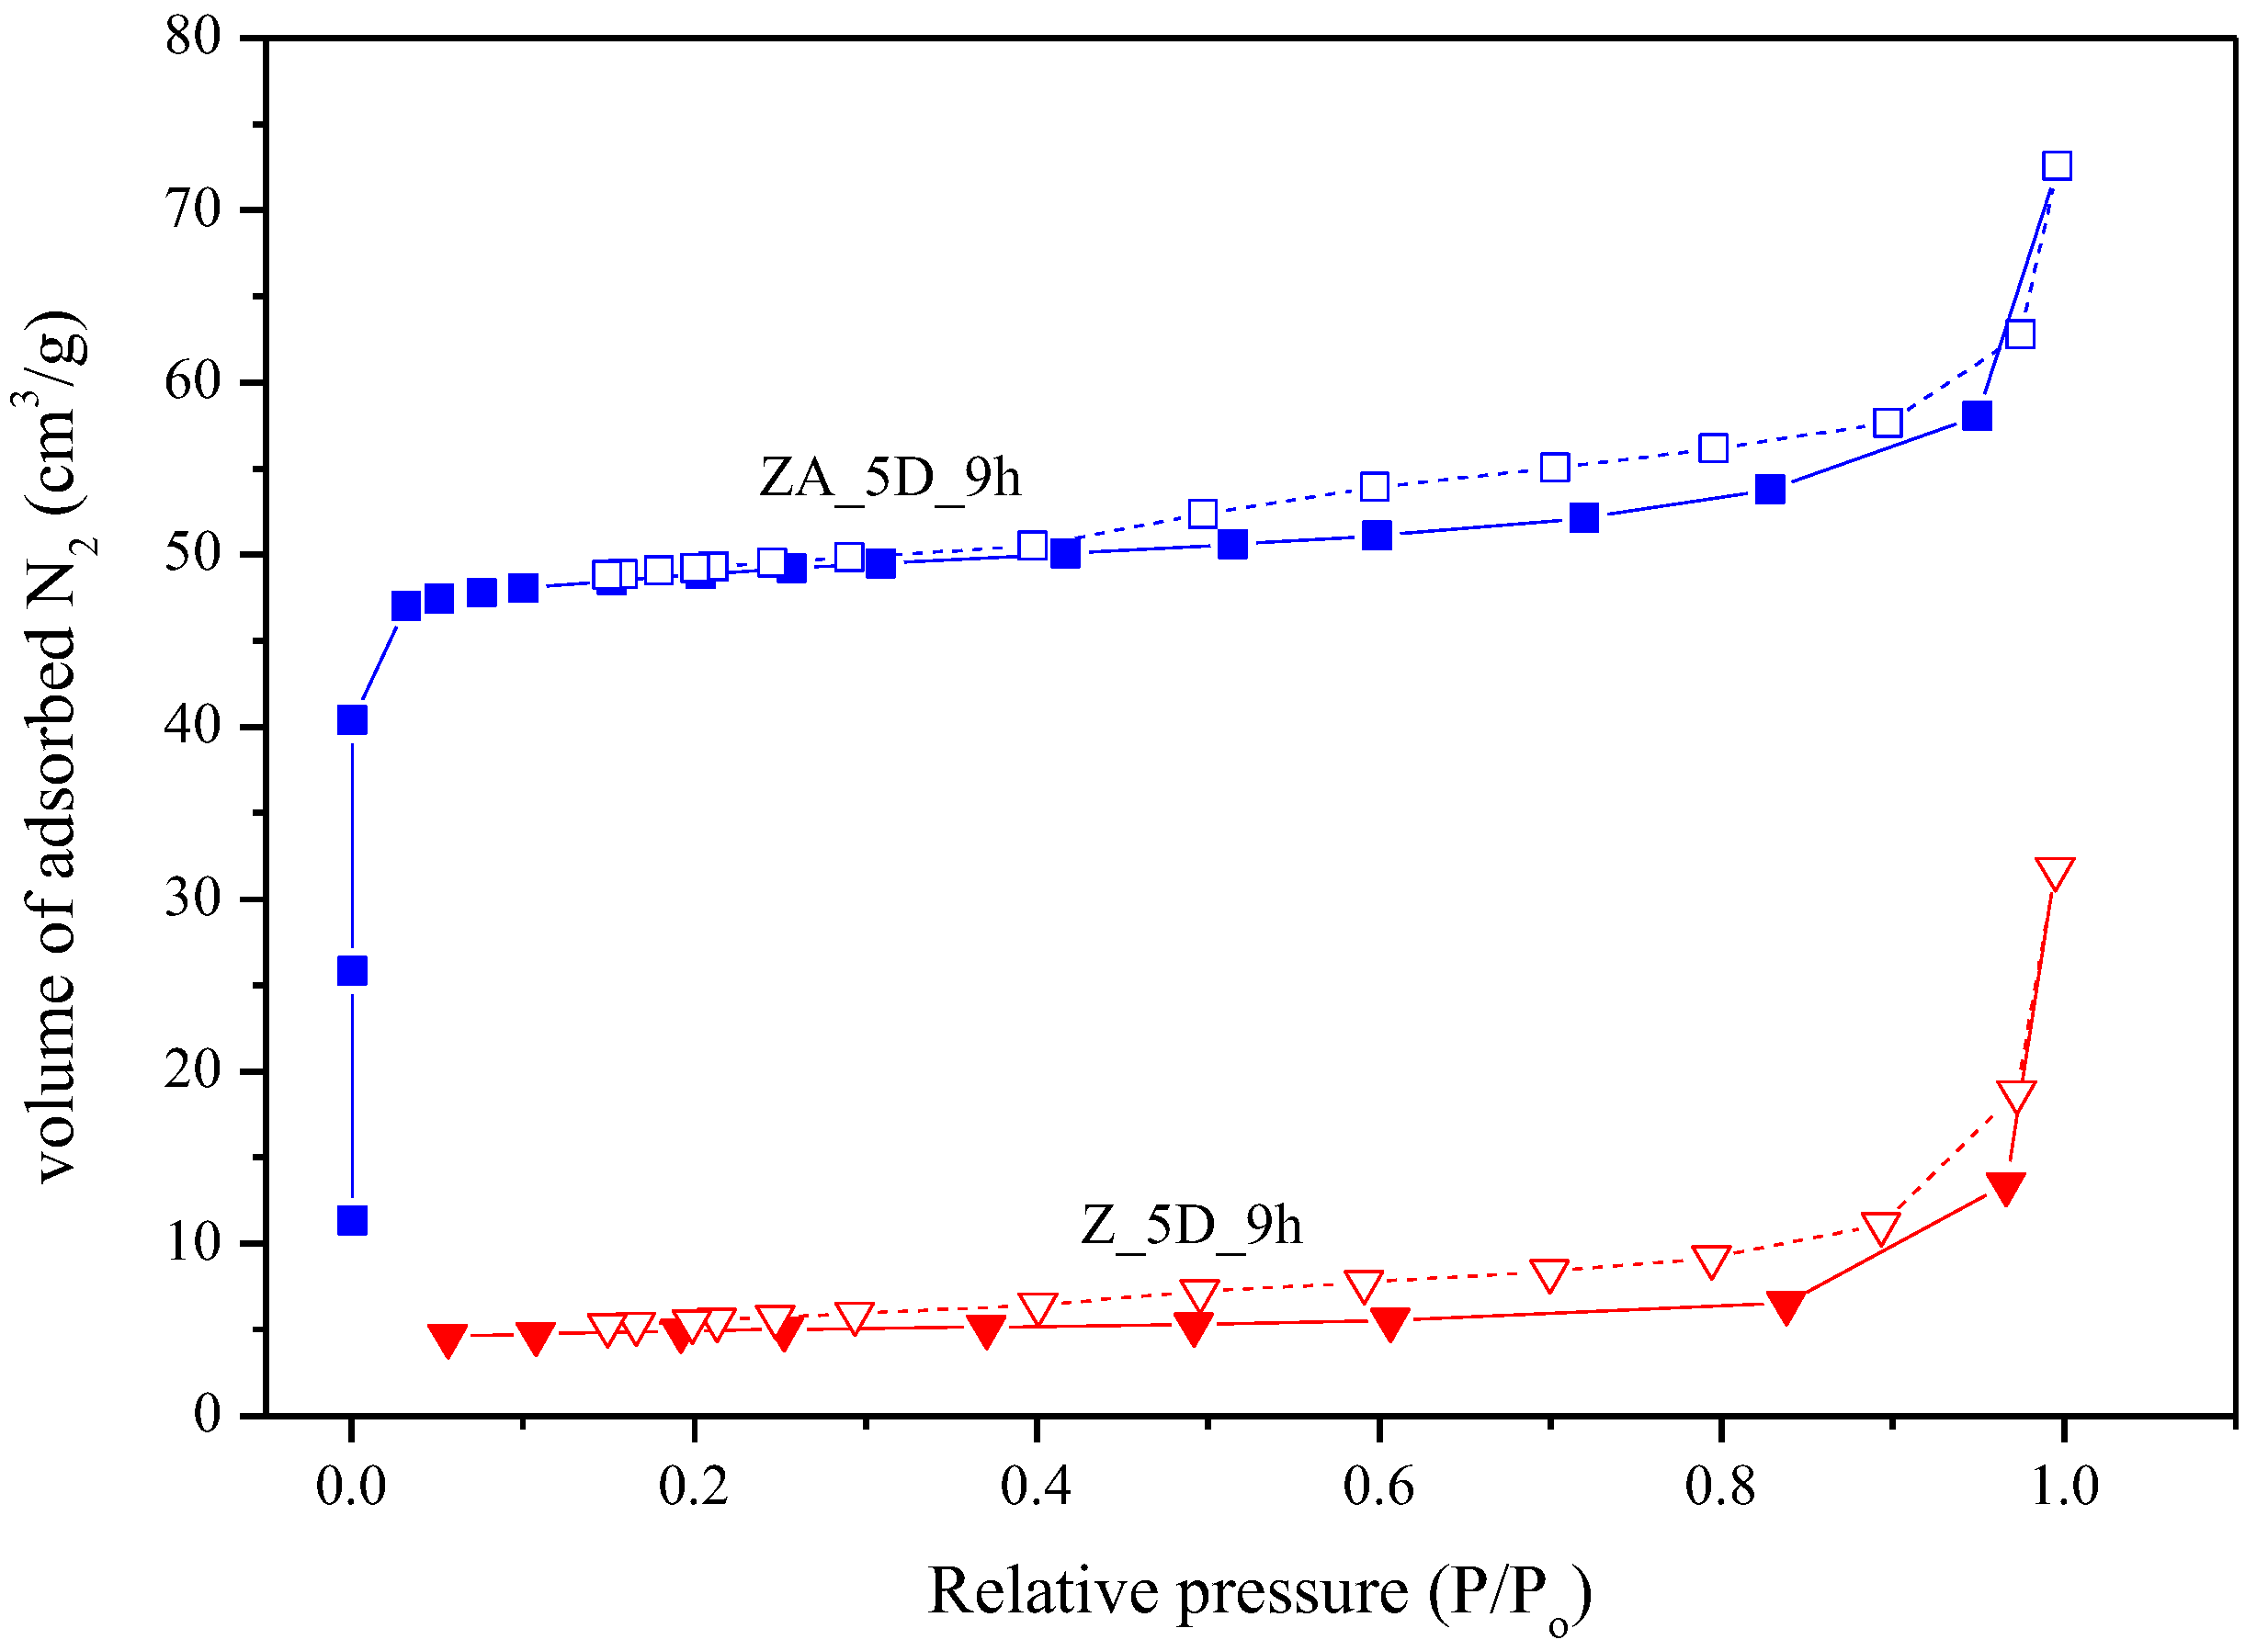
2.1. Effects of Different Synthesis Conditions on Zeolite Properties

Two zeolite samples with the same molar composition of precursor were prepared by using the same aging (1, 3, 5, and 7 days) and crystallization time (9 h), but the different synthesis parameter was the addition of organic phase (CTAB and heptane). Figure 1 illustrates the effect of organic phase addition and aging time on zeolite crystallinity by comparing zeolite with (ZA samples) and without (Z sample) organic phase addition at aging times of 1, 3, 5, and 7 days with crystallization time of 9 h. Zeolite without addition of CTAB and heptane cannot be formed within 1 day of aging time, which was indicated by no diffraction patterns of this sample. After 3 days of aging time, the characteristic signals of zeolite NaA with small amounts of zeolite NaX reflections were observed, and these peak intensities were slightly increased with aging time. Therefore, in this case, it seems that increased aging time did not affect zeolite crystallinity. In contrast, the zeolite sample with organic phase addition showed a different behavior. Zeolite can be formed within 1 day of aging time with high characteristic reflection intensity of zeolite NaA and low intense signals of zeolite NaX. The intensity of the characteristic zeolite NaX signals were gradually increased with increased aging time while that of zeolite NaA signals were decreased. Therefore, the addition of CTAB and heptane altered the zeolite structure by increasing zeolite crystallinity. Moreover, aging the reaction mixture before crystallization also affected to zeolite properties. Increasing aging time led to a larger amount of zeolite NaX phase, which is beneficial for CO2 diffusion since zeolite NaX exhibited high surface area and pore volume. However, the crystallinity of zeolite with 7 days aging time was not different from zeolite with 5 days of aging time. Therefore, an optimal aging time was 5 days with addition of CTAB and heptane, which can improve the zeolite crystallinity.
Comparison of morphology between zeolite with and without organic phase addition for aging times of 1, 3, 5, and 7 days and crystallinity of 9 h are shown in Figure S1. Zeolite without addition of CTAB and heptane (lefthand side) exhibited almost spherical shape for all samples, with an average particle size of 2–4 μm. These results were in agreement with X-ray diffraction (XRD) results that increasing aging time was not affected to zeolite crystallinity. For the other kind of zeolite with organic substances addition, all figures on the righthand side exhibited a different shape to a former kind of zeolite. The octahedral and cubic shape, which corresponded to a characteristic shape of zeolite NaX and NaA, respectively, were observed. Moreover, both features of the characteristic shape were more clearly observed upon increased aging time. At 5 days of aging time, the octahedral crystal shape appeared as a main component, which also corresponded with the XRD pattern as described above. From the XRD and SEM results, the conclusion is that addition of CTAB and heptane promotes crystallinity and that an optimal aging time is 5 days. This can indicate that the addition of additives and aging the reaction mixture for a period of time play an important role on zeolite properties by perturbing the nucleation process.
Another synthesis parameter was crystallization time. The crystallization time was varied as 1, 5, 7, 9, and 12 h. Zeolite was prepared with the same molar ratio as above with addition of CTAB and heptane and aging the reaction mixture for 5 days and then heating the zeolite gel at 100 °C for 1, 5, 7, 9, and 12 h. Figure 2 illustrates XRD patterns of zeolites synthesized by optimal condition with different crystallization times. Only zeolite NaX phase was observed when crystallization time was 1 h, and upon increasing the crystallization time, characteristic signals of zeolite NaA were also found. These characteristic signals of zeolite NaA and NaX co-existed until 12 h of crystallization time and the pattern was not different from the XRD pattern of synthesized zeolite with 9 h crystallization time. Therefore, an optimal crystallization time was 9 h. Figure S2 displays SEM images of the zeolite sample with different crystallization times. Both octahedral and cubic crystal shape co-existed in the zeolite sample with 5, 7, 9, and 12 h crystallization time. Figure 3 shows N2 adsorption–desorption isotherms of both kinds of zeolites (with and without organic substances addition). The N2 uptake of ZA_5D_9h was much higher than that of Z_5D_9h. The presence of a hysteresis loop in the isotherm may be caused by the occurrence of intercrystalline pores, which often occurs in the case of microporous systems, such as zeolites. Table 1 shows the surface area and pore volume of synthesized zeolite for comparing the effect of different synthesis conditions on those zeolites’ properties. The specific surface area and pore volume of zeolite with organic phase addition (ZA_5D_9h) was much higher than that of zeolite without addition of those substances (Z_5D_9h). The results of N2 adsorption–desorption agreed with XRD and SEM results, namely, that the addition of CTAB and heptane can improve zeolite crystallinity and also improve its surface area and pore volume. In order to show the role of CTAB and heptane on enhancing those zeolites’ properties, in situ small angle X-ray scattering and wide-angle X-ray scattering were conducted, which will be discussed in the next section.

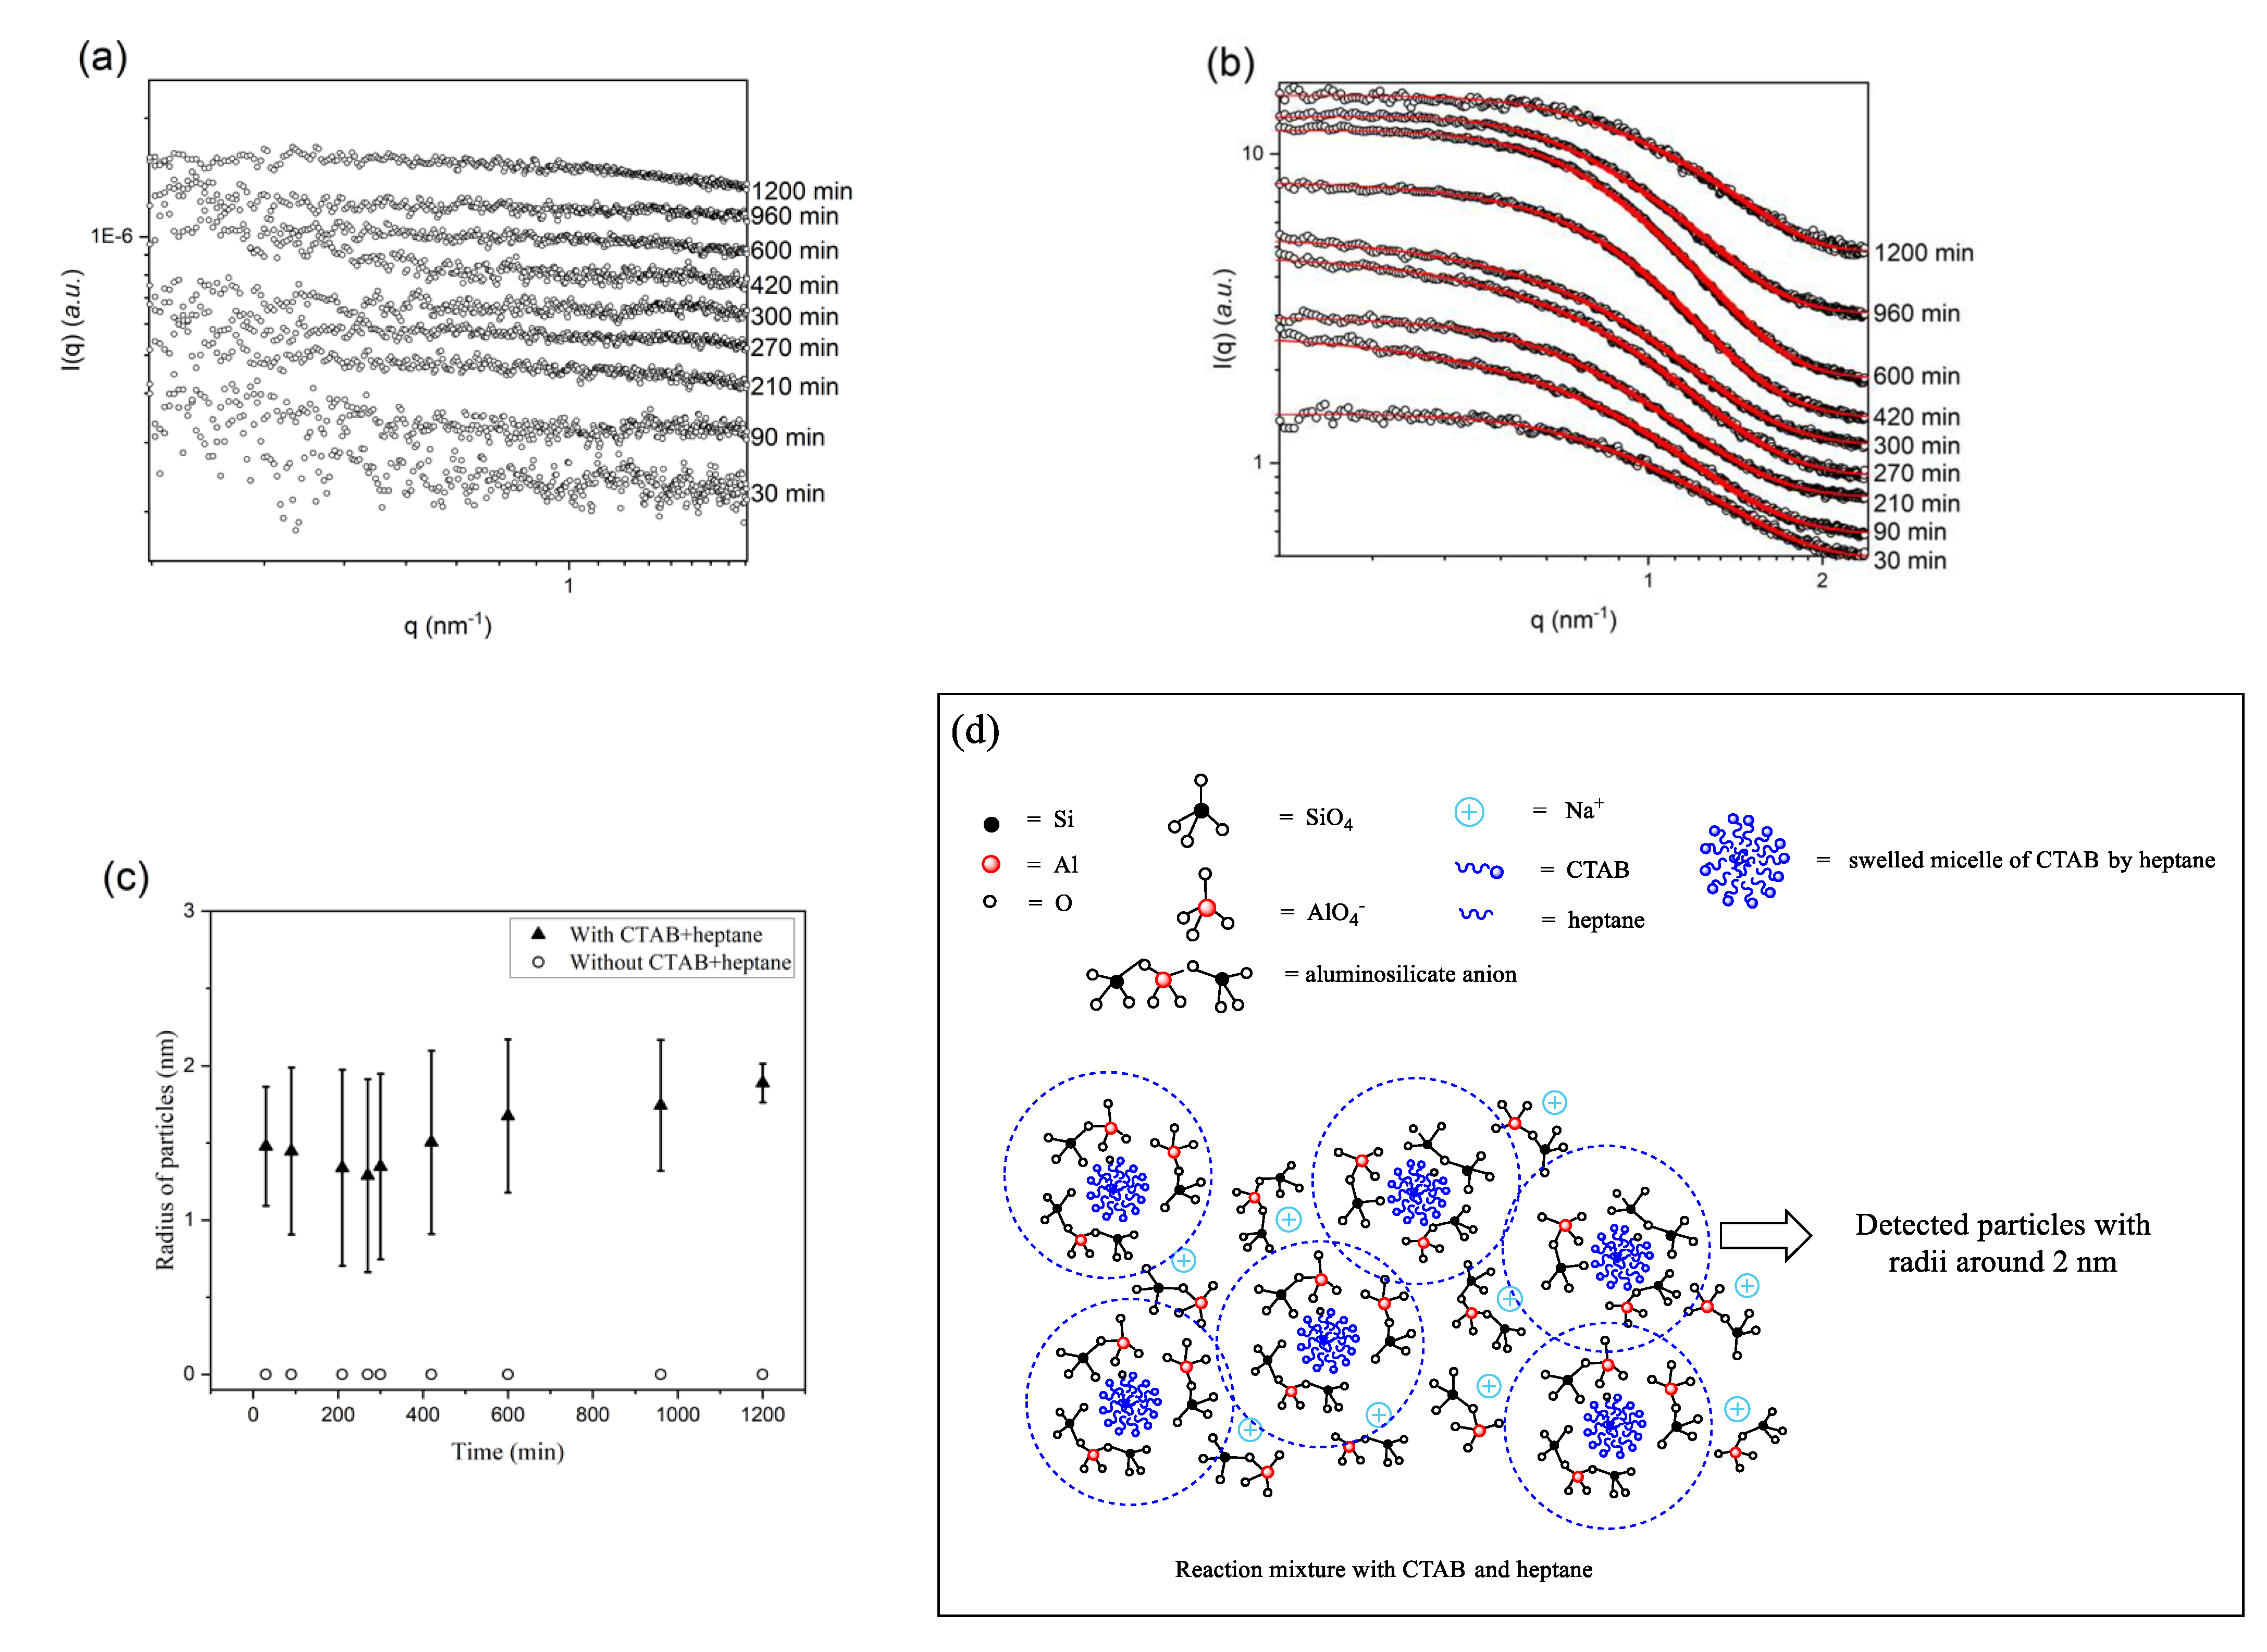
2.2. Effects of CTAB and Heptane on Enhancing Zeolite surface Area and Porosity Investigated by SAXS and WAXS

Based on the above results on structure, morphology, and surface properties of synthesized zeolite, addition of CTAB and heptane can promote high surface area and pore volume. In our previous work [37], we reported that addition of CTAB and heptane during zeolite synthesis process can improve the surface area and pore volume, which can also promote the CO2 adsorption and selectivity. We proposed that the cationic polar head group around the CTAB micelle can promote the formation of alumino-silicate anion, and then the rate and number of nuclei formation was increased. Moreover, the addition of heptane also promoted the rate of nuclei formation by entering inside the CTAB micelle, and then the CTAB micelle was swelled. As a result of the swelling effect by heptane, the swelled CTAB micelle exhibited higher charge density, leading to higher affinity to alumino-silicate anion formation, which can increase the number and rate of nuclei formation. This promoting mechanism by CTAB and heptane was believed to occur during the aging process. In order to prove the above proposed zeolite formation mechanism, investigating the formation of nuclei particle as a function of time by in situ experiment must be employed. An appropriate in situ technique to monitor the nucleation precursor formation during aging period is small-angle X-ray scattering. Comparing both kinds of zeolites, addition of CTAB and heptane can provide a zeolite within 1 day of aging time, while for the no additives addition, the zeolite gel must be aged for 3 days. Therefore, the addition of CTAB and heptane are an important factor in accelerating the formation of zeolite. To demonstrate this proposed mechanism, an in situ experiment by SAXS technique on Beamline 1.3 at SLRI was conducted.
At this beamline, the particle range of 1–100 nm can be detected, which is the range of expected nuclei particle size for this case. The in situ SAXS experiment for monitoring the nucleation precursor was conducted by mixing the silicon and aluminum sources and then sampling the zeolite gel at interval times during the aging period (24 h). The SAXS data at various sampling times were analyzed to obtain the radius of particles during the aging process. In the absence of CTAB and heptane in the reaction mixture, there was only a flat line to observe in the SAXS profiles, as shown in Figure 4a, indicating no nanoparticles in the reaction. The intensity of the SAXS profiles while in the presence of organic phases is shown in Figure 4b. The size and size distribution results from the fits of SAXS profiles of the reaction mixture with and without additives are shown in Figure 4c. The fitting result indicated that the reaction mixture with additives exhibited a detected particle with the radii of particles around 1–2 nm. Before the reaction time at 420 min, the radii of particles seemed to insignificantly change with broad size distribution. The radii of particles were found about 1.48 ± 0.39, 1.45 ± 0.54, 1.34 ± 0.64, 1.29 ± 0.63, 1.35 ± 0.60, and 1.51 ± 0.59 at 30, 90, 210, 270, 300, and 420 min, respectively. Next, the size of the particles lightly increased to almost 2 nm, which they are 1.68 ± 0.50, 1.74 ± 0.43, and 1.89 ± 0.1 at 600, 960, and 1200 min, respectively. However, the radius of particle was zero for the reaction mixture without additives, indicating no nuclei formation during aging time. These results show that the addition of CTAB and heptane promotes the nucleation precursor formation by increasing numbers and rate of nuclei formation. These results can confirm the above proposed role of those organic phase additions during the zeolite formation process, which can be expressed as Figure 4d.
After the in situ investigation by SAXS experiment, the crystallinity of zeolite during the crystallization process was also conducted. Both types of zeolites reaction mixtures were subjected to crystallization process by heating two reaction mixtures at 100 °C and then sampling the synthesized product at interval times for measuring WAXS. For in situ WAXS, the crystallinity of the sample as a function of time can be obtained by analyzing the WAXS pattern. Figure S3a,b shows WAXS patterns of both cases of zeolite (with and without additives) at different times. The characteristic signals of silicon and aluminum precursor were observed and those signals’ intensities were gradually decreased with increased crystallization time for both cases. For zeolite with additives, the characteristic reflections of zeolite NaX were observed at 240 min and that of zeolite NaA appeared to coexist at 420 min. All characteristic signals of NaX and NaA of zeolite with additives exhibited a slightly higher characteristic peak than that of the zeolite without additives, which indicated that the addition of CTAB and heptane can promote the formation of zeolite.

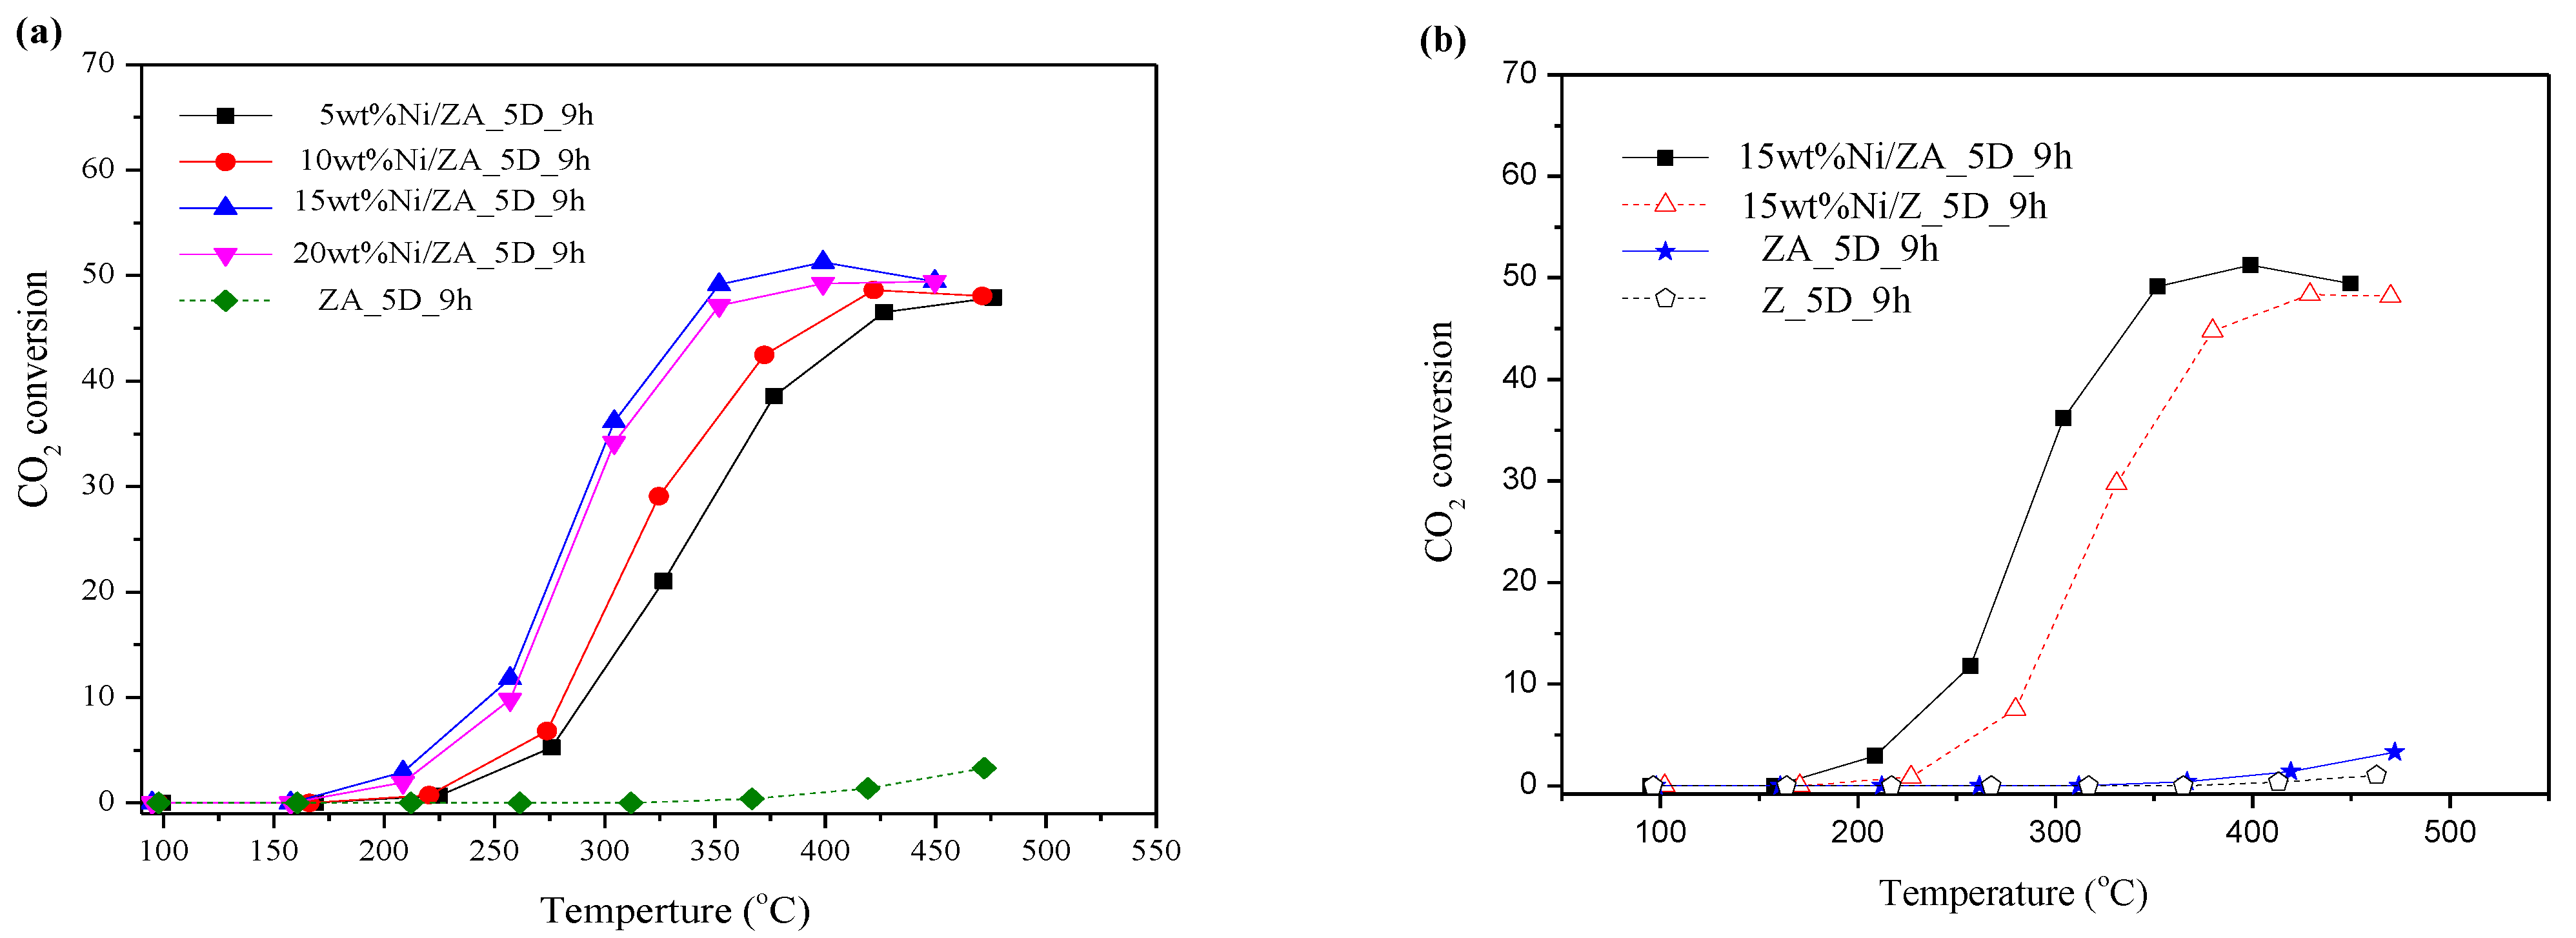
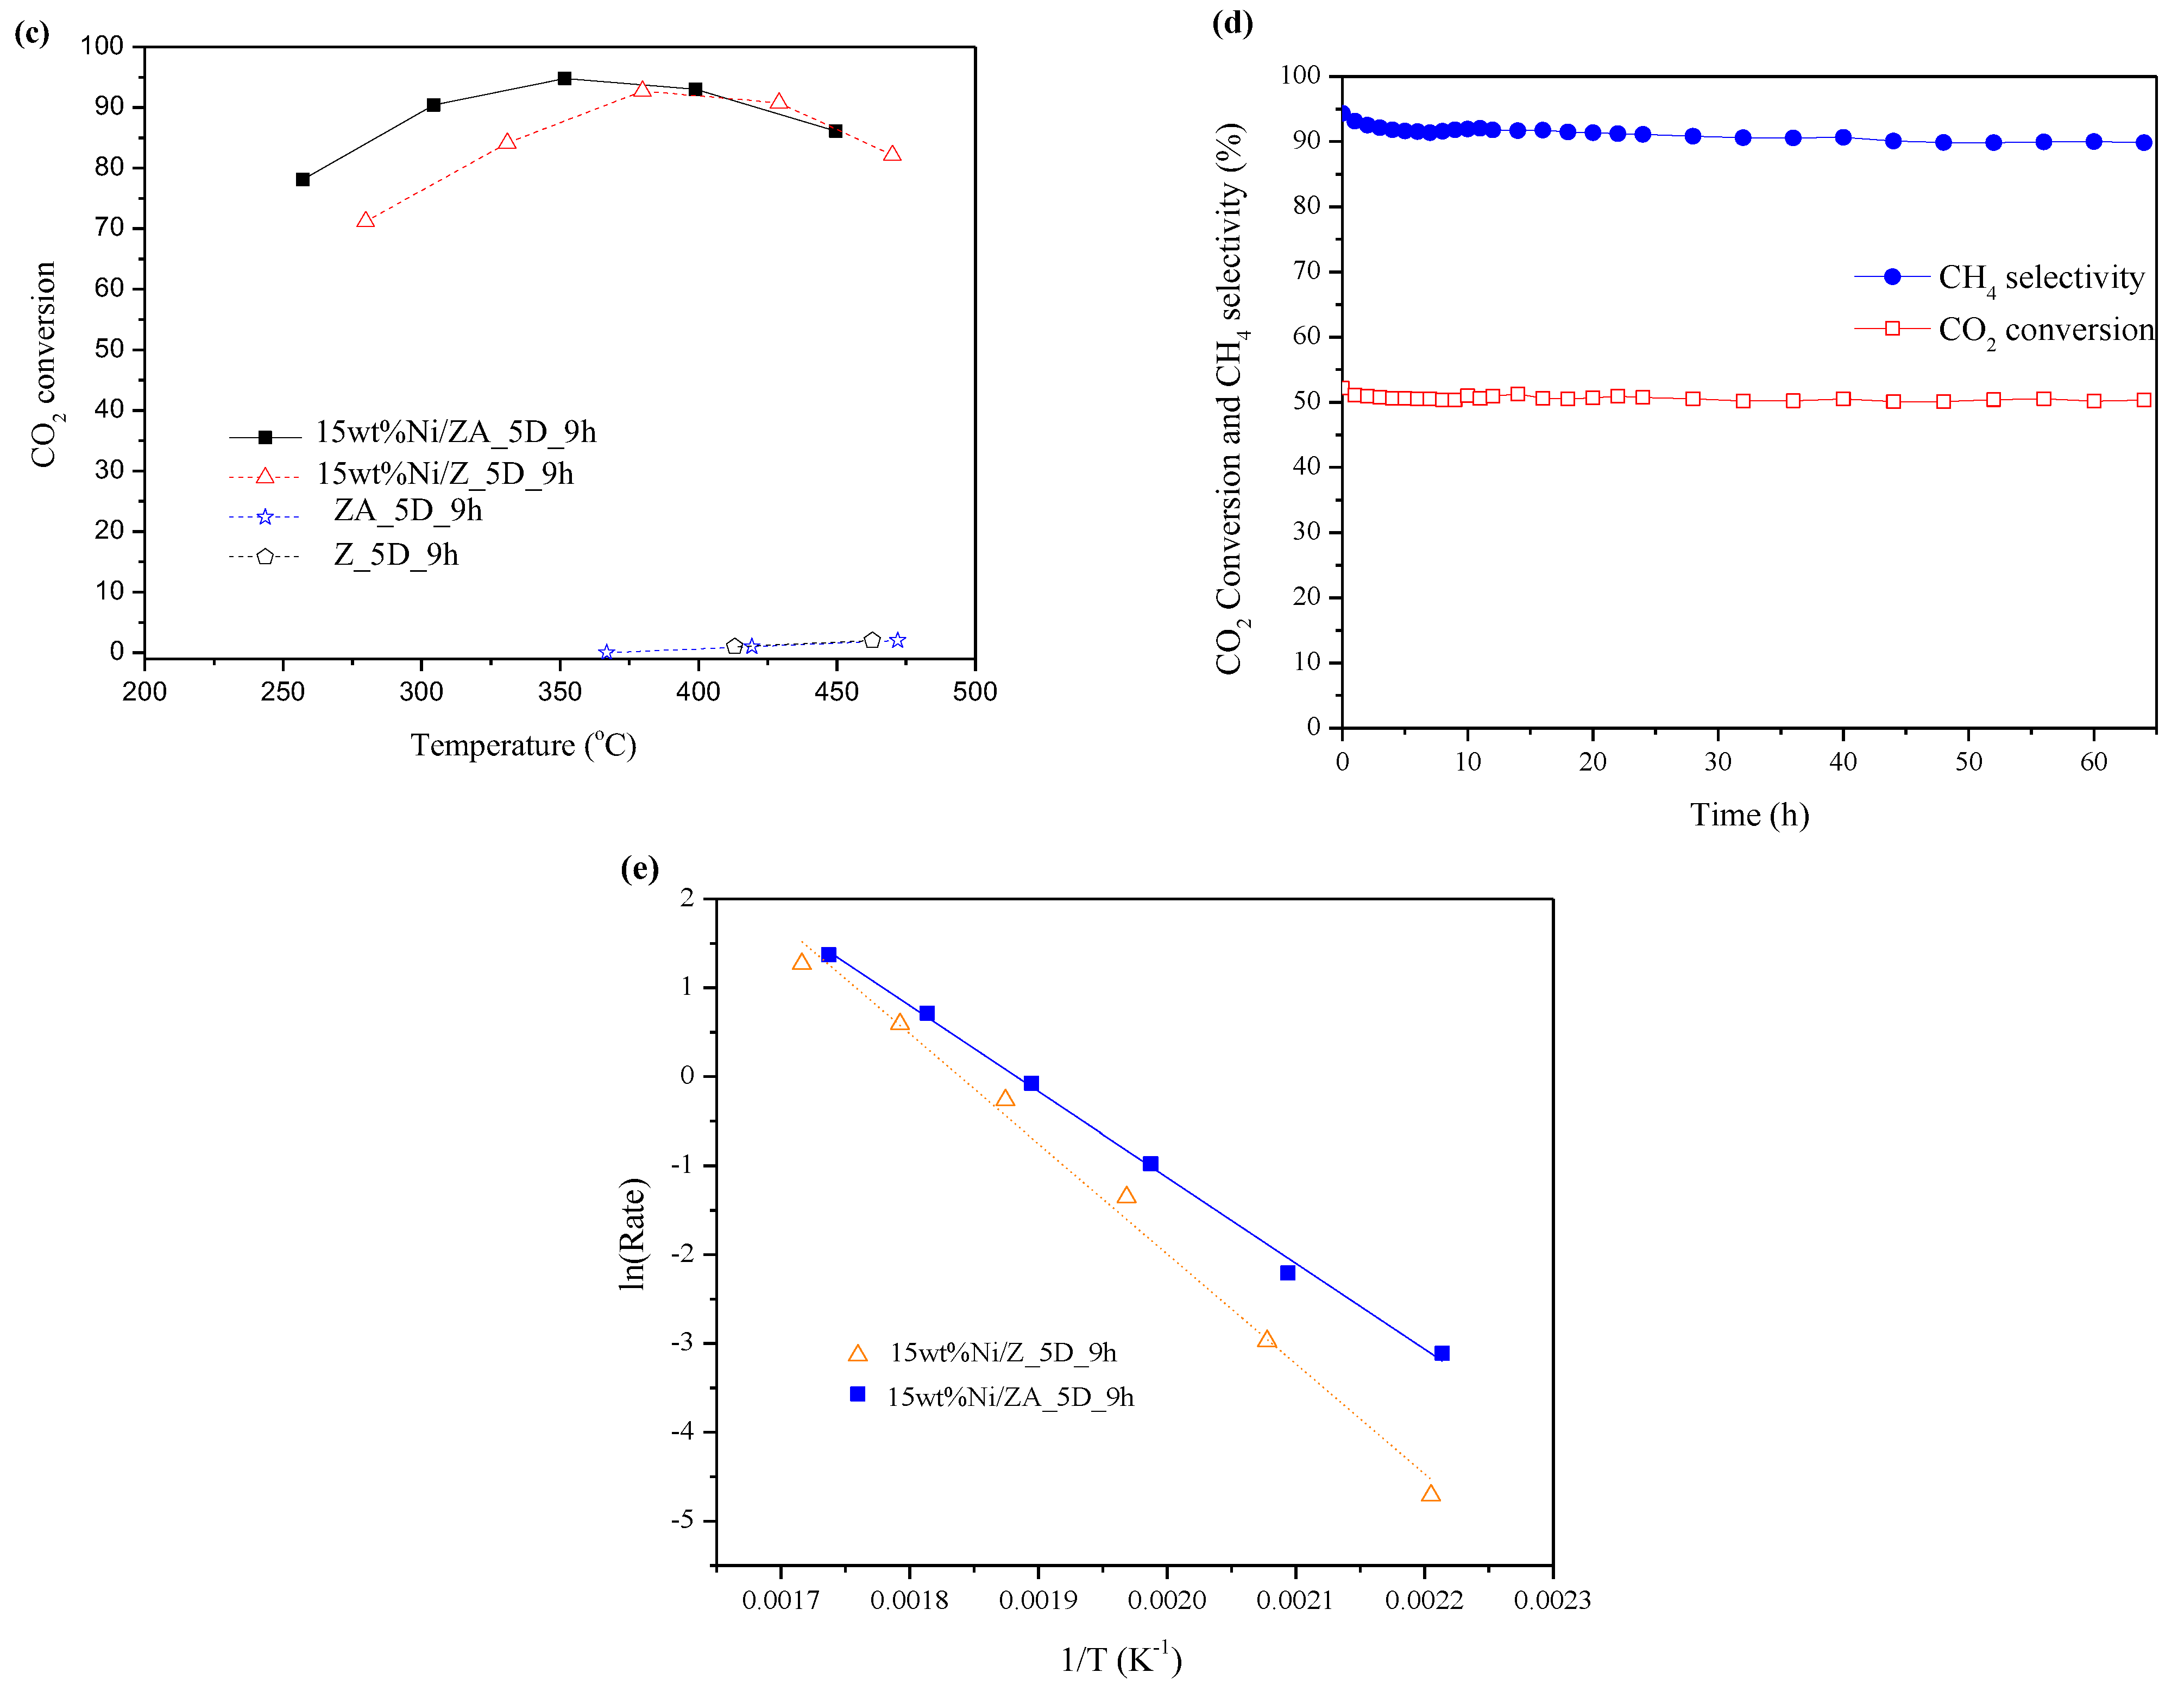
2.3. CO2 Methanation Catalytic Activity

In this section, synthesized zeolite with the optimal synthesis condition (aging time of 5 days and crystallization time of 9 h with addition of CTAB and heptane) was used as a catalyst support for catalyzing CO2 methanation by impregnating various amounts of nickel. Figure 5a CO2 methanation catalytic activity of 5, 10, 15, and 20wt%Ni impregnated on ZA_5D_9h support was compared with bare zeolite support. Bare zeolite supports were shown to be nonactive for CO2 methanation, even though reaction temperature was increased to 500 °C. Upon impregnating Ni species onto zeolite supports, the CO2 methanation catalytic activity was much enhanced. These results indicated that Ni species play an important role in catalyzing this reaction. Increasing Ni content, the catalytic activity was increased (increased conversion and shifting the conversion to lower temperature). However, higher Ni content over 15wt% led to lowering of CO2 methanation catalytic activity since high Ni loading amount would cover and block the zeolite surface area. Therefore, 15wt%Ni impregnated is the optimal content for maximizing the reaction rate.
In order to study the effects of zeolite supported with different surface area and pore volume on the catalytic activity, 15wt%Ni impregnated on zeolite without additives (Z_5D_9h) was also compared, as shown in Figure 5b. The catalytic activity of 15%Ni/Z_5D_9h was lower than that of 15%Ni/ZA_5D_9h. This indicated that bare zeolite support with high surface area (ZA_5D_9h = 166 m2/g) can provide more availability area for dispersing of Ni species. However, the surface area of 15%Ni/Z_5D_9h was slightly higher than that of 15%Ni/ZA_5D_9h, but its catalytic activity was lower. This indicated that Ni species was the main component to dominate the catalytic activity, and because of CO2 methanation, a larger amount of H2 dissociative to H atom was needed. Therefore, the state of Ni on different supports also should be different, and this point will be discussed in later.
Figure 5c illustrates CH4 selectivity of Ni impregnated on zeolite with and without organic phase addition catalyst and two bare zeolites. The results show that 15%Ni/ZA_5D_9h exhibited the highest CH4 selectivity around 95% at 350 °C and CH4 selectivity around 90% in wide temperature window (300–475 °C), while 15%Ni/Z_5D_9h exhibited lower CH4 selectivity (~90%) with narrow temperature window (350–450 °C). Figure 5d shows stability test of 15%Ni/ZA_5D_9h catalyst for CO2 methanation at 400 °C during 70 h. At the beginning of the reaction, CH4 selectivity and CO2 conversion were slightly dropped, and then those two values were almost constant during the entire 70 h. It indicated that this catalyst had high stability. The apparent activation energy (Ea) of 15wt%Ni/ZA_5D_9h and 15wt%Ni/Z_5D_9h catalyst was determined by using Arrhenius plot, as shown in Figure 5e. The slopes of ln(rate) vs reciprocal of absolute temperature are used to calculate the apparent activation energy, which are 80.27 and 102.9 kJ/mol, respectively. The apparent activation energy of 15wt%Ni/ZA_5D_9h exhibited lower Ea than that of 15wt% Ni/Z_5D_9h, which corresponded to its higher catalytic activity.

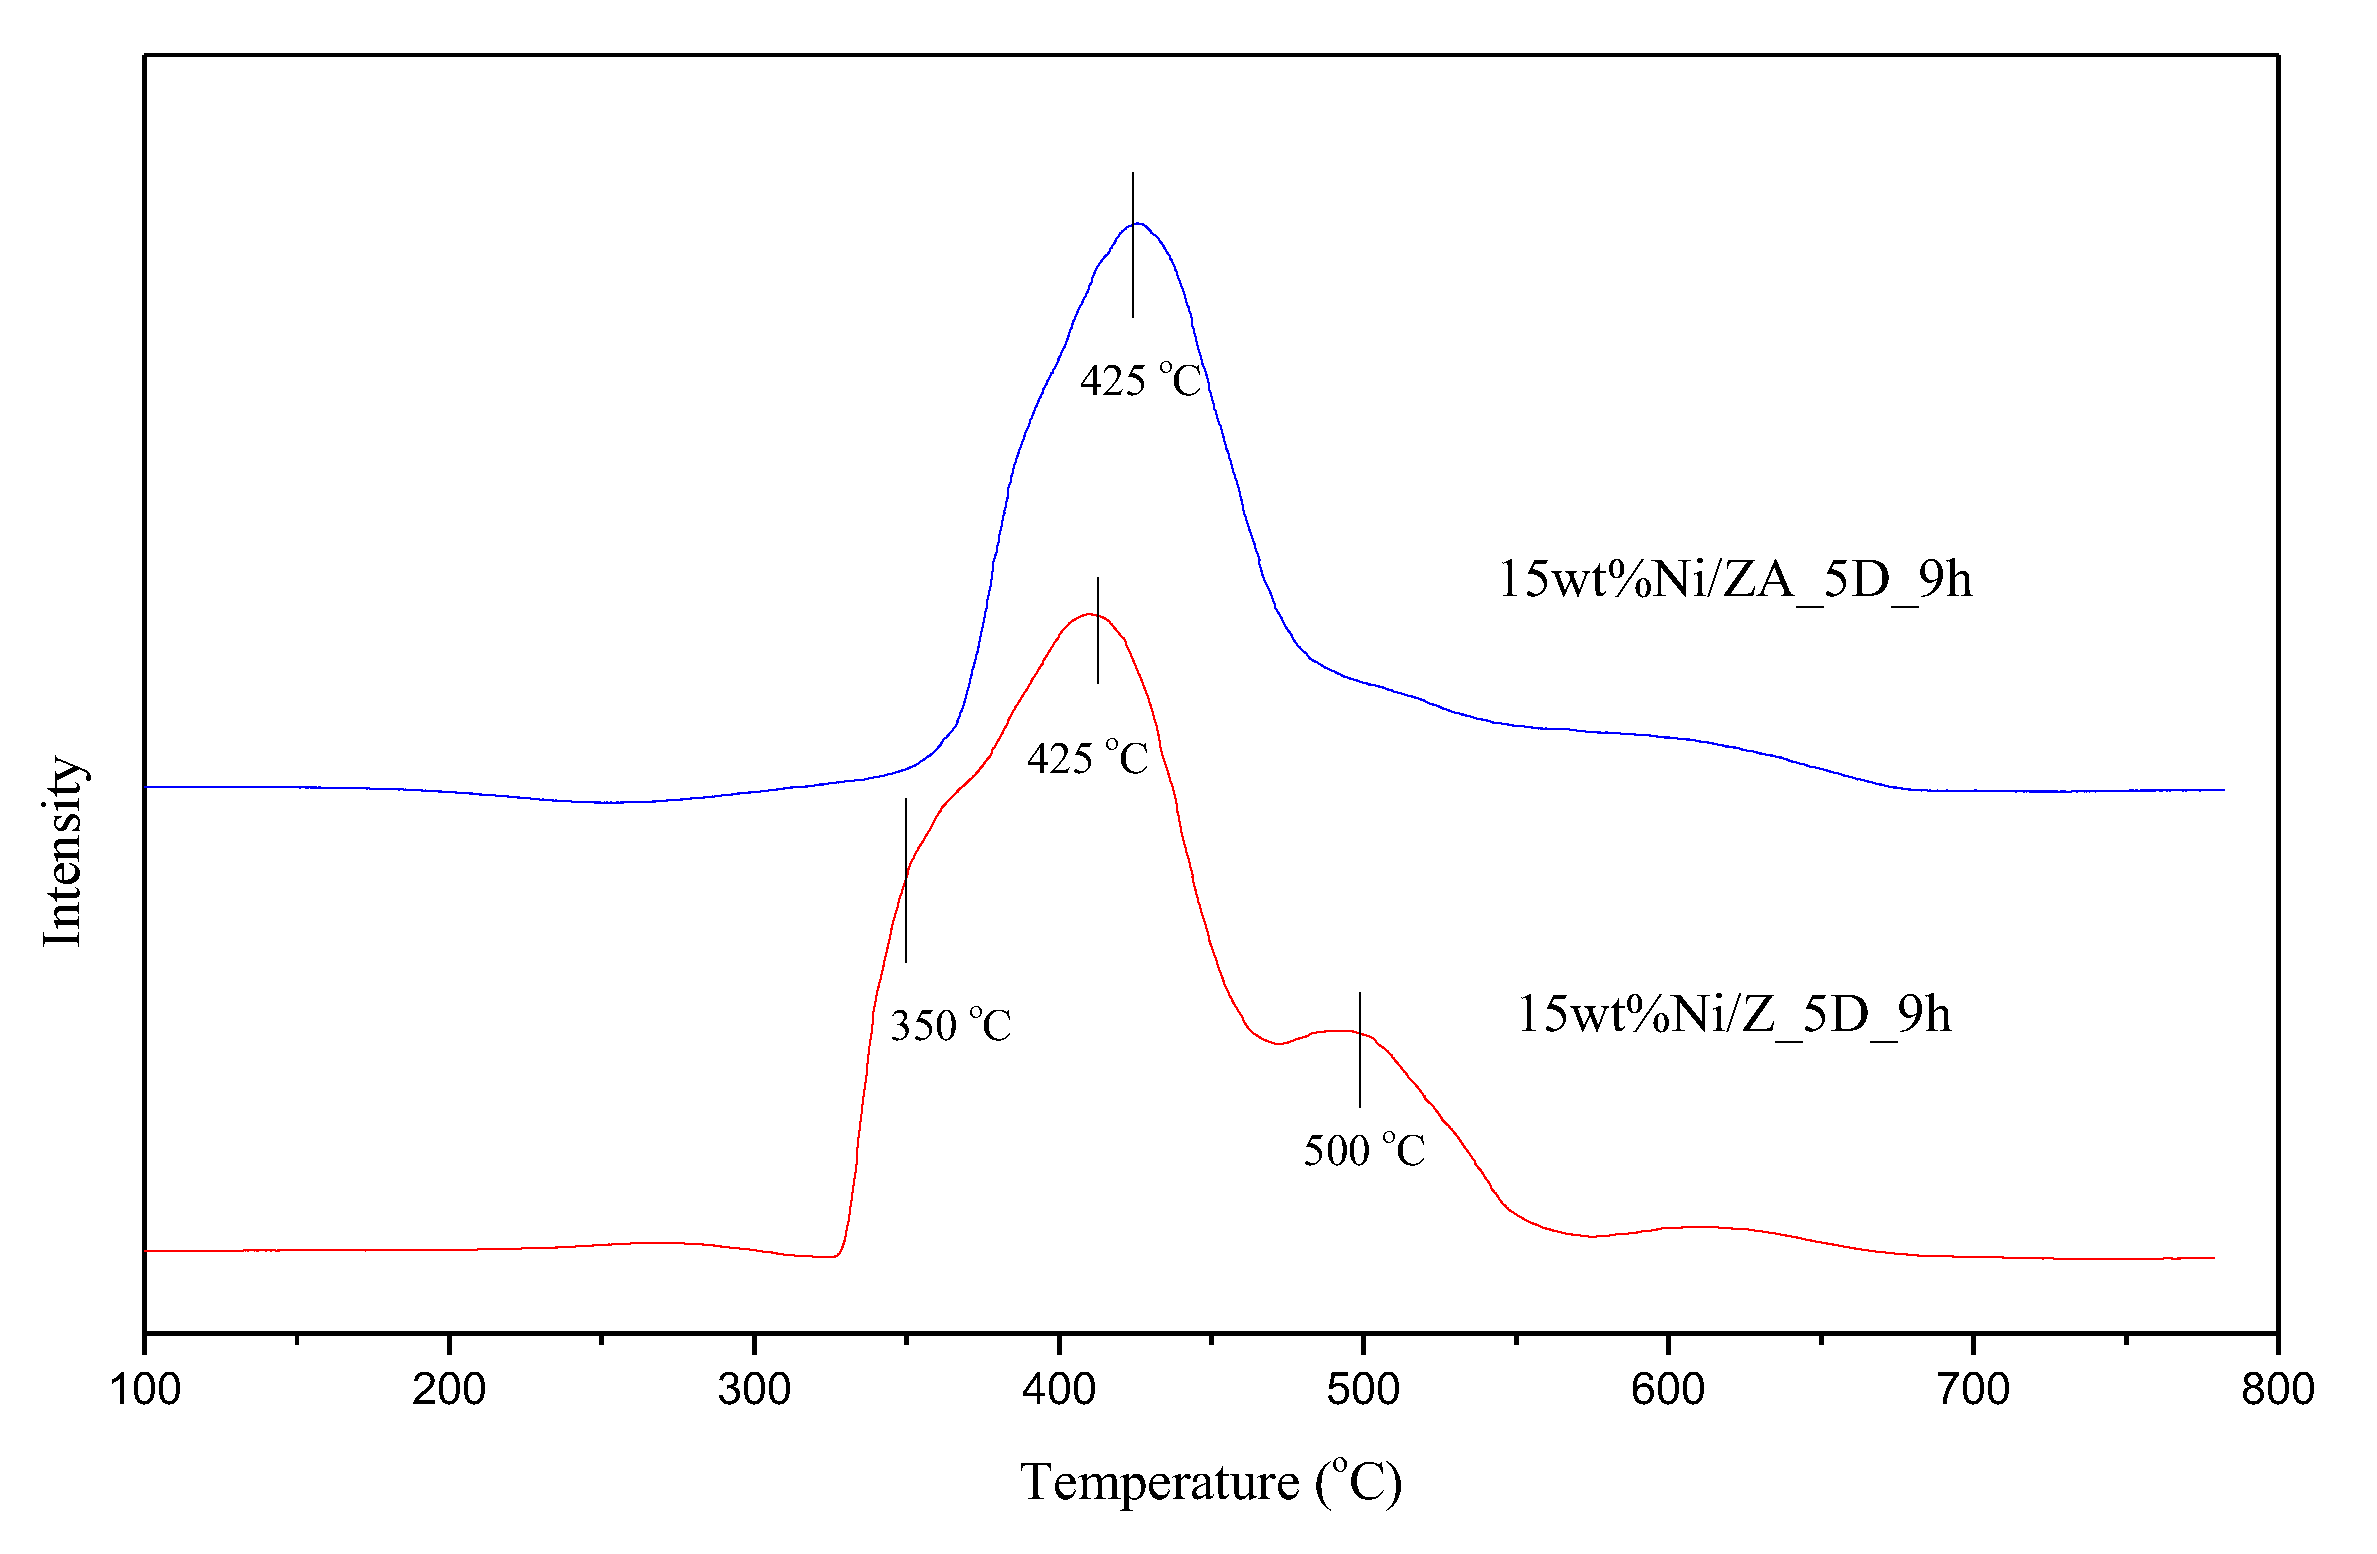
2.4. Catalyst Characterization

From the catalytic activity results, the optimal Ni content was 15wt%; thus, the effect of different support properties on the state of Ni was discussed in this section. Figure S4a displays the XRD patterns of bare zeolite (ZA_5D_9h) support and Ni impregnated on zeolite (15wt%Ni/ZA_5D_9h). Upon Ni loading on zeolite support, characteristic signals of both zeolite NaX and NaA decreased, which indicated lower crystallinity of the catalyst. Moreover, the additional characteristic reflections of NiO (111) and Ni (200) with higher peak intensity than that of zeolite support were also observed. This indicated that impregnated Ni species might exist on the surface of zeolite support. Figure S4b illustrates the N2 adsorption–desorption of 15wt%/ZA_5D_9h compared with 15wt%/Z_5D_9h. The N2 uptake of the former catalyst was lower than that of the latter catalyst. This probably is due to partial pore blocking of zeolite support by added Ni. The BET surface area of all catalysts is summarized in Table 1. Upon impregnation of Ni on the zeolite support, the specific surface area of the starting bare zeolite support was dramatically reduced (166.5 m2/g for ZA_5D_9h to 14.11 m2/g for 15wt%Ni/ZA_5D_9h). It indicated that lowering of the specific surface area was not affected by the catalytic activity. Since the catalytic activity of the catalyst was strongly dependent on adsorption of H2 and CO2 on the adsorption site, only the catalyst support or active metal cannot catalyze the reaction, i.e., the addition of Ni species on the catalyst surface acts as H2 adsorption site and zeolite support acts as CO2 adsorption site (this point will be evidenced in CO2 adsorption and CO2-TPD results). Consequently, both adsorption sites were needed for facilitating the reaction rate. However, the surface area of 15wt% Ni/Z_5D_9h was increased after being impregnated by Ni, which might be due to some agglomerated particles of impregnated Ni species that were covered on the zeolite particle, which led to an interpore between them and then resulted in higher porosity. According to SEM images of zeolite support (ZA_5D_9h) and 15wt%Ni/ZA_5D_9h catalysts in Figure S4c, the shape of the catalyst particle was not different from the original support, and the particle size was almost the same. From the above characterization results, the added Ni species existed on the catalyst surface; thus, mapping image of catalyst was used to investigate the dispersion of Ni species on zeolite support. Figure S5 displays SEM and mapping images of 15wt% Ni impregnated on zeolite with and without the addition of organic substances. The dispersion of detected Ni species on zeolite with organic phase addition was higher than that on zeolite without addition of those phases. The difference of surface area and pore volume of zeolite resulted in different dispersion of Ni species. The higher dispersion would lead to higher catalytic activity.
H2 TPR technique was used to investigate the reducibility of the catalyst and also to study the interaction between the Ni species and zeolite support. Figure 6 illustrates H2-TPR of 15wt%Ni/Z_5D_9h and 15wt%Ni/ZA_5D_9h. Both catalysts exhibited one main reduction band around 400–425 °C and one small reduction band around 600–650 °C. These peaks were assigned as reduction in NiO to metallic Ni [28,38,39]. For 15wt%Ni/ZA_5D_9h catalysts, only one main peak at 425 °C was observed, which showed that NiO was dispersed only on the catalyst surface. In the case of 15wt% Ni/Z_5D_9h, besides the main reduction peak at 400 °C, additional shoulders’ peaks at lower (350 °C) and higher (500 °C) temperatures were also found. These two additional peaks were attributed to different interactions between NiO and zeolite support. The reduction at low temperature (350 °C) was attributed to reduction in bulk NiO and higher temperatures (500 °C) to NiO interacting strongly with the support. It can indicate that the nonuniform dispersion would lead to different metal-support interaction, and then different reduction temperature was observed. It can be concluded that the main reduction peaks of both catalysts and the interaction between NiO and zeolite was different, i.e., the higher temperature reduction peak was attributed to stronger metal-support interaction. It has been reported that high-metal support interaction can promote the dispersion of metal on catalyst surface [28,40,41,42]. Therefore, from the H2-TPR results, 15wt%Ni/ZA_5D_9h exhibited higher uniform dispersion of NiO, which corresponded to the SEM mapping result. Moreover, high metal-support interaction can also suppress the sintering of Ni species under high reaction temperature. Considering the effect of different zeolite surface areas and porosity on NiO dispersion, ZA_5D_9h provided high surface area and pore volume; thus, NiO can be well dispersed on this support. In contrast, NiO cannot be uniformly dispersed on Z_5D_9h support because of its low surface area and pore volume; thus, a different interaction between NiO–zeolite support occurred, which corresponded to its lower catalytic activity.
In order to accerelate the CO2 methanation reaction, increasing the reactants’ (H2 and CO2) adsorption ability is crucial. H2 favors dissociative adsorption on metal site; thus, CO2 adsorption also would favor being adsorbed on zeolite support for this case. In order to show that zeolite was a CO2 adsorption site, a CO2 uptake experiment by TG/DTA was employed. Figure 7a illustrates CO2 uptake of 15wt%Ni impregnated on those two kinds of zeolite supports compared with NiO. It shows that 15wt%Ni/ZA_5D_9h exhibited higher CO2 uptake than 15wt%Ni/Z_5D_9h, even though the former sample had a lower surface area (14.11 m2/g for 15wt%Ni/ZA_5D_9h and 25.66 m2/g for 15wt%Ni/Z_5D_9h). This indicated that added NiO on Z_5D_9h covered zeolite surface and blocked the CO2 adsorption site, which led to a lowering of CO2 uptake. Moreover, CO2 uptake of bare zeolite and NiO were also reported to evidence that CO2 was favor to adsorb on zeolite support. It shows that ZA_5D_9h had the highest CO2 uptake while NiO was not adsorbing CO2. To further investigate the binding strength of CO2 and the catalyst surface, CO2-TPD was employed. Figure 7b illustrates the CO2-TPD profiles of 15wt%Ni/ZA_5D_9h and 15wt%Ni/Z_5D_9h. Normally, the CO2-TPD profile can be divided into three regions (weak, medium, and strong), which were categorized by the binding strength between CO2 and the catalyst surface. Only weak (<300 °C) and medium (300−500 °C) peaks, which attributed to weak and medium interaction between CO2 and the catalyst surface, were considered. However, the strong peak (>500 °C), which was assigned to strong interaction between them, was negligible [43]. Figure 7b shows that 15wt%Ni/ZA_5D_9h catalyst exhibited three peaks while only weak and strong peaks were observed for 15wt%Ni/Z_5D_9h. Since the peak area of the desorbed amount of CO2 is directly related to the adsorption amount, the areas of weak and medium peaks were compared. The peak areas of those two peaks of the two catalysts were 0.547 and 1.331 mmol/g for 15wt%Ni/Z_5D_9h and 15wt%Ni/ZA_5D_9h, respectively. It clearly shows that the latter catalyst exhibited much higher CO2 adsorption amount than the former, which is in agreement with the CO2 uptake results shown in Figure 7a.

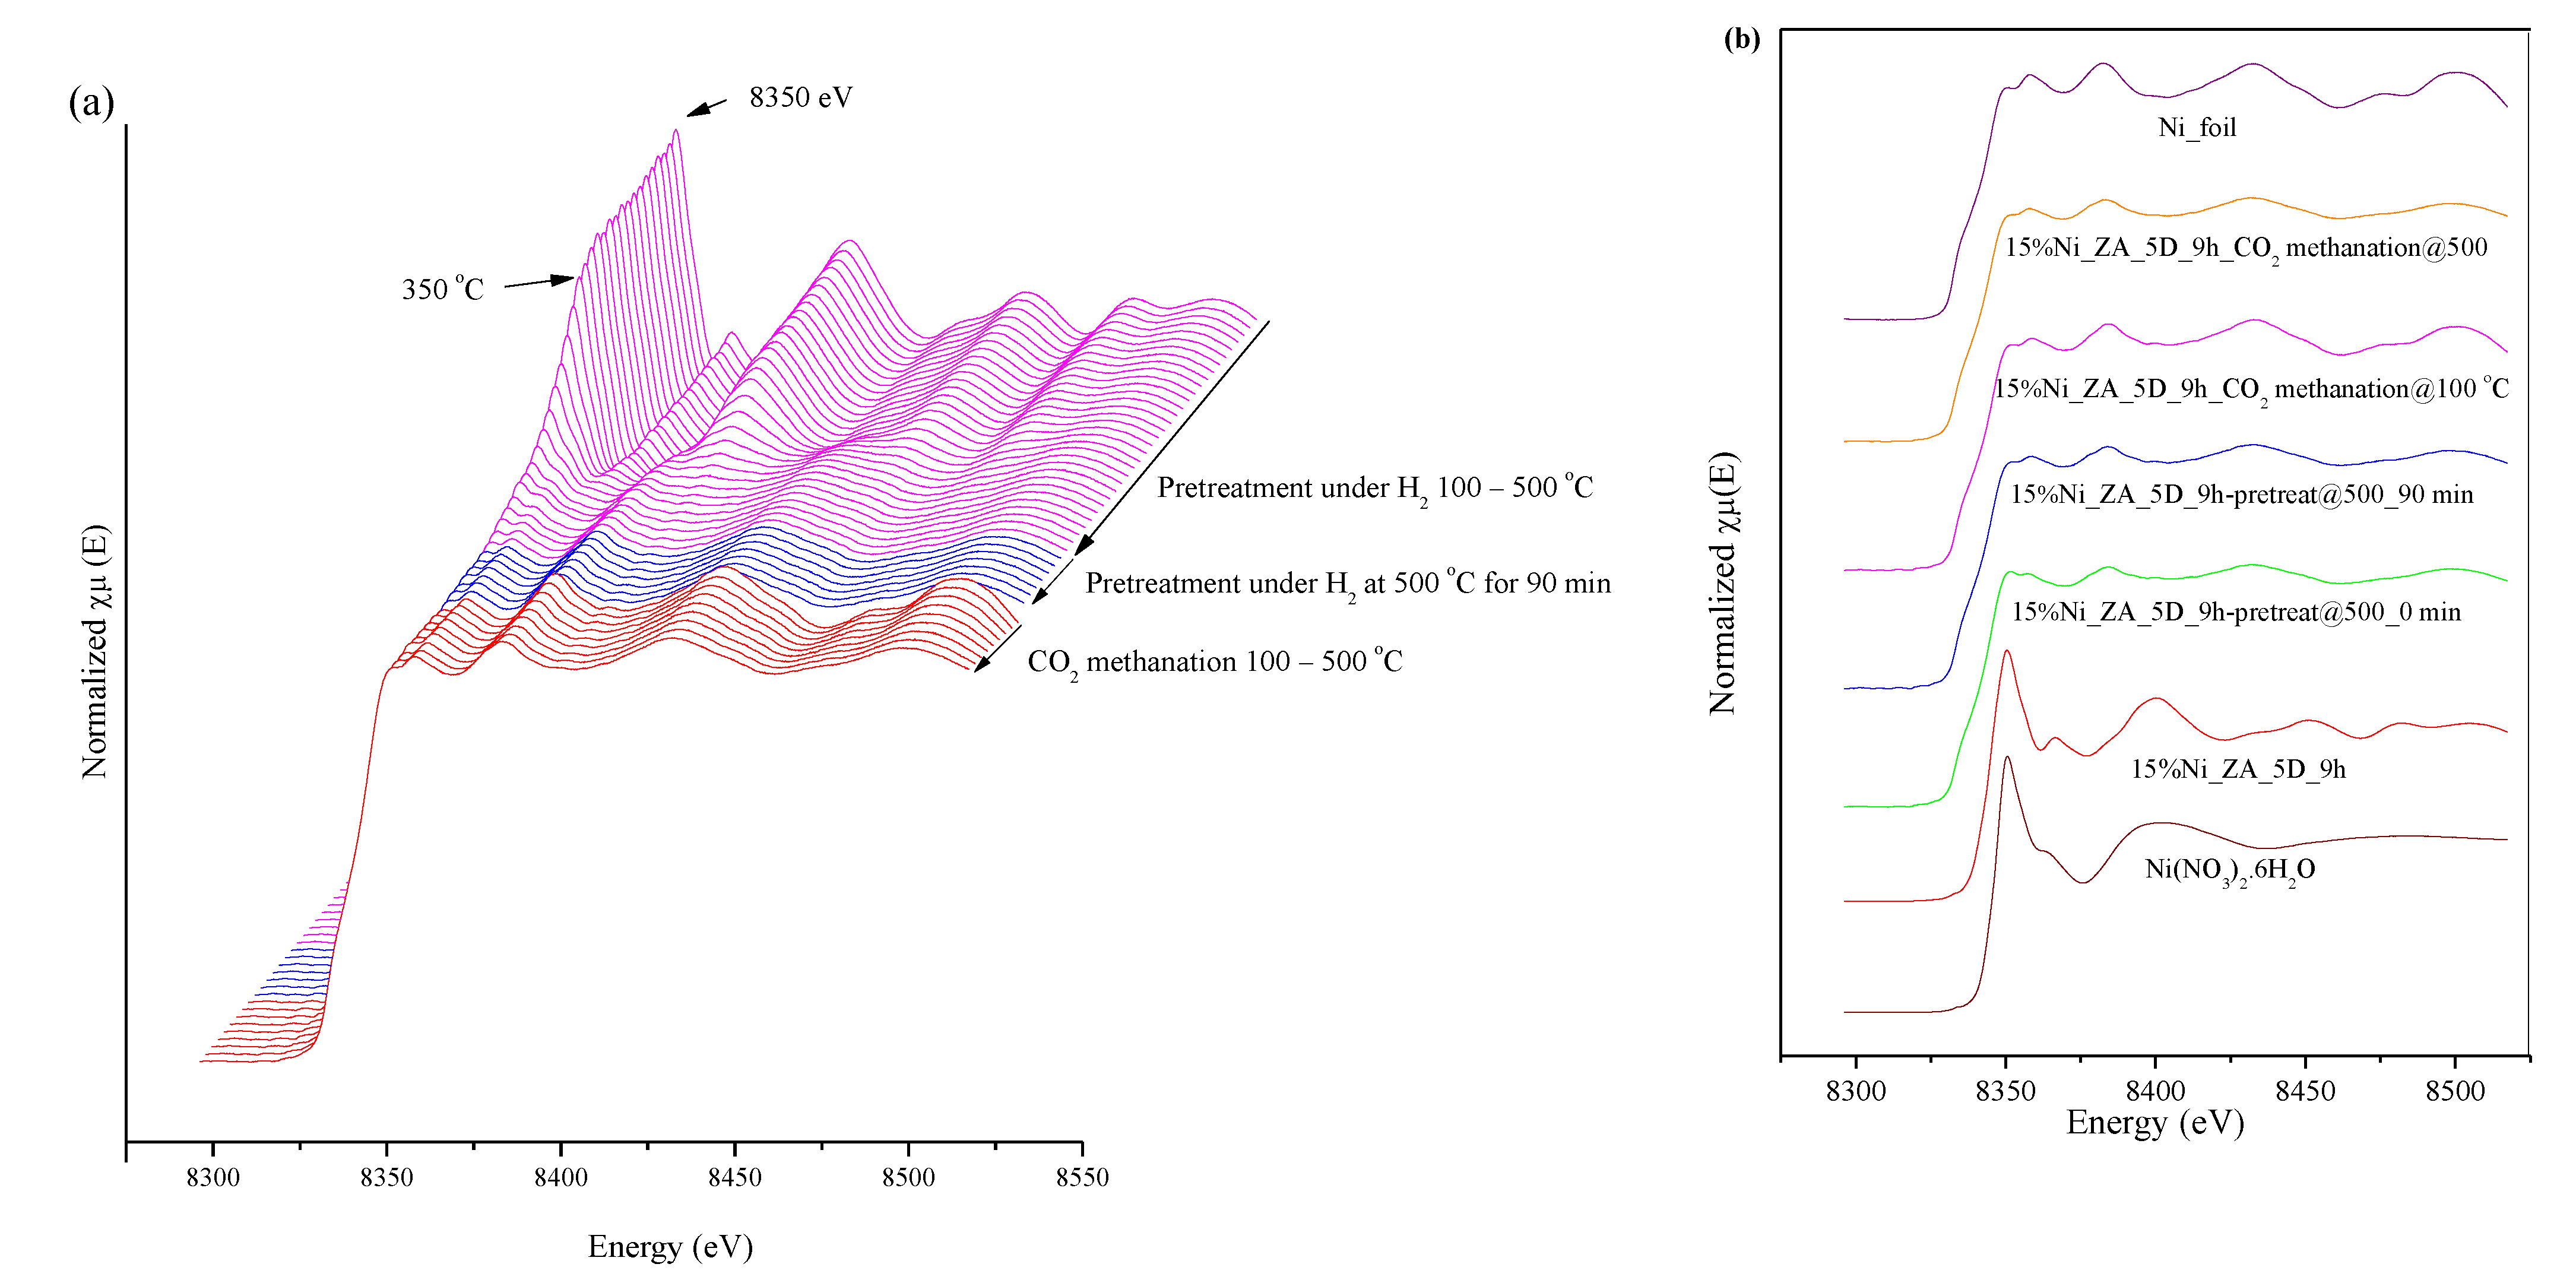
2.5. X-ray Absorption Spectroscopy

The results from CO2 methanation catalytic activity indicated that added Ni species play an important role in catalyzing the reaction. Therefore, to understand the role of catalyst on enhancing CO2 methanation catalytic activity, monitoring the changing properties of Ni species during CO2 methanation reaction by in situ experiment was performed. There are two in situ protocols to study different properties of catalyst. The first protocol is in situ CO2 methanation experiment by time-resolved X-ray absorption spectroscopy for investigating the Ni oxidation state changes during reaction (pretreatment and CO2 methanation reaction). The second one is in situ CO2 methanation experiment by X-ray absorption spectroscopy for monitoring the local environmental changes around the Ni probe atom during reaction (EXAFS analysis).

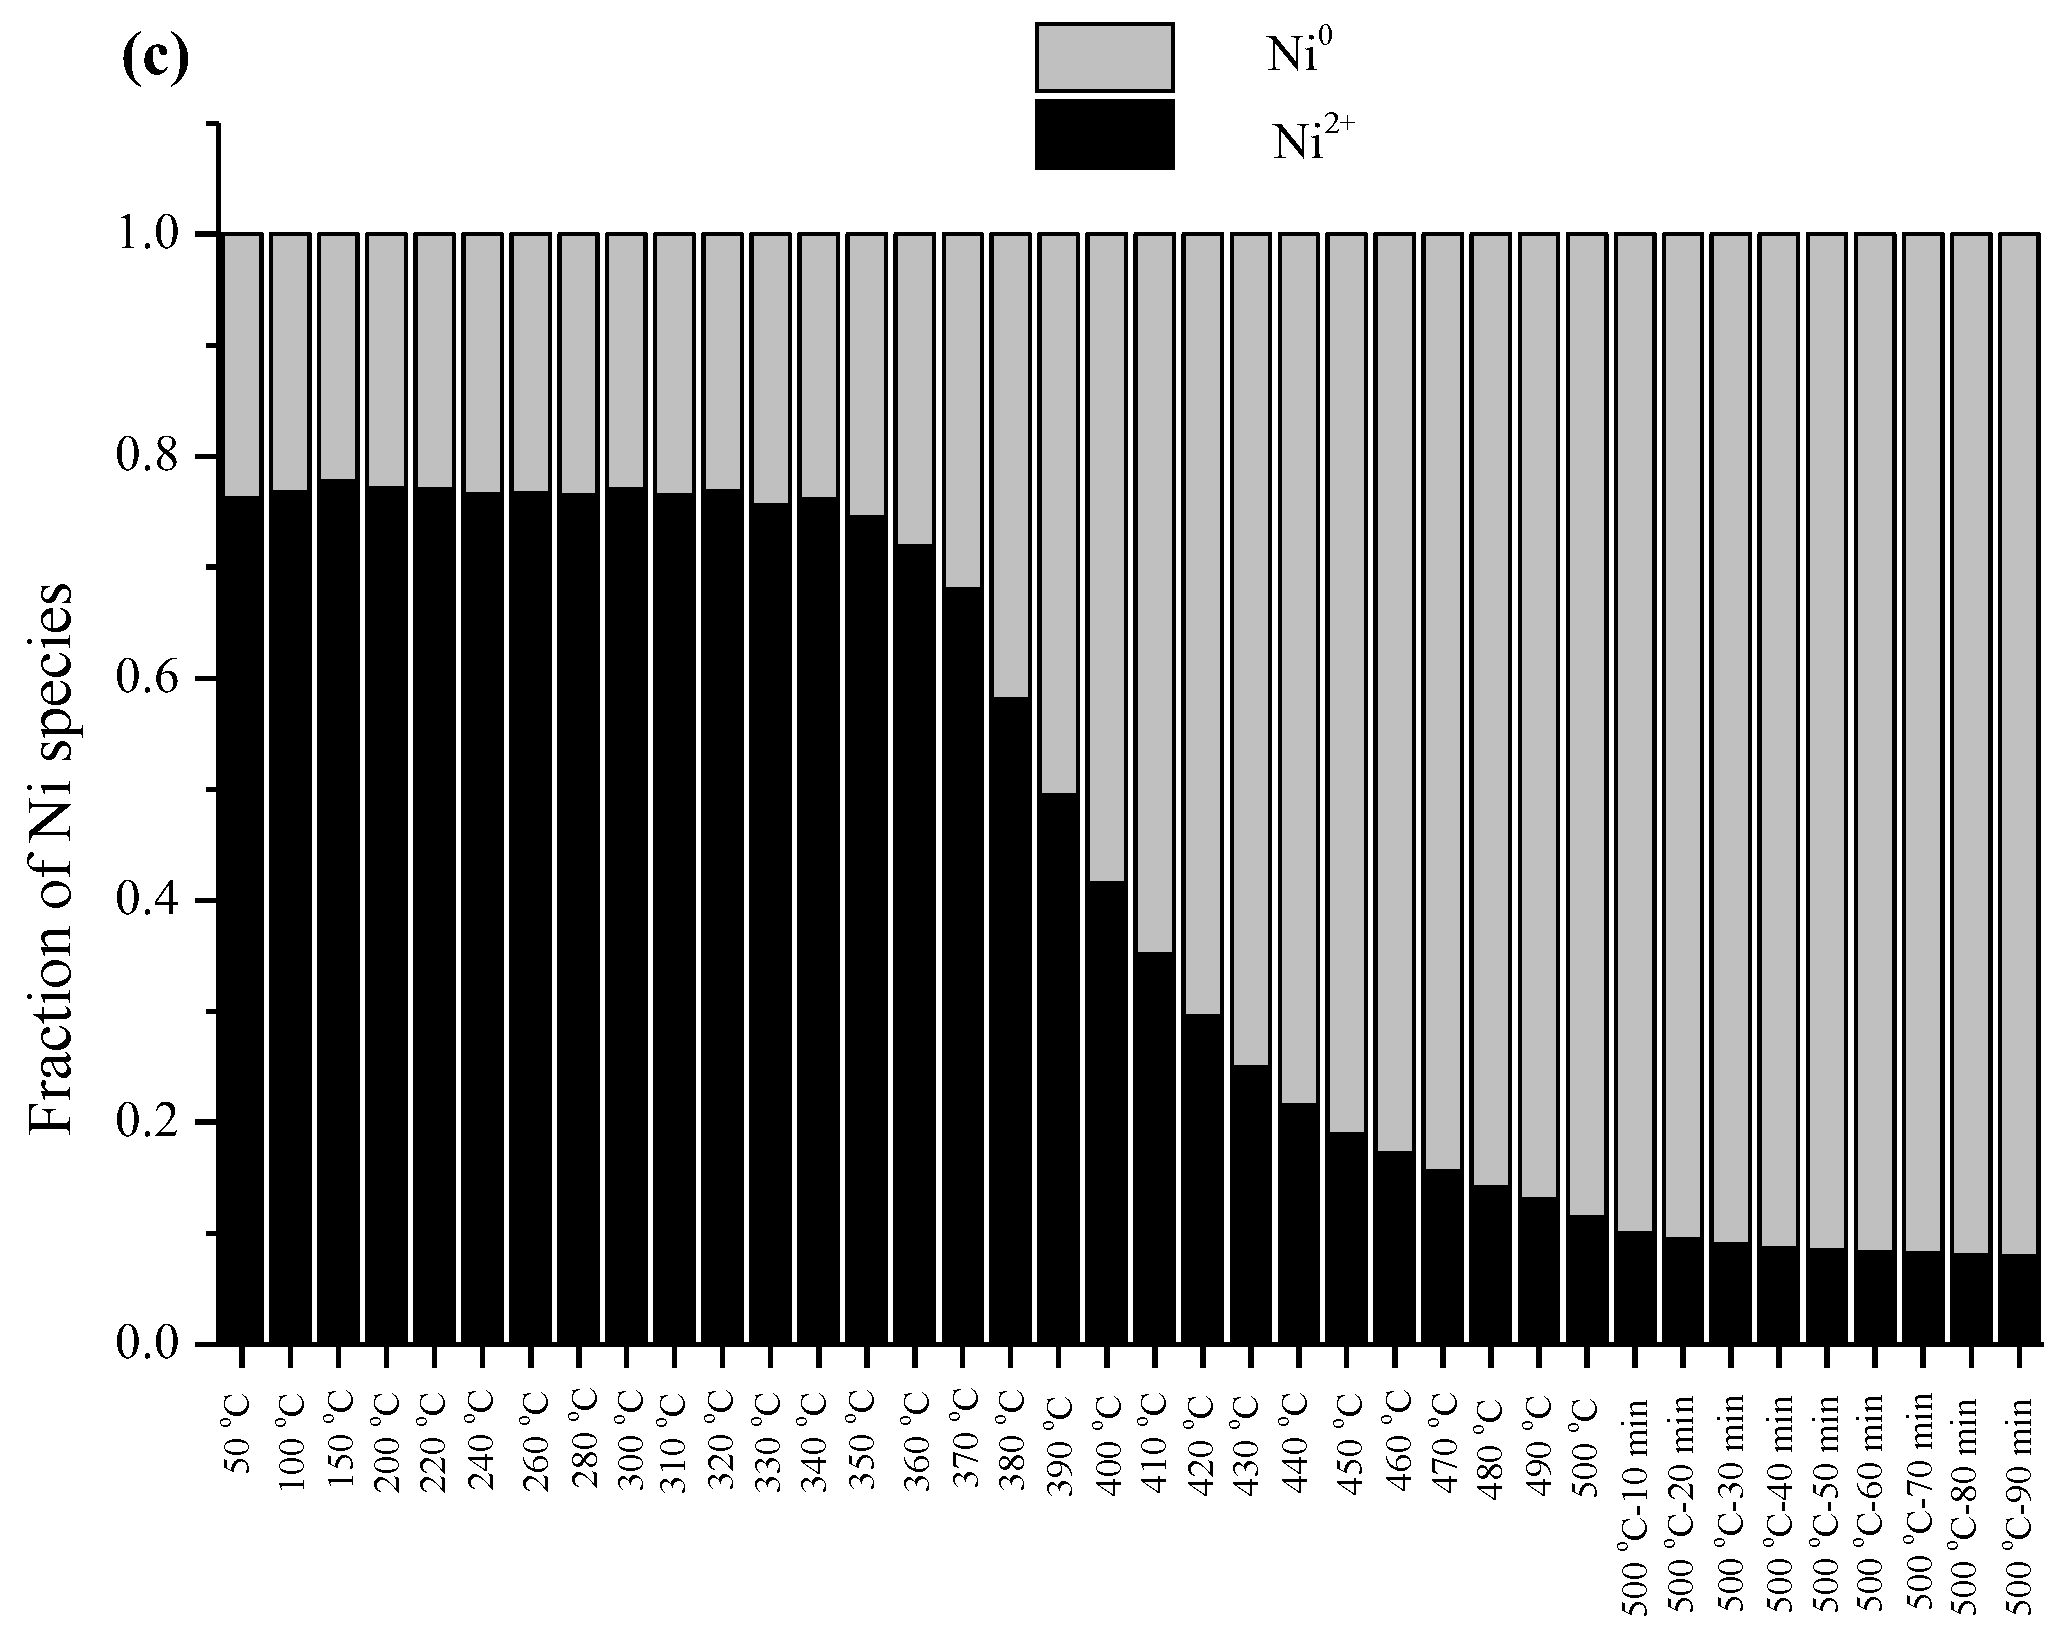
2.5.1. In Situ CO2 Methanation Experiment by Time-Resolved X-ray Absorption Spectroscopy

In this section, monitoring of the Ni oxidation state during pretreatment (under H2 flow for 90 min) and CO2 methanation reaction by analyzing the Ni K-edge XANES spectra was conducted. Figure 8a illustrates Ni K-edge XANES spectra of 15wt%Ni/ZA_5D_9h during pretreatment and under CO2 methanation conditions. Under the pretreatment step of flowing H2 over the catalyst and increasing the temperature from 100 to 500 °C, changes in XANES spectra features were observed. At the beginning state of the pretreatment process (temperature < 350 °C), the white line peak at 8350 eV, which was assigned as a white line characteristic peak of Ni2+ (transition from 1s to unoccupied 4p states), was unchanged. The Ni2+ species was reduced to Ni0 at a temperature around 350 °C, which can be observed by the gradual decrease in the white line peak of Ni2+ at 8350 eV, together with shifting the absorption edge of the Ni species to lower energy. This change indicated that Ni2+ was reduced to Ni0 under reduction atmosphere. Finally, the white line intensity at 8350 eV was reduced and almost unchanged up to 500 °C. Next, the reduction temperature was maintained at this point for 90 min. During holding at this reduction temperature, the Ni K-edge XANES spectra was unchanged. After the pretreatment step, the temperature was cooled to 100 °C under H2 to maintain the electronic state of Ni species constant. Then, the mixed feed gas (CO2, H2 and He) was switched to the sample to start the CO2 methanation reaction. Under CO2 methanation conditions, the XANES spectra features near the absorption edge were still almost the same as that in the pretreatment step. However, the spectra in higher energy showed different oscillating features, which indicated changes in the local environment around the Ni probe atom during reaction. This change will be discussed in the next section. In order to clearly investigate the XANES spectra changes, Ni K-edge XANES spectra at different conditions were selected and compared as shown in Figure 8b. This figure shows that freshly prepared 15wt%Ni/ZA_5D_9h exhibited the same white line and edge energy as Ni(NO3)2.6H2O (Ni2+) standard. After pretreatment, the catalyst under H2 flowed at 500 °C for 90 min, and the white line peak at 8350 eV was lowered together with shifting the edge energy to lower energy. However, the Ni K-edge XANES spectra of pretreated catalyst was not identical to that of Ni foil (Ni0) standard. This indicated that the NiO species on the catalyst surface was not converted to Ni0, which implied that co-existence of Ni2+ and Ni0 on the catalyst surfaces had occurred. For Ni K-edge XANES spectra of the catalyst under CO2 methanation conditions at 100 and 500 °C, the spectra feature was not identical to the spectra feature after the pretreatment process, especially the oscillation of spectra in high energy range, which indicated a different local environment around the Ni probe atom between these two stages. Moreover, the oscillation feature of 100 and 500 °C were also different, which also implied that under different reaction temperatures, the area around the Ni atom is different.
The result from Ni K-edge XANES spectra under pretreatment conditions in Figure 8b indicated that NiO still existed on the catalyst surface and was not almost reduced to Ni0 (indicated by different spectra features of pretreated catalyst at 500 °C and Ni0 standard). Therefore, determination of Ni0 and Ni2+ fraction on the catalyst surface by linear combination fitting was employed. The Ni K-edge XANES spectra of the catalyst during the pretreatment process in the temperature range of 100–500 °C were used for fitting by Ni foil and Ni(NO3)2.6H2O as a standard. Figure 8c displays the fraction of Ni0 and Ni2+ on the catalyst surface. It shows that, in the temperature range of 50–340 °C, Ni2+ was partially reduced to Ni0 (gray bar), and Ni2+ was the main component on the catalyst surface with a higher fraction than Ni0. Upon increasing the pretreatment temperature to higher than 350 °C, Ni2+ on the catalyst surface was rapidly reduced to Ni0, which led to an increase in Ni0 fraction. The reduction in Ni2+ to Ni0 occurred continuously until the pretreated temperature reached 500 °C. At that point, the fraction of Ni0 on the catalyst surface was higher than that of Ni2+, which indicated that NiO on the catalyst surface was almost reduced to Ni0 but a small amount of Ni2+ remained. After holding at 500 °C for 90 min, the fraction of Ni0 and Ni2+ were still unchanged.

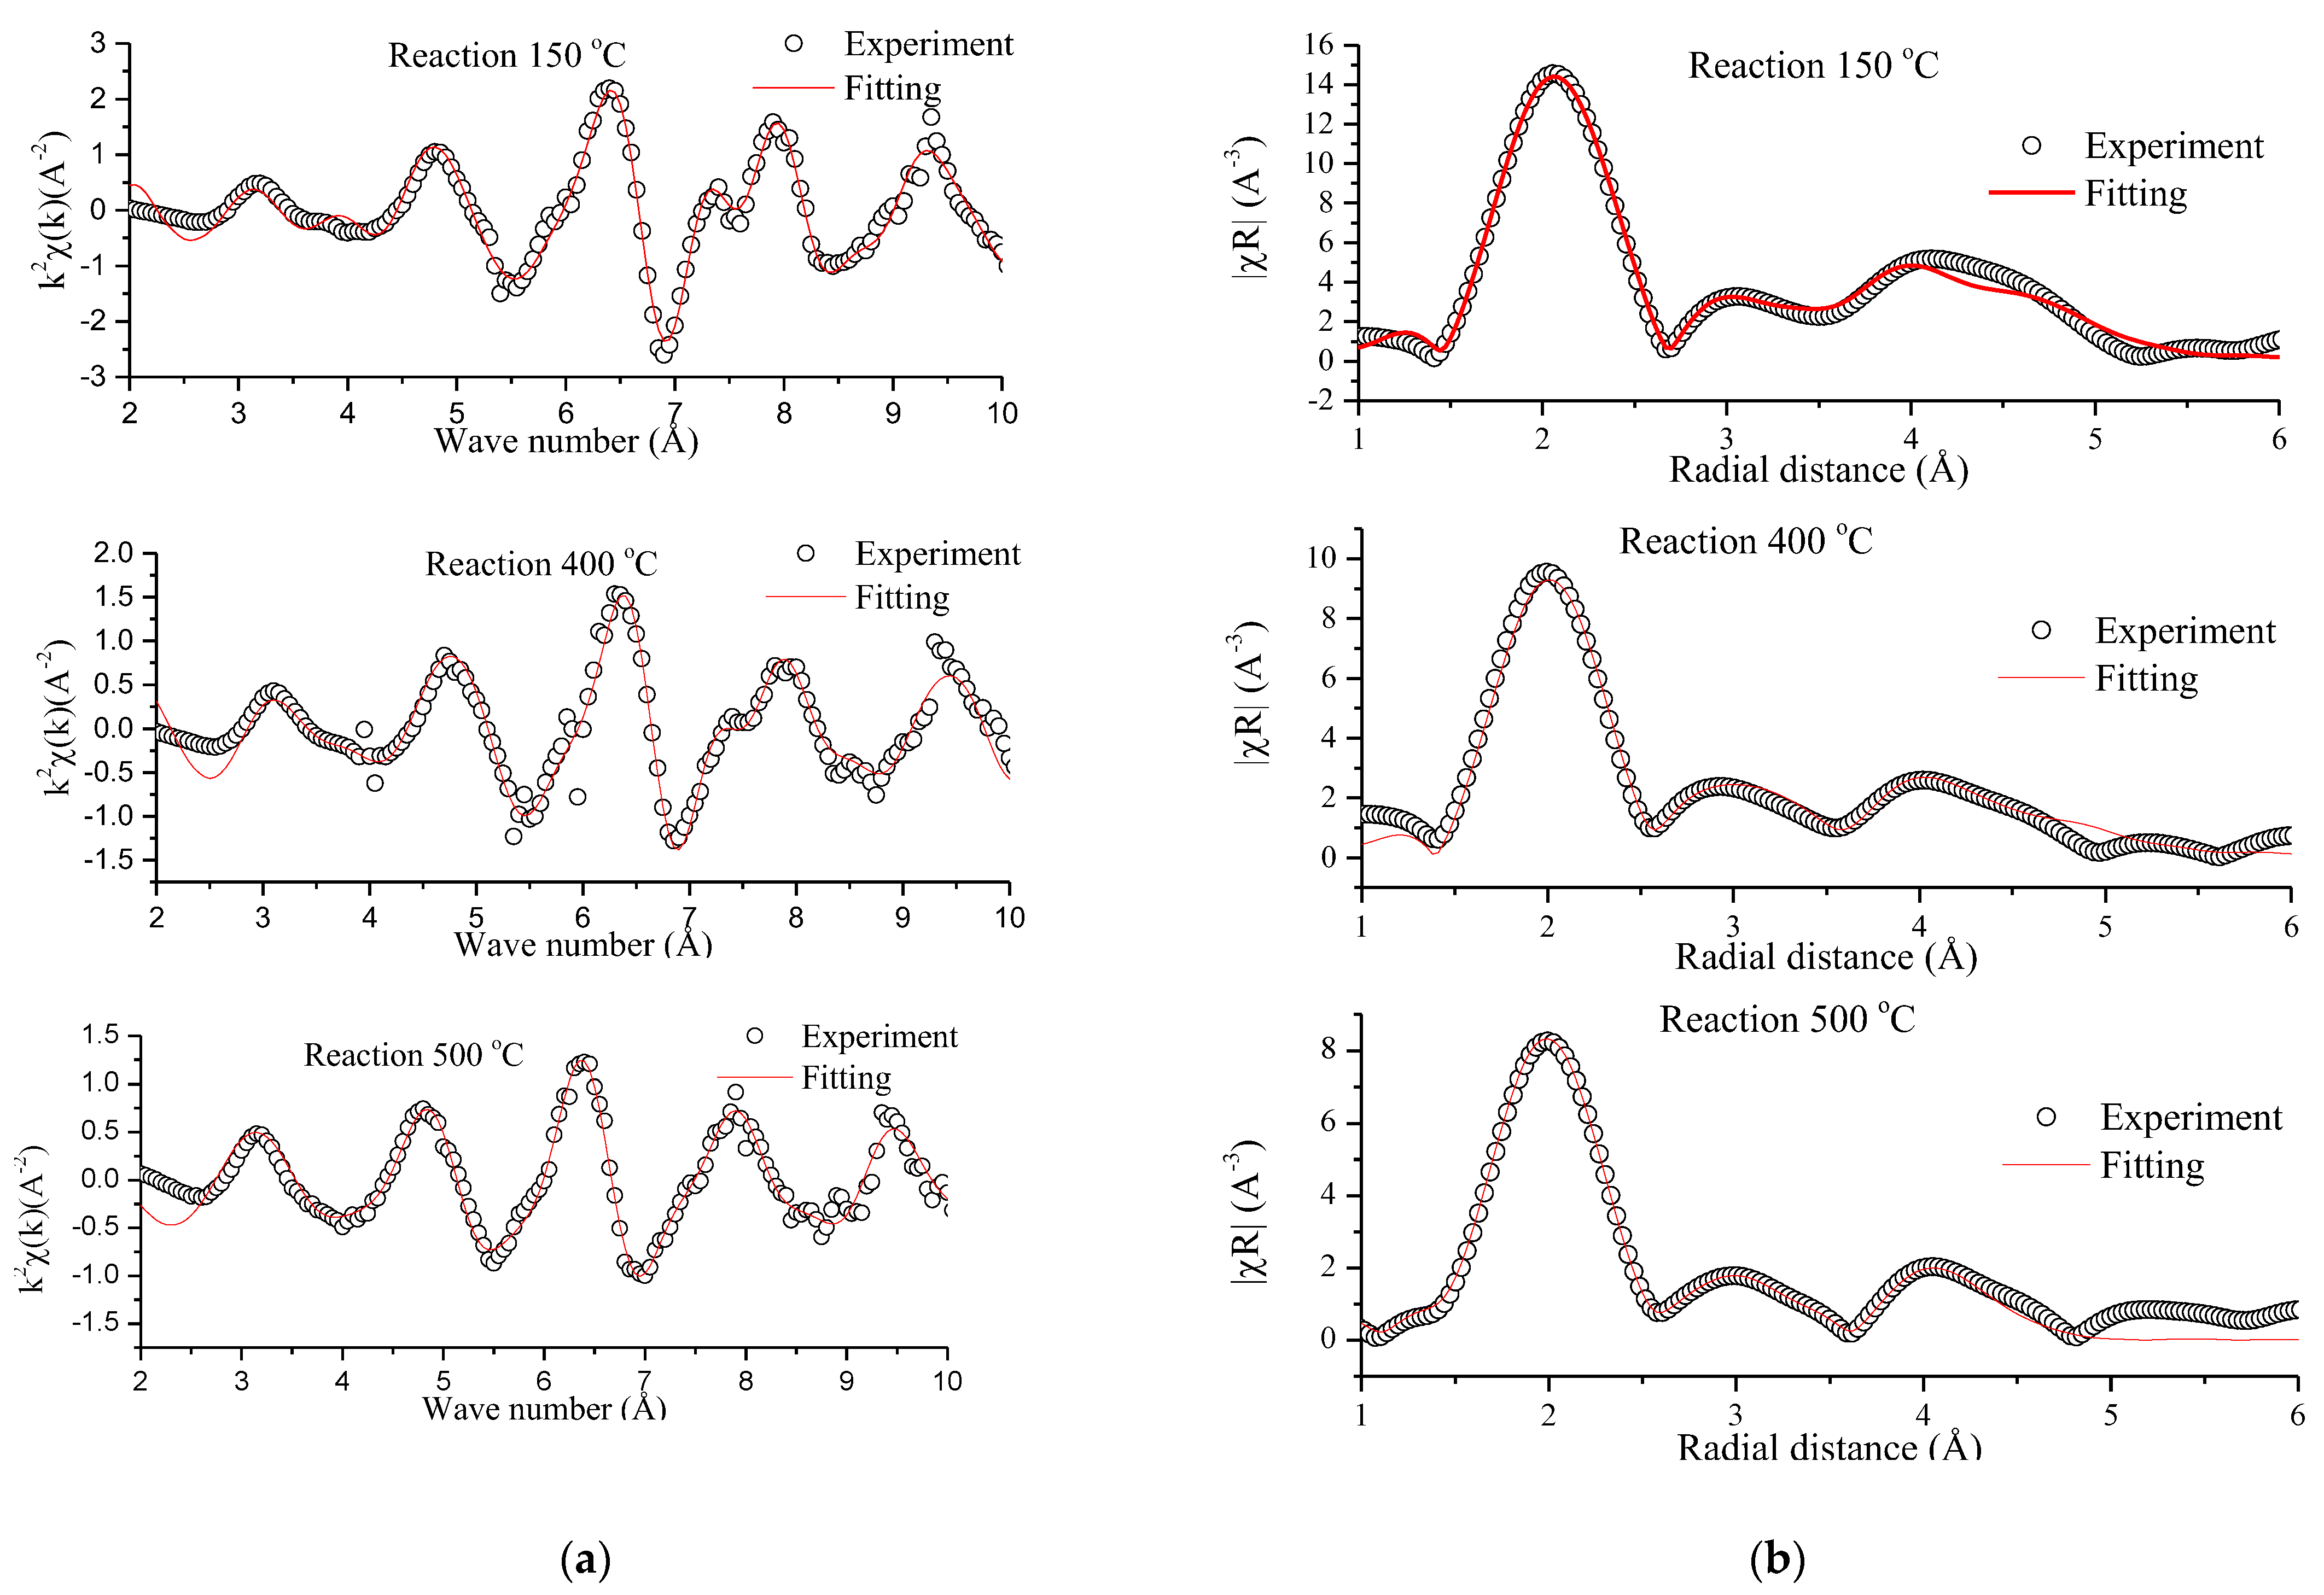
2.5.2. In Situ CO2 Methanation Experiment by X-ray Absorption Spectroscopy

The previous results on in situ TRXAS indicated that the environment around Ni probe atom was changed during the CO2 methanation reaction, which can be observed by different oscillations of spectra in the high energy region. Therefore, in this section, an in situ experiment of CO2 methanation was conducted for monitoring those changes by analyzing the data in the EXAFS region. The Ni K-edge EXAFS spectra at 150, 400, and 500 °C under CO2 methanation reaction was selected to use for analysis. All spectra were amplified by k2 weight with the window in k range space of 3–10 Å and R space of 1-6 Å. Figure 9a,b illustrate the k2 weight and R distance of the Ni K-edge EXAFS spectra of 15wt%Ni/ZA_5D_9h under CO2 methanation reaction at 150, 400, and 500 °C, respectively. From the fitting in Figure 9a,b, the best fitting parameter of this catalyst at different reaction temperatures was summarized in Table 2. The results from in situ TRXAS and linear combination indicated that Ni0 and Ni2+ co-existed on the catalyst surface. Therefore, Ni foil and NiO were used as a model in the fitting process. In the fitting process, s 0 2 parameter cannot be the same value because two standards (Ni0 and Ni2+) were used as a model; therefore, s 0 2 of Ni2+–O path was assigned to be equal to 1- s 0 2 of Ni–Ni path. The Ni species was the important species that participated in the reaction, and this species also existed as the main component on the catalyst surface; thus, the neighboring environment changing around the Ni0 probe atom was the focus of discussion. Table 2 summarized the best fitting parameter of 15wt%Ni/ZA_5D_9h, which indicated two paths (Ni0–Ni0 and Ni2+–O). It shows that the   s 0 2 value of the Ni–Ni path decreased with increased reaction temperature, which attributed to lowering the neighboring atoms around the Ni probe atom. Decreasing the Ni coordination number can promote the dissociation of H2 molecules on the catalyst surface; thus, the catalytic activity was enhanced upon increasing the reaction temperature. Moreover, the distance between Ni–Ni decreased upon increased reaction temperature, which might corresponded to the sintering of Ni species at high reaction temperature.

2.6. Effect of Different Surface Properties of Zeolite Support on CO2 Methanation Catalytic Activity

From the results of N2 adsorption–desorption isotherm, the zeolite support without addition of CTAB and heptane (Z_5D_9h) exhibited lower surface area and pore volume than that of zeolite support with organic phase addition (ZA_5D_9h). Upon impregnating the Ni species onto bare zeolite, the obtained support Ni catalyst exhibited some different properties as follows:
(i) For Z_5D_9h, an increased surface area (25 m2/g) was observed after being impregnated by Ni. This might be because Ni was deposited on the zeolite support and partially agglomerated to generate a pore, which can increase the surface area and pore volume. Starting with zeolite support with very low surface area can lead to low dispersion of the Ni species on support surface (evidence by SEM mapping results). This can indicate that the Ni species can be located at different sites (external surface and internal pore). The different locations of impregnated Ni on the zeolite support can affect the variation of the Ni–zeolite support interaction, which leads to different reducibility of the Ni species, as shown in the H2-TPR results. Finally, from low dispersion of the Ni species on the Z_5D_9h support, the CO2 methanation catalytic activity was lowered. Moreover, the nonuniform Ni dispersion on the catalyst surface also blocked the surface activity site on the zeolite for CO2 adsorption. Even impregnated Ni can greatly enhance the reaction, but the CO2 molecule was the other reactant that must also be adsorbed on the catalyst surface. Therefore, suppressing of CO2 adsorption by adding Ni on the Z_5D_9h support can lead to lowering of CO2 methanation catalytic activity since the surface reaction between adsorbed CO2 and H2 was low.
(ii) For the ZA_5D_9h zeolite support, impregnating Ni onto the zeolite support led to much lower surface area (~14 m2/g for 15wt%Ni/ZA_5D_9h). This indicated that added Ni was dispersed on the surface and also partially blocked inside the pore; thus, surface area was lowered. The result from SEM mapping indicated that Ni was highly dispersed on the catalyst surface due to high surface area and pore volume of the original zeolite support. Highly dispersed Ni can promote high metal-support interaction, which was evidenced by single reduction peak at high temperature in the H2-TPR results. This behavior can facilitate the adsorption of H2 molecules, and together with high CO2 adsorption (CO2 uptake results), the CO2 methanation catalytic activity was enhanced.

3. Materials and Methods

3.1. Materials and Reagents

All chemicals used in this work were analytical grade without future purification. Sodium silicate solution was obtained from PanReac ApliChem (Barcelona, Spain). Sodium hydroxide (>97%,) and aluminum hydroxide were purchased from Carlo Erba (Val de Reuil, France) and Merck (Darmstadt, Germany), respectively. Hexadetyltrimethyl ammonium bromide, CTAB (99+%), n-heptane, and ethanol were provided from Acros Organics (Mumbai, India), Lab-scan (Bangkok, Thailand), and RCI Labscan (Bangkok, Thailand), respectively. Deionized water was used for all synthesis procedure.

3.2. Zeolite Support Synthesis Procedure

In this work, sodium silicate solution and sodium aluminate were used as silicon and aluminum sources, respectively. The molar composition of zeolite was 5Na2O: 1Al2O3: 3SiO2: 138H2O. Sodium aluminate was first prepared by dissolving of 2.72 g. sodium hydroxide in deionized water (40 m) and then 2.79 g of aluminum hydroxide was added and stirred at 50 °C for 4 h. The prepared sodium aluminate was mixed with sodium silicate solution under stirring for a minute. Next, CTAB (1.04 g) and n-heptane (0.5 mL) were added into the mixture. The mixture was stored in polypropylene bottles and aged at room temperature. After finishing the aging process, the obtained mixture was heated in an oven at 100 °C for crystallization. Finally, the synthesized zeolite was filtered, washed by ethanol to eliminate CTAB, and followed by water for several times. The filtered sample was dried at 70 °C for 12 h and then calcined at 550 °C for 4 h. The final product was labeled as ZA_xD_yh, where x was aging time (days) and y was crystallization time (hours). The effect of different synthesis conditions on zeolite properties were studied. First, the effect of aging time was studied by varying aging time as 1, 3, and 5 days. Second, the effect of crystallization time was varied as 1, 3, 7, and 9 h. Finally, the effect of additive addition during the zeolite synthesis process was investigated by using the synthesis procedure in the same manner as above, but CTAB and n-heptane were not co-added.

3.3. Zeolite-Supported Ni Catalyst Preparation

A total of 5 and 15wt%. doped on zeolite was prepared by incipient wetness impregnation method. Ni(NO3)·6H2O was used as precursor. A desired amount of Ni(NO3)·6H2O was dissolved in deionized water and then added onto the synthesized zeolite support. The prepared catalyst was dried at 110 °C for 12 h and calcined at 450 °C for 2 h.

3.4. Characterization

XRD patterns of synthesized samples were obtained by PANanalytical Empyrean X-ray diffractometer (Marvern Panalytical Ltd., Marlvern, UK) with Cu Kα radiation (λ = 1.5406 Å). The diffraction patterns were recorded in the 2θ range of 5° to 50°. The increment was 0.02°. The scan speed was 30 sec/step.
The morphology of catalysts was investigated by LEO 1450 VP scanning electron microscope (SEM) instrument (Carl Zeiss, New York, NY, USA). The samples were dispersed on carbon tape and coated with gold particle before measurement.
The surface properties of all catalysts were determined from the N2 adsorption–desorption isotherm at −196 °C by Bel sorp mini II. The sample was outgassed before conducting the adsorption–desorption experiment under vacuum at 300 °C for 2 h. The specific surface area of the sample was obtained by BET equation at P/Po range from 0.10–0.25. The pore volume of sample was determined at P/Po close to unity (P/Po ≈ 1).
H2-temperature program reduction (H2-TPR) was investigated by Belcat B apparatus. The sample (20 mg) was first pretreated under He flow at 120 °C for 30 min. Next, the sample was cooled and the reducing mixed gas (5% H2 diluted in 95% Ar) was switched and flowed over the sample. The temperature of the sample was increased during flowing of dilute reducing gas up to 800 °C with the ramp rate of 10 °C/min. A thermal conductivity detector was used as a detector and the reducibility of the sample was reported in terms of H2 consumption as a function of temperature.

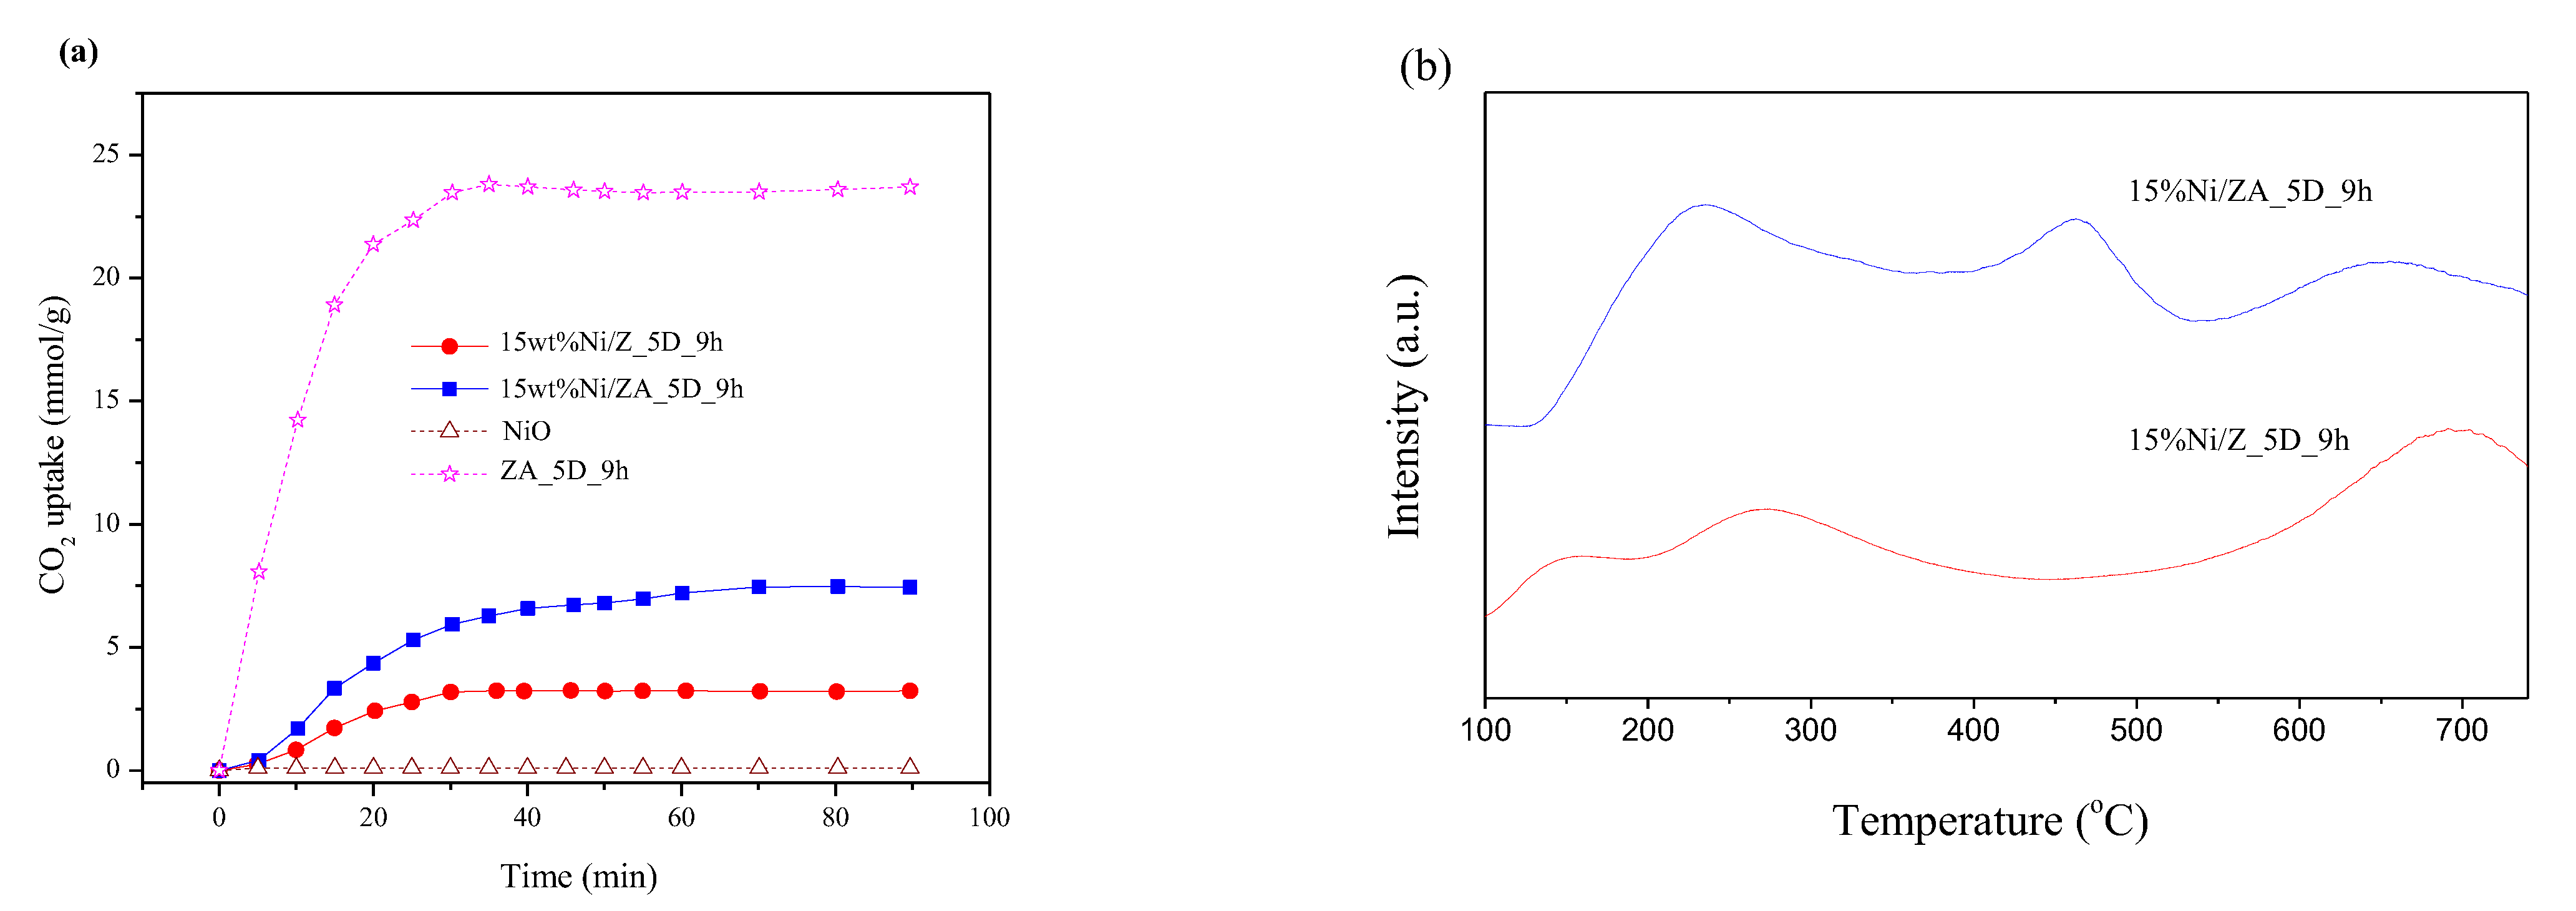
3.5. CO2 Uptake and CO2-Temperature Program Desorption

The CO2 adsorption ability of catalyst was investigated by Pyxis Diamond TG/DIA Perkin Elmer Analysis (Perkin Elmer, Wellesley, MA, USA). First, the sample was pretreated at 150 °C for 45 min under N2 flow (100 mL/min). Next, the sample was cooled to 40 °C under N2 flow. Then, CO2 was switched over the sample to start the adsorption process. The gas uptake process was conducted for 90 min. The amount of CO2 uptake can be calculated by differentiating between weight of sample before and after adsorption.
The binding strength of CO2 with the catalyst surface can be determined from CO2-tempreature program desorption (CO2-TPD) profile by Belcat II apparatus. The sample was pretreated by flowing He (50 mL/min) at 150 °C for 60 min. Then, the system was cooled to 50 °C under He flow with the same gas flow rate. Next, the mixed gas of CO2 and He was switched over the sample with the rate of 30 mL/min for 30 min. Then, He was switched over the sample again to remove excess amount of adsorbed CO2 at the same temperature (50 °C) for 60 min. Finally, the temperature of the system was then increased to 750 °C (10 °C/min). In this process, the adsorbed CO2 on catalyst surface was desorbed and detected by the TCD detector, and then the TPD profile was constructed.

3.6. In Situ Small-Angle X-ray Scattering (SAXS) and In Situ Wide-Angle X-ray Scattering (WAXS)

The effect of additives on the nucleation and crystallization process during zeolite synthesis procedure was investigated by in situ SAXS and in situ WAXS, respectively. Both experiments were performed at beamline 1.3 (Small Angle X-ray scattering) of the Synchrotron Light Research Institute (SLRI), Nakhon Ratchasima, Thailand.
For the in situ SAXS experiment, the sample was sampled from the reaction mixture of zeolite (sodium silicate solution + sodium aluminates) at room temperature during the aging process at 30, 90, 210, 270, 300, 420, 600, 960, and 1200 min. After sampling, the sample was first filtered by 220 nm nylon filter paper to obtain a clear final solution, and then the sample solution was immediately injected into a sample cell, and the scattering pattern was obtained. The sample-to-detector distance of 2700 mm (0.23 mm−1 < q < 2.4 nm−1) was used for SAXS setup with CCD Mar SX165 as a detector. Water and air were used as background and reference, respectively. The 2D SAXS patterns were reduced and radially averaged by staff-developed software at SLRI (SAXSIT) to obtain 1D SAXS curves. The SAXS intensity data (I(q) versus q, where q = 4π sinθ/λ, 2θ is the scattering angle and λ is the X-ray wavelength) were obtained at 9 keV (λ = 0.138 nm). The sphere model for form factor and Gaussian distribution were used to fit the 1D scattering curves. The fitting was performed with a least-squares minimization procedure using the software package SASfit (version 0.94.11) [44].
After the aging process was finished, the in situ WAXS was continuously conducted by heating the above reaction mixture in an oven at 100 °C and then sampling the reaction mixture for WAXS measurement every 30 min for 6 h. The distance between sample to detector was 170 mm (2.2 < 2θ < 40 degree) with LX170 as a detector. The WAXS patterns were corrected by using air as background and reference. The 2D WAXS patterns were reduced and radially averaged by staff-developed software at SLRI (SAXSIT) to obtain 1D WAXS curves. The WAXS curves were converted to the Cu-K alpha source.

3.7. CO2 Methanation Catalytic Activity Test

A CO2 methanation catalytic activity test was performed in a fix-bed continuous-flow quartz reactor with inner diameter of 0.6 mm. A total of 50 mg of catalyst sample was inserted between two layers of quartz wool and placed inside a temperature controllable furnace. The K-type thermocouple was used to detect the reaction temperature, which was placed at the top of the catalyst bed. Before the reaction, the catalyst was activated under H2 flowing at 500 °C for 90 min. Next, the catalyst was cooled to 100 °C and the feed gas was switched to mixed feed gas of 61.6% H2,15.4% CO2, and 23% He with a total flow rate of 40 mL/min. The mixed gas was flowed through the catalyst and the remaining reactants and products were analyzed by an online Agilent 6890N Series, Agilent technology Gas Chromatography (Agilent, Santa Clara, CA, USA) with HEYSEPD Packed Column and TCD detector. Next, the reaction temperature was increased to 150 °C and held at this point for 30 min before measuring the catalytic activity. The reaction temperature was increased by 50 °C for each step, and the temperature range for the catalytic activity test was 100–550 °C. The performance of the catalyst was calculated and reported as conversion of carbon dioxide ( X CO 2 ) and selectivity to methane ( S CH 4 ) by the following equations:
X CO 2 = C CO 2 in - C CO 2 out C CO 2 in × 100 %
S CH 4 = C CH 4 C CH 4 + C CO × 100 %
where C CO 2 in is the molar of CO2 in the pre-reaction, C CO 2 out - is the molar of CO2 in the post-reaction, and C CH 4 , C CO was the molar of CH4 and CO in the post-reaction.
In the kinetic study, a separate experiment was conducted by using the reaction temperature range of 175–275 °C (% conversion < 10%) to exclude the heat and mass transfer. The rate of reaction can be calculated by equation (4):
Rate = ( F CO 2 W )   ×   X CO 2
where F CO 2 is the total flow rate of CO2 (mol s−1), and W is the weight of sample (g).

3.8. X-ray Absorption Spectroscopy

3.8.1. X-ray Absorption Near-Edge Structure (XANES)

The oxidation state changing of Ni during CO2 methanation reaction was monitored by analyzing data of X-ray absorption near-edge structure of Ni K-edge region. The in situ experiment for obtaining XANES spectra was conducted on the time-resolved X-ray absorption spectroscopy beamline (BL 2.2) of the Synchrotron Light Research Institute, Nakhon Ratchasima, Thailand. The Si (111) bent crystal was used as an energy dispersive monochromator with the energy range of 2.4–10 keV. The detector was a linear image sensor. The in situ experiment was performed in a similar condition to the CO2 methanation catalytic test. The sample was pressed into a pellet and placed inside an in situ cell. The sample was first pretreated by flowing H2 at a flow rate of 24 mL/min and the in situ cell was then heated from room temperature to 500 °C. At this increasing step, XANES spectra were recorded every 10 °C increment. The pretreated process proceeded for 90 min, and XANES spectra were recorded every 10 min during holding at this reduced temperature (500 °C). After the pretreatment process, the in situ cell was cooled to 100 °C, and the CO2 methanation reaction was started by switching the feed gas to mixed feed gas between H2 (24 mL/min) and CO2 (6 mL/min) with the total flow rate of 30 mL/min. Then, the sample cell was heated to 150 °C and held at this point for 10 min, and then the XANES spectra were collected during holding time. The in situ CO2 methanation process was continued by increasing the reaction temperature for each sample by 50 °C until the temperature reached 550 °C, and the XANES spectra at each temperature were recorded. The XANES results were first corrected by preprocessing program, which was developed by BL 2.2, and then the corrected XANES spectra were further analyzed by Athena program (Demeter, version 0.9.25).

3.8.2. Extended X-ray Absorption Fine Structure (EXAFS)

The environmental change around the Ni probe atom during CO2 methanation reaction was obtained by analyzing the Ni K-edge EXAFS spectra. The in situ experiment was conducted at the SUT-NANOTEC-SLRI XAS Beamline (BL5.2) of the Synchrotron Light Research Institute (SLRI), Nakhon Rachasima, Thailand. The Ni K-edge EXAFS spectra were recorded in transmission mode. The double crystal monochromator (DCM) was equipped with Ge (220) crystal to select an appropriate photon energy. Ionization chambers were used as detectors, which were installed in front of and behind the sample to detect the incident (I0) and transmitted (I1) beam. The process of the in situ experiment was performed in a similar manner as the CO2 methanation catalytic activity test. The sample was placed in an in situ cell and activated before the reaction with 20 mL/min of H2 flow at 500 °C for 90 min. The EXAFS spectra were collected during this process. Next, the catalyst was cooled to 100 °C, and the feed gas was switched to mixed gas of H2 and CO2 (H2: CO2 ratio = 4: 1) with the total flow rate of 25 mL/min to start CO2 methanation reaction. Then, the sample was heated to 150 °C and held at this temperature for 30 min. The EXAFS spectra were recorded during holding at this temperature. Then, each sample was heated by 50 °C until the reaction temperature reached 550 °C, and the EXAFS spectra were also recorded in a similar manner as describe above. All recorded spectra were analyzed by Athena and Arthemis programs (Demeter, version 0.9.25).

4. Conclusions

In this work, the optimal condition for synthesizing zeolite with high surface area and pore volume was investigated. The optimal synthesis condition was addition of CTAB and heptane during mixing the precursors to obtain a zeolite gel and then aging the zeolite gel for 5 days before crystallization for 9 h. The addition of organic substances resulted in a mixing phases of zeolite NaA and NaX with high surface area and pore volume. The role of CTAB and heptane was to promote the formation and increase in nuclei number and nucleation rate by increasing the affinity between the nucleation precursor and the swelled CTAB micelle. This proposed mechanism can be evidenced by the results from small-angle X-ray scattering that, upon addition of CTAB and heptane, the nuclei can rapidly form, which also promotes the formation of the final zeolite product with high crystallinity and high surface area. Next, the synthesized zeolite by optimal synthesis condition (ZA_5D_9h) was impregnated with Ni for obtaining a supported-Ni zeolite catalyst for CO2 methanation reaction. The results from the catalytic activity test showed that 15wt%Ni/ZA_5D_9h exhibited the highest performance with high CH4 selectivity and stability. The high dispersion on zeolite support led to strong metal-support interaction, which was beneficial for dispersing and preventing the sintering of Ni species. Therefore, zeolite with high surface area and pore volume can provide more area for dispersing of the Ni species together with increasing CO2 adsorption capacity, which then leads to enhancing the CO2 methanation catalytic activity. Finally, all the results indicated that the zeolite with mixed phase of NaA and NaX can be a potential catalyst support for this reaction.

Supplementary Materials

The following are available online at https://www.mdpi.com/article/10.3390/catal12080823/s1, Figure S1: Comparison of SEM images between two kinds of samples; with (right) and without (left) organic substances addition with different aging times. Figure S2. SEM images of zeolites with different crystallization times. Figure S3. Comparison WAXS spectra of zeolite (a) without and (b) with addition of CTAB and heptane during heating at 100 oC for 7 h. Figure S4. (a) XRD patterns of zeolite support and 15wt%Ni/zeolite (b) N2 adsorption-desorption isotherms of 15wt%/zeolite with addition of organic phase (ZA_5D_9h) compared with15wt%Ni/zeolite without addition of organic phase (Z_5D_9h) and (c) SEM images of ZA_5D_9h and 15wt%Ni/ZA_5D_9h. Figure S5. SEM and mapping images of 15wt%Ni/Z_5D_9h and 15wt%Ni/ZA_5D_9h.

Author Contributions

The present research project was initiated by S.K. and K.C.C.; sample preparation, characterization, and data analysis were performed by S.K.; the XAS experiments were performed at SLRI, Thailand under instruction by Y.P.-a. and P.K.; SAXS and WAXS experiments were also conducted at SLRI under instruction by N.K. All the authors jointly prepared this manuscript through a discussion based on a draft. All authors have read and agreed to the published version of the manuscript.

Funding

This research received no external funding.

Acknowledgments

We would like to thank the Materials Chemistry Research Center, Department of Chemistry and Center of Excellence for Innovation in Chemistry, Faculty of Science, Khon Kaen University for financial support. The authors gratefully acknowledge Synchrotron Light Research Institute (Public Organization), Nakhon Ratchasima, Thailand for the generous beamtime.

Conflicts of Interest

The authors declare no conflict of interest.

References

  1. Cui, Q.; Huihui, W.; Xiangyu, J.; Ningbo, G. Effect of carbonization temperature on CO2 adsorption behavior of activated coal char. J. Energy Inst. 2021, 97, 92–99. [Google Scholar]
  2. Mingming, Z.; Yunxiang, P.; Yuzhu, S.; Ping, L.; Jianguo, Y. Preparation of CaO-Al2O3 sorbent and CO2 capture performance at high temperature. Fuel 2013, 111, 636–642. [Google Scholar]
  3. Arnost, Z.; Jakub, P.; Jiri, C. MgO-modified mesoporous silicas impregnated by potassium carbonate for carbon dioxide adsorption. Microporous Mesoporous Mater. 2013, 167, 44–50. [Google Scholar]
  4. Valverde, J.M.; Sanchez-Jimenez, P.E.; Perez-Maqueda, L.A. High and stable CO2 capture capacity of natural limestone at Ca-looping conditions by heat pretreatment and recarbonation synergy. Fuel 2014, 123, 79–85. [Google Scholar] [CrossRef] [Green Version]
  5. Zhang, Y.; Yu, P.; Luo, Y. Absorption of CO2 by amino acid-functionalized and traditional dicationic ionic liquids: Properties, Henry’s law constants and mechanisms. Chem. Eng. J. 2013, 214, 355–363. [Google Scholar] [CrossRef]
  6. Rahbari-Sisakht, M.; Ismail, A.F.; Rana, D.; Matsuura, T. A novel surface modified polyvinylidene fluoride hollow fiber membrane contactor for CO2 absorption. J. Membr. Sci. 2012, 415, 221–228. [Google Scholar] [CrossRef]
  7. Zain, M.M.; Mohamed, A.R. An overview on conversion technologies to produce value added products from CH4 and CO2 as major biogas constituents. Renew. Sustain. Energy Rev. 2018, 98, 56–63. [Google Scholar] [CrossRef]
  8. Schwach, P.; Pan, X.; Bao, X. Direct Conversion of Methane to Value-Added Chemicals over Heterogeneous Catalysts: Challenges and Prospects. Chem. Rev. 2017, 117, 8497–8520. [Google Scholar] [CrossRef]
  9. Zhao, G.; Drewery, M.; Mackie, J.; Oliver, T.; Kennedy, E.M.; Stockenhuber, M. The Catalyzed Conversion of Methane to Value-Added Products. Energy Technol. 2020, 8, 1900665. [Google Scholar] [CrossRef]
  10. Taifan, W.; Baltrusaitis, J. CH4 conversion to value added products: Potential, limitations and extensions of a single step heterogeneous catalysis. Appl. Catal. B Environ. 2016, 198, 525–547. [Google Scholar] [CrossRef]
  11. Aziz, M.A.A.; Jalil, A.A.; Triwahyono, S.; Ahmad, A. CO2 methanation over heterogeneous catalysts: Recent progress and future prospects. Green Chem. 2015, 17, 2647–2663. [Google Scholar] [CrossRef]
  12. Tan, C.H.; Nomanbhay, S.; Shamsuddin, A.H.; Park, Y.-K.; Hernández-Cocoletzi, H.; Show, P.L. Current Developments in Catalytic Methanation of Carbon Dioxide—A Review. Front. Energy Res. 2020, 9, 795423. [Google Scholar] [CrossRef]
  13. Ashok, J.; Pati, S.; Hongmanorom, P.; Tianxi, Z.; Junmei, C.; Kawi, S. A review of recent catalyst advances in CO2 methanation processes. Catal. Today 2020, 356, 471–489. [Google Scholar] [CrossRef]
  14. Jiajian, G.; Qing, L.; Fangna, G.; Bin, L.; Ziyi, Z.; Fabing, S. Recent advances in methanation catalysts for the production of synthetic natural gas. RSC Adv. 2015, 5, 22759–22776. [Google Scholar]
  15. Jianghui, L.; Caiping, M.; Qiong, W.; Yanfei, X.; Guangyuan, M.; Jie, W.; Hongtao, W.; Chenglong, D.; Chenghua, Z.; Mingyue, D. Enhanced low-temperature performance of CO2 methanation over mesoporous Ni/Al2O3-ZrO2 catalysts. Appl. Catal. B Environ. 2019, 243, 262–272. [Google Scholar]
  16. Ridzuan, N.D.M.; Shaharun, M.S.; Anawar, M.A.; Ud-Din, I. Ni-Based Catalyst for Carbon Dioxide Methanation: A Review on Performance and Progress. Catalysts 2022, 12, 469. [Google Scholar] [CrossRef]
  17. Li, L.; Zeng, W.; Song, M.; Wu, X.; Li, G.; Hu, C. Research Progress and Reaction Mechanism of CO2 Methanation over Ni-Based Catalysts at Low Temperature: A Review. Catalysts 2022, 12, 244. [Google Scholar] [CrossRef]
  18. Lv, C.; Xu, L.; Chen, M.; Cui, Y.; Wen, X.; Li, Y.; Wu, C.; Yang, B.; Miao, Z.; Hu, X.; et al. Recent Progresses in Constructing the Highly Efficient Ni Based Catalysts with Advanced Low-Temperature Activity Toward CO2 Methanation. Front. Chem. 2020, 8, 269. [Google Scholar] [CrossRef]
  19. Guo, X.; Traitangwong, A.; Hu, M.; Zuo, C.; Meeyoo, V.; Peng, Z.; Li, C. Carbon dioxide methanation over Nickel-based catalysts supported on various mesoporous material. Energy Fuels 2018, 32, 3681–3689. [Google Scholar] [CrossRef]
  20. Du, G.; Lim, S.; Yang, Y.; Wang, C.; Pfefferle, L.; Haller, G.L. Methanation of carbon dioxide on Ni-incorporated MCM-41 catalysts: The influence of catalyst pretreatment and study of steady-state reaction. J. Catal. 2007, 249, 370–379. [Google Scholar] [CrossRef]
  21. Rahmani, S.; Rezaei, M.; Meshkania, F. Preparation of highly active nickel catalysts supported on mesoporous nanocrystalline γ-Al2O3 for CO2 methanation. J. Ind. Eng. Chem. 2014, 20, 1346–1352. [Google Scholar] [CrossRef]
  22. Westermann, A.; Azambre, B.; Bacariza, M.C.; Graca, I.; Ribeiro, M.F.; Lopes, J.M. Insights into CO2 methanation mechanism over NiUSY zeolites: An operando IR study. Appl. Catal. B Environ. 2015, 120, 174–175. [Google Scholar] [CrossRef]
  23. Teh, L.P.; Triwahyono, S.; Jalil, A.A.; Mukti, R.R.; Aziz, M.A.A.; Shishido, T. Mesoporous ZSM5 having both intrinsic acidic and basic sites for cracking and methanation. Chem. Eng. J. 2015, 270, 196–204. [Google Scholar] [CrossRef]
  24. Graca, I.; González, L.V.; Bacariza, M.C.; Fernandes, A.; Henriques, C.; Lopes, J.M.; Ribeiro, M.F. CO2 hydrogenation into CH4 on NiHNaUSY zeolites. Appl. Catal. B Environ. 2014, 147, 101–110. [Google Scholar] [CrossRef]
  25. Bacariza, M.C.; Bértolo, R.; Graça, I.; Lopes, J.M.; Henriques, C. The effect of the compensating cation on the catalytic performances of Ni/USY zeolites towards CO2 methanation. J. CO2 Util. 2017, 21, 280–291. [Google Scholar] [CrossRef]
  26. Xu, L.; Wen, X.; Chen, M.; Lv, C.; Cui, Y.; Wu, X.; Wu, C.; Miao, Z.; Hu, X. Highly dispersed Ni-La catalysts over mesoporous nanosponge MFI zeolite for low-temperature CO2 methanation: Synergistic effect between mesoporous and microporous channels. J. Ind. Eng. Chem. 2021, 100, 159–173. [Google Scholar] [CrossRef]
  27. Carmen Bacariza, M.; Graça, I.; Lopes, J.M.; Henriques, C. Tuning zeolite properties towards CO2 methanation: An overview. ChemCatChem 2019, 11, 2388–2400. [Google Scholar] [CrossRef]
  28. Sholeha, N.A.; Mohamad, S.; Bahruji, H.; Prasetyoko, D.; Widiastuti, N.; Fatah, N.A.A.; Jalil, A.A.; Taufiq-Yap, Y.H. Enhanced CO2 methanation at mild temperature on Ni/zeolite from kaolin: Effect of metal–support interface. RSC Adv. 2021, 11, 16376. [Google Scholar] [CrossRef]
  29. Dreyer, J.A.H.; Li, P.; Zhang, L.; Beh, G.K.; Zhang, R.; Sit, P.H.-L.; Teoh, W.Y. Influence of the oxide support reducibility on the CO2 methanation over Ru-based catalysts. Appl. Catal. B Environ. 2017, 219, 715–726. [Google Scholar] [CrossRef]
  30. Hu, L.; Urakawa, A. Continuous CO2 capture and reduction in one process: CO2 methanation over unpromoted and promoted Ni/ZrO2. J. CO2 Util. 2018, 25, 323–329. [Google Scholar] [CrossRef] [Green Version]
  31. Burger, T.; Koschany, F.; Thomys, O.; Köhler, K.; Hinrichsen, O. CO2 methanation over Fe- and Mn-promoted co-precipitated Ni-Al catalysts: Synthesis, characterization and catalysis study. Appl. Catal. A Gen. 2018, 558, 44–54. [Google Scholar] [CrossRef]
  32. Wierzbicki, D.; Motak, M.; Grzybek, T.; Gálvez, M.E.; Da Costa, P. The influence of lanthanum incorporation method on the performance of nickel-containing hydrotalcite-derived catalysts in CO2 methanation reaction. Catal. Today 2018, 307, 205–211. [Google Scholar] [CrossRef]
  33. Krachuamram, S.; Danvirutai, C.; Youngme, S.; Chanapattharapol, K.C. Effects of Cetyltrimethylammonium Bromide and Heptane on the Surface Properties and CO2 Adsorption of Zeolite NaX. J. Chin. Chem. Soc. 2017, 64, 658–665. [Google Scholar] [CrossRef]
  34. Zhu, Y.; Hua, Z.; Zhou, J.; Wang, L.; Zhao, J.; Gong, Y.; Wu, W.; Ruan, M.; Shi, J. Hierarchical Mesoporous Zeolites: Direct Self-Assembly Synthesis in a Conventional Surfactant Solution by Kinetic Control over the Zeolite Seed Formation. Chem. A Eur. J. 2011, 17, 14618–14627. [Google Scholar] [CrossRef] [PubMed]
  35. Shvets, O.V.; Kasian, N.; Zukal, A.; Pinkas, J.; Cejka, J. The Role of Template Structure and Synergism between Inorganic and Organic Structure Directing Agents in the Synthesis of UTL Zeolite. Chem. Mater. 2010, 22, 3482–3495. [Google Scholar] [CrossRef]
  36. Xue, T.; Li, S.; Wu, H. Surfactant-promoted synthesis of Hierarchical Zeolite ferrierite nano-sheets. Microporous Mesoporous Mater. 2021, 312, 110748. [Google Scholar] [CrossRef]
  37. Krachuamram, S.; Chanapattharapol, K.C.; Kamonsutthipaijit, N. Synthesis and characterization of NaX-type zeolites prepared by different silica and alumina sources and their CO2 adsorption properties. Microporous Mesoporous Mater. 2021, 310, 110632. [Google Scholar] [CrossRef]
  38. Le, T.A.; Kim, J.; Kang, J.K.; Park, E.D. CO and CO2 methanation over M (MMn, Ce, Zr, Mg, K, Zn, or V)-promoted Ni/Al@ Al2O3 catalysts. Catal. Today 2020, 348, 80–88. [Google Scholar] [CrossRef]
  39. Le, T.A.; Kim, J.; Kang, J.K.; Park, E.D. CO and CO2 methanation over Ni/Al@ Al2O3 core–shell catalyst. Catal. Today 2020, 356, 622–630. [Google Scholar] [CrossRef]
  40. Lee, Y.H.; Ahn, J.Y.; Nguyen, D.D.; Chang, S.W.; Kim, S.S.; Lee, S.M. Role of oxide support in Ni based catalysts for CO2 methanation. RSC Adv. 2021, 11, 17648. [Google Scholar] [CrossRef]
  41. Le, M.C.; Van, K.L.; Nguyen, T.H.T.; Nguyen, N.H. The Impact of Ce-Zr Addition on Nickel Dispersion and Catalytic Behavior for CO2 Methanation of Ni/AC Catalyst at Low Temperature. J. Chem. 2017, 2017, 4361056. [Google Scholar] [CrossRef] [Green Version]
  42. Karam, L.; Bacariza, M.C.; Lopes, J.D.; Henriques, C.; Massiani, P.; Hassan, N.E. Assessing the potential of xNi-yMg-Al2O3 catalysts prepared by EISA-one-pot synthesis towards CO2 methanation: An overall study. Int. J. Hydrogen Energy 2020, 45, 28626–28639. [Google Scholar] [CrossRef]
  43. Lee, S.M.; Lee, Y.H.; Moon, D.H.; Ahn, J.Y.; Nguyen, D.D.; Chang, S.W.; Kim, S.S. Reaction Mechanism and Catalytic Impact of Ni/CeO2−x Catalyst for Low-Temperature CO2 Methanation. Ind. Eng. Chem. Res. 2019, 58, 8656–8662. [Google Scholar] [CrossRef]
  44. Breßler, I.; Kohlbrecher, J.; Thünemann, A.F. SASfit: A tool for small-angle scattering data analysis using a library of analytical expressions. J. Appl. Crystallogr. 2015, 48, 1587–1598. [Google Scholar] [CrossRef] [PubMed] [Green Version]
Figure 1. X-ray diffraction patterns of synthesized samples without (Z samples) and with (ZA samples) organic substances (CTAB and heptane) with different aging times.
Catalysts 12 00823 g001
Figure 2. X-ray diffraction patterns of synthesized samples with different crystallization times.
Catalysts 12 00823 g002
Figure 3. N2 adsorption–desorption isotherms of zeolite without additives (Z_5D_9h) and with additives (ZA_5D_9h) obtained from an optimal aging and a crystallization time.
Catalysts 12 00823 g003
Figure 4. The SAXS profiles of zeolite mixtures at various aging periods at room temperature (a) without and (b) with additives as shown in spheres and with the fits shown in solid lines. The stack of the curves is for clarity. (c) The radii of particles of zeolite mixture without and with additives were obtained from the fits of the scattering curves, and (d) the proposed nucleation precursor formation in the presence of CTAB and heptane, which promoted the nucleation precursor.
Catalysts 12 00823 g004
Figure 5. CO2 methanation catalytic activities of (a) 5, 10, 15, and 20wt%Ni/ZA_5D_9h; (b) 15wt%Ni/ZA_5D_9h, 15wt%Ni/Z_5D_9h, ZA_5D_9h, and Z_5D_9h; (c) CH4 selectivity of 15wt%Ni/ZA_5D_9h, 15wt%Ni/Z_5D_9h, ZA_5D_9h, and Z_5D_9h; (d) stability of 15wt%Ni/ZA_5D_9h at 400 °C for 70 h; and (e) Arrhenius plot of 15wt%Ni/Z_5D_9h, 5, and 15wt%Ni/ZA_5D_9h.
Catalysts 12 00823 g005aCatalysts 12 00823 g005b
Figure 6. H2-TPR of 15wt%Ni/Z_5D_9h and 15wt%Ni/ZA_5D_9h.
Catalysts 12 00823 g006
Figure 7. (a) CO2 uptake and (b) CO2-TPD of 15wt%Ni/Z_5D_9h and 15wt%Ni/ZA_5D_9h.
Catalysts 12 00823 g007
Figure 8. (a) Ni K-edge XANES spectra of 15wt%Ni/ZA_5D_9h during pretreatment and CO2 methanation; (b) selected XANES spectra of Ni K-edge at different conditions compared with Ni0, Ni2+ standards and fresh catalyst; and (c) fraction of Ni0; and Ni2+ existing on the 15wt%Ni/ZA_5D_9h catalyst during pretreatment process obtained by linear combination fitting.
Catalysts 12 00823 g008aCatalysts 12 00823 g008b
Figure 9. (a) The k2 weight EXAFS and (b) the radial function of Ni K-edge EXAFSspectra of 15wt%Ni/ZA_5D_9h under CO2 methanation condition at 150, 400, and 500 °C.
Catalysts 12 00823 g009
Table 1. Surface area and pore volume of synthesized zeolite.
SamplesSBET
(m2/g)
Pore Volume
(cm3/g)
Z_5D_9h13.980.0442
ZA_5D_9h166.50.1090
15%Ni/Z_5D_9h25.660.0548
15%Ni/ZA_5D_9h14.110.0495
Table 2. The best fitting parameter of 15wt%Ni/ZA_5D_9h.
Reaction Temperature (°C)PathsN S 0 2 σ 2 R
150 °CNi°–Ni°120.8560.011232.50
Ni2+–O60.1440.000502.12
400 °CNi°–Ni°120.8010.016032.47
Ni2+–O60.1990.003202.10
500 °CNi°–Ni°120.7300.015762.45
Ni2+–O60.2700.004002.05
Publisher’s Note: MDPI stays neutral with regard to jurisdictional claims in published maps and institutional affiliations.

