Review

Recent Advances in Catalysis for Methanation of CO2 from Biogas

1
Deutsches Biomasseforschungszentrum Gemeinnützige GmbH, Torgauer Straße 116, 04347 Leipzig, Germany
2
Leibniz-Institut für Katalyse e.V., Albert-Einstein-Straße 29a, 18059 Rostock, Germany
*
Author to whom correspondence should be addressed.
Catalysts 2022, 12(4), 374; https://doi.org/10.3390/catal12040374
Submission received: 10 March 2022 / Revised: 22 March 2022 / Accepted: 23 March 2022 / Published: 25 March 2022
(This article belongs to the Special Issue Heterogeneous Catalysis in Green Chemistry)

Abstract

:
Biogas, with its high carbon dioxide content (30–50 vol%), is an attractive feed for catalytic methanation with green hydrogen, and is suitable for establishing a closed carbon cycle with methane as energy carrier. The most important questions for direct biogas methanation are how the high methane content influences the methanation reaction and overall efficiency on one hand, and to what extent the methanation catalysts can be made more resistant to various sulfur-containing compounds in biogas on the other hand. Ni-based catalysts are the most favored for economic reasons. The interplay of active compounds, supports, and promoters is discussed regarding the potential for improving sulfur resistance. Several strategies are addressed and experimental studies are evaluated, to identify catalysts which might be suitable for these challenges. As several catalyst functionalities must be combined, materials with two active metals and binary oxide support seem to be the best approach to technically applicable solutions. The high methane content in biogas appears to have a measurable impact on equilibrium and therefore CO2 conversion. Depending on the initial CH4/CO2 ratio, this might lead to a product with higher methane content, and, after work-up, to a drop in-option for existing natural gas grids.

1. Introduction

Carbon dioxide (CO2) is the greenhouse gas that is considered to be the main cause of human-induced climate change [1]. It is one of the main by-products of industrial processes and energy production, such as power, heat, and transportation [2,3]. The main goal has to be the reduction of these emissions in order to eventually stop global warming. Whenever possible, biogenic energy sources should be used, as the CO2 emitted from these processes was previously bound from the air during plant growth, thus creating an emission-neutral cycle of carbon use instead of releasing CO2 from fossil energy sources. If the emissions from such processes cannot be reduced further by increasing efficiencies, reducing consumption, or using biogenic energy sources, it is also possible to capture and use the CO2 produced in the process [3,4].
The conversion of CO2 in carbon capture and utilization (CCU) processes to molecules like methanol, dimethyl ether, urea, or methane (CH4) creates added economic value and reduces the consumption of the initially used, mostly fossil, energy sources by maximizing the utilization of carbon [5]. In this way, a reduction of emissions through a circular economy of CO2 can be achieved. A major step towards defossilization can be taken by replacing fossil fuels with biogenic sources, and subsequently CCU for further processes, attaining so-called bioenergy with CCU processes (BECCU) [6,7].
Power-to-gas (PtG) processes, linking the electricity grid to the gas grid, are a promising way to produce fuels from CO2 [8]. Even in a defossilized and heavily electrified future, some sectors are going to be reliant on carbon-based fuels due to their low potential for electrification, such as aviation or heavy-duty transport on land and sea. In methanation processes, CH4 is produced from CO2 (or carbon monoxide, CO) and hydrogen (H2), which stems from the electrolytic splitting of water (H2O) into H2 and oxygen (O2) [9]. The production of methane from CO2 is a relatively simple and robust synthesis, which can be carried out in small-scale plants and without the necessity of a large CO2 point source. While methanation of CO is state of the art, using CO2 as carbon source for synthesis of CH4 only exists on a pilot scale today. One of the main arguments for technical methanation is that the existing large natural gas grid in many countries fulfills both the distribution and storage requirements of methane very efficiently [10].
To avoid greenhouse gas emissions from methanation, the electrolysis must be powered by electricity from renewable energy sources. At best, a biogenic source of CO2 should be used to avoid greenhouse gas emissions. A promising biogenic CO2 source is biogas. CO2 is already present in biogas at high concentrations of 15–60 vol% [11]. Due to the high CO2 content, the conventional carbon capture technologies can be used to separate CO2 and use it in a downstream process. However, it is also possible to save the energy intensive step of carbon capture and to hydrogenate the biogas—including CH4 and CO2—directly [12].
CO2 is thermodynamically very stable due to the highest oxidation state of the carbon atom and the linear structure of the molecule. Therefore, in direct biogas methanation, CO2 must be activated biologically by suitable microorganisms or thermo-catalytically by high energy input and/or suitable catalysts in order to react with other molecules [13,14].
In addition to CO2, biogas contains minor concentrations of sulfur compounds, ammonia, and organosilicon compounds known as siloxanes [15]. Such compounds, which often act as catalyst poisons, must be removed to use the biogas in a subsequent catalytic process. Sulfur-containing molecules are especially harmful, due to sulfur’s high affinity for transition metals, occupying the active sites of methanation catalysts [16,17]. For the fine desulfurization of biogas, the adsorption process with activated carbon and/or metal oxides has become widely accepted, as this is one of the simplest and most cost-effective solutions for H2S removal [18]. With such adsorbents, the H2S concentration of biogas can be reduced to sub-ppm range [19]. Even after fine desulfurization, the catalysts are exposed to low concentrations of H2S. Ni in particular is sensitive to sulfur-containing molecules down to the ppb range [20]. This shows that fine purification of the biogas is essential before catalytic utilization.
The major challenge in biogas methanation involves the catalyst-damaging trace components in biogas and the search for a catalyst resistant to those poisons. An additional interesting question is the impact of large amounts of CH4 in biogas on methanation, when CO2 is not separated from CH4 prior to the reaction.
This article concentrates on the chemical processes in thermo-catalytic methanation. The goal of this review is to evaluate current research on the influences of various biogas components on CO2 methanation catalysts, and to draw conclusions regarding which catalysts are suitable for direct biogas methanation.

2. Biogas Composition

The presence of catalyst poisons in biogas can be explained by the processes of biomass decomposition. Biogas is produced by the digestion of organic substrates by microorganisms under anaerobic conditions [21]. Any type of biomass composed of carbohydrates, cellulose and hemicellulose, proteins, and fats, can serve as the substrate for biogas production. During anaerobic digestion, the macromolecules mentioned are broken down by different microorganisms in four basic degradation steps, namely hydrolysis, acidogenesis, acetogenesis, and methanation, as shown in Figure 1 [22,23]. The resulting biogas is generally composed of 40–75 vol% CH4, 15–60 vol% CO2, and traces of H2O, H2, H2S, O2 (from desulfurization with air) and NH3 [11].
Waste biomass from agricultural or urban areas is particularly suitable for biogas production, as this avoids competition with the use of biomass as food. The exact composition of biogas is highly dependent on the used substrate or substrate mixture. For example, increased levels of H2S and other volatile sulfur-containing compounds such as mercaptans (R-SH) are seen in biogas when agricultural waste materials are used. The use of animal waste, e.g., chicken manure, results in high NH3 concentrations in the product gas [24]. Both H2S and NH3 are degradation products of proteins and their amino acids during acidogenesis [23,25]. H2S is only formed from the sulfur-containing amino acids cysteine and methionine, and NH3 is, among other reactions, a product of the Stickland reaction. In this redox reaction, two amino acids are degraded to acetate over several reaction steps [23].
Utilizing urban biomass such as municipal waste or sewage sludge adds other components to the biogas. For example, more halogenated hydrocarbons can be detected in the biogas from the fermentation of unsorted municipal waste, which can be traced back to plastic waste. In biogas from sewage sludge fermentation, particularly high concentrations of siloxanes are found. They enter the wastewater, for example, through the use of detergents and in the production of cosmetics [24]. In some cases, low concentrations of O2 and N2 can also be found in biogas. These are due to biological desulfurization, in which air is usually fed directly into the digester to oxidize sulfur-containing components to solid sulfur, thus separating them from the produced gas [11].
More detailed specifications of the expected biogas compositions obtained from agricultural waste, residual waste, biowaste, and sewage sludge are summarized in Table 1. The concentration ranges given in the table refer to the middle 60% of the measurement results [25,26]. The concentrations measured in each case were sorted in ascending order and evaluated without the highest and lowest 20% of the measured values. Thus, the table shows the mainly occurring concentration of the individual components. For a more detailed evaluation, including the maximum and minimum measured values and the median, please refer to [26].
Should biogas be used for direct combustion of the methane fraction in combined heat-and-power plants, the minor components of biogas would lead to adverse properties of the gas. The presence of CO2, H2O, NOx, and N2 results in a reduction of the calorific value [27]. Therefore, these components should be separated or, in case of CO2, be upgraded by the addition of H2 to raise the CH4 content. Components that should be considered critical for downstream processes include H2S, NH3, halogenated components, and siloxanes. H2S, NH3, and halogenated components have a corrosive effect on reactors or combustion engines in combination with water, and must be removed from the biogas to enable a long service life of the equipment [28]. The harmful effect of siloxanes arises from the reaction to microcrystalline SiO2, which is deposited on hot surfaces, where it causes abrasion or blocking [27,29,30]. Siloxanes are also possible catalyst poisons for downstream processes, as they might cover catalyst surfaces and block active sites [27].
The most prominent catalyst poisons in biogas are H2S and sulfur-organic compounds. Due to the high affinity of sulfur for transition metals, active sites of the catalyst are irreversibly occupied by strong chemisorption, leading to catalyst deactivation [17].
Knowledge of the biogas composition is important for selecting a suitable cleaning step prior to subsequent combustion or catalytic processing. To exploit biogases with a high content of sulfur-containing substances for catalytic downstream processes, further research should be conducted on sulfur-resistant catalysts.

3. CO2 Methanation

CO2 methanation (Equation (1)) can run directly or via CO as gaseous intermediate. In the second case, CO is formed by reverse water gas shift reaction (Equation (2)) followed by CO methanation (Equation (3)).
CO2 + 4 H2 ⇄ CH4 + 2 H2O     ΔHR = −165 kJ mol−1
CO2 + H2 ⇄ CO + H2O     ΔHR = 41 kJ mol−1
CO + 3 H2 ⇄ CH4 + H2O     ΔHR = −206 kJ mol−1
There is no consensus on the reaction mechanism of CO2 methanation. For the direct CO2 methanation, two main mechanisms are described. For one, the CO route with surface CO* intermediate species, and for the other, the formate route without intermediate CO [31]. However, if the reaction proceeds via CO as an intermediate (so-called carbide mechanism), reaction networks in which formate or carboxyl intermediates are formed have also been observed [32]. The carbide mechanism proceeds from CO2 via CO either to C (carbide) + O (not shown here) or to OCH2 and OCH3 as intermediates, which are hydrogenated to CH4 (Figure 2) [31,33,34]. The formate mechanism proceeds from CO2 via CO, HCOO, and C to CH4 [31]. Some groups also describe a formate route via methanol (Figure 3) [35]. However, the actual mechanism depends strongly on the catalyst’s properties.
Due to the exothermic character and the volume reduction during CO2 methanation, the equilibrium is shifted towards CH4, according to Le Chatelier’s principle, at low temperatures and high pressures. Nevertheless, the thermodynamically very stable structure of CO2 requires high activation energy. This is based on the fulfillment of the octet rule for each of the three atoms by the double bonds between carbon and oxygen atoms, and the two lone pairs at the oxygen atoms [36]. In addition, the reduction of CO2 to CH4 represents an eight electron process, which limits the reaction kinetically at low temperatures [37]. Therefore, temperatures above 200 °C are necessary to achieve sufficiently high reaction rates [38]. To overcome these activation barriers and to reach high CO2 conversions at sufficiently low temperatures, which is preferred because of the conditions of equilibrium, catalysts are required [39].
The key challenge for catalytic methanation with CO2 is finding a suitable catalyst with high activity at low temperatures [40,41]. Considering the high exothermic heat of the reaction, an effective heat management in the reactor is essential. Temperature hot spots might shift the equilibrium to unfavorable conditions, leading to catalyst deactivation by sintering, active metal agglomeration, coking via methane decomposition, or end in the worst case with reactor runaway.

4. Catalysts for Biogas Methanation

The direct methanation of biogas without prior separation of CO2 from CH4, which is referred to in the following as direct biogas methanation, is intended to take place at biogas plant sites and thus at small CO2 point sources. Besides having efficient plant conditions for the technology to be commercially viable, a high-performance catalyst providing high conversions, high selectivity, long lifetime, and a competitive price is crucial. Due to the possible presence of catalyst poisons such as sulfur-containing components even in purified biogas, the catalysts used for direct biogas methanation require a certain resistance to sulfur.
In most cases, methanation catalysts are composed of active metal particles that are finely distributed on an oxidic support material [42]. By supporting the catalytically active particles and thus dispersing them well on the surface of the support, the active surface area and the respective number of active sites is increased. The resulting interface between the substrate and the active metal also plays an important role, since H2 dissociation occurs at the active metal, and CO2 is mainly activated by the support [43,44]. Due to the spatial proximity of the activated species, the methanation reaction can proceed more easily at this interface. The introduction of one or more additional metals as promoters can improve both the dispersion of the active metal and the catalytic performance in general [45]. Besides the selection of the active metal, a suitable support, and optional promoters, the concentrations of the respective components play a major role [42,45]. Likewise, the preparation method can influence the catalytic activity, as it affects the particle size of the active component and the metal-support interactions [42,46]. Since the composition of a suitable catalyst is crucial for achieving high conversions and yields in methanation, the individual components of methanation catalysts are discussed in more detail (Section 4.1, Section 4.2 and Section 4.3). Materials, which can lead to improved S-compatibility of the catalyst, are discussed in Section 4.5.

4.1. Active Metal

There are several metals that catalyze CO2 methanation, especially transition metals from groups 8 to 10 [46]. Below are the descending series of activity and methane selectivity [46,47]:
Activity Ru > Fe > Ni > Co > Rh > Pd > Pt > Ir
Selectivity Pd > Pt > Ir > Ni > Rh > Co > Fe > Ru
Noble metals such as Ru, Rh, and Pd lead to high CH4 yields, because these metals are active in H2 activation at low temperatures. This correlates well with the low temperature level of the thermodynamic equilibrium, leading to an easy formation of CH4 [48]. Despite the high activity or selectivity of noble metals, they are rarely applied in industry due to their high cost [41,46]. If the price is neglected, Ru would be the most suitable active metal for methanation, especially at low temperatures [46]. Cheaper alternatives include Fe, Co, and Ni, with Ni being the most studied active metal for methanation to date, because of its competitive high activity and selectivity to CH4 [49,50]. In experiments up to 800 °C, other transition metals (Mo, Ag, Os, Ir, Pt) also showed methanation activity for carbon oxides. However, the list of important metals for methanation can be shortened due to the high cost by most of the noble metals to Fe, Co, Ni, Mo, and Ru [51]. Of these metals, the methanation activity of Ru is the highest, followed by Ni, Co, Fe, and Mo [51].

4.2. Support Material

Supports influence the adsorption capacity and morphology of the active phase, which can increase the catalytic activity [45]. Acidic or basic sites are often provided by supports rather than the metals. The related metal-support interaction might strongly affect metal activity, dispersion, and stabilization [52]. High basicity is also advantageous for CO2 activation as CO2 chemisorption is facilitated [48]. In some cases, active metals might even form new crystalline phases with support materials, e.g., highly stable Ni spinels [53]. Among the most studied supports are Al2O3, SiO2, TiO2, MgO, CeO2, and ZrO2 [41,42]. The use of mixed oxides composed of two of the aforementioned support materials may potentially increase the reducibility of the active phases or the stability of the catalysts [1].
The formation of spinels and solid solutions, e.g., between Al2O3 and MgO, is well known [53]. Their presence can stabilize Ni/Al2O3 [54], and thus high dispersion at high temperature stability can be achieved. Another example is the combination of CeO2 and ZrO2, which has already been studied [42,55,56,57]. Synergistic effects occur between the two oxides, bringing out the advantages of both support materials. CeO2 in general is a special support material due to its fluorite crystal structure. These crystal structures consist of a face-centered cubic packing of Ce4+ cations with all tetrahedral vacancies occupied by O2−. The reduction of CeO2 leads to the formation of free oxygen vacancies on the surface of the crystal lattice, where oxygen can be easily stored and released. They also facilitate the adsorption and activation of other oxygen-containing molecules, such as CO2 [35,57,58]. It was found that the methanation reaction with CeO2-supported Ru catalysts proceeds via the formate mechanism, in which formate is formed as an intermediate and hydrogenated subsequently (Figure 3). In contrast, this reaction pathway was not observed in an analogous experiment with Ru supported on Al2O3. Instead, CO was formed as intermediate (Figure 2) [35]. The addition of ZrO2 to CeO2 changes the crystal structure from a cubic lattice to a tetragonal crystal lattice with increasing ZrO2 concentration [57]. This results in an enhanced formation of oxygen vacancies due to easier reducibility and higher oxygen mobility in the crystal lattice [1,57]. In addition, cations of the active metals can be better incorporated into the lattice, where ZrO2-induced defects are present [57]. In summary, this leads to a high concentration of oxygen vacancies, high dispersion of the metal, and basic properties with the mixed CeO2-ZrO2 support [55].

4.3. Promoters

Generally, alkali and alkaline earth metals, transition metals, and rare earth metals are used as promoters. They can incorporate into the crystal lattice in ionic form, or deposit on the surface of the catalyst as oxides [48]. Such compounds act either electronically or as the structural promoter for metal dispersion and thermal stability. Another powerful effect is the modification of acid/basic sites on the catalyst surface by selective blocking (poisoning). The effects of the most investigated promoters for CO2 methanation are listed in Table 2. The active metals described in Section 4.1 can also be used as promoters. The promoter weight percentage is typically far below that of active metal or support [42].
An example of a promoting effect is the facilitated activation of CO2 due to increased basicity at the surface of the catalyst [48]. The dispersion of the active metal is also improved by most promoters, as well as the metal-support interactions in general [45].
In addition to improving effects, however, promoters can also have inhibiting effects. The concentration of the used promoter and the type of promoter itself play an important role. For example, if K is added to Ni, the reaction to higher hydrocarbons is facilitated [36,46]. The methanation is thus inhibited, which is why K is not suitable for CO2 methanation. Adding Cu is also unsuitable for CO2 methanation with Ni-based catalysts, as the NiCu alloy does not adsorb H2, and thus inhibits the hydrogenation reaction [48]. Regarding the concentration of promoters, volcano-shaped curves are often observed for the activity of the catalyst, meaning that the activity increases up to a certain concentration of promoter and then decreases at higher concentrations [36,64].

4.4. Deactivation of Catalysts

The relevant chemical, thermal, or mechanical mechanisms of catalyst deactivation are deeply discussed in, e.g., [63]. These effects might be reversible or irreversible, and Table 3 gives a short overview.
Most metal catalysts with acceptable methanation activity (cf. Section 4.1) are extremely sensitive to sulfur-containing compounds, and will inevitably deactivate over time in presence of H2S. Such chemical poisoning occurs predominantly via the dissociative adsorption of H2S on metal surfaces.
This effect was extensively investigated for Ni, as it serves as an active metal in highly important processes for hydrogenation of feedstocks contaminated with sulfur compounds. The poisoning by H2S is evident in the ppm range and even below. At such low partial pressures with a low degree of surface coverage, sulfur is up to three times more strongly bound to Ni than in bulk sulfides, and blocks the surface very effectively, as a single S atom interacts with several Ni atoms [63,65]. Sulfur preferably adsorbs at the defect sites of Ni particles, which are the active sites [66]. In the worst case, nearly complete coverage can occur at 0.1–1 ppm H2S. This hinders the desired adsorption and activation of H2, and explains the extreme deactivation of Ni by sulfur. The poisoning effect of H2S is very strong and almost irreversible, as stable sulfides like NiS or Ni3S2 can eventually form [63].
Similarities exist between methanation and the dry or steam reforming of methane (reductive mixtures of CO2, CH4, H2, CO, H2O at high temperature, Ni catalysts, traces of sulfur). The presence of various sulfur compounds adsorbed on Ni and Rh catalysts supported on CeO2-Al2O3 during steam reforming was proven by XANES (X-ray absorption near edge structure) measurements [67]. At temperatures up to 800 °C, four major sulfur species were detected: metal sulfides, organic sulfides with C-S-C bonds, sulfonates -RSO2O, and sulfate. Rh clearly outnumbered Ni regarding S resistance at 800 °C. In that study, some sulfur compounds were formed exclusively on either Ni or Rh. This points to a much higher complexity of surface S chemistry and poisoning. In the absence of sulfur, the carbon formation rate was low, while in the presence of sulfur the carbon deposition contributed 2/3 to deactivation. This points to a strong effect of sulfur on the carbon chemistry of Ni catalysts, which lowers the number of reactive carboxyl groups necessary for carbon gasification compared to Rh. Within a few hours the initial deactivation by S poisoning of Ni leads to sulfides, and subsequently unreactive carbon is formed [67].
Carbon formation, as the second major deactivation mechanism over Ni-based catalysts, leads to different types of deposits (filaments, encapsulating and pyrolytic carbon) [63]. Almost each of the effects described in Table 3 is relevant: chemisorption, physisorption, blocking the active metal surface by coverage, encapsulation, or pore plugging. The presence of hydrocarbons in the biogas feed will drastically increase the formation of carbon filaments. This can be partially suppressed by high Ni dispersion.
CO2 methanation typically runs at a high temperature and concentration of formed H2O as described in Section 3. Both are known to cause Ni sintering. Effective catalysts should be active at temperatures below 400 °C (at the cost of poor energy recovery) and stable against sintering and coking up to 700 °C [42]. Carbon formation and sintering can be prevented mainly by two approaches: setting optimum reaction conditions (temperature, pressure, H2 partial pressure) and catalyst modification.
In contrast to poisoning by sulfur, some of the carbon-mediated effects are reversible, and deposited carbon can be removed by gasification with H2, O2 or H2O at high temperature. Comparing the deactivation effects caused by S-compounds and C-compounds, the first is the bigger challenge in the application of metal catalysts for biogas methanation, since the deactivation effect is strong and catalyst regeneration is difficult.
In this context, it must be mentioned that sulfur compounds also interact with the metal surfaces of metallic construction materials (including Ni) following the described mechanisms. This may require additional measures, such as the inertization of pipes, reactors, and analytical equipment. On such sulfided surfaces, hydrocarbons may react to oligomers and finally carbon deposits [68].
Ni catalysts react under certain conditions with CO and may form volatile Ni carbonyl Ni(CO)4 at temperatures up to 300 °C [63]. Thus, the CO partial pressure must be minimized as far as possible.

4.5. Increasing Sulfur Resistance

The sulfur resistance can be modified by measures that either focus on the catalyst or the process [65]. Considering the described sensitivity of the conventional methanation catalysts against sulfur, a proper process design is the most effective way to lower the sulfur content to 0.1 ppm at the reactor inlet. This can be achieved at comparatively low cost with upstream ZnO adsorbers operated at 200 °C, which trap sulfur as ZnS. Thereby, the catalysts can reach lifetimes of 1–2 years. Alternatively, with an oversized bed of a cheap catalyst, the lifetime of the reactor load might be elongated as well [63].
Based on these ideas, several advanced catalyst concepts have been discussed. The trapping concept was demonstrated with a Ru/CeO2 catalyst immobilized in a micro-structured reactor by adding Ni as sulfur trapping component. This improved the catalyst stability in CO2 methanation with 1 ppm H2S [69]. Changing the reaction conditions (temperature, pressure, feed composition) offers some potential to influence the adsorption equilibria on the catalyst surface. Other sulfur adsorbing sites such as Zn or Ce may be added to the catalyst to decrease the poisoning. This could have a similar protective effect as upstream traps. A similar approach is to create mass transfer limitations that stop poisons at the surface before entering the pores with the active metal sites (core-shell catalysts, protective layers [63]). Interestingly, among several Al2O3-supported mono- and bimetallic Ni and Co catalysts, monolith-type catalysts showed higher S tolerance compared to pelletized or powder catalysts at 525 °C with 10 ppm H2S in the feed, although complete deactivation was reached within 2–3 days [70].
When modifying the catalyst, proper choice of the active metal, and the support and promoters, are possible factors to achieving higher stability. Numerous studies varied the innumerable compositions as well as the preparation and pretreatment parameters, e.g., to reduce the strength of poison adsorption by catalyst modification.

4.5.1. Active Metal

Several strategies have been reported to prepare monometallic Ni catalysts with improved sulfur resistance. Avoiding defect sites, e.g., by using plasma techniques, has been proposed [42,71,72,73]. Thereby, improved S-tolerance of a 10% Ni/SiO2 catalyst for CO methanation with smaller Ni particle size, less defects, and enhanced metal-support interaction was obtained. The catalyst was tested with 10 ppm H2S up to 500 °C. In particular, the low-temperature activity was improved, and carbon formation (encapsulation) was decreased [71].
Weakening the interaction between sulfur and the metal can be improved by using bimetallic catalysts like Ni-Ru with small cluster sizes. The lifetime of a Ni-Ru/SiO2 catalyst for CO methanation was significantly improved by using polyethylene glycol as an additive during preparation, and exceeded the stability of separated Ru and Ni/SiO2 catalysts [74]. This was explained by geometric factors: H2S adsorption was weaker when interacting with Ni and Ru simultaneously, and the small metal particles were more stable against sintering, which lowered the carbon formation. Thus, catalyst lifetime was extended to 400 h.
Regarding energetic and electronic aspects, DFT (density functional theory) calculations are an excellent approach to estimating the adsorption energies of sulfur or carbon containing compounds on metal surfaces. Adding Ni to a Rh catalyst for CO methanation significantly changes the S adsorption and CO dissociation energies, which results in lower sulfur coverage, thereby increasing catalyst stability [75]. The combination of DFT calculations and experiments in steam reforming on Ni-Ru, Ni-Sn, and Ni catalysts (Ni/M = 3) supported on Al2O3 in the presence of H2S, identified bimetallic surfaces with lower H2S adsorption energies and enhanced adsorption of hydrocarbons [76].
Beyond the mentioned metals used in hydrogenation catalysts, which are deactivated by sulfur, some metals such as Mo or W can form various materials with different oxidation states, which promote redox reactions as well. Some of them are known to form active phases with much better sulfur tolerance. Co-Mo and Ni-Mo (W) supported on γ-alumina are state-of-the-art hydrodesulfurization (HDS) catalysts, which can cope with sulfur contents of 1000 ppm and more [67,68,77]. The active phase MoS2 is easily accessible from MoO3 precursor via in situ sulfurization, e.g., with dimethyl disulfide or H2S, and shows highest HDS efficiency in the temperature range of 380–400 °C. This matches the preferred temperature range of methanation. MoO3 precursors might form tetrahedral, octahedral, and crystalline phases on Al2O3 depending on preparation and calcination methods. In addition, Al2(MoO4)3 species form above 600 °C [78]. MoS2 is catalytically active in methanation. A special advantage of Mo catalysts is that they can be operated in methanation at much lower H2/CO ratios than Ni-based materials unless steam is added to prevent carbon deposition [79]. These findings offer the potential to develop S-resistant catalysts [42,80,81]. However, the activity of Mo for methanation is still lower compared to other metals. The highest CO conversion of 46% was achieved at 560 °C with a MoO3/Al2O3 catalyst obtained via the incipient wetness method. Moderate deactivation was observed over 45 h on stream in the presence of 0.24 vol% H2S [78]. Modification of a Ni/Al2O3 catalyst for methanation of CO with Mo led to improved activity even with 10 ppm H2S [70]. The combination of 50% Ni and MoO3 on Al2O3 support showed acceptable catalytic performance in the methanation of CO2-rich gas from biomass gasification in the presence of 10 ppm H2S [82]. The nature and amount of the poisoning sulfur species (sulfide, sulfate) were analyzed by XANES and temperature-programmed oxidation, respectively. It was observed that the poisoning was due to thiophene, but not H2S. Total run times of 100 h were achieved.
To develop such sulfide catalysts, several obstacles must be tackled: (1) classical HDS catalysts permanently lose sulfur during hydrogenation in form of H2S, which must be replenished by continuously feeding low concentrations of S compounds; (2) the possible activity of such catalysts in the oligomerization of carbon species on the catalyst surface; and (3) the acidity of such metal sulfides.

4.5.2. Support

One very important support feature is acidity, which governs the adsorption and desorption of sulfur compounds [74]. With Ni as active metal, the sulfur tolerance decreases in the order CeO2 > α-Al2O3 > TiO2 > MgO [44,69]. CeO2 is known for its redox properties, and introduces basic sites for CO2 activation [83], while Al2O3 provides high surface area and thermal stability. The effect of the promoter CeO2 on the S-resistance of Ni/Al2O3 was investigated in CO2 methanation [84]. As with other promoters, CeO2 helps in dispersing Ni by forming smaller crystallites and hindering their growth. Such mixed CeO2-Al2O3 supports are effective at slowing down Ni deactivation during CO2 methanation at 300 °C in the presence of 0.4 ppm H2S [85]. The improved sulfur resistance was explained by the formation of Ce2O2S. This phase is thermodynamically preferred over NiS, with the reaction to sulfided CeO2 occurring spontaneously over the entire temperature range. As a result, the catalytically active Ni sites remain stable for a longer time, even in the presence of S compounds [62]. However, the Ni/CeO2-Al2O3 catalyst deactivated rapidly in less than 60 h. Interestingly, CeO2 doped with rare-earth metal (La, Gd, Sm, Nb, Y) was reported to be active and stable in the steam reforming of biogas and other feeds in the presence of H2S, even at 900 °C [86]. This proves the importance of O mobility in the catalysts.
TiO2-supported noble metals Pt and Rh were also described as S-resistant catalysts, which was attributed to oxygen vacancies such as those present in the CeO2 lattice. H2S can be incorporated into these vacancies [71,87]. In general, the acidity of the support material plays a major role in sulfur adsorption, with the less S being deposited, the more acidic the surface.
Using Ru as active metal (5 wt%) on various supports in micro-structured reactors showed an activity ranking SiO2 > CeO2, TiO2 in CO2 methanation with 1 ppm H2S [69]. However, the initial activity of the catalysts drastically dropped within 50 h at the latest.
As mentioned above, the obvious combination of sulfur-resistant MoO3 with γ-Al2O3 gives comparatively low activity. A more suitable support is required, since Mo strongly interacts with the basic OH sites of Al2O3 support, which is disadvantageous for the formation of the active MoS2 phase [88]. Using MoO3 and a binary CeO2-Al2O3 support via co-precipitation preparation, stable CO methanation over 40 h was achieved [89].

4.5.3. Promoters

For the most preferred transition metals (Pt, Pd, Ni, Rh, Mo, W), sulfur withdraws charge from the metal, which decreases the ability to adsorb CO and to dissociate H2. Suited promoters that counteract S poisoning, e.g., in the reforming process, are Cu, Ag, Au, Al, Zn, and Sn, which form bimetallic phases with the active metals [65]. Another beneficial effect of these promoters might be that they are able to increase the activity of Mo and W in HDS. Here, Ni is an outstandingly effective promoter, as it accelerates the formation of MoS2. Since the composition of the catalysts is the same as that preferred for CO2 methanation, these promoters could also be suitable in this case.
Likewise, alkaline promoters can increase the S-tolerance of a supported Ni catalyst. An obvious effect would be the inactivation of acid sites (electronic effect). In a Ni/SiO2 catalyst for benzene hydrogenation, the use of alkali metals (Li, Na, and K) led to the partial blocking of Ni surface, which was explained by geometric effects. This decreased the adsorption of H2S and thiophene [90].
So far, few studies have been conducted on the development of S-resistant catalysts for CO2 methanation. However, such catalysts are important for the direct use and upgrading of existing gases, such as biogas. By developing effective S-resistant catalysts, the biogas can be used without the need for fine purification. This would make direct methanation of biogas more economical.
Apart from the mentioned active compounds, other types of catalysts with remarkable methanation activity and sulfur resistance have been developed. Well-known are supported noble metal catalysts. During the last decades, some new phases such as carbides, nitrides, and phosphides have been investigated in combination with various active metals [68,91]. Nevertheless, these concepts are still far away from realization [42], but the findings might be the starting point for catalyst preparation with such materials and advanced methods (cf. Section 4.5).

4.6. Catalyst Regeneration

Sulfur poisoning determines the overall deactivation rate compared to carbon formation. As mentioned, sulfides, sulfates, and other structures can form during methanation and sulfur poisoning in general. As a final means to prolong the catalyst lifetime, regeneration by oxidation or reduction was proposed by several authors [63,92,93]. This is very difficult however, as the effectivity is hindered by several effects. By reduction, the removal rate is far too low for technical applications. Raising the temperature might be helpful, but this is only possible with thermally stable catalysts. The same is true for oxidative treatment, which might additionally lead to the formation of NiSO4 as the most stable structure [69]. Another option, steam treatment, might be applied. More sophisticated protocols have been tested, e.g., for the regeneration of a Ni/SiO2 catalyst poisoned by thiophene using a sequence of oxidation–reduction treatments at low O2 partial pressure and 1 atm H2. Temperatures above 700 °C would be necessary in all cases, which causes sintering of Ni metal particles.
Apart from that, some treatments with oxidants such as permanganate, hypochlorite and N2O were reported, which are only applicable ex situ.

5. Review Criteria and Catalyst Nomenclature

This review aims to analyze scientific literature on experiments with catalysts for direct biogas methanation. Hence, only studies on CO2 methanation are regarded. The selected publications include tests with simulated biogas as feed, which contains CH4 in addition to CO2, and studies on catalyst poisoning by H2S. Other catalyst poisons, for example NH3, are not considered, because not enough experimental studies on them were found. The focus of the selected studies is set on the catalyst and its composition of metal, support material, and, where relevant, promoters. For this purpose, only studies with specified catalyst composition were evaluated. For uniformity and better readability, the naming of catalysts is adjusted in this review when necessary. When naming catalysts in the following, the active metal will be named first, followed by promoters after a hyphen, if applicable. The support material follows a slash character, as in the following example: Ni20-Cu5/Al2O3. The numbers after the metals indicate the targeted loading in weight percent. The results of the selected studies are based on experiments. Simulation studies were only considered as support for the experimental findings.

6. Influence of CH4 in the Feed Gas

Several studies state that the separation of CO2 from CH4 is unnecessary when biogas is used for CO2 methanation [12,14,94,95]. However, not many studies have experimentally tested the influence of CH4 in the feed on methanation. On the one hand, the high CH4 content in the gas could shift the reaction equilibrium towards the reactants according to Le Chatelier’s principle. This would decrease the conversions of CO2 and H2, and consequently lead to a lower CH4 yield. On the other hand, in industrial processes CH4 is recycled to the inlet gas to act as a diluent and to contribute to a better temperature distribution in the reactor during the exothermic reaction of CO2 and H2 [96]. This avoids hot spots in the reactor bed.
To summarize the current knowledge of the CH4 impact on CO2 methanation, this section outlines and evaluates four experimental studies with different catalysts. The CO2 yield and CH4 selectivity achieved in these studies are displayed in Table 4 for respective CH4/CO2 ratios in the feed.

6.1. Influence of CH4 on Ni/Al2O3

The performance of Ni/Al2O3 catalysts, with promoters or non-promoted, has been investigated in three studies with CH4 in the inlet gas.
In the first study, four incipient wetness impregnated catalysts with 12 or 20 wt% Ni, either non-promoted or with 0.5 wt% Ru on Al2O3, were studied [97]. The two better performing catalysts with higher Ni loading were selected for the investigation of CH4 influence under the reaction conditions given in Table 5.
In a first experiment with unpromoted Ni20/Al2O3, the composition of the gas was varied by changing the concentration of CH4,in from zero via 14 to 29 vol% and back to zero, holding each value for 2 h [97]. The addition of CH4 was compensated by the reduction of N2 content in the feed to leave the inlet content of H2 and CO2 unaffected. With increasing CH4 concentrations in the inlet gas, the CO2 conversion decreased slightly from 71.5% to 70.8% to 70.6% (Table 4). The initial CO2 conversion was well reproduced at 71.4% in the last 2 h without CH4 addition. The CH4 selectivity always remained high without much variation [97].
As a second experiment, both catalysts were tested with 29 vol% CH4 for 24 h [97]. No loss of CO2 conversion was observed during this time. In general, CO2 conversion in these experiments was slightly lower than in CO2 methanation with pure H2/CO2 stream, but the difference is not significant. The same applies to the CH4 selectivity, which remained above 99% in all cases (Table 4) [97]. Comparing the two studied catalysts, the Ru-promoted catalyst achieved higher CO2 conversion (81%) than the non-promoted Ni20/Al2O3, with 70% CO2 conversion in the 24 h experiment. As described in Section 4, the addition of Ru not only increases the number of active sites on the catalyst, but also promotes the reducibility of the catalyst. This was supported by the reduction profile (H2-TPR) for Ni20-Ru0.5/Al2O3 in that study [97].
These results show that the influence of 14 vol% and 29 vol% CH4 on CO2 methanation on Ni/Al2O3 is low, making both Ni catalysts on Al2O3 (with and without a Ru promoter) suitable for direct biogas methanation [97].
A second study investigated the influence of CH4 using Mg-promoted Ni/Al2O3 catalysts prepared by precipitation [98]. The reaction conditions are given in Table 6. With an unspecified pressure, it is assumed that the experiments were performed at 1 bar.
CO2 conversion decreased from 74% for the pure CO2 methanation to 67%, 64%, and 54% as the CH4 concentration increased (Table 4). Hence, compared to CO2 conversion without CH4 in the inlet gas, the highest tested CH4 concentration in the reactant gas led to a 20% decrease of CO2 conversion [98]. The CH4 yield showed a similar trend. However, the CH4 selectivity remained the same and thus appears to be independent of the CH4 concentration in the input stream.
The results from the second study imply that a high CH4 content leads to reduced CO2 conversion for Ni20-Mg3/Al2O3 [98].
A third study investigated the influence of CH4 in the inlet gas on two unpromoted Ni catalysts prepared by impregnation [99]. The reaction conditions for the first series of experiments in a fixed-bed reactor are given in Table 7.
The experiments with CH4 in the inlet gas were performed at 300 °C and 600 °C for 20 h respectively, while the reference experiment with no CH4 in the inlet gas was performed at 350 °C for 20 h and then set to 600 °C for another 20 h [99]. The addition of CH4 was compensated by the reduction of Ar concentration in the inlet gas (Table 4) to leave the inlet content of H2 and CO2 unaffected.
Both catalysts showed higher CO2 conversion and higher CH4 selectivity at 350 °C than at 600 °C. Compared to the reference experiment, the catalysts achieved a lower CO2 conversion, which decreased to about the same value (81–82%) with CH4 in the inlet gas [99]. The CO2 conversion decreased by about 6% for Ni20/Al2O3 and by about 10% for Ni40/Al2O3 at 350 °C (Table 4). For the CH4 selectivity, even stronger decreases (21%) were observed. At 350 °C and no CH4 present, both catalysts achieved 100% CH4 selectivity. Over 20 h, conversion rate and selectivity remained constant in both cases [99].
In a second series of experiments with the same catalysts, the effect of CH4 was tested for about 70 h in microchannel reactors (Table 8) [99].
The resulting CO2 conversions in the microchannel reactor (12.5 bar) were higher than in the experiments with the fixed-bed reactor, which were performed at 2 bar (Table 4). This is consistent with the expectations of thermodynamic equilibrium (cf. Section 3). On average over 70 h on stream with CH4 in the feed gas, Ni40/Al2O3 gave a higher CO2 conversion (95.7%) compared to Ni20/Al2O3 (93.7%) [99]. Over the 70 h on stream, CH4 selectivity remained around 100% and no deactivation (sintering, carbon depositions) was observed.
The results from that third study suggest that a biogas-like concentration of CH4 with CH4/CO2 = 50/50 can lead to lower CO2 conversion compared to pure CO2 methanation. This was observed for both Ni/Al2O3 catalysts, with none standing out as performing significantly better. The study also shows that higher CO2 conversions can be achieved by increasing the pressure in a direct biogas methanation.

6.2. Influence of CH4 on Ni/CeO2

In the third study discussed in Section 6.1, a catalyst supported on CeO2 (Ni20/CeO2) was also investigated [99]. The reaction conditions for the fixed-bed and microchannel reactor experiments were the same as given in Table 7 and Table 8.
In the fixed-bed experiments, Ni20/CeO2 showed higher CO2 conversion and CH4 selectivity at 350 °C compared to 600 °C. With CH4 in the inlet gas, CO2 conversion was lowered by around 10%, and CH4 selectivity strongly decreased by 25% compared to the reference experiment without CH4 addition (Table 4) [99]. These values remained constant over 20 h. It was suspected that the presence of CH4 slows down processes at the surface of the CeO2-supported catalyst [99].
In the microchannel reactor experiments with CH4 in the inlet gas, Ni20/CeO2 showed no significant difference over 70 h compared to the two Al2O3-supported catalysts described in Section 6.1 with no visible deactivation trends. Higher CO2 conversion (94.6%) was reached in the microchannel reactor compared to the fixed-bed reactor experiment (Table 4).

6.3. Influence of CH4 on Ni/CeO2-ZrO2

Among three catalysts for CO2 methanation with 15 wt% Ni on CeO2-ZrO2 support (without promoter/3 wt% Co-promoter/3 wt% Mn promoter), the Co-promoted catalyst was selected, due to the best performance, for experiments on the influence of CH4 [1]. The advantages of Co as promoter are explained in Section 4.3 (Table 2). The experiments were performed under reaction conditions given in Table 9.
The experiments were run at 200–450 °C in 50 K intervals, each held for 30 min. A long-term test for 30 h at 300 °C was also performed with 15 vol% CH4 in the feed gas [1].
In the range of 250–350 °C, a positive effect on CO2 conversion was observed for all three initial CH4 concentrations tested on Ni15-Co3/CeO2-ZrO2 [1]. Above 400 °C, only the experiment with 15 vol% CH4 showed a higher conversion of CO2 compared to pure CO2 methanation. The highest CO2 conversions were achieved at 350 °C, with the addition of 15% CH4 yielding the best results (78% CO2 conversion). Lower CH4 content in the feed gas (10%, 5%) led to lower CO2 conversions (74% and 72%, Table 4). For CO2 methanation without CH4 in the feed gas, the CO2 conversion was about 71% [1]. The higher CO2 conversion with increasing CH4 content can be explained by secondary reactions of CO2 with CH4, such as reforming reactions, leading to higher CO2 consumption. This effect was evident in experiments on the dry reforming of methane for the Co-promoted Ni catalyst at low temperatures [1]. CH4 selectivity was also slightly improved by adding CH4 to the feed gas, and reached its maximum (99%) with 15 vol% CH4 at 300 °C. However, at the relevant methanation temperatures of 300–450 °C, the differences in CH4 selectivity for the different gas compositions were not significant. Over the long-term experiment (38 h) with 15 vol% CH4, the Co-promoted catalyst showed high stability and kept the high selectivity of 99% to CH4 [1].
The tested Ni catalyst on CeO2-ZrO2 support with Co as promoter is suitable for further studies with real CH4-containing gases such as flue gases, or methanation plants with recycling loops [1].

6.4. Further Studies

There is another experimental methanation study with a gas containing CH4 using a wet-impregnated Ru0.5/Al2O3 catalyst [95]. Different parameters were varied to find the best reaction conditions (Table 10). The study was not considered in more detail above, because no reference information was provided on the behavior of the catalyst without CH4 in the inlet gas.
The experiments were evaluated on the basis of CO2 conversion and CH4 selectivity [95]. The catalyst achieved its highest activity at 450 °C, high H2/CO2 ratios, and 90,000 mL g−1 h−1, as expected for pure CO2 methanation without CH4. In a long-term experiment (450 °C, 3 bar, GHSV = 90,000 mL g−1 h−1, and H2/CO2 = 4) the catalyst with 0.5 wt% Ru, as well as another catalyst with 0.05 wt% Ru, were able to maintain their activity over the entire time of the experiment (approximately 65–75 h) [95]. The catalyst with the higher Ru loading achieved almost 80% CO2 conversion, and the catalyst with 0.05 wt% Ru reached 58% CO2 conversion, which decreased to 54% during the experiment. The CH4 selectivity remained constant at 98% for Ru0.5/Al2O3, while the 0.05 wt% Ru catalyst again showed a slight drop from 80% to 78% CH4 selectivity [95]. These experiments show that with the Ru0.5/Al2O3 catalyst, even with CH4 in the feed, conversions and yields predicted by thermodynamic equilibrium could be achieved.
There are two simulation studies in which the influence of CH4 concentration on methanation was investigated.
In the first simulation study, a comprehensive thermodynamic analysis of both CO and CO2 methanation was carried out [96]. The influence of CH4 was investigated only for CO methanation (H2/CO = 3, 200–800 °C, 1 and 30 bar), and CH4/CO ratios of 1, 3, and 5 did not lead to large differences in CO conversion at the same reaction conditions. However, CH4 cracking occurred above 400 °C, leading to carbon deposition [96]. This reaction may also take place during CO2 methanation. The recycled fraction of the CH4-containing product gas should therefore not be too high, suggesting a recycle ratio of product gas of 0.5–3.0 for the methanation process [96].
The second simulation study considered the influence of CH4 from 1–10 bar [100]. The influence of the CH4 concentration is only significant at low pressures, especially at atmospheric pressure. Above 8 bar, only a very small influence of the initial CH4 concentration on the CO2 conversion was observed. Based on the results, the separation of CO2 from CH4 is not necessary for methanation [100].

6.5. Discussion on the Effect of Methane in the Feed

The four studies in Section 6.1,Section 6.2 and Section 6.3 looked at CO2 conversion and CH4 selectivity to assess the influence of CH4 on CO2 methanation. While three studies show that the CH4 selectivity in the experiments with CH4 in the inlet gas did not change significantly in the temperature ranges studied, one study shows a decrease from 100% CH4 selectivity to 75–79% for Ni catalysts on Al2O3 and on CeO2 after the addition of CH4 at the inlet [99]. This sharp decrease is surprising, since under similar conditions (similar catalyst mass, same catalyst composition Ni20/Al2O3, CH4/CO2 = 50/50), CH4 selectivity remained nearly 100% [97].
For better comparability of the data in the literature, a simulation of thermodynamic equilibrium was made. It shows that the maximum CO2 conversion decreases with increasing CH4 concentration (Table 11, see Appendix A for details on the calculation). At higher pressures, the maximum CO2 conversion increases for a given CH4 content in the feed.
From the comparison of the CO2 conversions achieved by the catalysts of the four studies, no clear conclusions can be drawn about the influence of CH4 on the CO2 methanation. One study shows a positive influence of CH4 on the CO2 conversion by the Co-promoted Ni/CeO2-ZrO2 catalyst [1]. The higher the CH4 concentration at the inlet, the higher the CO2 conversion [1]. With a concentration of 15 vol% CH4 in the feed, a maximum increase in CO2 conversion of 7% was achieved compared to CO2 methanation without CH4 [1]. This effect was attributed to the dry reforming of methane, which occurred at low temperatures in an experiment with CO2 and CH4 as input gas [1]. In a second study, no significant effect of CH4 on CO2 conversion was observed for Ni catalysts supported on Al2O3 with and without Ru as a promoter [97]. When the CH4 concentration was increased to 14 and 29 vol%, the CO2 conversion decreased by only 1% compared to pure CO2 methanation [97]. Based on Table 11, a stronger decline in conversion is expected compared to equilibrium. Therefore, mixing CH4 into the feed gas had no significant negative effect. With 29 vol% CH4 in the feed, the catalyst with Ru as promoter reached equilibrium conversion, while methanation without CH4 did not. A third study shows the opposite result. There, the CO2 conversion of Ni20-Mg3/Al2O3 decreased strongly by up to 20% for the experiment with the highest CH4 content (27 vol%) compared to the experiment without CH4 [98]. The equilibrium analysis suggests only a 3–4% drop in conversion rates and shows that the conversions achieved in that study are well below equilibrium. Similar results were obtained with unpromoted Ni catalysts on Al2O3 and on CeO2, respectively [99]. At the tested methane concentration in the gas, which was adjusted to a CH4/CO2 ratio of 50/50, the CO2 conversion decreased by up to 10% compared to pure CO2 methanation.
In one study, Ni20/CeO2 and Ni40/Al2O3 performed slightly better than Ni20/Al2O3 [99]. This suggests that higher metal loading might be beneficial, and that CeO2 could ease CO2 activation compared to Al2O3. However, in the same study, it was suggested that CH4 in the feed slowed down processes at the surface of the CeO2 support [99].
From the comparison of the studies, it cannot be precisely concluded at which reaction conditions or catalyst compositions CH4 is more readily tolerated in the inlet gas. However, the studies used different inert gas concentrations in the experiments, which affects the equilibrium at the end of the reaction, as the partial pressures of the products at equilibrium depend on the inert gas content.
Both a simulation [100] and an experimental study [99] indicate that at high pressures (10 and 12.5 bar, respectively), similar CO2 conversions can be achieved with CH4 in the feed gas compared to pure CO2 methanation. The equilibrium analysis (Table 11) also shows a decreasing effect of methane admixture with increasing reaction pressure. A temperature effect was also observed experimentally. Comparing 350 °C and 600 °C, all tested catalysts were more active at the lower temperature [99].

7. Influence of H2S in the Feed Gas

The origin of trace compounds in biogas can be traced back to the macromolecules of the biogas substrate, as described in Section 2. H2S is a suitable test molecule for investigating the influence of sulfur-containing substances on the catalyst in the laboratory. It is therefore possible to examine how catalysts react to one of the most important catalyst poisons in biogas on a smaller scale. The toxicity of sulfur-containing molecules increases with the number of free electron pairs available for bonding and with lower shielding of the S atom, as well as with increasing electronegativity [63]. These factors make H2S more toxic than oxidized sulfur-containing molecules such as SO2 [33]. It has been observed that catalyst deactivation by H2S proceeds in three prominent phases, which are visible, for example, in CO2 conversion as depicted in Figure 4:
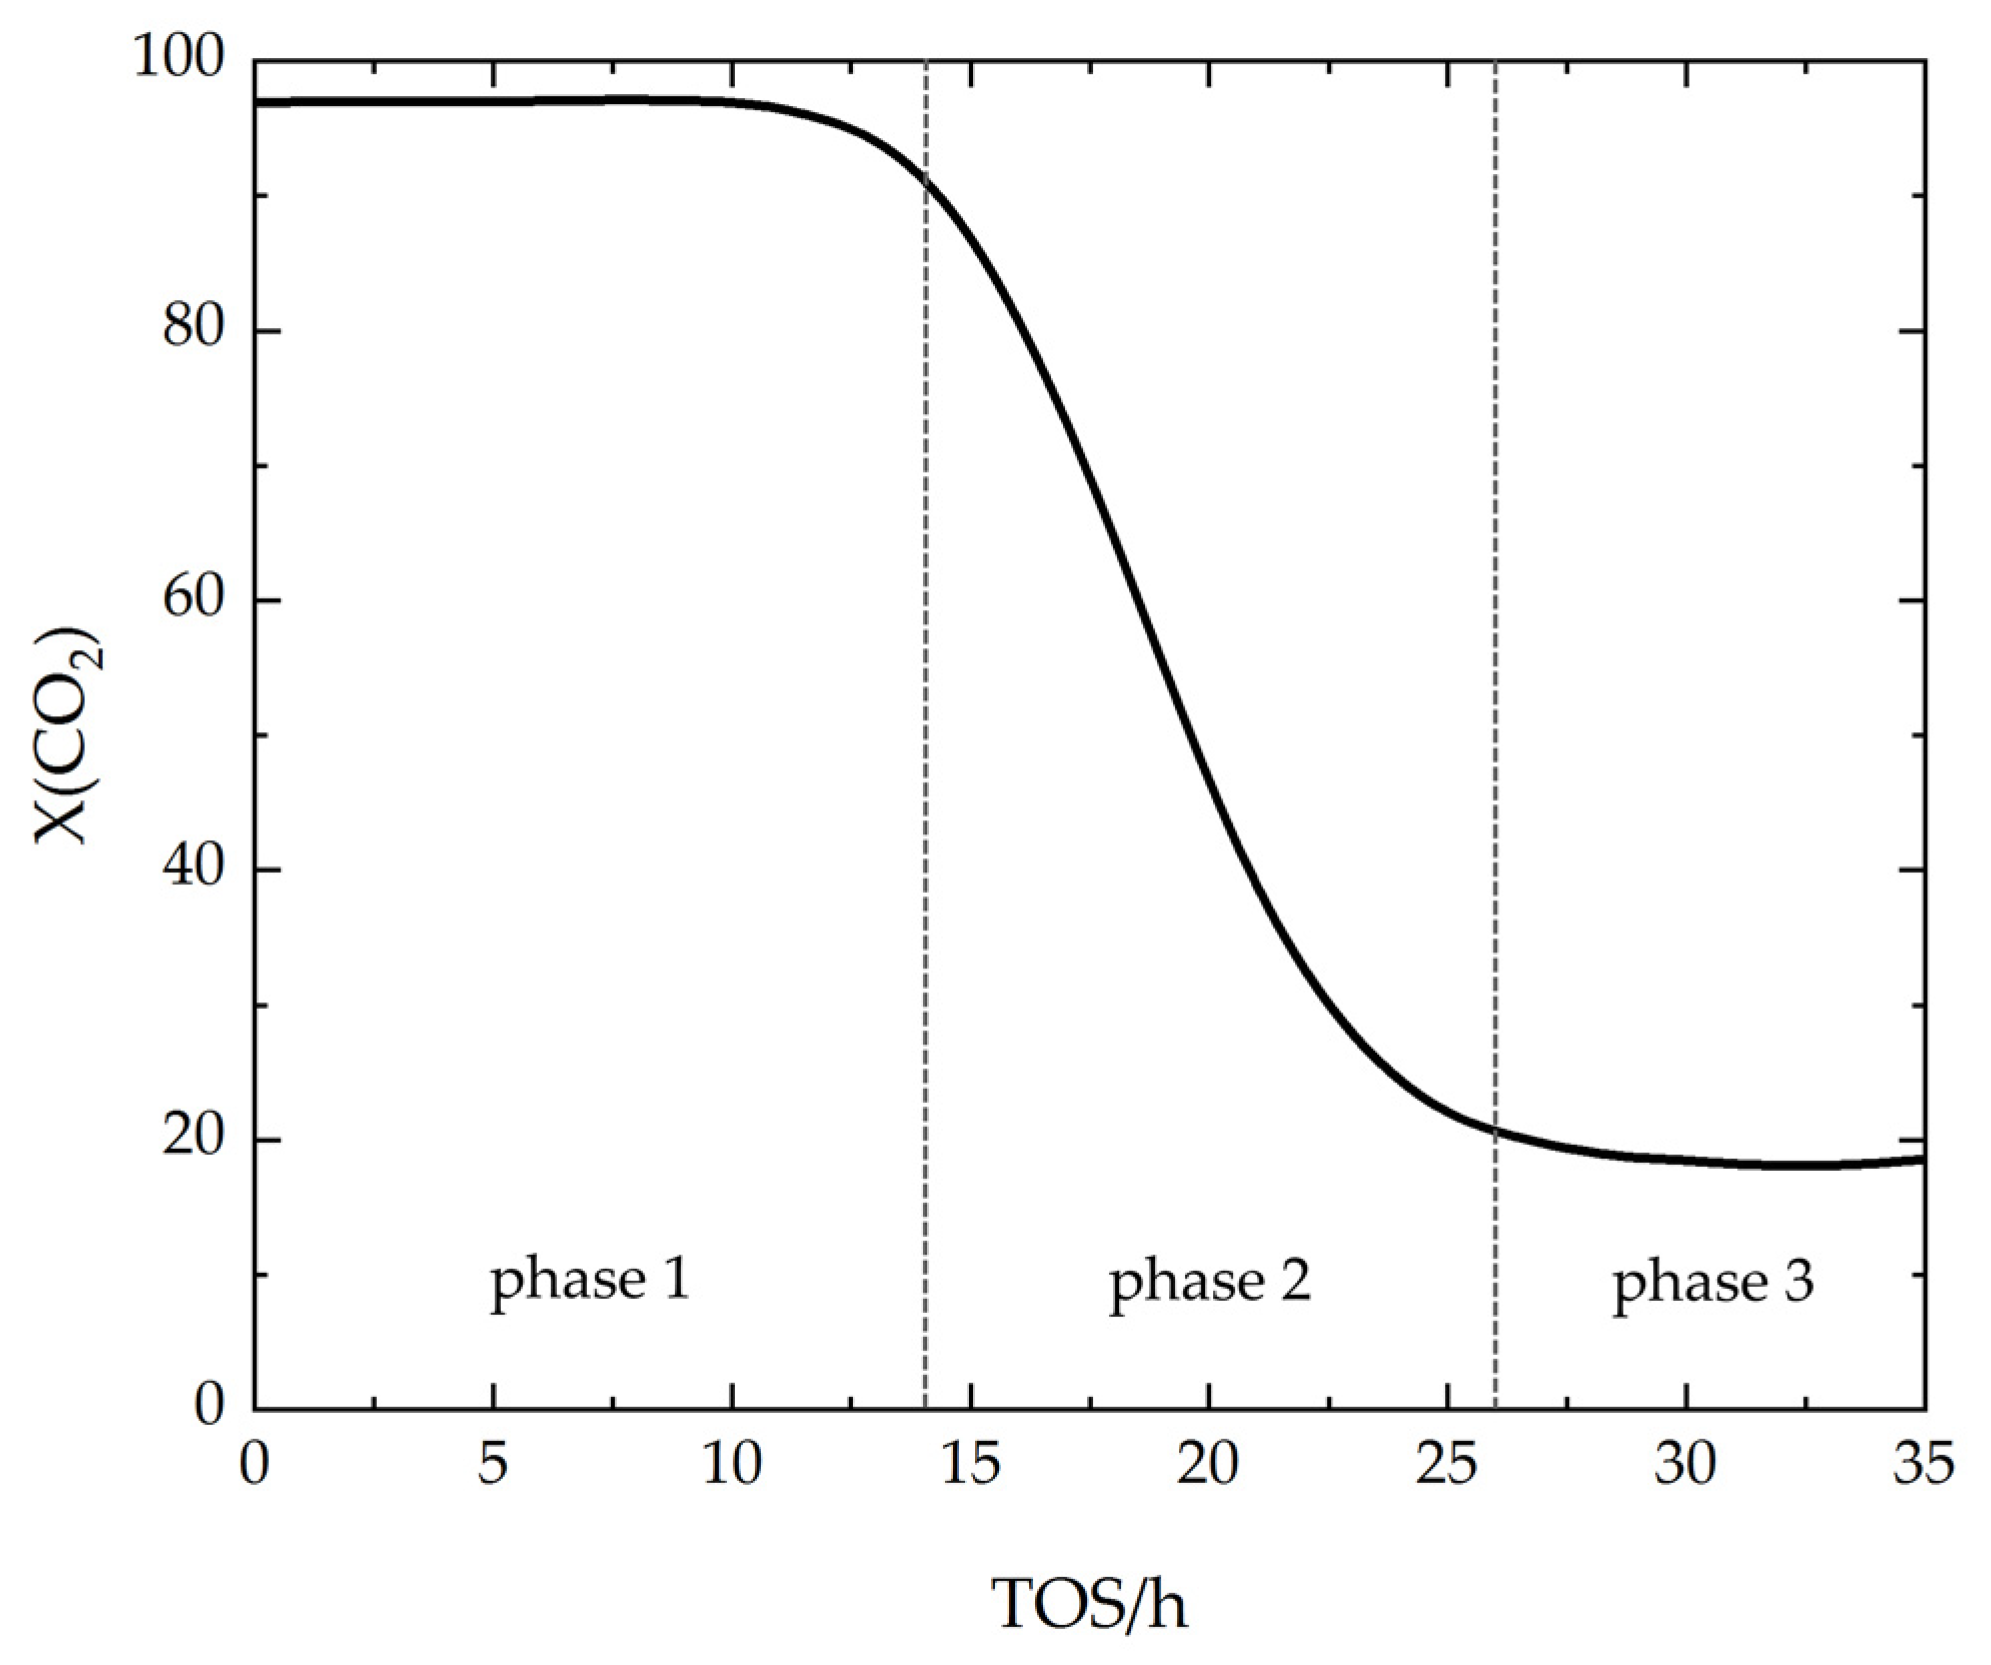
  • Phase 1 usually starts with a constant and high CO2 conversion, which slightly decreases after a certain time on stream with H2S in the feed gas. The decline in CO2 conversion indicates that the catalyst can no longer reach equilibrium conversion due to H2S poisoning [41]. During H2S poisoning, deactivation of the catalyst particles proceeds along the catalyst bed with time on stream. CO2 conversion is an integral parameter across the entire catalyst bed, which only begins to decrease as the poisoning approaches the rear end of the catalyst bed [41,50].
  • In phase 2, the CO2 conversion decreases rapidly within a short time. This phase represents the poisoning of the remaining active catalyst particles at the rear end of the catalyst bed [41].
  • Finally, in phase 3, CO2 conversion reaches a minimum, which remains constant over time on stream. The constant low CO2 conversion indicates saturation of sulfur on the catalyst surface. Due to the formation of strong sulfur-metal bonds, the active sites are blocked and no longer available for CO2 adsorption [87]. Hence, CO2 adsorption is only possible on the catalyst support. Since the active metal is crucial to activate H2 for CH4 formation, CO2 methanation activity is lost and only CO is formed as a product.
The time to complete poisoning can vary depending on the amount of catalyst, the catalyst composition, and reaction conditions. The poisoning rate is, for example, influenced by the bed capacity, the temperature, and the H2S concentration in the gas [63].
Since the effort for H2S removal increases with decreasing target concentration, and complete removal upstream of CO2 methanation units is not possible with current biogas-cleaning technologies, poisoning has to be either accepted in industrial applications, or sulfur-resistant catalysts have to be developed [50]. The latter was investigated in several studies, although most studies focus on the reforming of biogas or natural gas rather than CO2 methanation with biogas [60]. Seven studies were found in recent literature which provide results from CO2 methanation and are evaluated in the following.

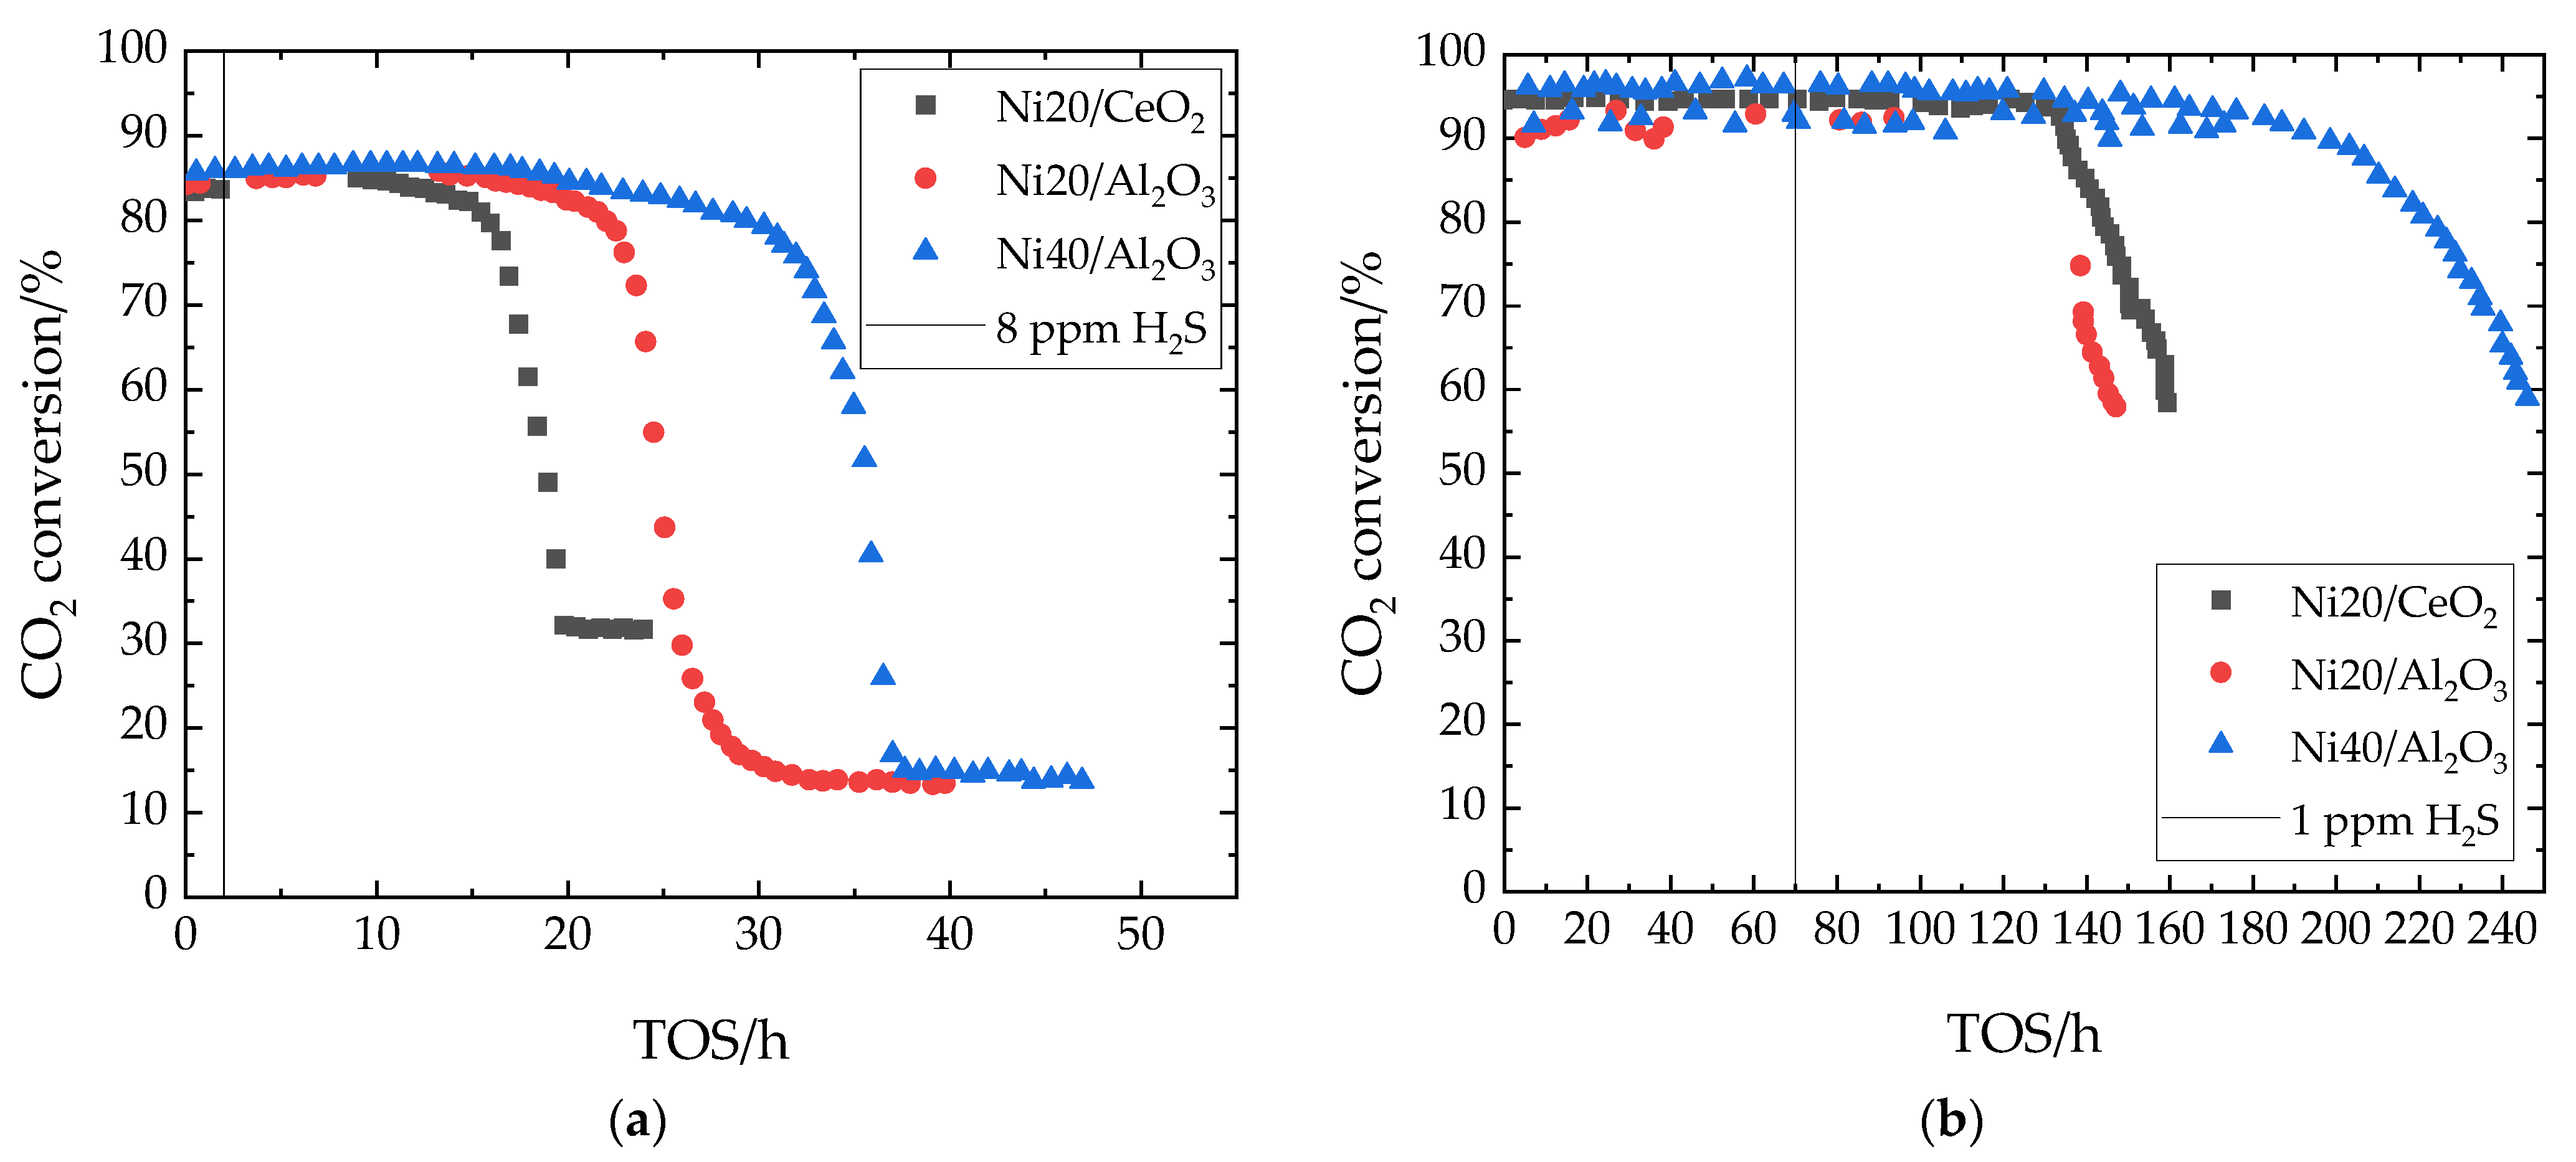
7.1. Sulfur Tolerance of Unpromoted Ni Catalysts

The sulfur tolerance of three unpromoted Ni catalysts on Al2O3 and CeO2, which were already discussed in Section 6.1, was studied in a fixed-bed reactor under the reaction conditions given in Table 12 [99]. H2S was added after 2 h.
The influence of H2S on the catalytic performance was discussed by CO2 conversion (Figure 5a) and CH4 selectivity [99]. At the same Ni loading, the catalyst on Al2O3 showed around a 10 h longer phase 1 (analogous to Figure 4) than the catalyst on CeO2. Although the plateau of phase 3 was reached earliest by Ni/CeO2, the CeO2-supported catalyst kept 30% CO2 conversion, which was around 10% higher than that of the Al2O3-supported catalysts in phase 3. With decreasing CO2 conversion, a simultaneous decrease in CH4 selectivity and an increase in CO selectivity was observed [99]. The change in selectivity was attributed to inhibited hydrogenation of carbon species on the surface, lower stability of intermediate carbonyl groups, and their desorption before methanation [99]. It was also shown that the catalyst with higher Ni loading resists sulfur poisoning over a longer time. The better sulfur tolerance at higher nickel loading can be attributed to the fact that sulfur adsorbs strongly on the active Ni sites, as described in Section 4.4. In STEM-EDX (scanning transmission electron microscope coupled with energy-dispersive X-ray spectroscopy) images, sulfur atoms were not only detected on Ni crystallites [99], but small amounts were also found on the support materials. This effect was more pronounced on CeO2 [99].
The same catalysts were tested in a microchannel reactor under different conditions (Table 13), including the addition of CH4 in the inlet gas. H2S was added after 70 h.
In the microchannel reactor at higher pressure and lower H2S concentration, similar deactivation phenomena (Figure 5b) were seen as described above. The stable runtime of the catalyst was increased by the lower amount of H2S. Among the tested catalysts, Ni40/Al2O3 achieved a significantly longer phase 1 (by ~50 h) than the catalysts with lower Ni loading. STEM-EDX images of the H2S poisoned catalysts showed a high dispersion of S atoms. Sulfur is present on the surface of the support, which was related to H2S partial oxidation on lattice oxygen of CeO2 or the formation of elemental sulfur on hydroxyl groups of Al2O3 [99]. Detailed mapping also indicated that sulfur atoms were located close to Ni in Ni20/CeO2 [99]. The amounts of sulfur on the catalysts increased in the order Ni20/Al2O3 (0.1 wt%) < Ni20/CeO2 (0.2 wt%) < Ni40/Al2O3 (0.7 wt%), and the high amount of sulfur on Ni40/Al2O3 can be attributed to the longer operation time [99]. Due to the lack of strong vibration bands associated with carbon materials in Raman spectra, deactivation due to carbon deposits is unlikely [99]. However, typical vibration bands ascribed to different sulfur species (sulfur, nickel sulfides, thiocarbonates, sulfur-containing organic compounds) were also not visible in Raman and FTIR (Fourier-transform infrared) spectra of the used catalysts [99]. This might indicate that deactivation occurs due to low amounts of sulfur, which is finely distributed on the catalyst surface as described in Section 4.4.

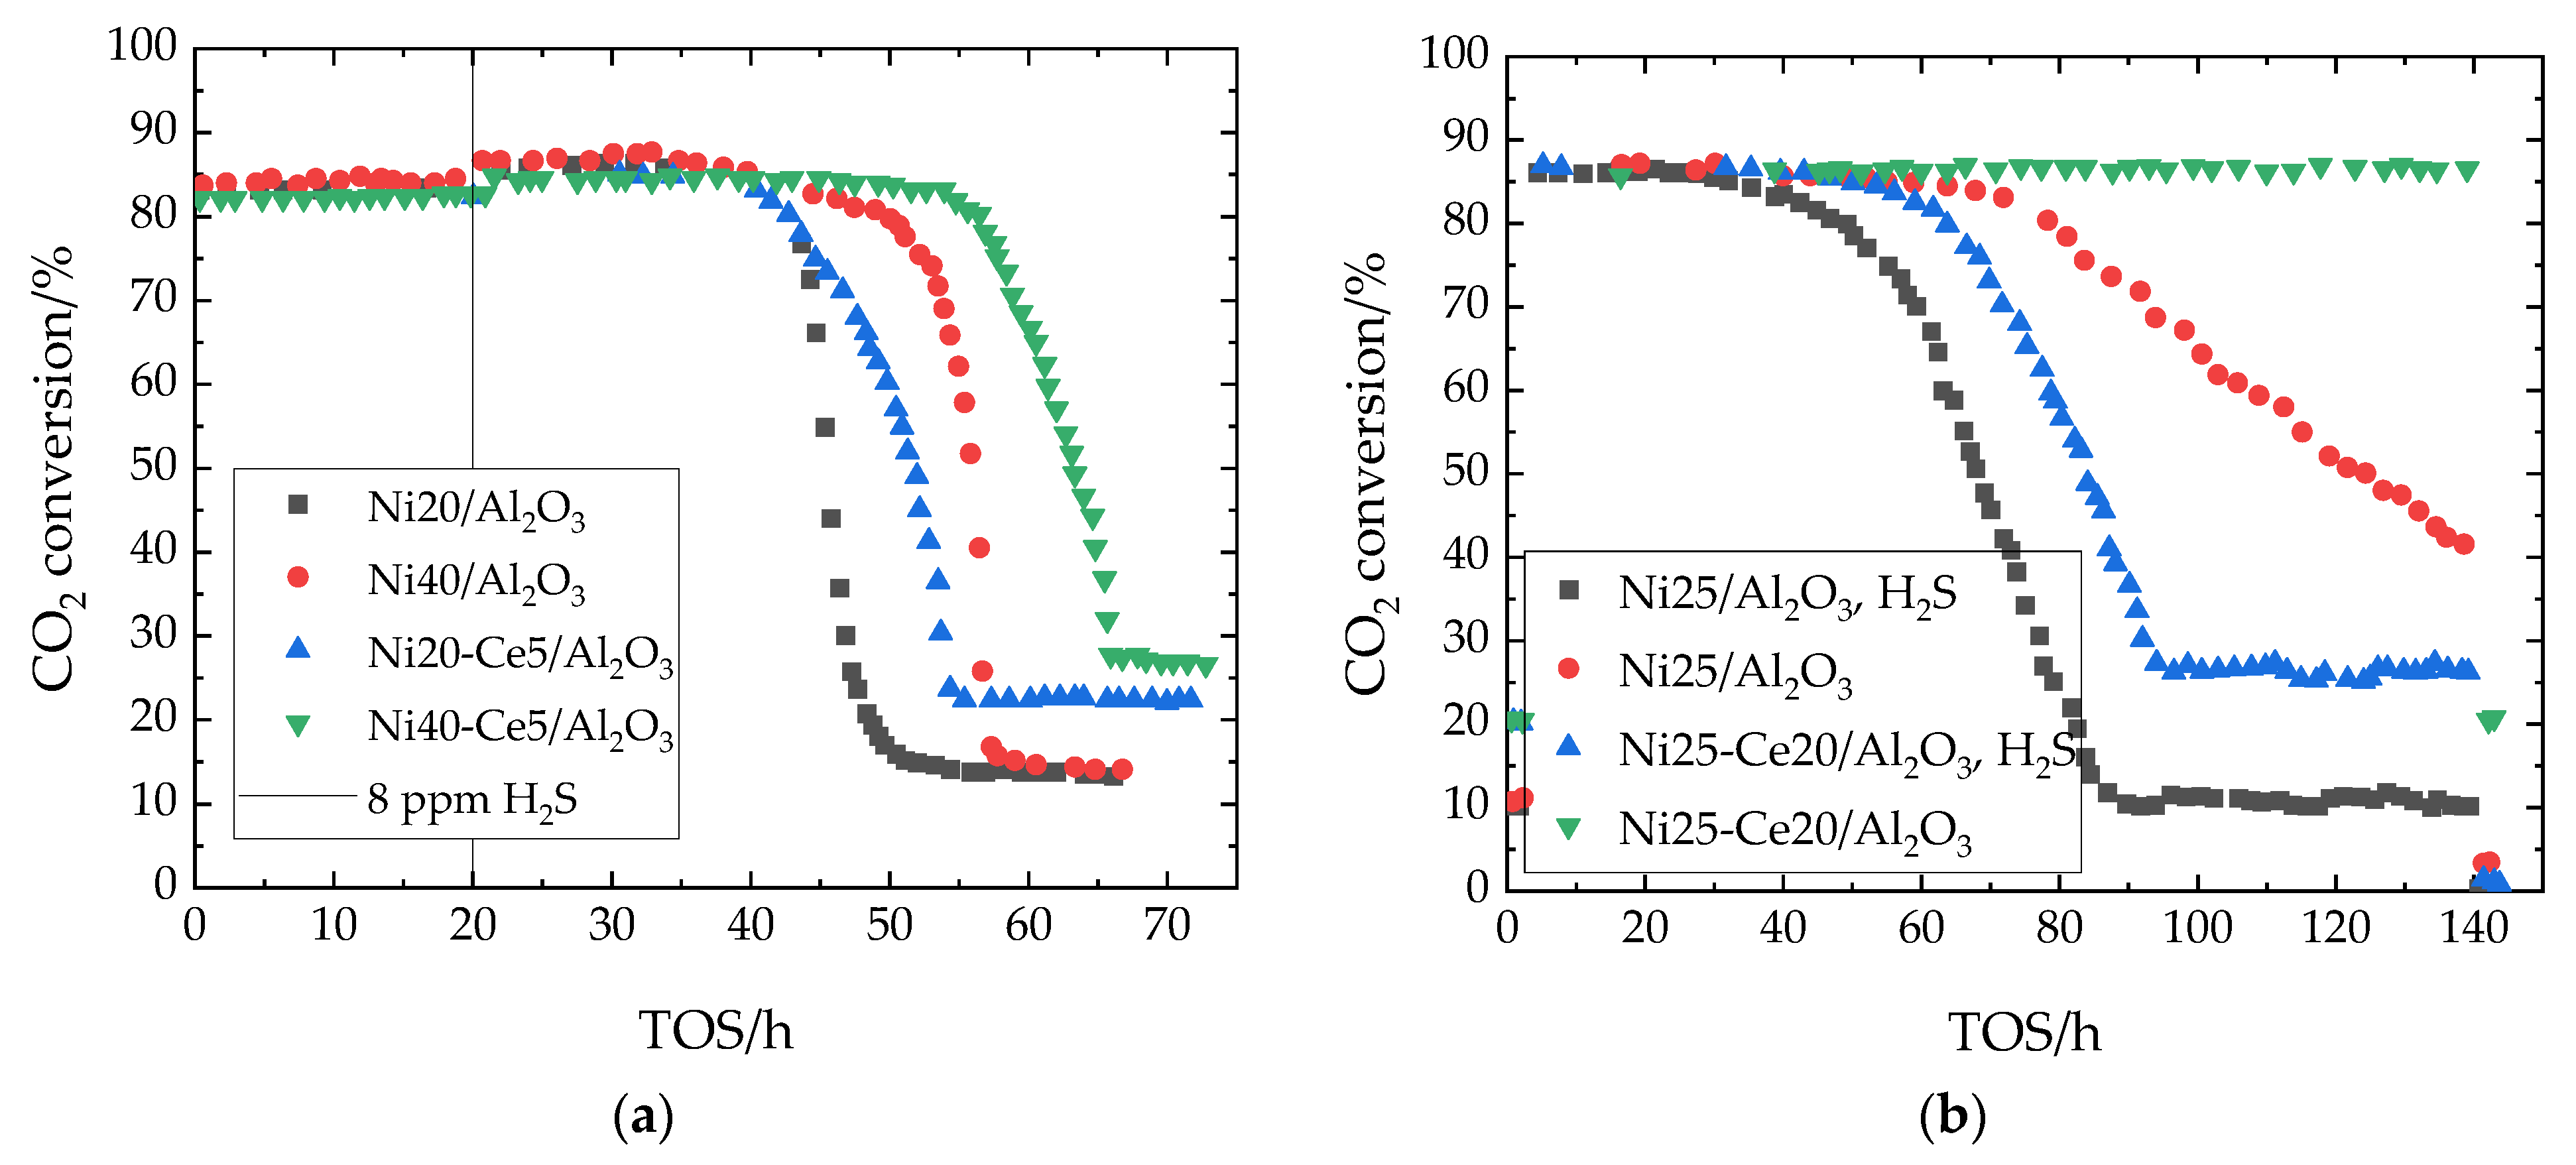
7.2. Sulfur Tolerance of Ni/Al2O3 with Ce Promoter

Two studies on the sulfur tolerance of CO2 methanation catalysts were performed with Ce promoters on Ni/Al2O3 catalysts.
In the first study, long-term (70 h) experiments were carried out with impregnated catalysts under the reaction conditions given in Table 14. H2S was added to the gas after 20 h [60].
Catalyst poisoning was evaluated by the CO2 conversion curves (Figure 6a), CH4 selectivity, and CO selectivity over time on stream, where complete loss of methanation activity occurred between 70–80 h. The graphs for CO2 conversion and CH4 selectivity can be divided very well into the three phases shown in Figure 4. The loss of CH4 selectivity and CO2 conversion occurred simultaneously for the respective catalysts. A change in selectivity to CO, as described in Section 7, became apparent at the same time, with CO selectivity reaching 100% in all cases after deactivation. Comparing Ni20/Al2O3 and Ni40/Al2O3, the Ni loading affected the course of the deactivation curve (Figure 6a), as already observed in Section 7.1. The higher Ni loading prolonged phase 1 by around 10 h, in which the activity of the catalyst remained high for the time being. The rate of deactivation and the final CO2 conversion (around 14%) of the catalysts differ only slightly between Ni20/Al2O3 and Ni40/Al2O3.
No precise conclusions were made about the structure of the S species or their binding to the active sites. However, DRIFT (diffuse reflectance infrared Fourier transformed) spectra from the visible carbonate vibration bands indicated that thiocarbonates were formed from CO2 and H2S above 200 °C [60]. Since Raman spectra obtained of the spent catalysts do not show peaks for pure sulfur, nickel sulfides, or sulfur-containing organic compounds, it was assumed that the sulfur species were highly dispersed on the surface, as already described in Section 7.1. By DRIFT spectra it was shown that, in contrast to freshly prepared catalysts, no vibrational bands for carbonyl groups were found in the H2S-deactivated catalysts [60]. This suggests that the first step of the carbide mechanism of methanation, CO2 transformation to CO, is inhibited on the deactivated catalysts. Thus, H2S adsorption results in deactivation.
The addition of Ce as a promoter changes the deactivation curve (Figure 6a). In both materials with Ce addition, the rate of deactivation in phase 2 was reduced, as indicated by a less severe drop in the curve. In addition, the final CO2 conversions of the catalysts with Ce promoter were higher than for the analogous catalysts without Ce. DRIFT spectra showed that formate intermediates were formed on the Ce-promoted catalyst. This could explain the higher activity of the promoted catalysts [60]. For Ni40-Ce5/Al2O3, phase 1 lasts 5 h longer than for Ni40/Al2O3, making it the most stable one among the catalysts studied. It has been generally found that a larger active surface area available for reaction results in a longer catalyst life [60].
The second study looked at wet impregnated Ni catalysts with CeO2 as promoter on Al2O3 in sulfur poisoning experiments [62]. The reaction was carried out with the conditions described in Table 15 at a temperature profile of 250 °C for 2 h, 500 °C for 138 h, and again 250 °C for 2 h. Reference experiments without H2S addition were performed under the same conditions for the two catalysts.
CO2 conversion was evaluated to determine the catalyst deactivation by H2S. CH4 selectivity was 100% in all cases. Only CH4, H2, CO, and CO2 were detected with a gas micro-chromatograph [62]. In the reference experiment without H2S, the unpromoted catalyst was deactivated during the experiment (Figure 6b), which was attributed to sintering. This indicates that Ce promotion stabilizes the Ni particles, and it was suggested that sintering occurs preferentially at CeO2 [62]. In all experiments, the CO2 conversion was higher at 500 °C compared to 250 °C.
In the presence of 1 ppm H2S, both catalysts deactivated within 80–100 h (Figure 6b) as described in Figure 4. The CeO2-promoted catalyst showed both a higher stability due to a longer phase 1 and a higher final CO2 conversion (~27%) in phase 3 compared to the unpromoted Ni25/Al2O3 catalyst (~11% CO2 conversion) [62].
The better sulfur resistance of the CeO2-promoted catalyst is due to adsorption of sulfur on the promoter. HRSTEM (high-resolution scanning transmission electron microscopy) showed the presence of cerium oxysulfide (Ce2O2S) species on the surface after poisoning [62]. The thermodynamically favored formation of Ce2O2S over NiS has already been described in Section 4.5.2. Accordingly, the poisoning of the active Ni phase is slowed down by the presence of CeO2 [62]. An experiment with higher H2S concentration (5 ppm) in the gas showed a faster deactivation of the Ce-promoted catalyst [62]. This is evident from a shortened phase 1 and a rapid drop in the curve in phase 2. In addition, the final CO2 conversion in phase 3 dropped to 19%, which is slightly lower than with 1 ppm H2S (~27% CO2 conversion) [62]. The catalyst life is drastically shortened when higher H2S concentrations are present in the reaction gas.

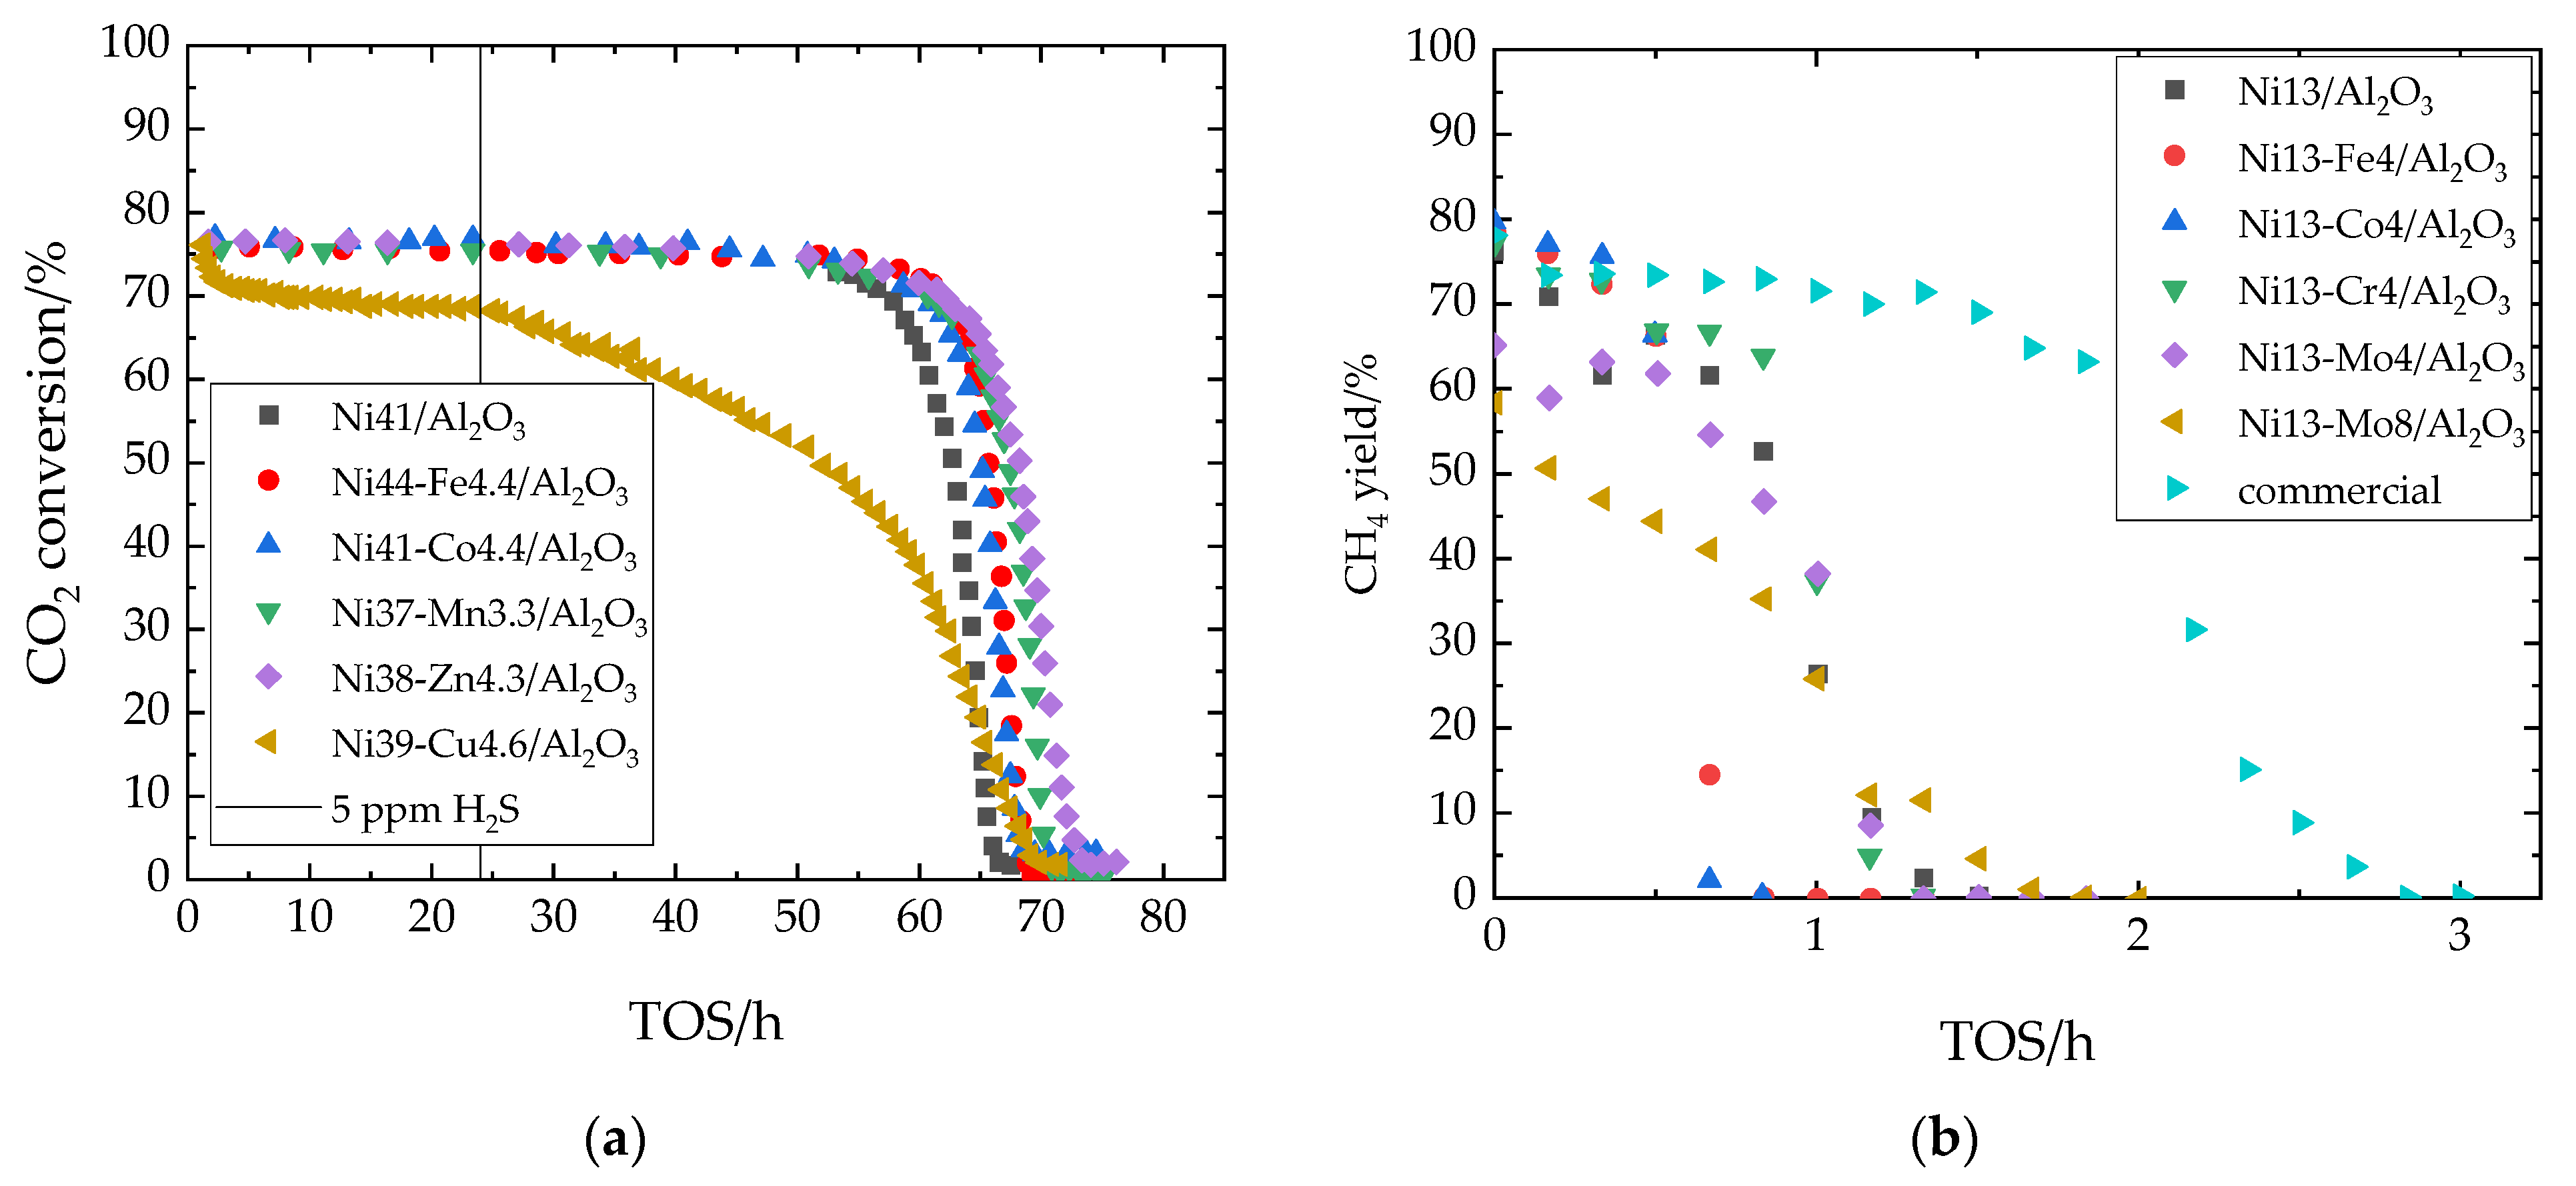
7.3. Sulfur Tolerance of Ni/Al2O3 with Transition Metal Promoters

Two studies were performed on screening different transition metal promoters for Ni/Al2O3.
The first study investigated sulfur poisoning of co-precipitated catalysts with Mn, Fe, Co, Cu, and Zn as promoters [41]. The catalysts and reaction conditions are given in Table 16. H2S was added after an aging period of 24 h.
The activity of the catalysts during the poisoning experiments was evaluated by CO2 conversion [41]. All deactivation curves (Figure 7a) of the investigated catalysts, except for that of the Cu-promoted catalyst, follow the three phases shown in Figure 4. Already during aging without H2S, the CO2 conversion of the Ni-Cu catalyst showed a rapid decrease from 75% to 70% [41]. In Section 4.3 it was stated that Cu might not be a suitable promoter for a Ni-based CO2 methanation catalyst, and it was shown that a Cu phase settles on the surface at the expense of active Ni centers [41]. The other catalysts showed no loss of activity prior to H2S addition. Apart from Cu-promoted, all promoted catalysts revealed better sulfur resistance than the unpromoted catalyst, as shown by a longer phase 1 (Figure 7a). Results from CHNS analysis showed that sulfur uptake was increased by 10–20% for all promoted catalysts (to 658–722 µmol gcat−1) compared to the unpromoted Ni catalyst (608 µmol gcat−1). This proves that sulfur can accumulate not only on the Ni but also on the promoters, which can protect the active Ni centers. Among the deactivation curves of the Mn-, Fe-, Co- and Zn-promoted catalysts, the respective CO2 conversions differ mainly in the steepness of the decline of phase 2 and the final activity in phase 3, which drops down to zero CO2 conversion for NiFe and remains highest for NiCo (~3%) [41].
The second study investigated sulfur poisoning on incipient wetness impregnated catalysts with Co, Cr, Fe, and Mo as promoters [64]. After activity tests at different temperatures (300–500 °C), methanation experiments were continued with the addition of H2S under reaction conditions given in Table 17 until deactivation.
The evaluation of the poisoning experiments was based on the CH4 yield [64]. After deactivation, the CH4 yield decreased to zero in all cases (Figure 7b). Due to the rapid and complete deactivation of the catalysts within 50 to 170 min, most deactivation curves in Figure 7b cannot be divided into the three phases shown in Figure 4. The deactivation was attributed to the formation of both NiS and C deposits [64].
The first catalysts to show complete deactivation between 40 and 50 min were those promoted with Co and with Fe. Unlike the other catalysts investigated, these two catalysts kept high initial CH4 yield above 73% for a longer time (20 min compared to ~10 min) but showed a very steep drop towards zero CH4 yield. The catalyst with Cr promoter showed a similar deactivation curve, but with increased stability keeping a CH4 yield above 64% for 50 min. After 80 min, the sample with Cr lost its activity, just as the 4 wt% Mo-promoted catalyst did. STEM-EDX images of spent catalysts showed that significant interactions between promoter and Ni were only present in the catalysts with Cr and Mo [64]. These catalysts were referred to as bimetallic catalysts, while in the other two cases (Fe and Co) the promoter was distributed in the pore system alongside Ni [64].
Only the catalyst promoted with 8 wt% Mo can stabilize high methane yield for a longer time (100 min) than the unpromoted Ni catalyst (90 min until complete deactivation, Figure 7b). The higher S-resistance of the Mo-promoted catalyst was attributed to the inhibition of S2− formation [64]. However, like the 4 wt% Mo-promoted catalyst, the initial CH4 yield was 10–20% lower compared to the other catalysts. The advantages of Mo addition for improved sulfur resistance at the cost of a lower methanation activity have already been discussed in Section 3 and Section 4. A commercial catalyst (no further details given) was also tested and showed a CH4 yield drop to zero after 170 min.
After the poisoning experiments, regeneration experiments were carried out with 3% O2 in N2 for 4 h at 500 °C [64]. The catalyst activity could not be restored for any catalyst except for the Co-promoted with a much lower CH4 yield of 13%.

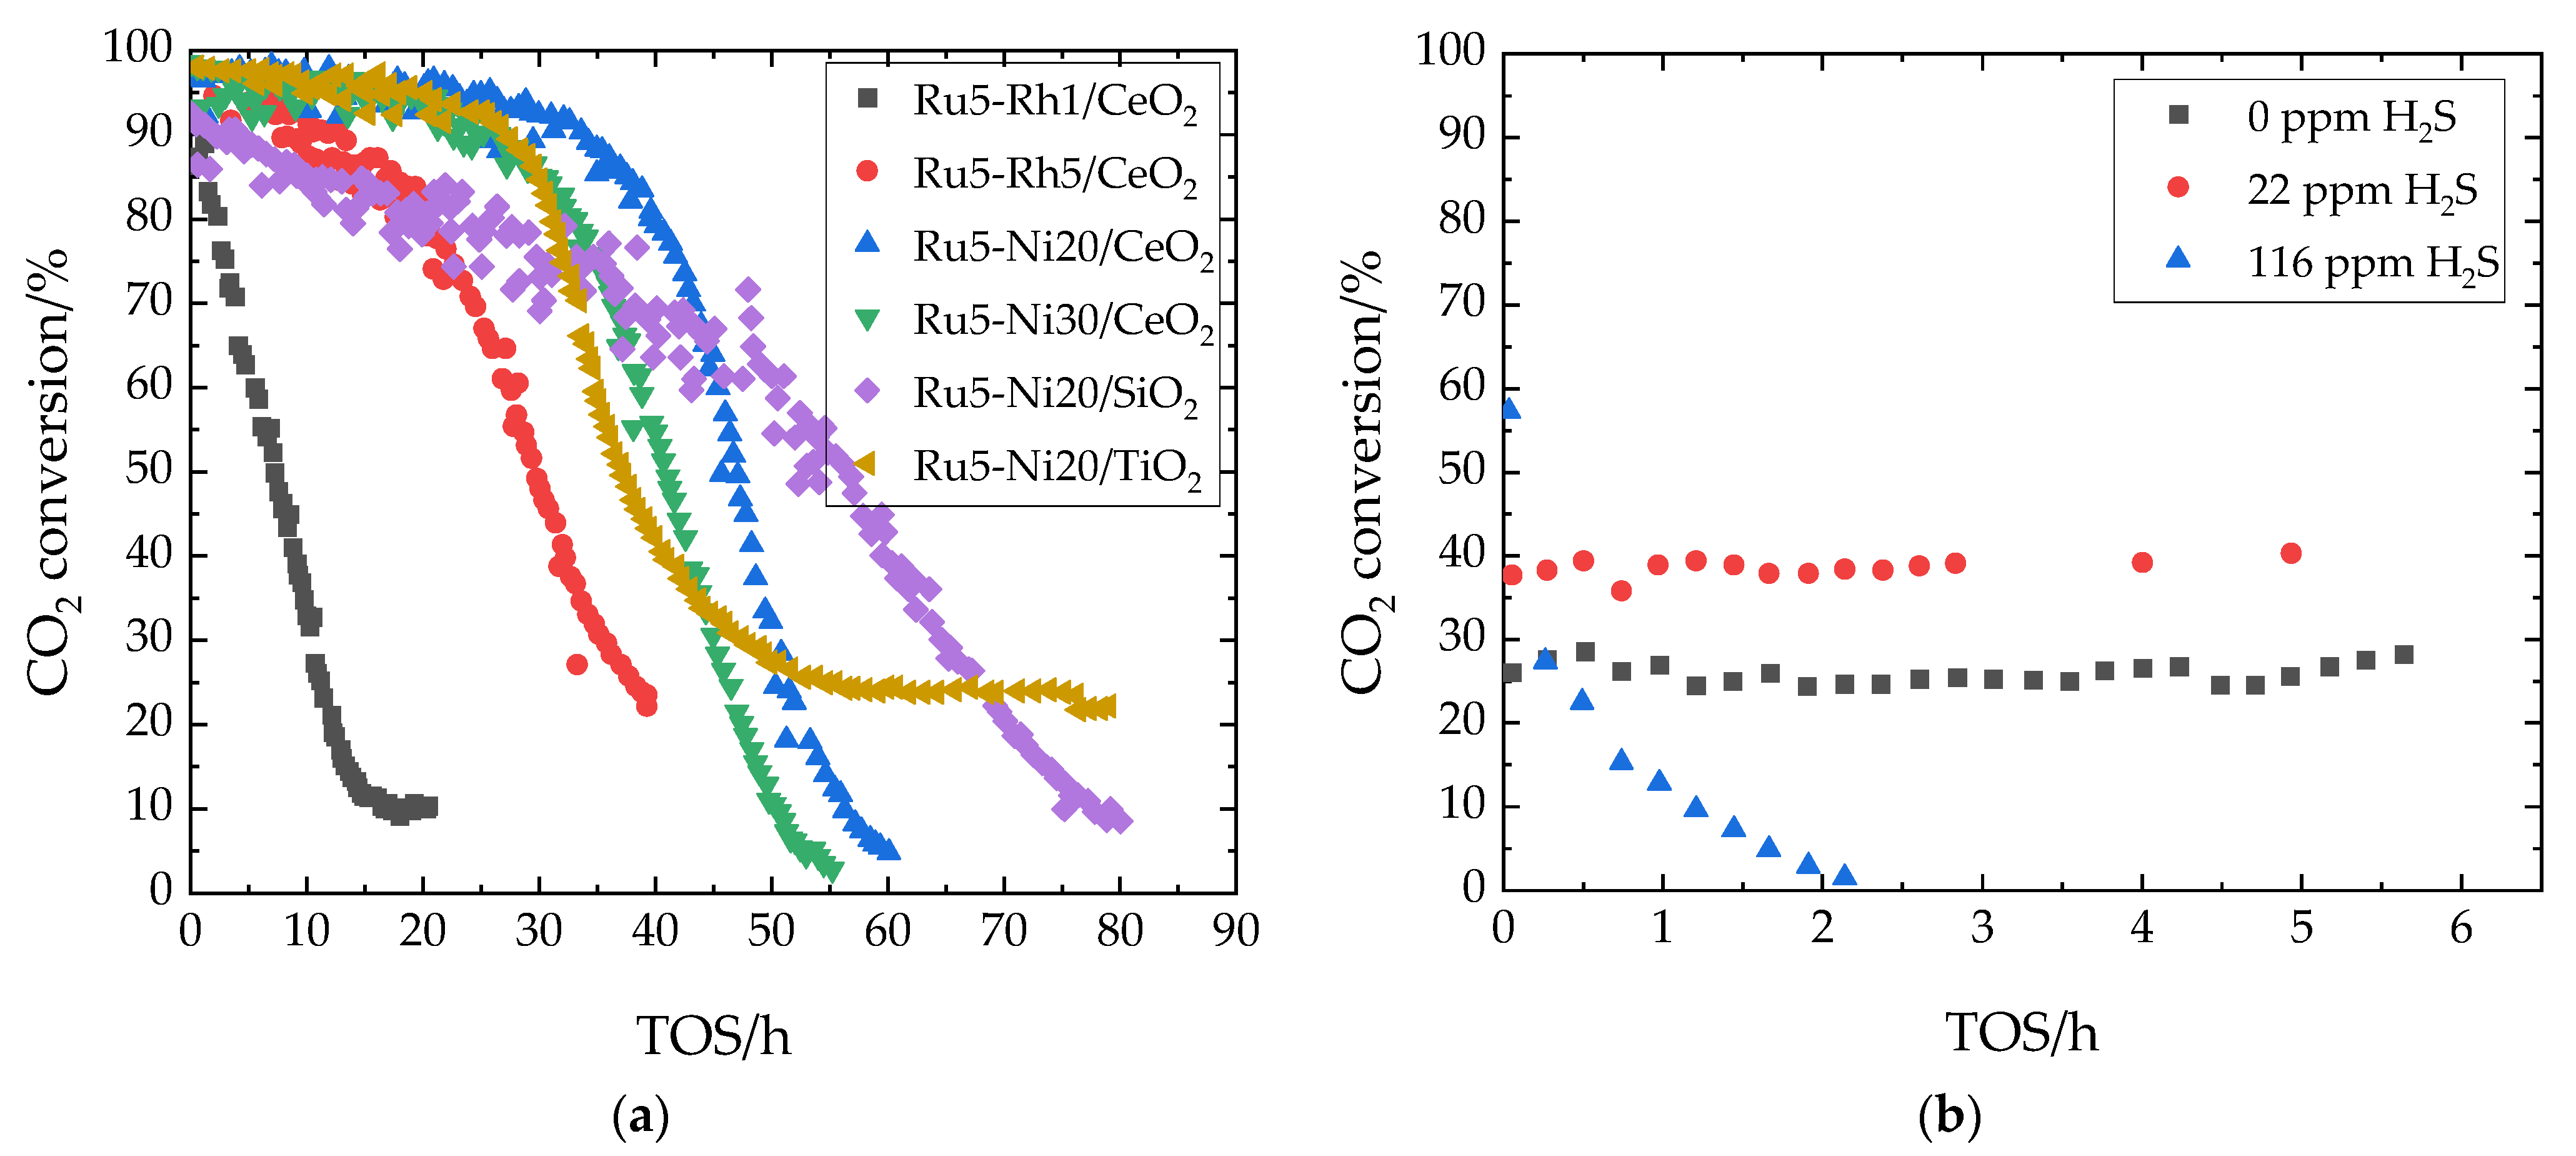
7.4. Sulfur Tolerance of Unpromoted and Promoted Noble Metals on Different Supports

Two studies investigated the sulfur tolerance of noble metal-based CO2 methanation catalysts.
The first study investigated the sulfur poisoning of co-impregnated Ru-based catalysts with Rh or Ni as promoters supported on CeO2, SiO2, or TiO2 [69]. The reaction conditions for the experiments are listed in Table 18; H2S was added immediately or after 118 min in the case of Ru5/CeO2.
The stability of the catalysts after H2S addition was evaluated based on CO2 conversion and CH4 selectivity [69]. The deactivation curves generally follow the three phases described in Figure 4, and are accompanied by decreasing CH4 selectivity and an increase in CO selectivity.
The unpromoted Ru5/CeO2 catalyst deactivated within 6 h after H2S was introduced to the gas stream [69]. When Rh was added as a promoter, only the higher concentration (5 wt% Rh) contributed to improved sulfur resistance with a short (5 h) stable phase 1 (Figure 8a). By adding Ni (20 and 30 wt%) to the Ru catalyst on CeO2, a longer stability of the CO2 conversion and thus higher resistance to H2S was achieved (Figure 8a). The EDX data of the deactivated catalysts showed a much lower concentration of sulfur (0.20 and 0.42 wt%) than of carbon (1.44 and 2.91 wt%) on the catalyst surfaces, with double the amount of sulfur and carbon found on the catalyst with 30 wt% Ni addition compared to Ru5-Ni20/CeO2 [69]. The high affinity of sulfur to Ni is discussed in Section 2 and small amounts are shown to be sufficient for catalyst deactivation, as also described in the literature (Section 4.5.1). The Ru5-Ni20/CeO2 has a stable phase 1 of around 20 h, and after 60 h the deactivation is nearly completed. Compared to 20 wt% Ni addition, the Ru catalyst with 30 wt% Ni is more sensitive to H2S, and showed complete deactivation earlier (55 h, Figure 8a). It was assumed that due to the higher Ni loading, the more active Ru is less accessible to the gaseous reactants [69].
Comparing Ru5-Ni20 on three supports (CeO2, SiO2, TiO2), the catalysts with CeO2 and TiO2 support both showed a typical stable phase 1 at the beginning of the poisoning tests. The longest stable phase 1 with 20 h was shown by the above described Ru5-Ni20/CeO2. The SiO2-supported catalyst showed a deviating behavior in the deactivation curve (Figure 8a) without clear differentiation into the phases shown in Figure 4. From the beginning, there was observed a continuous decline of the CO2 conversion, but the full deactivation of the catalyst took the longest time (80 h) of all tested catalysts [69]. With the SiO2 support, CH4 was still formed with high selectivity (~78%) even after deactivation, while the CH4 selectivity dropped to zero for the other catalysts [69]. TEM images with Ni mapping showed that Ni was well distributed on the support, which led to smaller particle sizes compared to the catalysts with different support materials. However, the specific surface area of Ru5-Ni20/SiO2 (221 m2 g−1) was much higher than the surface area of the other catalysts (35–59 m2 g−1) [69].
The Ru5-Ni20/TiO2 catalyst was used to test a regeneration procedure with 0.12% O2 in N2 (600 °C, 4 h) after poisoning [69]. The catalyst did not regain its initial activity, and deactivation started immediately after restarting the reaction.
In the second study, different unpromoted noble metals (Rh, Pd, and Ru) impregnated on TiO2 were tested and the sulfur tolerance of Rh was further investigated on different supports [101]. The reaction conditions of the experiments are given in Table 19. Since no pressure during the reaction was specified, it is assumed that the experiments were performed at atmospheric pressure.
The catalyst activity during H2S addition was evaluated based on CO2 conversion and CH4 formation rate [101].
For Rh/TiO2, a promoting effect of 22 ppm H2S was found when the freshly reduced catalyst was used (Figure 8b). However, with 116 ppm H2S the catalyst deactivated rapidly within 130 min. For Ru and Pd on TiO2, and for Rh/CeO2, the addition of 22 ppm H2S also resulted in an increased product formation rate compared to a reference experiment without H2S addition. However, the main product of the reaction on Pd/TiO2 was CO [101]. TPD (temperature-programmed desorption) measurements showed that sulfur was built into oxygen vacancies of the TiO2 support and created new sites with catalytic activity at the metal-support interface. These sites prevented re-oxidation of the oxygen vacancies, and thus led to the observed higher stability of CO2 methanation [101].
The promoting effect of 22 ppm H2S was not observed for Rh/SiO2 and Rh/Al2O3. Some of the catalysts (Rh/ZrO2, Rh/MgO) initially showed CO2 conversions below 1% in the absence of H2S and no conversion when 22 ppm H2S was added.

7.5. Discussion on the Effect of H2S in the Feed

Characterization of the catalysts by Raman spectroscopy showed that sulfur species are strongly dispersed on the catalyst surface [60,99]. This means that even a small amount of sulfur can lead to deactivation, and explains the rapidly decreasing activity curves. Despite the use of different catalysts and reaction conditions, the studies considering the selectivity of CH4 and CO have in common that deactivation is accompanied by a selectivity shift from CH4 to CO as the main product [60,69,99]. This was seen for both Ni and noble metal catalysts.
It was also shown that the support material plays an important role. In the case of CeO2, carbonates were formed more easily compared to Al2O3, which facilitates the subsequent hydrogenation to formate and leads to better CO2 conversions [99]. In the case of a Ru-Ni catalyst with SiO2 as support, CH4 could be formed even after severe catalyst deactivation with 80% selectivity due to the improved interaction with the catalytically active metal particles [69]. This performance was not seen with the other catalysts and requires a highly dispersed active phase.
Apart from the choice of a suitable support material, monometallic catalysts can be made more sulfur-resistant by increasing the concentration of the active metal (Figure 9) [60]. Comparing the amount of added H2S up to complete deactivation (start of phase 3) for the unpromoted Ni catalysts, the tolerable amount of sulfur increases under-proportionally with increasing Ni loading. At twice the Ni loading (20 compared to 40 wt%), the sulfur content that passed over the catalyst increases only from 7.9 to 9.2 mgH2S/gcat (Figure 9). This might be explained by geometrical features such as surface/volume ratio of the Ni particles, which depends on the dispersion.
Different transition metals (Mn, Fe, Co, Zn) were shown to adsorb H2S [41]. The addition of promoters such as Ce [60,62] or Mo [64] seems especially promising (Figure 9) to protect the catalytically active sites. For Ce as a promoter, it was shown at the molecular level that Ce2O2S species form preferentially over Ni sulfides [62]. While Ce additionally led to an improved CO2 methanation activity due to its structural properties, the activity of the tested Mo-promoted catalysts was lower. In the case of the catalysts studied in Section 7.3, this could also be due to the choice of support material. In the literature (cf. Section 4.5.3) it was described that Mo does not form a stable structure on Al2O3. The interaction of the promoter with the active metal also seems to play a major role. Among the promoters Co, Cr, Fe, and Mo, significant interactions with Ni were only seen with Cr and Mo. These were the catalysts that showed better sulfur resistances in the experiments [64].
In noble metal-based bimetallic catalysts, Ni can act as a sulfur trap. However, appropriate loading should be selected, as it has been shown that too high Ni concentrations can accelerate sulfur deposition and increase carbon formation [69]. The advantages of Ni as a sulfur trap are small in such cases, and the disadvantages in terms of C deposition outweigh the advantages.
In one study, a promoting effect of H2S in the inlet gas on the CH4 formation rate was described [101]. Since this effect was only observed at the lowest H2S concentration within that study (22 ppm), and only on a fresh catalyst surface, the statement cannot be transferred to the real application. However, the study provides evidence that reducible support materials, e.g., with oxygen vacancies in the crystal lattice, are better suited for the application with H2S in the feed gas than non-reducible supports such as MgO and Al2O3.
In the two studies in which reactivation with dilute O2 was investigated after the poisoning experiments [64,69], the activity of the catalysts could not be restored.

8. Conclusions and Outlook

The presence of both CH4 and H2S affects the activity of methanation catalysts. No general conclusion can be drawn for CH4 in the feed, whether it is beneficial for methanation or not. This seems to depend on the catalyst composition and reaction conditions. However, a high methane content in the feed can have a measurable effect on the synthesis process and thus on CO2 conversion. Depending on the CH4/CO2 ratio, a product gas with a higher methane content can thus be obtained compared to reference experiments without CH4. Since the results of the studies are inconclusive, this effect needs to be scrutinized.
It should also be investigated in detail which reactions take place, e.g., whether methane reforming is a side reaction in addition to methanation. Methane reforming would lead to an increased CO2 conversion but not to a higher methane yield. This research could uncover suitable reaction conditions (e.g., T and p), at which the methanation reaction occurs predominantly. The reviewed studies on CH4 influence were conducted at 1 bar or only slightly higher pressure. Investigating higher pressures would be a possible starting point for further studies on the influence of CH4 on CO2 methanation. Future experiments on CH4 influence should also run over a longer time to clarify whether CH4 favors deactivation processes by C-deposition or whether sintering is delayed due to a better temperature distribution.
H2S in the feed resulted in deactivation for all tested catalysts within several hours. The addition of promoters to Ni or the addition of Ni to a noble metal-based catalyst has been shown to trap sulfur molecules, protecting the active phase. In addition, there is evidence that reducible supports such as CeO2 or TiO2, which have oxygen vacancies in the crystal lattice, lead to better sulfur resistance of the catalyst than non-reducible supports. During deactivation, selectivity shifted from CH4 to CO for both Ni and noble metal-based catalysts. This seems to be characteristic for H2S poisoning on methanation catalysts. For the unpromoted Ni catalysts with increasing Ni loading, the tolerable amount of sulfur increases under-proportionally. It could be a direction for further research to investigate higher volumes of catalysts with low Ni loading instead of lower volumes of highly loaded Ni catalysts.
Future experiments should also consider the influence of other catalyst poisons present in the biogas, such as NH3 or siloxanes. The investigation of several biogas components together in the feed would also be an interesting research approach. This could help understanding the interaction of possibly simultaneously occurring deactivation processes such as poisoning and coking before scaling up to industrial applications.

Author Contributions

Conceptualization, S.N. and M.K.; investigation, S.N., U.A., S.D. and M.K.; resources, S.N. and U.A.; writing—original draft preparation, S.N. and U.A.; writing—review and editing, S.N, U.A., S.D. and M.K.; visualization, S.N.; supervision, S.N.; project administration, M.K.. All authors have read and agreed to the published version of the manuscript.

Funding

The authors gratefully acknowledge the German Federal Ministry for Digital and Transport for financial support for the project “Pilot-SBG-Bioresources and hydrogen as raw materials for methane as a fuel—conceptual design and realization of a pilot plant” and the German Federal Ministry of Food and Agriculture for the institutional funding of DBFZ.

Data Availability Statement

Not applicable.

Acknowledgments

The authors gratefully acknowledge visualization support from Rico Ehrentraut (DBFZ) and support from Jörg Kretzschmar (DBFZ) on biogas-related questions.

Conflicts of Interest

The authors declare no conflict of interest. The funders had no role in the design of the study; in the collection, analyses, or interpretation of data; in the writing of the manuscript, or in the decision to publish the results.

Appendix A

The thermodynamic equilibrium was simulated using a Gibbs reactor in Aspen Plus. Reaction conditions were 350 °C, 140 mL/min, H2/CO2 = 4, CH4/CO2 = 100/0, 50/50 and 67/33 respectively, according to the data in Table 4 from [97]. The CO2 conversion ( X ( CO 2 ) ) was calculated using the mole fractions of CO2 at the inlet ( x CO 2 , i n ) and CO2 at the outlet ( x CO 2 , o u t ) as follows:
X ( CO 2 ) = x CO 2 , i n x CO 2 , o u t x CO 2 ,   i n

Appendix B

The total mass of H2S ( m H 2 S ) added until complete deactivation ( t d e a c t ) per catalyst mass ( m c a t ) was calculated using the mole flow of H2S ( m ˙ H 2 S ) as follows:
m H 2 S m c a t = m ˙ H 2 S t d e a c t m c a t
The time of complete deactivation was defined as the first data point of the plateau of phase 3 of the deactivation curves (Figure 5, Figure 6, Figure 7 and Figure 8). For curves that do not follow the three deactivation phases, the last data point was used. If aging occurred prior to the poisoning experiments, this time was not considered, but only the time of H2S addition.
The mass flow of H2S was calculated by specifying temperature, pressure, total volume flow, and gas composition in Aspen Plus via a heater model. These reaction conditions and the catalyst mass were given in the corresponding publications.

References

  1. Pastor-Pérez, L.; Patel, V.; Le Saché, E.; Reina, T.R. CO2 methanation in the presence of methane: Catalysts design and effect of methane concentration in the reaction mixture. J. Energy Inst. 2020, 93, 415–424. [Google Scholar] [CrossRef]
  2. Umweltbundesamt. Climate Protection Plan 2050 of the Federal Government (German, Klimaschutzplan 2050 der Bundesregierung: Diskussionsbeitrag des Umweltbundesamtes); Umweltbundesamt: Dessau-Roßlau, Germany, 2016.
  3. Billig, E.; Decker, M.; Benzinger, W.; Ketelsen, F.; Pfeifer, P.; Peters, R.; Stolten, D.; Thrän, D. Non-fossil CO2 recycling—The technical potential for the present and future utilization for fuels in Germany. J. CO2 Util. 2019, 30, 130–141. [Google Scholar] [CrossRef]
  4. Adnan, A.I.; Ong, M.Y.; Nomanbhay, S.; Chew, K.W.; Show, O.L. Technologies for Biogas Upgrading to Biomethane: A Review. Bioengineering 2019, 6, 92. [Google Scholar] [CrossRef] [PubMed] [Green Version]
  5. Huang, C.H.; Tan, C.S. A Review: CO2 Utilization. Aerosol Air Qual. Res. 2014, 14, 480–499. [Google Scholar] [CrossRef] [Green Version]
  6. Shahbaz, M.; AlNouss, A.; Ghiat, I.; Mckay, G.; Mackey, H.; Elkhalifa, S.; Al-Ansari, T. A comprehensive review of biomass based thermochemical conversion technologies integrated with CO2 capture and utilisation within BECCS networks. Resour. Conserv. Recycl. 2021, 173, 105734. [Google Scholar] [CrossRef]
  7. Gabrielli, P.; Gazzani, M.; Mazzotti, M. The Role of Carbon Capture and Utilization, Carbon Capture and Storage, and Biomass to Enable a Net-Zero-CO2 Emissions Chemical Industry. Ind. Eng. Chem. Res. 2020, 59, 7033–7045. [Google Scholar] [CrossRef] [Green Version]
  8. Lee, W.J.; Li, C.E.; Prajitno, H.; Yoo, J.; Patel, J.; Yang, Y.X.; Lim, S. Recent trend in thermal catalytic low temperature CO2 methanation: A critical review. Catal. Today 2021, 368, 2–19. [Google Scholar] [CrossRef]
  9. Ghaib, K.; Ben-Fares, F.Z. Power-to-Methane: A state-of-the-art review. Renew. Sust. Energ. Rev. 2018, 81, 433–446. [Google Scholar] [CrossRef]
  10. Dannesboe, C.; Hansen, J.B.; Johannsen, I. Catalytic methanation of CO2 in biogas: Experimental results from a reactor at full scale. React. Chem. Eng. 2020, 5, 183–189. [Google Scholar] [CrossRef] [Green Version]
  11. Ryckebosch, E.; Drouillon, M.; Vervaeren, H. Techniques for transformation of biogas to biomethane. Biomass Bioenergy 2011, 35, 1633–1645. [Google Scholar] [CrossRef]
  12. Villadsen, S.N.B.; Fosbøl, P.L.; Angelidaki, I.; Woodley, J.M.; Nielsen, L.P.; Møller, P. The Potential of Biogas; the Solution to Energy Storage. ChemSusChem 2019, 12, 2147–2153. [Google Scholar] [CrossRef] [PubMed]
  13. Roy, S.; Cherevotan, A.; Peter, S.C. Thermochemical CO2 Hydrogenation to Single Carbon Products: Scientific and Technological Challenges. ACS Energy Lett. 2018, 3, 1938–1966. [Google Scholar] [CrossRef] [Green Version]
  14. Calbry-Muzyka, A.S.; Schildhauer, T.J. Direct Methanation of Biogas—Technical Challenges and Recent Progress. Front. Energy Res. 2020, 8, 356. [Google Scholar] [CrossRef]
  15. Kuo, J.; Dow, J. Biogas production from anaerobic digestion of food waste and relevant air quality implications. J. Air Waste Manag. Assoc. 2017, 67, 1000–1011. [Google Scholar] [CrossRef] [PubMed]
  16. Ahmed, M.A.A. Catalyst deactivation: Common causes. In Proceedings of the Nitrogen + Syngas 2013 International Conference, Berlin, Germany, 5–8 March 2013; pp. 213–232. [Google Scholar]
  17. Bartholomew, C.H. Mechanisms of Nickel Catalyst Poisoning. Stud. Surf. Sci. Catal. 1987, 34, 81–104. [Google Scholar]
  18. Coppola, G.; Papurello, D. Biogas Cleaning: Activated Carbon Regeneration for H2S Removal. Clean Technol. 2018, 1, 4. [Google Scholar] [CrossRef] [Green Version]
  19. Barelli, L.; Bidini, G.; de Arespacochaga, N.; Pérez, L.; Sisani, E. Biogas use in high temperature fuel cells: Enhancement of KOH-KI activated carbon performance toward H2S removal. Int. J. Hydrog. Energy 2017, 42, 10341–10353. [Google Scholar] [CrossRef]
  20. Guilera, J.; Soto, R.; Alarcón, A.; Andreu, T. Satisfactory catalyst stability in SNG production using real biogas despite sulfur poisoning evidences at different reactor zones. Fuel 2021, 306, 121682. [Google Scholar] [CrossRef]
  21. Balat, M.; Balat, H. Biogas as a Renewable Energy Source—A Review. Energ. Source Part A 2009, 31, 1280–1293. [Google Scholar] [CrossRef]
  22. Weiland, P. Biogas production: Current state and perspectives. Appl. Microbiol. Biotechnol. 2010, 85, 849–860. [Google Scholar] [CrossRef]
  23. Weinrich, S.; Nelles, M. Basics of Anaerobic Digestion: Biochemical Conversion and Process Modelling. DBFZ Rep. 2021, 40, 10–80. [Google Scholar]
  24. Kwaśny, J.; Balcerzak, W. Sorbents Used for Biogas Desulfurization in the Adsorption Process. Pol. J. Environ. Stud. 2016, 25, 37–43. [Google Scholar] [CrossRef]
  25. Ramsay, I.R.; Pullammanappallil, P.C. Protein degradation during anaerobic wastewater treatment: Derivation of stoichiometry. Biodegradation 2001, 12, 247–257. [Google Scholar] [CrossRef] [PubMed]
  26. Köppel, W.; Schreck, H.; Lubenau, U.; Erler, R. Monitoring Biogas II; 2014; Available online: https://www.dvgw.de/medien/dvgw/forschung/berichte/g1_03_10.pdf (accessed on 8 March 2022).
  27. Bragança, I.; Sánchez-Soberón, F.; Pantuzza, G.F.; Alves, A.; Ratola, N. Impurities in biogas: Analytical strategies, occurrence, effects and removal technologies. Biomass Bioenergy 2020, 143, 105878. [Google Scholar] [CrossRef]
  28. Yang, L.C.; Ge, X.M.; Wan, C.X.; Yu, F.; Li, Y.B. Progress and perspectives in converting biogas to transportation fuels. Renew. Sust. Energ. Rev. 2014, 40, 1133–1152. [Google Scholar] [CrossRef]
  29. Schweigkofler, M.; Niessner, R. Determination of Siloxanes and VOC in Landfill Gas and Sewage Gas by Canister Sampling and GC-MS/AES Analysis. Environ. Sci. Technol. 1999, 33, 3680–3685. [Google Scholar] [CrossRef]
  30. Cabrera-Codony, A.; Montes-Morán, M.A.; Sánchez-Polo, M.; Martín, M.J.; Gonzalez-Olmos, R. Biogas upgrading: Optimal activated carbon properties for siloxane removal. Environ. Sci. Technol. 2014, 48, 7187–7195. [Google Scholar] [CrossRef]
  31. Li, W.H.; Wang, H.Z.; Jiang, X.; Zhu, J.; Liu, Z.M.; Guo, X.W.; Song, C.S. A short review of recent advances in CO2 hydrogenation to hydrocarbons over heterogeneous catalysts. RSC Adv. 2018, 8, 7651–7669. [Google Scholar] [CrossRef] [Green Version]
  32. Tsiotsias, A.I.; Charisiou, N.D.; Yentekakis, I.V.; Goula, M.A. The Role of Alkali and Alkaline Earth Metals in the CO2 Methanation Reaction and the Combined Capture and Methanation of CO2. Catalysts 2020, 10, 812. [Google Scholar] [CrossRef]
  33. Strucks, P.; Failing, L.; Kaluza, S. A Short Review on Ni-Catalyzed Methanation of CO2: Reaction Mechanism, Catalyst Deactivation, Dynamic Operation. Chem. Ing. Tech. 2021, 93, 1526–1536. [Google Scholar] [CrossRef]
  34. Frontera, P.; Macario, A.; Ferraro, M.; Antonucci, P. Supported Catalysts for CO2 Methanation: A Review. Catalysts 2017, 7, 59. [Google Scholar] [CrossRef]
  35. Wang, F.; He, S.; Chen, H.; Wang, B.; Zheng, L.R.; Wei, M.; Evans, D.G.; Duan, X. Active Site Dependent Reaction Mechanism over Ru/CeO2 Catalyst toward CO2 Methanation. J. Am. Chem. Soc. 2016, 138, 6298–6305. [Google Scholar] [CrossRef] [PubMed]
  36. Younas, M.; Loong Kong, L.; Bashir, M.J.K.; Nadeem, H.; Shehzad, A.; Sethupathi, S. Recent Advancements, Fundamental Challenges, and Opportunities in Catalytic Methanation of CO2. Energy Fuels 2016, 30, 8815–8831. [Google Scholar] [CrossRef]
  37. Wei, W.; Jinlong, G. Methanation of carbon dioxide: An overview. Front. Chem. Sci. Eng. 2011, 5, 2–10. [Google Scholar] [CrossRef]
  38. Rachow, F. Process Optimization for the Methanation of CO2 (German, Prozessoptimierung für die Methanisierung von CO2: Vom Labor zum Technikum). Ph.D. Dissertation, BTU Cottbus-Senftenberg, Cottbus, Germany, 2017. [Google Scholar]
  39. Stangeland, K.; Kalai, D.; Li, H.L.; Yu, Z.X. CO2 Methanation: The Effect of Catalysts and Reaction Conditions. Energy Procedia 2017, 105, 2022–2027. [Google Scholar] [CrossRef]
  40. Ma, Y.; Liu, J.; Chu, M.; Yue, J.R.; Cui, Y.B.; Xu, G.W. Cooperation Between Active Metal and Basic Support in Ni-Based Catalyst for Low-Temperature CO2 Methanation. Catal. Lett. 2020, 150, 1418–1426. [Google Scholar] [CrossRef]
  41. Wolf, M.; Wong, L.H.; Schüler, C.; Hinrichsen, O. CO2 methanation on transition-metal-promoted Ni-Al catalysts: Sulfur poisoning and the role of CO2 adsorption capacity for catalyst activity. J. CO2 Util. 2020, 36, 276–287. [Google Scholar] [CrossRef]
  42. Gao, J.J.; Liu, Q.; Gu, F.N.; Liu, B.; Zhong, Z.Y.; Su, F.B. Recent advances in methanation catalysts for the production of synthetic natural gas. RSC Adv. 2015, 5, 22759–22776. [Google Scholar] [CrossRef]
  43. Swalus, C.; Jacquemin, M.; Poleunis, C.; Bertrand, P.; Ruiz, P. CO2 methanation on Rh/γ-Al2O3 catalyst at low temperature: “In situ” supply of hydrogen by Ni/activated carbon catalyst. Appl. Catal. B 2012, 125, 41–50. [Google Scholar] [CrossRef]
  44. Tada, S.; Shimizu, T.; Kameyama, H.; Haneda, T.; Kikuchi, R. Ni/CeO2 catalysts with high CO2 methanation activity and high CH4 selectivity at low temperatures. Int. J. Hydrog. Energy 2012, 37, 5527–5531. [Google Scholar] [CrossRef]
  45. Boggula, R.R.; Fischer, D.; Casaretto, R.; Born, J. Methanation potential: Suitable catalyst and optimized process conditions for upgrading biogas to reach gas grid requirements. Biomass Bioenergy 2020, 133, 105447. [Google Scholar] [CrossRef]
  46. Rönsch, S.; Schneider, J.; Matthischke, S.; Schlüter, M.; Götz, M.; Lefebvre, J.; Prabhakaran, P.; Bajohr, S. Review on methanation—From fundamentals to current projects. Fuel 2016, 166, 276–296. [Google Scholar] [CrossRef]
  47. Vannice, M.A. The Catalytic Synthesis of Hydrocarbons from Carbon Monoxide and Hydrogen. Catal. Rev. Sci. Eng. 1976, 14, 153–191. [Google Scholar] [CrossRef]
  48. Tsiotsias, A.I.; Charisiou, N.D.; Yentekakis, I.V.; Goula, M.A. Bimetallic Ni-Based Catalysts for CO2 Methanation: A Review. Nanomaterials 2020, 11, 28. [Google Scholar] [CrossRef]
  49. Walker, S.B.; Sun, D.; Kidon, D.; Siddiqui, A.; Kuner, A.; Fowler, M.; Simakov, D.S.A. Upgrading biogas produced at dairy farms into renewable natural gas by methanation. Int. J. Energy Res. 2018, 42, 1714–1728. [Google Scholar] [CrossRef]
  50. Wolf, M.; Schüler, C.; Hinrichsen, O. Sulfur poisoning of co-precipitated Ni–Al catalysts for the methanation of CO2. J. CO2 Util. 2019, 32, 80–91. [Google Scholar] [CrossRef]
  51. Mills, A.G.A.; Steffgen, F.W. Catalytic Methanation. Catal. Rev. 1974, 8, 159–210. [Google Scholar] [CrossRef]
  52. Ewald, S.; Kolbeck, M.; Kratky, T.; Wolf, M.; Hinrichsen, O. On the deactivation of Ni-Al catalysts in CO2 methanation. Appl. Catal. A-Gen. 2019, 570, 376–386. [Google Scholar] [CrossRef]
  53. Liu, C.J.; Ye, J.Y.; Jiang, J.J.; Pan, Y.X. Progresses in the Preparation of Coke Resistant Ni-based Catalyst for Steam and CO2 Reforming of Methane. ChemCatChem 2011, 3, 529–541. [Google Scholar] [CrossRef]
  54. Zhou, L.; Li, L.; Wei, N.; Li, J.; Basset, J.M. Effect of NiAl2O4 Formation on Ni/Al2O3 Stability during Dry Reforming of Methane. ChemCatChem 2015, 7, 2508–2516. [Google Scholar] [CrossRef] [Green Version]
  55. Pastor-Pérez, L.; Saché, E.L.; Jones, C.; Gu, S.; Arellano-Garcia, H.; Reina, T.R. Synthetic natural gas production from CO2 over Ni-x/CeO2-ZrO2 (x = Fe, Co) catalysts: Influence of promoters and space velocity. Catal. Today 2018, 317, 108–113. [Google Scholar] [CrossRef]
  56. Atzori, L.; Rombi, E.; Meloni, D.; Sini, M.F.; Monaci, R.; Cutrufello, M.G. CO and CO2 Co-Methanation on Ni/CeO2-ZrO2 Soft-Templated Catalysts. Catalysts 2019, 9, 415. [Google Scholar] [CrossRef] [Green Version]
  57. Zhu, H.; Razzaq, R.; Li, C.; Muhmmad, Y.; Zhang, S. Catalytic Methanation of Carbon Dioxide by Active Oxygen Material CexZr1−xO2 Supported Ni-Co Bimetallic Nanocatalysts. AIChE J. 2013, 59, 2567–2576. [Google Scholar] [CrossRef]
  58. Sakpal, T.; Lefferts, L. Structure-dependent activity of CeO2 supported Ru catalysts for CO2 methanation. J. Catal. 2018, 367, 171–180. [Google Scholar] [CrossRef]
  59. Kim, H.Y.; Lee, H.M.; Park, J.N. Bifunctional Mechanism of CO2 Methanation on Pd-MgO/SiO2 Catalyst: Independent Roles of MgO and Pd on CO2 Methanation. J. Phys. Chem. C 2010, 114, 7128–7131. [Google Scholar] [CrossRef]
  60. Gac, W.; Zawadzki, W.; Rotko, M.; Słowik, G.; Greluk, M. CO2 Methanation in the Presence of Ce-Promoted Alumina Supported Nickel Catalysts: H2S Deactivation Studies. Top. Catal. 2019, 62, 524–534. [Google Scholar] [CrossRef] [Green Version]
  61. Chein, R.Y.; Wang, C.C. Experimental Study on CO2 Methanation over Ni/Al2O3, Ru/Al2O3, and Ru-Ni/Al2O3 Catalysts. Catalysts 2020, 10, 1112. [Google Scholar] [CrossRef]
  62. Alarcón, A.; Guilera, J.; Soto, R.; Andreu, T. Higher tolerance to sulfur poisoning in CO2 methanation by the presence of CeO2. Appl. Catal. B 2020, 263, 118346. [Google Scholar] [CrossRef]
  63. Argyle, M.; Bartholomew, C. Heterogeneous Catalyst Deactivation and Regeneration: A Review. Catalysts 2015, 5, 145. [Google Scholar] [CrossRef] [Green Version]
  64. Méndez-Mateos, D.; Barrio, V.L.; Requies, J.M.; Cambra, J.F. A study of deactivation by H2S and regeneration of a Ni catalyst supported on Al2O3, during methanation of CO2. Effect of the promoters Co, Cr, Fe and Mo. RSC Adv. 2020, 10, 16551–16564. [Google Scholar] [CrossRef]
  65. Rodriguez, J.A.; Hrbek, J. Interaction of Sulfur with Well-Defined Metal and Oxide Surfaces: Unraveling the Mysteries behind Catalyst Poisoning and Desulfurization. Acc. Chem. Res. 1999, 32, 719–728. [Google Scholar] [CrossRef]
  66. Rostrup-Nielsen, J.R.; Pedersen, K. Sulfur poisoning of Boudouard and methanation reactions on nickel catalysts. J. Catal. 1979, 59, 395–404. [Google Scholar] [CrossRef]
  67. Chen, Y.; Xie, C.; Li, Y.; Song, C.; Bolin, T.B. Sulfur poisoning mechanism of steam reforming catalysts: An X-ray absorption near edge structure (XANES) spectroscopy study. Phys. Chem. Chem. Phys. 2010, 12, 5502. [Google Scholar] [CrossRef] [PubMed]
  68. Freund, H.-J.; Goodman, D.W. Handbook of Heterogeneous Catalysis, 2nd ed.; Weitkamp, J., Ed.; Wiley VCH: Weinheim, Germany, 2008. [Google Scholar]
  69. Neuberg, S.; Pennemann, H.; Shanmugam, V.; Thiermann, R.; Zapf, R.; Gac, W.; Greluk, M.; Zawadzki, W.; Kolb, G. CO2 Methanation in Microstructured Reactors—Catalyst Development and Process Design. Chem. Eng. Technol. 2019, 42, 2076–2084. [Google Scholar] [CrossRef]
  70. Bartholomew, C.H.; Weatherbee, G.D.; Jarvi, G.A. Sulfur Poisoning of Nickel Methanation Catalysts: I. In situ Deactivation by H2S of Nickel and Nickel Bimetallics. J. Catal. 1979, 60, 257–269. [Google Scholar] [CrossRef]
  71. Yan, X.L.; Liu, Y.; Zhao, B.R.; Wang, Y.; Liu, C.J. Enhanced sulfur resistance of Ni/SiO2 catalyst for methanation via the plasma decomposition of nickel precursor. Phys. Chem. Chem. Phys. 2013, 15, 12132–12138. [Google Scholar] [CrossRef]
  72. Zhang, X.; Sun, W.J.; Chu, W. Effect of glow discharge plasma treatment on the performance of Ni/SiO2 catalyst in CO2 methanation. J. Fuel Chem. Technol. 2013, 41, 96–101. [Google Scholar] [CrossRef]
  73. Yan, X.L.; Liu, Y.; Zhao, B.R.; Wang, Z.; Wang, Y.; Liu, C.J. Methanation over Ni/SiO2: Effect of the catalyst preparation methodologies. Int. J. Hydrog. Energy 2013, 38, 2283–2291. [Google Scholar] [CrossRef]
  74. Yuan, C.; Yao, N.; Wang, X.; Wang, J.; Lv, D.; Li, X. The SiO2 supported bimetallic Ni–Ru particles: A good sulfur-tolerant catalyst for methanation reaction. Chem. Eng. J. 2015, 260, 1–10. [Google Scholar] [CrossRef]
  75. Lee, K.; Song, C.; Janik, M.J. Density functional theory study of sulfur tolerance of CO adsorption and dissociation on Rh–Ni binary metals. Appl. Catal. A-Gen. 2010, 389, 122–130. [Google Scholar] [CrossRef]
  76. Rangan, M.; Yung, M.M.; Medlin, J.W. Experimental and computational investigations of sulfur-resistant bimetallic catalysts for reforming of biomass gasification products. J. Catal. 2011, 282, 249–257. [Google Scholar] [CrossRef]
  77. Shafiq, I.; Shafique, S.; Akhter, P.; Yang, W.; Hussain, M. Recent developments in alumina supported hydrodesulfurization catalysts for the production of sulfur-free refinery products: A technical review. Catal. Rev. 2022, 64, 1–86. [Google Scholar] [CrossRef]
  78. Wang, B.; Ding, G.; Shang, Y.; Lv, J.; Wang, H.; Wang, E.; Li, Z.; Ma, X.; Qin, S.; Sun, Q. Effects of MoO3 loading and calcination temperature on the activity of the sulphur-resistant methanation catalyst MoO3/γ-Al2O3. Appl. Catal. A-Gen. 2012, 431–432, 144–150. [Google Scholar] [CrossRef]
  79. Wang, B.; Yao, Y.; Jiang, M.; Li, Z.; Ma, X.; Qin, S.; Sun, Q. Effect of cobalt and its adding sequence on the catalytic performance of MoO3/Al2O3 toward sulfur-resistant methanation. J. Energy Chem. 2014, 23, 35–42. [Google Scholar] [CrossRef]
  80. Zaman, S.; Smith, K.J. A Review of Molybdenum Catalysts for Synthesis Gas Conversion to Alcohols: Catalysts, Mechanisms and Kinetics. Catal. Rev. Sci. Eng. 2012, 54, 41–132. [Google Scholar] [CrossRef]
  81. Kim, M.Y.; Ha, S.B.; Koh, D.J.; Byun, C.; Park, E.D. CO methanation over supported Mo catalysts in the presence of H2S. Catal. Commun. 2013, 35, 68–71. [Google Scholar] [CrossRef]
  82. Struis, R.P.W.J.; Schildhauer, T.J.; Czekaj, I.; Janousch, M.; Biollaz, S.M.A.; Ludwig, C. Sulphur poisoning of Ni catalysts in the SNG production from biomass: A TPO/XPS/XAS study. Appl. Catal. A-Gen. 2009, 362, 121–128. [Google Scholar] [CrossRef]
  83. Mullins, D.R. The surface chemistry of cerium oxide. Surf. Sci. Rep. 2015, 70, 42–85. [Google Scholar] [CrossRef] [Green Version]
  84. Liu, Q.; Gao, J.; Zhang, M.; Li, H.; Gu, F.; Xu, G.; Zhong, Z.; Su, F. Highly active and stable Ni/γ-Al2O3 catalysts selectively deposited with CeO2 for CO methanation. RSC Adv. 2014, 4, 16094–16103. [Google Scholar] [CrossRef]
  85. Guilera, J.; del Valle, J.; Alarcón, A.; Díaz, J.A.; Andreu, T. Metal-oxide promoted Ni/Al2O3 as CO2 methanation micro-size catalysts. J. CO2 Util. 2019, 30, 11–17. [Google Scholar] [CrossRef]
  86. Laosiripojana, N.; Charojrochkul, S.; Kim-Lohsoontorn, P.; Assabumrungrat, S. Role and advantages of H2S in catalytic steam reforming over nanoscale CeO2-based catalysts. J. Catal. 2010, 276, 6–15. [Google Scholar] [CrossRef]
  87. Fitzharris, W.D.; Katzer, J.R.; Manogue, W.H. Sulfur Deactivation of Nickel Methanation Catalyst. J. Catal. 1982, 76, 369–384. [Google Scholar] [CrossRef]
  88. Hinnemann, B.; Nørskov, J.K.; Topsøe, H. A density functional study of the chemical differences between Type I and Type II MoS2-based structures in hydrotreating catalysts. J. Phys. Chem. 2005, 109, 2245–2253. [Google Scholar] [CrossRef] [PubMed]
  89. Jiang, M.; Wang, B.; Yao, Y.; Wang, H.; Li, Z.; Ma, X.; Qin, S.; Sun, Q. The role of the distribution of Ce species on MoO3/CeO2–Al2O3 catalysts in sulfur-resistant methanation. Catal. Commun. 2013, 35, 32–35. [Google Scholar] [CrossRef]
  90. Diaz, A.; Odriozola, J.A.; Montes, M. Influence of alkali additives on activity and toxicity of H2S and tiophene over a Ni/SiO2 catalyst. Appl. Catal. A-Gen. 1998, 166, 163–172. [Google Scholar] [CrossRef]
  91. Alexander, A.M.; Hargreaves, J.S.J. Alternative catalytic materials: Carbides, nitrides, phosphides and amorphous boron alloys. Chem. Soc. Rev. 2010, 39, 4388–4401. [Google Scholar] [CrossRef]
  92. Bartholomew, C.H.; Agrawal, P.K.; Katzer, J.R. Sulfur Poisoning of Metals. Adv. Catal. 1982, 135–242. [Google Scholar] [CrossRef]
  93. Aguinaga, A.; Montes, M. Regeneration of a nickel/silica catalyst poisoned by thiophene. Appl. Catal. A-Gen. 1992, 90, 131–144. [Google Scholar] [CrossRef]
  94. Zhang, X.; Witte, J.; Schildhauer, T.; Bauer, C. Life cycle assessment of power-to-gas with biogas as the carbon source. Sustain. Energy Fuels 2020, 4, 1427–1436. [Google Scholar] [CrossRef]
  95. Zhuang, Y.; Simakov, D.S.A. Single-Pass Conversion of CO2/CH4 Mixtures over the Low-Loading Ru/γ-Al2O3 for Direct Biogas Upgrading into Renewable Natural Gas. Energy Fuels 2021, 35, 10062–10074. [Google Scholar] [CrossRef]
  96. Gao, J.; Wang, Y.; Ping, Y.; Hu, D.; Xu, G.; Gu, F.; Su, F. A thermodynamic analysis of methanation reactions of carbon oxides for the production of synthetic natural gas. RSC Adv. 2012, 2, 2358–2368. [Google Scholar] [CrossRef]
  97. Stangeland, K.; Kalai, D.Y.; Li, H.; Yu, Z. Active and stable Ni based catalysts and processes for biogas upgrading: The effect of temperature and initial methane concentration on CO2 methanation. Appl. Energy 2018, 227, 206–212. [Google Scholar] [CrossRef]
  98. Han, D.; Kim, Y.; Byun, H.; Cho, W.; Baek, Y. CO2 Methanation of Biogas Over 20 wt% Ni-Mg-Al Catalyst: On the Effect of N2, CH4, and O2 on CO2 conversion Rate. Catalysts 2020, 10, 1201. [Google Scholar] [CrossRef]
  99. Gac, W.; Zawadzki, W.; Rotko, M.; Greluk, M.; Słowik, G.; Pennemann, H.; Neuberg, S.; Zapf, R.; Kolb, G. Direct Conversion of Carbon Dioxide to Methane over Ceria- and Alumina-Supported Nickel Catalysts for Biogas Valorization. ChemPlusChem 2021, 86, 889–903. [Google Scholar] [CrossRef] [PubMed]
  100. Jürgensen, L.; Ehimen, E.A.; Born, J.; Holm-Nielsen, J.B. Dynamic biogas upgrading based on the Sabatier process: Thermodynamic and dynamic process simulation. Bioresour. Technol. 2015, 178, 323–329. [Google Scholar] [CrossRef]
  101. Szailer, T.; Novák, É.; Oszkó, A.; Erdőhelyi, A. Effect of H2S on the hydrogenation of carbon dioxide over supported Rh catalysts. Top. Catal. 2007, 46, 79–86. [Google Scholar] [CrossRef]
Figure 1. Sequence of decomposition products from the four steps of biogas production: hydrolysis, acidogenesis, acetogenesis, and methanation [23].
Catalysts 12 00374 g001
Figure 2. Proposed elementary steps with M = active metal and S = support for H2-assisted carbide mechanism [34].
Catalysts 12 00374 g002
Figure 3. Proposed elementary steps with M = active metal and S = support for formate mechanism over Ru/CeO2 [35].
Catalysts 12 00374 g003
Figure 4. CO2 conversion course during H2S poisoning of arbitrary catalyst with division into three distinct phases.
Catalysts 12 00374 g004
Figure 5. CO2 conversion in H2S poisoning experiments in CO2 methanation with unpromoted Ni catalysts in (a) fixed-bed reactor and (b) microchannel reactor with CH4 in the inlet gas [99].
Catalysts 12 00374 g005
Figure 6. CO2 conversion in H2S poisoning experiments in CO2 methanation with Ce-promoted Ni/Al2O3 catalysts with (a) 5 ppm H2S addition after 20 h [60] and (b) 1 ppm H2S addition compared to reference experiments [62].
Catalysts 12 00374 g006
Figure 7. CO2 conversion or CH4 yield in H2S poisoning experiments in methanation with Ni/Al2O3 catalysts and transition metal promoters with (a) 5 ppm H2S addition after 24 h [41] and (b) 50 ppm H2S addition [64].
Catalysts 12 00374 g007
Figure 8. CO2 conversion in H2S poisoning experiments in methanation with (a) 1 ppm H2S addition to bimetallic Ru catalysts [69] and (b) Rh/TiO2 [101].
Catalysts 12 00374 g008
Figure 9. Correlation of total fed H2S amount and metal content until complete deactivation (beginning of phase 3) for the catalysts from studies discussed in Section 7. Calculations are given in Appendix B.
Catalysts 12 00374 g009
Table 1. Average concentrations of the individual biogas components for different substrate groups, according to [26].
CompoundUnitAgricultural Waste 1Residual Waste 2Bio Waste 3Sewage Sludge 4
CH4vol%52–5759–6458–6163–65
CO2vol%36–4833–3839–4135–37
O2vol%<2<0.5<0.6<0.2
N2vol%0–4.50–2.21.4–1.60.2
H2Smg/m310–5605–320390–8605–20
R-SHmg/m30–51–83–51–2
NH3mg/m30–122–15<2<1
H2ppmv10–50050–390100–190120–350
BTEXmg/m3<2<90<3<39
Simg/m3<2<2<24–15
1 including renewable resources and farm manure; 2 e.g., residues from food and feed production, residues from processing agricultural commodities or garden waste; 3 from organic waste garbage can; 4 from municipal wastewater treatment.
Table 2. Common promoters used in catalysts for CO2 methanation and their effects.
PromoterEffectSource
Fe
  • higher activity at low temperature
  • higher reducibility of Ni
  • facilitated CO2 adsorption
[1,48]
Co
  • higher activity at low temperature
  • facilitated CO2 adsorption
  • lower carbon deposition and sintering of metal particles
  • lower activation energy required for CO2 activation
[1,48]
Ru
  • higher dispersion of active metal
  • higher reducibility of Ni
  • higher basicity
  • higher activity at low temperature
  • facilitated CO2 and H2 activation
[48]
Mg
  • lower carbon deposition and metal particle sintering
  • resistance to water
  • higher thermal stability
  • stabilization of Al2O3 support when H2O is present
  • facilitated CO2 activation
[2,44,45,59]
Mn
  • higher adsorption capacity for CO2
  • higher reducibility of Ni and stabilized metal surface of Ni0
  • higher dispersion of active metal
  • higher number of moderate basic sites
[1]
Ce
  • higher dispersion of active Ni phase
  • higher activity at low temperature
  • lower metal particle sintering
  • lower S deposition on active metal
  • stabilization of Al2O3 support when H2O is present
[42,60,61,62]
Zr
  • higher dispersion of active metal
  • higher reducibility of Ni
[39]
Mo
  • higher sulfur resistance
[63]
Table 3. Types and mechanisms of catalyst deactivation [63].
MechanismTypeDescription
PoisoningChemicalSpecies adsorb strongly on catalytic sites and block them for reaction
FoulingMechanicalPhysical deposition of species on catalytic surface and in pores
Thermal degradation and sinteringThermal
Thermal/chemical
Thermally induced loss of catalytic surface area, support area, and active phase support reactions
Vapor formationChemicalLoss of catalyst compounds by reaction with gas
Vapor-solid and solid-solid reactionsChemicalReaction of catalyst compounds among each other or with gas leading to deactivation
Attrition/crushingMechanicalLoss of active material due to abrasion and crushing
Table 4. Experimental conditions (catalyst composition, temperature, CH4/CO2 ratio, and feed gas composition with CH4 concentration in bold type) and results (CO2 conversion and CH4 selectivity) of different studies. All experiments were performed at 1 bar except where indicated.
Reaction ConditionsCatalystT/°CCH4/CO2H2/CO2/CH4/N2/vol% 1X (CO2)S (CH4)Ref.
Table 5Ni20/Al2O33500/100
50/50
67/33
57/14/00/29
57/14/14/14
57/14/29/00
71.5%
70.8%
70.6%
99.7%
99.5%
99.4%
[97]
Table 5Ni20-Ru0.5/Al2O33500/100
67/33
57/14/00/29
57/14/29/00
82% 2
81% 2
>99%
>99%
[97]
Table 6Ni20-Mg3/Al2O34000/100
40/60
50/50
65/35
80/20/00/00
71/18/12/00
67/17/17/00
58/15/27/00
74% 2
67%
64%
54%
96% 2
97% 2
97% 2
97% 2
[98]
Table 7 3Ni20/Al2O33500/100
50/50
62/15/00/23 5
62/15/15/08 5
88.5%
82% 2
100%
79% 2
[99]
Table 7 3Ni40/Al2O33500/100
50/50
62/15/00/23 5
62/15/15/08 5
91.4%
81% 2
100%
79% 2
[99]
Table 7 3Ni20/CeO23500/100
50/50
62/15/00/23 5
62/15/15/08 5
91.7%
81% 2
100%
75% 2
[99]
Table 8 4Ni20/Al2O335050/5062/15/15/08 593.7%100%[99]
Table 8 4Ni40/Al2O335050/5062/15/15/08 595.7%100%[99]
Table 8 4Ni20/CeO235050/5062/15/15/08 594.6%100%[99]
Table 9Ni15-Co3/
CeO2-ZrO2
3500/100
21/79
36/64
47/53
80/20/00/00
76/19/05/00
72/18/10/00
68/17/15/00
71% 2
72%
74%
78%
98% 2
97%
98%
99%
[1]
1 rounded to integers; 2 numbers read from graphs (not given in the text); 3 experiments performed at 2 bar; 4 experiments performed at 12.5 bar; 5 with Ar instead of N2.
Table 5. Catalysts and reaction conditions for experiments on CH4 influence on methanation over Ni/Al2O3 with Ru promoter [97].
CatalystsNi20/Al2O3
Ni20-Ru0.5/Al2O3
Activation conditions600 °C, 6 h, H2/N2
T350 °C
p1 bar
H2/CO24
WHSV56,000 mL gcat−1 h−1
CH4,in0, 14, 29 vol%
Table 6. Catalyst and reaction conditions for experiments on CH4 influence on methanation over Ni/Al2O3 with Mg promoter [98].
CatalystNi20-Mg3/Al2O3
Activation conditions700 °C, 4 h, H2/N2
T400 °C
pnot specified
H2/CO24
GHSV30,000 h−1
CH4,in0, 12, 17, 27 vol%
Table 7. Catalyst and reaction conditions for fixed-bed reactor experiments on CH4 influence on methanation over unpromoted Ni/Al2O3 [99].
CatalystsNi20/Al2O3
Ni40/Al2O3
Activation conditions600 °C, 2 h, H2
T350 °C, 600 °C
p2 bar
H2/CO24
WHSV30 L gcat−1 h−1
CH4,in0, 15.4 vol%
Table 8. Catalyst and reaction conditions for microchannel reactor experiments on CH4 influence on methanation with unpromoted Ni/Al2O3 [99].
CatalystsNi20/Al2O3
Ni40/Al2O3
Activation conditions500 °C, 2 h, H2
T350 °C
p12.5 bar
H2/CO24
WHSV45 L gcat−1 h−1
CH4,in15.4 vol%
Table 9. Catalyst and reaction conditions for experiments on CH4 influence on methanation with Co-promoted Ni/CeO2-ZrO2 [1].
CatalystNi15-Co3/CeO2-ZrO2
Activation conditions450 °C, 1 h, H2/N2
T200–450 °C
p1 bar
H2/CO24
WHSV12,000 mL g−1 h−1
CH4,in0, 5, 10, 15 vol%
Table 10. Parameters for experiments with Ru0.5/Al2O3 with H2/CO2 = 4 and CH4/CO2 = 50/50 [95].
Reduction T400 °C, 600 °C
T350–600 °C
p1–3.8 bar
WHSV90,000–420,000 mL g−1 h−1
Table 11. Calculated CO2 conversion in equilibrium for methanation with 0, 14 or 20 vol% CH4 in the feed, based on an Aspen Plus simulation with a Gibbs reactor at 350 °C, a feed with H2/CO2 = 4 and N2 addition as described in [97].
X(CO2), 0 vol% CH4X(CO2), 14 vol% CH4X(CO2), 29 vol% CH4
1 bar85.0%82.9%81.5%
2 bar88.3%86.6%85.6%
12.5 bar94.0%93.2%92.7%
Table 12. Catalysts and reaction conditions for experiments on H2S influence on methanation with unpromoted Ni catalysts in a fixed-bed reactor [99].
CatalystsNi20/CeO2
Ni20/Al2O3
Ni40/Al2O3
Activation conditions600 °C, 2 h, H2
T450 °C
p2 bar
H2/CO24
WHSVnot specified
H2Sin8 ppm
Table 13. Catalysts and reaction conditions for experiments on H2S influence on methanation with unpromoted Ni catalysts in a microchannel micro reactor [99].
CatalystsNi20/CeO2
Ni20/Al2O3
Ni40/Al2O3
Activation conditions500 °C, 2 h, H2
T350 °C
p12.5 bar
H2/CO24
WHSV45 L gcat−1 h−1
H2Sin1 ppm
CH4,in15.4 vol%
Table 14. Catalysts and reaction conditions for experiments on H2S influence on methanation with Ni/Al2O3 and Ce promoter [60].
CatalystsNi20/Al2O3
Ni40/Al2O3
Ni20-Ce5/Al2O3
Ni40-Ce5/Al2O3
Activation conditions600 °C, 2 h, H2
T475 °C
p1.9 bar
H2/CO24
WHSV4.6 LCO2 h−1 g−1
H2Sin8 ppm
Table 15. Catalysts and reaction conditions for experiments on H2S influence on methanation with Ni/Al2O3 and Ce promoter [62].
CatalystsNi25/Al2O3
Ni25-Ce20/Al2O3
Activation conditions500 °C, 3 h, H2
T250 °C, 500 °C
p5 bar
H2/CO24
GHSV40,000 mL g−1 h−1
H2Sin1–5 ppm
Table 16. Catalysts and reaction conditions for experiments on H2S influence on methanation with Ni/Al2O3 and Mn, Fe, Co, Cu, and Zn promoter [41].
CatalystsNi41/Al2O3
Ni37-Mn3.3/Al2O3
Ni44-Fe4.4/Al2O3
Ni41-Co4.4/Al2O3
Ni39-Cu4.6/Al2O3
Ni38-Zn4.3/Al2O3
Activation conditions450 °C, 4 h, H2/Ar
T400 °C
p1 bar
H2/CO24
GHSVnot specified
H2Sin5 ppm
Table 17. Catalysts and reaction conditions for experiments on H2S influence with Ni/Al2O3 and Co, Cr, Fe, and Mo as promoter [64].
CatalystsNi13/Al2O3
Ni13-Co4/Al2O3
Ni13-Cr4/Al2O3
Ni13-Fe4/Al2O3
Ni13-Mo4/Al2O3
Ni13-Mo8/Al2O3
Activation conditions400 °C, 4 h, H2/N2
T300–500 °C
p10 bar
H2/CO24
WHSV33.5 gfeed gcat−1 h−1
H2Sin50 ppm
Table 18. Catalysts and reaction conditions for experiments on H2S influence in methanation with bimetallic noble metal catalysts on different supports [69].
CatalystsRu5/CeO2
Ru5-Rh1/CeO2
Ru5-Rh5/CeO2
Ru5-Ni20/CeO2
Ru5-Ni30/CeO2
Ru5-Ni20/SiO2
Ru5-Ni20/TiO2
Activation conditions500 °C, 2 h, H2
T375 °C
p12.5 bar
H2/CO24
WHSV40 L gcat−1 h−1
H2Sin1 ppm
Table 19. Catalysts and reaction conditions for experiments on H2S influence in methanation with noble metals on different supports [101].
CatalystsRh/TiO2
Ru/TiO2
Pd/TiO2
Rh/Al2O3
Rh/SiO2
Rh/CeO2
Rh/ZrO2
Rh/MgO
Activation conditions400 °C, 1 h
T275 °C
pnot specified
H2/CO24
GHSVnot specified
H2Sin22 ppm, 116 ppm
Publisher’s Note: MDPI stays neutral with regard to jurisdictional claims in published maps and institutional affiliations.

