Article

Effect of Plating Variables on Oxygen Evolution Reaction of Ni–Zn–Fe Electrodes for Alkaline Water Electrolysis

1
Hydrogen Energy Research Center, Korea Institute of Energy Research, Daejeon 34129, Korea
2
Department of Chemical Engineering and Applied Chemistry, Chungnam National University, Daejeon 34134, Korea
*
Author to whom correspondence should be addressed.
Catalysts 2022, 12(3), 346; https://doi.org/10.3390/catal12030346
Submission received: 24 January 2022 / Revised: 8 March 2022 / Accepted: 15 March 2022 / Published: 18 March 2022
(This article belongs to the Section Electrocatalysis)

Abstract

:
In this study, we investigated the oxygen evolution reaction (OER) characteristics of Ni–Zn–Fe electrodes by varying plating current density and Ni:Fe ratio in a plating bath. The activity of the OER increased up to the plating current density of 160 mA/cm2, as the Fe content of the deposited electrode increased and electrochemical surface area (ECSA) increased after Zn dealloying. However, for the plated electrode with higher than 160 mA/cm2 of current density, the change in composition caused by underpotential deposition led to decreased activity due to decreasing Fe content and diminishing Zn dealloying. Moreover, when the Ni:Fe ratio in the plating bath was varied, outstanding OER activity was observed at Ni:Fe = 2:1. When the Fe content of the bath increased beyond this ratio, Fe could not restrain Ni oxidation and formed Fe oxides in OER reaction, and oxygen vacancy decreased. These caused a degradation of the OER activity.

1. Introduction

The current global crisis urges us to minimize the use of fossil fuels and explore approaches to realize extended and more effective use of renewable energy [1,2]. Renewable energy requires energy storage technology as this energy can be harnessed only intermittently because of climate conditions such as seasonal variations, weather, and time [3]. Hydrogen energy is environmentally friendly and shows a high level of energy (141.9 J/kg) per unit mass compared to fossil fuels (e.g., gasoline 47.4 J/kg); thus, it has received considerable attention as a potential form of energy storage [4]. Among the methods for hydrogen energy production, alkaline water electrolysis has been the most widely investigated approach because of its technical maturity, high durability, and requirement of low-cost cell components [5]. The oxygen evolution reaction (OER) in alkaline water electrolysis, in particular, has a higher overpotential than the hydrogen evolution reaction (HER) as oxygen is generated via a more complex mechanism with four-electron transfer [6]. To increase the efficiency of alkaline water electrolysis, therefore, it is essential to explore a strategy to lower the overpotential of OER.
To reduce the overpotential of OER, using electrodes bearing catalysts based on precious metals (e.g., Pt, RuO2, and IrO2). However, the large-scale applications of such catalysts are limited because of their rarity and high cost [7]. Ni has been mainly used among the transition metals because of its high activity and high corrosion resistance in alkaline conditions. However, since Ni has lower activity than precious metal, the activity is improved by adjusting the adsorption/desorption energy of OER intermediate through alloy with other transition metals (e.g., Fe, Co, and Cr) according to the volcano plot [8,9,10,11,12,13]. Among the methods to prepare alloy electrodes, considerable research interest has been focused on electrodeposition because it is simple and economical compared to other coating methods (e.g., using ionomer binder) [14]. Another advantage of electrodeposition is the control of plating current density, which enables high rates of nucleation and growth during the production of an electrode catalyst having desired structure and shape. In general, an increase in plating current density leads to a more refined particle size [15,16]. Several studies reported contrasting results of increased particle size with increased plating current density [17]. As the plating current density influences the morphology of the electrode surface, considerable research is required to understand the electrode characteristics.
In Ni–Fe alloy electrodes, Fe was reported to enhance the activity for the OER by inhibiting oxidation and serving as the active site [18]. According to Louie et al., the addition of Fe to a Ni electrode restrained the oxidation of Ni; this composite electrode exhibited nearly twice the activity for the OER at approximately 40% Fe [19]. Corrigan et al. reported a decrease in the Tafel slope but a higher activity of the OER with an increase in the Fe concentrations (10–50%) in Ni–Fe electrodes [20]. Gorlin et al. reported that among Ni–Fe catalysts with varying Ni–Fe ratios, those with approximately 50% Fe exhibited the highest activity for the OER [21]. The studies show the key role of the Ni–Fe ratio in the OER.
To increase the surface area of the electrode, a Raney Ni catalyst may be prepared by using a Ni–Zn alloy and through selective Zn dealloying [22]. The activity of Raney Ni electrodes increases upon Zn dealloying, which implies a highly porous structure and a large surface area to increase the number of active sites whereon the OER occurs.
Alloying of Raney Ni catalyst with porous structure and Fe, which helps OER activity, shows high OER activity [23]. Many research on Ni–Zn–Fe coating technology using electroplating has been done for a long time [24,25,26]. However, to the best of our knowledge, there have been no reports of literature using the Ni–Zn–Fe catalyst prepared by electroplating as an electrode for alkaline water electrolysis. Therefore, in this paper, a Ni–Zn–Fe catalyst was prepared using an electroplating method and the OER activity was analyzed under alkaline water electrolysis conditions. The plating current density and ratios of Ni and Fe precursors in the plating bath were selected as variables having a significant effect on Ni–Zn–Fe electrodeposition. Moreover, the changes in the electrode composition, morphology, and electrochemical and physicochemical properties were analyzed, and the influence of plating variables on the OER activity effect was studied.

2. Results and Discussion

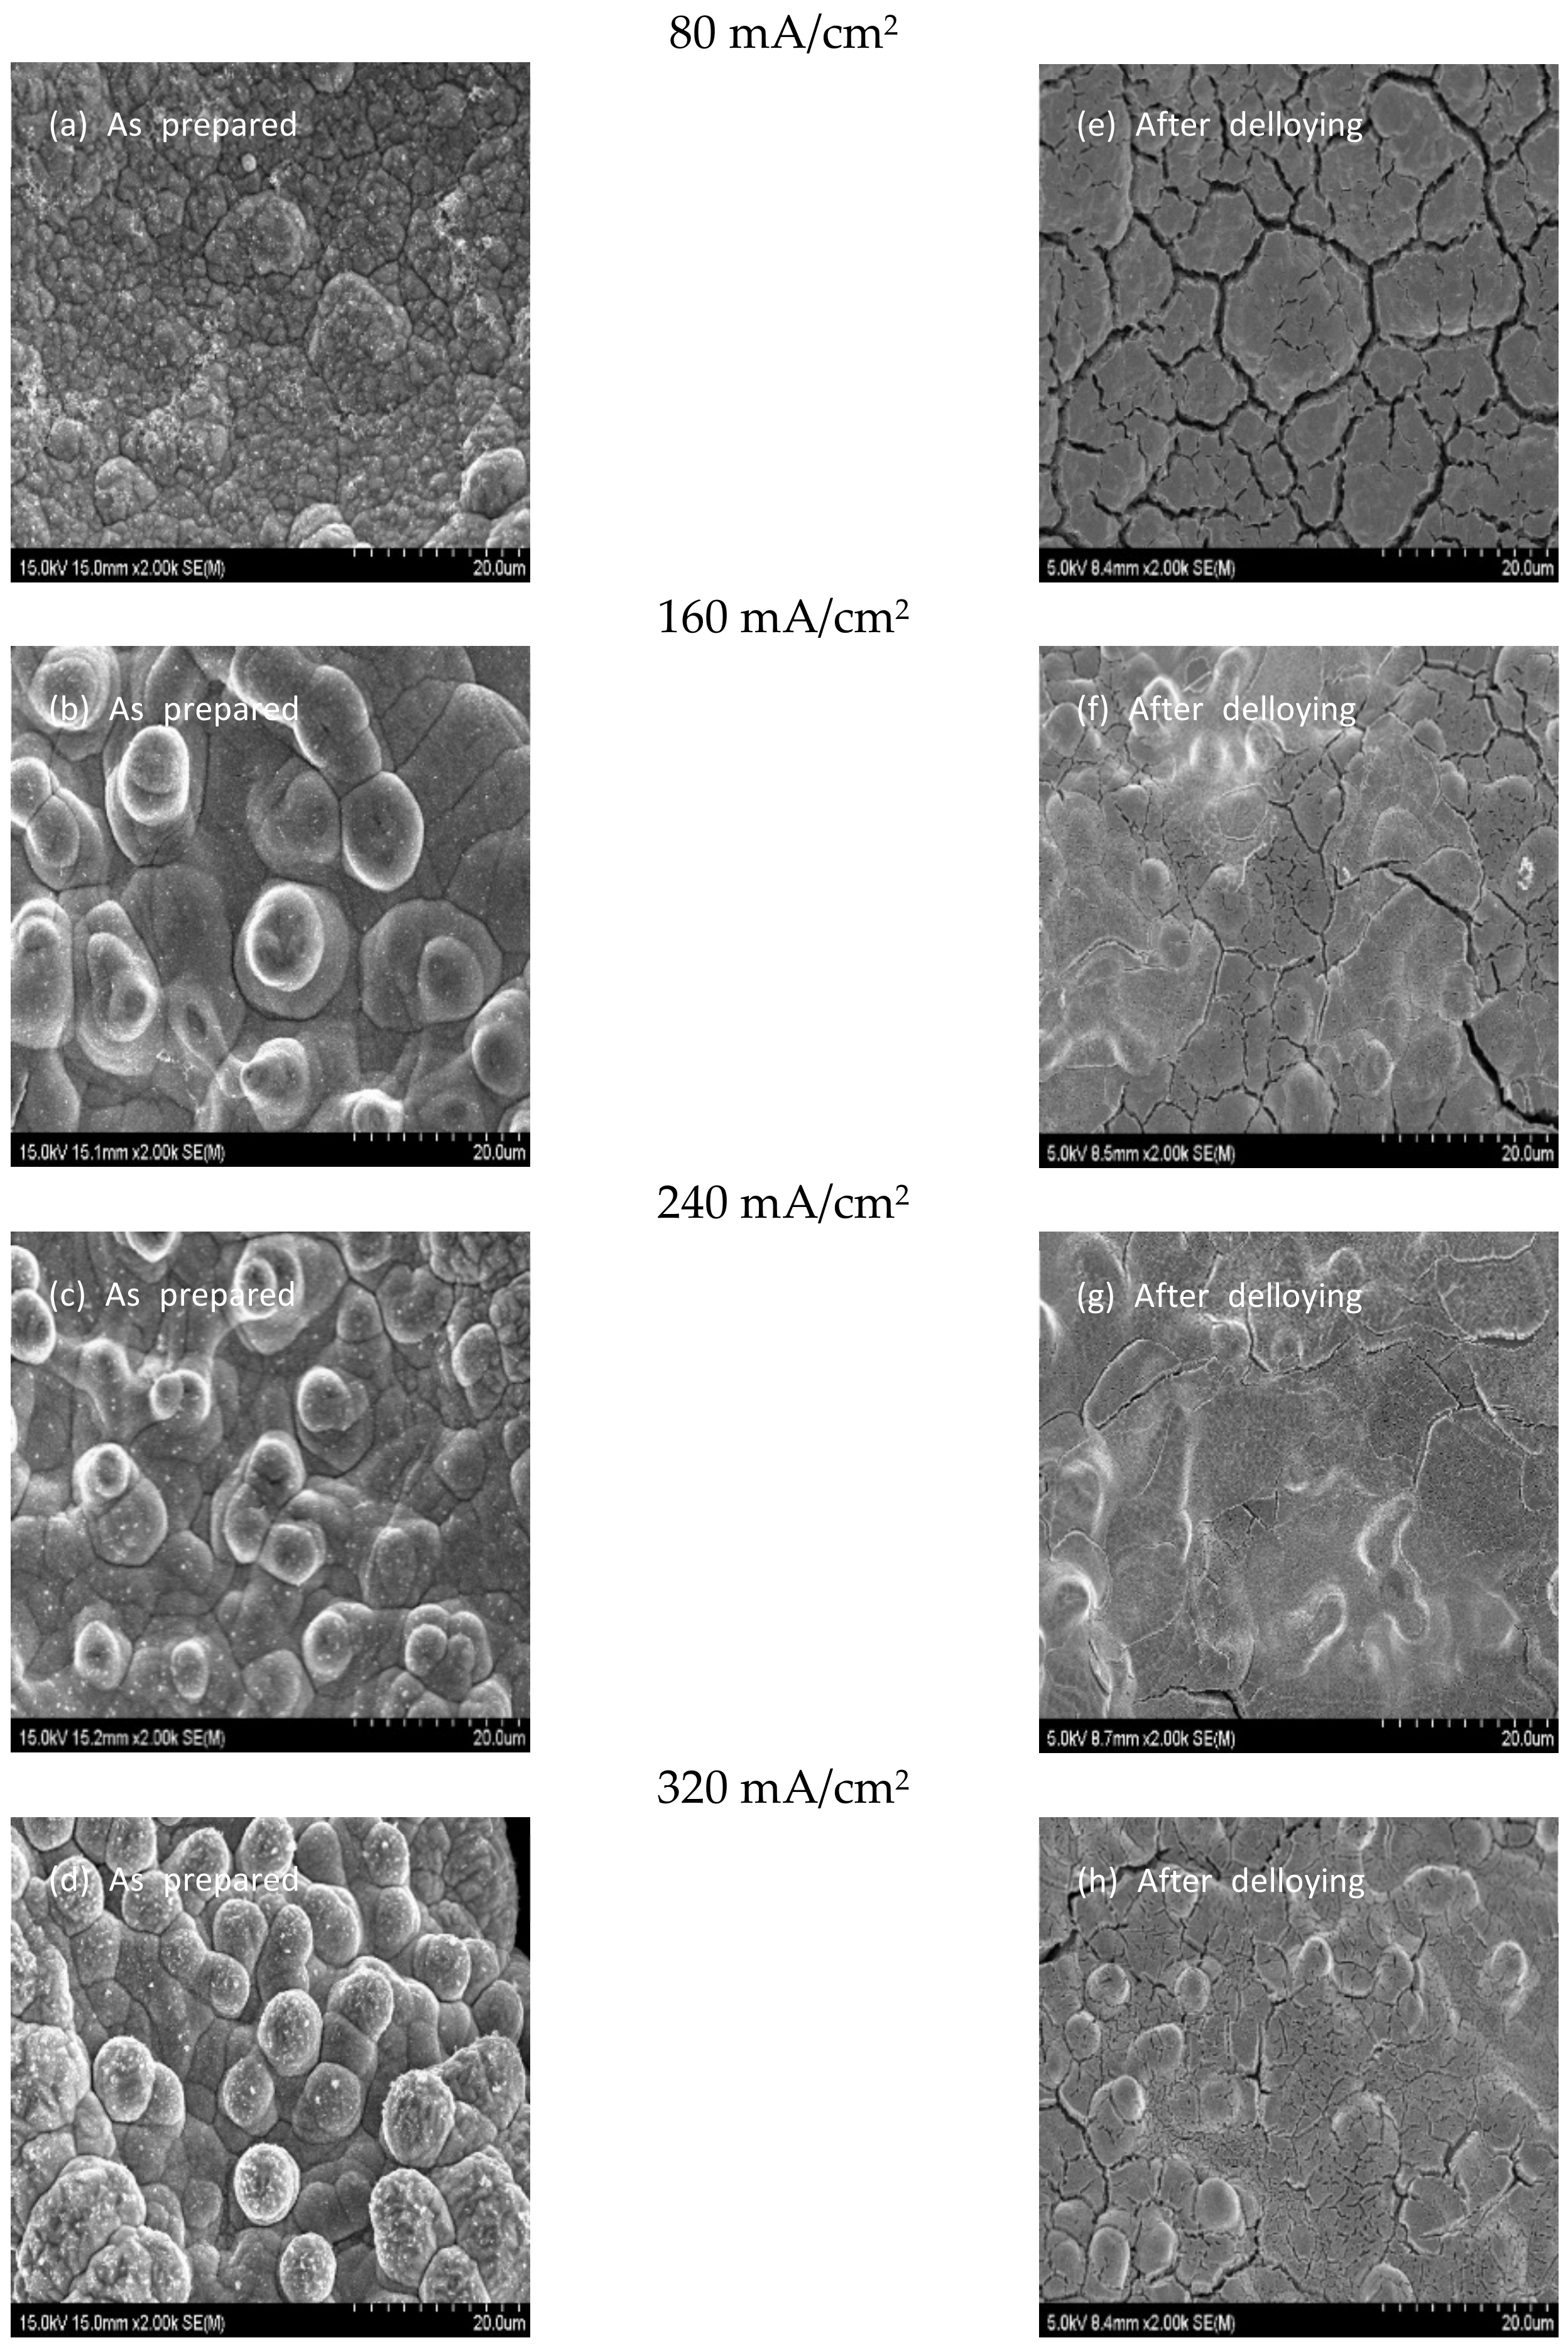
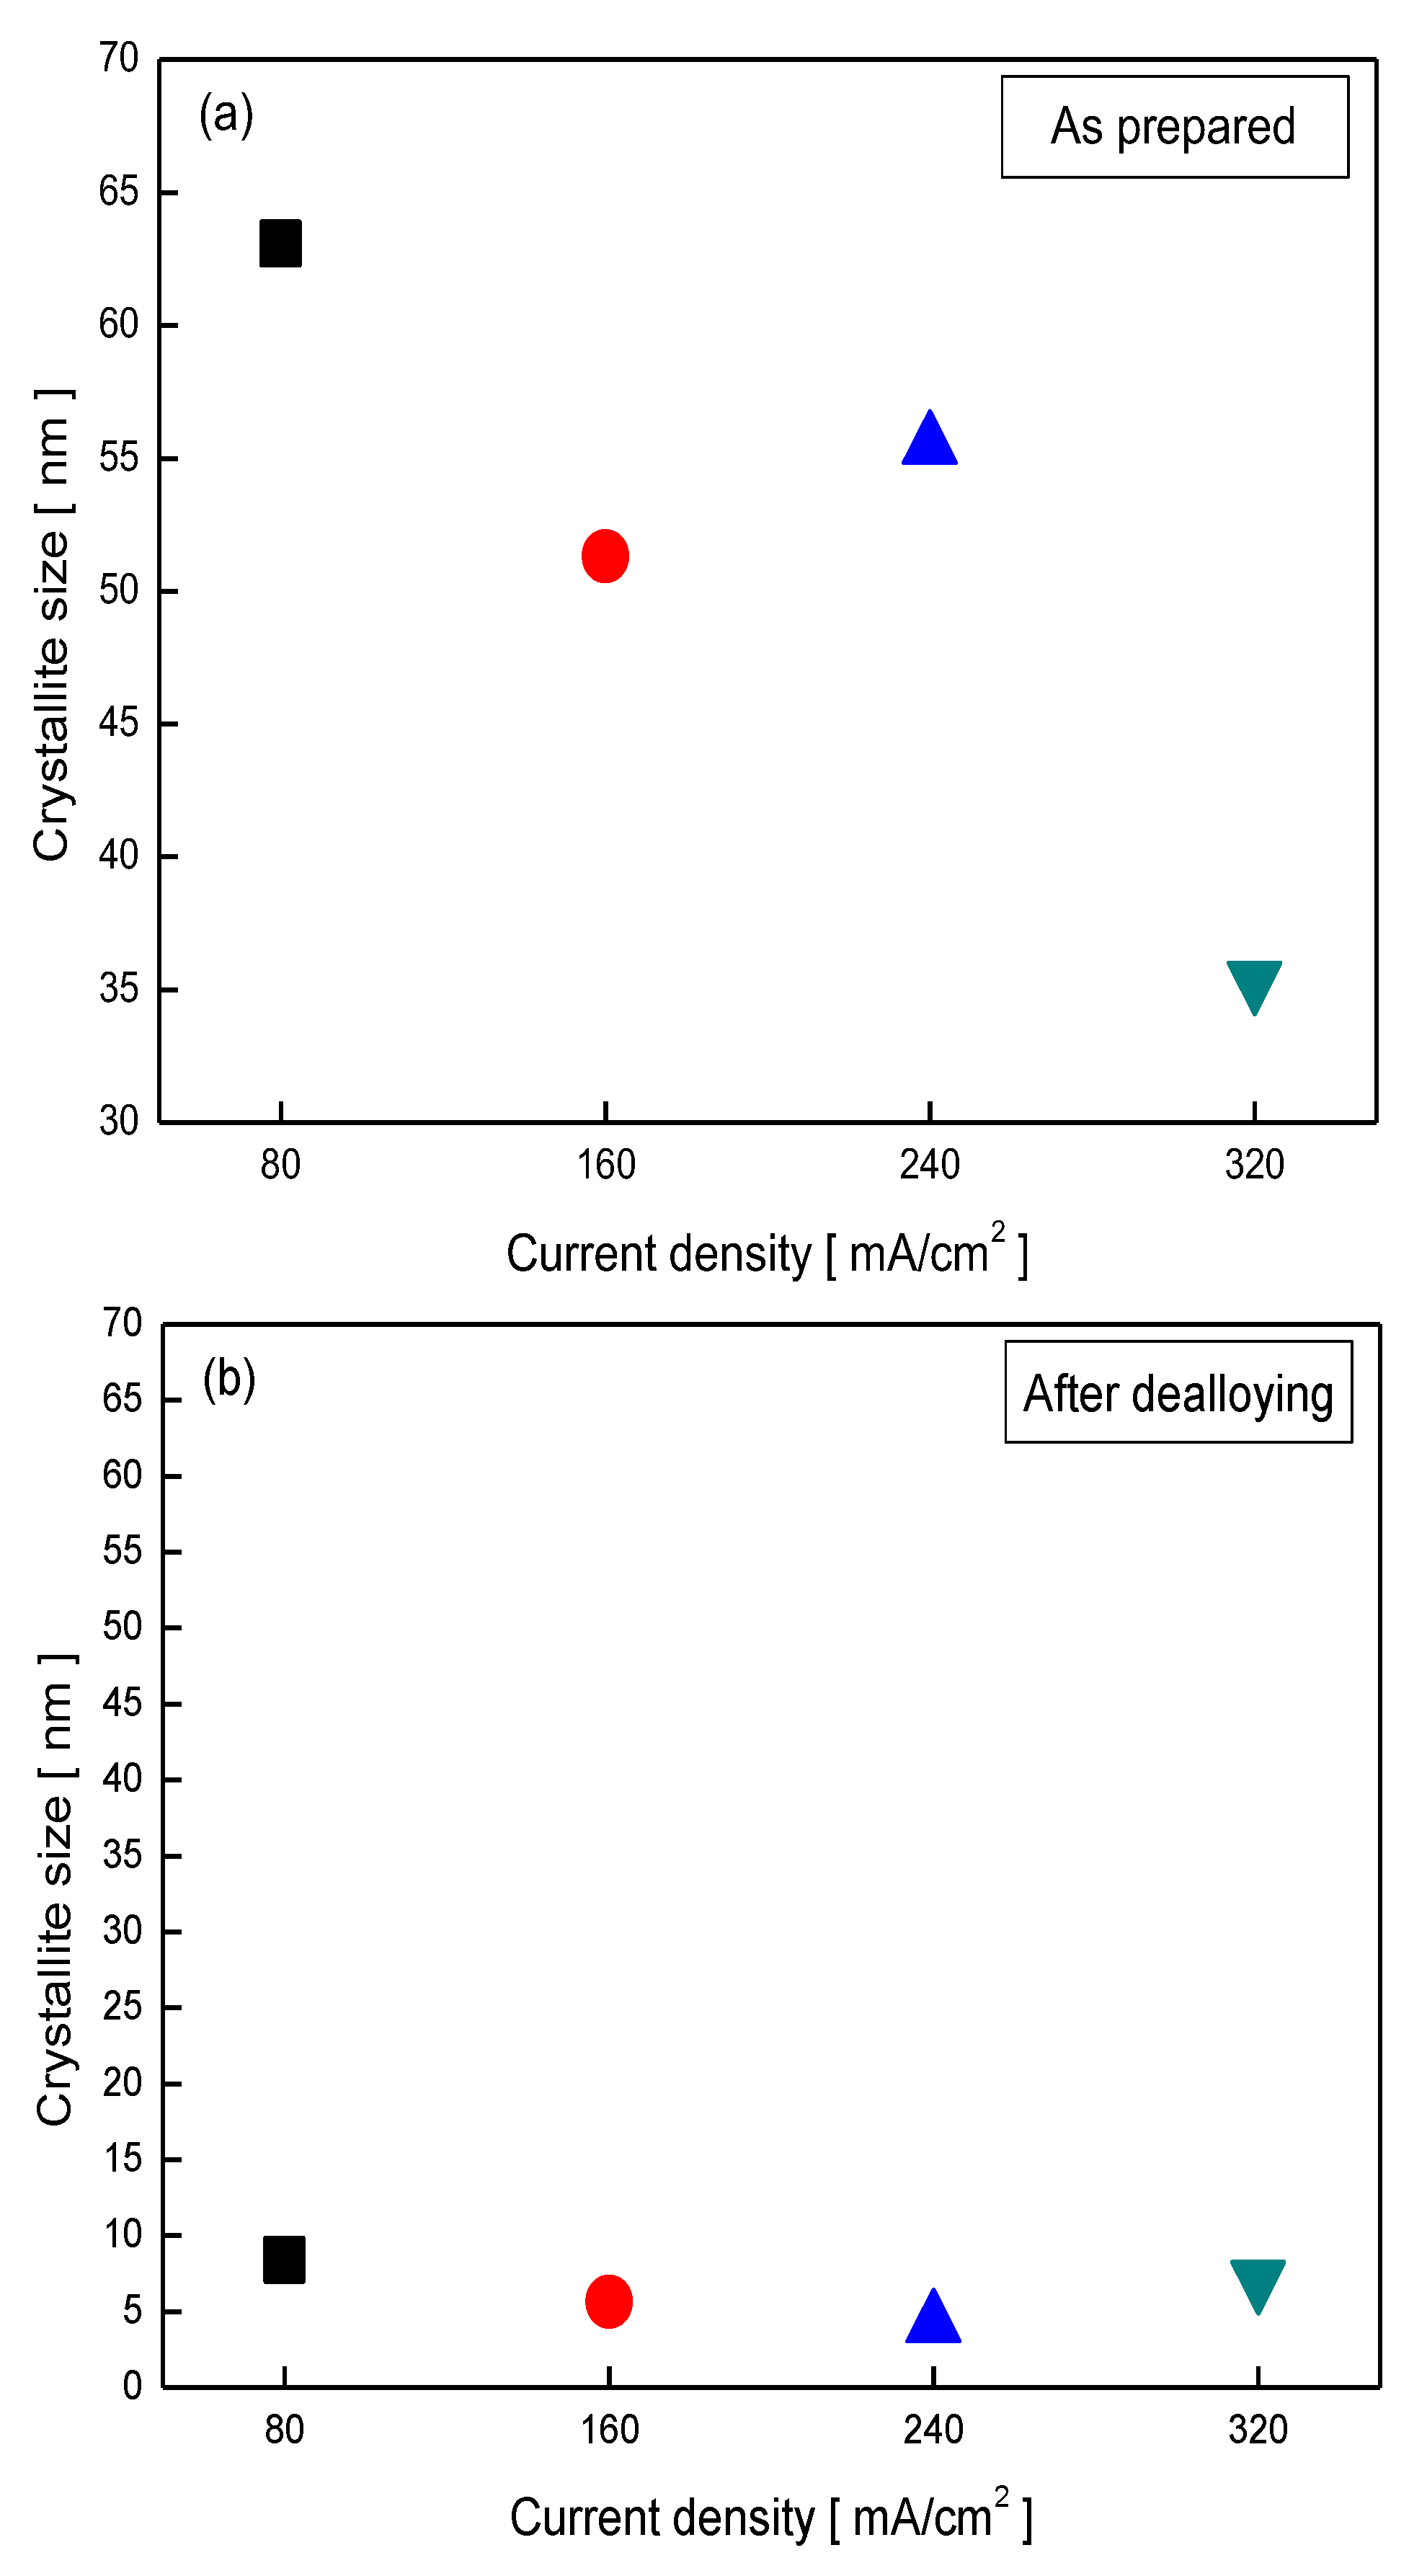
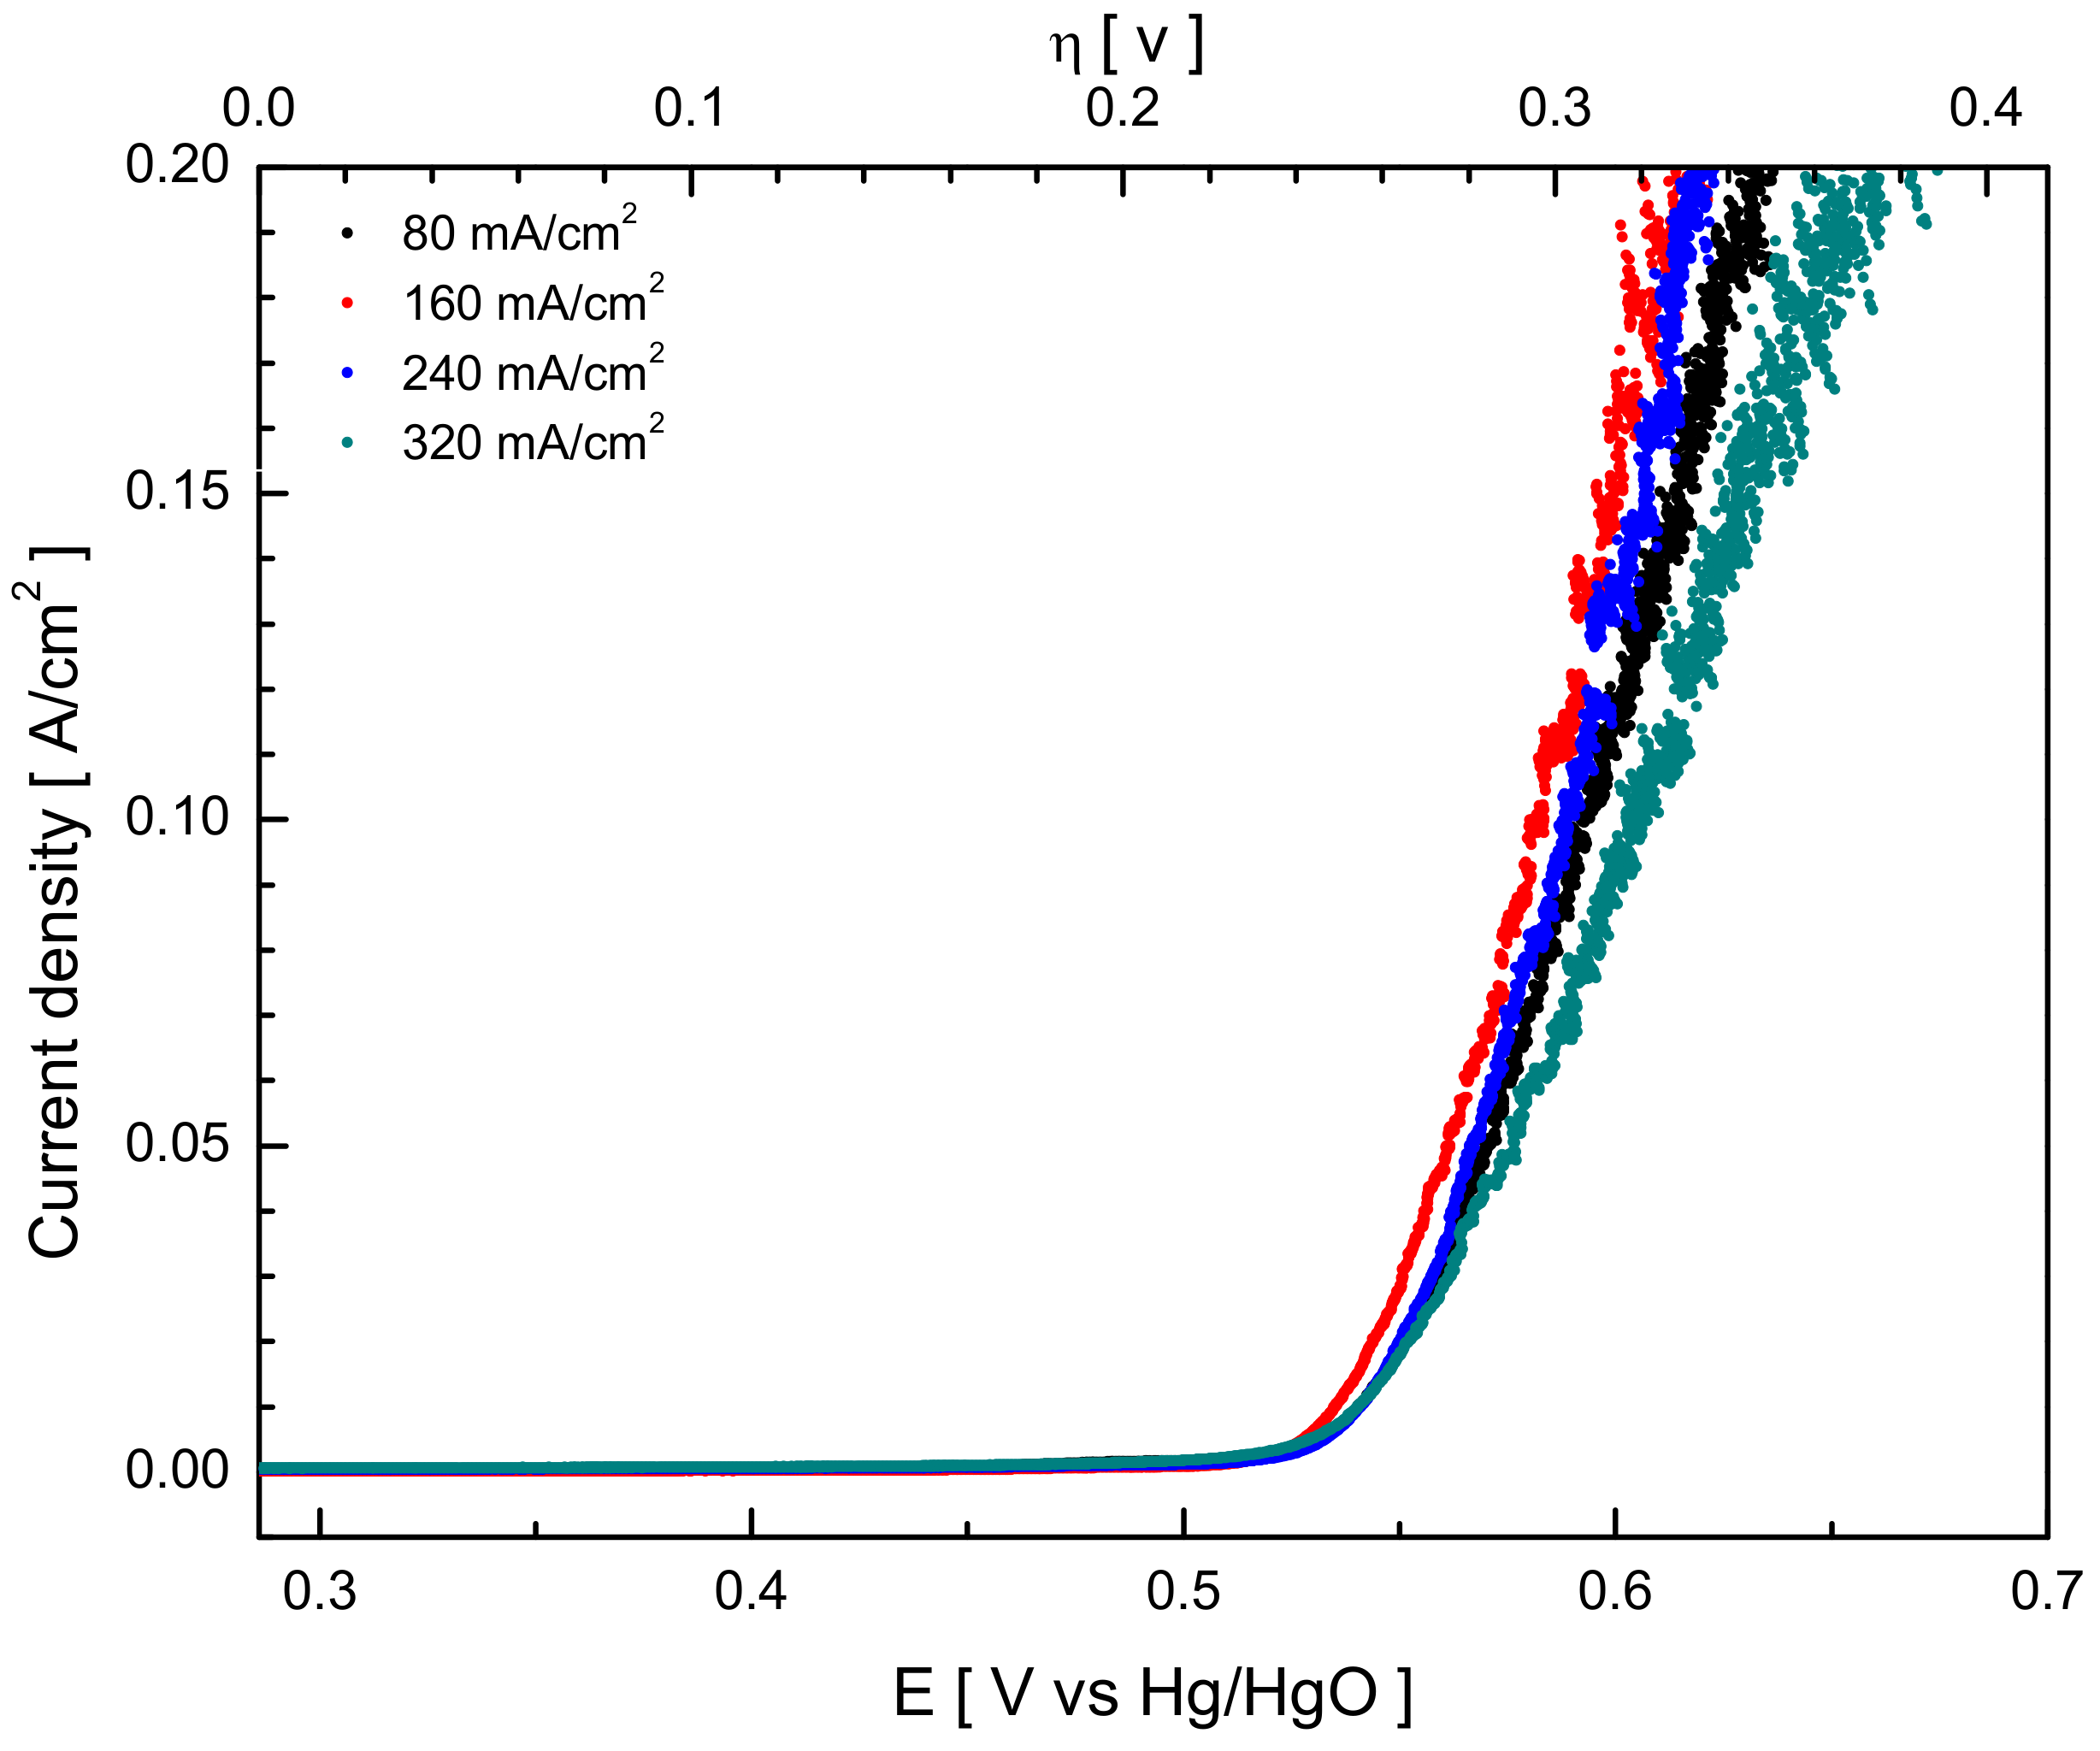
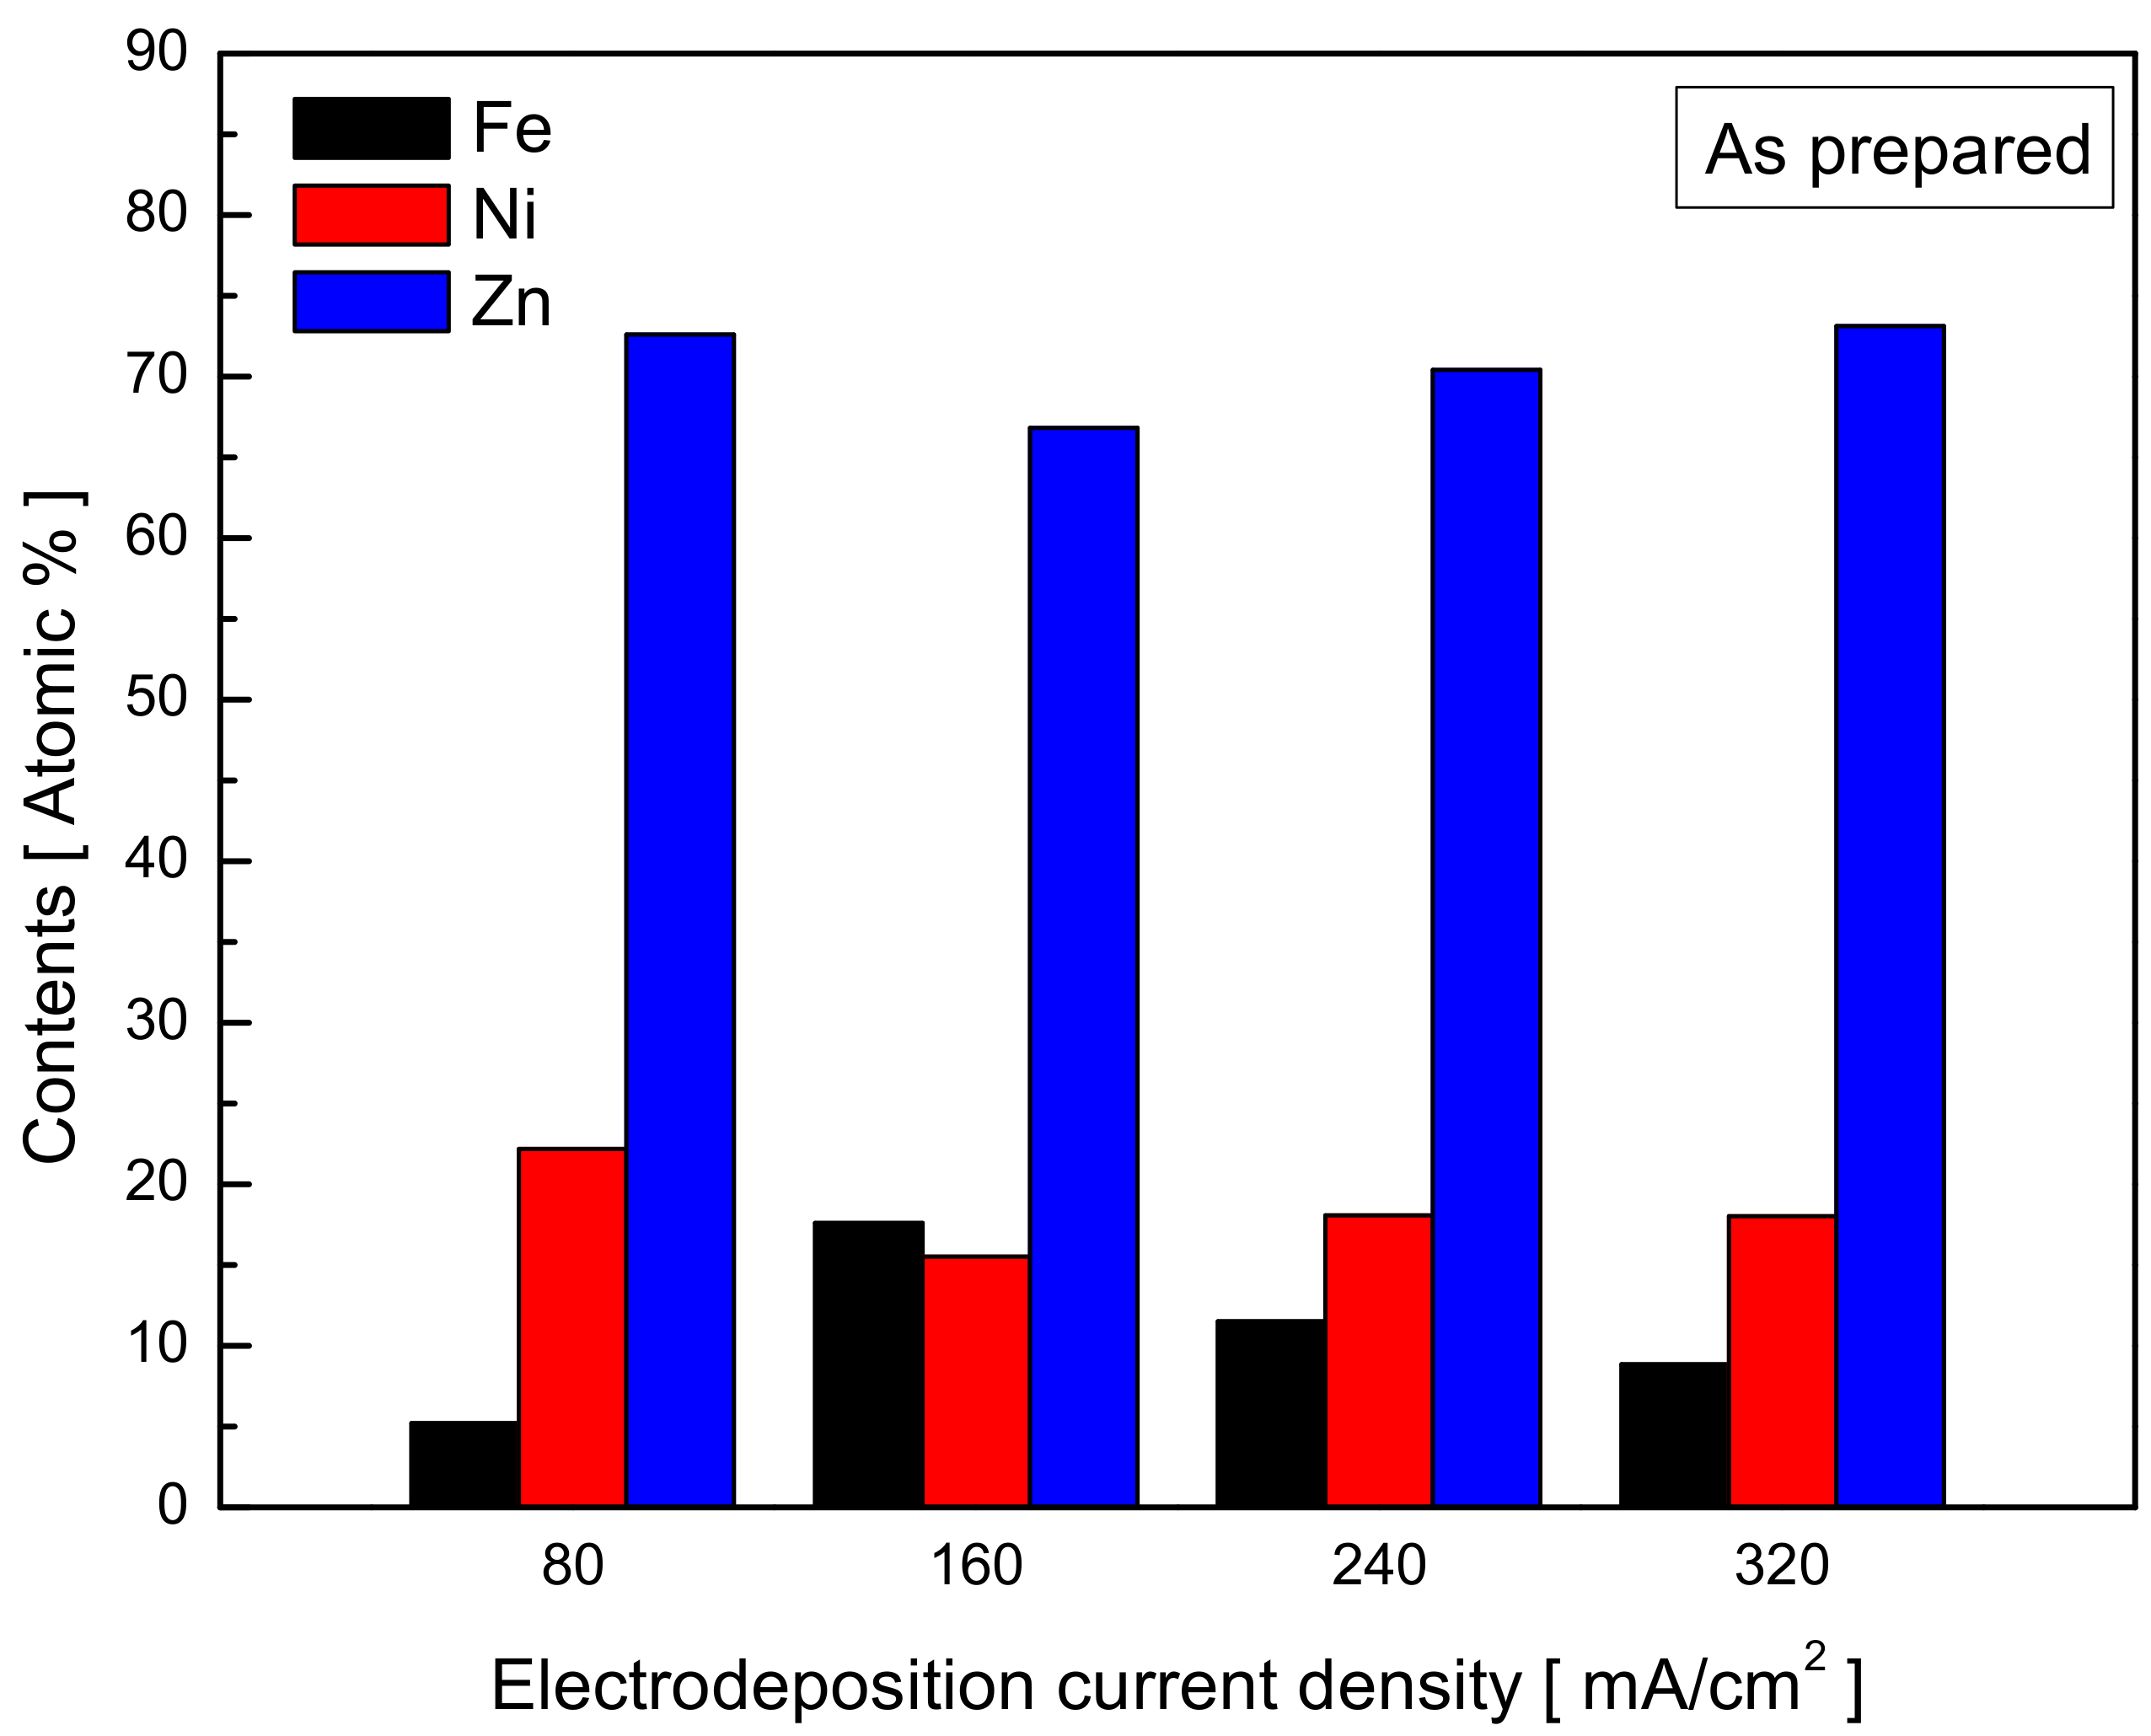
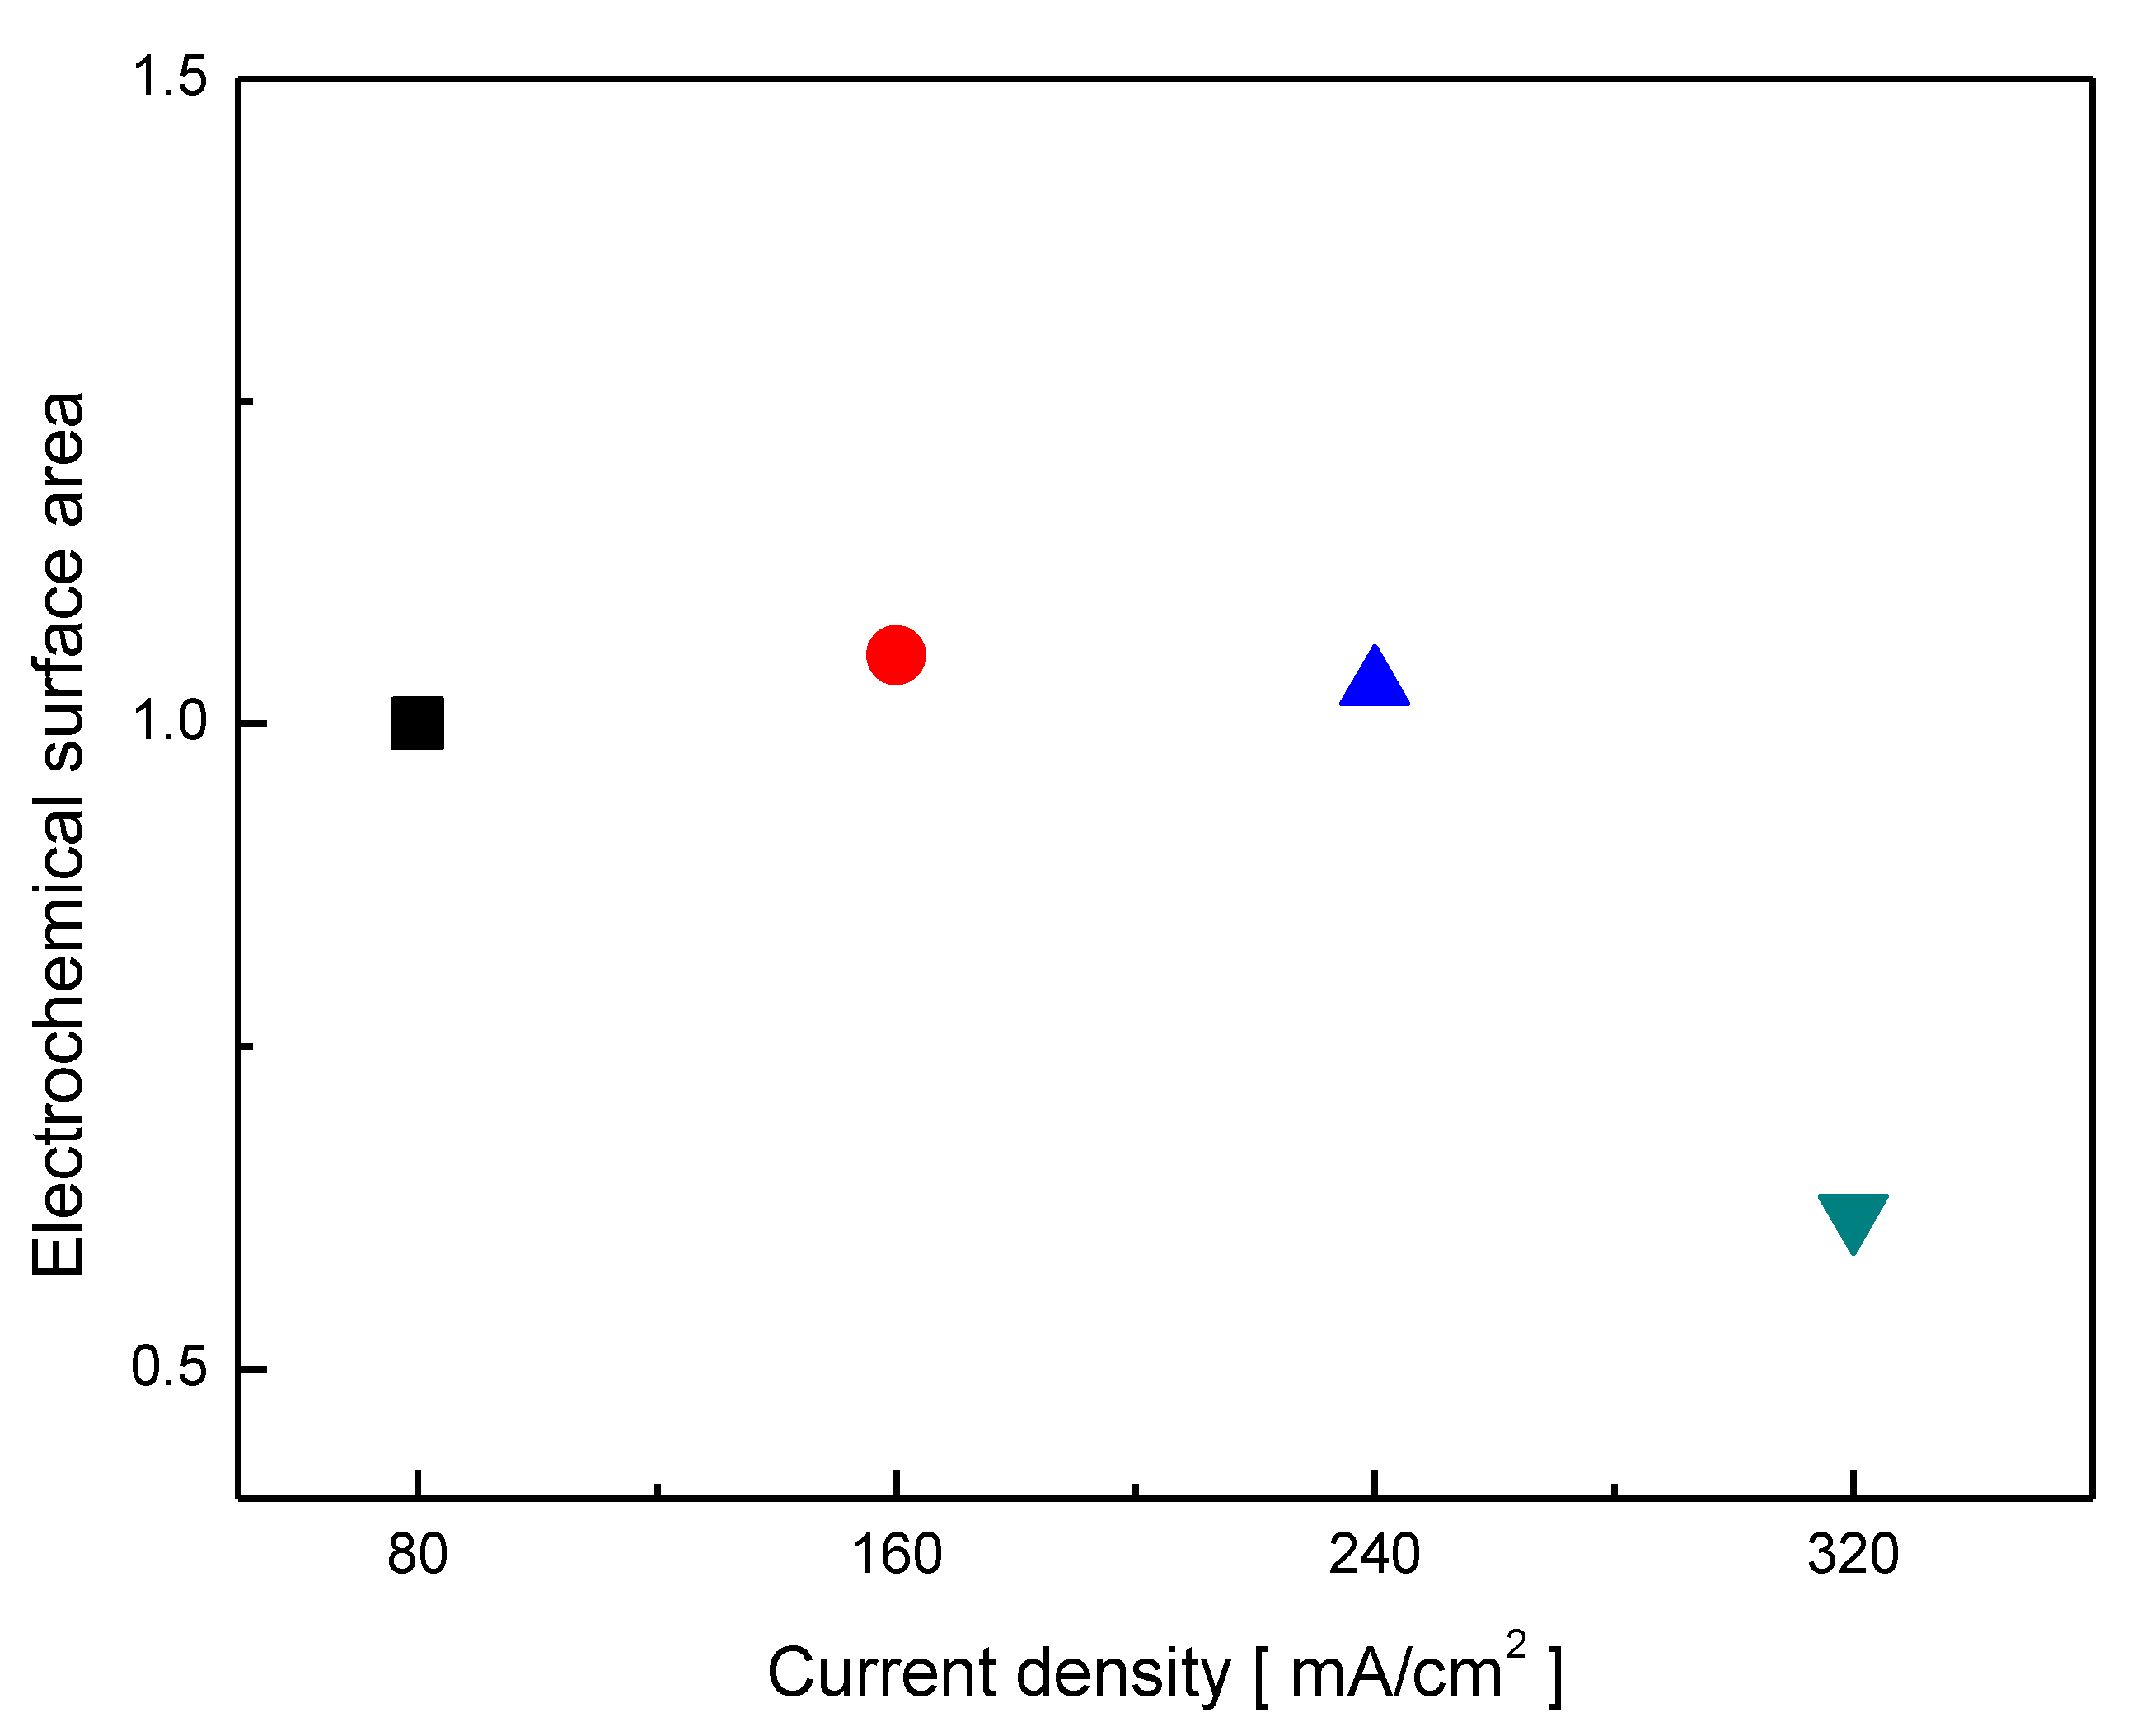
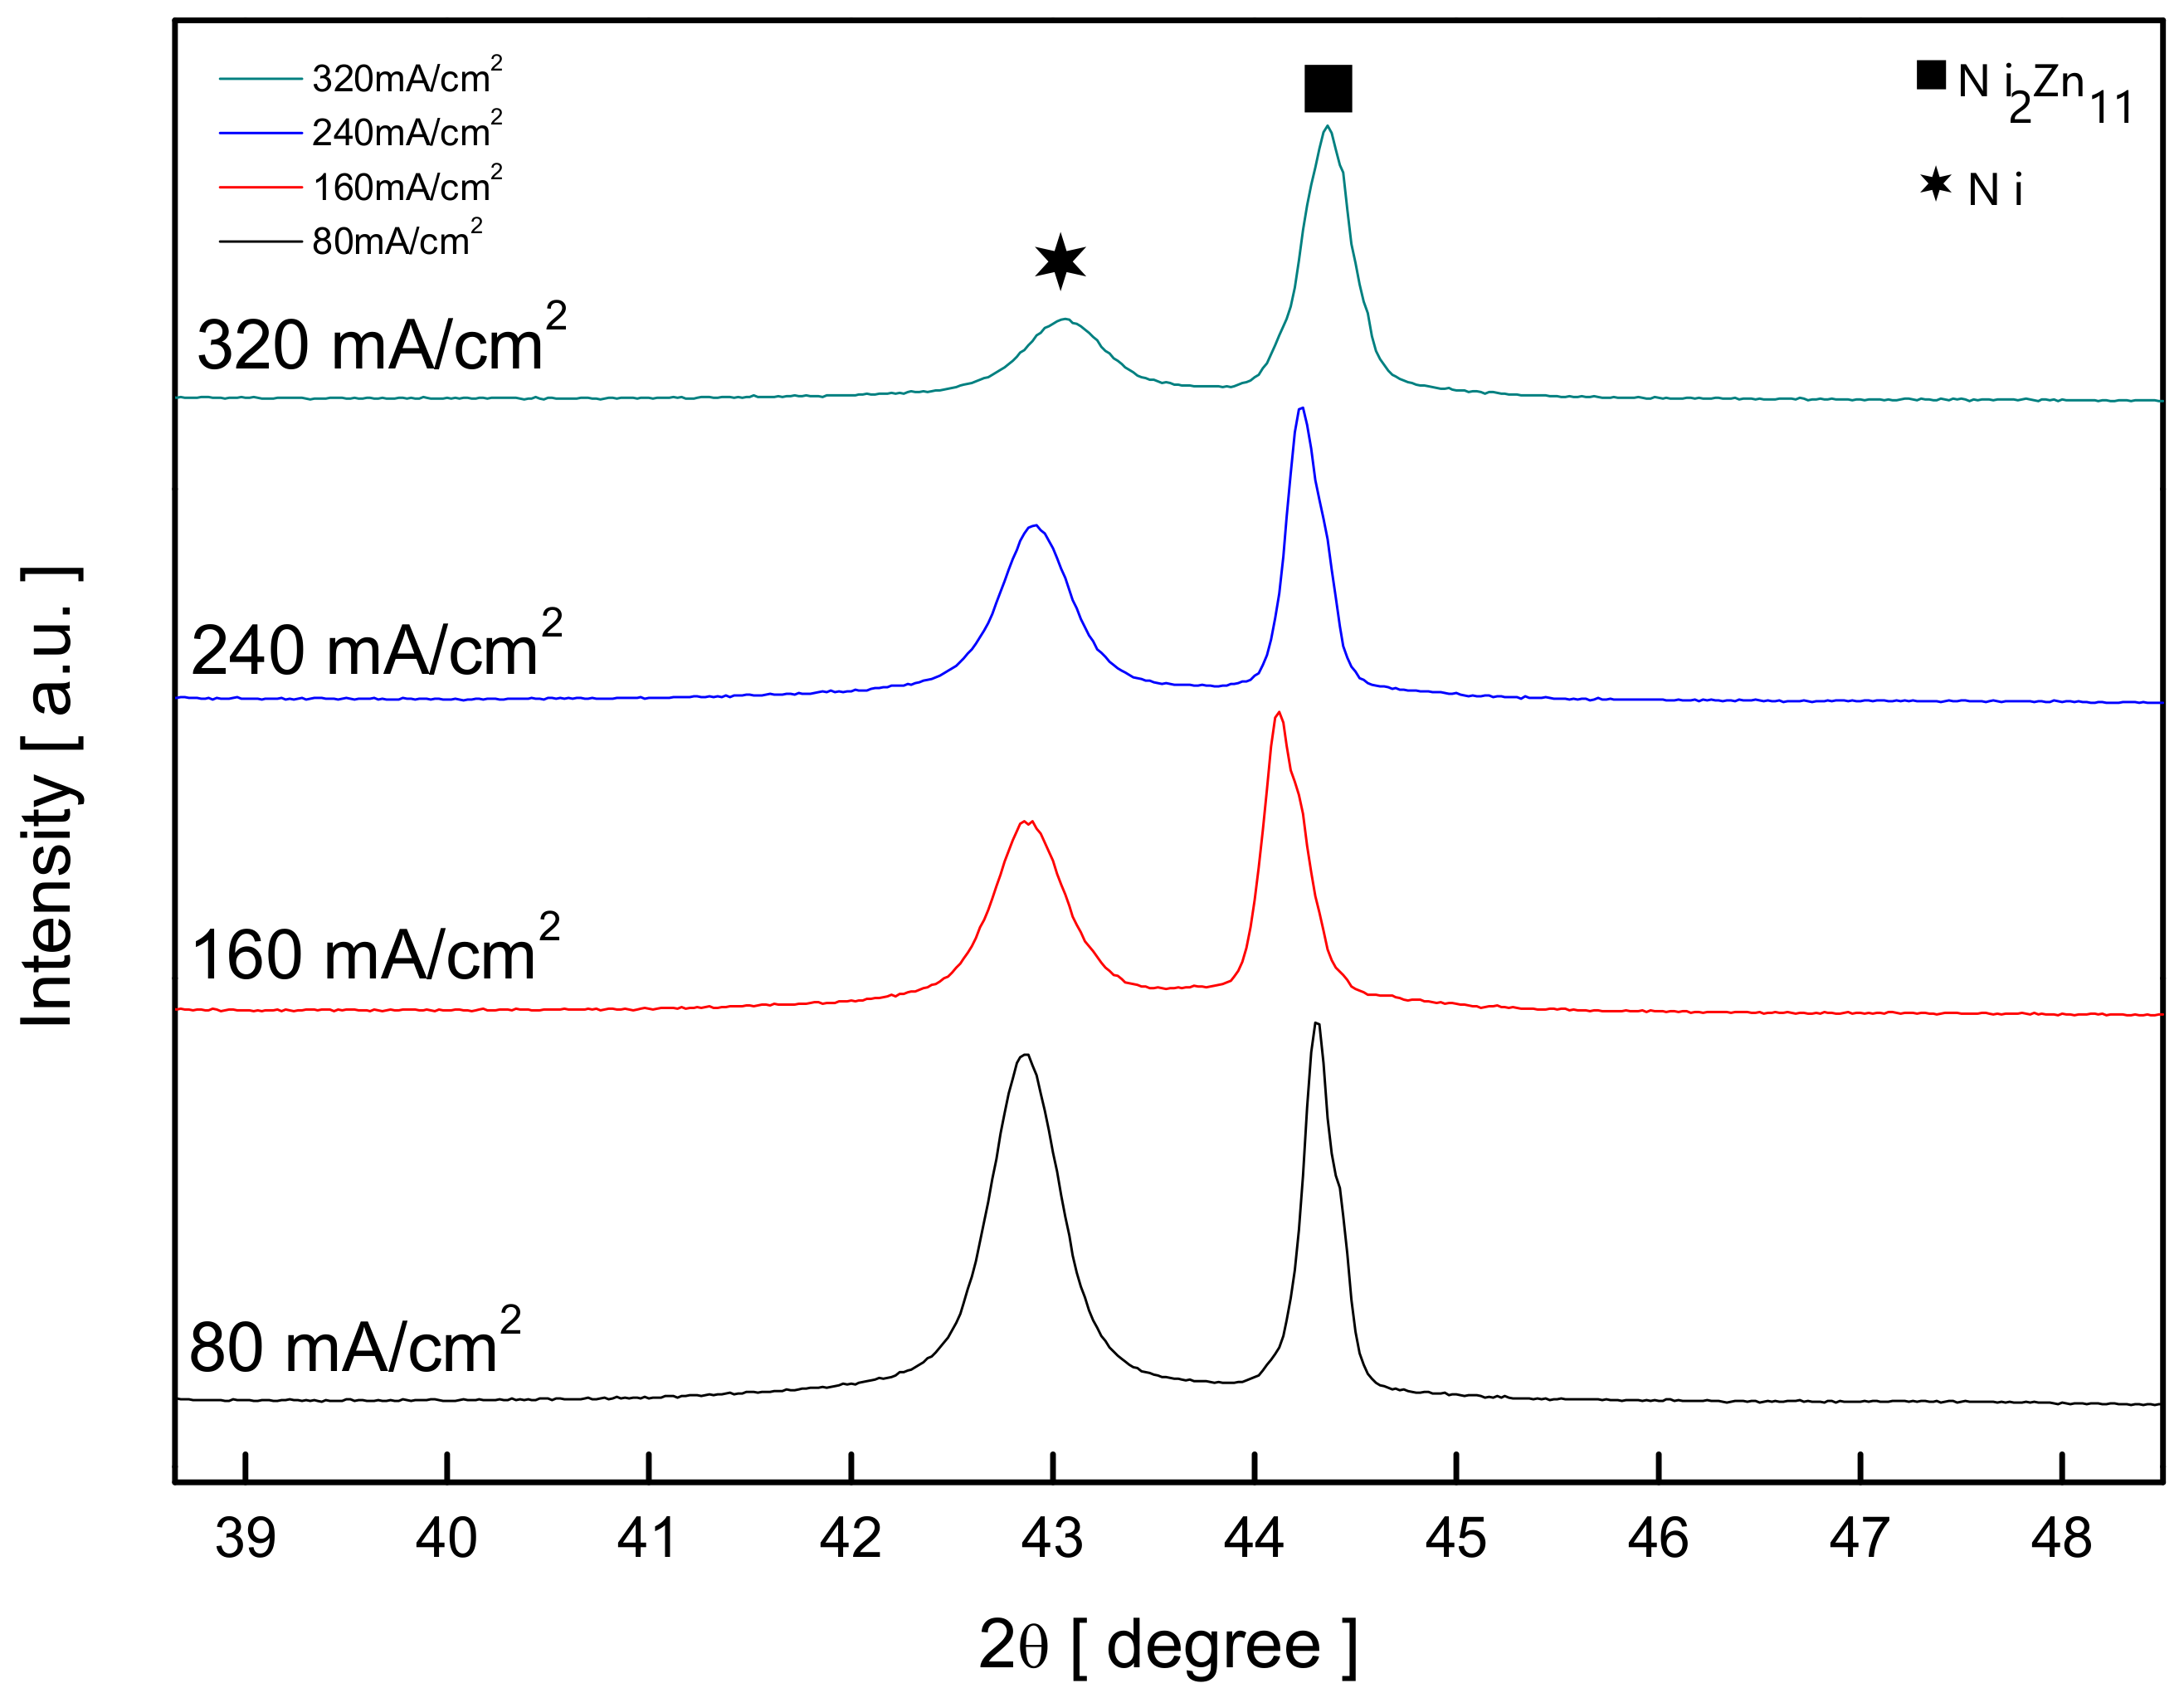
2.1. Effects of Plating Current Density

An electrode was prepared by varying the plating current density at a constant electric charge ( 678.24   ). Figure 1 shows the electrode surface images taken before (Figure 1a–d) and after dealloying (Figure 1e–h) in plating bath E at different plating current densities. As shown across Figure 1a–d, an increase in the plating current density changes the surface morphology. At the plating current density of >160 mA/cm2, a cauliflower-like structure was found on the deposited electrode that had not been observed at 80 mA/cm2. This structure was formed because the local crystal growth was facilitated by the Ni-ion consumption rate exceeding the Ni ion diffusion rate in the electrolyte with increased plating current density [27]. In addition, a previous study reported that the rate of nucleation increased with the plating current density and formed finer particle size, indicating an inverse proportional relationship between particle size and plating current density [28]. This study observed a decrease in particle size and a cauliflower-like morphology as the plating current density increased. The observation is consistent with the previous study. A crack structure was also observed on the electrode surface after Zn dealloying (Figure 1e–h).
Figure 2 shows the crystallite size calculated based on the XRD pattern of the electrode prepared in accordance with the variation of plating current density. The calculation applied the Scherrer Equation (1) and the measured half-width of the XRD peak.
t = K × λ B × cos θ B
In Equation (1), t is the crystallite size, K is the dimensionless shape factor (0.9), λ is the X-ray wavelength (0.154 nm), B is the full width at half maximum, and θB is the Bragg’s angle. The crystallite size was calculated for the Ni(111) plane. The electrode crystallite size measured before Zn dealloying (Figure 2a) showed that the crystallite size decreased from 65 to 35 nm as the plating current density increased from 80 to 320 mA/cm2. This reflects the impact of the cauliflower morphology produced through the local crystal growth, as shown in Figure 1, and agrees with the findings of Rashidi et al., who reported a correlation between plating current density and crystallite size change [28].
However, after Zn dealloying (Figure 2b), the Ni crystallite size of the electrode resulted in constant regardless of current density. This is presumed to be due to Ni recrystallization in the Ni–Zn alloy during Zn dealloying that decreased the overall crystallite size.
To compare the OER activity of the electrodes prepared in this study according to the plating current density, the LSV was applied, and the result is presented in Figure 3 and Figure S1. The overpotential at 100 mA/cm2 current density and Tafel slope are presented in Table 1. As shown, the overpotential decreased as the plating current density increased up to 160 mA/cm2, which enhanced the OER activity. Numerous previous studies suggested the Equations (2)–(6) to describe the mechanism of the OER at the electrode under the alkaline condition [29,30,31,32]. The mechanism mostly involves an intermediate such as MOH or OH and two ways of oxygen formation from the MO intermediate. One is the direct binding of 2MO and the other is the formation of the MOOH intermediate to precede oxygen formation. The Tafel slope of 26–33 mV/dec, which means the chemical O–O coupling stage after the electron transfer (3) is the rate-determining step of the OER, similar to the Tafel stage of the HER. In general, a lower Tafel slope means faster kinetics in the OER. The Tafel slope of the Ni–Zn–Fe electrode was lower than that of the Ni–Zn catalyst (73 mV/dec) [33]. According to Hai Xiao et al., O radical stabilization mediated by Fe during the OER over the Ni–Fe catalysts was reported to have a critical role in O–O coupling to further reduce the Tafel slope [34].
OH + M → MOH + e
OH + MOH → MO + H2O(l) + e
2MO → 2M + O2(g)
OH + MO → MOOH + e
OH + MOOH → M + O2(g) + H2O(l) + e
To identify the reason for the difference in activity in terms of the plating current density, the contents of Ni and Fe on the deposited electrode surface were analyzed by EDS, and the results are shown in Figure 4. The Fe content before Zn dealloying increased until the plating current density reached 160 mA/cm2. However, when the current density was increased from 160 mA/cm2 to 240 and 320 mA/cm2, an unexpected decrease in Fe content was observed. The hydrogen produced at the cathode during electrodeposition increases the pH of the electrolyte close to the cathode surface, which results in the generation of Zn(OH)2, Ni(OH)2, and Fe(OH)2. As the reduction potential of Zn(OH)2 is lower than that of both Ni(OH)2 and Fe(OH)2, the Zn deposition preferentially occurs, leading to underpotential deposition.
Therefore, it is possible that the increase in plating current density could cause a relative decrease in Fe content on the electrode surface [35]. After Zn dealloying, a trend of proportional relationship was found between the change in Fe content on the electrode surface (Figure S2) and the OER activity in Figure 3. According to Corrigan et al., Fe increase the OER activity by improving the conductivity of NiOOH [20]. Stevens et al. reported that an approximately 150-fold increase in OER activity was due to the electron properties, reduction potential, and redox peak size and shape of the Fe–NiOxHy electrode prepared by adding 10% Fe to the NiOxHy electrode [36]. Louie et al. reported that the OER activity varied according to the Fe content of the Ni–Fe film and the presence of Fe affects the average oxidation state of Ni, the OER activity was the highest at approximately 40 at.% Fe content [19]. These studies highlighted the importance of Fe content in the Ni-based electrodes and indicated that the Ni:Fe ratio plays a key role in OER. The electrode surface composition is influenced by various factors such as the precursor type, production methods, and conditions. Hence, many studies have been conducted on developing electrodes that have an optimal level of Fe content [37]. In this study, the highest OER activity was obtained at approximately 40 at.% Fe content and 160 mA/cm2 plating current density.
To identify the factors that influence the OER activity other than the surface composition of the deposited electrode, the ECSA of the electrode after Zn dealloying was measured with respect to the plating current density. CV method was applied to estimate the ECSA, and the obtained values (Figures S3 and S4), which is presented in terms of the plating current density as shown in Figure 5. The ECSA was calculated by assigning a value of 1.0 to the ECSA of the deposited electrode, with a plating current density of 80 mA/cm2 as reference.
The ECSA of the plated electrode with plating current densities of 80, 160, and 240 mA/cm2 had similar values. It decreased when the plating current density was 320 mA/cm2. The crystallite size of the prepared electrode decreased as the plating current density increased, but it became similar after dealloying Zn (Figure 2). It infers that the dealloying process influenced the electrode’s surface area and crystallite size, and the Ni, Fe, Zn composition could be the main variable to determine the surface properties of the electrode.
In the electrode surface composition after Zn dealloying (Figure S2), the electrode activity increased as the amount of residual Zn decreased. The correlation between the amount of residual Zn and the ECSA can be seen in Figure 6, which shows the XRD pattern for the electrode according to the change in plating current density before dealloying. The Ni2Zn11 (330) peak was detected at 44.3°, and a shift was observed in accordance with the plating current density. The most shift to lower angle of Ni2Zn11 (330) peak was observed when the plating current density was 160 mA/cm2. Zn2+ was found to have a greater ionic radius than Ni2+; the ionic radius was 0.69 Å for Ni2+ and 0.74 Å for Zn2+. Thus, in the case of Ni–Zn alloy with a higher content of Zn, the peak shift would be toward a lower angle.
Sheela et al. reported that Zn dealloying was inhibited in Ni–Zn alloy electrodes depending on the composition of Ni and Zn [38]. For Ni–Zn alloys with γ and δ phase, which has a relatively high content of Zn, the rate of Zn dealloying is relatively high and leaves a small amount of residual Zn after dealloying. In contrast, for Ni–Zn alloys with a relatively low content of Ni, Zn dissolution during the dealloying process is suppressed, leaving a greater amount of residual Zn on the surface. As the plating current density changed, the particle size, surface morphology and compositions were changed too. Among these changes, the composition determined the dealloying properties, and it affects the ECSA and crystallite size change by recrystallization during the dealloying process. In addition, the Fe content is an important factor in OER.

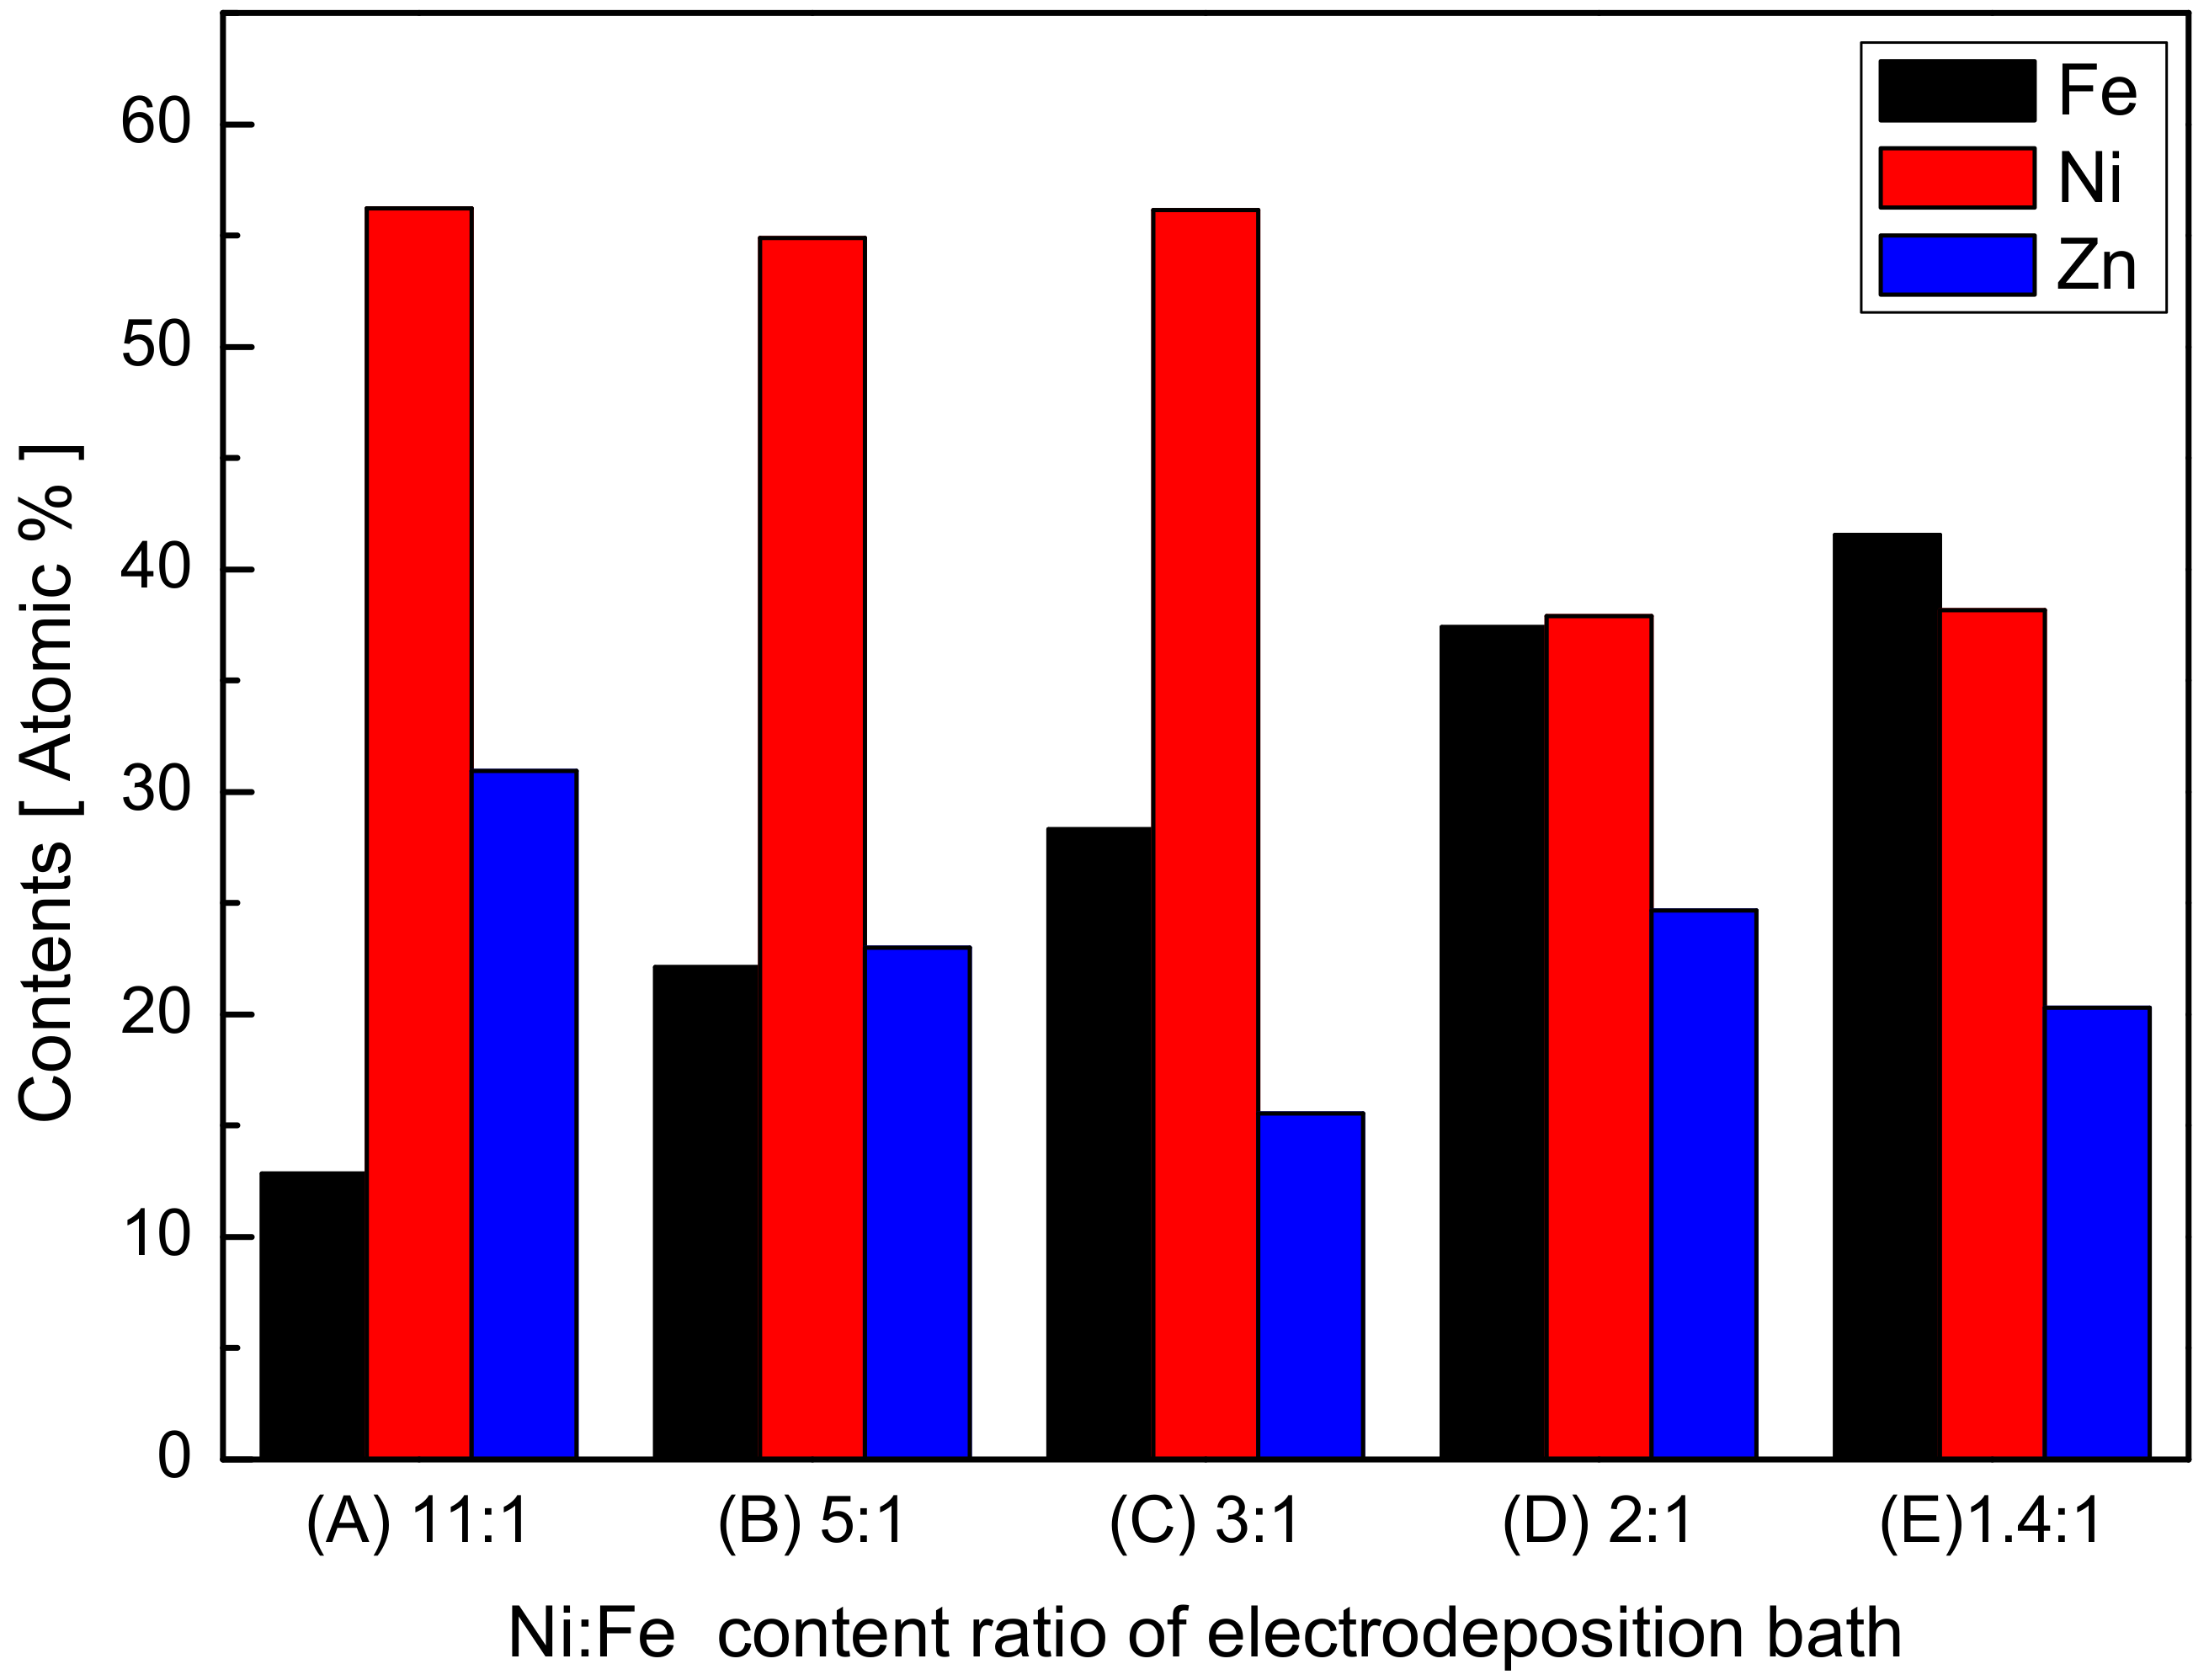
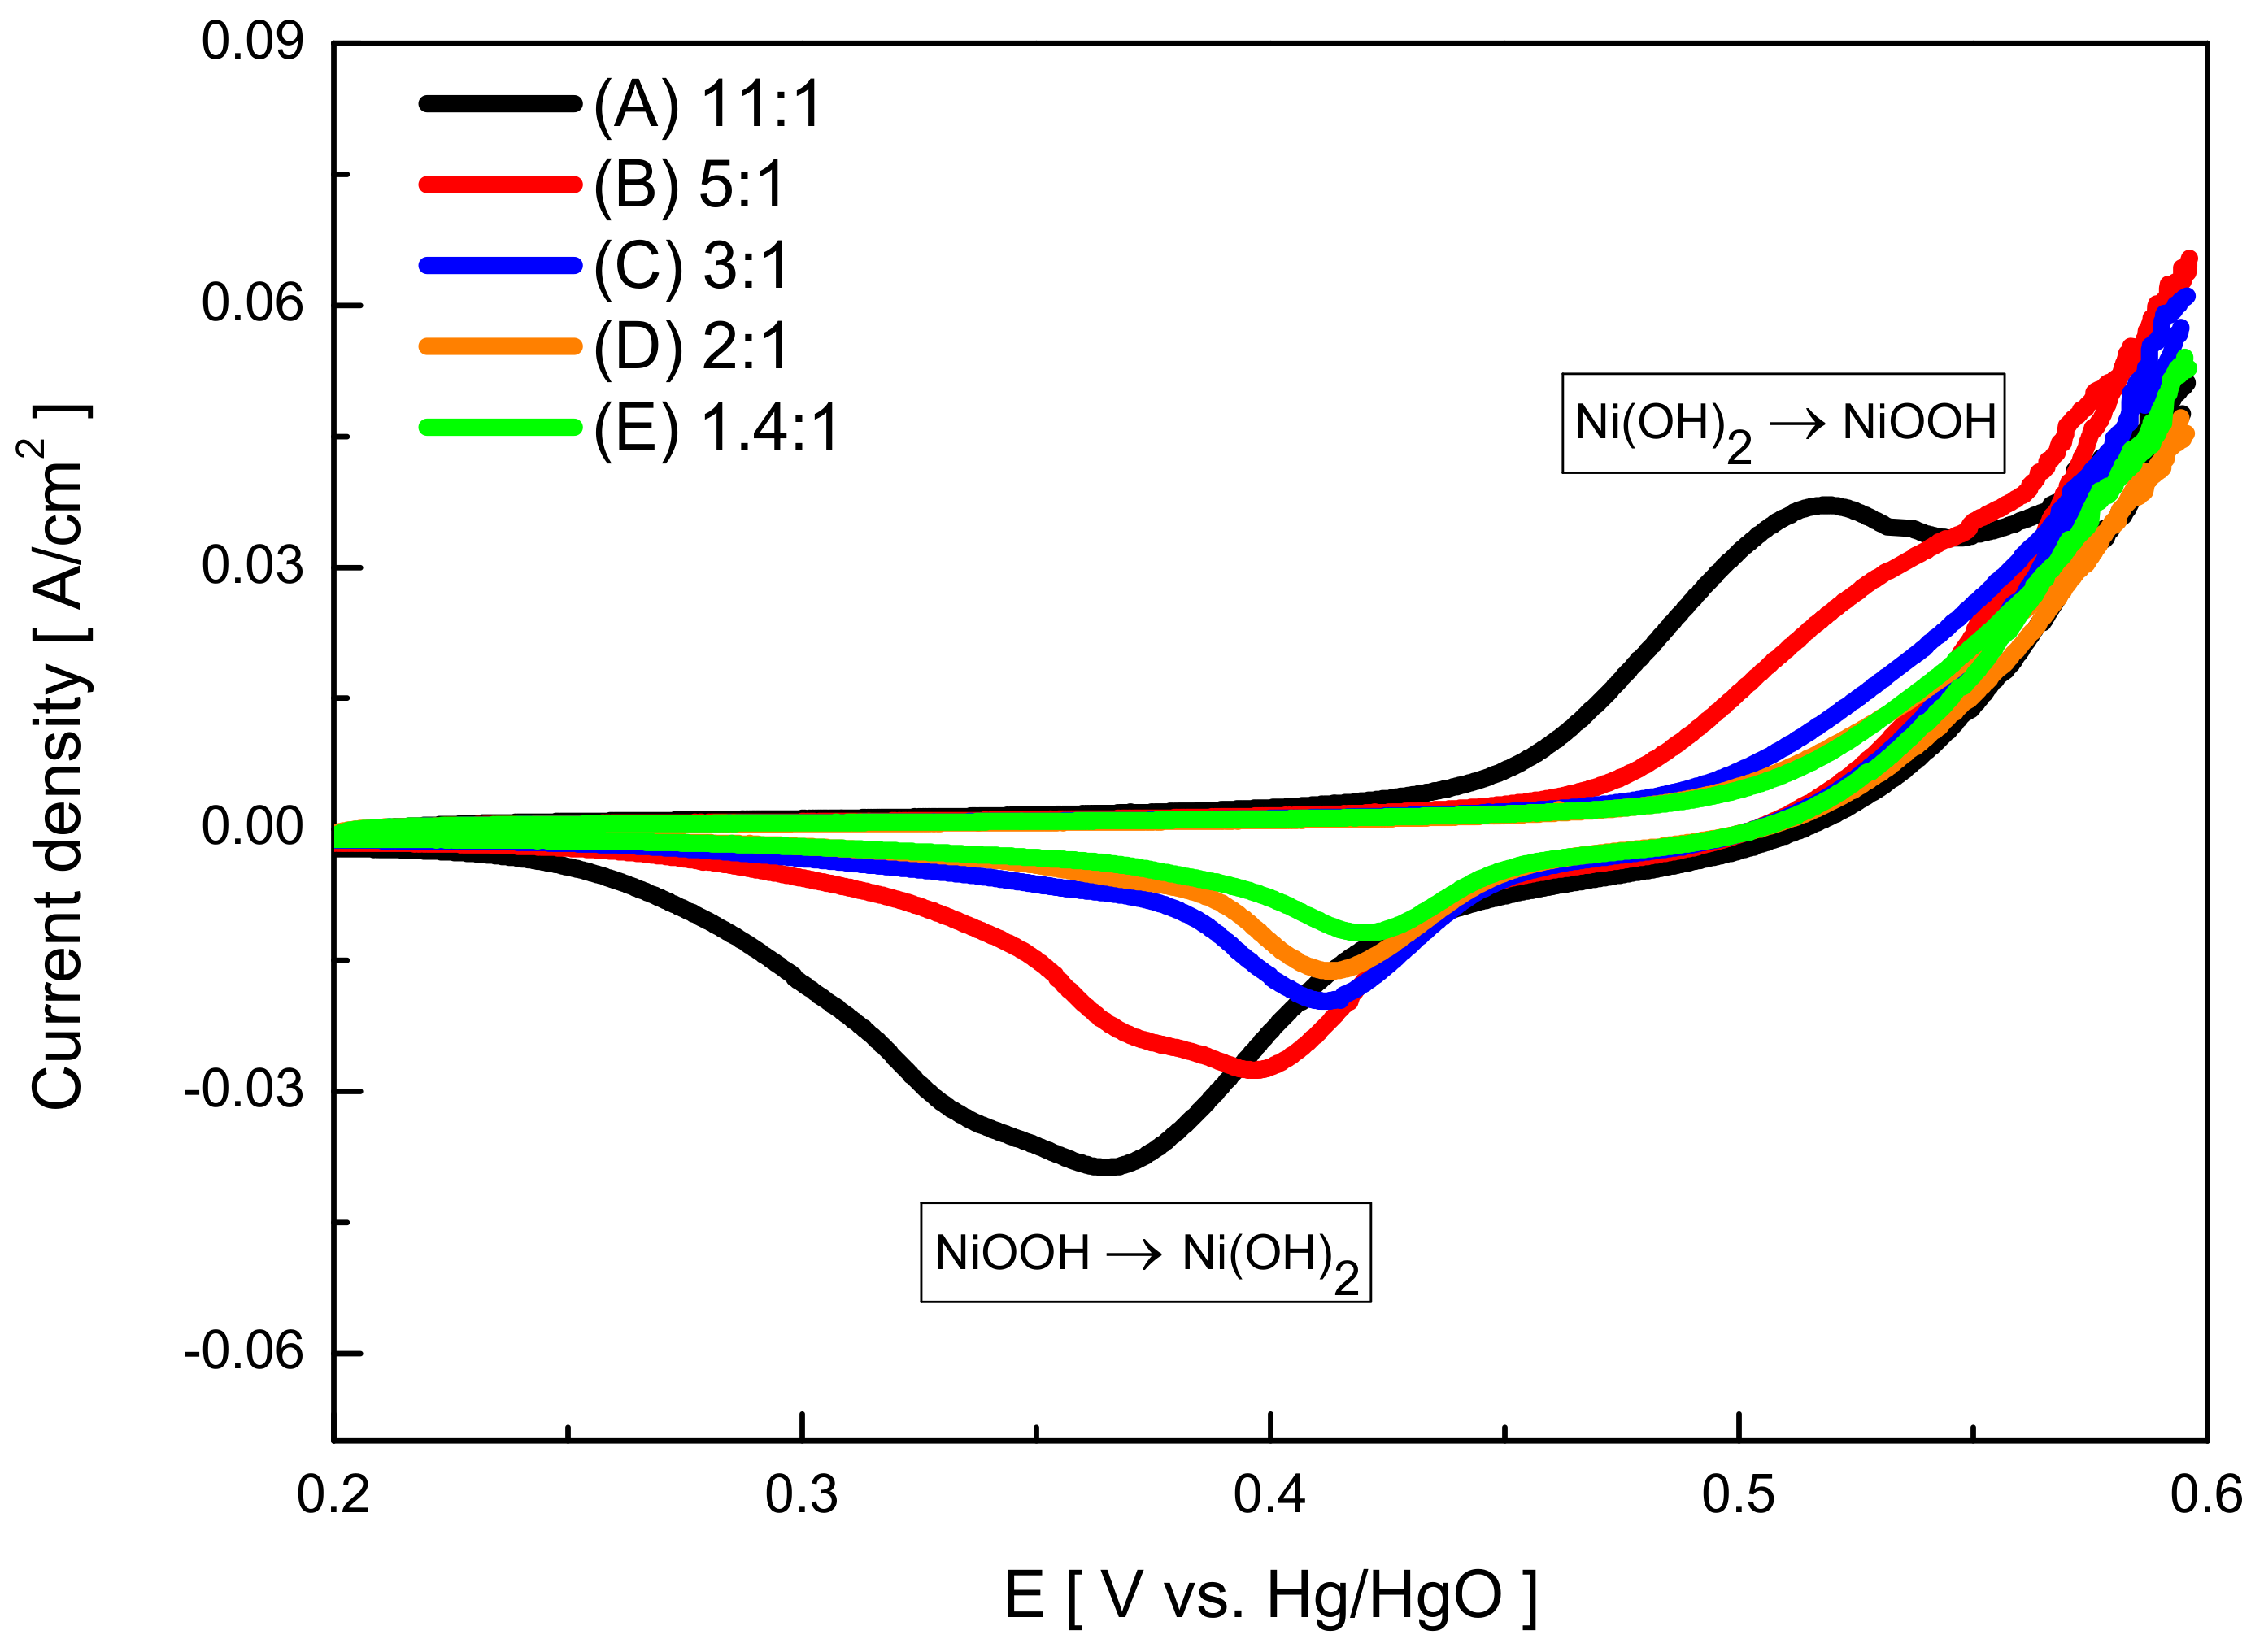
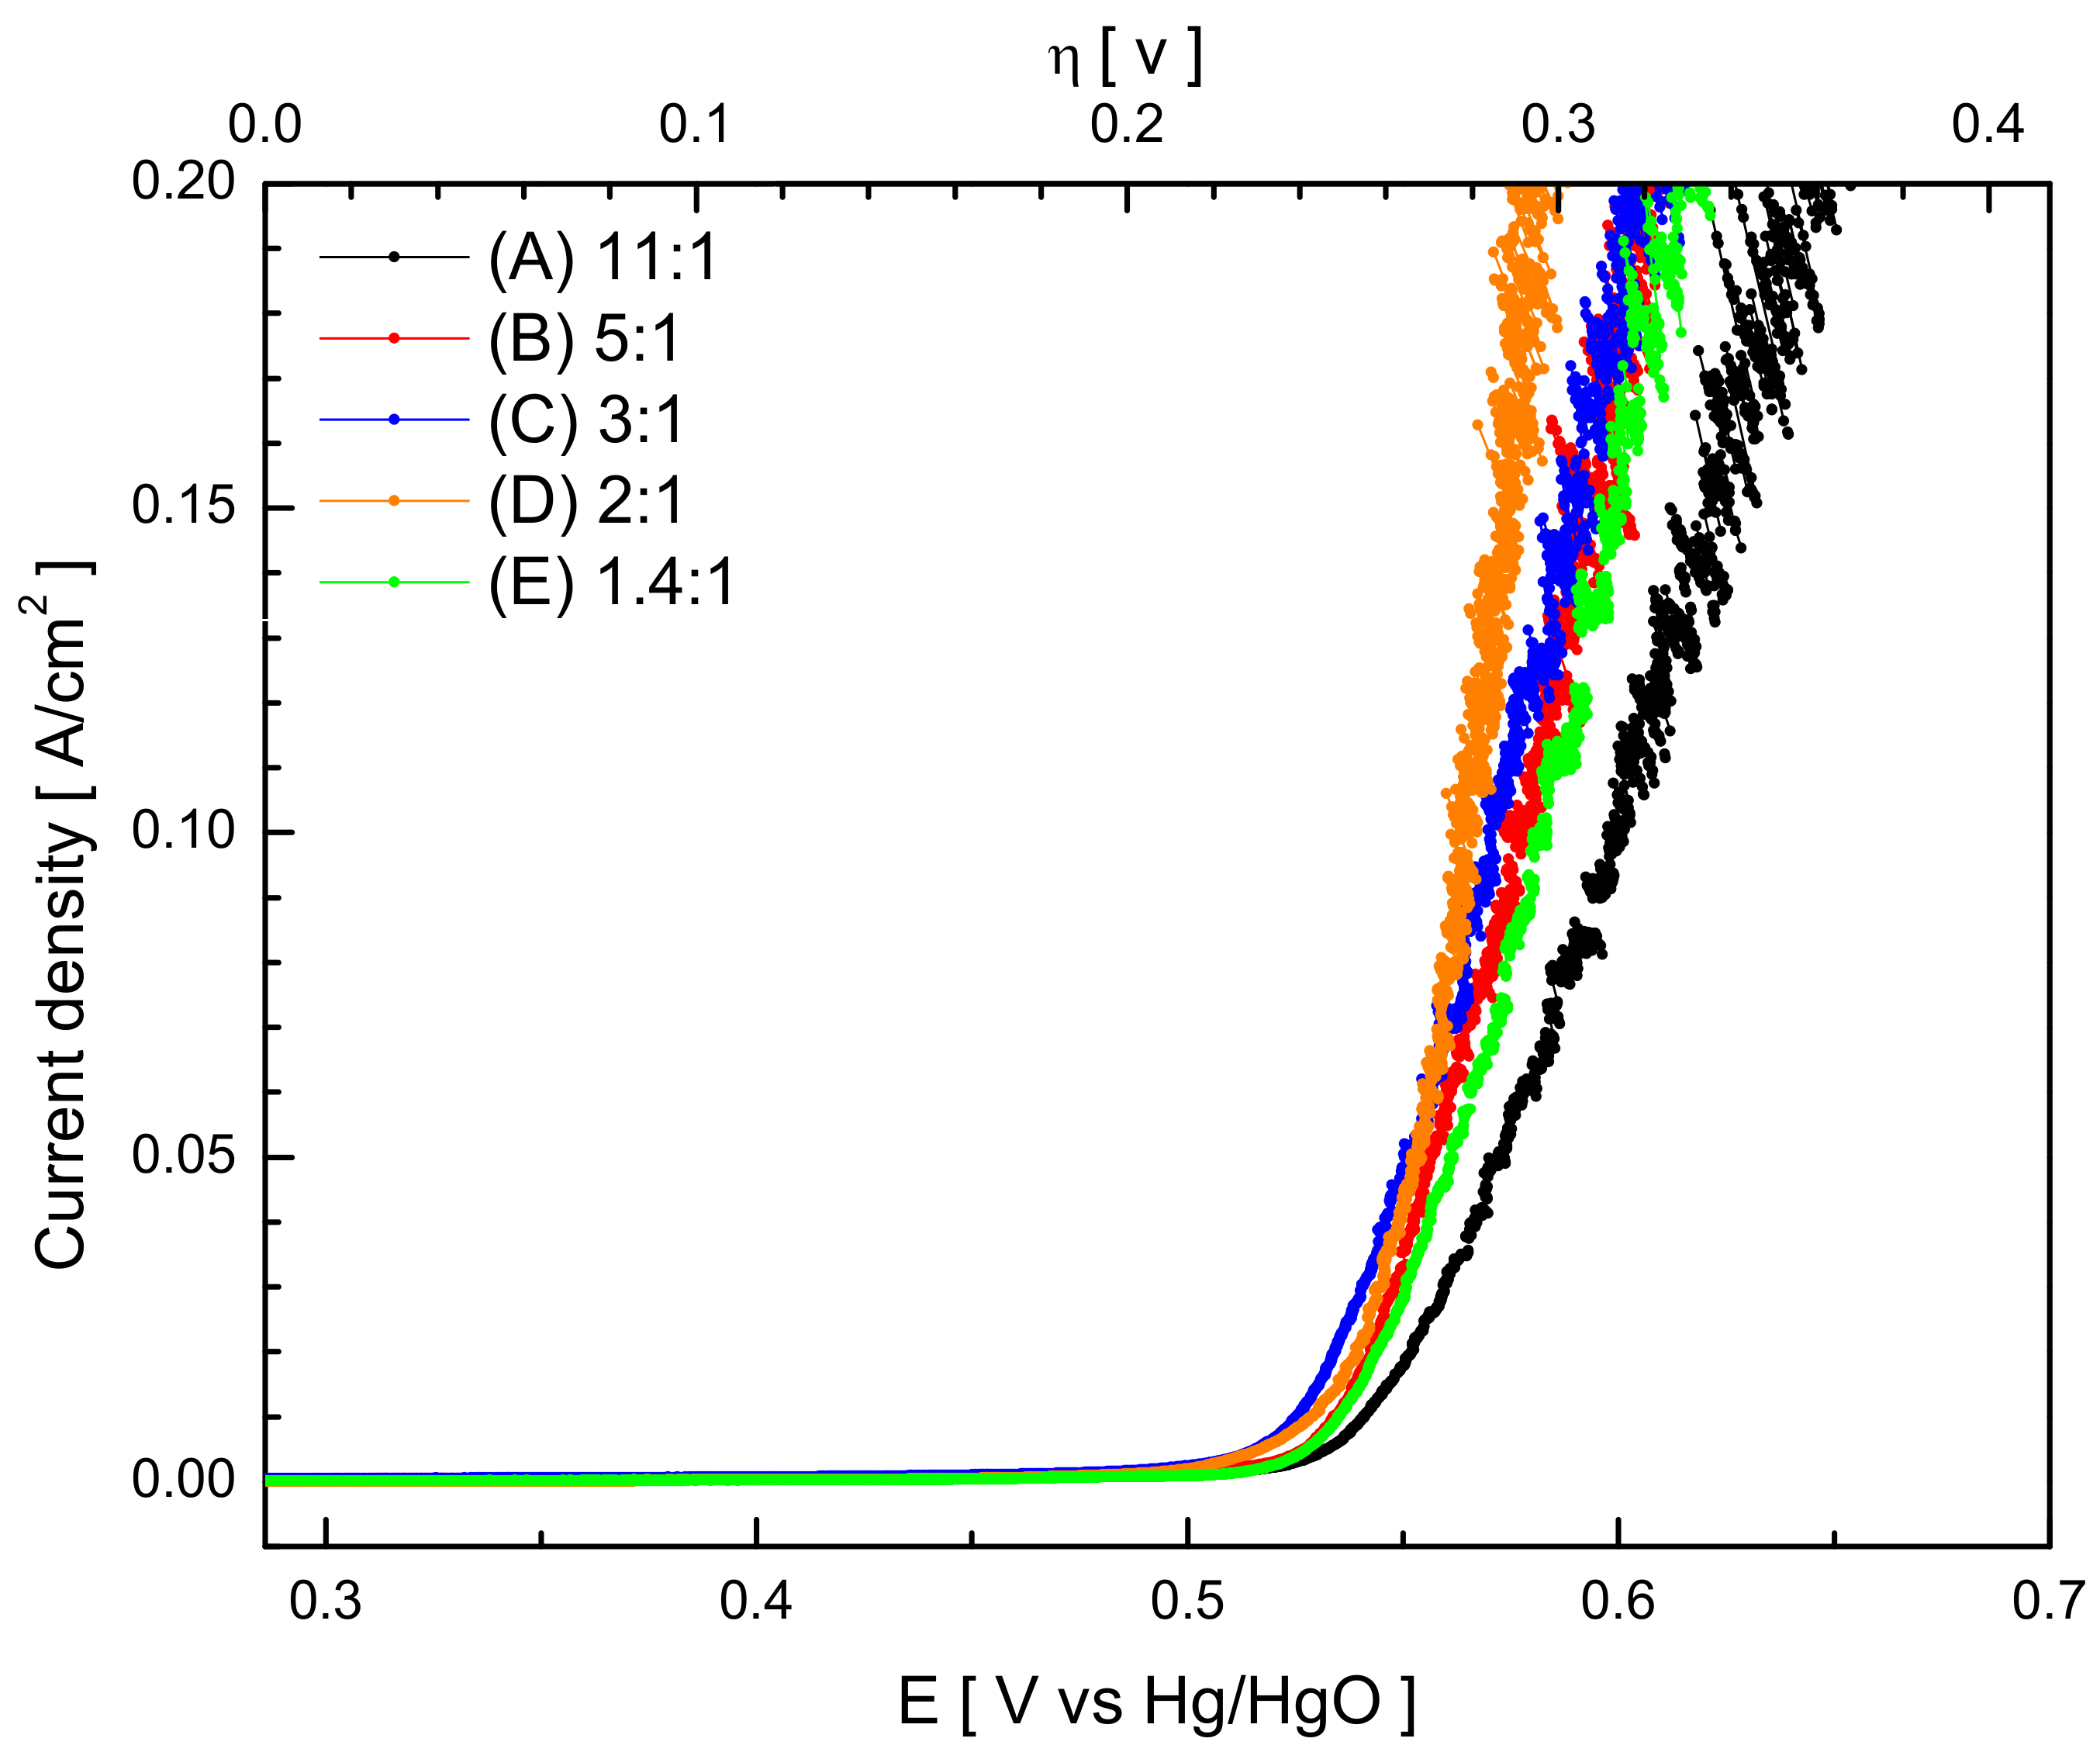
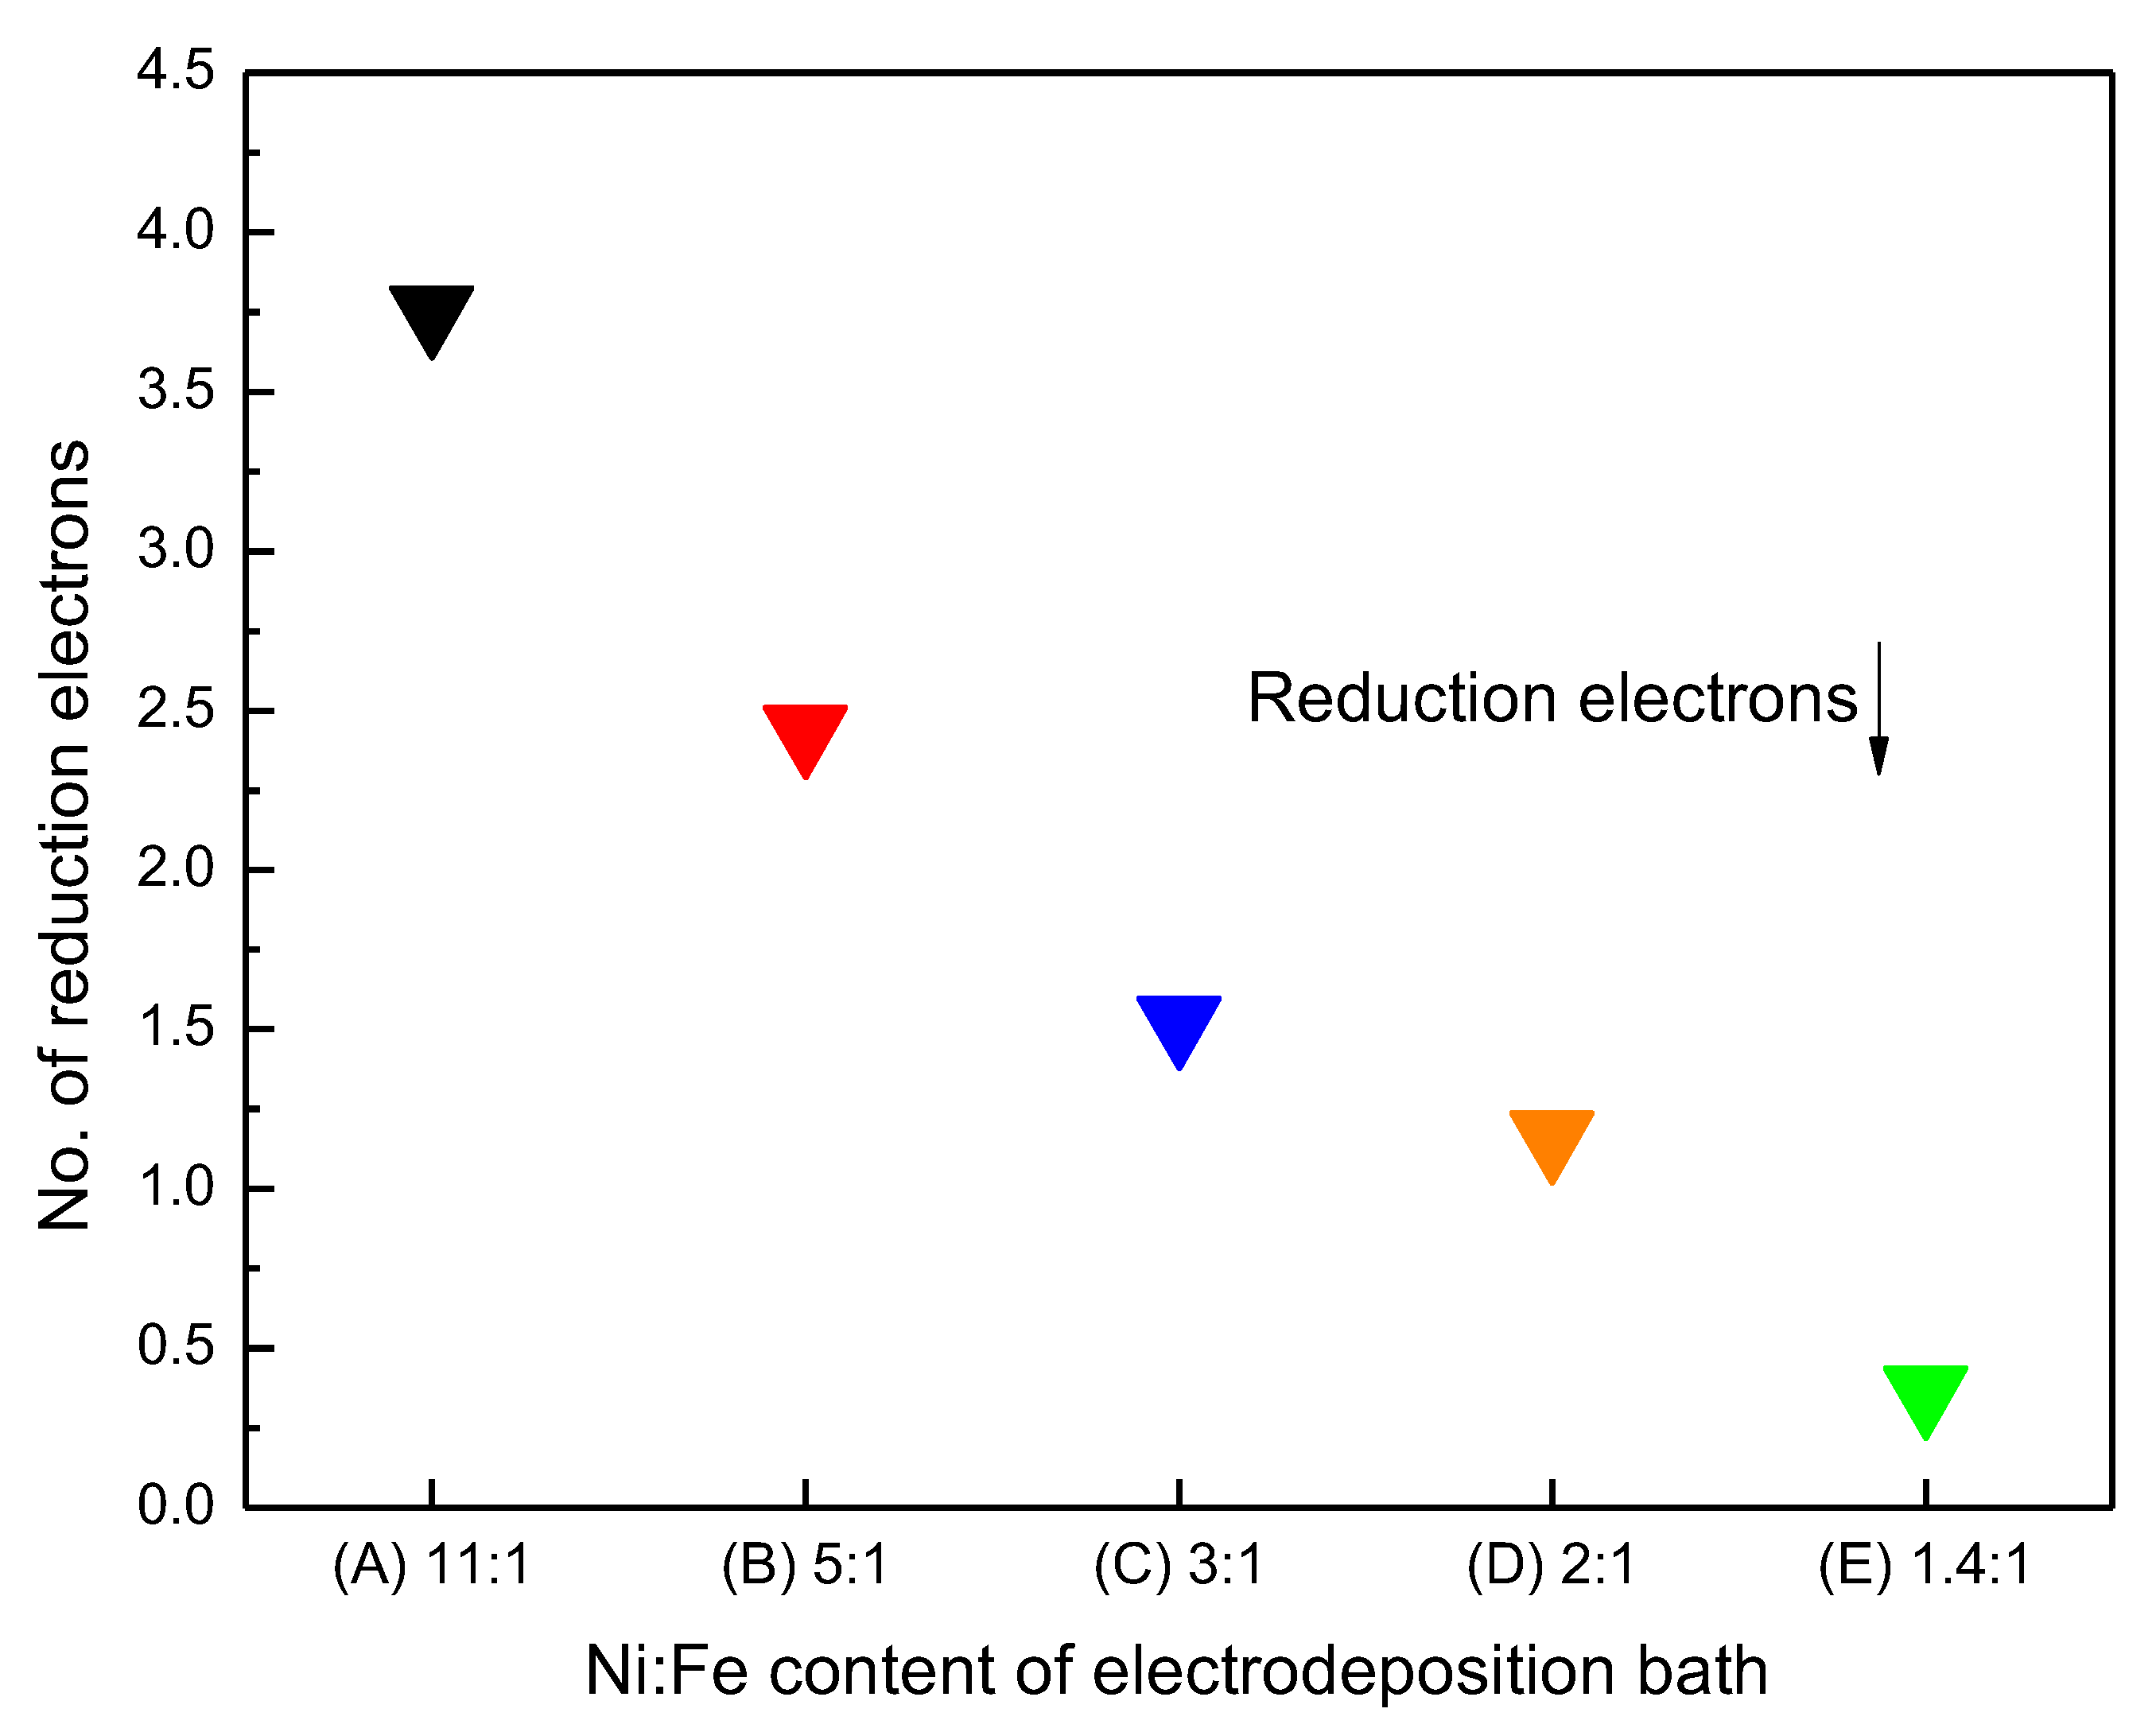
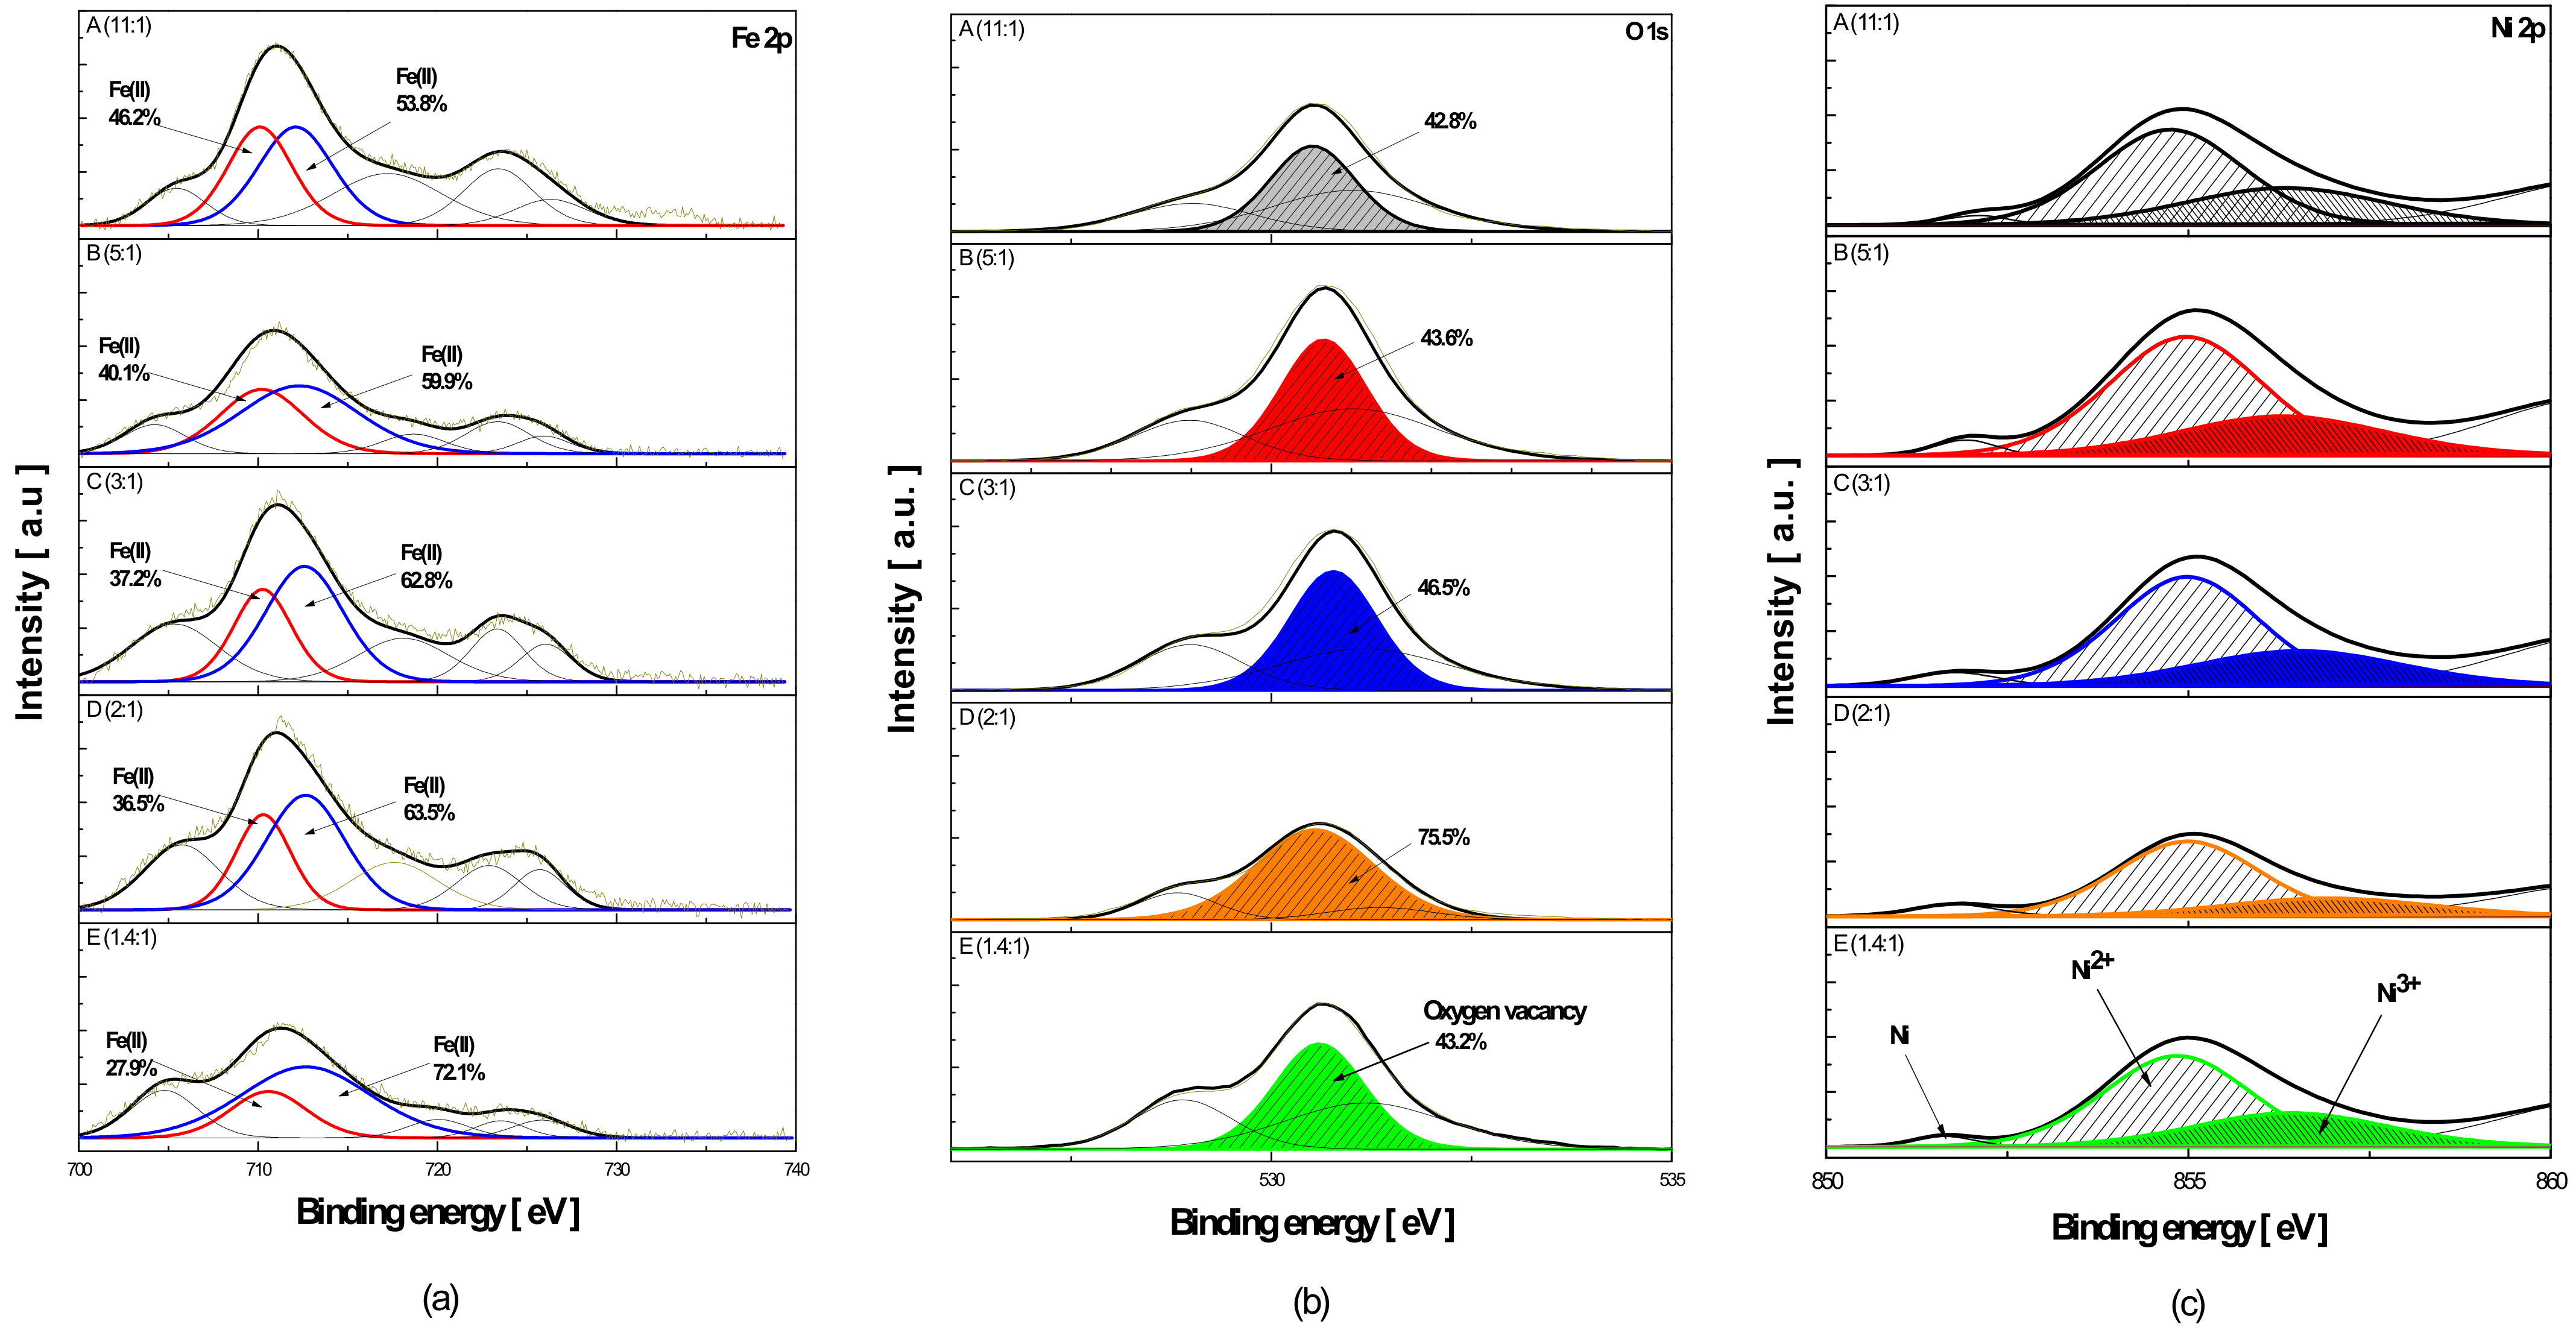
2.2. Characteristics According to the Ni:Fe Ratio in the Plating Bath

As described in Section 3.1, the Ni:Fe ratio of Ni electrode plays a critical role in the OER activity [19,21]. To examine the characteristics of the electrode according to the Ni:Fe ratio, the electrode was prepared by varying the contents of Ni and Fe precursors in the plating bath. When preparing the electrode, the plating current density was applied at 160 mA/cm2, which is the plating condition showing the most outstanding activity in 1. Figure 7 shows a graph of the electrode surface composition measured by EDS with respect to the Ni:Fe ratio after dealloying. In the surface composition of the deposited electrode, the Fe content of the electrode increased as the Fe content in the plating bath increased.
Figure 8 shows the redox peaks of the electrode surface obtained through the CV to identify the redox property change according to the plating bath composition. The oxidation of Ni {Ni(OH)2 → NiOOH} occurs before the OER [19]. The redox peak for Ni was observed only in plating bath A, which had the highest Ni content. The Ni reduction {NiOOH → Ni(OH)2} peak was shown to shift toward higher voltages as the Fe content increased. In a previous study, the redox potential of Ni(OH)2/NiOOH was found to shift toward higher voltages as the Fe content increased [39]. It is therefore presumed that the Ni oxidation peak moved to a higher voltage as Fe content increased, thus overlapping with the OER peak [40].
Figure 9 presents the results of LSV applied to the electrode prepared by varying the Ni:Fe ratio in the plating bath. Table 2 presents the OER overpotential at a current density of 100 mA/cm2. The overpotential decreased as the Fe content in plating bath increased up to Ni:Fe = 2:1(Bath D). It is also known that Fe3+ cations substitute for Ni3+ cations of γ-NiOOH, thereby becoming more active [41]. The results obtained in this study agreed with previous studies that reported an increase in OER activity with an increase in Fe content in the electrode. In plating bath E, the overpotential increased despite having the highest Fe content. When the Fe content increases above a certain ratio, the OER activity unexpectedly decreases. This is because the Fe on the electrode surface is segregated in the form of oxides instead of forming Ni–Fe hydroxide in the Ni–Fe alloy, which reduces the number of active sites [19,42].
Figure 10 shows a graph of the transferred electrons on the electrode surface during the reduction reaction. To obtain the number of electrons that participated in the reaction, the area of the Ni reduction peak in the CV result shown in Figure 8 was calculated using Equation (7).
N o . o f   r e d u c t i o n   e l e c t r o n s = Q p . c
The number of reduction electrons {Q(p,c)} decreases as the Fe content in the plating bath increases. The number of reduction electrons decreases means that the number of Ni active sites decreases, which has a direct influence on the OER. In this study, it is speculated that Fe enhances the OER activity by inhibiting Ni+2 oxidation by substituting Ni in NiOOH and this activity enhancement overcomes the decrease of active sites at a certain point (plating bath E). Over that particular point, Fe substitution does not occur, and Fe segregation is considered to have occurred.
To identify the chemical state, XPS was performed. Figure 11 shows the XPS spectra of the Fe 2p, Ni 2p, and O 1s for the electrode after the OER. Fe 2p spectra were deconvolved into peaks of Fe2+ and Fe3+. Ni 2p spectra were deconvolved into peaks of Ni0, Ni2+, and Ni3+. The O 1s was deconvolved into peaks of metal-oxygen, oxygen vacancies, and hydroxyl species. Table 3 presents the Ni2+/Ni3+ peak area ratio, oxygen vacancy peak area percentage, and Fe3+ peak area percentage obtained from the XPS spectra. The Ni2+/Ni3+ peak area ratio increase as the Fe content on the electrode surface increases after OER. This agrees well with the result of CV (Figure 8), which described the role of Fe in inhibiting Ni oxidation.
The oxygen vacancy showed a similar trend to the Ni2+/Ni3+ peak area ratio. The oxygen vacancy is known to enhanced Ni3+ reduction to Ni2+ after OER reaction and reduce the energy required for H2O adsorption and thus enhance the OER activity [43,44,45]. As a result, the increase in Fe content led to an increase in the number of oxygen vacancies and a reduction in the OER overpotential.
As shown in Table 3, the peak area percentage of Fe3+ increases as the Fe content in the plating bath increases. While Fe3+ acts as an active site by substituting Ni3+ in γ-NiOOH, and Fe content above a certain level results in an increase in the amount of the inactive γ-FeOOH catalyst, which reduces the OER activity [41]. Therefore, the phenomenon of reduced OER activity in plating bath E with the highest Fe content is considered to be due to the influence of inactive γ-FeOOH.
The Ni–Zn–Fe electrode exhibited the most outstanding OER activity in this study was prepared in plating bath D (Ni:Fe = 2:1) at a plating current density of 160 mA/cm2. A comparison between this electrode and the recently reported transition metal electrodes in terms of OER activity is presented in Table 4, where the overpotential is varied at a current density of 100 mA/cm2. Compared to the transition metal electrodes in previous studies, the Ni–Zn–Fe electrode in this study showed excellent OER activity.

3. Experimental Procedures

3.1. Electrode Preparation

3.1.1. Pre-Treatment

To remove oil and oxidized layers from the Ni-foam surface used as the substrate for electrodeposition, the foam was treated with 30 wt.% NaOH (97.0%, Junsei, Tokyo, Japan) at 90 °C for 1 min and immersed in HCl (20.0%, Daejung, siheung, Korea) at 25 °C for 1 min. Next, 70 wt.% H2SO4 (Daejung, siheung, Korea) was used, and the current density of 108 mA/cm2 was applied for 3 min to remove NiO from the Ni-foam surface. The Strike process is a method to promote surface activation through thin Ni plating. In this method, an electrolyte containing a mixture of NiCl2·6H2O (97.0%, Junsei, Tokyo, Japan) and HCl (35.0 wt%, Samchun Chemicals, Seoul, Korea) was used at a current density of −26.8 mA/cm2 for 5 min. The Ni-foam substrate was rinsed with distilled water at the end of each step.

3.1.2. Electroplating

Table 5 lists the composition of the five plating baths (A–E) used in this study; each bath has different Ni:Fe ratios. The deposition was carried out in a two-electrode system at 50 °C with Ni as the counter electrode. The plating current density was applied at 80, 160, 240, and 320 mA/cm2. For electrodeposition, the potentiostat/galvanostat/impedance analyzer (ZIVE SP2, WONATECH, Seoul, Korea) was used.

3.1.3. Zn Dealloying

The electrode prepared through electrodeposition was immersed in 30 wt.% KOH (95.0%, Samchun Chemicals, Seoul, Korea) and 10 wt.% potassium sodium tartrate tetrahydrate (99%, Alfa Aesar, MA, USA) at 80 °C for 24 h. This led to selective Zn dealloying on the electrode surface, whereby Raney Ni with a large electrode surface area was prepared. After Zn dealloying, the electrode was washed with distilled water and dried in a decompression chamber in an atmosphere comprising N2-based mixed gas at 1.6 vol.% O2 for stabilization.

3.2. Physicochemical Analysis

Energy dispersive spectroscopy (EDS; X-MAX 50, HORIBA, Tokyo, Japan) was conducted to identify the deposited components on the electrode surface. Scanning electron microscopy (SEM; S-4800, HITACHI, Tokyo, Japan) was performed to analyze the surface structure and shape. X-ray diffraction (XRD; DMAX-2500PC, Rigaku, Tokyo, Japan) analysis was carried out to evaluate the electrode surface structure under the following conditions: CuK (λ = 1.5056 Å) radiant energy at 2θ: 10°–90°, voltage: 40 kV, and current: 150 mA. To examine the redox state of the electrode surface, X-ray photoelectron spectrometry (XPS; Thermo scientific, K-alpha+, MA, USA) was conducted, and the binding energy was adjusted in reference to the C1s peak at 248.5 eV.

3.3. Electrochemical Analysis

A three-electrode system consisting of the working electrode, counter electrode, and reference electrode was used to analyze the electrochemical properties. A potentiostat/galvanostat/impedance analyzer (ZIVE SP2, WONATECH, Seoul, Korea) was used for measurements. It was performed in 1M KOH (Daejung, siheung, Korea) and Ni plate was used as the counter electrode. The reference electrode was Hg/HgO (0.115 V vs. SHE, XR 400, Radiometer Analytical, Lyon, France).
To examine the OER activity at the electrodes, linear sweep voltammetry (LSV) was conducted; the sweep of voltage was set at the rate of 0.1 mV/s and 0.2–1.0 V (vs. Hg/HgO). The measurements were adjusted for IR drop using the solution resistance for electrochemical impedance spectroscopy (EIS).
To identify the Ni redox peaks based on the Ni:Fe ratio, cyclic voltammetry (CV) was performed for the analysis at 1 mV/s scan rate and 0.2–0.6 V (vs. Hg/HgO).
The electrochemical surface area (ECSA) of the electrode was measured in the electrical double layer region {0.3–0.1 V (vs. Hg/HgO)}. As the ECSA is proportional to the double-layer capacitance (Cdl), a graph was drawn for the changes in current density according to the scan rate and the slope of the current density according to the scan rate was obtained to calculate Cdl.

4. Conclusions

In this study, Ni, Zn, Fe was deposited on Ni-foam substrate to form electrodes that can increase the efficiency of alkaline water electrolysis. The physicochemical and electrochemical properties of the electrode were analyzed to examine the effects of the plating current density and plating bath Ni:Fe ratio on the characteristics of the electrode in the OER.
(1) The electrode surface morphology, as well as the particle size and composition of the electrode catalyst, were shown to change depending on the plating current density. As the plating current density increased, the electrode surface acquired a cauliflower-like shape with a decrease in particle size. Among these changes, the composition determined the dealloying properties, and it affects the ECSA and crystallite size change by recrystallization during the dealloying process. The OER activity increased up to a plating current density of 160 mA/cm2 and decreased at current densities above 240 mA/cm2.
(2) The Fe content of the electrode increased up to approximately 40 at.% at a plating current density of 160 mA/cm2. The increase in Fe content inhibited Ni oxidation by substituting Ni in NiOOH and enhanced the OER. At current densities above 240 mA/cm2, the Fe content decreased as Zn content increased more. Zn content increase is due to the Zn underpotential deposition. Ni–Zn alloy formed at the plating current density of 160 mA/cm2 showed the most Zn-rich phase in XRD results. Zn dealloying reaction occurred more actively in that Zn-rich Ni–Zn alloy; therefore, the residual quantity of Zn was smallest.
(3) To determine the effects of the Ni:Fe ratio in the plating bath, it was observed that the Fe content of the prepared electrode increased as the Fe content of the precursor increased. The OER activity increased with an increase in Fe content of the electrode up to approximately 37 at.%; however, it decreased when the Fe content became approximately 41 at.%. Fe inhibited the oxidation of Ni by shifting its oxidation potential to a more positive value. Fe also served as the active site by substituting Ni3+ in γ-NiOOH. In addition, the higher oxygen vacancy led to a reduction in the H2O adsorption energy, which increased the activity of OER. The activity decreased with an overdose of Fe above 40 at.%, as the γ-FeOOH catalyst known as the inactive phase grew out of it, which reduces the OER activity.
(4) In this study, the current density and bath composition of electrodeposition affected the surface composition of the electrode of Ni–Fe-Zn. The electrodeposited composition of Ni–Fe-Zn affected the composition of the electrode after dealloying and the composition after dealloying is the most important factor in OER activity. Especially, the Fe content of the dealloyed electrode was crucial in OER activity in this study. From the results of this study, we saw that Ni–Fe-Zn composition could be controlled by electrodeposition current density and bath composition. The Fe-content bath composition was proportional to the Fe content on the surface after dealloying at 160 mA/cm2 electrodeposition condition.

Supplementary Materials

The following supporting information can be downloaded at: https://www.mdpi.com/article/10.3390/catal12030346/s1, Figure S1. I-E curves (LSV) of electrodeposited Ni-Zn-Fe on Ni foam prepared with different current densities and bare Ni (Condition: scan rate = 0.1 mV/s, temperature = 25 °C, KOH = 1 M, bath = E).; Figure S2. Composition of electrodeposited Ni Zn–Fe on Ni foam with different current densities after dealloying [atomic %] bath (E).; Figure S3. Plots of scan rates vs. double layer charging current density of the electrodes, electrodeposited with a varying current density of 80, 160, 240, and 320 mA/cm2.; Figure S4. Electrochemical capacitance of the electrodes electrodeposited with different current densities (80, 160, 240, and 320 mA/cm2).

Author Contributions

Conceptualization, S.-h.L., H.J. and K.-s.K.; Data curation, S.-h.L. and K.-s.K.; Funding acquisition, K.-s.K.; Investigation, S.-h.L.; Methodology, K.-s.K.; Project administration, K.-s.K.; Supervision, J.E.K., H.J., C.-s.P., S.-u.J., K.J., Y.-h.K. and K.-s.K.; Validation, H.J. and K.-s.K.; Writing—original draft, S.-h.L.; Writing—review & editing, S.-h.L., H.J., Y.-h.K. and K.-s.K. All authors have read and agreed to the published version of the manuscript.

Funding

This research was funded by the Korea Agency for Infrastructure Technology Advancement(KAIA), grant number 22OHTI-C162271-02.

Data Availability Statement

The data presented in this study are available in article and supplementary material.

Conflicts of Interest

The authors declare no conflict of interest.

References

  1. Zouhri, K.; Lee, S.Y. Evaluation and Optimization of the Alkaline Water Electrolysis Ohmic Polarization: Exergy Study. Int. J. Hydrog. Energy 2016, 41, 7253–7263. [Google Scholar] [CrossRef]
  2. Kim, H.S.; Kim, H.; Flores, M.C.; Jung, G.-S.; In, S.-I. Stable Surface Technology for HER Electrodes. Catalysts 2021, 11, 693. [Google Scholar] [CrossRef]
  3. Schmidt, O.; Gambhir, A.; Staffell, I.; Hawkes, A.; Nelson, J.; Few, S. Future Cost and Performance of Water Electrolysis: An Expert Elicitation Study. Int. J. Hydrog. Energy 2017, 42, 30470–30492. [Google Scholar] [CrossRef]
  4. Veziroğlu, T.N.; Şahin, S.N. 21st Century’s Energy: Hydrogen Energy System. Energy Conv. Manag. 2008, 49, 1820–1831. [Google Scholar] [CrossRef]
  5. Pérez-Viramontes, N.J.; Collins-Martínez, V.H.; Escalante-García, I.L.; Flores-Hernández, J.R.; Galván-Valencia, M.; Durón-Torres, S.M. Ir-Sn-Sb-O Electrocatalyst for Oxygen Evolution Reaction: Physicochemical Characterization and Performance in Water Electrolysis Single Cell with Solid Polymer Electrolyte. Catalysts 2020, 10, 524. [Google Scholar] [CrossRef]
  6. Panda, C.; Menezes, P.W.; Zheng, M.; Orthmann, S.; Driess, M. In Situ Formation of Nanostructured Core–Shell Cu3N–CuO to Promote Alkaline Water Electrolysis. ACS Energy Lett. 2019, 4, 747–754. [Google Scholar] [CrossRef]
  7. He, G.; Zhang, W.; Deng, Y.; Zhong, C.; Hu, W.; Han, X. Engineering Pyrite-Type Bimetallic Ni-Doped CoS2 Nanoneedle Arrays over a Wide Compositional Range for Enhanced Oxygen and Hydrogen Electrocatalysis with Flexible Property. Catalysts 2017, 7, 366. [Google Scholar] [CrossRef] [Green Version]
  8. Koj, M.; Gimpel, T.; Schade, W.; Turek, T. Laser Structured Nickel-Iron Electrodes for Oxygen Evolution in Alkaline Water Electrolysis. Int. J. Hydrog. Energy 2019, 44, 12671–12684. [Google Scholar] [CrossRef]
  9. Santos, D.M.F.; Sequeira, C.A.C.; Figueiredo, J.L. Hydrogen Production by Alkaline Water Electrolysis. Quim. Nova 2013, 36, 1176–1193. [Google Scholar] [CrossRef]
  10. Colli, A.N.; Girault, H.H.; Battistel, A. Non-Precious Electrodes for Practical Alkaline Water Electrolysis. Materials 2019, 12, 1336. [Google Scholar] [CrossRef] [Green Version]
  11. Gong, M.; Dai, H. A Mini Review of NiFe-Based Materials as Highly Active Oxygen Evolution Reaction Electrocatalysts. Nano Res. 2015, 8, 23–39. [Google Scholar] [CrossRef] [Green Version]
  12. Diaz-Morales, O.; Ledezma-Yanez, I.; Koper, M.T.M.; Calle-Vallejo, F. Guidelines for the Rational Design of Ni-Based Double Hydroxide Electrocatalysts for the Oxygen Evolution Reaction. ACS Cat. 2015, 5, 5380–5387. [Google Scholar] [CrossRef]
  13. Yeo, B.S.; Bell, A.T. Enhanced Activity of Gold-Supported Cobalt Oxide for the Electrochemical Evolution of Oxygen. J. Am. Chem. Soc. 2011, 133, 5587–5593. [Google Scholar] [CrossRef] [PubMed]
  14. Rashidi, A.M.; Eivani, A.R.; Amadeh, A. Application of artificial neural networks to predict the grain size of nano-crystalline nickel coatings. Comput. Mater. Sci. 2009, 45, 499–504. [Google Scholar] [CrossRef]
  15. Winand, R. Electrodeposition of Metals and Alloys-New Results and Perspectives. Electrochim. Acta 1994, 39, 1091–1105. [Google Scholar] [CrossRef]
  16. Qu, N.S.; Zhu, D.; Chan, K.C.; Lei, W.N. Pulse Electrodeposition of Nanocrystalline Nickel Using Ultra Narrow Pulse Width and High Peak Current Density. Surf. Coat. Technol. 2003, 168, 123–128. [Google Scholar] [CrossRef]
  17. Rashidi, A.M.; Amadeh, A. The Effect of Current Density on the Grain Size of Electrodeposited Nanocrystalline Nickel Coatings. Surf. Coat. Technol. 2008, 202, 3772–3776. [Google Scholar] [CrossRef]
  18. Fabbri, E.; Habereder, A.; Waltar, K.; Kötz, R.; Schmidt, T.J. Developments and Perspectives of Oxide-Based Catalysts for the Oxygen Evolution Reaction. Catal. Sci. Technol. 2014, 4, 3800–3821. [Google Scholar] [CrossRef] [Green Version]
  19. Louie, M.W.; Bell, A.T. An Investigation of Thin-Film Ni−Fe Oxide Catalysts for the Electrochemical Evolution of Oxygen. J. Am. Chem. Soc. 2013, 135, 12329–12337. [Google Scholar] [CrossRef] [Green Version]
  20. Corrigan, D.A. The Catalysis of the Oxygen Evolution Reaction by Iron Impurities in Thin Film Nickel Oxide Electrodes. J. Electrochem. Soc. 1987, 134, 377–384. [Google Scholar] [CrossRef]
  21. Görlin, M.; Chernev, P.; Ferreira de Araújo, J.; Reier, T.; Dresp, S.; Paul, B.; Krähnert, R.; Dau, H.; Strasser, P. Oxygen Evolution Reaction Dynamics, Faradaic Charge Efficiency, and the Active Metal Redox States of Ni–Fe Oxide Water Splitting Electrocatalysts. J. Am. Chem. Soc. 2016, 138, 5603–5614. [Google Scholar] [CrossRef] [PubMed]
  22. Kjartansdóttir, C.; Caspersen, M.; Egelund, S.; Møller, P. Electrochemical Investigation of Surface Area Effects on PVD Al-Ni as Electrocatalyst for Alkaline Water Electrolysis. Electrochim. Acta 2014, 142, 324–335. [Google Scholar] [CrossRef]
  23. Meng, T.; Li, Q.; Yan, M.; Wang, D.; Fan, L.; Liu, X.; Xing, Z.; Yang, X. Electrochemically Induced In-Situ Surface Self-Reconstruction on Ni, Fe, Zn Ternary-Metal Hydroxides towards the Oxygen-Evolution Performance. Chem. Eng. J. 2021, 410, 128331. [Google Scholar] [CrossRef]
  24. Hegde, A.C.; Venkatakrishna, K.; Eliaz, N. Electrodeposition of Zn-Ni, Zn-Fe and Zn-Ni-Fe Alloys. Surf. Coat. Technol. 2010, 205, 2031–2041. [Google Scholar] [CrossRef]
  25. Nayana, K.O.; Prashanth, S.A.; Venkatesha, T.V.; Pandurangappa, M. Effect of Additives on Nanocrystalline Bright Zn-Ni-Fe Alloy Electrodeposit Properties. Surf. Eng. 2019, 35, 1061–1069. [Google Scholar] [CrossRef]
  26. Oliveira, R.P.; Bertagnolli, D.C.; Ferreira, E.A.; da Silva, L.; Paula, A.S. Influence of Fe2+ Oxidation and Its Antioxidant Ascorbic Acid as Additive in Zn-Ni-Fe Electrodeposition Process on a Low Carbon Steel. Surf. Coat. Technol. 2018, 349, 874–884. [Google Scholar] [CrossRef]
  27. Wang, J.; Wilcox, G.D.; Mortimer, R.J.; Liu, C.; Ashworth, M.A. Electrodeposition and Characterisation of Novel Ni-NbOx Composite Coatings as a Diffusion Barrier for Liquid Solder Interconnects—Part II: Diffusion Barrier Performance. ECS Trans. 2015, 64, 109–121. [Google Scholar] [CrossRef]
  28. Rashidi, A.M. A Galvanostatic Modeling for Preparation of Electrodeposited Nanocrystalline Coatings by Control of Current Density. J. Mater. Sci. Technol. 2012, 28, 1071–1076. [Google Scholar] [CrossRef]
  29. Suen, N.T.; Hung, S.F.; Quan, Q.; Zhang, N.; Xu, Y.J.; Chen, H.M. Electrocatalysis for the Oxygen Evolution Reaction: Recent Development and Future Perspectives. Chem. Soc. Rev. 2017, 46, 337–365. [Google Scholar] [CrossRef] [PubMed]
  30. Doyle, R.L.; Lyons, M.E.G. Kinetics and Mechanistic Aspects of the Oxygen Evolution Reaction at Hydrous Iron Oxide Films in Base. J. Electrochem. Soc. 2013, 160, H142–H154. [Google Scholar] [CrossRef]
  31. Bajdich, M.; García-Mota, M.; Vojvodic, A.; Nørskov, J.K.; Bell, A.T. Theoretical Investigation of the Activity of Cobalt Oxides for the Electrochemical Oxidation of Water. J. Am. Chem. Soc. 2013, 135, 13521–13530. [Google Scholar] [CrossRef] [Green Version]
  32. Yue, S.; Wang, S.; Jiao, Q.; Feng, X.; Zhan, K.; Dai, Y.; Feng, C.; Li, H.; Feng, T.; Zhao, Y. Preparation of Yolk–Shell-Structured CoxFe1− xP With Enhanced OER Performance. ChemSusChem 2019, 12, 4461–4470. [Google Scholar] [CrossRef] [PubMed]
  33. Samanta, A.; Das, S.; Jana, S. Ultra-Small Intermetallic NiZn Nanoparticles: A Non-Precious Metal Catalyst for Efficient Electrocatalysis. Nanoscale Adv. 2020, 2, 417–424. [Google Scholar] [CrossRef] [Green Version]
  34. Xiao, H.; Shin, H.; Goddard, W.A. Synergy Between Fe and Ni in the Optimal Performance of (Ni,Fe)OOH Catalysts for the Oxygen Evolution Reaction. Proc. Natl Acad. Sci. USA 2018, 115, 5872–5877. [Google Scholar] [CrossRef] [PubMed] [Green Version]
  35. Torabinejad, V.; Aliofkhazraei, M.; Assareh, S.; Allahyarzadeh, M.H.; Rouhaghdam, A.S. Electrodeposition of Ni-Fe alloys, composites, and nano coatings—A review. J. Alloys Compd. 2017, 691, 841–859. [Google Scholar] [CrossRef]
  36. Stevens, M.B.; Trang, C.D.M.; Enman, L.J.; Deng, J.; Boettcher, S.W. Reactive Fe-Sites in Ni/Fe (Oxy)Hydroxide Are Responsible for Exceptional Oxygen Electrocatalysis Activity. J. Am. Chem. Soc. 2017, 139, 11361–11364. [Google Scholar] [CrossRef]
  37. Klaus, S.; Cai, Y.; Louie, M.W.; Trotochaud, L.; Bell, A.T. Effects of Fe Electrolyte Impurities on Ni(OH)2/NiOOH Structure and Oxygen Evolution Activity. J. Phys. Chem. C 2015, 119, 7243–7254. [Google Scholar] [CrossRef] [Green Version]
  38. Sheela, G.; Pushpavanam, M.; Pushpavanam, S. Zinc–Nickel Alloy Electrodeposits for Water Electrolysis. Int. J. Hydrog. Energy 2002, 27, 627–633. [Google Scholar] [CrossRef]
  39. Acharya, P.; Nelson, Z.J.; Benamara, M.; Manso, R.H.; Bakovic, S.I.P.; Abolhassani, M.; Lee, S.; Reinhart, B.; Chen, J.; Greenlee, L.F. Chemical Structure of Fe–Ni Nanoparticles for Efficient Oxygen Evolution Reaction Electrocatalysis. ACS Omega 2019, 4, 17209–17222. [Google Scholar] [CrossRef] [Green Version]
  40. Trotochaud, L.; Young, S.L.; Ranney, J.K.; Boettcher, S.W. Nickel–Iron Oxyhydroxide Oxygen-Evolution Electrocatalysts: The Role of Intentional and Incidental Iron Incorporation. J. Am. Chem. Soc. 2014, 136, 6744–6753. [Google Scholar] [CrossRef]
  41. Friebel, D.; Louie, M.W.; Bajdich, M.; Sanwald, K.E.; Cai, Y.; Wise, A.M.; Cheng, M.J.; Sokaras, D.; Weng, T.C.; Alonso-Mori, R.; et al. Identification of Highly Active Fe Sites in (Ni, Fe) OOH for Electrocatalytic Water Splitting. J. Am. Chem. Soc. 2015, 137, 1305–1313. [Google Scholar] [CrossRef] [Green Version]
  42. Hu, C.C.; Wu, Y.R. Bipolar Performance of the Electroplated Iron–Nickel Deposits for Water Electrolysis. Mater. Chem. Phys. 2003, 82, 588–596. [Google Scholar] [CrossRef]
  43. Zhuang, L.; Ge, L.; Yang, Y.; Li, M.; Jia, Y.; Yao, X.; Zhu, Z. Ultrathin Iron-Cobalt Oxide Nanosheets With Abundant Oxygen Vacancies for the Oxygen Evolution Reaction. Adv. Mater. 2017, 29, 1606793. [Google Scholar] [CrossRef] [PubMed]
  44. Bao, J.; Zhang, X.; Fan, B.; Zhang, J.; Zhou, M.; Yang, W.; Hu, X.; Wang, H.; Pan, B.; Xie, Y. Ultrathin Spinel-Structured Nanosheets Rich in Oxygen Deficiencies for Enhanced Electrocatalytic Water Oxidation. Angew. Chem. 2015, 127, 7507–7512. [Google Scholar] [CrossRef]
  45. Kim, H.; Kim, J.; Ahn, S.H. Monitoring Oxygen–Vacancy Ratio in NiFe-Based Electrocatalysts During Oxygen Evolution Reaction in Alkaline Electrolyte. J. Ind. Eng. Chem. 2019, 72, 273–280. [Google Scholar] [CrossRef]
  46. Bezerra, L.S.; Maia, G. Developing Efficient Catalysts for the OER and ORR Using a Combination of Co, Ni, and Pt. Oxides along with Graphene Nanoribbons and NiCo2O4. J. Mater. Chem. A. 2020, 8, 17691–17705. [Google Scholar] [CrossRef]
  47. Yu, Z.; Lin, T.; Zhu, C.; Li, J.; Luo, X. Design of Trimetallic NiMoFe Hollow Microspheres with Polyoxometalate-Based Metal-Organic Frameworks for Enhanced Oxygen Evolution Reaction. ChemElectroChem 2021, 8, 1316–1321. [Google Scholar] [CrossRef]
  48. Bai, J.; Mei, J.; Liao, T.; Sun, Q.; Chen, Z.G.; Sun, Z. Molybdenum-Promoted Surface Reconstruction in Polymorphic Cobalt for Initiating Rapid Oxygen Evolution. Adv. Energy Mater. 2022, 12, 2103247. [Google Scholar] [CrossRef]
  49. Abed, J.; Ahmadi, S.; Laverdure, L.; Abdellah, A.; O’brien, C.P.; Cole, K.; Sobrinho, P.; Sinton, D.; Higgins, D.; Mosey, N.J.; et al. In Situ Formation of Nano Ni-Co Oxyhydroxide Enables Water Oxidation Electrocatalysts Durable at High Current Densities. Adv. Mater. 2021, 33, 2103812. [Google Scholar] [CrossRef] [PubMed]
  50. Wu, T.; Song, E.; Zhang, S.; Luo, M.; Zhao, C.; Zhao, W.; Liu, J.; Huang, F.; Wu, T.; Song, E.; et al. Engineering Metallic Heterostructure Based on Ni3N and 2M-MoS2 for Alkaline Water Electrolysis with Industry-Compatible Current Density and Stability. Adv. Mater. 2022, 2108505. [Google Scholar] [CrossRef]
Figure 1. SEM images of electrodeposited Ni–Zn–Fe on a Ni–foam bath E with different current densities (ad as prepared, eh after dealloying).
Catalysts 12 00346 g001
Figure 2. Ni(111) crystallite size of electrodeposited Ni–Zn–Fe on Ni foam prepared by different current density in the bath (E) (a) as prepared (b) after dealloying.
Catalysts 12 00346 g002
Figure 3. I-E curves (LSV) of electrodeposited Ni–Zn–Fe on Ni foam prepared with different current density in the bath (E) (Condition: scan rate = 0.1 mV/s, temperature = 25 °C, KOH = 1 M).
Catalysts 12 00346 g003
Figure 4. Composition of electrodeposited Ni–Zn–Fe on Ni foam with a different current density as a prepared [atomic %] bath (E).
Catalysts 12 00346 g004
Figure 5. Electrochemical surface area of electrodeposited Ni–Zn–Fe on a Ni plate bath (E) with different current densities.
Catalysts 12 00346 g005
Figure 6. XRD patterns of Ni–Zn–Fe electrode surface on a Ni-foam bath (E) with different plating current densities before Zn dealloying.
Catalysts 12 00346 g006
Figure 7. Surface composition after dealloying of electrodeposited Ni–Zn–Fe on Ni foam according to the Ni:Fe ratio of the bath (A), (B), (C), (D), (E).
Catalysts 12 00346 g007
Figure 8. Results of cyclic voltammetry of electrodeposited Ni–Zn–Fe on Ni foam in the different Ni:Fe ratio of the bath (A), (B), (C), (D), (E) (Condition: scan rate = 1 mV/s).
Catalysts 12 00346 g008
Figure 9. I-E curves (LSV) of electrodeposited Ni–Zn–Fe on Ni foam in the different Ni:Fe ratio of the bath (A), (B), (C), (D), (E) (Condition: scan rate = 0.1 mV/s, temperature = 25 °C, KOH = 1 M).
Catalysts 12 00346 g009
Figure 10. Number of electrons transferred during reduction {NiOOH → Ni(OH)2} obtained by integration of the area in the CV curve.
Catalysts 12 00346 g010
Figure 11. XPS spectra of Ni–Zn–Fe electrode after dealloying according to the different Ni:Fe ratio of the bath (A), (B), (C), (D), (E): (a) Fe 2p peaks; (b) O 1s peaks; (c) Ni 2p peaks.
Catalysts 12 00346 g011
Table 1. Electrochemical overpotentials of OER and Tafel slope values for Ni–Zn–Fe Catalysts tested in 1 M KOH at 298 K.
SampleTafel Slope [mV·dec−1]Overpotential @ 100 mA·cm2 Current Density [mV]
80 mA/cm2260.306
160 mA/cm2280.302
240 mA/cm2330.303
320 mA/cm2290.309
Table 2. Overpotential at 100 mA/cm2 of the electrodeposited Ni–Zn–Fe electrodes on Ni foam in the different Ni:Fe ratio of the bath (A), (B), (C), (D), (E) (Condition: scan rate = 0.1 mV/s, temperature = 25 °C, KOH = 1 M).
SampleOverpotential @ 100 mA·cm−2 Current Density [mV]
(A) 11:10.313
(B) 5:10.287
(C) 3:10.284
(D) 2:10.276
(E) 1.4:10.302
Table 3. Summary of peak area ratio of Ni(II)/Ni(III), oxygen vacancy peak area percentage and Fe(III) peak area percentage of the electrodeposited Ni–Zn–Fe on Ni foam in the different Ni:Fe ratio of the bath (A), (B), (C), (D), (E).
SampleNi2+/Ni3+ Peak Area RatioOxygen Vacancy Peak Area Percentage (%)Fe(lll) Peak Area (%)
A (11:1)1.8642.853.8
B (5:1)2.3143.659.9
C (3:1)2.5046.562.8
D (2:1)2.8975.563.5
E (1.4:1)2.0443.272.1
Table 4. Comparison of oxygen overpotentials between this study and the recently reported transition metal electrodes in OER(1 M KOH at 298 K).
CatalystsMethod of PreparationOxygen Overpotential/mV at 0.1 A·cm−2Ref
Ni–Zn–Fe
160 mA/cm2
Electrodeposition276this paper
NiCoO4Hydrothermal350[46]
NiMoFe@NC700solvothermal288[47]
CMN-500Hydrothermal290[48]
(NiCo)3Se4 CryoCryomilling389[49]
Ni3NHydrothermal374[50]
Table 5. Composition of electrodeposition baths (g/L).
PrecursorA
(11:1)
B
(5:1)
C
(3:1)
D
(2:1)
E
(1.4:1)
H3BO337.537.537.537.537.5
C6H5K3O732.4432.4432.4432.4432.44
FeSO4·7H2O306090120150
NiSO4·6H2O330300270240210
NiCl2·6H2O4545454545
ZnCl22020202020
C7H5NO3S11111
Publisher’s Note: MDPI stays neutral with regard to jurisdictional claims in published maps and institutional affiliations.

