Article

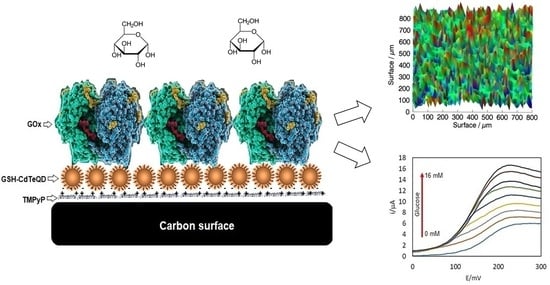
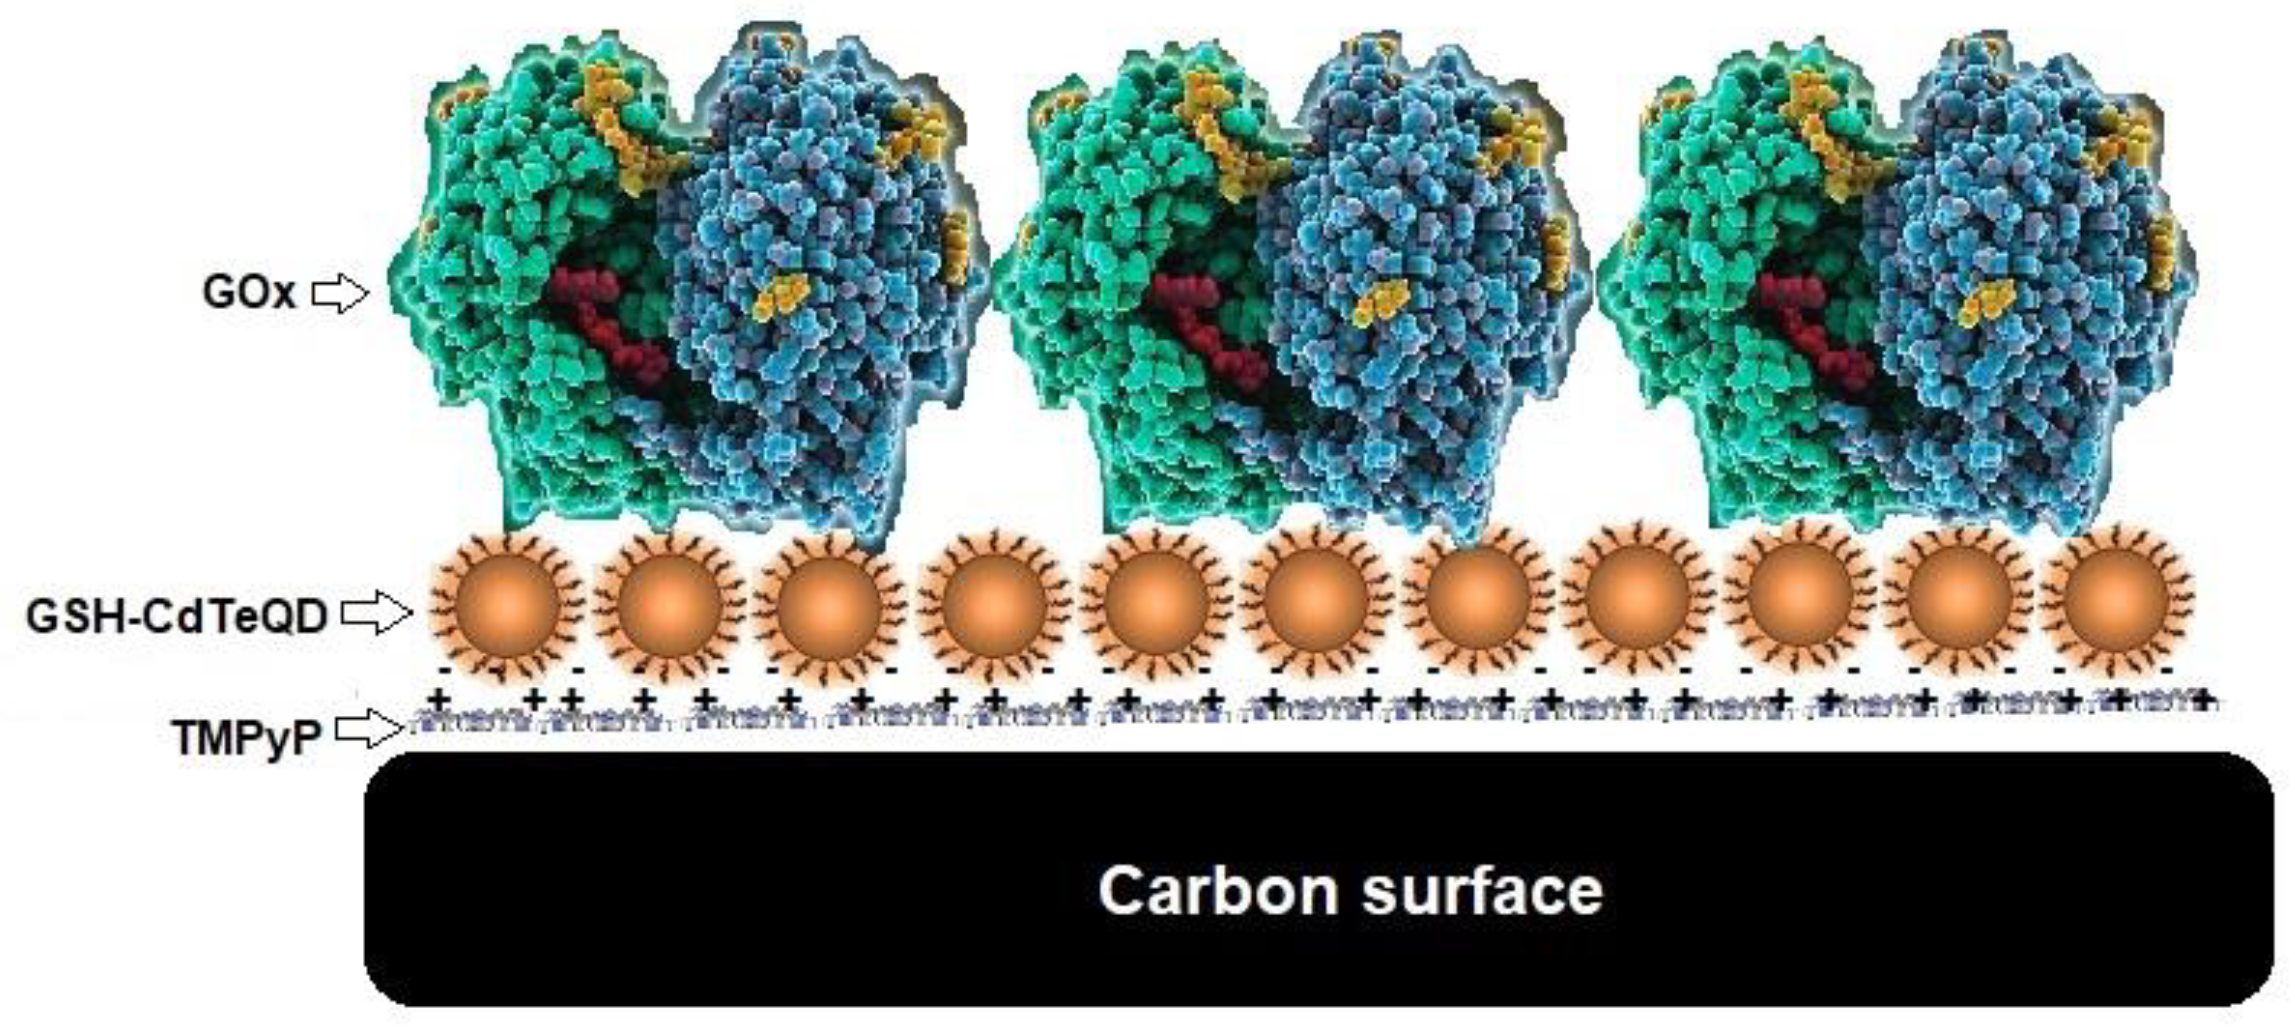
Immobilization of Glucose Oxidase on Glutathione Capped CdTe Quantum Dots for Bioenergy Generation

by
Daniel Lozano-López
1,
Marisol Galván-Valencia
2,
Ivone Rojas-de Soto
1,
Ricardo A. Escalona-Villalpando
3,
Janet Ledesma-García
3 and
Sergio Durón-Torres
2,*
1
Unidad Académica de Ingeniería Eléctrica, Universidad Autónoma de Zacatecas, Col. Centro, Av. Ramón López Velarde 801, Zacatecas C.P. 98000, Mexico
2
Unidad Académica de Ciencias Químicas, Universidad Autónoma de Zacatecas, Campus Siglo XXI, Edif. 6, Km 6 carr. Zacatecas-Guadalajara, Zacatecas C.P. 98160, Mexico
3
División de Investigación y Posgrado, Facultad de Ingeniería, Universidad Autónoma de Querétaro, Santiago de Querétaro C.P. 76010, Mexico
*
Author to whom correspondence should be addressed.
Catalysts 2022, 12(12), 1659; https://doi.org/10.3390/catal12121659
Submission received: 15 November 2022 / Revised: 12 December 2022 / Accepted: 14 December 2022 / Published: 17 December 2022
(This article belongs to the Special Issue Recent Trends in Enzyme Immobilization)

Abstract

:
An efficient immobilization of Glucose oxidase (GOx) on an appropriate substrate is one of the main challenges of developing fuel cells that allow energy to be obtained from renewable substrates such as carbohydrates in physiological environments. The research importance of biofuel cells relies on their experimental robustness and high compatibility with biological organisms such as tissues or the bloodstream with the aim of obtaining electrical energy even from living systems. In this work, we report the use of 5,10,15,20 tetrakis (1-methyl-4-pyridinium) porphyrin and glutathione capped CdTe Quantum dots (GSH-CdTeQD) as a support matrix for the immobilization of GOx on carbon surfaces. Fluorescent GSH-CdTeQD particles were synthesized and their characterization by UV-Vis spectrophotometry showed a particle size between 5–7 nm, which was confirmed by DLS and TEM measurements. Graphite and Toray paper electrodes were modified by a drop coating of porphyrin, GSH-CdTeQD and GOx, and their electrochemical activity toward glucose oxidation was evaluated by cyclic voltammetry, chronoamperometry and electrochemical impedance spectroscopy. Additionally, GOx modified electrode activity was explored by scanning electrochemical microscopy, finding that near to 70% of the surface was covered with active enzyme. The modified electrodes showed a glucose sensitivity of 0.58 ± 0.01 μA/mM and an apparent Michaelis constant of 7.8 mM. The addition of BSA blocking protein maintained the current response of common interferent molecules such as ascorbic acid (AA) with less than a 5% of interference percentage. Finally, the complex electrodes were employed as anodes in a microfluidic biofuel cell (μBFC) in order to evaluate the performance in energy production. The enzymatic anodes used in the μBFC allowed us to obtain a current density of 7.53 mAcm−2 at the maximum power density of 2.30 mWcm−2; an open circuit potential of 0.57 V was observed in the biofuel cell. The results obtained suggest that the support matrix porphyrin and GSH-CdTeQD is appropriate to immobilize GOx while preserving the enzyme’s catalytic activity. The reported electrode arrangement is a viable option for bioenergy production and/or glucose quantification.

Graphical Abstract

1. Introduction

The development of biofuel cells (BFC) has become a wide field of study in the search for alternative energies [1]. In particular, BFCs that use enzymes as anodic or cathodic redox catalysts have gained a special interest due to their biocompatibility and possible operation at physiological pH and temperature by employing renewable organic fuels [2,3,4]. For this purpose, one of the enzymes commonly used is Glucose oxidase (GOx), which through the flavin-adenine dinucleotide cofactor (FAD) allows the generation of two electrons for each oxidized glucose molecule, which could be employed in an external circuit as electrical energy [5]. One of the main challenges in BFC development is the immobilization method that allows an adequate anchoring of enzyme to the electrode surface. Some immobilization techniques, such as those involving covalent bonds, can decrease enzyme activity by interfering with the enzyme’s active site. Additionally, in other methods, large amounts of enzyme are required for the attachment although only a small amount is actually immobilized [6]. Among the currently used enzymatic immobilization methods, adsorption based attachment presents important advantages, since it does not compromise the three-dimensional structure of the protein complex [7,8,9] and decreases the possibility of occlusion of the active site of the enzyme [10].
Among the most studied materials to improve GOx immobilization, nanoparticles stand out due to their remarkable advantages, such as increased surface area, porous nature, tunable morphology, and others, which makes them a very attractive option for enzyme immobilization [11]. Previous works report the immobilization of GOx in materials such as carbon nanotubes, which take advantage of their high conductivity and the interaction of functional groups with amino acid residues for the enzyme–support interaction [12]. Fe2O3 nanoparticles, due to their magnetic characteristics and low toxicity, are considered a good alternative for immobilization [13], and even some types of perovskites, that apparently improve electron transfer between GOx and the electrode surface [14].
Within these nanoparticle options, the use of nanoparticles of Quantum dots has been proposed as a viable alternative for anchoring GOx [15,16]. Within these types of semiconductor nanocrystals are included the glutathione-coated cadmium tellurium Quantum dots (GSH-CdTeQD), which stand out for their photoluminescence properties and the homogeneity obtained when the QD surface is coated. This characteristic provides the system with great stability and biocompatibility [17]. The complex GSH-CdTeQD has been proposed as a support matrix for the immobilization of GOx due to its high surface area, while the functional groups of the system allow for efficient enzyme adsorption and provide an optimal microenvironment that preserves the enzyme’s catalytic activity [18].
Some authors have described the existence of electrostatic affinity between GSH-CdTeQD and cationic macrocycles such as 5,10,15,20-tetrakis (1-methyl-4-pyridinium) porphyrin (TMPyP), schematically represented in Figure 1 [19,20]. It is presumed that GSH-CdTeQD binds strongly to porphyrin forming a very stable TMPyP/GSH-CdTeQD complex [21,22]. As a flat molecule [23], TMPyP has a high affinity for carbon structures and supports [24,25], and when combined with GSH-CdTeQD, the resulting assembled material could generate a multilayer array that could be used for the adsorption of biomolecules such as GOx [26].
To obtain energy from the GOx enzymatic reaction, fuel cells (FC) can be used. Conventional FCs consist of an anode and a cathode separated by a proton exchange membrane (PEM) and these can be externally connected to take advantage of the electric energy generated from the internal electrode reactions [27]. However, this arrangement has certain disadvantages; in general, PEM fuel cells are built with expensive materials which degrade easily, and additional problems can occur during the device’s assembly that limit the possibility of miniaturization, increase the resistance of the ion exchange membrane and increase the requirements of high precision manufacturing. An alternative to the PEM is the use of microfluidic cells (μFC) [28,29,30] where both anode and cathode electrolytes move in parallel with a laminar flux, and the interface generated between the fluids acts as an exchange system, eliminating the need for a real membrane [31,32,33].
In this work, in order to improve the enzymatic catalysis of glucose for electrical energy generation in a microfluidic bio-fuel cell, the development of a self-assembled system that allows the immobilization of GOx with TMPyP/GSH-CdTeQD is reported. Figure 2 shows the proposed schematic assembly of the immobilization system: TMPyP/GSH-CdTeQD/GOx.
The obtained results indicate that the TMPyP/GSH-CdTeQD/GOx system not only preserves the catalytic activity of the enzyme but allows it to obtain a power density up to 2 mW cm−2 in a μFC arrangement; a comparable value with those obtained when other immobilization approaches were used.

2. Results and Discussion

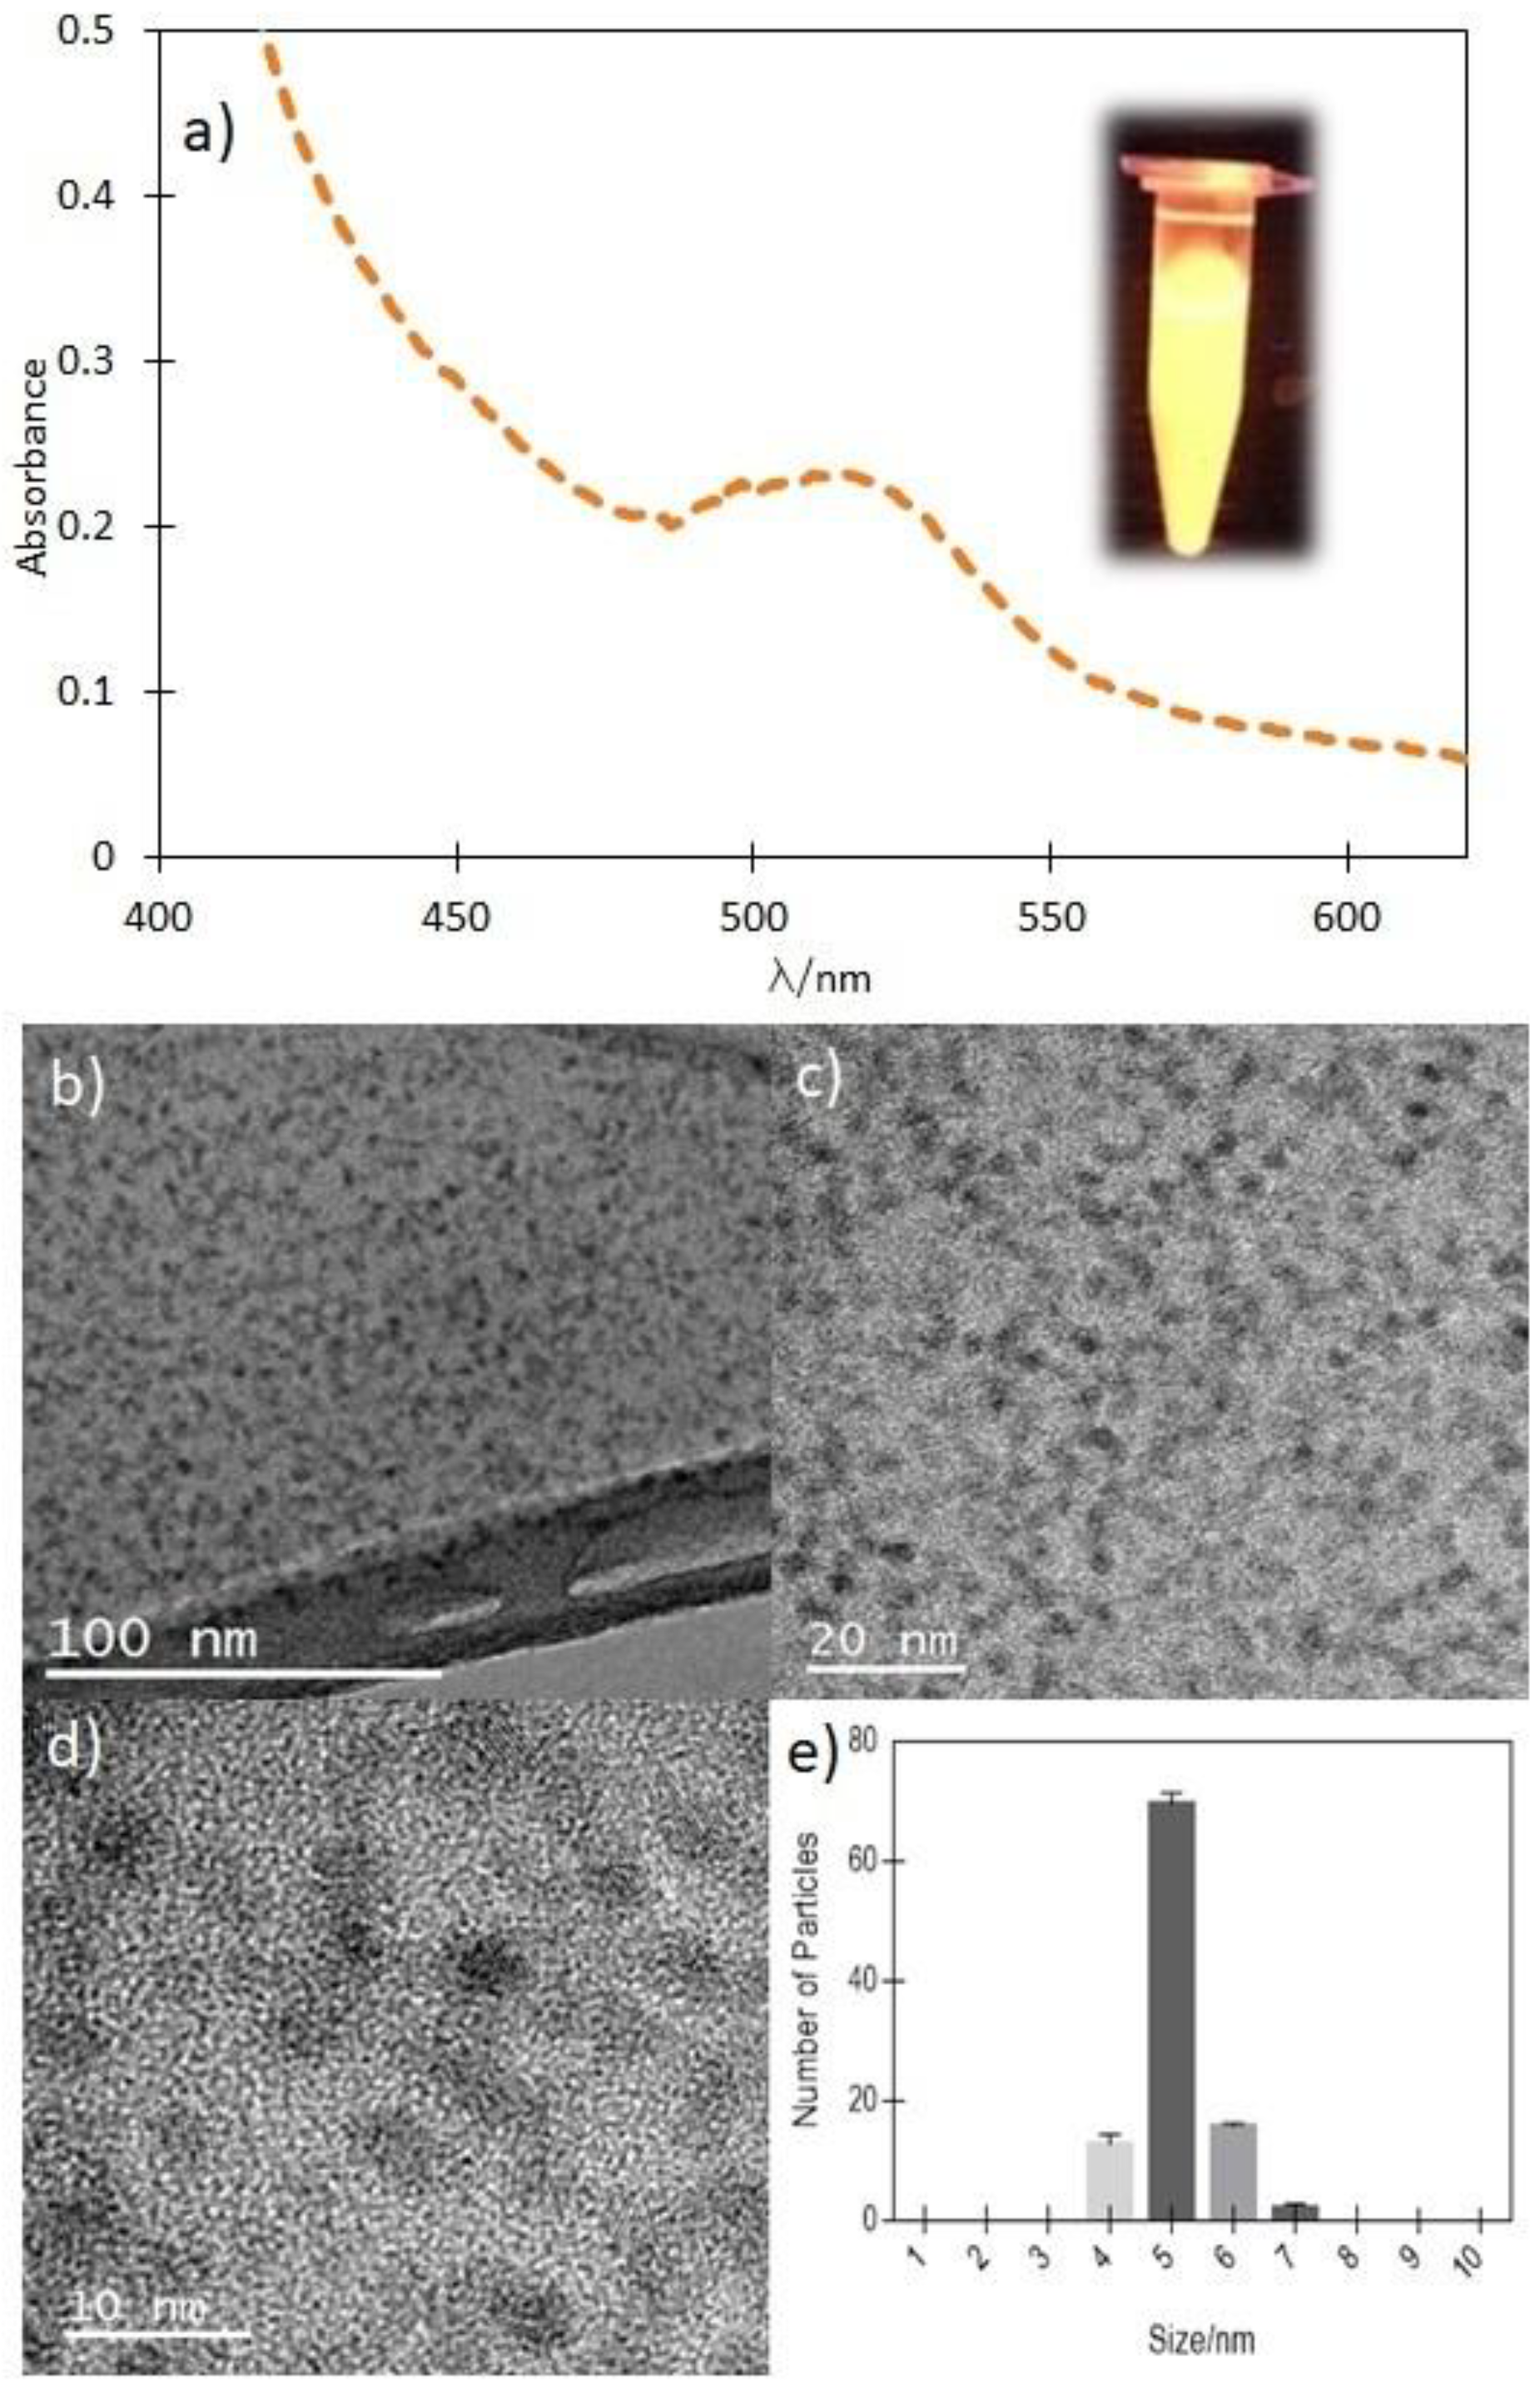
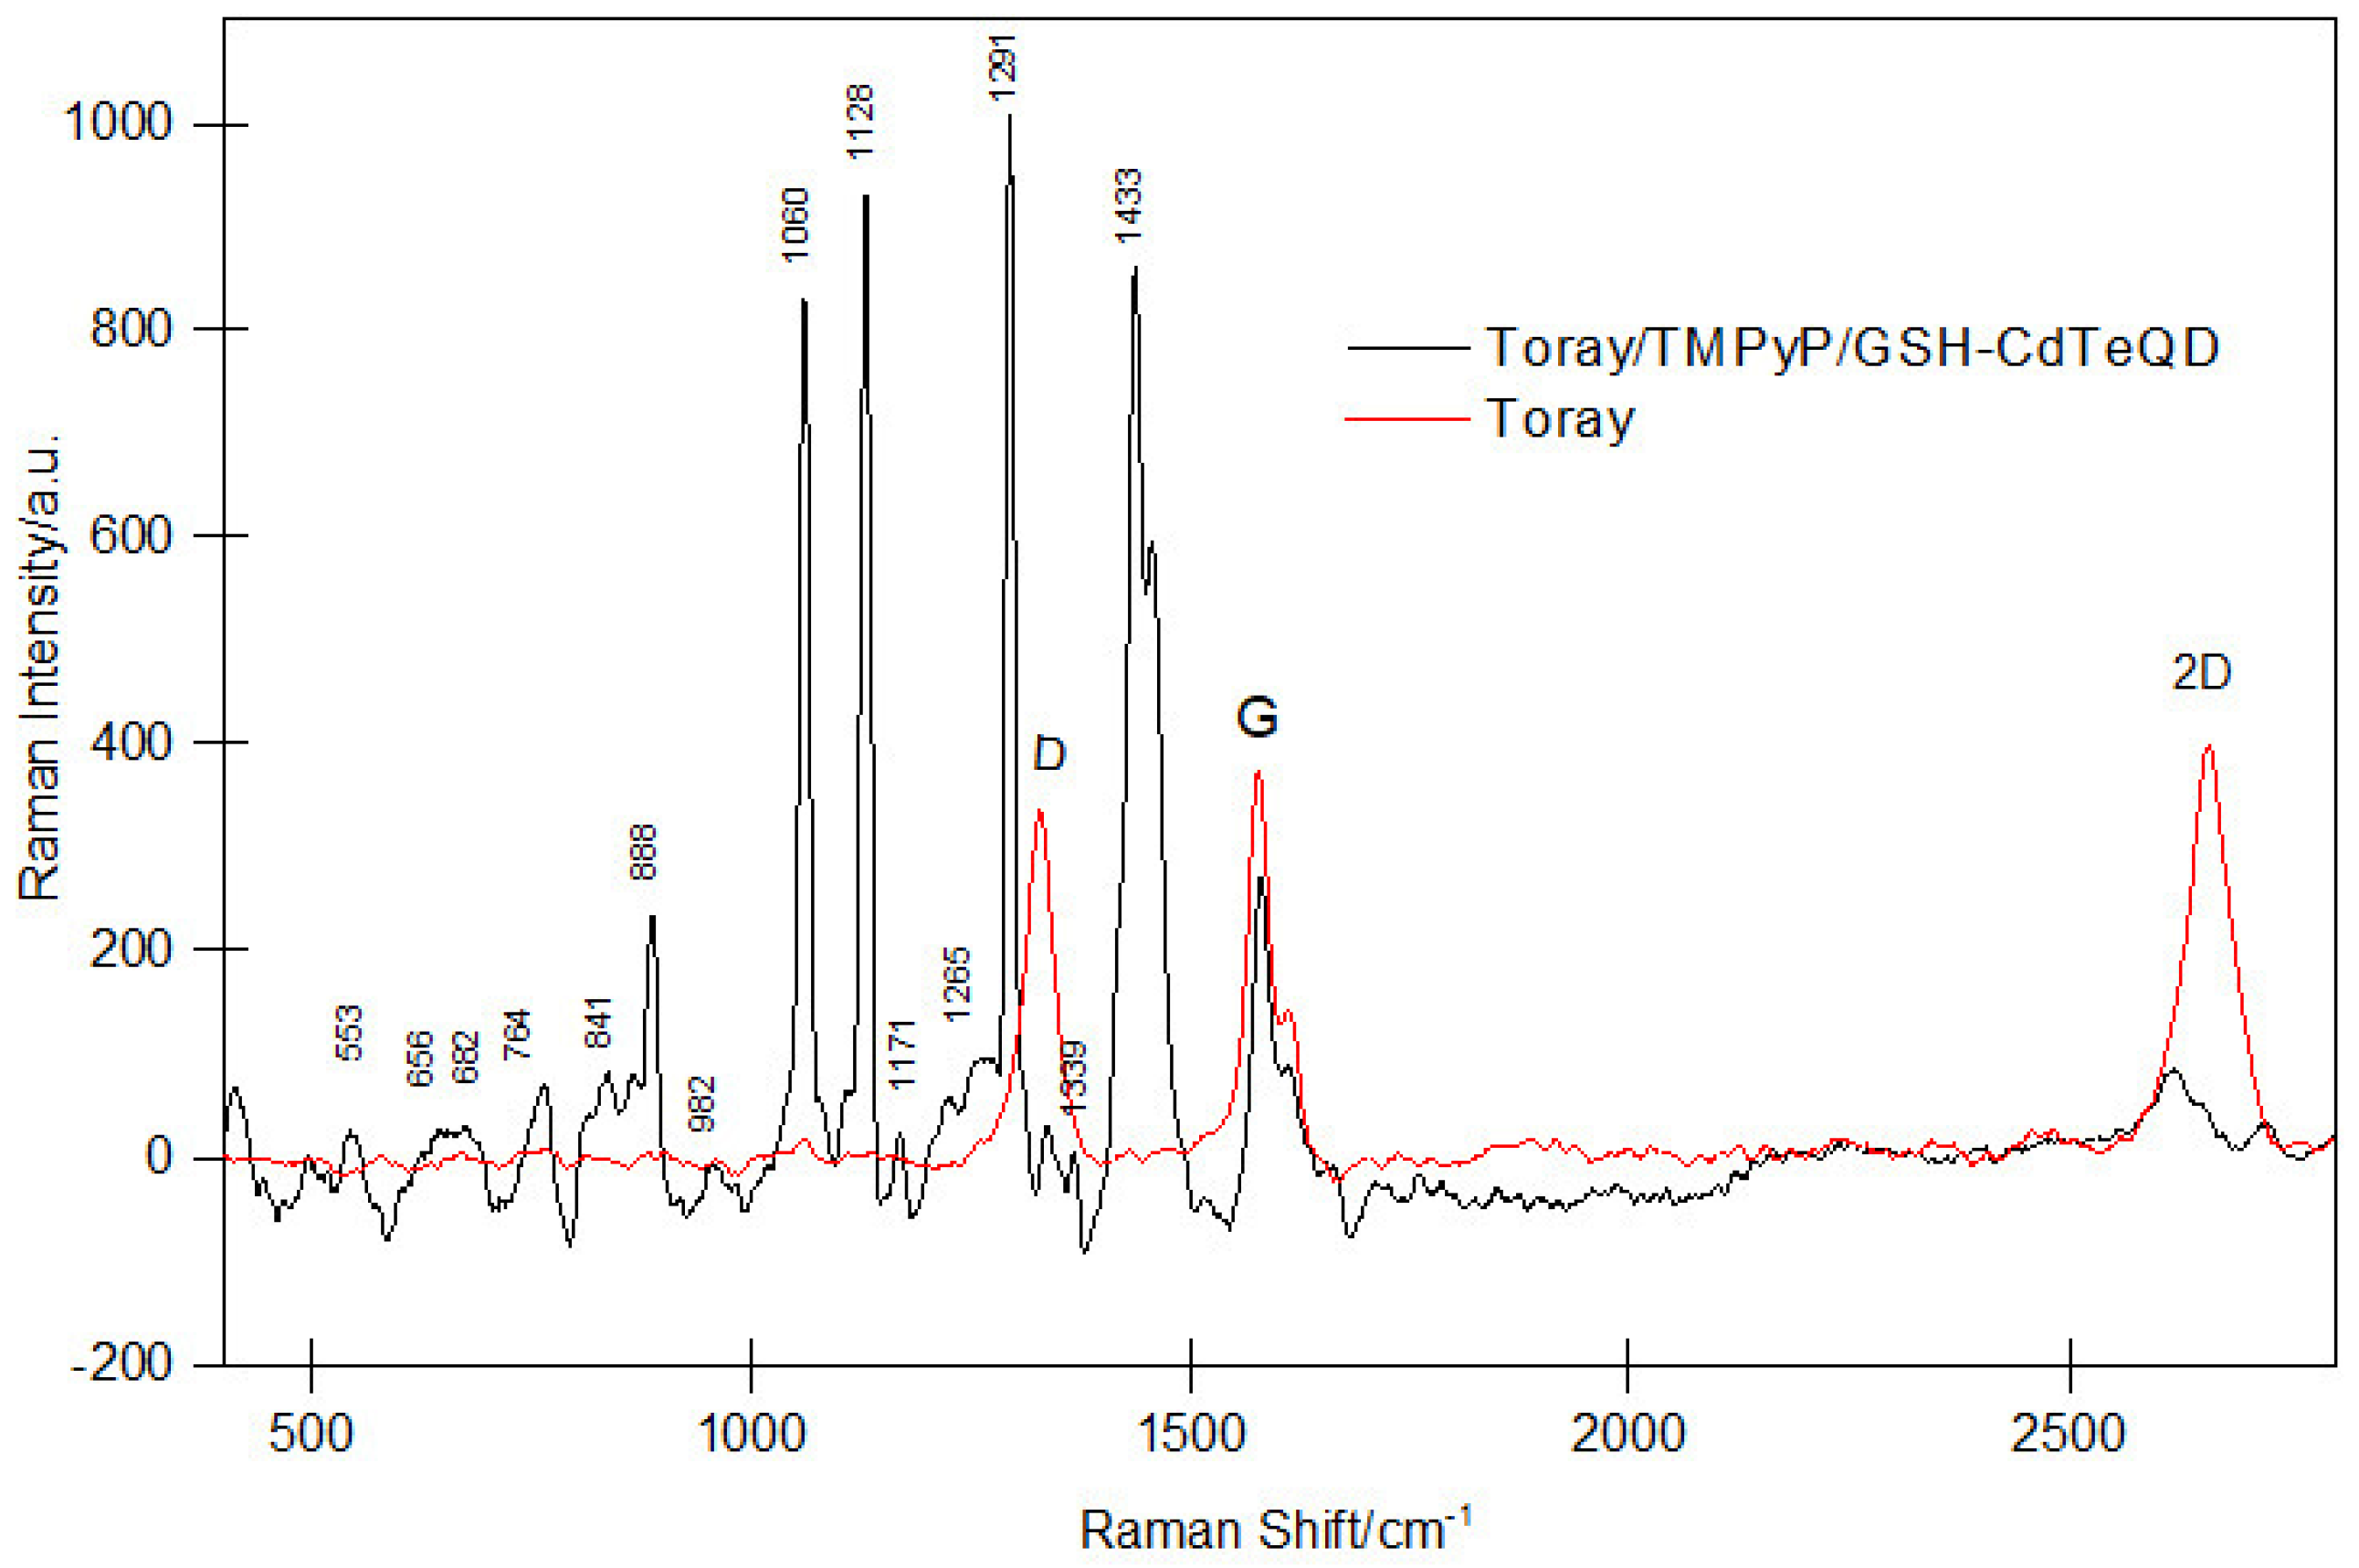
2.1. Pysicochemical Characterization of GSH-CdTeQD

The one-step synthesis method used to obtain the GHS-CdTeQD enable a growth of the nanoparticles that is proportional to the reflux time [34]. With the aim to obtain a highly oriented enzyme immobilization, and considering the dimensions of GOx (6.0, 5.2 and 7.7 nm−3) [35], a size between 5 and 7 nm of QD is desired to either bind an enzyme to each particle, or to generate holes between the particles with an appropriate size and a high content of COO- groups capable of electrostatically attracting the abundant lysine (Lys) residues in certain regions of the GOx surface [36]. For this purpose, a 65 min reflux time was chosen. At the end of the reaction, the synthesized GSH-CdTeQD was observed under 360 nm UV light. As shown in the insert of Figure 3a, the sample emits a high fluorescence, which indicates that the nanocrystals have a size less than 10 nm, corresponding to the size range commonly observed in QDs [17]. According to Yu’s equation [37], which associates the absorbance with the particle size range, the wavelength at 514 nm of the peak maximum in the GSH-CdTeQD spectrum would indicate a size of approximately 7 nm. The gravimetrically estimated concentration of GSH-CdTeQD in the suspension obtained from the one-step synthesis was 3.5 mg mL−1.
TEM images of a GSH-CdTeQD sample are shown in Figure 3b–d. It can be observed as regular near spherical shapes that can be related to the QD particles. From micrography (c) an average size between 5 and 6 nm of nanocrystals could be obtained, which is consistent with the UV-Vis calculated size.
The literature suggests that a strong interaction is produced between the molecules that generates the self-assembly of the TMPyP and GSH-CdTeQD in a layer-by-layer system [26]. In order to confirm this interaction, TMPyP and GSH-CdTeQD were evaluated by dispersive light scattering (DLS) and Zeta Potential (ζ) measurements. In accordance with the DLS results summarized in Table 1, the GSH-CdTeQD mean particle size was 7 nm with some rare occurrences of particles with sizes near to 177 nm (data not shown). The smaller size coincides with those obtained from the spectrophotometric analysis. On the other hand, the presence of particles larger than 100 nm is not consistent with the quantum dots’ characteristics (sizes smaller than 10 nm) and can be related to the formation of aggregates between the QD, glutathione and porphyrine molecules [38]. It is interesting to note the agreement between the spectrophotometric and DLS size measurements, while on the other hand, the TEM images showed that the predominant size of the nanocrystals was around 5 nm. According to Segets [38], this could be due to the coating of the QDs showing an apparent particle size, which includes both the porphyrine and solvation layers formed in the GSH-CdTeQD assembly, which without an appropriate correction factor, can increase the detected size by up to 1.5 nm. However, the coincidence in the size detected by both optical methods suggests a homogeneous particle size distribution and an adequate coating of the CdTe crystals with GSH, which is essential to ensure their biocompatibility [39]. Furthermore, the TMPyP in contact with the GSH-CdTeQD suspension promotes the formation of bigger particles with a uniform size near to 328 nm, this agglomeration behavior of a colloidal system has been previously reported for the interaction of these different materials [40].
In order to confirm the presence of GSH on the surface of the GSH-CdTeQD particle, their ζ values were evaluated [41,42]. For QDs coated with ligands such as GSH or MPA, the functional groups present in their structure (generally carboxyl groups) confer to the particles a negative charge that is associated with surface potentials from −12 to −65 mV, unlike uncoated QDs, in which case the surface presents a positive charge and ζ values [43,44]. As shown in Table 1, the ζ for GSH-CdTeQD was −29.3 mV, confirming the presence of GSH molecules attached to the surface of the particle. It has been proposed that during the QD synthesis process, GSH acts as a reducer for metals such as tellurium or selenium [45], and additionally, as a ligand for cadmium atoms through the -SH group, as demonstrated by traditional and biomimetic methods [46,47].
Additionally, the TMPyP/GSH-CdTeQD deposit on the carbon electrodes was evaluated by Raman spectroscopy. A comparison of the spectra between the carbonaceous support (Toray®, Fuel Cell Store, College Station, TX, USA) without modifications, and the support after deposition of the TMPyP/GSH-CdTeQD system is shown in Figure 4. In the Toray sample (Figure 4 red line), characteristic bands of carbonaceous pristine material are appreciated. The band at 1580 cm−1, known as the G band, corresponds to plane vibrations of the C-C bonds. The observed bands at 1330 and 2660 cm−1 are called band D and 2D, respectively, and represent the out-of-plane vibrations of carbon atoms on the surface [48,49]. On the other hand, the Raman spectrum obtained from the TMPyP/GSH-CdTeQD modified electrode shows a radically different signal, which although it conserves the G band with very few modifications, it additionally shows a notable decrease in the D and 2D bands intensities (Figure 4 black line). Generally, this behavior suggests that porphyrin is deposited in the plane of the carbon structure [50,51]. The characteristic signals of TMPyP are also appreciated by the appearance of bands at 656, 807, 982 and 1261 cm−1 corresponding to the amino group of pyridines in the tetrapyrrole ring. In addition to that, the bands corresponding to the glutathione functional groups that cover the GSH-CdTeQD are visible at shifts of 553, 1128, 1171 and 1339 cm−1 [52,53]. In same situations, the literature suggests that the functional groups of both the porphyrin and glutathione molecules could “combine” their respective signals, causing the intensity increase of the band at 1060 cm−1, which is attributed to the -CN bond of both the tetrapyrrole ring and the glutamate that is part of the glutathione structure [52].
To estimate the approximate amount of GSH-CdTe anchored to the TMPyP modified graphite surface, an indirect analysis was performed by depositing 3 µL of the stock suspension on four electrodes; after solvent evaporation, the electrodes were washed with a known volume of deionized water. These volumes were analyzed by spectrophotometry at 360 nm, assuming that the unanchored GSH-CdTeQD would be detected in the supernatant, allowing the quantity of nanocrystals adsorbed to the surface to be obtained by the difference. By using a calibration curve obtained from samples with concentrations from 3.5 × 10⁻³ to 17.5 × 10⁻³ mg mL−1, it was determined that the amount of GSH-CdTeQD deposited on the surface of the electrodes was 1.9 × 10⁻³ mg.

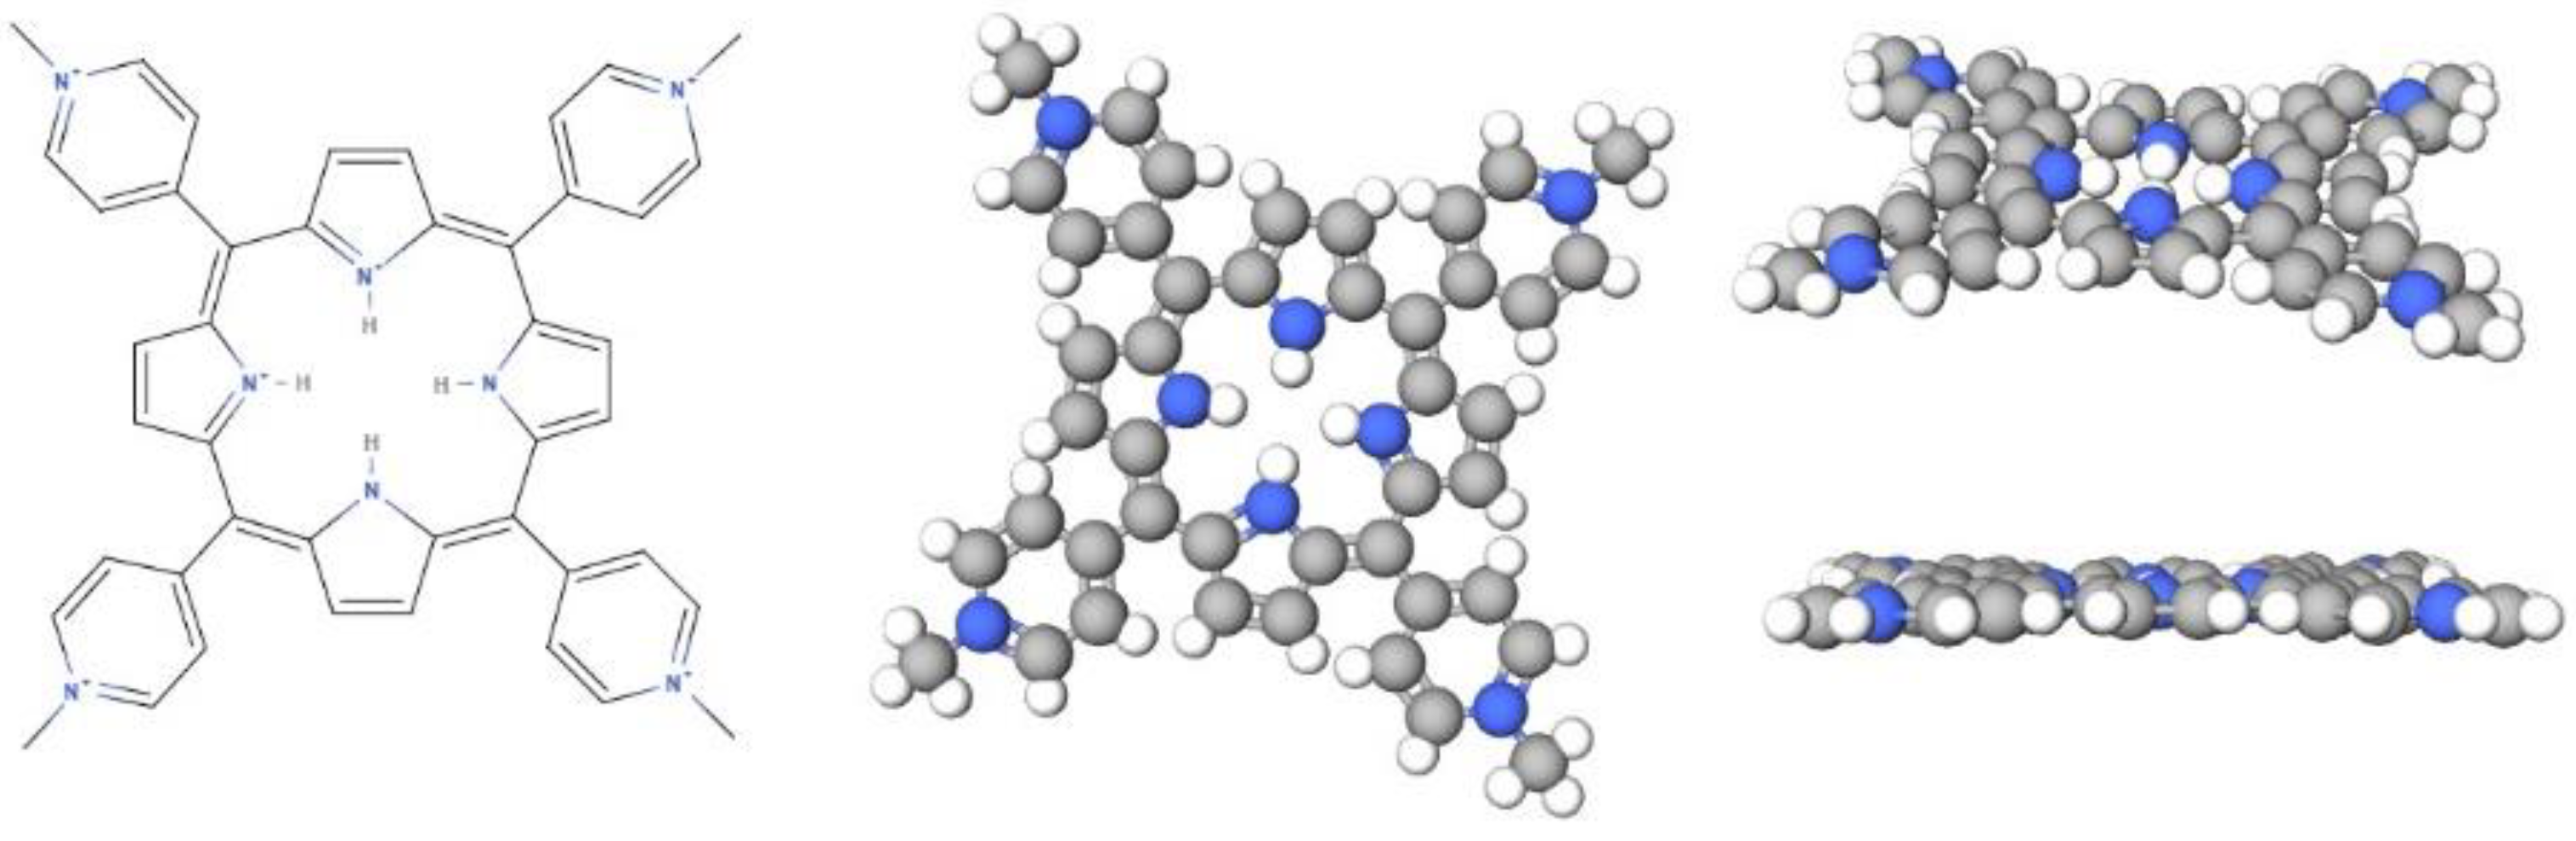
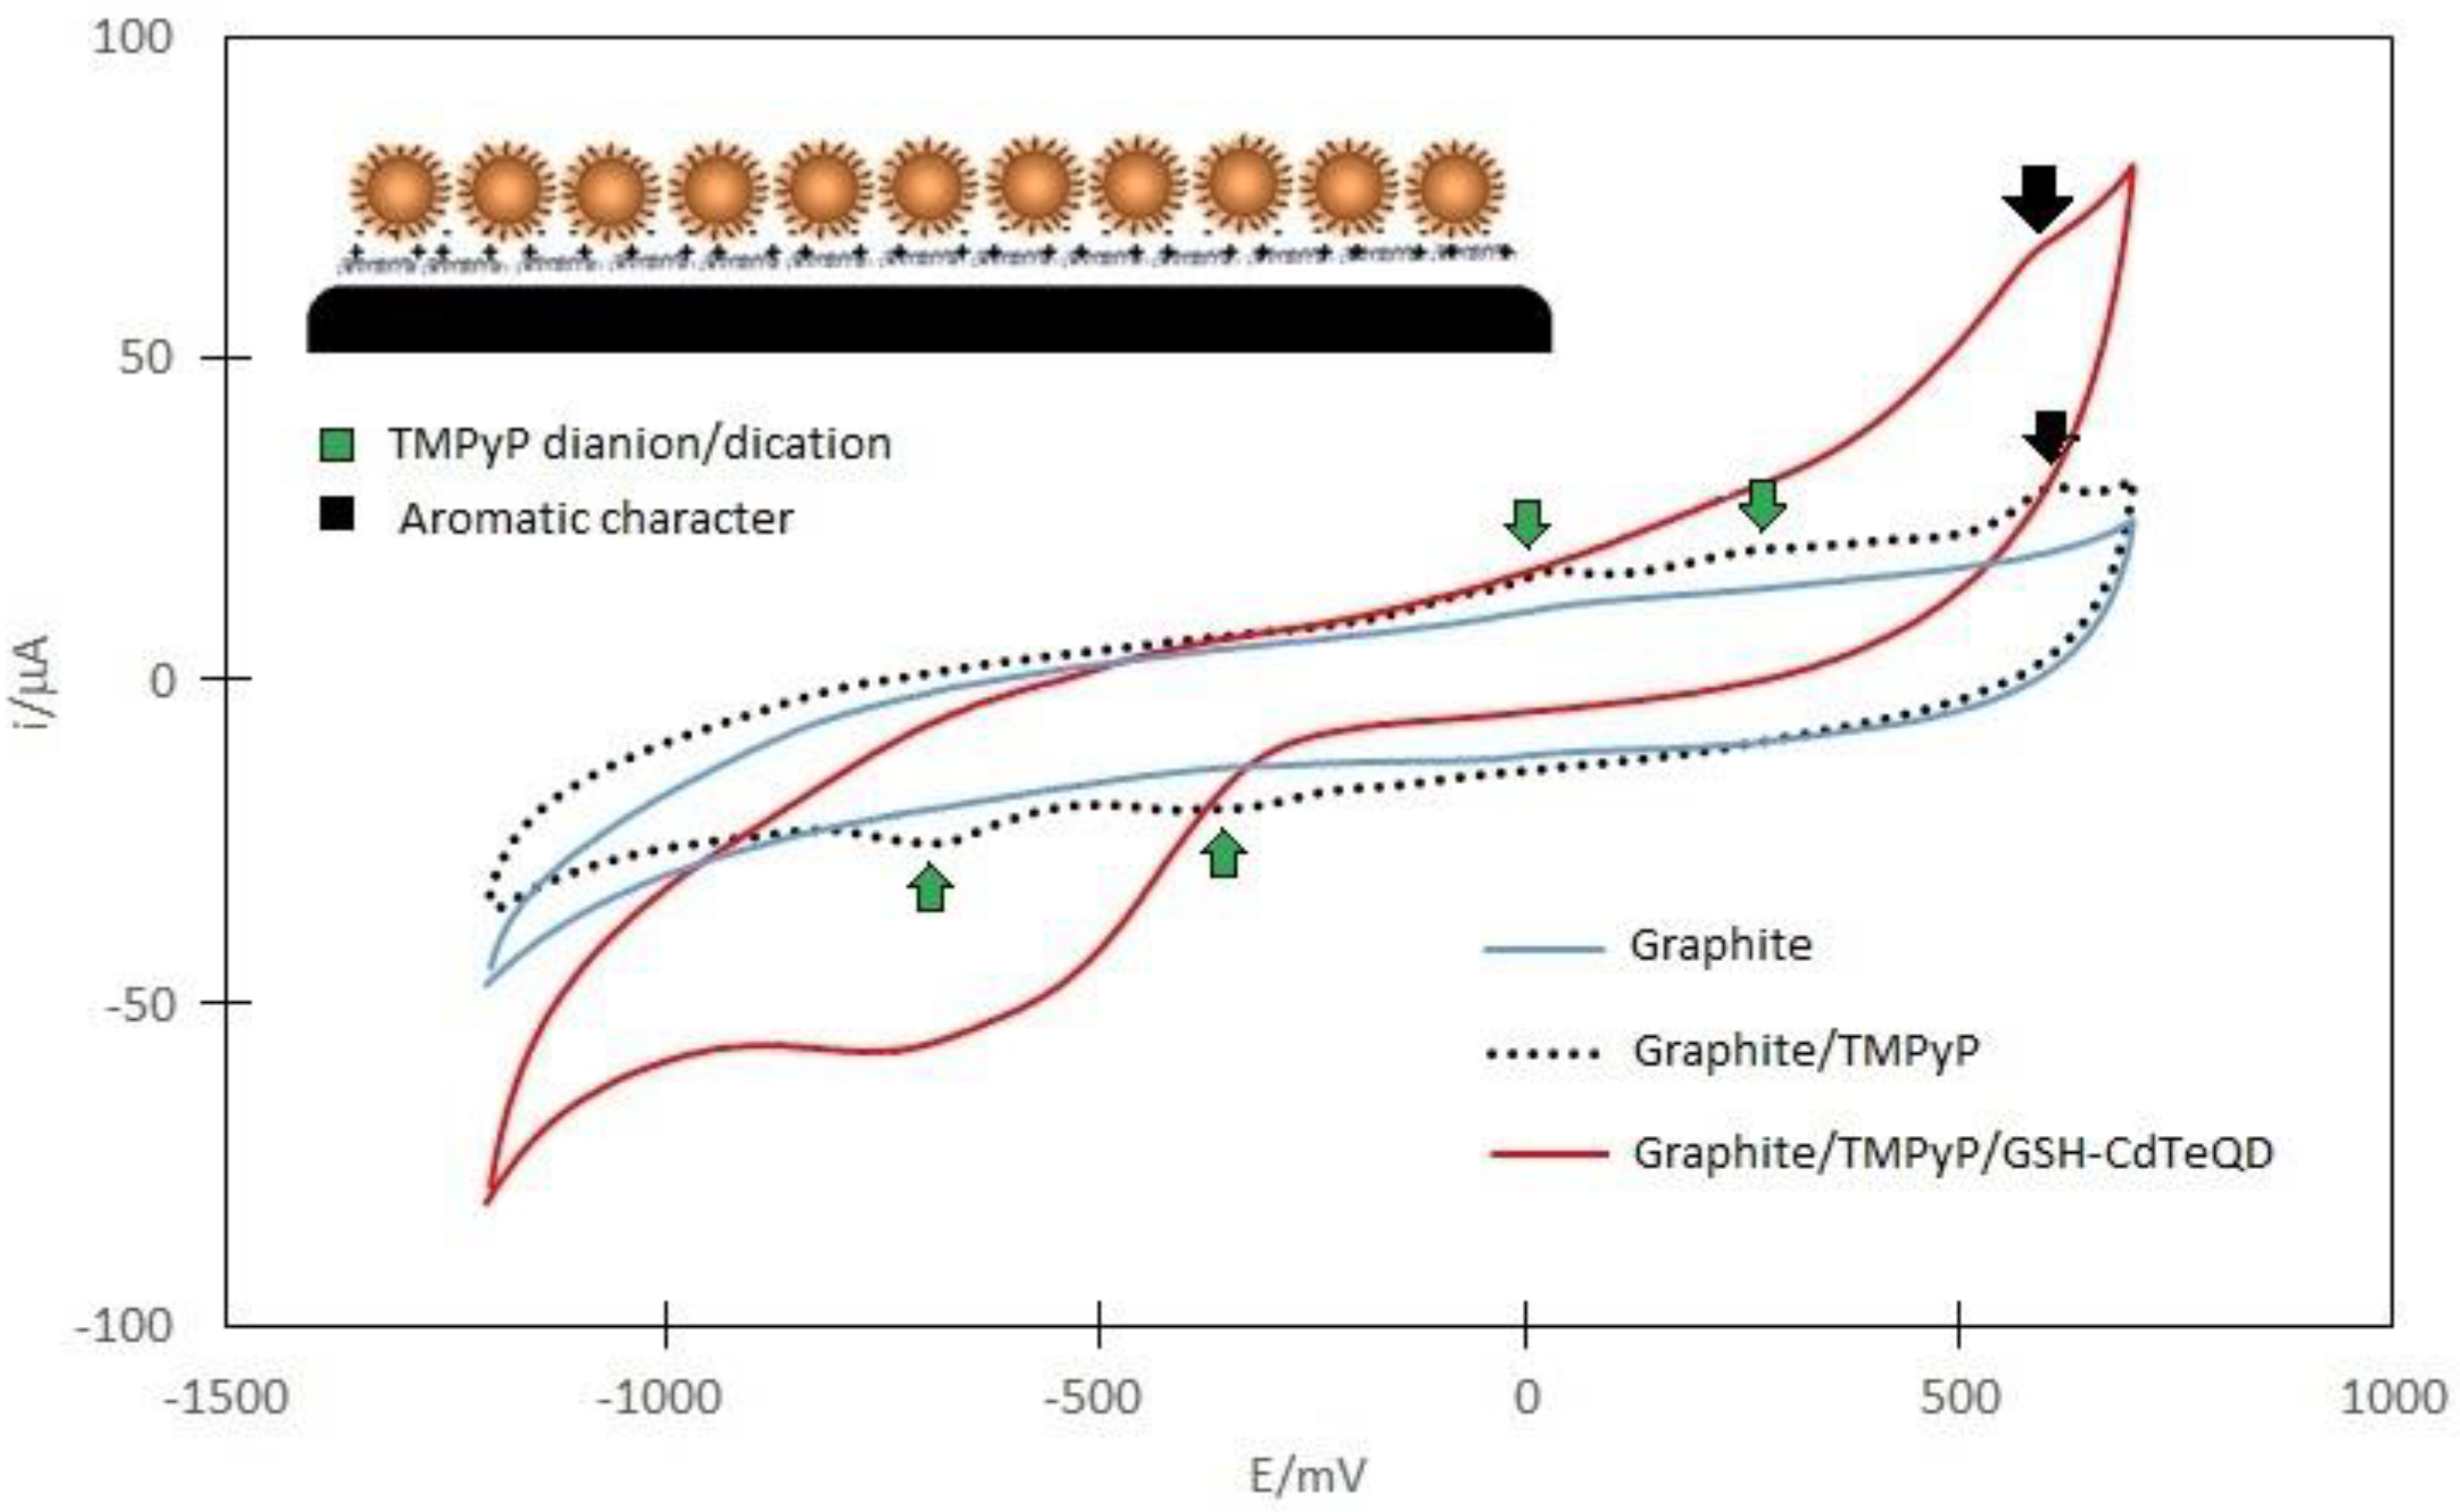
2.2. Electrochemical Analysis of TMPyP, GSH-CdTeQD and TMPyP/GSH-CdTeQD

After confirming the presence and interaction of TMPyP and GSH-CdTeQD on the carbonous surface, electrochemical measurements were performed to further characterize the TMPyP/GSH-CdTe assemble. The cyclic voltammetry analysis of the TMPyP deposited on the graphite showed a profile similar to those reported in the literature [54]. As shown in Figure 5 (dotted line), this molecule exhibits a pair of electrochemical processes at potentials of 25 and 255 mV in the anodic scan, and at −410 and −690 mV potentials in the cathodic scan, which are associated with the formation of a dication-dianion structure in the central nitrogen of the porphyrin macrocycle. It is also possible to distinguish a signal that appears at 620 mV in the anodic scan, which could be attributed to the oxidation of two delocalized π electrons, responsible for the aromatic character of the porphyrin ring [54,55]. These results suggest that TMPyP is effectively bounded to graphite. However, when depositing GSH-CdTeQD on the adsorbed TMPyP, the anodic signal almost completely disappears (Figure 5 red line), keeping only the π electrons-attributed peak, while in the cathodic region, the reduction signals seem to overlap with other reduction processes. This change could be due to the binding of the GSH-CdTeQD with the -NH groups present in the center of the macrocycle, while the conservation of the signal at 620 mV could be related to the electronic exchange occurring through the GSH-CdTeQD. It also seems that the system improves the oxygen evolution reaction (OER), since in the anodic scan, the OER onset potential begins at 450 mV; 200 mV less than those observed for graphite alone and graphite/TMPyP electrodes.

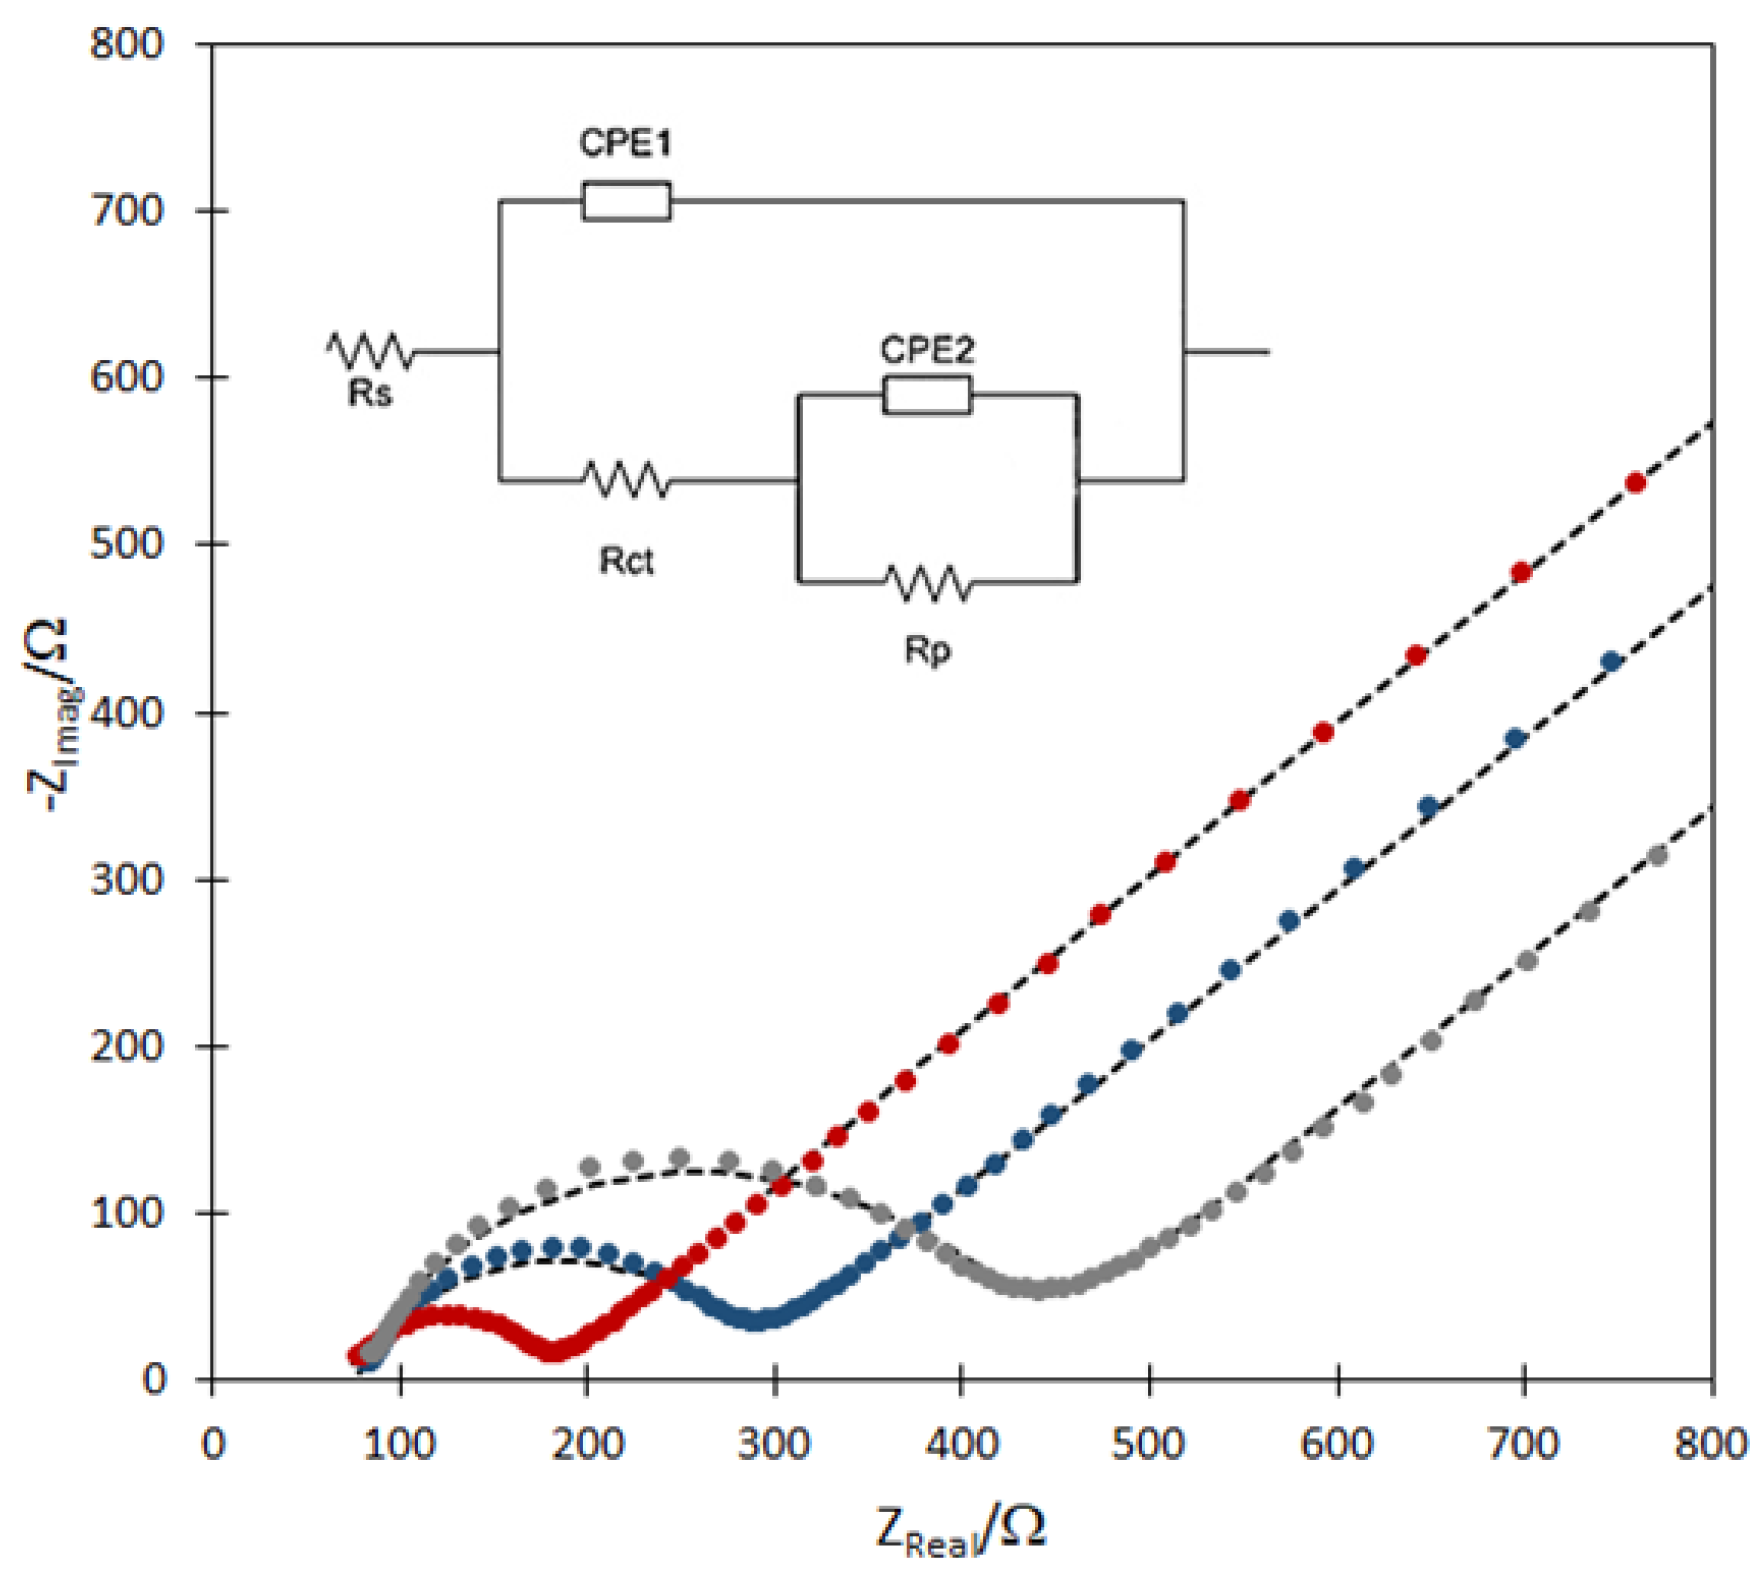
2.3. EIS for TMPyP and TMPyP/GSH-CdTeQD

In order to know the impedimetric properties of the self-assembled system, a GC electrode was analyzed by EIS before and after its modification with TMPyP and TMPyP/GSH-CdTeQD. A pair of K4Fe(CN)6/K3Fe(CN)6 was used as a redox probe, applying a small AC sine wave signal at its formal oxidation potential. In order to evaluate the charge transfer resistance (RCT) of the redox pair reaction and other impedance parameters of deposited materials, a GC electrode was used in the EIS experiments instead of graphite due to its higher conductivity properties and lower porosity [56,57,58]. The spectra obtained were adjusted to a modified Randles equivalent circuit, shown as an insert in Figure 6. Here, CPE1 is a constant phase element used to simulate the dispersed capacitance of the double layer, and a parallel circuit CPE2(RP) is employed to simulate the anomalous Warburg diffusion impedance observed in the multi-layered electrodes. The fitting of experimental impedance spectra to the proposed equivalent circuit was obtained by using the complex nonlinear least square LEVM free immittance program by Dr. J. Ross Macdonald [59]. A fine adjustment between the experimental EIS complex data (points) and fitting results (segmented curves) can be appreciated in Figure 6, this means that the proposed equivalent circuit can appropriately represent the complex layered electrode obtained. The complex impedance spectrum of the GC surface showed a depressed semicircle associated with the dispersed behavior of the electrode with an RCT value of 209 Ω, while in the GC surface modified with TMPyP, the RCT value decreased to 115 Ω. The charge transfer resistance was again increased up to 360 Ω after depositing the GSH-CdTeQD, as shown in Figure 6. The resistive behavior of these materials has already been described in the literature and can be related to the changes in electrostatic attraction to the anions of the redox probe when the electrode surface is modified. In this sense, the increase in RCT when immobilizing GSH-CdTeQD on a cationic porphyrin was reported in 2014 as associated with the immobilization of multiple “bilayers” of both materials on ITO electrodes [26]. On the other hand, the decrease in RCT when only TMPyP is deposited, can be attributed to an increase in the positive charge of the multilayer electrode; this is consistent with previous reports, which indicate that the immobilization of polypyrrole on graphite surfaces enhances the attraction of negatively charged ferrocyanide ions to the electrode surface, due to the positive charged amino groups contained in the pyrrole structure [60,61,62].

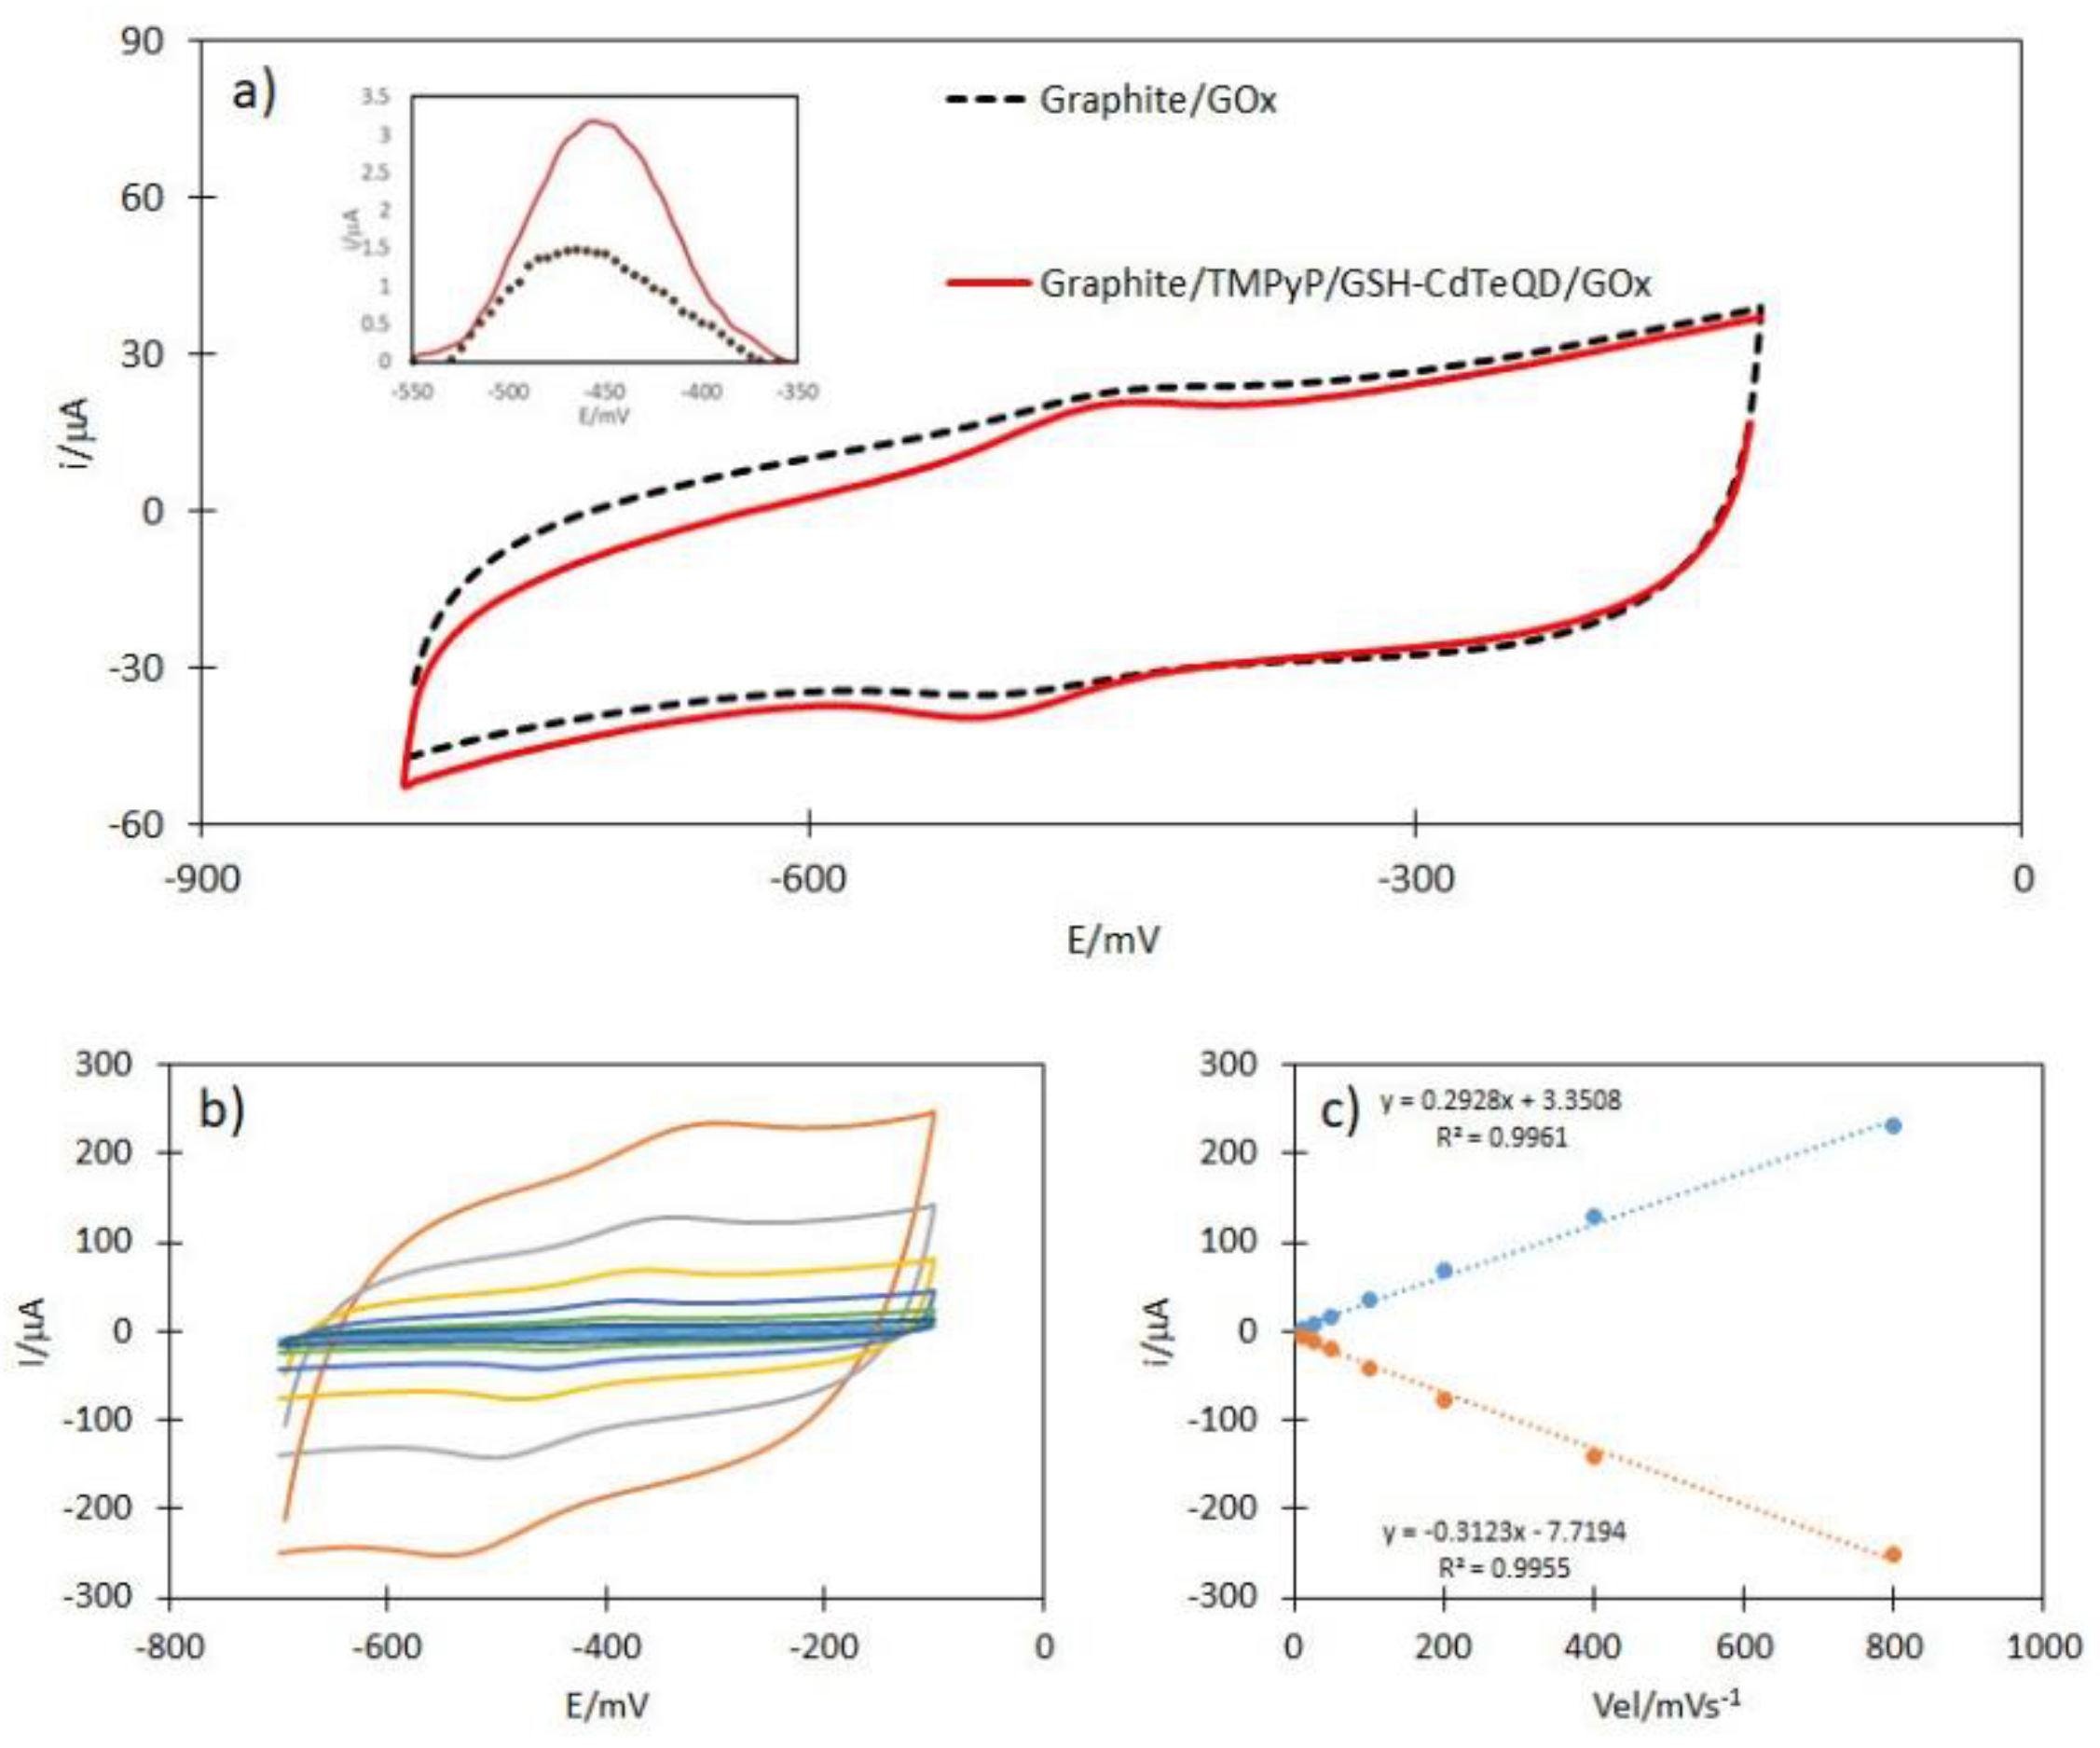
2.4. Electrochemical Analysis of GOx Immobilization

In order to make a comparison, GOx was deposited on a bare graphite surface and on a TMPyP/GSH-CdTeQD modified electrode, and the adsorption of the enzyme on both electrodes was evaluated by CV. The voltammograms obtained are presented in Figure 7a, where the difference in current response between the electrodes can be noted. A closer view of the voltammograms peaks near to −450 mV after the base lines were subtracted are shown in the insert. A notable increase in the oxidation current related to the FAD/FADH2 redox pair is observed in the electrodes modified with TMPyP/GSH-CdTeQD, compared with those in which only GOx was deposited. The higher measured current suggests that the TMPyP/GSH-CdTeQD system allows it to immobilize a larger amount of enzyme than pure graphite does.
According to several authors [63,64,65,66,67], the peak oxidation current of the FAD could be related with the amount of immobilized enzyme according to the Brown Anson Equation (Equation (1)), where iP is the peak oxidation current of FAD+2, A is the geometric area of the electrode, v is the scan rate, Γ is the concentration of GOx adsorbed on the electrode, F is the Faraday constant, T is the system temperature, and R is the universal gas constant. This equation indicates that the higher the oxidation current, the greater the amount of immobilized GOx. Hence, 1 × 10⁻¹⁰ mol cm−2 of adsorbed GOx could be evaluated in simple graphite, while in the surface modified with TMPyP/GSH-CdTeQD, the calculated adsorption was 2.3 × 10⁻¹⁰ mol cm−2. This means that the adsorption of GOx is improved in the TMPyP/GSH-CdTeQD modified electrode. The founded adsorbed concentration value is within the common range of the GOx amount immobilized onto other modified surfaces [68,69,70].
i P = n 2 F 2 v A Γ ° * 4 R T
With the purpose of confirming the enzyme adsorption on the self-assembled system, a TMPyP/GSH-CdTeQD/GOx modified electrode, was analyzed by CV at different potential scanning rates and the increase in the current of the redox pair was registered, Figure 7b. Linear correlation graphs between the peak oxidation and reduction currents versus thee scan rate are presented in Figure 7c. According to the literature, this linear behavior indicates that the voltammetry response of the modified electrode corresponds to a surface-controlled process, which mean that the enzyme is strongly adsorbed on the electrode. Employing the Laviron equation (Equation (2)), it was possible to calculate the constant of the electron transfer rate (Ks), which is a measurement of the capacity of a system to facilitate or improve the electronic transfer during an electrochemical reaction.
l o g K s = α l o g 1 α + 1 α l o g α l o g R T n F v α 1 α n F Δ E p 2.3 R T
In this equation, α is the charge transfer coefficient, obtained from the angular coefficient of the line that is formed by graphing Ep vs. the logarithm of the scan rate, υ is the scan rate and ∆Ep is the separation of the redox peaks of the FAD/FADH2 pair. An α value of 0.43, and a Ks value of 4.91s−1 were obtained, which, when compared with previous reports, indicates good electronic transfer capacity [71,72,73].

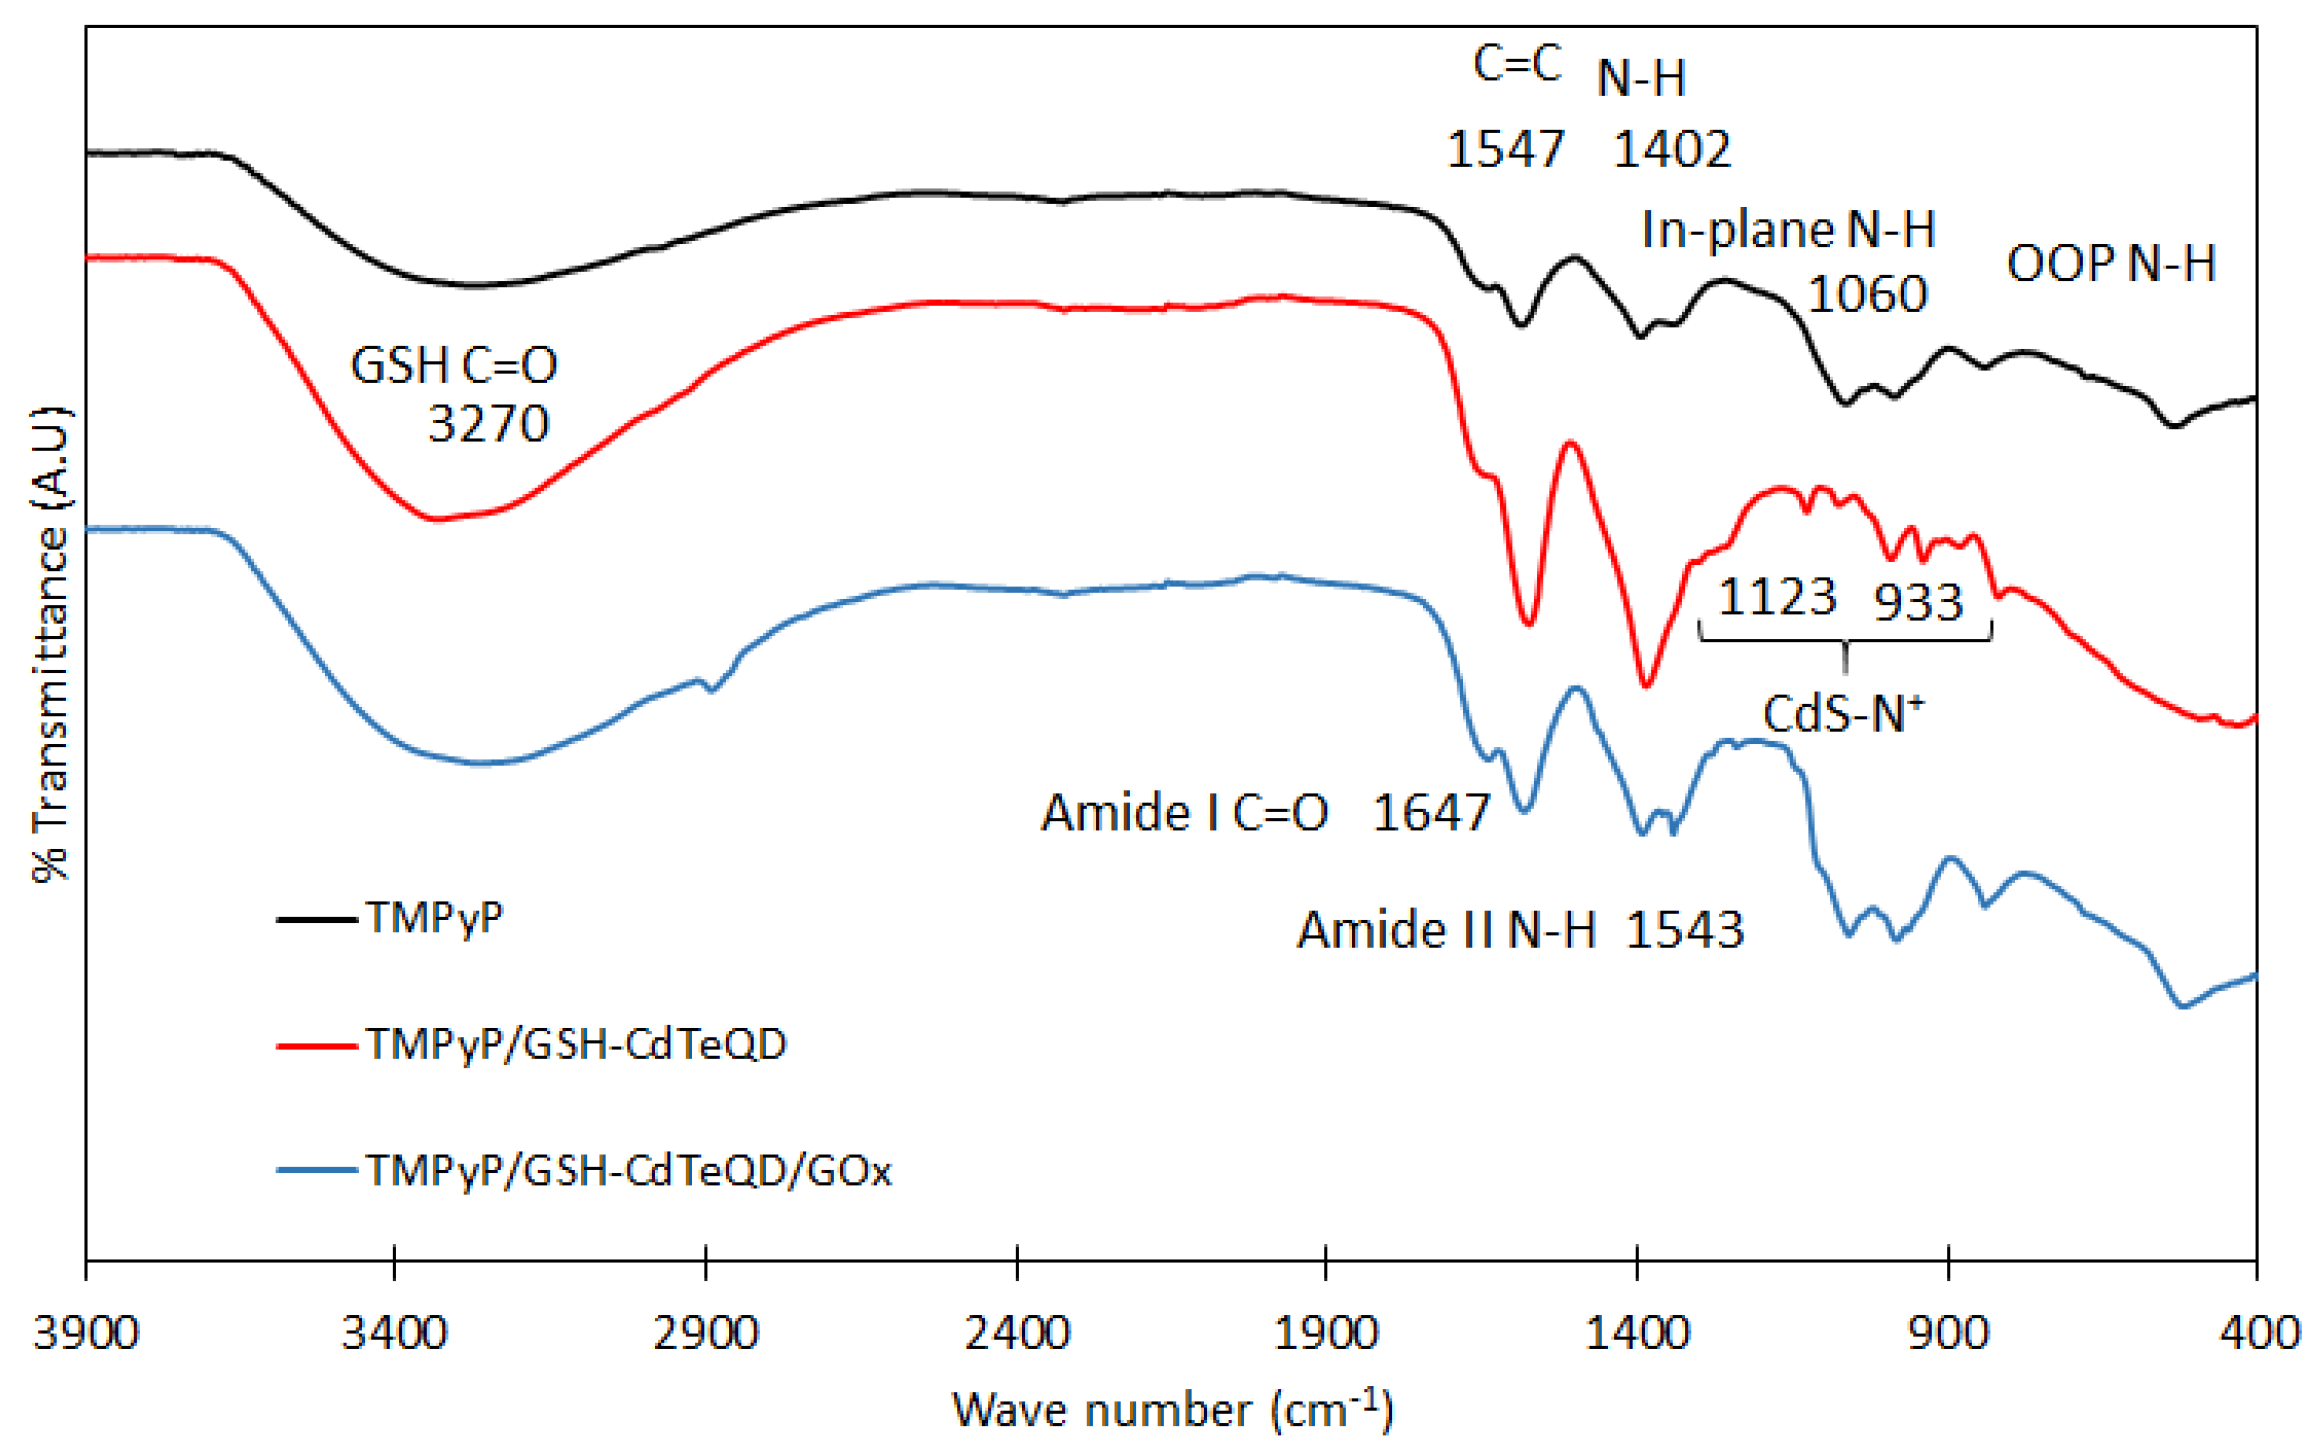
2.5. Physicochemical Analysis of Anchored GOx

GOx deposited over the TMPyP/GSH-CdTeQD system was also characterized by FTIR. The spectrum obtained for TMPyP only deposited on the carbonaceous surface (Figure 8, black line) exhibits bands at 542 cm−1 corresponding to the out-of-plane (OOP) vibrations of the tetrapyrrole ring; it also appears as a broad band at 660 cm−1, which could belong to deformations in the plane of TMPyP. Characteristic bands attributed to the amino groups present in the structure of the macrocycle and the pyridinium substituents can be observed at 830, 1060, 1402 and 1647 cm−1 [50,74]. On the other hand, the red line in Figure 8 shows a quite different FTIR spectrum of TMPyP/GSH-CdTeQD. Although in the TMPyP spectrum the curve around 3270 cm−1 is wider, and slightly less intense, when GSH-CdTeQD has been aggregated, this signal becomes more pronounced and defined. This band is related to the presence of carbonyl groups of GSH covering the GSH-CdTeQD system. In addition, new signals are observed at 933 and 1123 cm−1, which have been reported as characteristics of interactions between the CdS and pyridyl group of TMPyP [75]. Assuming the formation of CdS on the surface of the GSH-CdTeQD, these bands allow us to corroborate the union between TMPyP and GSH-CdTeQD, not only through the amino groups of the tetrapyrrole ring, but also through the pyridinium groups that are part of its structure.
Finally, the spectrum obtained for the TMPyP/GSH-CdTeQD/GOx system, shown in Figure 8 (blue), showed a set of bands corresponding to a mixture of signals of the two spectra previously described; besides which, there was the presence of characteristic signals for Gox at 1647 and 1543 cm−1, corresponding to I and II amides, respectively, thus corroborating the presence of the enzyme over the self-assembled system [76,77].
The analysis by EDS coupled to SEM allowed us to confirm the atomic composition of the materials present in the TMPyP/GSH-CdTeQD/GOx system, as shown in Table 2. It can be observed that the presence of cadmium and tellurium correspond to the composition of the Quantum dots, with an approximate ratio for the Cd:Te of 3:1; literature reports similar ratios when GSH-CdTeQD has been evaluated by EDS [78]. Additionally, EDS indicates the presence of a sulfur characteristic of the GSH used as a ligand, and probably of amino acids such as cysteine and methionine present in the GOx protein structure [79]. Chlorine and sodium atoms were detected and could correspond to PBS residues used as the solvent for GOx; while the carbon and oxygen detected can be associated with the organic compounds of the enzyme, TMPyP and GSH.

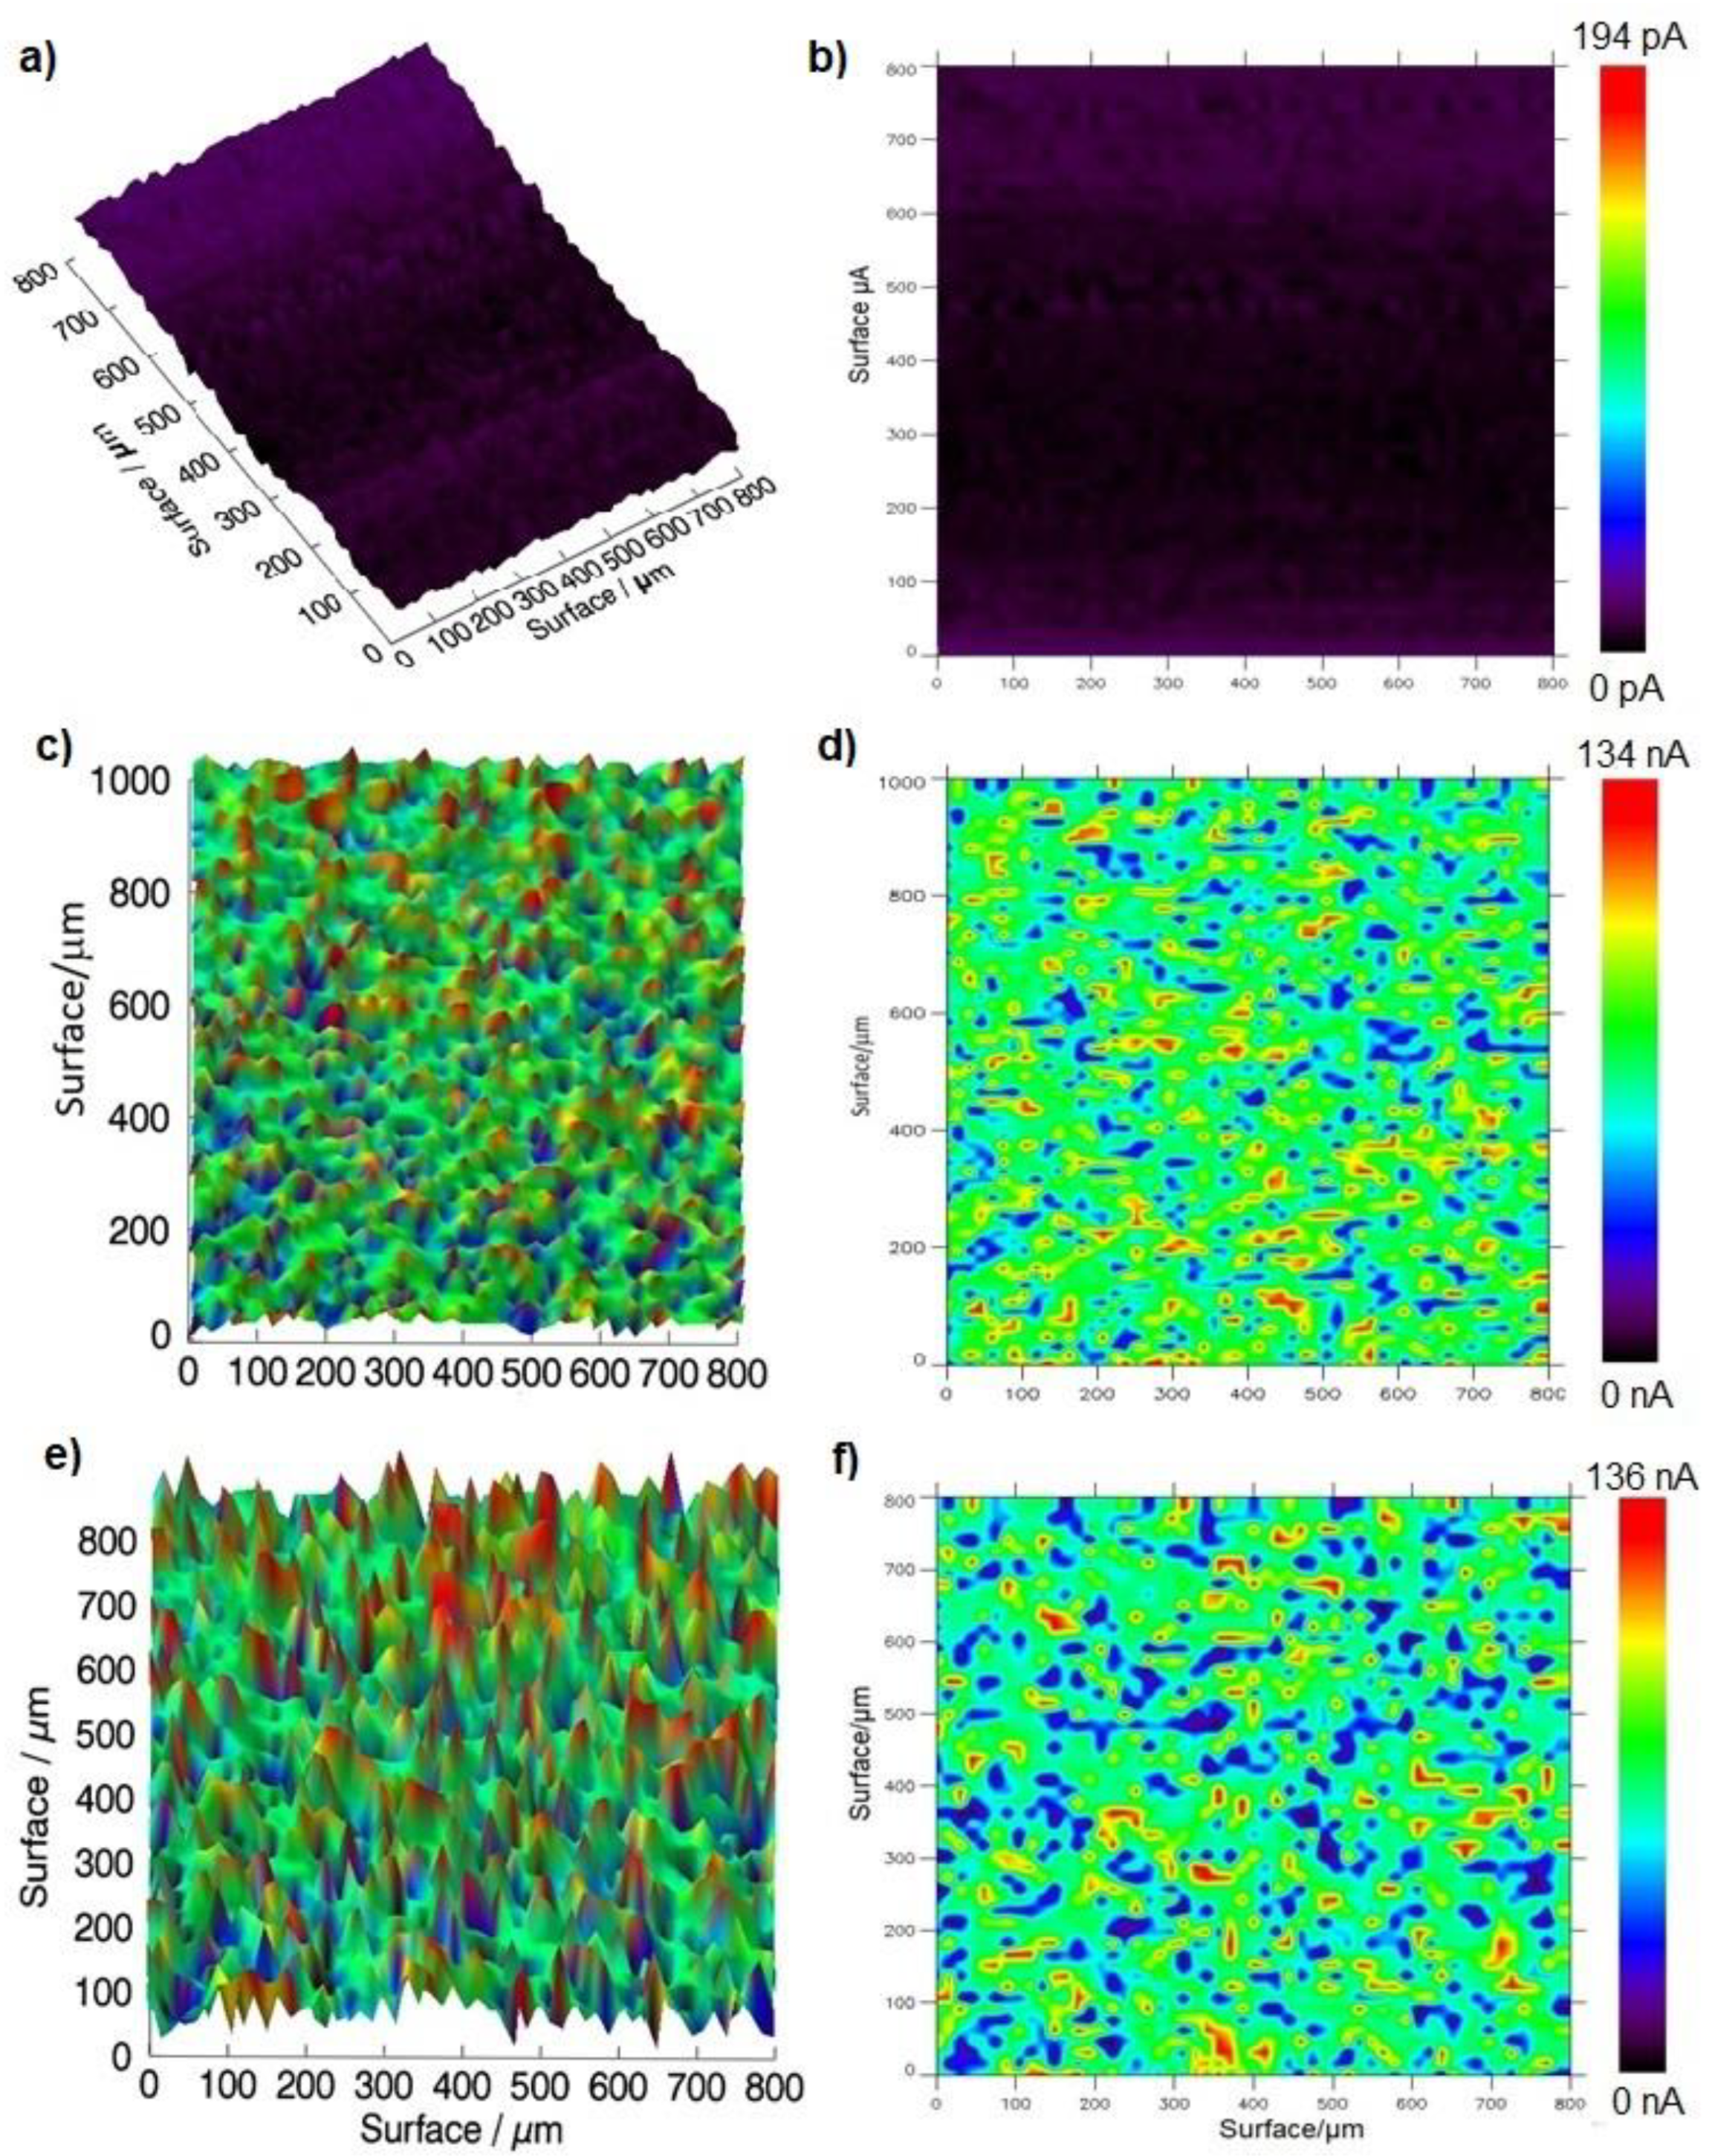
2.6. Evaluation of TMPyP/GSH-CdTQD/GOx Electrodes by Scanning Electrochemical Microscopy

A useful test to evaluate the presence and activity of GOx anchored to a surface is Scanning Electrochemical Microscopy (SECM) [80,81,82]. A TMPyP/GSH-CdTeQD/GOx modified graphite electrode was evaluated by SECM in the absence and presence of 5 mM glucose to verify its enzymatic oxidation onto the electrode’s surface. It was observed that when GOx is not anchored to the electrode, even in the presence of glucose, the oxidation does not take place as can be proved by the near to zero current measured in scanning. A similar behavior is obtained for the scanning of an electrode with immobilized GOx but with the absence of glucose in the cell, as shown in Figure 9a,b. In this case, the enzyme cannot perform any catalytic reaction, and the measured currents are again negligible. In contrast, after the addition of glucose 5 mM, an increase in the surface scanning current of the electrode could be observed, Figure 9c,d, due to H2O2 produced by enzymatic glucose oxidation according to the mechanism represented by reactions (3) and (4). The resultant scanning current was measured by applying a 0.7 V potential at the tip scanning electrode, corresponding to the oxidation potential of H2O2 on a platinum surface [83]. The catalytic current was observed in different surface regions with a pattern that suggests that GOx, in addition to being present and active on the electrode, is homogeneously distributed by the whole scanned area.
GOxox + Glucose− > GOxred + Gluconolactone
GOxred + O2− > GOxox + H2O2
Taking as a reference the color scale shown in the right bars of Figure 9, in the images obtained for the electrodes in the absence of glucose, Figure 9a,b, the purple-blue region was designated as the “zone without enzymatic activity”. In correspondence, the term “enzymatically active zone” can be assigned to the regions with a color between green and red [72]. Using ImageJ software, the percentages of possible coating of the surface with electrochemically active enzyme were estimated by means of an RGB analysis of the image, obtaining 71% of colors between green and red, and 29% of colors in the blue range, which suggests that at least 70% of the surface oxidizes glucose or is functionalized with GOx.
The same GOx-modified surface was scanned in the presence of the mediator FcMeOH and 5 mM glucose, by applying a potential of 0.25 V to the tip vs. SCE, which correspond to the FcMeOH redox potential. It can be observed that a similar behavior to those obtained in the H2O2 production reaction occurred, as shown in Figure 9e,f. In this case, despite the fact that the current peaks apparently are more pronounced, the current values measured remain in the same range as those obtained in the peroxide detection, which makes it possible to corroborate the activity of the immobilized enzyme both by the production of H2O2 and by the mediator method [80,84].
Raith reported a similar method based on Red-Green (RG) analysis to demonstrate the immobilization of glucose oxidase on a gold surface, in order to study the enzymatic activity by SECM employing the “substrate generation-tip collection method” [85]. By delineating the specific zone of enzyme immobilization with the use of tapes containing holes of different diameters, he demonstrated the ability of SECM to detect zones with higher, lower or null enzyme activity. In this report, the difference between zones with and without GOx is clearly observed through the reddish colors resulting from the increase in current, attributed to the catalytic activity of the enzyme, which contrast with the dark green of the zones lacking enzyme. Although the reported current values are not fully comparable with those obtained here, mainly due to the distance between the probe and the surface, the experimental design offers an interesting alternative for the analysis of localized catalytic activity on a surface [86].

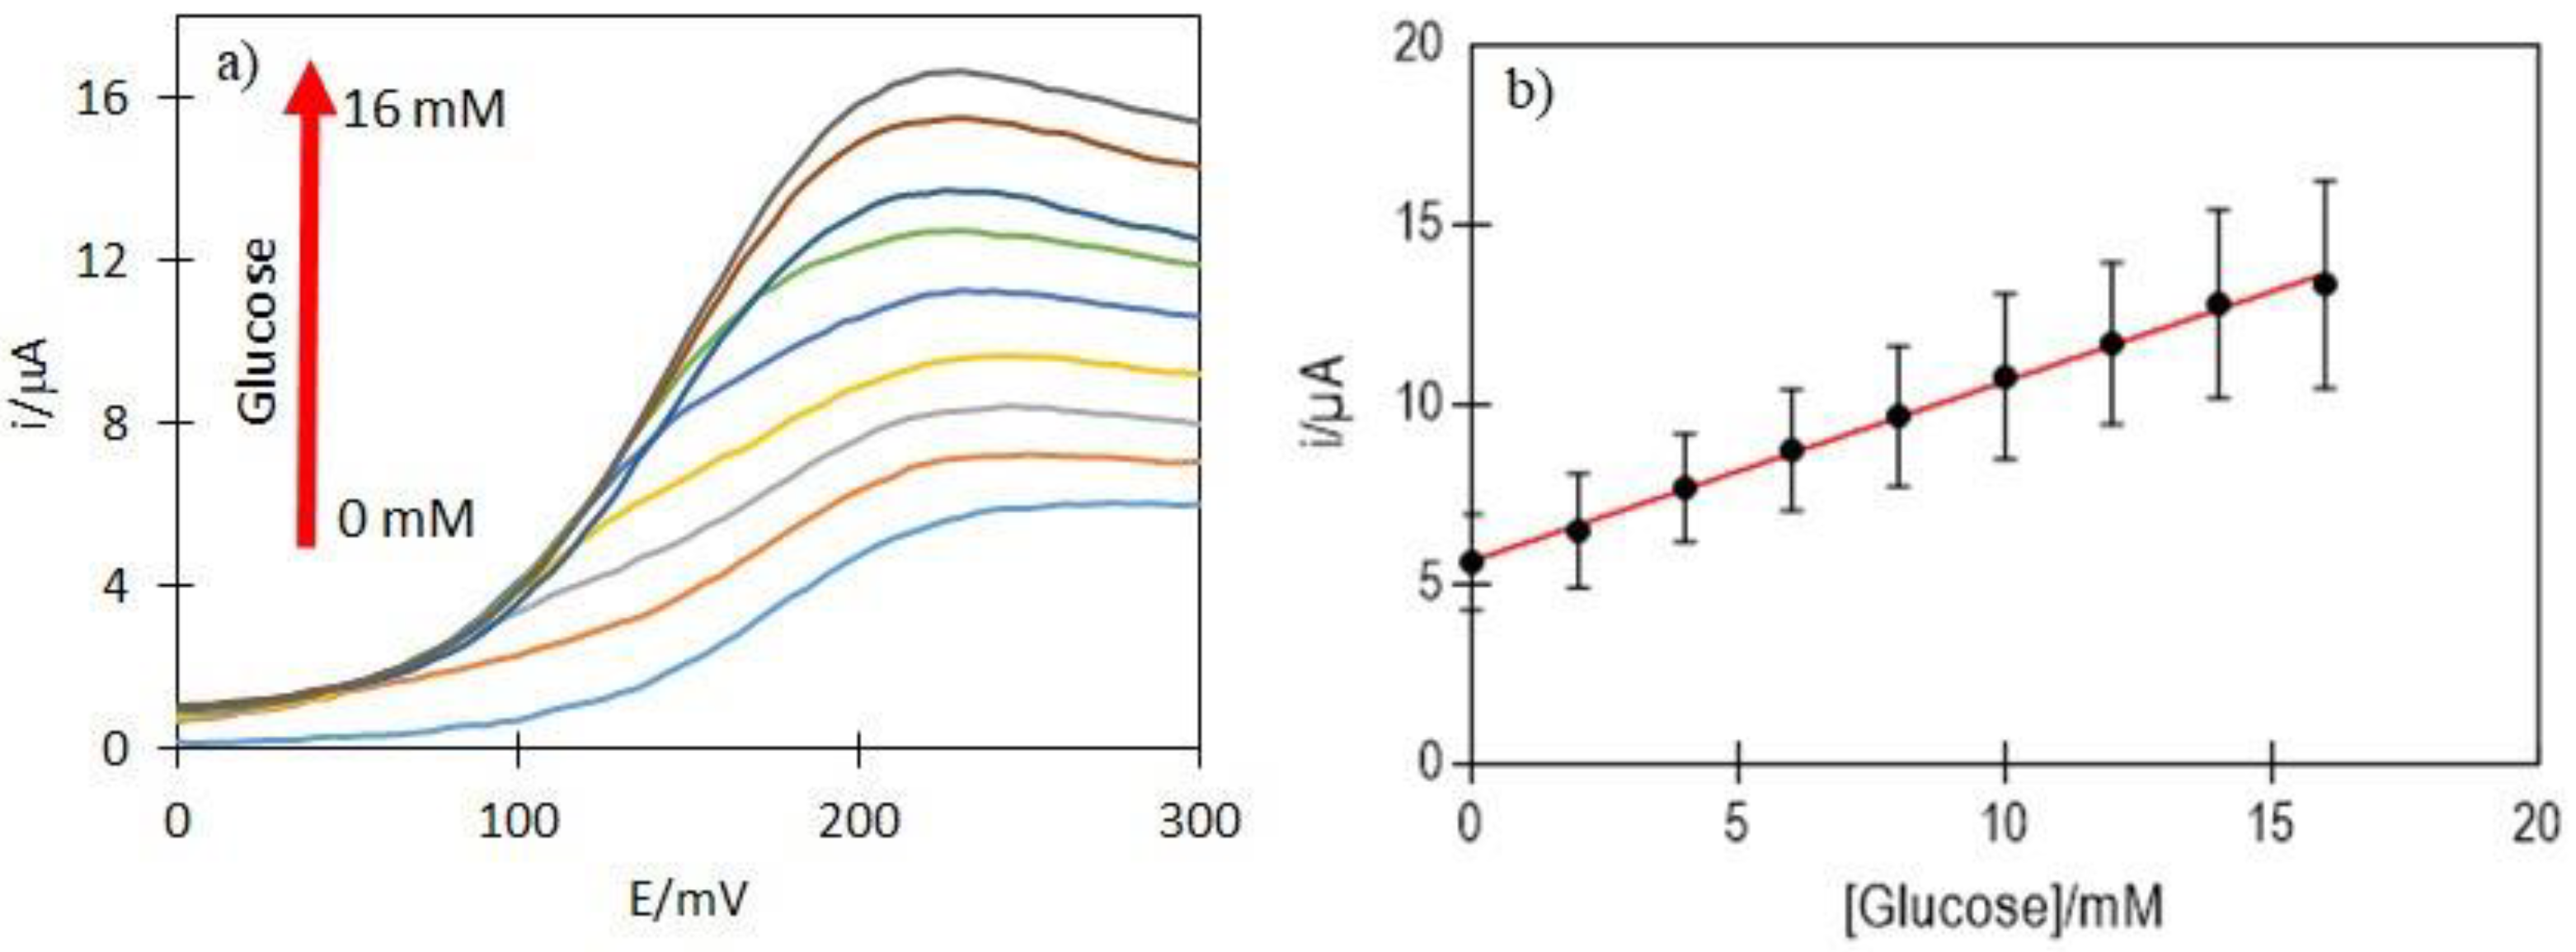
2.7. Amperometric Response of TMPyP/GSH-CdTeQD/GOx Electrodes to Glucose

Enzymatic electrodes were evaluated in the presence of FcMeOH as an electro carrier mediator between the deep active center of GOx and the surface of carbon electrode. The ferrocene-methanol molecule has a characteristic redox pair whose current increases as a function of glucose concentration oxidized by GOx. The modified TMPyP/GSH-CdTe/GOx graphite electrode produced a monotonic increase in current of around 1.2 μA when glucose concentration reaches a value of 2 mM. A saturation point is obtained for a 16 mM glucose concentration corresponding to a current near to 16.2 μA (10.3 μA more than a current of 5.9 μA corresponding to 0 mM), which suggests that enzyme adsorbed onto an electrode, conserves its catalytic activity. Furthermore, the signal measured at this electrode was stable, and the current increased linearly as a function of glucose additions, Figure 10a. The response of the enzymatic arrangement was reproducible on seven different graphite electrodes, with a sensitivity of 0.58 ± 0.01 μA/mM, in the linear range from 2 to 16 mM, Figure 10b. The apparent Michaelis constant for the enzymatic reaction obtained from imax vs. glucose concentration data (GraphPad Prism®) was 7.8 mM, indicating a good affinity of the enzyme for the substrate. Due to reproducibility, stability, linear range and ease of deposit, these results indicate that the TMPyP/GSH-CdTeQD/GOx arrangement is an appropriate option for GOx immobilization in biosensor design [5,70].

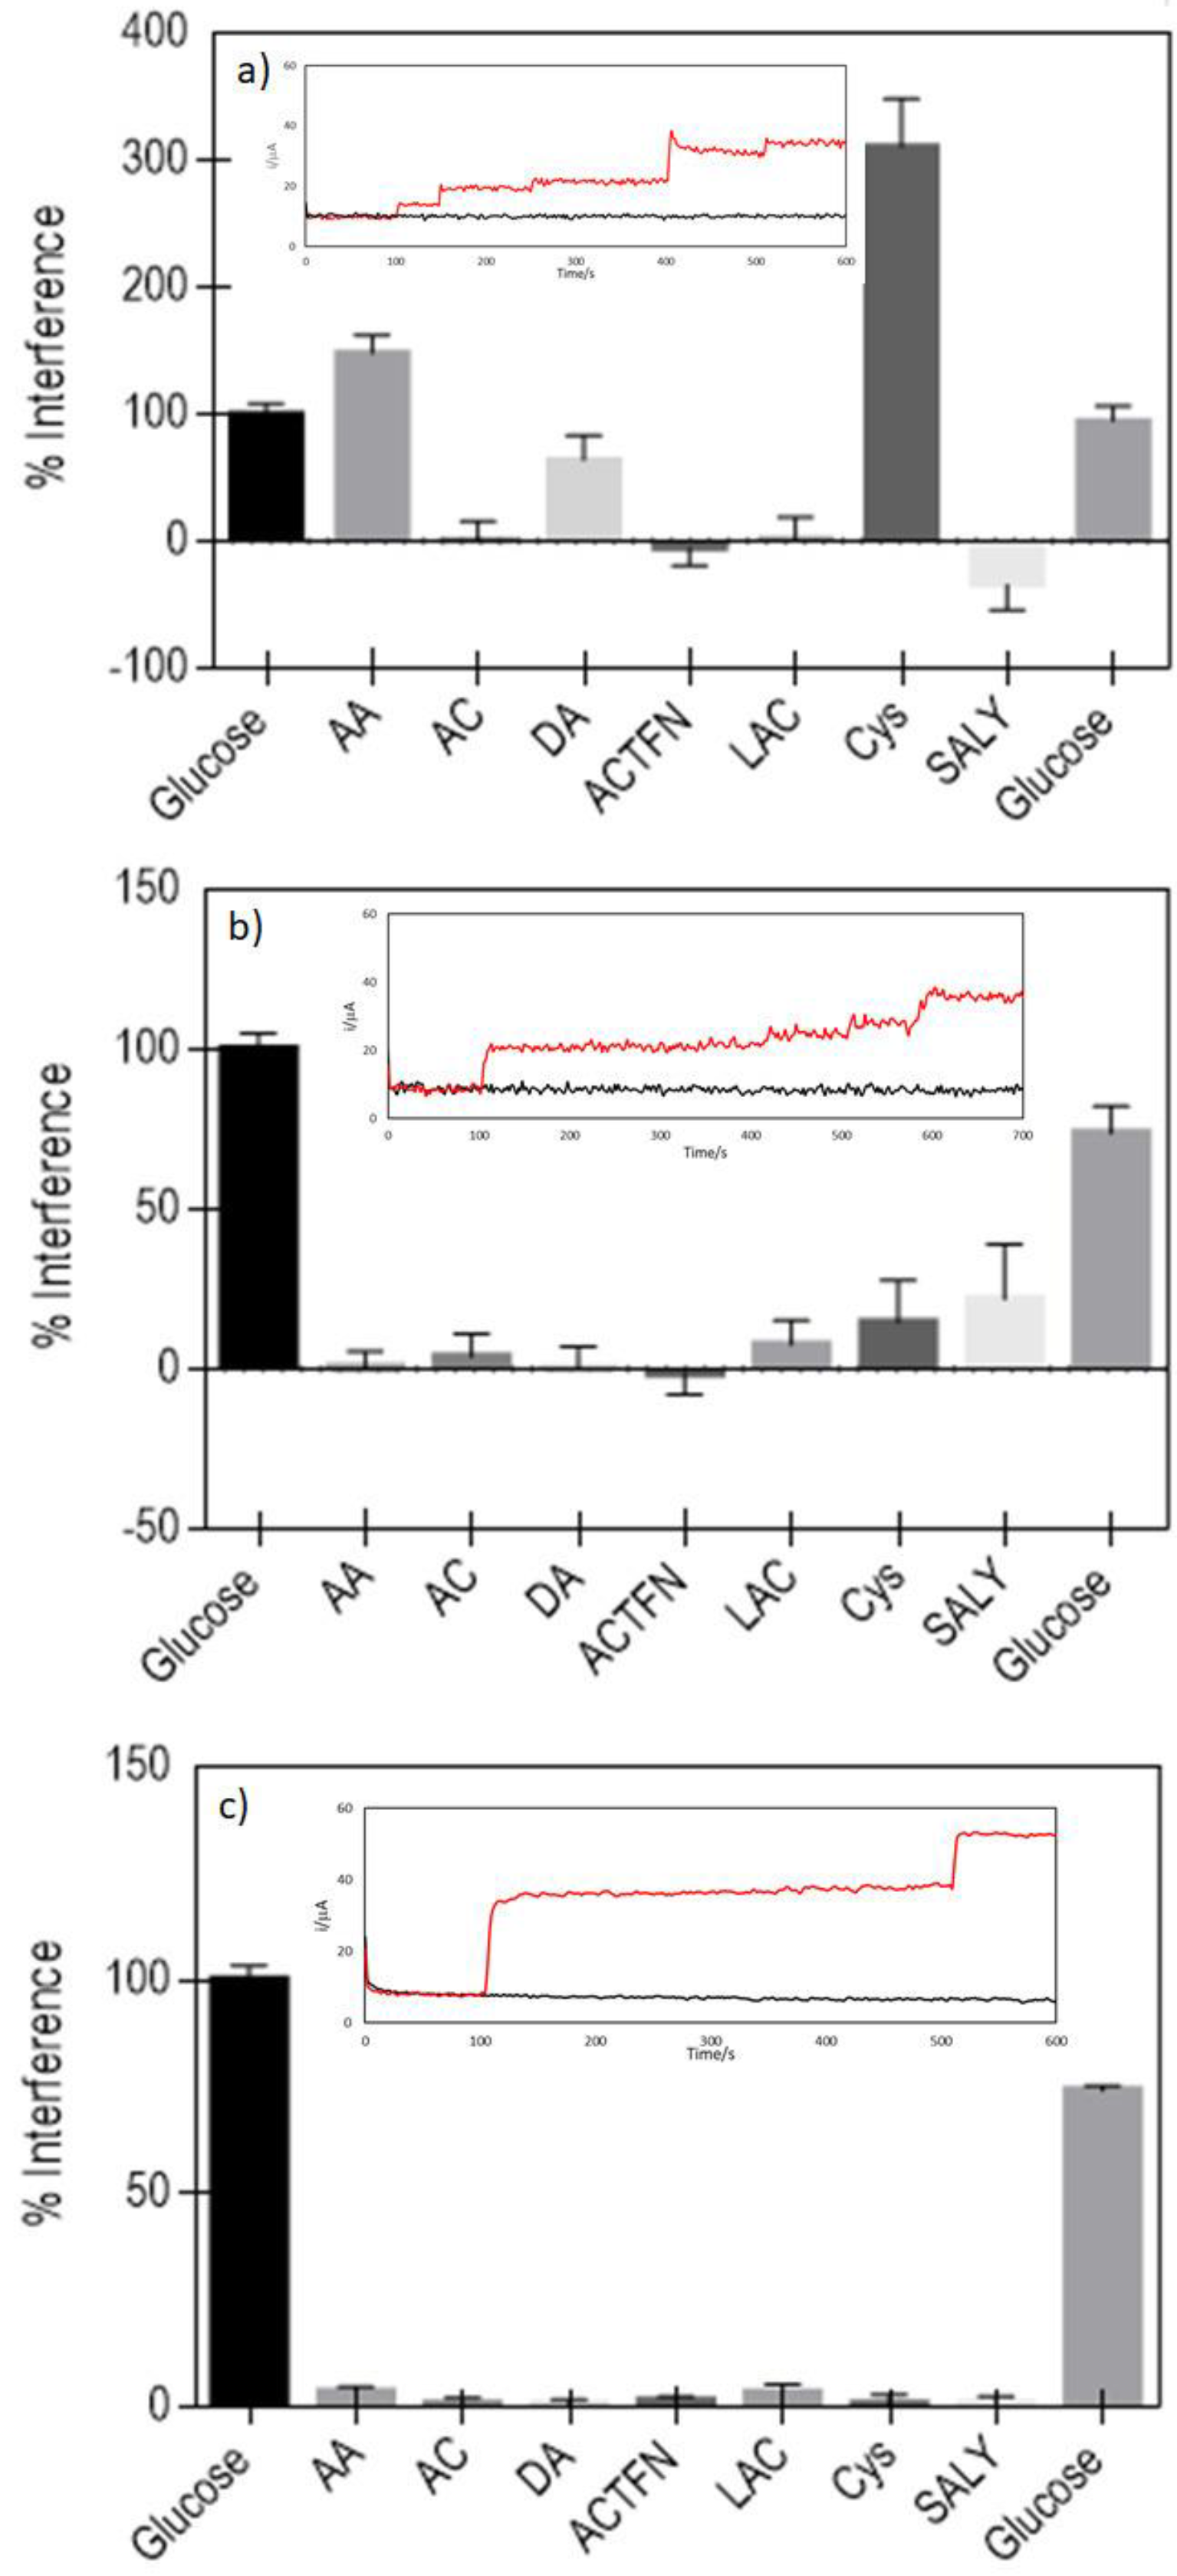
2.8. Interferents Assay

In addition to analytical sensitivity, one of the most important characteristics in the development of enzymatic electrodes with potential use in biosensors, is its selectivity to the analyte (glucose for the GOx-modified electrodes). The TMPyP/GSH-CdTeQD/GOx electrodes were evaluated by chronoamperometry under stirring, adding glucose and the interferents: ascorbic acid (AA), citric acid (AC), dopamine (DA), acetaminophen (ACTFN), lactose (LAC), L-Cysteine (Cys), and acetyl salicylic acid (SALY), all of them at concentrations higher to those found in a physiological environment.
As can be seen from Figure 11a, AA, DA and Cys induced a large current increase, causing 148, 64 and 311% of interference, respectively, taking as a reference the current attributed to glucose; so it can be argued that these compounds could be considered as strong interferents for the TMPyP/GSH-CdTeQD/GOx system. This result indicates that this electrode arrangement is not suitable for use in a glucose biosensor. It is already known that AA interacts with the QDs of CdS [87]; this way, the high sensitivity of the modified electrodes to interferents could be explained by assuming that gaps exist in the surface of the electrode that have not been coated by GOx, leaving sites where interferents such as AA could interact with the exposed GSH-CdTeQD complex of the electrode causing an increase in current.
In order to reduce the contribution of such interferents, electrodes modified with TMPyP/GSH-CdTeQD/GOx were incubated with bovine serum albumin (BSA) for 30 and 90 min; as this protein is smaller than Gox, it could penetrate easily toward the sites not covered by the enzyme [88]. As shown in Figure 11b, when the BSA is used as a blocking agent, although it remains a small signal due to the interferents, their current contribution is drastically reduced. The best result is observed in Figure 11c corresponding to 90 min of BSA incubation, where it can be seen that the contribution of interferents is negligible, and the only increase in current is that corresponding to the glucose addition. Moreover, in Figure 11b, it can be observed that there is less noise current response despite a high stirring speed being used. It can be concluded that the performance of the TMPyP/GSH-CdTeQD/GOx immobilization system improves in selectivity when BSA is added on the surface with a 90 min incubation period. Izadyar et al. found a similar behavior and observed that the incorporation of BSA into electrodes modified with GOx and a recombinant Mn peroxidase, significantly improved the electrochemical detection of glucose. This effect is mainly attributed to the strong intermolecular interaction that exists between BSA and the enzymes, as well as the great stability of this blocking protein, which would improve the microenvironment on the electrode surface, providing support and extending the lifetime of the immobilized enzymes [88].

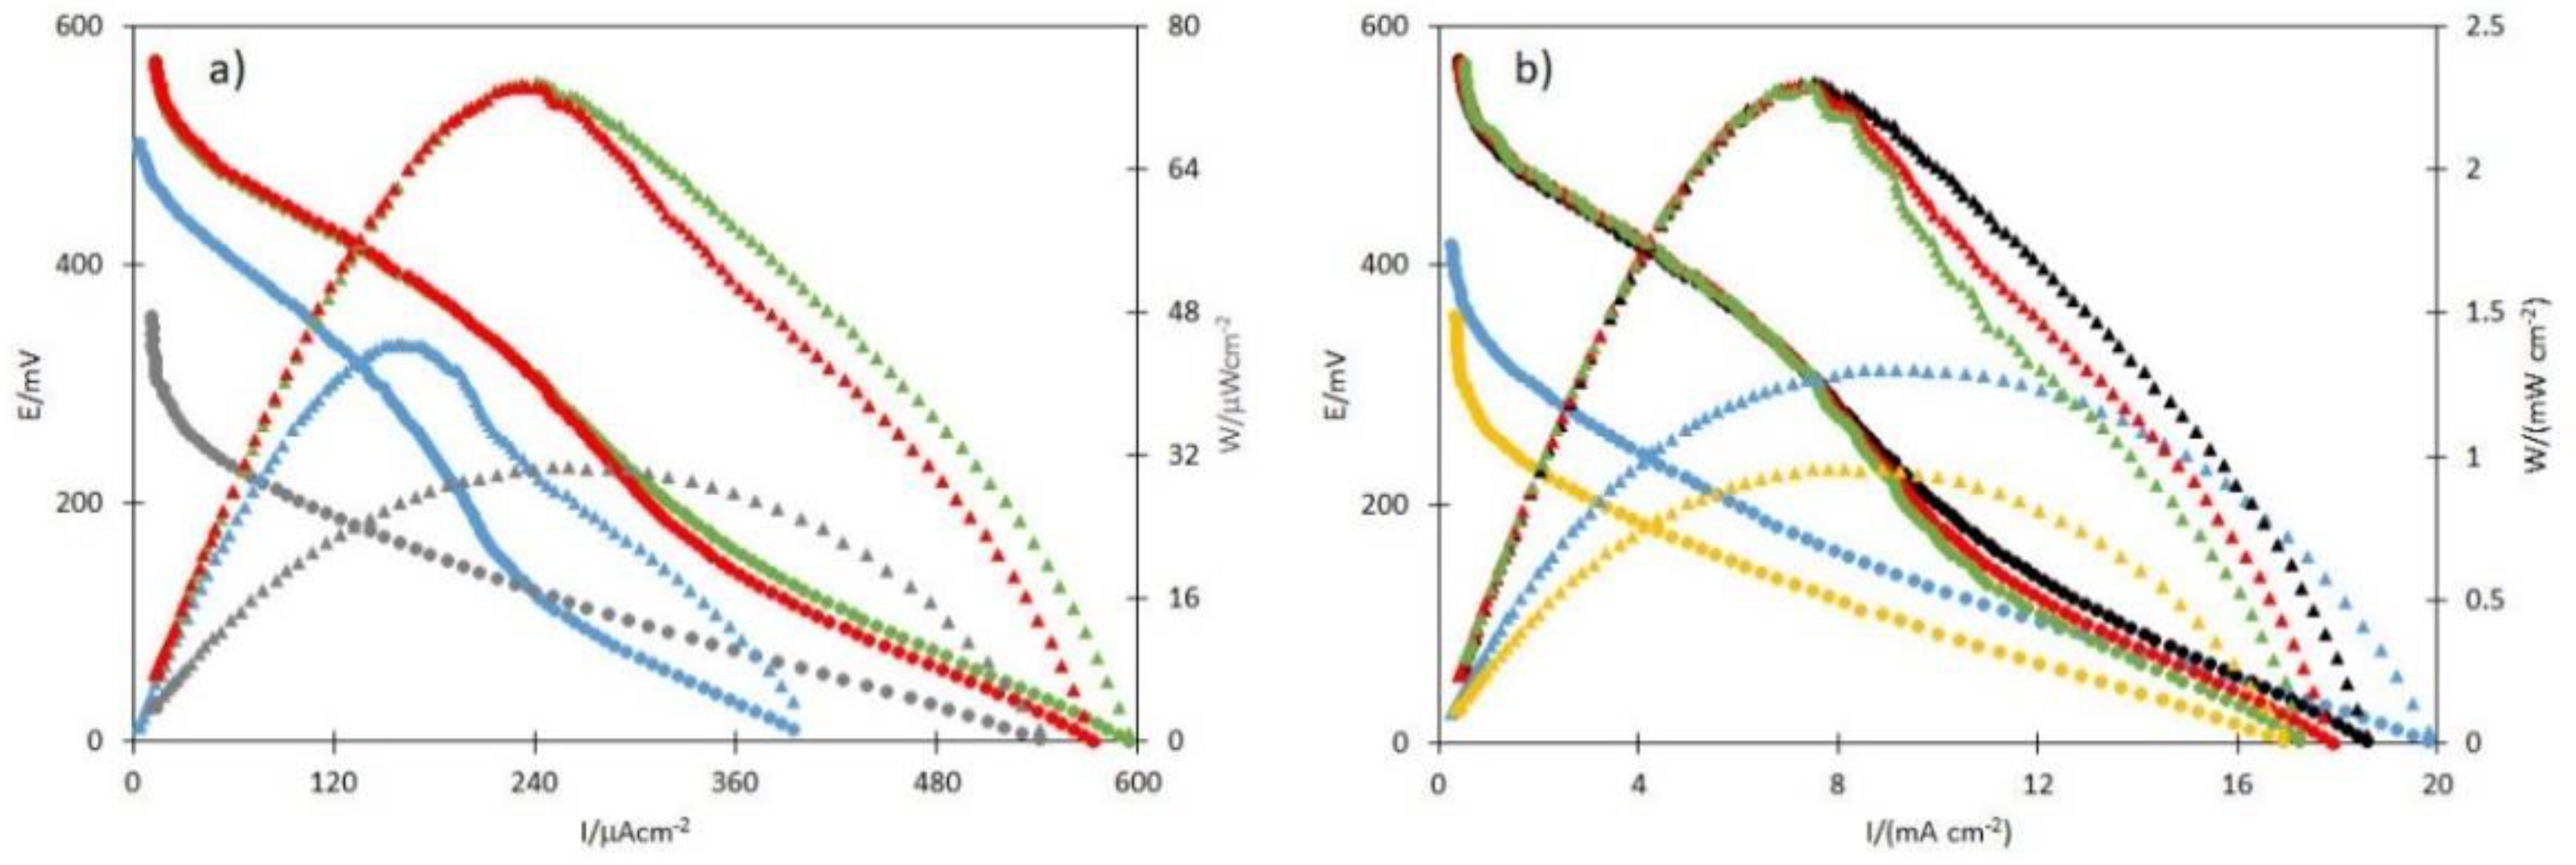
2.9. Performance of Glucose Microfluidic Fuel Cell

Finally, in order to complement the glucose oxidation activity study, the performance of the TMPyP/GSH-CdTeQD/GOx bioelectrode was tested in a μBFC for energy generation.
In this case, glucose concentrations of 10, 20 and 50 mM were used as combustible materials in the anolyte. The microfluidic fuel cell results obtained are shown in Figure 12a. Without glucose, the system reached a power value of 0.95 mW cm−2 with an open circuit potential (OCP) of 357 mV, and a maximum current density (Imax) of 7.8 mA cm−2 (gray curve), which is explained by the presence of FcMeOH in the solution, this molecule is highly electroactive, capable of reaching a potential and generating a current [89]. The presence of glucose in the solution caused changes in the shape and amplitude of the polarization curves, showing a favorable dependence when the glucose concentration was between 10 and 20 mM; at this last concentration, a maximum power of 2.3 mW cm−2 was reached. However, as shown in the Figure 12a red curve, with the addition of high glucose concentrations (50 mM), the power does not increase further and even the maximum discharge current decreased. In this way, the results indicate that an optimal concentration of glucose is around 20 mM.
Subsequently, the appropriate flow rate was selected for the best performance of the microfluidic cell. Rates of 1, 3, 6, 9 and 12 mL h−1 were tested, employing glucose 20 mM as an optimal concentration. From the analysis of the polarization curves in Figure 12b, the increase in potential and current that is obtained from the flow of 6 mL h−1 (gray line) is notable; meanwhile, with 9 and 12 mL h−1, the power is slightly less (yellow and black lines, respectively). These results agree with those described by Khan et al., who reported that with at a saturating glucose concentration for the enzyme system, there is no significant increase in cell power related to flow rate [90]. In this way, it was decided to use the flow rate of 6 mL h−1 since it implies a lower energy expenditure, an important feature when implemented in a real device, considering that some biofuel cells require a flow rate of up to 18 mL h−1 [91].
Although a complete comparison is not possible due to the different experimental conditions used, this paper’s performance results were compared with previously reported works where GOx was used for the oxidation of glucose in fuel cells. As shown in Table 3, the cell performance values obtained in this work are similar to those previously reported, with a Wmax value of 2.30 mW cm−2, which is an acceptable value for enzymatic electrodes. It should be noted that, despite the fact that the increases in current obtained in the voltammetry analysis were relatively low compared to other studies aimed at the development of biosensors [70], the biofuel cell performance was quite promising, since the Imax and Wmax obtained are higher than those obtained in relatively similar assemblies built with nanometric materials [92,93]. The measured open circuit potential is equivalent to those obtained when novel materials as MWCNTs are used in anodes of cells and higher than the OCP obtained with precious metals (Au) or metallic oxides [94,95,96]. These results could be attributed to the use of a microfluidic arrangement, which in principle allows an increase in the Imax and Wmax due to an improvement in the availability of fuel and oxidant toward the catalytic sites [91]. On the other hand, the use of Toray paper as a support electrode would suppose a three-dimensional matrix that, when combined with the TMPyP/GSH-CdTeQD/GOx assembly, functions as a flow-through type of electrode [91], enabling better contact between the fuel and the enzyme.

3. Materials and Methods

All reactants used were of analytical grade. GOx from Aspergillus niger (G7141-50KU, Sigma-Aldrich, St. Louis, MO, USA), TMPyP (323497-250MG, Sigma-Aldrich, St. Louis, MO, USA) and ferrocene-methanol (335061-500MG, Sigma-Aldrich, St. Louis, MO, USA) were used without further purification. Graphite rods of 75 mm in length and 3 mm in diameter were used in the cyclic electrochemical initial characterization of the TMPyP/GSH-CdTeQD7GOx system. CdCl2·2.5 H2O (239208-100G, Merck, Rahway, NJ, USA), L-Glutatione Reduced (G4251-1G, Sigma-Aldrich, St. Louis, MO, USA), NaBH4 and Na2TeO3, used for the synthesis of the GSH-CdTeQD, were obtained from Merck and used without any further purification. Phosphate buffer solution (PBS) 0.1 M was prepared from Na2PO4, KHPO4, NaCl and KCl to meet the required concentration to ensure a 7.4 pH constant value during measurements.

3.1. Synthesis of GSH-CdTeQD

GSH-CdTeQD were synthesized according to a previously described method [17]. The increase in the size of the GSH-CdTeQD assembly, with respect to the reflux time, was monitored qualitatively by the change in photoluminescence color of the aliquots taken at different moments during the synthesis; the reaction was stopped after 65 min when an orange colored fluorescence in solution was observed. In order to determine the approximate concentration of the GSH-CdTeQD obtained from the synthesis, a 1 mL aliquot of the suspension was precipitated by adding 1 mL of isopropyl alcohol and centrifuging at 12,000 rpm. Verifying that there was no detectable photoluminescence in the supernatant, it was discarded, and the GSH-CdTeQD pellet was washed three times with ethanol and deionized water. After precipitating the nanocrystals again, the sample was dried at 60 °C and weighed in triplicate to obtain the concentration in terms of mg mL−1 of the total suspension. The nanocrystals deposited on the electrodes were taken directly from the synthesis solution without further modifications.

3.2. Preparation of Electrodes

All materials were deposited in three different carbon electrode types. The surface-enzyme adsorption was firstly carried out on graphite electrodes of 3 mm diameter (A = 0.07 cm2), embedded in epoxy resin and polypropylene tubes. The carbon surface was previously cleaned by mechanical polishing using sandpaper and Bond paper before being used. For the impedimetric analysis of the bioelectrode, an alumina polished (0.05 µm) glassy carbon (GC) surface was used. The analysis of the microfluidic cell system was carried out by using strips of carbon fiber paper (Toray®, Fuel Cell Store, College Station, TX, USA) on the effective area A = 0.032 cm2. The materials were deposited by drop coating 3 μL of solution of each substance (0.1 mM TMPyP dissolved in 8% methanol and 0.1 M Tris buffer, GSH-CdTeQD in stock solution, and GOx 5 mg mL−1 in PBS 0.1 M). Each material was incubated on the surface of the electrode at room temperature until evaporation of the solvent, any solvent excess was rinsed with deionized water.

3.3. Electrochemical Characterization

The electrodes were characterized by cyclic voltammetry (CV) in a conventional three-electrode cell by using PBS 0.1 M pH 7.4 as the support electrolyte and at a 50 mV s−1 scanning rate. The reference was an Hg/Hg2Cl2/KClsat (SCE) electrode (−0.241 V respect to NHE) and a platinum wire was used as the counter electrode. In this work, all the shown potentials are referring to the SCE electrode. The different materials and electrodes were characterized by electrochemical impedance spectroscopy (EIS) in PBS 0.1 M pH 7.4 solution by using K4Fe(CN)6/K3Fe(CN)6 (P3289-100G Sigma-Aldrich, St. Louis, MO, USA and 1.04973.0250 Merck Rahway, NJ, USA respectively) as a probe redox couple at a DC potential of 0.25 V with an AC sinusoidal amplitude signal of 5 mV in a frequency range from 100 KHz to 0.01 Hz. The chronoamperometric response of the electrode to glucose was measured at a 0.2 V potential value by adding consecutive aliquots of a 0.5 M glucose solution. CV, EIS and Chronoamperometry essays were carried out on Gamry 600, Potentiostat/Galvanostat/ZRA equipment (Gamry Instruments Warminster, PA, USA). Scanning electrochemical microscopy (SECM) was performed on a BioLogic Potentiostat (BioLogic Science Instruments, Seyssinet-Pariset, France) by using 0.1 M PBS pH 7.4 + Ferrocene methanol (FcMeOH) 0.5 mM solution in the absence and presence of 5 mM glucose. A scan of the surface was made with a platinum electrode of 25 µm diameter by applying a potential of 0.7 V in order to detect the peroxide production, and at a potential of 0.25 V for the Ferrocene oxidation detection. The counter electrode used in the SECM was a graphite bar. Any potential was applied to the multi-layered electrode since the glucose oxidation reaction by GOx occurs naturally.

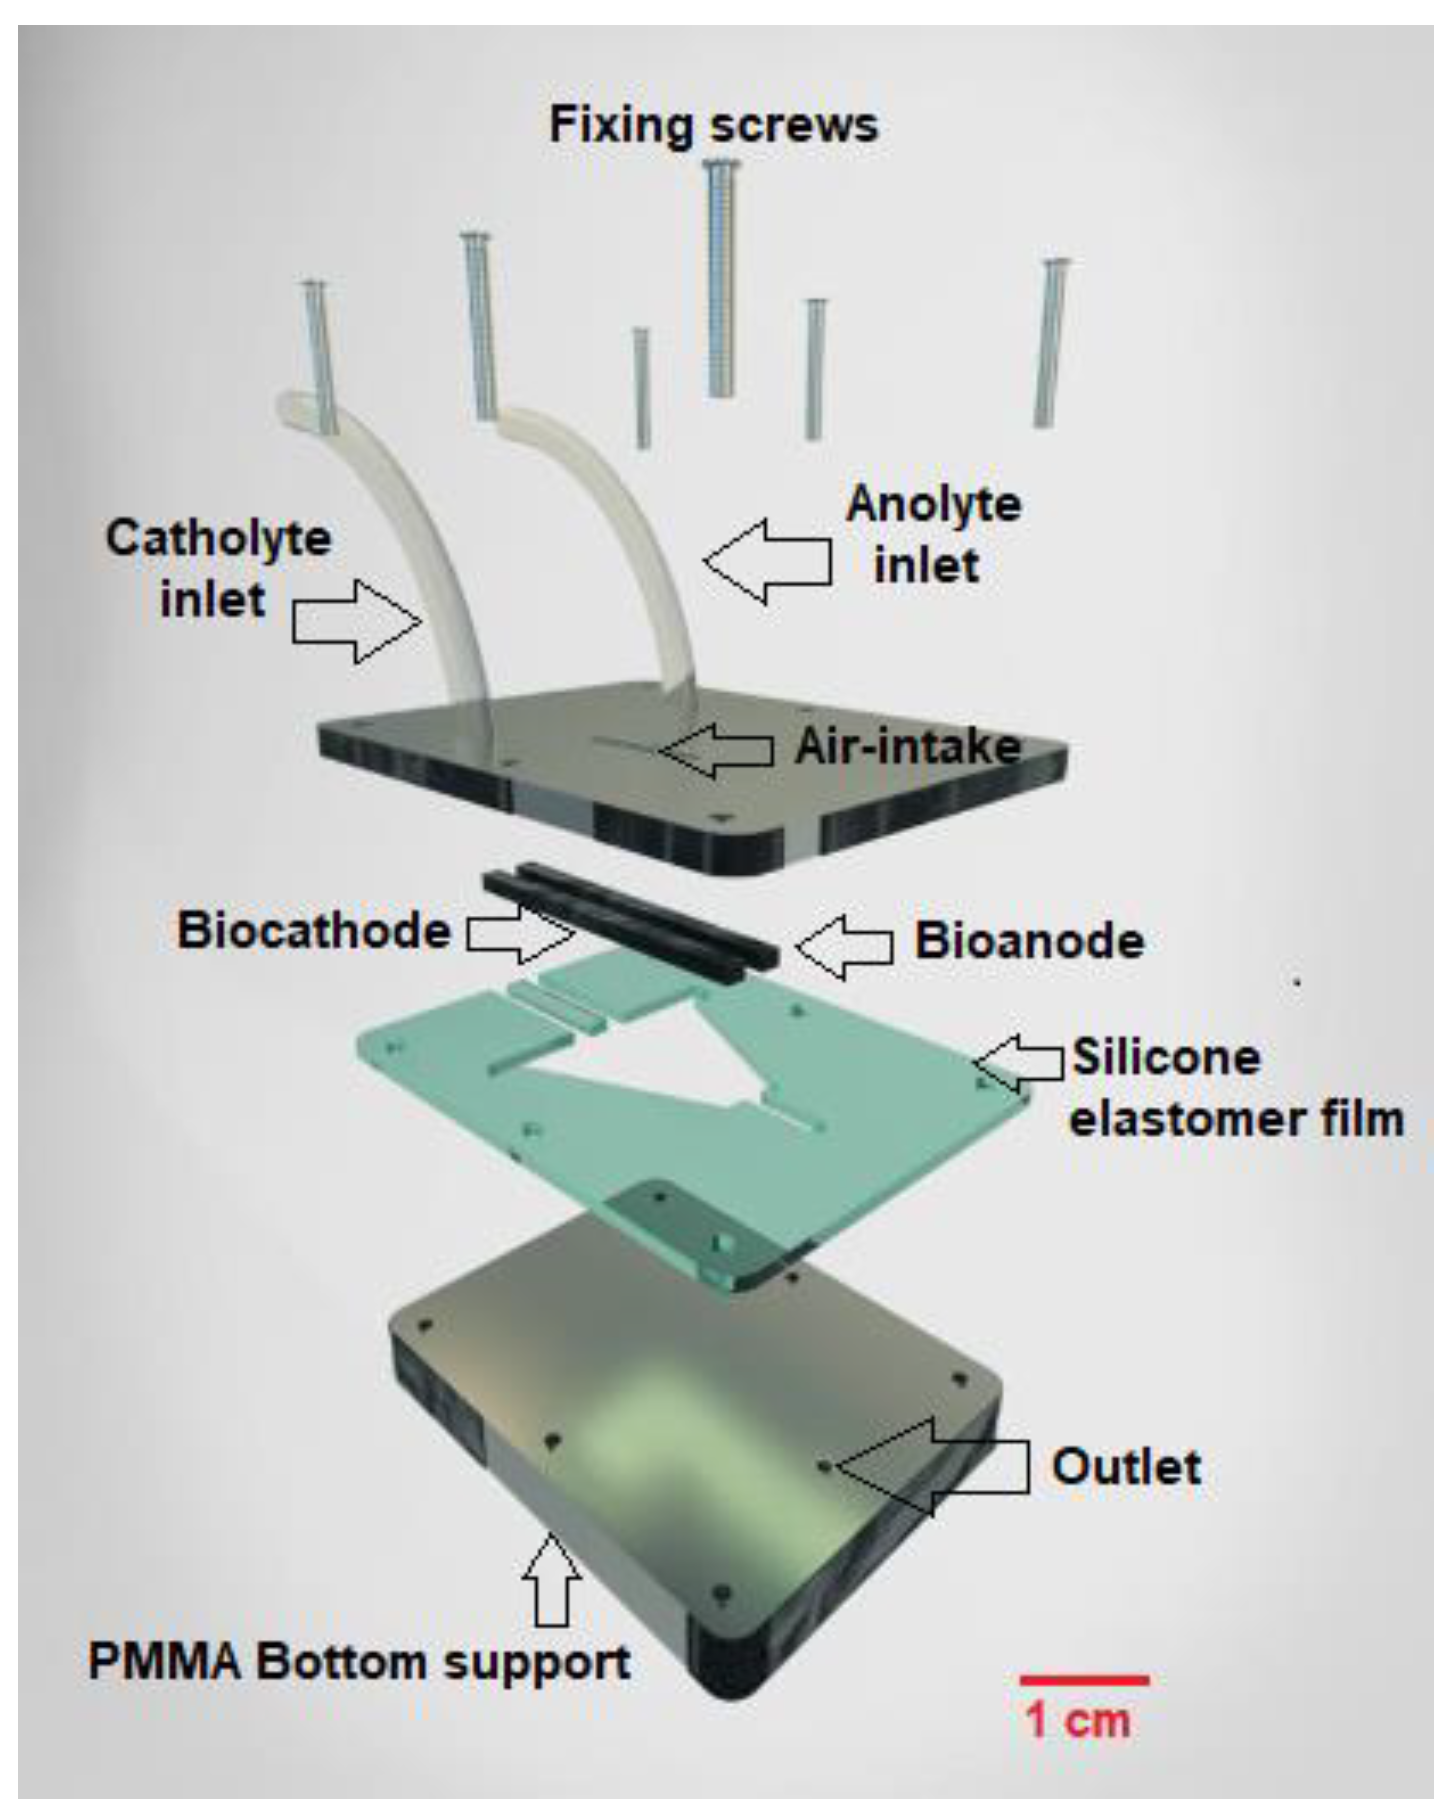
3.4. Design and Operation of the Glucose Microfluidic Cell

For the microfluidic cell arrangement, a previously reported system in the literature [29] was used. This consists of two acrylic plates assembled on a “sandwich-type” arrangement, separated by a silicone elastomer film (Silastic®, Dow, Midland, MI, USA) cut into a trapezoid shape to form the microfluidic channels for the electrolytes, Figure 13. The anode was made of TMPyP/GSH-CdTeQD/GOx-modified and immobilized on Toray paper, using aluminum foils as electrical contacts. MWCNT/Lc cathodes were prepared as described previously [1] by mixing the catalytic ink with the carbon MWCNT and Lacasse enzyme. Later, the ink was deposited on Toray paper electrodes with the dimensions described above. In the μBFC, the bioanodes were evaluated in 0.1 M PBS pH 7.4 solution with Ferrocene 0.5 mM at different glucose concentrations (0, 10, 20 and 50 mM). The optimal flow rate for the cell was determined by measuring the power obtained at 1, 3, 6, 9, and 12 mL h−1, the fluid speed was controlled by using a KDS 101 syringe flow pump (KD Scientific, Holiston, MA, USA). The biocathode used in all experiments was an MWCNT/Lc electrode and a 0.1 M PBS (pH 5.6) solution was used as a catholyte.

3.5. Physicochemical Characterization

The spectrophotometric characterization of the GSH-CdTeQD was performed using a Jenway 6405 UV-Vis spectrophotometer (Cole-Parmer, Vernon hills, IL, USA) with a spectral scan from 350 to 700 nm. The hydrodynamical particle size and zeta potential of the particles were determined by dynamic light scattering (DLS) by using a Zetasizer Nano ZS® equipment (Malvern Panalyitical, Malvern, UK). The size of the GSH-CdTeQD complex was obtained by Transmission Electron Microscopy (TEM) in a JSM® 5800-LV unit (JEOL, Tokio, Japan) operating at 25 kV. FTIR was carried out on a Spectrum Two spectrometer (Perkin Elmer Waltham, MA, USA) in order to identify the functional groups of porphyrin, GSH-CdTeQD and GOx deposited on the electrodes. Raman spectroscopy was performed on an Xplora® Raman Microscope in Toray paper electrodes before and after being modified with TMPyP/GSH-CdTeQD (Horiba Instruments Inc., Kyoto, Japan). The microscopically atomic composition of the adsorbed materials was obtained by using an Energy-dispersive X-ray spectrometer coupled to a scanning electron microscope (SEM) GmbH® JSM-6610(Horiba Instruments Inc., Kyoto, Japan).

4. Conclusions

Nanometric GHS-CdTeQD particles were synthesized, and physicochemically and electrochemically characterized. It was shown that this ensemble readily adsorbs in TMPyP modified carbonaceous materials such as graphite and Toray paper, resulting in a homogeneous self-assembly arrangement. The physicochemical analysis showed that the bond between GSH-CdTeQD and TMPyP is related to the electric charge interactions of the materials, the amino groups being the main contributors to the union between TMPyP/GSH-CdTeQD. The presence of TMPyP on the carbon surface was EIS confirmed by an RCT decrease in the K4Fe(CN)6/K3Fe(CN)6 redox reaction, possibly due to the positive charges present in its structure, which promote the approach of negative ions to the electrode; the bonding of the GSH-CdTeQD particles to carbon TMPyP modified electrodes was verified by a posterior increase in the Rct value. This arrangement allowed for a greater quantity of GOx to be immobilized than on an unmodified carbon electrode. The electrochemical results indicate that the enzyme remained highly functional after being immobilized over the TMPyP/GSH-CdTeQD system. The enzyme electrodes showed a sensitivity of 0.58 ± 0.01 μA/mM when glucose was added, and the increase in current, with respect to the sugar concentration, remains linear in a range from 2 to 16 mM. The immobilized GOx also exhibited a good affinity for the substrate and a high electron transfer (Ks = 4.91 s−1) was obtained, which suggests that the immobilization approach can additionally be considered suitable for the development of an amperometry biosensor. Furthermore, when the TMPyP/GSH-CdTeQD/GOx system was deposited onto Toray paper, the obtained electrodes could be used as anodes in a microfluidic biofuel cell. Values of 7.53 mA cm−2, 2.30 mW cm−2 and 0.571 mV were measured for Imax, Wmax and OCP, respectively. These microfluidic fuel cell performance properties are quite competitive with those previously reported in other works. The layered structure of TMPyP/GSH-CdTeQD/GOx can be considered an efficient approach for the immobilization of the glucose oxidase enzyme with potential applications in bioenergy generation and/or biosensing. The electrostatic bonding characteristics of the immobilization strategy could be extended to the anchoring of other kinds of enzymes or biomolecules.

Author Contributions

Conceptualization, D.L.-L. and S.D.-T.; methodology, D.L.-L.; software, D.L.-L. and S.D.-T.; validation, S.D.-T., M.G.-V. and R.A.E.-V.; formal analysis, S.D.-T. and M.G.-V.; investigation, I.R.-d.S.; resources, S.D.-T., J.L.-G. and R.A.E.-V.; data curation, I.R.-d.S.; writing—original draft preparation, D.L.-L.; writing—review and editing, S.D.-T. and R.A.E.-V.; visualization, I.R.-d.S.; supervision, M.G.-V.; project administration, S.D.-T.; funding acquisition, S.D.-T., R.A.E.-V. and J.L.-G. All authors have read and agreed to the published version of the manuscript.

Funding

This research was partially funded by the Mexican Council of Science and Technology (CONACyT) through the project FORDECYT-PRONACES/845132/2020.

Data Availability Statement

Not applicable.

Acknowledgments

D. Lozano greatly acknowledges the Mexican Council of Science and Technology (CONACYT) for a graduate fellowship.

Conflicts of Interest

The authors declare no conflict of interest.

References

  1. Mishra, A.; Bhatt, R.; Bajpai, J.; Bajpai, A. Nanomaterials based biofuel cells: A review. Int. J. Hydrogen Energy 2021, 46, 19085–19105. [Google Scholar] [CrossRef]
  2. Kwon, C.H.; Ko, Y.; Shin, D.; Kwon, M.; Park, J.; Bae, W.K.; Lee, S.W.; Cho, J. High-power hybrid biofuel cells using layer-by-layer assembled glucose oxidase-coated metallic cotton fibers. Nat. Commun. 2018, 9, 4479. [Google Scholar] [CrossRef] [PubMed] [Green Version]
  3. Haque, S.U.; Duteanu, N.; Ciocan, S.; Nasar, A.; Inamuddin. A review: Evolution of enzymatic biofuel cells. J. Environ. Manag. 2021, 298, 113483. [Google Scholar] [CrossRef] [PubMed]
  4. Nasar, A.; Perveen, R. Applications of enzymatic biofuel cells in bioelectronic devices—A review. Int. J. Hydrogen Energy 2019, 44, 15287–15312. [Google Scholar] [CrossRef]
  5. Li, J.; Liu, Y.; Tang, X.; Xu, L.; Min, L.; Xue, Y.; Hu, X.; Yang, Z. Multiwalled carbon nanotubes coated with cobalt(II) sulfide nanoparticles for electrochemical sensing of glucose via direct electron transfer to glucose oxidase. Microchim. Acta 2020, 187, 80. [Google Scholar] [CrossRef]
  6. Nguyen, H.H.; Kim, A.M. An Overview of Techniques in Enzyme Immobilization. Appl. Sci. Converg. Technol. 2017, 26, 157–163. [Google Scholar] [CrossRef]
  7. Chomicz, R.; Bystrzejewski, M.; Stolarczyk, K. Carbon-Encapsulated Iron Nanoparticles as a Magnetic Modifier of Bioanode and Biocathode in a Biofuel Cell and Biobattery. Catalysts 2021, 11, 705. [Google Scholar] [CrossRef]
  8. Estrada-Osorio, D.; Escalona-Villalpando, R.A.; Gutiérrez, A.; Arriaga, L.; Ledesma-García, J. Poly-L-lysine-modified with ferrocene to obtain a redox polymer for mediated glucose biosensor application. Bioelectrochemistry 2022, 146, 108147. [Google Scholar] [CrossRef]
  9. Haque, S.U.; Nasar, A.; Duteanu, N.; Inamuddin. Carbon based-nanomaterials used in biofuel cells—A review. Fuel 2023, 331, 125634. [Google Scholar] [CrossRef]
  10. Ahmad, R.; Rizaldo, S.; Shaner, S.E.; Kissel, D.S.; Stone, K.L. Immobilization of a Bienzymatic System via Crosslinking to a Metal-Organic Framework. Catalysts 2022, 12, 969. [Google Scholar] [CrossRef]
  11. Meena, J.; Gupta, A.; Ahuja, R.; Singh, M.; Panda, A.K. Recent advances in nano-engineered approaches used for enzyme immobilization with enhanced activity. J. Mol. Liq. 2021, 338, 116602. [Google Scholar] [CrossRef]
  12. Maity, D.; Minitha, C.R.; Rajenda, K.R.T. Glucose oxidase immobilized amine terminated multiwall carbon nanotubes/reduced graphene oxide/polyaniline/gold nanoparticles modified screen-printed carbon electrode for highly sensitive amperometric glucose detection. Mater. Sci. Eng. C 2019, 105, 110075. [Google Scholar] [CrossRef] [PubMed]
  13. Patel, S.K.S.; Choi, S.H.; Kang, Y.C.; Lee, J.-K. Large-scale aerosol-assisted synthesis of biofriendly Fe2O3yolk–shell particles: A promising support for enzyme immobilization. Nanoscale 2016, 8, 6728–6738. [Google Scholar] [CrossRef] [PubMed] [Green Version]
  14. Dai, H.; Zhong, Y.; Wu, X.; Hu, R.; Wang, L.; Zhang, Y.; Fan, G.; Hu, X.; Li, J.; Yang, Z. Synthesis of perovskite-type SrTiO3 nanoparticles for sensitive electrochemical biosensing applications. J. Electroanal. Chem. 2018, 810, 95–99. [Google Scholar] [CrossRef]
  15. Sağlam, Ö.; Kızılkaya, B.; Uysal, H.; Dilgin, Y. Biosensing of glucose in flow injection analysis system based on glucose oxidase-quantum dot modified pencil graphite electrode. Talanta 2016, 147, 315–321. [Google Scholar] [CrossRef]
  16. Buk, V.; Pemble, M.E. A highly sensitive glucose biosensor based on a micro disk array electrode design modified with carbon quantum dots and gold nanoparticles. Electrochim. Acta 2019, 298, 97–105. [Google Scholar] [CrossRef]
  17. Sheng, Z.; Han, H.; Hu, X.; Chi, C. One-step growth of high luminescence CdTe quantum dots with low cytotoxicity in ambient atmospheric conditions. Dalton Trans. 2010, 39, 7017–7020. [Google Scholar] [CrossRef]
  18. Cao, L.; Ye, J.; Tong, L.; Tang, B. A New Route to the Considerable Enhancement of Glucose Oxidase (GOx) Activity: The Simple Assembly of a Complex from CdTe Quantum Dots and GOx, and Its Glucose Sensing. Chem. A Eur. J. 2008, 14, 9633–9640. [Google Scholar] [CrossRef]
  19. Zhang, L.; Peng, D.; Liang, R.-P.; Qiu, J.-D. Graphene Quantum Dots Assembled with Metalloporphyrins for “Turn On” Sensing of Hydrogen Peroxide and Glucose. Chem. A Eur. J. 2015, 21, 9343–9348. [Google Scholar] [CrossRef]
  20. Vaishnavi, E.; Renganathan, R. “Turn-on-off-on” fluorescence switching of quantum dots–cationic porphyrin nanohybrid: A sensor for DNA. Analyst 2014, 139, 225–234. [Google Scholar] [CrossRef]
  21. Ahmed, G.H.; Aly, S.M.; Usman, A.; Eita, M.S.; Melnikov, V.A.; Mohammed, O.F. Quantum confinement-tunable intersystem crossing and the triplet state lifetime of cationic porphyrin–CdTe quantum dot nano-assemblies. Chem. Commun. 2015, 51, 8010–8013. [Google Scholar] [CrossRef] [PubMed] [Green Version]
  22. Liu, L.; Tanveer, Z.I.; Jiang, K.; Huang, Q.; Zhang, J.; Wu, Y.; Han, Z. Label-Free Fluorescent Aptasensor for Ochratoxin—A Detection Based on CdTe Quantum Dots and (N-Methyl-4-pyridyl) Porphyrin. Toxins 2019, 11, 447. [Google Scholar] [CrossRef] [PubMed] [Green Version]
  23. Gong, L.; Bae, I.; Kim, S.K. Effect of Axial Ligand on the Binding Mode of M-meso-Tetrakis(N-methylpyridinium-4-yl)porphyrin to DNA Probed by Circular and Linear Dichroism Spectroscopies. J. Phys. Chem. B 2012, 116, 12510–12521. [Google Scholar] [CrossRef] [PubMed]
  24. El-Shafai, N.; El-Khouly, M.E.; El-Kemary, M.; Ramadan, M.S.; Masoud, M.S. Self-assembly of porphyrin on graphene oxide in aqueous medium: Fabrication, characterization, and photocatalytic studies. Photochem. Photobiol. Sci. 2019, 18, 2071–2079. [Google Scholar] [CrossRef] [PubMed]
  25. Wang, J.; Zhang, Z.; Zha, S.; Zhu, Y.; Wu, P.; Ehrenberg, B.; Chen, J.-Y. Carbon nanodots featuring efficient FRET for two-photon photodynamic cancer therapy with a low fs laser power density. Biomaterials 2014, 35, 9372–9381. [Google Scholar] [CrossRef] [PubMed]
  26. García, C.; Fuenzalida, F.; Ruiz, D.; Aguirre, M. Electrochemical, spectroscopic and morphological characterization of electrostatic self-assembled hybrids of tetracationic phosphonium porphyrins and CdTe quantum dots. J. Appl. Electrochem. 2014, 44, 1345–1353. [Google Scholar] [CrossRef]
  27. Zhang, S.; Chen, M.; Zhao, X.; Cai, J.; Yan, W.; Yen, J.C.X.; Chen, S.; Yu, Y.; Zhang, J. Advanced Noncarbon Materials as Catalyst Supports and Non-noble Electrocatalysts for Fuel Cells and Metal–Air Batteries. Electrochem. Energy Rev. 2021, 4, 336–381. [Google Scholar] [CrossRef]
  28. Khan, H.; Tanveer, M.; Nguyen, D.D.; Ullah, A.; Shin, M.C.; Kwak, M.K.; Park, C.W.; Kim, G.M. Efficient stacking of glucose/oxygen microfluidic biofuel cells using a single-streamflow channel. Energy Convers. Manag. 2022, 271, 116270. [Google Scholar] [CrossRef]
  29. Escalona, R.; Hasan, K.; Milton, R.D.; Moreno-Zuria, A.; Arriaga, L.; Minteer, S.D.; Ledesma-García, J. Performance comparison of different configurations of Glucose/O2 microfluidic biofuel cell stack. J. Power Sources 2019, 414, 150–157. [Google Scholar] [CrossRef]
  30. Liu, Y.; Fan, Z.; Qiao, L.; Liu, B. Advances in microfluidic strategies for single-cell research. TrAC Trends Anal. Chem. 2022, 157, 116822. [Google Scholar] [CrossRef]
  31. Zhang, T.; Yu, C.; Zhu, X.; Yang, Y.; Ye, D.; Chen, R.; Liao, Q. Elimination of Fuel Crossover in a Single-Flow Microfluidic Fuel Cell with a Selective Catalytic Cathode. Ind. Eng. Chem. Res. 2022, 61, 1955–1964. [Google Scholar] [CrossRef]
  32. Ibrahim, O.A.; Navarro-Segarra, M.; Sadeghi, P.; Sabaté, N.; Esquivel, J.P.; Kjeang, E. Microfluidics for Electrochemical Energy Conversion. Chem. Rev. 2022, 122, 7236–7266. [Google Scholar] [CrossRef] [PubMed]
  33. Escalona-Villalpando, R.; Martínez-Maciel, A.; Espinosa-Ángeles, J.; Ortiz-Ortega, E.; Arjona, N.; Arriaga, L.; Ledesma-García, J. Evaluation of hybrid and enzymatic nanofluidic fuel cells using 3D carbon structures. Int. J. Hydrogen Energy 2018, 43, 11847–11852. [Google Scholar] [CrossRef]
  34. Wang, H.; Xu, L.; Liu, N.; Zhang, R.; Xu, J.; Su, W.; Yu, Y.; Ma, Z.; Li, W.; Chen, K. Enhanced stability and emission intensity of aqueous CdTe/CdS core–shell quantum dots with widely tunable wavelength. Can. J. Phys. 2014, 92, 802–805. [Google Scholar] [CrossRef]
  35. Libertino, S.; Aiello, V.; Scandurra, A.; Renis, M.; Sinatra, F. Immobilization of the Enzyme Glucose Oxidase on Both Bulk and Porous SiO2 Surfaces. Sensors 2008, 8, 5637–5648. [Google Scholar] [CrossRef]
  36. Suzuki, N.; Lee, J.; Loew, N.; Takahashi-Inose, Y.; Okuda-Shimazaki, J.; Kojima, K.; Mori, K.; Tsugawa, W.; Sode, K. Engineered Glucose Oxidase Capable of Quasi-Direct Electron Transfer after a Quick-and-Easy Modification with a Mediator. Int. J. Mol. Sci. 2020, 21, 1137. [Google Scholar] [CrossRef] [Green Version]
  37. Yu, W.W.; Qu, L.; Guo, W.; Peng, X. Experimental Determination of the Extinction Coefficient of CdTe, CdSe, and CdS Nanocrystals. Chem. Mater. 2003, 15, 2854–2860. [Google Scholar] [CrossRef]
  38. Segets, D. Analysis of Particle Size Distributions of Quantum Dots: From Theory to Application. KONA Powder Part. J. 2016, 33, 48–62. [Google Scholar] [CrossRef] [Green Version]
  39. Chen, X.; Guo, Z.; Miao, P. One-pot synthesis of GSH-Capped CdTe quantum dots with excellent biocompatibility for direct cell imaging. Heliyon 2018, 4, e00576. [Google Scholar] [CrossRef] [Green Version]
  40. Lemon, C.M.; Karnas, E.; Han, X.; Bruns, O.T.; Kempa, T.J.; Fukumura, D.; Bawendi, M.G.; Jain, R.K.; Duda, D.G.; Nocera, D.G. Micelle-Encapsulated Quantum Dot-Porphyrin Assemblies as In Vivo Two-Photon Oxygen Sensors. J. Am. Chem. Soc. 2015, 137, 9832–9842. [Google Scholar] [CrossRef]
  41. He, D.; Yang, X.; He, X.; Wang, K.; Yang, X.; He, X.; Zou, Z. A sensitive turn-on fluorescent probe for intracellular imaging of glutathione using single-layer MnO2 nanosheet-quenched fluorescent carbon quantum dots. Chem. Commun. 2015, 51, 14764–14767. [Google Scholar] [CrossRef] [PubMed]
  42. Shi, Y.; Zhang, H.; Yue, Z.; Zhang, Z.; Teng, K.-S.; Li, M.-J.; Yi, C.; Yang, M. Coupling gold nanoparticles to silica nanoparticles through disulfide bonds for glutathione detection. Nanotechnology 2013, 24, 375501. [Google Scholar] [CrossRef] [PubMed]
  43. Li, D.; Li, G.; Guo, W.; Li, P.; Wang, E.; Wang, J. Glutathione-mediated release of functional plasmid DNA from positively charged quantum dots. Biomaterials 2008, 29, 2776–2782. [Google Scholar] [CrossRef] [PubMed]
  44. Zheng, Y.; Yang, Z.; Li, Y.; Ying, J.Y. From Glutathione Capping to a Crosslinked, Phytochelatin-like Coating of Quantum Dots. Adv. Mater. 2008, 20, 3410–3415. [Google Scholar] [CrossRef]
  45. Gu, Y.-P.; Cui, R.; Zhang, Z.-L.; Xie, Z.-X.; Pang, D.-W. Ultrasmall Near-Infrared Ag2Se Quantum Dots with Tunable Fluorescence for In Vivo Imaging. J. Am. Chem. Soc. 2012, 134, 79–82. [Google Scholar] [CrossRef]
  46. Deng, Z.; Lie, F.L.; Shen, S.; Ghosh, I.; Mansuripur, M.; Muscat, A.J. Water-Based Route to Ligand-Selective Synthesis of ZnSe and Cd-Doped ZnSe Quantum Dots with Tunable Ultraviolet A to Blue Photoluminescence. Langmuir ACS J. Surf. Colloids 2009, 25, 434–442. [Google Scholar] [CrossRef]
  47. Li, Y.; Cui, R.; Zhang, P.; Chen, B.-B.; Tian, Z.-Q.; Li, L.; Hu, B.; Pang, D.-W.; Xie, Z.-X. Mechanism-Oriented Controllability of Intracellular Quantum Dots Formation: The Role of Glutathione Metabolic Pathway. ACS Nano 2013, 7, 2240–2248. [Google Scholar] [CrossRef]
  48. Rebelo, S.L.H.; Guedes, A.; Szefczyk, M.E.; Pereira, A.M.; Araújo, J.P.; Freire, C. Progress in the Raman spectra analysis of covalently functionalized multiwalled carbon nanotubes: Unraveling disorder in graphitic materials. Phys. Chem. Chem. Phys. 2016, 18, 12784–12796. [Google Scholar] [CrossRef]
  49. Selvarajan, P.; Chandra, G.; Bhattacharya, S.; Sil, S.; Vinu, A.; Umapathy, S. Potential of Raman spectroscopy towards understanding structures of carbon-based materials and perovskites. Emerg. Mater. 2019, 2, 417–439. [Google Scholar] [CrossRef]
  50. Wang, R.-X.; Fan, J.-J.; Fan, Y.-J.; Zhong, J.-P.; Wang, L.; Sun, S.-G.; Shen, X.-C. Platinum nanoparticles on porphyrin functionalized graphene nanosheets as a superior catalyst for methanol electrooxidation. Nanoscale 2014, 6, 14999–15007. [Google Scholar] [CrossRef]
  51. Barszcz, B.; Bogucki, A.; Laskowska, B.; Ion, R.; Graja, A. Spectral Investigations of Fullerene-Porphyrin Complexes. Acta Phys. Pol. A 2007, 112, 143–152. [Google Scholar] [CrossRef]
  52. Huang, G.G.; Han, X.X.; Hossain, M.K.; Kitahama, Y.; Ozaki, Y. A Study of Glutathione Molecules Adsorbed on Silver Surfaces under Different Chemical Environments by Surface-Enhanced Raman Scattering in Combination with the Heat-Induced Sensing Method. Appl. Spectrosc. 2010, 64, 1100–1108. [Google Scholar] [CrossRef] [PubMed]
  53. Singh, G.; Dogra, S.D.; Kaur, S.; Tripathi, S.; Prakash, S.; Rai, B.; Saini, G. Structure and vibrations of glutathione studied by vibrational spectroscopy and density functional theory. Spectrochim. Acta Part A Mol. Biomol. Spectrosc. 2015, 149, 505–515. [Google Scholar] [CrossRef] [PubMed]
  54. Van Caemelbecke, E.; Derbin, A.; Hambright, P.; Garcia, R.; Doukkali, A.; Saoiabi, A.; Ohkubo, K.; Fukuzumi, S.; Kadish, K.M. Electrochemistry of [(TMpyP)MII]4+(X)4 (X = Cl or BPh4) and [(TMpyP)MIIICl]4+(Cl)4 in N,N-Dimethylformamide Where M Is One of 15 Different Metal Ions. Inorg. Chem. 2005, 44, 3789–3798. [Google Scholar] [CrossRef] [PubMed]
  55. Kadish, K.M.; Araullo, C.; Maiya, G.B.; Sazou, D.; Barbe, J.M.; Guilard, R. Electrochemical and spectral characterization of copper, zinc, and vanadyl meso-tetrakis(1-methylpyridinium-4-yl)porphyrin complexes in dimethylformamide. Inorg. Chem. 1989, 28, 2528–2533. [Google Scholar] [CrossRef]
  56. Xu, J.; Chen, Q.; Swain, G.M. Anthraquinonedisulfonate Electrochemistry: A Comparison of Glassy Carbon, Hydrogenated Glassy Carbon, Highly Oriented Pyrolytic Graphite, and Diamond Electrodes. Anal. Chem. 1998, 70, 3146–3154. [Google Scholar] [CrossRef]
  57. Lim, Y.; Chu, J.H.; Lee, D.H.; Kwon, S.-Y.; Shin, H. Increase in graphitization and electrical conductivity of glassy carbon nanowires by rapid thermal annealing. J. Alloys Compd. 2017, 702, 465–471. [Google Scholar] [CrossRef]
  58. Silva, L.A.J.; Stefano, J.S.; Cardoso, R.M.; Prado, N.S.; Soares, P.H.T.; Nossol, E.; Munoz, R.A.A.; Angnes, L.; Richter, E.M. Evaluation of graphite sheets for production of high-quality disposable sensors. J. Electroanal. Chem. 2019, 833, 560–567. [Google Scholar] [CrossRef]
  59. Available online: https://jrossmacdonald.com/levmlevmw/ (accessed on 15 November 2022).
  60. Walch, N.J. Graphene Modified Electrodes for Enhanced Electrochemical Detection. Ph.D. Thesis, Cranfield University, Bedford, UK, 2016. [Google Scholar]
  61. Konwer, S.; Boruah, R.; Dolui, S.K. Studies on Conducting Polypyrrole/Graphene Oxide Composites as Supercapacitor Electrode. J. Electron. Mater. 2011, 40, 2248–2255. [Google Scholar] [CrossRef]
  62. Pyo, M.; Maeder, G.; Kennedy, R.T.; Reynolds, J.R. Controlled release of biological molecules from conducting polymer modified electrodes: The potential dependent release of adenosine 5′-triphosphate from poly(pyrrole adenosine 5′-triphosphate) films. J. Electroanal. Chem. 1994, 368, 329–332. [Google Scholar] [CrossRef]
  63. Brown, A.P.; Anson, F.C. Electron transfer kinetics with both reactant and product attached to the electrode surface. J. Electroanal. Chem. Interfac. Electrochem. 1978, 92, 133–145. [Google Scholar] [CrossRef]
  64. Verhagen, M.F.; Hagen, W.R. Electron transfer mechanisms of flavine adenine dinucleotide at the glassy carbon electrode; a model study for protein electrochemistry. J. Electroanal. Chem. 1992, 334, 339–350. [Google Scholar] [CrossRef]
  65. Ridhuan, N.S.; Razak, K.A.; Lockman, Z. Fabrication and Characterization of Glucose Biosensors by Using Hydrothermally Grown ZnO Nanorods. Sci. Rep. 2018, 8, 13722. [Google Scholar] [CrossRef] [PubMed]
  66. Haque, S.U.; Nasar, A.; Inamuddin; Asiri, A.M. Preparation and characterization of a bioanode (GC/MnO2/PSS/Gph/Frt/GOx) for biofuel cell application. Int. J. Hydrogen Energy 2019, 44, 7308–7319. [Google Scholar] [CrossRef]
  67. Kundu, M.; Bhardwaj, H.; Pandey, M.K.; Krishnan, P.; Kotnala, R.K.; Sumana, G. Development of electrochemical biosensor based on CNT–Fe3O4 nanocomposite to determine formaldehyde adulteration in orange juice. J. Food Sci. Technol. 2019, 56, 1829–1840. [Google Scholar] [CrossRef]
  68. Kang, X.; Wang, J.; Wu, H.; Aksay, I.A.; Liu, J.; Lin, Y. Glucose Oxidase-graphene-chitosan modified electrode for direct electrochemistry and glucose sensing. Biosens. Bioelectron. 2009, 25, 901–905. [Google Scholar] [CrossRef]
  69. Wu, P.; Shao, Q.; Hu, Y.; Jin, J.; Yin, Y.; Zhang, H.; Cai, C. Direct electrochemistry of glucose oxidase assembled on graphene and application to glucose detection. Electrochim. Acta 2010, 55, 8606–8614. [Google Scholar] [CrossRef]
  70. Kowalewska, B.; Jakubow, K. The impact of immobilization process on the electrochemical performance, bioactivity and conformation of glucose oxidase enzyme. Sens. Actuators B Chem. 2017, 238, 852–861. [Google Scholar] [CrossRef]
  71. Wen, D.; Liu, Y.; Yang, G.; Dong, S. Electrochemistry of glucose oxidase immobilized on the carbon nanotube wrapped by polyelectrolyte. Electrochim. Acta 2007, 52, 5312–5317. [Google Scholar] [CrossRef]
  72. Wu, W.-C.; Huang, J.-L.; Tsai, Y.-C. Direct electron transfer and biosensing of glucose oxidase immobilized at multiwalled carbon nanotube-alumina-coated silica modified electrode. Mater. Sci. Eng. C 2012, 32, 983–987. [Google Scholar] [CrossRef]
  73. Razmi, H.; Mohammad-Rezaei, R. Graphene quantum dots as a new substrate for immobilization and direct electro-chemistry of glucose oxidase: Application to sensitive glucose determination. Biosens. Bioelectron. 2013, 41, 498–504. [Google Scholar] [CrossRef] [PubMed]
  74. El-Nahass, M.; Zeyada, H.; Aziz, M.; Makhlouf, M. Optical absorption of tetraphenylporphyrin thin films in UV–vis–NIR region. Spectrochim. Acta Part A Mol. Biomol. Spectrosc. 2005, 62, 11–15. [Google Scholar] [CrossRef] [PubMed]
  75. Jhonsi, M.A.; Renganathan, R. Photoinduced Electron Transfer from Meso-Tetrakis (N-methylpyridyl)porphyrin (TMPyP) to Colloidal CdS. Z. Phys. Chem. 2008, 222, 1601–1610. [Google Scholar] [CrossRef]
  76. Baghayeri, M.; Veisi, H.; Ghanei-Motlagh, M. Amperometric glucose biosensor based on immobilization of glucose oxidase on a magnetic glassy carbon electrode modified with a novel magnetic nanocomposite. Sens. Actuators B Chem. 2017, 249, 321–330. [Google Scholar] [CrossRef]
  77. Patel, S.K.S.; Choi, S.H.; Kang, Y.C.; Lee, J.-K. Eco-Friendly Composite of Fe3O4-Reduced Graphene Oxide Particles for Efficient Enzyme Immobilization. ACS Appl. Mater. Interfaces 2017, 9, 2213–2222. [Google Scholar] [CrossRef] [PubMed]
  78. Pérez-Donoso, J.M.; Monrás, J.P.; Bravo, D.; Aguirre, A.; Quest, A.F.; Osorio-Roman, I.O.; Aroca, R.F.; Chasteen, T.G.; Vásquez, C.C. Biomimetic, Mild Chemical Synthesis of CdTe-GSH Quantum Dots with Improved Biocompatibility. PLoS ONE 2012, 7, e30741. [Google Scholar] [CrossRef] [PubMed]
  79. Hecht, H.; Kalisz, H.; Hendle, J.; Schmid, R.; Schomburg, D. Crystal Structure of Glucose Oxidase from Aspergillus niger Refined at 2.3 A Resolution. J. Mol. Biol. 1993, 229, 153–172. [Google Scholar] [CrossRef]
  80. Polcari, D.; Dauphin-Ducharme, P.; Mauzeroll, J. Scanning Electrochemical Microscopy: A Comprehensive Review of Experimental Parameters from 1989 to 2015. Chem. Rev. 2016, 116, 13234–13278. [Google Scholar] [CrossRef]
  81. Morkvenaite-Vilkonciene, I.; Ramanaviciene, A.; Kisieliute, A.; Bucinskas, V.; Ramanavicius, A. Scanning electrochemical microscopy in the development of enzymatic sensors and immunosensors. Biosens. Bioelectron. 2019, 141, 111411. [Google Scholar] [CrossRef]
  82. Morkvenaite-Vilkonciene, I.; Ramanaviciene, A.; Genys, P.; Ramanavicius, A. Evaluation of Enzymatic Kinetics of GOx-based Electrodes by Scanning Electrochemical Microscopy at Redox Competition Mode. Electroanalysis 2017, 29, 1532–1542. [Google Scholar] [CrossRef]
  83. Carriere, V.M.; Rodrigues, J.P.; Tan, C.; Arumugam, P.; Poh, S. In Vitro Electrochemical Detection of Hydrogen Peroxide in Activated Macrophages via a Platinum Microelectrode Array. Sensors 2021, 21, 5607. [Google Scholar] [CrossRef] [PubMed]
  84. Conzuelo, F.; Schulte, A.; Schuhmann, W. Biological imaging with scanning electrochemical microscopy. Proc. R. Soc. A Math. Phys. Eng. Sci. Med. 2018, 474, 20180409. [Google Scholar] [CrossRef] [PubMed]
  85. Raith, T.; Kröninger, A.; Mickert, M.; Gorris, H.H.; Matysik, F.-M. Enhanced resolution of generator-collector studies of enzymatic structures by means of hydrodynamic scanning electrochemical microscopy. Talanta 2020, 214, 120844. [Google Scholar] [CrossRef] [PubMed]
  86. Preet, A.; Lin, T.-E. A Review: Scanning Electrochemical Microscopy (SECM) for Visualizing the Real-Time Local Catalytic Activity. Catalysts 2021, 11, 594. [Google Scholar] [CrossRef]
  87. Ganiga, M.; Cyriac, J. An ascorbic acid sensor based on cadmium sulphide quantum dots. Anal. Bioanal. Chem. 2016, 408, 3699–3706. [Google Scholar] [CrossRef]
  88. Izadyar, A.; Ni Van, M.; Rodriguez, K.A.; Seok, I.; Hood, E.E. A bienzymatic amperometric glucose biosensor based on using a novel recombinant Mn peroxidase from corn and glucose oxidase with a Nafion membrane. J. Electroanal. Chem. 2021, 895, 115387. [Google Scholar] [CrossRef]
  89. Bahar, T.; Yazici, M.S. Immobilized glucose oxidase biofuel cell anode by MWCNTs, ferrocene, and polyethylenimine: Electrochemical performance. Asia-Pac. J. Chem. Eng. 2018, 13, e2149. [Google Scholar] [CrossRef]
  90. Khan, H.; Choi, J.H.; Ullah, A.; Kim, Y.H.; Kim, G.M. Continuous Determination of Glucose Using a Membraneless, Microfluidic Enzymatic Biofuel Cell. Micromachines 2020, 11, 1129. [Google Scholar] [CrossRef]
  91. Shaegh, S.A.M.; Nguyen, N.-T.; Chan, S.H. A review on membraneless laminar flow-based fuel cells. Int. J. Hydrogen Energy 2011, 36, 5675–5694. [Google Scholar] [CrossRef] [Green Version]
  92. Arjun, A.M.; Vimal, M.; Sandhyarani, N. A hybrid hydrogel separated biofuel cell with a novel enzymatic anode and glucose tolerant cathode. Int. J. Hydrogen Energy 2019, 44, 27056–27066. [Google Scholar] [CrossRef]
  93. Kang, Z.; Jiao, K.; Yu, C.; Dong, J.; Peng, R.; Hu, Z.; Jiao, S. Direct electrochemistry and bioelectrocatalysis of glucose oxidase in CS/CNC film and its application in glucose biosensing and biofuel cells. RSC Adv. 2017, 10, 4572–4579. [Google Scholar] [CrossRef] [Green Version]
  94. Renaud, L.; Selloum, D.; Tingry, S. Xurography for 2D and multi-level glucose/O2 microfluidic biofuel cell. Microfluid. Nanofluidics 2015, 18, 1407–1416. [Google Scholar] [CrossRef]
  95. Galindo, R.; Dector, A.; Arriaga, L.; Gutiérrez, S.; Herrasti, P. Maghemite as a catalyst for glucose oxidation in a microfluidic fuel cell. J. Electroanal. Chem. 2012, 671, 38–43. [Google Scholar] [CrossRef]
  96. Zebda, A.; Renaud, L.; Cretin, M.; Pichot, F.; Innocent, C.; Ferrigno, R.; Tingry, S. A microfluidic glucose biofuel cell to generate micropower from enzymes at ambient temperature. Electrochem. Commun. 2009, 11, 592–595. [Google Scholar] [CrossRef]
  97. Khan, H.; Kim, C.M.; Kim, S.Y.; Goel, S.; Dwivedi, P.K.; Sharma, A.; Kim, Y.H.; Kim, G.M. Correction to: Fabrication of Enzymatic Biofuel Cell with Electrodes on Both Sides of Microfluidic Channel. Int. J. Precis. Eng. Manuf. Green Technol. 2019, 6, 655. [Google Scholar] [CrossRef] [Green Version]
  98. Escalona-Villalpando, R.; Dector, A.; Dector, D.; Moreno-Zuria, A.; Durón-Torres, S.; Galván-Valencia, M.; Arriaga, L.; Ledesma-García, J. Glucose microfluidic fuel cell using air as oxidant. Int. J. Hydrogen Energy 2016, 41, 23394–23400. [Google Scholar] [CrossRef]
  99. Zebda, A.; Gondran, C.; Le Goff, A.; Holzinger, M.; Cinquin, P.; Cosnier, S. Mediatorless high-power glucose biofuel cells based on compressed carbon nanotube-enzyme electrodes. Nat. Commun. 2011, 2, 370. [Google Scholar] [CrossRef] [Green Version]
  100. Reuillard, B.; Le Goff, A.; Agnès, C.; Holzinger, M.; Zebda, A.; Gondran, C.; Elouarzaki, K.; Cosnier, S. High power enzymatic biofuel cell based on naphthoquinone-mediated oxidation of glucose by glucose oxidase in a carbon nanotube 3D matrix. Phys. Chem. Chem. Phys. 2013, 15, 4892–4896. [Google Scholar] [CrossRef]
Figure 1. 3D structure of 5,10,15,20-tetrakis (1-methyl-4-pyridinium) porphyrin (TMPyP) that exemplifies the planarity of the molecule.
Catalysts 12 01659 g001
Figure 2. Scheme of TMPyP/GSH-CdTeQD/GOx system deposited on a carbon surface.
Catalysts 12 01659 g002
Figure 3. (a) UV-Vis absorbance spectrum of the GSH-CdTeQD synthesized in this work. The insert shows the sample fluorescence under UV light irradiation. (bd) TEM analysis for a sample of GSH-CdTeQD at different magnification. The particle size distribution histogram is shown in (e).
Catalysts 12 01659 g003
Figure 4. Raman spectra of a single Toray electrode (red line) and a TMPyP/GSH-CdTeQD modified electrode (black line). Bands D, G and 2D are labeled in their respective positions, as well as the Raman displacement value for the main bands corresponding to the active groups of the deposited material.
Catalysts 12 01659 g004
Figure 5. CVs comparative between graphite (solid blue line), graphite modified with TMPyP (dashed black line), and graphite modified with TMPyP/GSH-CdTeQD (solid red line). Insert shows the theoretical arrangement of the TMPyP/GSH-CdTeQD.
Catalysts 12 01659 g005
Figure 6. EIS Nyquist spectra of GC (blue), GC/TMPyP (red) and GC/TMPyP/GSH-CdTeQD (gray) electrodes. The segmented line curves illustrate the LEVM fit to the equivalent circuit (insert) used to evaluate the RCT of the K4Fe(CN)6/K3Fe(CN)6 redox reaction in each electrode.
Catalysts 12 01659 g006
Figure 7. (a) Voltammograms of graphite electrodes modified with GOx (black dashed line) and with TMPyP/GSH-CdTeQD/GOx (red line). Peaks obtained after subtracting the baseline are shown in the insert. (b) CVs of TMPyP/GSH-CdTeQD/GOx modified electrodes at different scanning rates. (c) Linear correlation between the current increases and the scan rate.
Catalysts 12 01659 g007
Figure 8. FTIR spectra obtained from the analysis of a modified electrode with TMPyP (black line), TMPyP/GSH-CdTeQD (red line) and TMPyP/GSH-CdTeQD/GOx (blue line).
Catalysts 12 01659 g008
Figure 9. The 3D images (left) and respective plane RGB images (right) of SECM current obtained for a TMPyP/GSH-CdTeQD/GOx modified graphite electrode. (a,b) without glucose, (c,d) in the presence of glucose 5 mM at 0.7 V vs. SCE for H2O2 determination and (e,f) at 0.25 V vs. SCE for the FcMeOH reaction.
Catalysts 12 01659 g009
Figure 10. Increase in the oxidation current of Ferrocene-methanol, as a function of the glucose added to cell (a). Calibration curve obtained from glucose determination on three electrodes modified with TMPyP/GSH-CdTeQD/GOx (b).
Catalysts 12 01659 g010
Figure 11. Sensibility of enzymatic electrodes to interferents. The interference percentage of the current obtained for the TMPyP/GSH-CdTeQD/GOx electrodes without (a) and with BSA incubation for 30 (b) and 90 (c) minutes. Inserts show the corresponding chronoamperograms.
Catalysts 12 01659 g011
Figure 12. (a) Full cell polarization curves of Toray paper anodes modified with Porphyrin/GSH-CdTeQD/GOx, evaluated in PBS 0.1 M pH 7.4, in the presence of FcMeOH (a) at a 6 mL h−1 flow rate. The glucose concentration in the anolyte was 0 mM (gray), 10 mM (blue), 20 mM (green), or 50 mM (red); and (b) at different flow rates of the anolyte and catholyte: 1 mL h−1 (yellow), 3 mL h−1 (blue), 6 mL h−1 (black), 9 mL h−1 (red), and 12 mL h−1 (green).
Catalysts 12 01659 g012
Figure 13. Diagram of the microfluidic cell used in this work.
Catalysts 12 01659 g013
Table 1. Values of Zeta Potential and hydrodynamical ratio obtained by DLS obtained for TMPyP and GSH-CdTeQD separately and combined.
SampleHydrodynamical Ratio/nmζ/mV
TMPyP-−4.3
GSH-CdTeQD7 −29.3
TMPyP/GSH-CdTeQD328−33.9
Table 2. EDS elemental composition of the TMPyP/GSH-CdTeQD/GOx system deposited on carbon.
ElementWeight %Atomic %
C31 ± 343 ± 4
O36 ± 437 ± 4
Na24 ± 217 ± 1
S2 ± 0.11 ± 0.1
Cl4 ± 0.22 ± 0.1
Cd3 ± 0.30.4 ± 0.04
Te1 ± 0.40.1 ± 0.05
Table 3. Performance comparison between different enzymatic fuel cells.
AnodeOCP/
V
Imax/
mA cm−2
Wmax/
mW cm−2
Cell TypeRef
Pyr-Carboxilic Acid MWCNTs0.1400.0060.06Hidrogel[92]
Chitosan-CarbonNanoChips0.590.4340.055S. C. 1[93]
Vinil/Au0.3330.0450.013Microfluidic[94]
Vulcan/Maghemite/GOx0.3N. E.0.03Microfluidic[95]
Au0.30.690.11Microfluidic[96]
ITO/MWCNTs/CrosslinkedGOx0.560.450.153Microfluidic[97]
MWCNTs/GOx/GA0.722.450.61Microfluidic[98]
MWCNTs/GOx0.95N. E.1.25S. C. 1[99]
MWCNTs/Naftoquinone/GOx0.764.471.54S. C. 1[100]
TMPyP/GSHCdTeQD/GOx0.5717.532.30MicrofluidicThis Work
1 S. C. = Single compartment cell.
Publisher’s Note: MDPI stays neutral with regard to jurisdictional claims in published maps and institutional affiliations.

