Article

Synthesis of High-Energy Faceted TiO2 Nanocrystals with Enhanced Photocatalytic Performance for the Removal of Methyl Orange

1
Department of Chemistry and Chemical Engineering, Jinzhong University, Jinzhong 030619, China
2
Department of Materials Science and Engineering, Jinzhong University, Jinzhong 030619, China
*
Authors to whom correspondence should be addressed.
Catalysts 2022, 12(12), 1534; https://doi.org/10.3390/catal12121534
Submission received: 31 October 2022 / Revised: 23 November 2022 / Accepted: 25 November 2022 / Published: 28 November 2022
(This article belongs to the Special Issue Advanced Catalytic Material for Water Treatment)

Abstract

:
In this work, brookite TiO2 nanocrystals with co-exposed {001} and {120} facets (pH0.5-T500-TiO2 and pH11.5-T500-TiO2), rutile TiO2 nanorod with exposed {110} facets and anatase TiO2 nanocrystals with exposed {101} facets (pH3.5-T500-TiO2) and {101}/{010} facets (pH5.5-T500-TiO2, pH7.5-T500-TiO2 and pH9.5-T500-TiO2) were successfully synthesized through a one-pot solvothermal method by using titanium (V) iso-propoxide (TTIP) colloidal solution as the precursor. The crystal structure, morphology, specific surface area, surface chemical states and photoelectric properties of the pHx-T500-TiO2 (x = 0.5, 1.5, 3.5, 5.5, 7.5, 9.5, 11.5) were characterized by powder X-ray diffraction (XRD), field scanning transmission electron microscopy (FESEM), transmission electron microscopy (TEM), high-resolution TEM (HRTEM), nitrogen adsorption instrument, X-ray photoelectron spectroscopy (XPS), UV-Visible diffuse reflectance spectra and electrochemical impedance spectroscopy (EIS). The photocatalytic activity performance of the pHx-T500-TiO2 samples was also investigated. The results showed that as-prepared pH3.5-T500-TiO2 nanocrystal with exposed {101} facets exhibited the highest photocatalytic activity (95.75%) in the process of photocatalytic degradation of methyl orange (MO), which was 1.1, 1.2, 1.2, 1.3, 1.4, 1.6, 10.7, 15.1 and 27.8 fold higher than that of pH5.5-T500-TiO2 (89.47%), P25-TiO2 (81.16%), pH9.5-T500-TiO2 (79.41%), pH7.5-T500-TiO2 (73.53%), pH0.5-T500-TiO2 (69.10%), CM-TiO2 (61.09%), pH11.5-T500-TiO2 (8.99%), pH1.5-T500-TiO2 (6.33%) and the Blank (3.44%) sample, respectively. The highest photocatalytic activity of pH3.5-T500-TiO2 could be attributed to the synergistic effects of its anatase phase structure, the smallest particle size, the largest specific surface area and exposed {101} facets.

1. Introduction

Over the past few decades, titanium dioxide (TiO2) has been recognized as the most efficient and environmentally friendly photocatalyst, not only because of its advantages such as low cost, chemical stability, non-toxicity, high reactivity and good resistance to photo-corrosion, but also because of its potential application prospects in energy conversion, environmental remediation, photochemical storage and self-cleaning [1,2]. There are mainly three polymorphs of TiO2, namely, anatase, rutile and brookite, among which anatase is considered to be the most active for the degradation of organic pollutants [3,4,5,6]. The photocatalytic activity of anatase TiO2 is influenced by the morphology and exposed facets of crystals. Therefore, the shape-controlled synthesis of anatase crystals with dominant exposed high-energy facets has aroused great research interest in the past decade [3]. However, high-reactive facets such as {010}/{100} (0.53 J/m2), {001} (0.90 J/m2), {110} (1.09 J/m2 and {111} (1.61 J/m2) facets usually experience rapid diminution during the growth process of anatase TiO2 crystals to reduce the surface energies, resulting in the surface of anatase TiO2 crystals produced dominated by {101} facets (0.44 J/m2) [7,8]. Wen et al. made a breakthrough in synthesizing various morphology anatase TiO2 nanocrystals (boat-like, comb-like, leaflike, rhombic, et al.) with exposed highly reactive {010} facets by exfoliated [Ti1.73O4]1.07− nanosheet colloidal solutions [9]. Inspired by this pathbreaking work, extensive efforts have been devoted to the synthesis of different morphologies of anatase TiO2 crystals with dominant {010}, {001} and {111} facets. For instance, by using hydrofluoric acid (HF) as a shape-direction reagent, Yang et al. synthesized high-reactive anatase TiO2 microcrystals with 47% {001} facets [10]. By using titanium oxy-sulfate and HF with different concentrations as titanium source and shape-direction reagent, respectively, Pan et al. synthesized truncated tetragonal bipyramid anatase TiO2 with different proportions of {101}, {010} and {101} facets [11]. By using Ti(OBu)4 as titanium source, Zheng et al. synthesized hierarchical TiO2 microspheres consisting of anatase nanosheets or decahedrons with co-exposed {001} and {101} facets [12]. By simply tuning Ti/F ratio, Pan et al. synthesized anatase TiO2 crystal with co-exposed {001}, {010}, or {110} facets and sphere-like microcrystal with exposed dominant {001} facets [13]. By using metal titanium as precursor, Liu et al. synthesized sheet-shaped anatase TiO2 microcrystals with 75% {001} facets and 25% {101} facets [14]. By using a well-controlled alkaline hydrothermal transformation method, Pan et al. synthesized sword-like anatase TiO2 nanobelts with exposed 78% {100} facets [15]. By using a hydrothermal synthetic route, Liu et al. synthesized sheet-shaped, truncated bipyramidal and rod-like anatase TiO2 crystals with respectively dominated exposed {001}, {101} and {100} facets [16]. By using a solvothermal method, Žerjav et al., synthesized a series of truncated anatase TiO2 bipyramids with exposed different ratios of {001} facets [17]. Recently, by using a novel fluorine-free strategy based on topochemical conversion of 2D 1T-TiS2, Zarattini et al. synthesized single-crystalline 2D anatase TiO2 with co-exposed high energy {001} facets on the top and bottom and {100} facets at the sides of the nanosheet [18]. By using the exfoliated titanate nanosheets as precursors (such as [Ti3O7]2− or [Ti4O9]2−), our group also synthesized single-crystalline anatase TiO2 with exposed {010} facets and {111}-facets [19,20].
Herein, we demonstrate a novel, simple, green and low cost strategy to synthesize brookite TiO2 nanocrystal with co-exposed {001} and {120} facets, rutile TiO2 nanorod with exposed {110} facets and anatase TiO2 nanocrystals with exposed {101} facets and {101}/{010} facets based on the titanium (V) iso-propoxide (TTIP) colloidal solution as the precursor. To the best of our knowledge, this is the first time to synthesize TiO2 nanocrystals with different crystal forms and co-exposed crystal facets under different pH conditions in the coexistence of tetra-isopropyl titanate, isopropanol and triethanolamine. The structure, morphology, specific surface area, surface chemical states and photoelectric properties of the pHx-T500-TiO2 were carefully characterized. The photocatalytic activity for the degradation of MO under ultraviolet light irradiation was also investigated and compared with that of P25-TiO2 and CM-TiO2. The pH3.5-T500-TiO2 nanocrystal synthesized through solvothermal treatment of the TTIP colloidal solution has shown the highest photocatalytic activity, which can be attributed to its anatase phase structure, the smallest particle size, largest specific surface area and exposed {101} facets.

2. Results and Discussion

2.1. XRD Analysis

The crystal structure of the synthesized TiO2 samples was characterized by XRD (Figure 1). It can be seen that the pH0.5-TiO2 sample synthesized at pH = 0.5 consists of composite phases of brookite and rutile TiO2 (Figure 1a). The characteristic peaks at 2θ = 25.42°, 30.90°, 36.32°, 40.3°, 42.48°, 46.28°, 48.14°, 49.36°, 54.38°, 55.36° and 57.32° corresponding to the (120), (121), (012), (022), (221), (032), (231), (132), (320), (241) and (113) planes diffraction of brookite TiO2 (orthorhombic system; space group, Pcab; JCPDS No. 29-1360, a = 0.5456 nm, b = 0.9182 nm, c = 5.143 nm), respectively, were observed. Meanwhile, the diffraction peak observed at 27.54° corresponds to the (110) crystal plane of rutile TiO2 (tetragonal system; space group, P42/mnm; JCPDS No. 21-1276, a = b = 0.4593 nm and c = 0.2959 nm). According to the comprehensive intensity of brookite (121) peak TiO2 (50.0%) and rutile TiO2 (110) peak (22.6%), it can be estimated that the percentage of brookite and rutile TiO2 in the pH0.5-TiO2 sample is 85.76% and 14.24%, respectively [21]. As pH increased to 1.5 (Figure 1b), the diffraction peaks of pH1.5-TiO2 sample observed at 2θ = 27.72°, 36.38°, 39.46°, 41.56°, 44.32°, 54.62°, 56.86°, 63.08°, 64.38°, 69.22° and 70.16° corresponding to the (110), (101), (200), (111), (210), (211), (220), (002), (310), (301) and (112) crystal planes of rutile TiO2, while the weak peak observed at 2θ = 25.69° corresponding to the (101) crystal plane of anatase TiO2 (tetragonal system; space group, I41/amd; JCPDS No. 21-1272, a = b = 0.37852 nm, c = 0.95139 nm). Similarly, according to the integrated intensity of rutile TiO2 (110) peak (100.0%) and anatase (101) peak TiO2 (3.7%), it can be estimated that the percentage of rutile and anatase TiO2 in the pH0.5-TiO2 sample is 96.81% and 3.19%, respectively [21]. As shown in Figure 1c–f, the pH3.5-TiO2, pH5.5-TiO2, pH7.5-TiO2 and pH9.5-TiO2 samples prepared at 180 °C for 24 h under different pH conditions possessed the same diffraction peaks in spite of the difference in intensity and can be attributed to the tetragonal anatase phase with the diffraction peaks at 2θ = 25.56°, 38.32°, 48.40°, 54.38°, 54.75°, 63.14° and 75.52°, corresponding to the (101), (004), (200), (105), (211), (211), (204) and (215) crystal planes of anatase TiO2. Obviously, the change from Figure 2c–f shows an interesting phenomenon, that the diffraction peak intensity of anatase (101) plane increases increasing pH values, indicating an improved crystallization [22]. Continuing to increase the pH to 11.5 (Figure 1g), in addition to the characteristic peaks of brookite TiO2, the other diffraction peaks at 10.28°, 24.30° and 28.28° were also observed in the obtained pH11.5-TiO2 sample, corresponding to the (20-1), (401) and (310) planes of layered H2Ti4O9 H2O phase (monoclinic system; space group, C; JCPDS No. 38-0699, a = 1.988 nm, b = 0.3735 nm, c = 1.209 nm and β = 114.9), respectively, and the basic interlayer spacing was 0.866 nm. At pH = 12.5 (Figure 1h), no diffraction peak of TiO2 was obtained in the XRD of pH12.5-TiO2 sample, indicating that it is not conductive to the synthesis of TiO2 under strong alkaline conditions. The diffraction peaks at 9.46° and 48.34° were observed in the obtained pH12.5-TiO2 sample, corresponding to the (200) and (020) planes of layered H2Ti2O5∙H2O phase (orthorhombic system; space group, P; JCPDS No. 47-0124, a = 1.083 nm, b = 0.3784 nm and c = 0.2998 nm), respectively, and the basic interlayer spacing was 0.934 nm.
Figure 1a′–h′ show the XRD patterns of as-prepared pHx-T500-TiO2 products. The average crystallite sizes of the synthesized TiO2 products estimated from the full width at half-maximum (FWHM) of XRD peaks using Scherrer equation [23] D = 0.89λ/βcosθ (λ, the wavelength of X-ray irradiation (Cu Ka = 0.15406 nm); β, the FWHM of the diffraction peak; θ, the X-ray diffraction angle) are 20.7 (22.3), 20.1 (25.0), 7.4 (18.2), 11.4 (16.5), 10.4 (15.8), 13.5 (16.6) and 29.6 (34.8) nm for pH0.5-TiO2 (pH0.5-TiO2-T500), pH1.5-TiO2 (pH1.5-TiO2-T500), pH3.5-TiO2 (pH3.5-TiO2-T500), pH5.5-TiO2 (pH5.5-TiO2-T500), pH7.5-TiO2 (pH7.5-TiO2-T500), pH9.5-TiO2 (pH9.5-TiO2-T500) and pH11.5-TiO2 (pH11.5-TiO2-T500), respectively. Compared with Figure 1a–h, the intensities of the diffraction peaks and average crystallite sizes of all products are significantly enhanced and enlarged, indicating that their crystallinity is increased. TiO2 in the pH0.5-T500-TiO2 sample existed as brookite and rutile (Figure 1a′) and the percentage of brookite and rutile TiO2 was estimated to be 83.08% and 16.92%, respectively, according to the integrated intensity of brookite (121) peak TiO2 (41.5%) and rutile TiO2 (110) peak (23.0%) [21]. Compared with Figure 1aʹ, the diffraction peaks of brookite TiO2 is slightly shifted to the right, which is caused by the slight decrease of the interplanar spacing (for example, d(120) decreases from 3.501 Å to 3.493 Å). After calcining the pH1.5-TiO2 sample at 500 °C for 3 h, only the diffraction peak of rutile TiO2 was observed in the pH-T500-TiO2 sample obtained (Figure 1b′). Compared with Figure 1b, the diffraction peak at 2θ = 25.69° disappears, indicating that a very small amount of anatase TiO2 was transformed into rutile TiO2 upon firing at 500 °C. Compared with the pHx-TiO2 (x = 3.5, 5.5, 7.5, 9.5) samples (Figure 1c–f), the crystal structure of the pHx-T500-TiO2 (x = 3.5, 5.5, 7.5, 9.5) samples obtained after calcination at 500 °C for 3 h did not change except that the crystal plane spacing of (101) was slightly increased, which led to the diffraction peaks shifted slightly to the left (Figure 1c′–f′). The diffraction peaks in Figure 1gʹ correspond to the brookite phase TiO2. Compared to the standard JCPDS card number 29-1360 (d(120) = 3.512 Å), all the diffraction peaks are slightly shifted to the right, which is due to the slight reduction of the interplanar spacing of the as-synthesized brookite TiO2 (d(120) = 3.453 Å). Compared with Figure 1g, the layered phase disappeared, indicating that the decomposition of H2Ti4O9∙H2O occurred at high temperature. As can be seen from Figure 1h′, the pH12.5-T500-TiO2 product obtained after high-temperature calcination is still a layered phase. Compared with Figure 1h, the basic layer spacing of the (200) crystal plane increases from 9.342 to 9.666 Å, resulting in the diffraction peak slightly shifting to the left. In addition, the intensity of the diffraction peaks is significantly enhanced, indicating an increase in crystallinity.

2.2. Morphology and Microstructure Analysis

Figure 2 shows the FESEM images of the as-prepared pHx-T500-TiO2 samples. It can be seen from Figure 2 that the morphology of pHx-T500-TiO2 samples obtained under different pH conditions is different. At pH = 0.5, the morphology of the obtained pH0.5-T500-TiO2 nanocrystal mainly consists of rod shape with a length of 104–133 nm and a width of 21–37 nm, cuboid shape with a length of 20–60 nm and a width of 14–30 nm, and spherical shape with a diameter of 20–27 nm, as shown in Figure 2a,b. At pH = 1.5, the morphology of the obtained pH0.5-T500-TiO2 nanocrystal is mainly rod-shaped with a length of 50–104 nm and a width of 15–29 nm, corresponding to rutile TiO2 (Figure 2c). When pH is 3.5~9.5, the morphology of the obtained pHx-T500-TiO2 (x = 3.5, 5.5, 7.5, 9.5) nanocrystals is mainly cuboid and spherical with particle size of about 20 nm, as shown in Figure 2d–g. When the pH continues to increase to 11.5, the morphology of the obtained pH11.5-T500-TiO2 is mainly composed of tetragonal columnar nanocrystals with a length of 189–290 nm, a width of 70–137 nm and a thickness of 25–40 nm, plate-like nanocrystals with a thickness of 15–33 nm and some irregular large particles (Figure 2h,i).
The morphological and structural characteristics of the obtained pHx-T500-TiO2 samples were further characterized by TEM and HRTEM, as shown in Figure 3 and Figure 4. Figure 4 shows the TEM and HRTEM images of the pH0.5-T500-TiO2, pH1.5-T500-TiO2, pH3.5-T500-TiO2 and pH5.5-T500-TiO2 samples synthesized by the hydrothermal process at 180 °C by varying the pH values of the TTIP suspension liquid. The TEM image of the pH0.5-T500-TiO2 sample obtained shows a rod-shaped morphology with a length of 34–114 nm and a width of 17–36 nm, cuboid morphology with a length of with a length of 20–28 nm and a width of 17–21 nm and spherical morphology with a diameter of 14–25 nm, which is consistent with those observed by FESEM (Figure 3a). For pH0.5-T500-TiO2, the distances between the lattice fringes, 0.350 and 0.350 nm (or 0.351 nm and 0.351 nm), can be assigned to the (120) and (−120) planes of the brookite TiO2 phase, respectively, and the angle labeled at 80° between the (120) and (−120) planes is identical to the theoretical value, suggesting that the rod-like nanocrystal co-exposes {001} and {120} facets on the top (or bottom) and lateral planes (Figure 4b,c) [24]. The fast Fourier transform (FFT) diffraction pattern of the white, dashed lines region (Figure 3a inset) further indicated that the rod-like TiO2 nanocrystal is single-crystalline. The 0.280 nm of the interplanar spacing of the nanoparticles can be assigned to the (121) planes of the brookite TiO2 (Figure 3c). The TEM image of the pH1.5-T500-TiO2 sample obtained shows a rod-shaped morphology with a length of 28–104 nm and a width of 15–39 nm, which is consistent with those observed by FESEM (Figure 3d). The lattice fringes parallel to the lateral planes were measured to be 0.324 nm, corresponding to the interplanar distance of the rutile TiO2 (110) planes (Figure 3e,f), indicating that the nanorod exposes {110} facets on the lateral planes and the growth direction along the {001} direction [25,26]. The TEM image of the pH3.5-T500-TiO2 sample obtained shows a cuboid morphology with a length of 13–20 nm and a width of 10–19 nm and spherical morphology with a diameter of 11–21 nm, which is consistent with those observed by FESEM (Figure 3g). The 0.350 nm (or 0.352, 0.354 nm) of the interplanar spacing of the nanoparticles can be assigned to the (101) planes of the anatase TiO2 (Figure 3h,i) [27]. The FFT diffraction pattern of the white, dashed line region (Figure 3i inset) further indicates that the irregular TiO2 nanocrystal is a single-crystalline. Figure 3j–l presents the TEM and HRTEM images of the pH5.5-T500-TiO2 sample. The distances between the lattice fringes, 0.350 nm (or 0.349 nm) and 0.237 nm, can be assigned to the (101) and (004) planes of the anatase TiO2 phase, respectively [3,9]. Viewed along the {010} direction, there were two atomic planes (101) and (004) and the interface angle is 68.3°, indicating that the as-prepared pH5.5-T500-TiO2 sample is a single-crystalline anatase TiO2 (Figure 3k inset) with exposed {010} facets. The lattice fringes are paralleled to the lateral planes of the nano-cuboid, indicating that the {101} facets are exposed on the lateral surface of the nano-cuboid.
Figure 4 shows the TEM and HRTEM images of the pH7.5-T500-TiO2, pH9.5-T500-TiO2 and pH11.5-T500-TiO2 samples synthesized by the hydrothermal process at 180 °C by varying the pH values of the TTIP suspension liquid. The TEM image of the pH7.5-T500-TiO2 sample obtained mainly shows a cuboid morphology with a length of with a length of 12–24 nm and a width of 8–21 nm, which is consistent with those observed by FESEM (Figure 4a). For pH7.5-T500-TiO2, the distances between the lattice fringes, 0.350 nm (or 0.349 nm), can be assigned to the (101) planes of the anatase TiO2 phase (Figure 4b). The existence of the two atomic planes, (101) and (020), with a lattice spacing of 0.349 and 0.189 nm between two consecutive planes and an interfacial angle of 90° between the (101) and (020) crystal planes, proves that the cuboid-shaped pH7.5-T500-TiO2 anatase nanocrystals should be mainly exposed with {101} and {010} facets on the lateral surfaces (Figure 4c). The TEM image of the pH9.5-T500-TiO2 sample obtained presents a cuboid morphology with a length of 12–30 nm and a width of 10–24 nm, which is consistent with those observed by FESEM (Figure 4d). Three sets of lattice fringes with intervals of 0.349, 0.237 and 0.349 nm and angles of 68.3°, 68.3° and 136.6° can be identified in the HRTEM image, which is in good agreement with the spacing of the (101), (004) and (−101) planes of the tetragonal anatase TiO2, respectively, indicating that the as-prepared pH9.5-T500-TiO2 nano-cuboid was single-crystalline and co-exposed {101} and {010} facets (Figure 4e). The 0.349 nm (0.350 nm) of the interplanar spacing of the nano-cuboid can be assigned to the (101) planes of the anatase TiO2 (Figure 4f). Figure 4g–i presents the TEM and HRTEM images of the pH11.5-T500-TiO2 sample. The distances between the lattice fringes, 0.350 nm and 0.350 nm, can be assigned to the (120) and (−120) planes of the brookite TiO2 phase, respectively. The angle between (120) and (−120) planes is about 80°, which is in agreement with the theoretical angle, suggesting that the rod-like nanocrystal co-exposes {001} and {120} facets on the top (or bottom) and lateral planes (Figure 4h). The lattice fringes parallel to the lateral planes was measured to be 0.352 nm, corresponding to the interplanar distance of the brookite TiO2 (120) planes (Figure 4i), indicating that the tetragonal prism exposes {120} facets on the lateral planes. The above analysis showed that the cuboid nanocrystals co-exposed {001} and {120} planes on the top (or bottom) and lateral planes (Figure 4h).

2.3. XPS Studies

X-ray photoelectron spectroscopy (XPS) was employed to analyze the surface chemical states of pHx-T500-TiO2 and CM-TiO2 samples. As shown in Figure 5a, the co-existence of Ti, O and C elements in pHx-T500-TiO2 and CM-TiO2 samples is evidenced. In detail, Ti 2p spectra in Figure 5b show two distinct peaks of Ti 2p3/2 (457.98~459.08 eV) and Ti 2p1/2 (463.98~464.88 eV), indicating the Ti (IV) oxidation state in pHx-T500-TiO2 and CM-TiO2 [16]. High-resolution O 1s spectra in Figure 5c show the strong peaks at 529.48~530.18 eV, which can be identified to Ti-O-Ti surface lattice oxygen species [28]. The high-resolution C 1s XPS spectra of pHx-T500-TiO2 and CM-TiO2 samples in Figure 5d can be deconvoluted into a strong peak of C-C/C=C species (284.58~284.88 eV) and a relatively weak peak of C=O (288.28~288.58 eV), which are caused by the adventitious hydrocarbon from the XPS instrument itself [28,29].

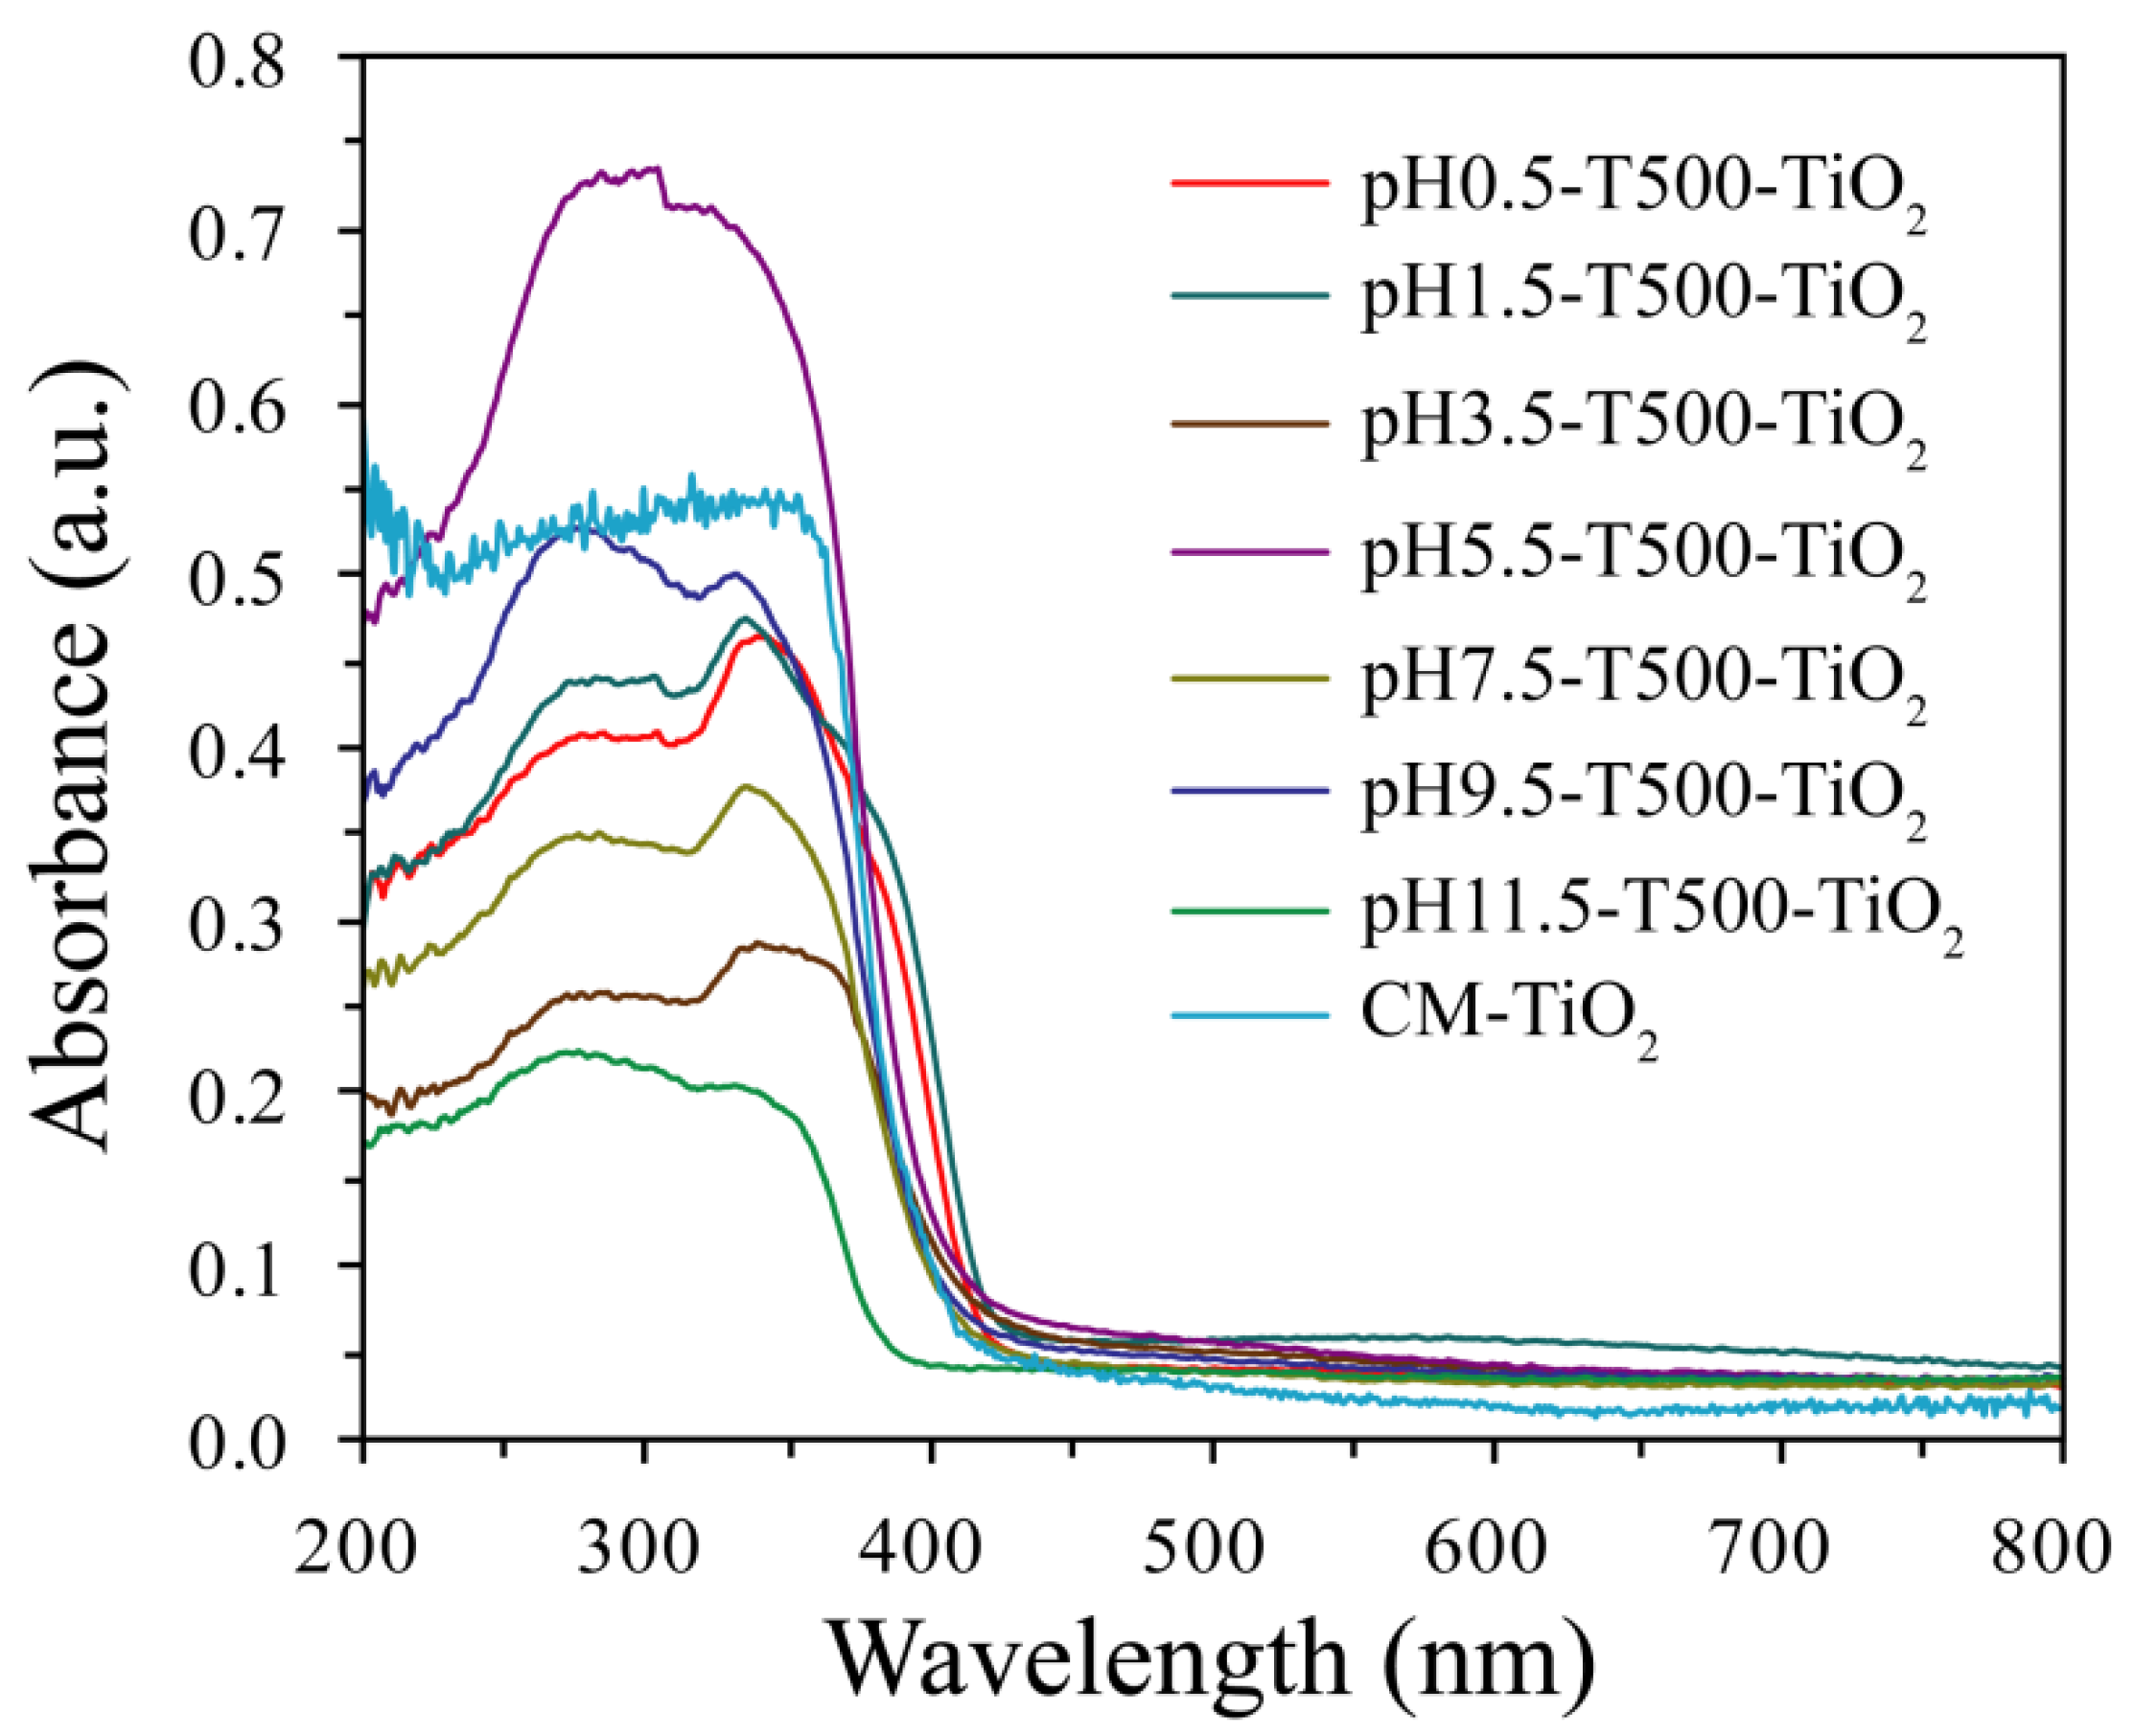
2.4. UV-Visible Diffuse Reflectance Spectra Studies

To determine the nature of the band gap, the UV-visible diffuse reflectance spectra of the different samples were investigated and the adsorption data shown in Figure 6 were fitted to the direct transition ((αhv)2 = B(hvEg)) [30,31] by extrapolating the linear part of the curves equal to zero. In the above equation, α is the absorption coefficient, hv is the energy of the incident photon, Eg is the band gap energy and B is a constant. The spectrum of the sample is shifted to a shorter wavelength, indicating an increase in the band gap, while the spectrum is shifted to a longer wavelength, indicating a decrease in the band gap. The absorption edge of CM-TiO2 is about 394 nm, while the absorption edges of pH0.5-T500-TiO2, pH1.5-T500-TiO2, pH3.5-T500-TiO2, pH5.5-T500-TiO2, pH7.5-T500-TiO2, pH9.5-T500-TiO2 and pH11.5-T500-TiO2 show obvious red shift of 21 nm (about 415 nm), 27 nm (about 421 nm), 23 nm (about 417 nm), 6 nm (about 400 nm), 10 nm (about 404 nm),10 nm (about 404 nm) and blue shift of 8 nm (about 386 nm) relative to that of CM-TiO2 sample, respectively. According to the above formula, the band gap value of the samples can be estimated as 2.99 eV (pH0.5-T500-TiO2), 2.95 eV (pH1.5-T500-TiO2), 2.97 eV (pH3.5-T500-TiO2), 3.10 eV (pH5.5-T500-TiO2), 3.07 eV (pH7.5-T500-TiO2), 3.07 eV (pH9.5-T500-TiO2), 3.21 eV (pH11.5-T500-TiO2) and 3.15 eV (CM-TiO2), respectively. In addition, the adsorption intensity in the visible light range differs among the pHx-T500-TiO2 samples and shows an order of pH5.5-T500-TiO2 > CM-TiO2 > pH9.5-T500-TiO2 > pH1.5-T500-TiO2 > pH0.5-T500-TiO2 > pH7.5-T500-TiO2 > pH3.5-T500-TiO2 > pH11.5-T500-TiO2.

2.5. Electrochemical Impedance Spectroscopy Analysis

The photoelectric properties of the pHx-T500-TiO2 and CM-TiO2 samples were investigated with electrochemical impedance spectroscopy (EIS) measurement. EIS Nyquist plots of pHx-T500-TiO2 nanocrystals obtained under different pH value conditions are shown in Figure 7. As shown in Figure 7, the impedance arc radius of the nanocrystals increases in an order of pH9.5-T500-TiO2 < pH0.5-T500-TiO2 < pH7.5-T500-TiO2 < pH11.5-T500-TiO2 < pH5.5-T500-TiO2 < pH3.5-T500-TiO2 < pH1.5-T500-TiO2 < CM-TiO2. It is well known that the separation efficiency of photogenerated electron-hole pairs has an important effect on photocatalytic activity. In general, the decrease of the semicircle diameter at the high-frequency region of the EIS Nyquist plot indicates that charge-transfer resistance at the contact interface between electrode and electrolyte is low [28]. Obviously, the pH9.5-T500-TiO2 nanocrystals display the lowest semicircle diameter at a high frequency than that of pHx-T500-TiO2 (x = 0.5, 1.5, 3.5, 5.5, 7.5, 11.5) and CM-TiO2 samples, suggesting the smallest charge-transfer resistance and the lowest recombination resistance. The same trend is seen in the electron-hole separation efficiency of pH1.5-T500-TiO2, pH11.5-T500-TiO2 and CM-TiO2 samples without typical semicircle at the high frequency, corresponding to lower electron-hole separation efficiencies.

2.6. Photocatalytic Activity Analysis

In this study, methyl orange (MO), with a major adsorption band at about 467 nm, was selected as a model pollutant for evaluating the photocatalytic activities of pHx-T500-TiO2 (x = 0.5, 1.5, 3.5, 5.5, 7.5, 9.5, 11.5) samples. Photolysis of MO solution with P25-TiO2, CM-TiO2 and without any catalyst (i.e., Blank) were also performed under the same conditions for comparison. The photocatalytic degradation of MO can be described as the following reactions (1)-(7) [32]:
TiO2 + hv → TiO2 (e+ h+)
TiO2 (h+) + OH¯ → TiO2 (·OH)
TiO2 (e) + O2 → TiO2 (O2)
TiO2 (O2) + H2O → TiO2 (HO2· + OH)
TiO2 (HO2·) + H2O → TiO2 (H2O2 + ·OH)
TiO2 (H2O2) + TiO2 (·OH + ·OH)
TiO2 (·OH) + MO → peroxy or hydroxylated…intermediates → degraded or mineralized products.
The above reactions were chosen because both the photoelectrons and photo-holes eventually participate in the formation of the ·OH radical, resulting in the degradation of MO. The photocatalytic degradation of MO was carried out under ultraviolet light irradiation from a low-pressure mercury lamp (λmax = 365 nm). Figure 8a depicts the spectral change curve of 3.15 × 10⁻⁵ mol/L MO solution degraded based on pH3.5-T500-TiO2 sample as the photocatalyst. It can be seen that the absorbance intensity of the ultraviolet-visible region (300−650 nm) gradually decreased with the prolonging of irradiation time. Moreover, the maximum adsorption peaks shifted from 467 to 465, 463, 461, 458, 454, 453, 450 and 449 nm at 0, 15, 30, 45, 60, 75, 90, 105 and 120 min, respectively, indicating the degradation of MO. The degradation percentage of MO with irradiation time for the as-prepared pHx-T500-TiO2, P25-TiO2, CM-TiO2 and Blank samples are shown in Figure 8b and the corresponding properties and activity parameters are list in Table 1. As shown in Figure 8b, the TiO2 samples with different crystal phases produce different photocatalytic degradation efficiency, exhibiting an order of total degradation efficiency during 120 min under ultraviolet light with pH3.5-T500-TiO2 (95.75%) > pH5.5-T500-TiO2 (89.47%) > P25-TiO2 (81.16%) > pH9.5-T500-TiO2 (79.41%) > pH7.5-T500-TiO2 (73.53%) > pH0.5-T500-TiO2 (69.10%) > CM-TiO2 (61.09%) > pH11.5-T500-TiO2 (8.99%) > pH1.5-T500-TiO2 (6.33%) > Blank (3.44%). The pH3.5-T500-TiO2 sample shows the highest photo-catalytic activity, which is 1.1, 1.2, 1.2, 1.3, 1.4, 1.6, 10.7, 15.1 and 27.8 folds higher than that of pH5.5-T500-TiO2, P25-TiO2, pH9.5-T500-TiO2, pH7.5-T500-TiO2, pH0.5-T500-TiO2, CM-TiO2, pH11.5-T500-TiO2, pH1.5-T500-TiO2 and the Blank sample, respectively. It is universally acknowledged that the photocatalytic activity of TiO2 samples is comprehensively affected by many factors, such as crystalline phase, heterostructure, crystal size, specific surface area and exposed crystal surface [33]. Generally speaking, compared with other crystal forms, anatase TiO2 usually has significant photocatalytic activity in the process of photocatalytic degradation of organic pollution and its photocatalytic activity is inversely proportional to the particle size and proportional to the specific surface area [34]. For the prepared pHx-T500-TiO2 sample, pH1.5-T500-TiO2 depicts the lowest photocatalytic activity can be attributed to its rutile structure, larger particle size (mean size: 49.4 nm) and smaller specific surface area (31.7 m2/g). The low photocatalytic activity of pH11.5-T500-TiO2 is attributed to its brookite structure, the largest particle size (mean size: 199.2 nm) and the smallest specific surface area (7.9 m2/g). Compared with pH1.5-T500-TiO2 and pH11.5-T500-TiO2, pH0.5-T500-TiO2 has higher photocatalytic activity, which is attributed to its brookite/rutile heterostructure, smaller particle size (mean size: 30.4 nm) and larger specific surface area (51.4 m2/g). In addition, for pHx-T500-TiO2 samples with the same anatase crystal form and exposed facets, the order of increasing photocatalytic activity (pH7.5-T500-TiO2 < pH9.5-T500-TiO2 < pH5.5-T500-TiO2 < pH3.5-T500-TiO2) is almost the same as the order of decreasing particle size (pH9.5-T500-TiO2 (mean size: 21.4 nm) > pH7.5-T500-TiO2 (mean size: 19.6 nm)) > pH5.5-T500-TiO2 (mean size: 18.9 nm) > pH3.5-T500-TiO2 (mean size: 17.4 nm)) and increasing specific surface area (pH9.5-T500-TiO2 (73.2 m2/g) < pH7.5-T500-TiO2 (79.5 m2/g) < pH5.5-T500-TiO2 (82.8 m2/g) < pH3.5-T500-TiO2 (89.6 m2/g)). The above analysis results show that the enhanced photocatalytic activity of pH3.5-T500-TiO2 with exposed {101} facets is attributed to its smallest particle size and largest specific surface area. The commercial P25-TiO2 sample (~87% anatase and~13% rutile) showed high photocatalytic activity due to the synergistic effect of heterojunction structure, large specific surface area (52.5 m2/g) and small particle size (~26.2 nm) [35]. Although CM-TiO2 also has rutile/anatase heterostructure, its photocatalytic activity is far less than that of pHx-T500-TiO2 (x = 3.5, 5.5, 7.5, 9.5) with exposed {101} crystal facets, which is due to its larger particle size (mean size: 98.7 nm), smaller specific surface area (15.8 m2/g) and no specific exposed crystal surface.
The stability and reusability of the pH3.5-T500-TiO2, pH5.5-T500-TiO2, pH7.5-T500-TiO2, pH9.5-T500-TiO2 and pH25-TiO2 samples were evaluated by carrying out cycling experiments three times for the photodegradation of MO, as shown in Figure 9d. The degradation rates of the pH3.5-T500-TiO2, pH5.5-T500-TiO2, pH7.5-T500-TiO2, pH9.5-T500-TiO2 and pH25-TiO2 samples decreased by only 2.61%, 3.35%, 3.13%, 2.87% and 3.77% for the MO photodegradation, respectively, after recycling three times, indicating that the above samples possessed good stability and reusability.

3. Materials and Methods

3.1. Materials

Titanium (V) iso-propoxide (TTIP, Ti[OCH(CH3)2]4, ≥99.0%), hydrochloric acid (HCl, 36.0~38.0%) and sodium hydroxide (NaOH, ≥96%) were purchased from Sahn chemical technology Co., Ltd. (Shanghai, China), Chengdu Chron Chemicals Co. Ltd. (Chengdu, China), Tianjin Kaitong Chemical Reagent Co. LTD (Tianjin, China), respectively. Isopropyl alcohol ((CH3)2CHOH, ≥99.7%), triethanolamine (N(CH2CH2OH)3, ≥85.0%) and the commercial titanium dioxide (CM-TiO2, 96.8% anatase and 3.2% rutile) were obtained from Tianjin Bodi Chemical Co., LTD (Tianjin, China) and used as received. Degussa P25-TiO2 powder (~80% anatase and ~20% rutile) was obtained from Guangzhou Heqian Trading Co., Ltd. (Guangzhou, China).

3.2. Synthesis

30 mL of titanium (V) iso-propoxide (TTIP) was added dropwise to a mixture of 350 mL of distilled water, 120 mL of isopropanol and 60 mL of triethanolamine under magnetic stirring for 24 h, then 70 mL of the resulting white suspension liquid above was transferred to a 100 mL Teflon-line autoclave, which was first adjusted to a set pH (0.5, 1.5, 3.5, 5.5, 7.5, 11.5 and 12.5) with 3 mol/L HCl and 3 mol/L NaOH, the autoclaves were heated to 180 °C and kept at this temperature for 24 h. After cooling to room temperature, the resulting samples were filtered, washed, dried and ground. Finally, the above white samples were placed in a high-temperature box furnace and annealed at 500 °C for 3 h. After cooling to room temperature, white TiO2 powders were obtained.

3.3. Characterization

Powder X-ray diffraction (XRD) measurements of the samples were performed using an X-ray diffractometer (XRD-6100, Shimadzu, Kyoto, Japan) equipped with graphite monochromatized Cu Ka radiation (λ = 1.5406 Å). The field scanning transmission electron microscopy (FESEM) images were taken on a Hitachi SU8100 atomic resolution analytical microscope (Tokyo, Japan). Transmission electron microscopy (TEM) and high-resolution TEM (HRTEM) images were recorded on a FEI TALOS F200S transmission electron microscope (Portland, OR, USA). The specific surface area was measured at −196 °C with a micromeritics ASAP 2020 nitrogen adsorption instrument (Micromeritics Instrument Corp., Atlanta, GA, USA) using the Brunauer–Emmett–Teller (BET) equation. X-ray photoelectron spectroscopy (XPS) measurements were carried out on a Thermo Fisher Scientific system (New York, NY, USA). Electrochemical impedance spectroscopy (EIS, CHI600E, Shanghai Chenhua Instrument Co. Ltd., Shanghai, China) measurement was carried out on the electrochemical workstation under the irradiation of a 300 W xenon lamp equipped with a cut-off filter (>420 nm). Indium tin oxide (ITO) conductive glass (opening area: 1 cm2), platinum and an Ag/AgCl electrode were used as working electrode, counter electrode and reference electrode, and 0.2 mol/L Na2SO4 solution was used as electrolyte. Under open circuit potential conditions, EIS was recorded in the frequency range of 100 kHz to 0.01 Hz.

3.4. Photocatalytic Experiments

Photocatalytic activity of the synthesized pHx-TiO2 nanocrystals was evaluated with methyl orange (C14H14N3NaO3S, MO) dye as model water pollutant under ultraviolet light irradiation, then 100 mg of the sample was dispersed in 150 mL MO aqueous solution with the concentration of 3.15 × 10⁻⁵ mol/L in a 250 mL quartz beaker. Prior to irradiation, the suspension was kept under stirring with a magnetic stirrer for 60 min in the dark to ensure that the MO dye reached the adsorption/desorption equilibrium on the surface of TiO2 nanocrystals. A 175 W low-pressure mercury lamp (λmax = 365 nm) was used as the ultraviolet light source and the distance from the light source to the liquid level of the suspension was 25 cm. At a regular time interval of 15 min, 4 mL of the suspension was extracted and centrifuged, then the supernatant liquid was collected to evaluate the degradation effect of MO. The absorbance spectra of the supernatant liquid were recorded using a TU 1901 ultraviolet-visible spectrophotometer (Beijing Purkinje General Instrument Co., Ltd., Beijing, China). The photocatalytic activity of CM-TiO2 crystals was also measured as a reference to compare with that of the synthesized TiO2 nanocrystals using the same parameters. Dye degradation rate (η) = (c0ct)/ct × 100%, where c0 and ct are the original MO concentration after adsorption/desorption equilibrium and the residual MO concentration after a certain period of illumination, respectively.

4. Conclusions

In summary, brookite TiO2 nanocrystals with co-exposed {001} and {120} facets, rutile TiO2 nanorod with exposed {110} facets and anatase TiO2 nanocrystals with exposed {101} facets and {101}/{010} facets were synthesized using distilled water, isopropanol and triethanolamine as solvents by a simple solvothermal treatment of TTIP colloidal solution with desired pH value. The crystal structure, morphology, specific surface area and electron-hole separation efficiency of the pHx-T500-TiO2 were characterized by XRD, FESEM, TEM, HRTEM, nitrogen adsorption instrument, XPS, UV-Vis DRS spectra and EIS. The pH value of the solution has an important influence on the structure and morphology of the synthesized TiO2 nanocrystals. When pH ≤ 1.5, the mixed phase of brookite and rutile TiO2 is obtained, with the shape of rod and cuboid; When 3.5 ≤ pH ≤ 9.5, anatase TiO2 is obtained and its morphology is cuboid and spherical; at 9.5 < pH ≤ 11.5, the obtained brookite TiO2 has a square column shape; when pH ≥ 12.5, layered phase is obtained, i.e., the precursor does not react. Photocatalytic degradation of MO performance of the as-obtained pHx-T500-TiO2 nanocrystals was investigated under ultraviolet irradiation. It is worth mentioning that the pH3.5-T500-TiO2 nanocrystal exhibits the best photocatalytic activity due to the synergistic effects of its anatase phase structure, the smallest particle size, the largest specific surface area and the exposed anatase {101} facets in comparison with the CM-TiO2, P25-TiO2 and other pHx-T500-TiO2 nanocrystals.

Author Contributions

Conceptualization, Y.D., X.N. and W.L.; methodology, Y.D., X.N. and W.L.; formal analysis, J.L. (Jian Liu) and J.L. (Jinxiao Li); data curation, J.L. (Jian Liu) and J.L. (Jinxiao Li); writing—original draft preparation, X.N. and Y.D.; writing—review and editing, Y.D. and W.L.; funding acquisition, Y.D. and W.L. All authors have read and agreed to the published version of the manuscript.

Funding

This research was funded by grants 201901D111303 and 20210302124045 from the Applied Basic Research Project of Shanxi; grant 2019L0881 and 2020L0602 from the Shanxi Scientific and Technological Innovation Programs of Higher Education Institutions; grant jzxycxtd2019005 from the Jinzhong University “1331 Project” Key Innovation Team; and Research Start-up Fee of Jinzhong University.

Data Availability Statement

The processed data required to reproduce these findings are available by e-mail to the corresponding author.

Conflicts of Interest

The authors declare no conflict of interest.

References

  1. Pitchaimuthu, S.; Honda, K.; Suzuki, S.; Naito, A.; Suzuki, N.; Katsumata, K.; Nakata, K.; Ishida, N.; Kitamura, N.; Idemoto, Y.; et al. Solution plasma process-derived defect-induced heterophase anatase/brookite TiO2 nanocrystals for enhanced gaseous photocatalytic performance. ACS Omega 2018, 3, 898–905. [Google Scholar] [CrossRef] [PubMed] [Green Version]
  2. Zou, F.X.; Hu, J.W.; Miao, W.J.; Shen, Y.J.; Ding, J.D.; Jing, X.H. Synthesis and Characterization of Enhanced Photocatalytic Activity with Li+-Doping Nanosized TiO2 Catalyst. ACS Omega 2020, 5, 28510–28516. [Google Scholar] [CrossRef] [PubMed]
  3. Zhao, J.; Zou, X.X.; Su, J.; Wang, P.P.; Zhou, L.J.; Li, G.D. Synthesis and photocatalytic activity of porous anatase TiO2 microspheres composed of {010}-faceted nanobelts. Dalton Trans. 2013, 42, 4365–4368. [Google Scholar] [CrossRef] [PubMed]
  4. Roy, A.; Mukhopadhyay, S.; Sujatha Devi, P.S.; Sundaram, S. Polyaniline-layered rutile TiO2 nanorods as alternative photoanode in dye-sensitized solar cells. ACS Omega 2019, 4, 1130–1138. [Google Scholar] [CrossRef] [PubMed] [Green Version]
  5. Svora, P.; Ecorchard, P.; Pližingrová, E.; Komárková, B.; Pawełkowicz, S.S.; Murafa, N.; Maříková, M.; Darina Smržová, D.; Wagner, B.; Machálková, A.; et al. Influence of inorganic bases on the structure of titanium dioxide based microsheets. ACS Omega 2020, 5, 23703–23717. [Google Scholar] [CrossRef]
  6. Lee, M.G.; Yang, J.W.; Kwon, H.R.; Jang, H.W. Crystal facet and phase engineering for advanced water splitting. CrystEngComm 2022, 24, 5838–5864. [Google Scholar] [CrossRef]
  7. Han, X.G.; Kuang, Q.; Jin, M.S.; Xie, Z.X.; Zheng, L.S. Synthesis of titania nanosheets with a high percentage of exposed {001} facets and related photocatalytic properties. J. Am. Chem. Soc. 2009, 131, 3152–3153. [Google Scholar] [CrossRef]
  8. Xu, H.; Reunchan, P.; Ouyang, S.; Tong, H.; Umezawa, N.; Kako, T.; Ye, J. Anatase TiO2 single crystals exposed with high reactive {111} facets toward efficient H2 evolution. Chem. Mater. 2013, 25, 405–411. [Google Scholar] [CrossRef]
  9. Wen, P.H.; Itoh, H.; Tang, W.P.; Feng, Q. Single nanocrystals of anatase-type TiO2 prepared from layered titanate nanosheets: Formation mechanism and characterization of surface properties. Langmuir 2007, 23, 11782–11790. [Google Scholar] [CrossRef]
  10. Yang, H.G.; Sun, C.H.; Qiao, S.Z.; Zou, J.; Liu, G.; Smith, S.C.; Cheng, H.M.; Lu, G.Q. Anatase TiO2 single crystals with a large percentage of reactive facets. Nature 2008, 453, 638–642. [Google Scholar] [CrossRef]
  11. Pan, J.; Liu, G.; Lu, G.Q.; Cheng, H.M. On the true photoreactivity order of {001}, {010}, and {101} facets of anatase TiO2 Crystals. Angew. Chem. Int. Ed. 2011, 50, 2133–2137. [Google Scholar] [CrossRef]
  12. Zheng, Z.L.; Huang, B.B.; Lu, J.B.; Qin, X.Y.; Zhang, X.Y.; Ying Dai, Y. Hierarchical TiO2 microspheres: Synergetic effect of {001} and {101} facets for enhanced photocatalytic activity. Chem. Eur. J. 2011, 17, 15032–15038. [Google Scholar] [CrossRef]
  13. Pan, L.; Zou, J.J.; Wang, S.B.; Liu, X.U.; Zhang, X.W.; Wang, L. Morphology evolution of TiO2 Facets and vital influences on photocatalyic activity. ACS Appl. Mater. Interfaces 2012, 4, 1450–1655. [Google Scholar] [CrossRef]
  14. Liu, M.; Li, H.M.; Zeng, Y.S.; Huang, T.C. Anatase TiO2 single crystals with dominant {001} facets: Facile fabrication from Ti powders and enhanced photocatalytical activity. Appl. Surf. Sci. 2013, 274, 117–123. [Google Scholar] [CrossRef]
  15. Pan, F.; Wu, K.; Li, H.X.; Xu, G.Q.; Chen, W. Synthesis of {100} facets dominant anatase TiO2 nanobelts and the origin of facet-dependent photoreactivity. Chem. Eur. J. 2014, 20, 15095–15101. [Google Scholar] [CrossRef]
  16. Liu, X.G.; Du, G.R.; Li, M. True photoreactivity origin of Ti3+-doped anatase TiO2 crystals with respectively dominated exposed {001}, {101}, and {100} facets. ACS Omega 2019, 4, 14902–14912. [Google Scholar] [CrossRef] [Green Version]
  17. Žerjav, G.; Pintar, A.; Ferentz, M.; Landau, M.; Haimovich, A.; Goldbourt, A.; Herskowitz, M. Effect of surface chemistry and crystallographic parameters of TiO2 anatase nanocrystals on photocatalytic degradation of Bisphenol A. Catalysts 2019, 9, 447. [Google Scholar] [CrossRef] [Green Version]
  18. Zarattini, M.; Dun, C.C.; Isherwood, L.H.; Felten, A.; Filippi, J.; Gordon, M.P.; Zhang, L.F.; Kassem, O.; Song, X.J.; Zhang, W.J.; et al. Synthesis of 2D anatase TiO2 with highly reactive facets by fluorine-free topochemical conversion of 1T-TiS2 nanosheets. J. Mater. Chem. A 2022, 10, 13884–13894. [Google Scholar] [CrossRef]
  19. Du, Y.E.; Feng, Q.; Chen, C.D.; Tanaka, Y.; Yang, X.J. Photocatalytic and Dye-sensitized solar cell perforemances of {010}-faceted and [111]-faceted anatase TiO2 nanocrystals synthesized from tetratitanate nanoribbons. ACS Appl. Mater. Interfaces 2014, 6, 16007–160019. [Google Scholar] [CrossRef]
  20. Du, Y.E.; Du, D.J.; Feng, Q.; Yang, X.J. Delithiation, exfoliation, and transformation of rock-salt-structured Li2TiO3 to highly exposed {010}-faceted anatase. ACS Appl. Mater. Interfaces 2015, 7, 7995–8004. [Google Scholar] [CrossRef]
  21. Zhang, H.Z.; Banfield, F. Understanding polymorphic phase transformation behavior during growth of nanocrystalline aggregates: Insights from TiO2. J. Phys. Chem. B 2000, 104, 3481–3487. [Google Scholar] [CrossRef]
  22. Peng, Y.P.; Lo, S.L.; Ou, H.H.; Lai, S.W. Microwave-assisted hydrothermal synthesis of N-doped titanate nanotubes for visible-light-responsive photocatalysis. J. Hazard. Mater. 2010, 183, 754–758. [Google Scholar] [CrossRef] [PubMed]
  23. Shang, Q.Q.; Huang, X.; Tan, X.; Tao Yu, T. High Activity Ti3+-Modified Brookite TiO2/Graphene Nanocomposites with Specific Facets Exposed for Water Splitting. Ind. Eng. Chem. Res. 2017, 56, 9098−9106. [Google Scholar] [CrossRef]
  24. Lin, H.F.; Li, L.P.; Zhao, M.L.; Huang, X.S.; Chen, X.M.; Li, G.S.; Yu, R.C. Synthesis of High-Quality Brookite TiO2 Single-Crystalline Nanosheets with Specific Facets Exposed: Tuning Catalysts from Inert to Highly Reactive. J. Am. Chem. Soc. 2012, 134, 8328–8331. [Google Scholar] [CrossRef] [PubMed]
  25. Du, Y.E.; Niu, X.J.; Hou, K.; He, X.R.; Zhang, C.F. Microflowery, microspherical, and fan-shaped TiO2 crystals via hierarchical self-assembly of nanorods with exposed specific crystal facets and enhanced photocatalytic performance. Catalysts 2022, 12, 232. [Google Scholar] [CrossRef]
  26. Zhang, H.M.; Liu, X.L.; Wang, Y.; Liu, P.R.; Cai, W.P.; Zhu, G.S.; Yang, H.G.; Zhao, H.J. Rutile TiO2 films with 100% exposed pyramid-shaped (111) surface: Photoelectron transport properties under UV and visible light irradiation. J. Mater. Chem. A 2013, 1, 2646–2652. [Google Scholar] [CrossRef] [Green Version]
  27. Liu, X.B.; Zhuang, H.Q.; Huang, J.L.; Xu, W.T.; Lin, L.Q.; Zheng, Y.M.; Li, Q.B. Engineering TiO2 nanosheets with exposed (001) facets via the incorporation of Au clusters for boosted photocatalytic hydrogen production. Mater. Adv. 2020, 1, 1608–1612. [Google Scholar] [CrossRef]
  28. Li, T.; Shen, Z.L.; Shu, Y.L.; Li, X.G.; Jiang, C.J.; Chen, W. Facet-dependent evolution of surface defects in anatase TiO2 by thermal treatment: Implications for environmental applications of photocatalysis. Environ. Sci. Nano 2019, 6, 1740–1753. [Google Scholar] [CrossRef]
  29. Zhang, N.; Jiang, G.Y.; Chen, X.; Mao, J.Y.; Zhou, Y.J.; Li, Y.S. Rational design of a tubular, interlayer expanded MoS2-N/O doped carbon composite for excellent potassium-ion storage. J. Mater. Chem. A 2019, 7, 9305–9315. [Google Scholar] [CrossRef]
  30. Shen, L.M.; Bao, N.Z.; Zheng, Y.Q.; Gupta, A.; An, T.C.; Yanagisawa, K. Hydrothermal splitting of titanate fibers to single-crystalline TiO2 nanostructures with controllable crystalline phase, morphology microstructure, and photocatalytic activity. J. Phys. Chem. C 2008, 112, 8809–8818. [Google Scholar] [CrossRef]
  31. Verma, R.; Gangwar, J.; Srivastava, A.K. Multiphase TiO2 nanostructures: A review of efficient synthesis, growth mechanism, probing capabilities, and applications in bio-safety and health. RSC Adv. 2017, 7, 44199–44224. [Google Scholar] [CrossRef] [Green Version]
  32. Liu, B.; Khare, A.; Aydil, E.S. TiO2-B/anatase core-shell heterojunction nanowires for photocatalysis. ACS Appl. Mater. Inter. 2011, 3, 4444–4450. [Google Scholar] [CrossRef]
  33. Zhang, H.; Liu, P.; Li, F.; Liu, H.; Wang, Y.; Zhang, S.; Guo, M.; Cheng, H.; Zhao, H. Facile fabrication of anatase TiO2 microspheres on solid substrates and surface crystal facet transformation from {001} and {100}. Chem. Eur. J. 2011, 17, 5949−5957. [Google Scholar]
  34. Niu, X.J.; Du, Y.E.; Liu, J.; Li, J.X.; Guo, Y.W. Facile synthesis of TiO2/MoS2 composites with co-exposed high-energy facets for enhanced photocatalytic performance. Micromachines 2022, 13, 1812. [Google Scholar] [CrossRef]
  35. Du, Y.-E.; Niu, X.J.; Li, W.X.; An, J.; Liu, Y.F.; Chen, Y.Q.; Wang, P.F.; Yang, X.D.; Feng, Q. Microwave-Assisted Synthesis of High-Energy Faceted TiO2 Nanocrystals Derived from Exfoliated Porous Metatitanic Acid Nanosheets with Improved Photocatalytic and Photovoltaic Performance. Materials 2019, 12, 3614. [Google Scholar] [CrossRef]
Figure 1. XRD patterns of (a) pH0.5−TiO2, (b) pH1.5−TiO2, (c) pH3.5−TiO2, (d) pH5.5−TiO2, (e) pH7.5−TiO2, (f) pH9.5−TiO2, (g) pH11.5−TiO2 and (h) pH12.5−TiO2 samples hydrothermally synthesized at 180 °C for 24 h under different pH conditions and (a′) pH0.5−T500−TiO2, (b′) pH1.5−T500−TiO2, (c′) pH3.5−T500−TiO2, (d′) pH5.5−T500−TiO2, (e′) pH7.5−T500−TiO2, (f′) pH9.5−T500-TiO2, (g′) pH11.5−T500−TiO2 and () pH12.5−T500−TiO2 products obtained by calcining the hydrothermally synthesized pHx-TiO2 samples at 500 °C for 3 h.
Catalysts 12 01534 g001
Figure 2. FESEM images of (a,b) pH0.5−T500−TiO2, (c) pH1.5−T500−TiO2, (d) pH3.5−T500−TiO2, (e) pH5.5−T500−TiO2, (f) pH7.5−T500−TiO2, (g) pH9.5−T500−TiO2, (h,i) pH115−T500−TiO2 samples.
Catalysts 12 01534 g002
Figure 3. TEM and HRTEM images of the prepared (ac) pH0.5−T500−TiO2, (df) pH1.5−T500−TiO2, (gi) pH3.5−T500−TiO2 and (jl) pH5.5−T500−TiO2 samples under different pH value conditions. The insets in (a,i,k) are fast Fourier transform (FFT) diffraction patterns.
Catalysts 12 01534 g003
Figure 4. TEM and HRTEM images of the prepared (ac) pH7.5−T500−TiO2, (df) pH9.5−T500−TiO2 and (gi) pH11.5−T500−TiO2 samples under different pH value conditions.
Catalysts 12 01534 g004
Figure 5. XPS survey scan of the (a) pHx-T500-TiO2 and CM-TiO2 samples, high-resolution XPS spectra of (b) Ti 2p, (c) O 1s and (d) C 1s in pHx-T500-TiO2 and CM-TiO2 samples.
Catalysts 12 01534 g005
Figure 6. UV-Vis diffuse reflectance spectra of the pHx-T500-TiO2 and CM-TiO2 samples.
Catalysts 12 01534 g006
Figure 7. EIS Nyquist plots the (a) pHx−T500-TiO2 and (b) CM-TiO2 samples.
Catalysts 12 01534 g007
Figure 8. (a) Spectral changes of the centrifuged methyl orange solution with pH3.5−T500−TiO2 sample as the photocatalyst and (b) Variation of degradation percentage of methyl orange with irradiation time under ultraviolet light irradiation for pHx-T500-TiO2, P25-TiO2, CM-TiO2 and Blank samples.
Catalysts 12 01534 g008
Figure 9. Stability and recyclability performance of pH3.5−T500−TiO2, pH5.5−T500−TiO2, pH7.5−T500−TiO2, pH9.5−T500−TiO2 and pH25−TiO2 samples for photocatalytic degradation of methyl orange solution.
Catalysts 12 01534 g009
Table 1. Properties and activity parameters of the prepared and commercial TiO2 samples.
SamplesPhaseExposed FacetsDXRD a
(nm)
DFESEM b
(nm)
Specific Surface Area (m2/g)Degradation
Percentage (%)
pH0.5-TiO2brookite/rutile{001}/{120}22.330.451.469.10
pH1.5-TiO2rutile{110}25.049.431.76.33
pH3.5-TiO2anatase{101}18.217.489.695.75
pH5.5-TiO2anatase{101}/{010}16.518.982.889.47
pH7.5-TiO2anatase{101}/{010}15.819.679.573.53
pH9.5-TiO2anatase{101}/{010}16.621.473.279.41
pH11.5-TiO2brookite{001}/{120}34.8199.27.98.99
P25-TiO2anatase/rutile{111}-facets20.026.252.581.16
CM-TiO2anatase/rutilewithout54.460.77.2761.09
Blank-----3.44
a Average crystalline size calculated by using the Scherrer equation without consideration the crystal shape. b Size of the longest growth direction in FE-SEM images measured using software.
Publisher’s Note: MDPI stays neutral with regard to jurisdictional claims in published maps and institutional affiliations.

