Article

Na Promotion of Pt/m-ZrO2 Catalysts for the Steam Reforming of Formaldehyde

1
Center for Applied Energy Research, University of Kentucky, 2540 Research Park Drive, Lexington, KY 40511, USA
2
Department of Biomedical Engineering and Chemical Engineering, University of Texas at San Antonio, One UTSA Circle, San Antonio, TX 78249, USA
3
Argonne National Laboratory, Lemont, IL 60439, USA
4
Department of Mechanical Engineering, University of Texas at San Antonio, One UTSA Circle, San Antonio, TX 78249, USA
*
Author to whom correspondence should be addressed.
Catalysts 2022, 12(11), 1294; https://doi.org/10.3390/catal12111294
Submission received: 31 August 2022 / Revised: 18 October 2022 / Accepted: 20 October 2022 / Published: 22 October 2022
(This article belongs to the Special Issue Catalytic Reforming for Syngas and H2 Productions)

Abstract

:
The decomposition selectivity of formaldehyde during steam reforming was explored using unpromoted and sodium promoted Pt/m-ZrO2 catalysts, and the Na content was varied (0.5%Na, 1%Na, 1.8%Na, 2.5%Na, and 5%Na). In situ DRIFTS experiments during temperature programmed reaction in flowing H2O revealed that formaldehyde is adsorbed at reduced defect sites on zirconia, where it is converted to formate species through the addition of labile bridging OH species. Formate species achieve a maximum intensity in the range of 125–175 °C, where only slight changes in intensity are observed. Above this temperature, the formate decomposition reactivity strongly depends on the Na loading, with the optimum loadings being 1.8%Na and 2.5%Na. CO2 temperature programmed desorption results, as well as a greater splitting observed between the formate νasym(OCO) and νsym(OCO) bands in infrared spectroscopy, indicate greater basicity is induced by the presence of Na. This strengthens the interaction between the formate -CO2 functional group and the catalyst surface, weakening the formate C-H bond. A shift in the ν(CH) band of formate to lower wavenumbers was observed by addition of Na, especially at 1.8%Na and higher loadings. This results in enhanced decarboxylation and dehydrogenation of formate, as observed in in situ DRIFTS, temperature-programmed reaction/mass spectrometry experiments of the steam reforming of formaldehyde, and fixed bed reaction tests. For example, 2.5%Na addition of 2.5% increased the CO2 selectivity from 83.5% to 99.5% and the catalysts achieved higher stable conversion at lower temperature than NiO catalysts reported in the open literature. At 5%Na loading, Pt sites were severely blocked, hindering H-transfer.

1. Introduction

Hydrogen has high gravimetric energy density (120 MJ/kg) but low volumetric energy density (5.6 MJ/L at 700 bar compared to 32.0 MJ/L for gasoline). As such, researchers have been investigating sustainable liquid chemical carriers of hydrogen, such as bio-renewable ethanol (21 MJ/L) [1,2,3,4,5,6], methanol (15.6 MJ/L) [4,7,8,9], glycerol [3,4,10,11] and formic acid [12]. In contrast, there are only a few studies on the use of formaldehyde for the production of hydrogen [13,14,15,16,17,18,19,20,21] Although pure formaldehyde is a colorless gas that polymerizes into paraformaldehyde, it can be stored as an aqueous solution as formalin, and it is typically stabilized by methanol. Thus, it is important to examine the reactivity of formaldehyde in its own right as a potential chemical carrier of hydrogen.
A few studies [12,13,17,18] investigated formaldehyde steam reforming (FSR) on nickel catalyst because of its good C–O, C–C and C–H bond cracking capability. Unsupported NiO, MoO3 and NiO/MoO3 were studied by Jin et al. [17]. The authors found that the catalytic synergy between NiO and MoO3 improved the hydrogen selectivity compared to NiO and MoO3 systems. Furthermore, they found that formaldehyde conversions higher than 90% were obtained at 400 °C for NiO/MoO3.
Other studies also investigated FSR activity on NiO supported catalysts. Complete conversion of formaldehyde and high hydrogen selectivity (>90%) could be reached at 400 °C with very low NiO loading when NaF and NaCl are used as support. The optimal nickel loading was 3% and 4% for NaCl and NaF support, respectively. Chu et al. [14] observed that some interactions between NiO and NaCl improved the catalytic performance enabling the reactant to be rapidly activated compared to more traditional supports such as Al2O3. For example, H2 selectivity was only 61% on 3%NiO, where it was 100% for 3%NiO/NaCl. Finally, a correlation was identified between the nickel loading and the CO/CO2 selectivity trend. By increasing the NiO content, the CO2 selectivity was found to increase progressively in the higher temperature range studied (400–450 °C). Other supports were also investigated, including V2O5(WO3)/TiO2. However, higher temperatures were found to be required (T > 450 °C) for complete formaldehyde conversion and hydrogen selectivities higher than 90%. DRIFTS studies on un-supported and supported NiO systems showed that adsorbed formaldehyde is first transformed to formate species, followed by production of H2 and either CO2 or CO, depending on the catalyst formulation and temperature.
Another important reason to study formaldehyde steam reforming is because this compound is a likely intermediate in methanol steam reforming (MSR) [21], occurring during the oxidative dehydrogenation of methoxy species to formate intermediate [9], which is further decomposed in the presence of steam to CO2 and H2. Indeed, parallel investigation of FSR and MSR allow further insight into the MSR mechanism and the rate determining step [15,16].
The intermediacy of formate over Pt/zirconia, a partially oxide supported metal catalyst, has been proposed for a number of reactions, including water-gas shift (WGS) [22,23,24,25], methanol steam reforming, [12,26], and formic acid steam reforming [12]. For each reaction, Na addition plays an important role in the catalysis. For water-gas shift, a collaboration between Honda and University of Kentucky CAER showed that Na addition weakens the formate C–H bond [27,28]. A more recent study of the Na loading effect showed that the n(CH) band is shifted to significantly lower wavenumbers at loadings of 1.8–2.5%Na [29]. Shido and Iwasawa [30] previously implicated the breaking of the C–H bond of formate as the rate limiting step over the related Rh/ceria catalyst system. Therefore, the weakening of the C–H bond by Na was suggested to be responsible for the step change improvement observed in the optimum range of Na loading. Na doping at this level also accelerated the formic acid steam reforming rate [12]. Interestingly, both water-gas shift and steam-assisted formic acid decomposition displayed a similar normal kinetic isotope effect (NKIE); moreover, the NKIE diminished slightly with Na addition in both cases. This is consistent not only with formate C–H bond breaking being the rate limiting step, but also that Na addition lowers the energy barrier making C–H bond cleaving more facile.
The Na doping effect on methanol steam reforming and ethanol steam reforming (ESR) performed at low temperature was different. Na did not improve the conversion rate of either methanol [12,26] or ethanol [31,32]; rather, Na addition significantly promoted the decarboxylation of formate (MSR) or acetate (ESR), which promotes the liberation of hydrogen (MSR) or methane (ESR). This result indicates that the rate limiting step of steam reforming of light alcohols is likely not the formate/acetate decomposition step. Nevertheless, Na can still have an important secondary impact on product selectivity rather than activity.
The present work is aimed at (1) determining whether Na doping can improve the dehydrogenation/decarboxlation selectivity of Pt/m-ZrO2 during formaldehyde steam reforming, (2) find the optimal Na loading that promotes the dehydrogenation/decarboxylation pathway, and (3) assess the activity and initial stability of the Na-doped catalyst relative to undoped Pt/mZrO2 for formaldehyde steam reforming. The catalysts were previously characterized by a number of methods (BET surface area, TPR-MS, and TPR-EXAFS/XANES), and these results are briefly summarized in the following section. In situ DRIFTS of formaldehyde steam reforming was conducted to ascertain whether formate species are formed after formaldehyde decomposition, as well as to determine whether Na promoter influences the formate C–H bond, as well as the formate decomposition rate, including the nature of the decomposition pathway and the effect of Na loading. Temperature programmed reaction of an adsorbed formaldehyde/H2O mixture was performed in order to determine whether Na addition as well as Na loading influence the formate dehydrogenation step. As such, the results were compared and contrasted with those from in situ DRIFTS. Finally, possible routes of deactivation during the steam reforming of liquid chemical carriers include deposition of carbon on the catalyst surface, as well as sintering of metal nanoparticles [5,6,11]. To assess activity, selectivity, and initial stability, reaction testing experiments were carried out using a fixed bed reactor.

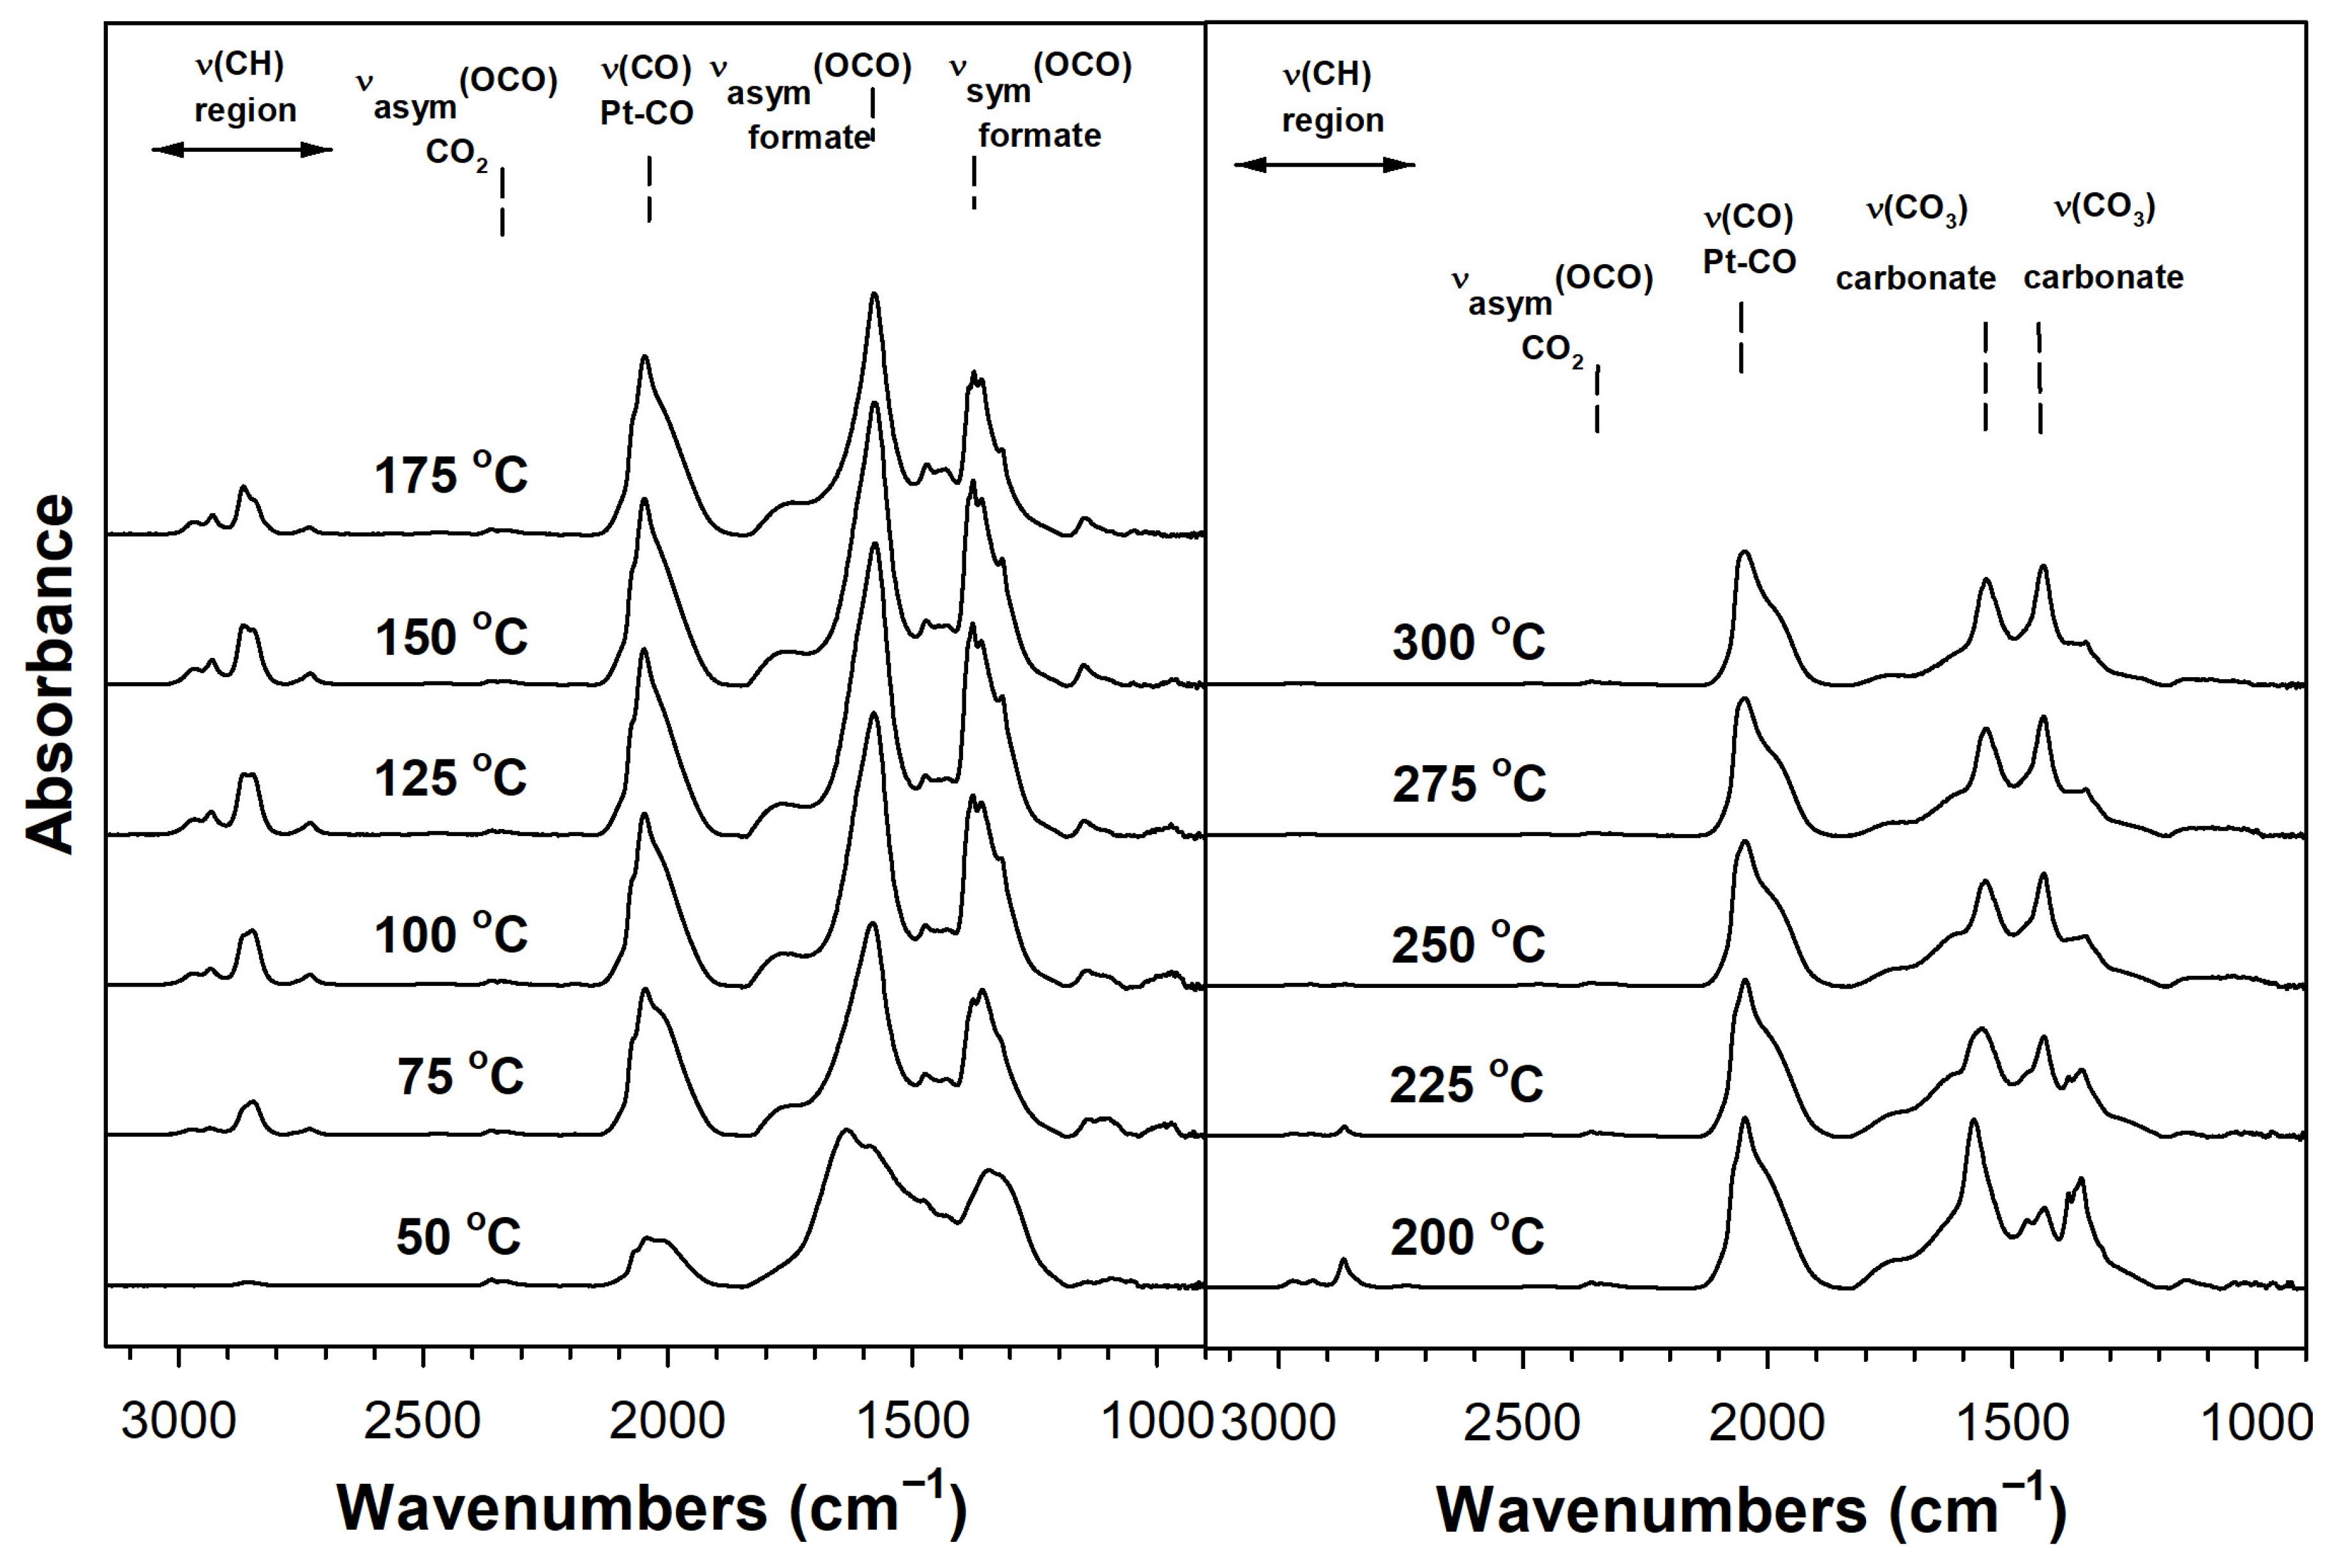
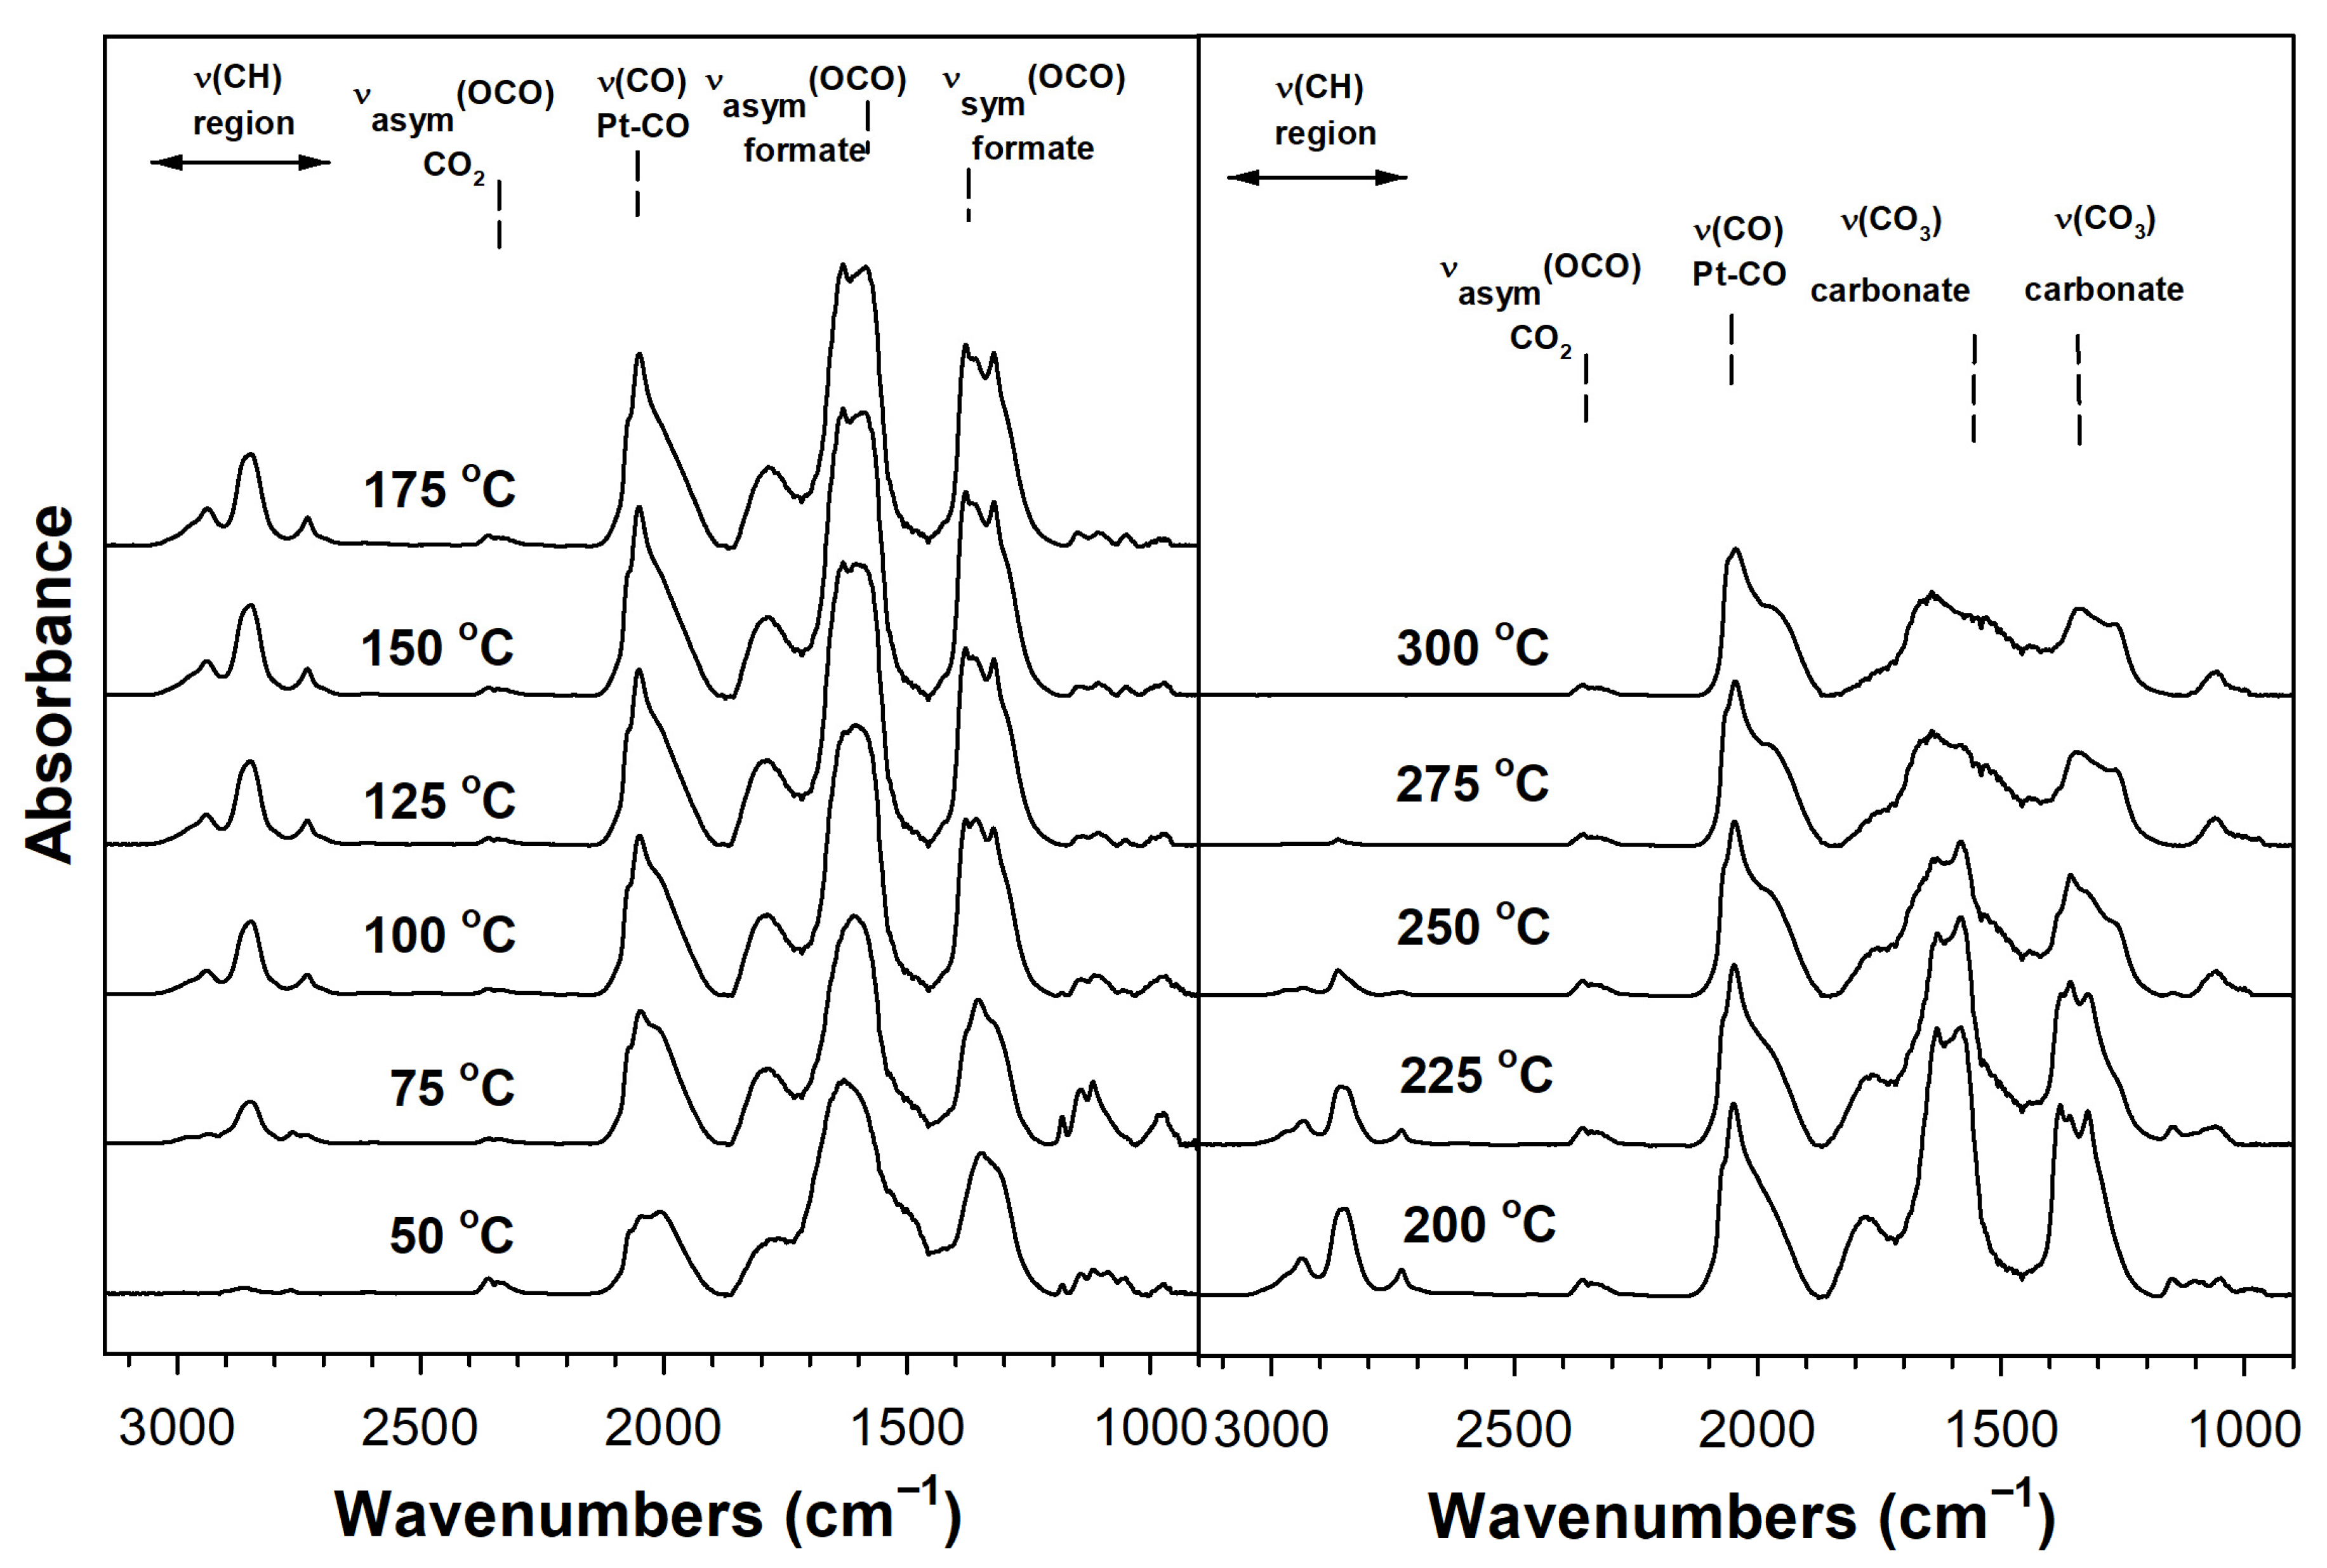
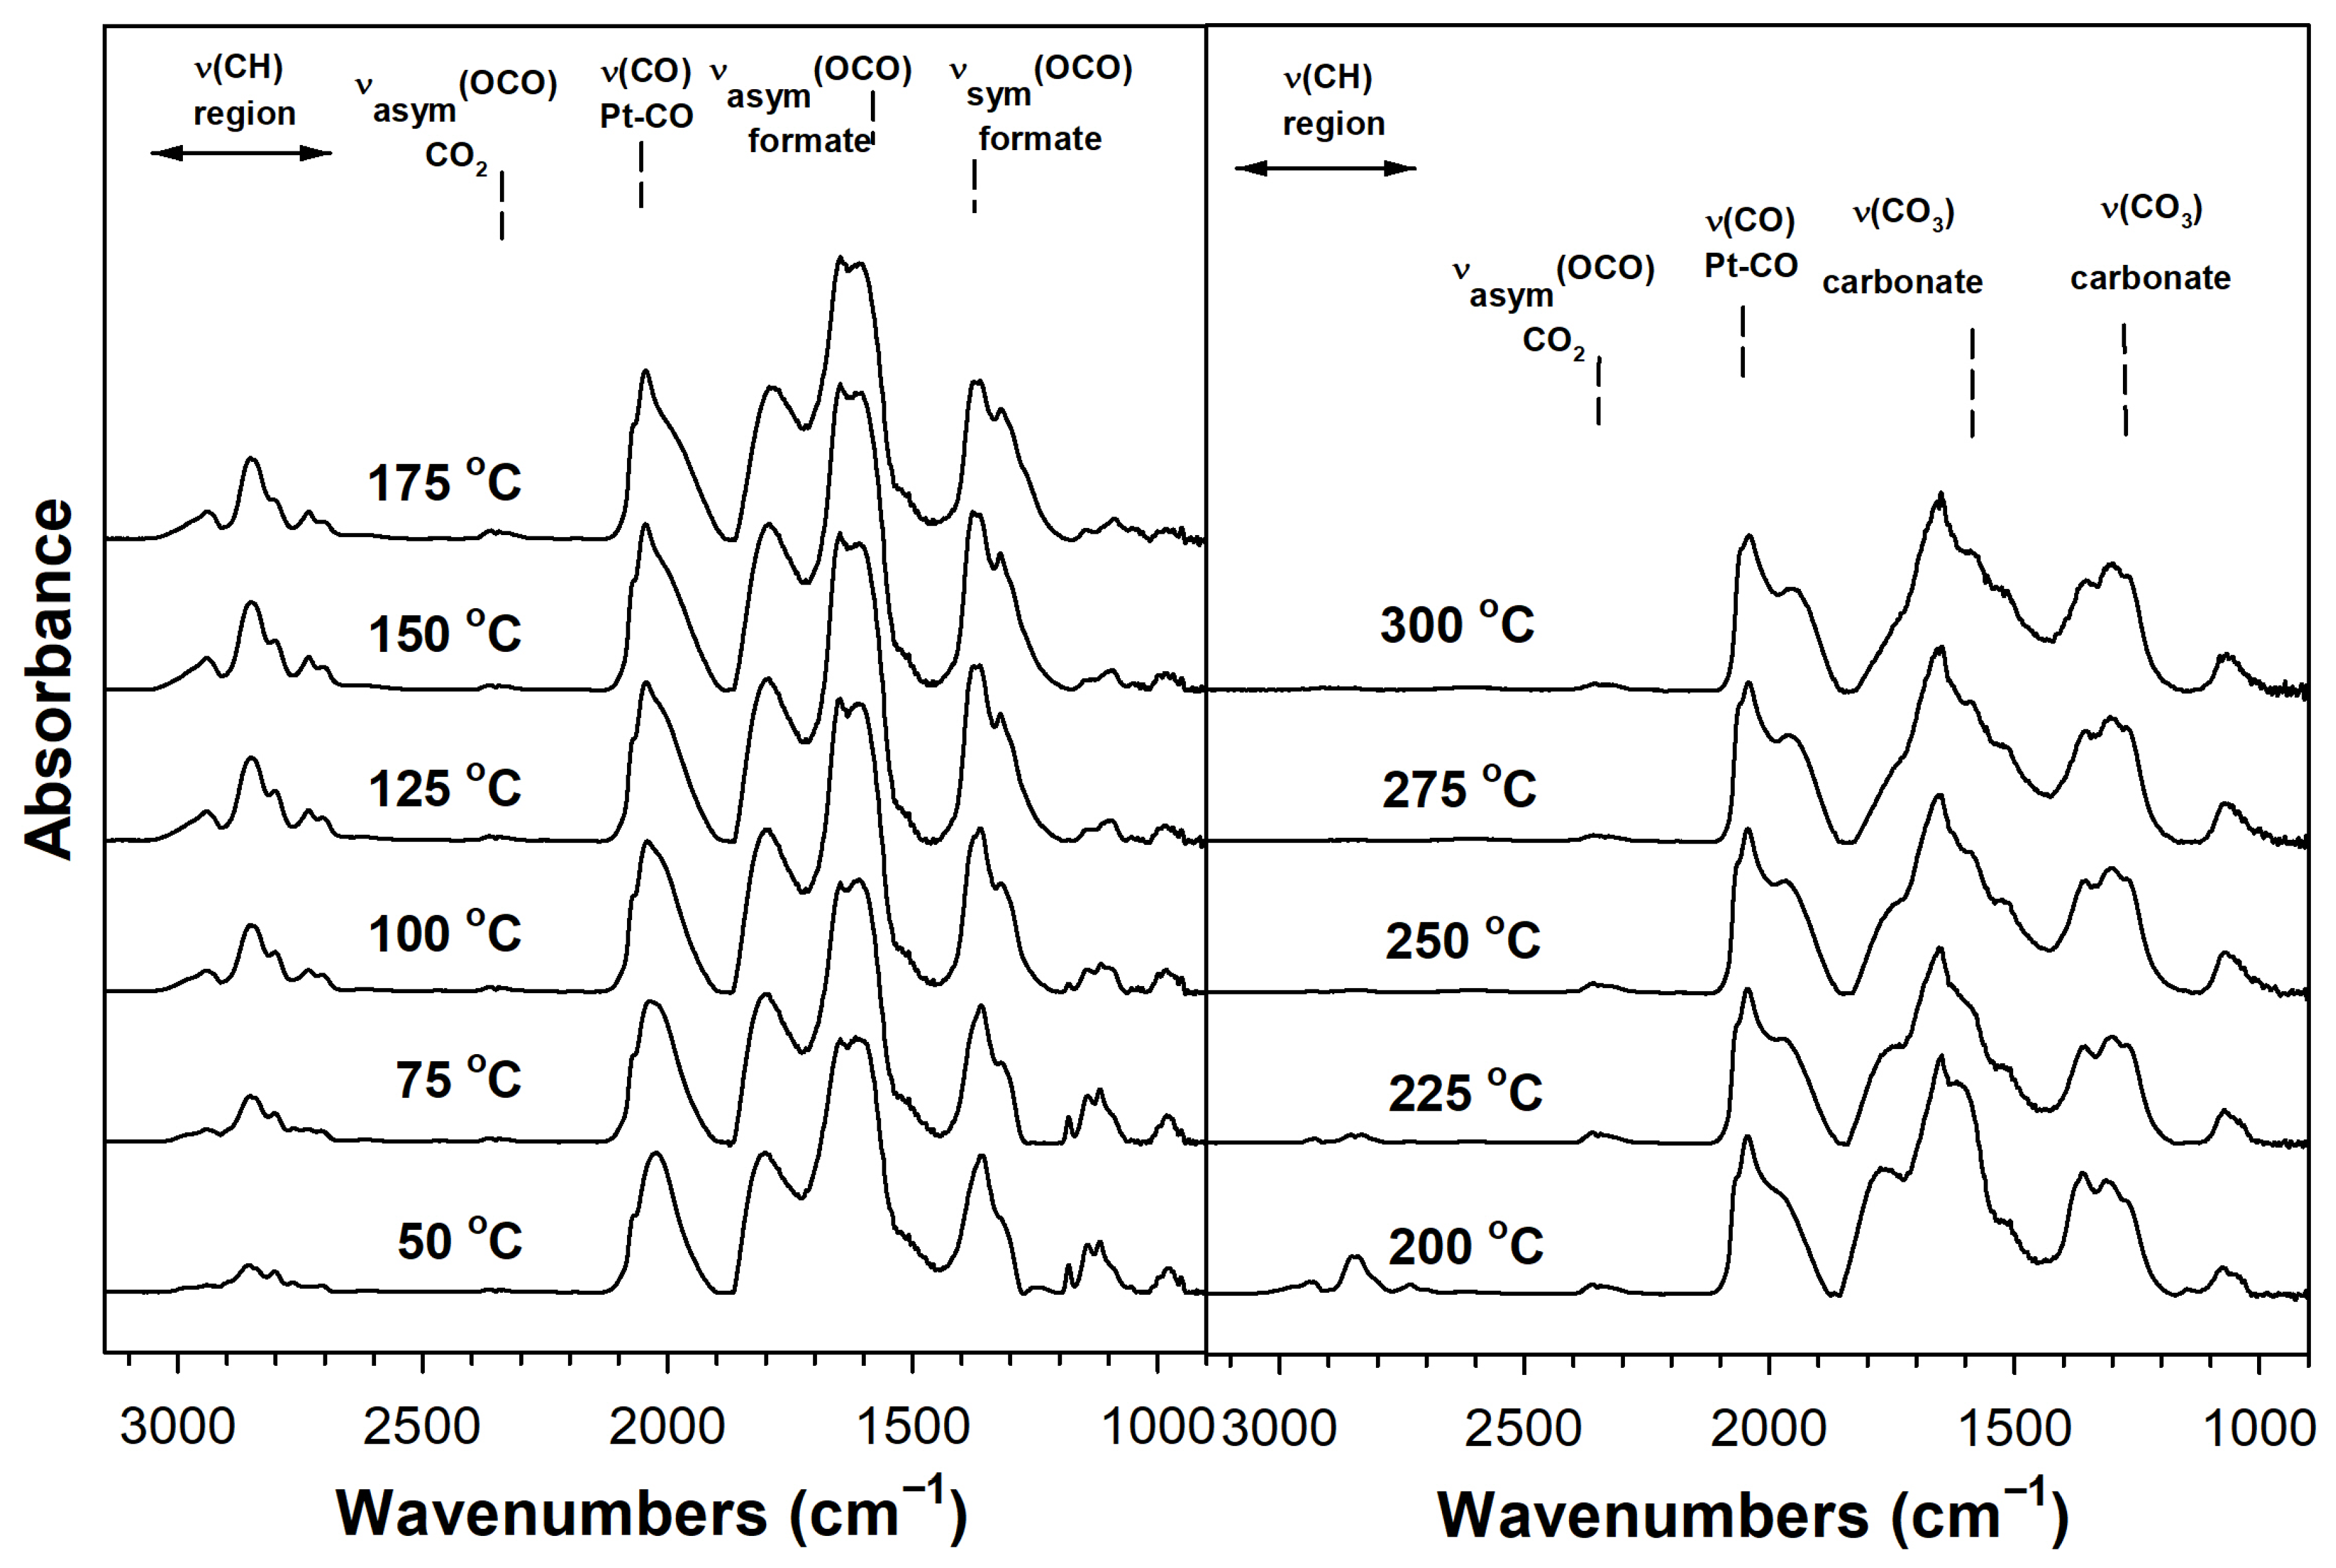
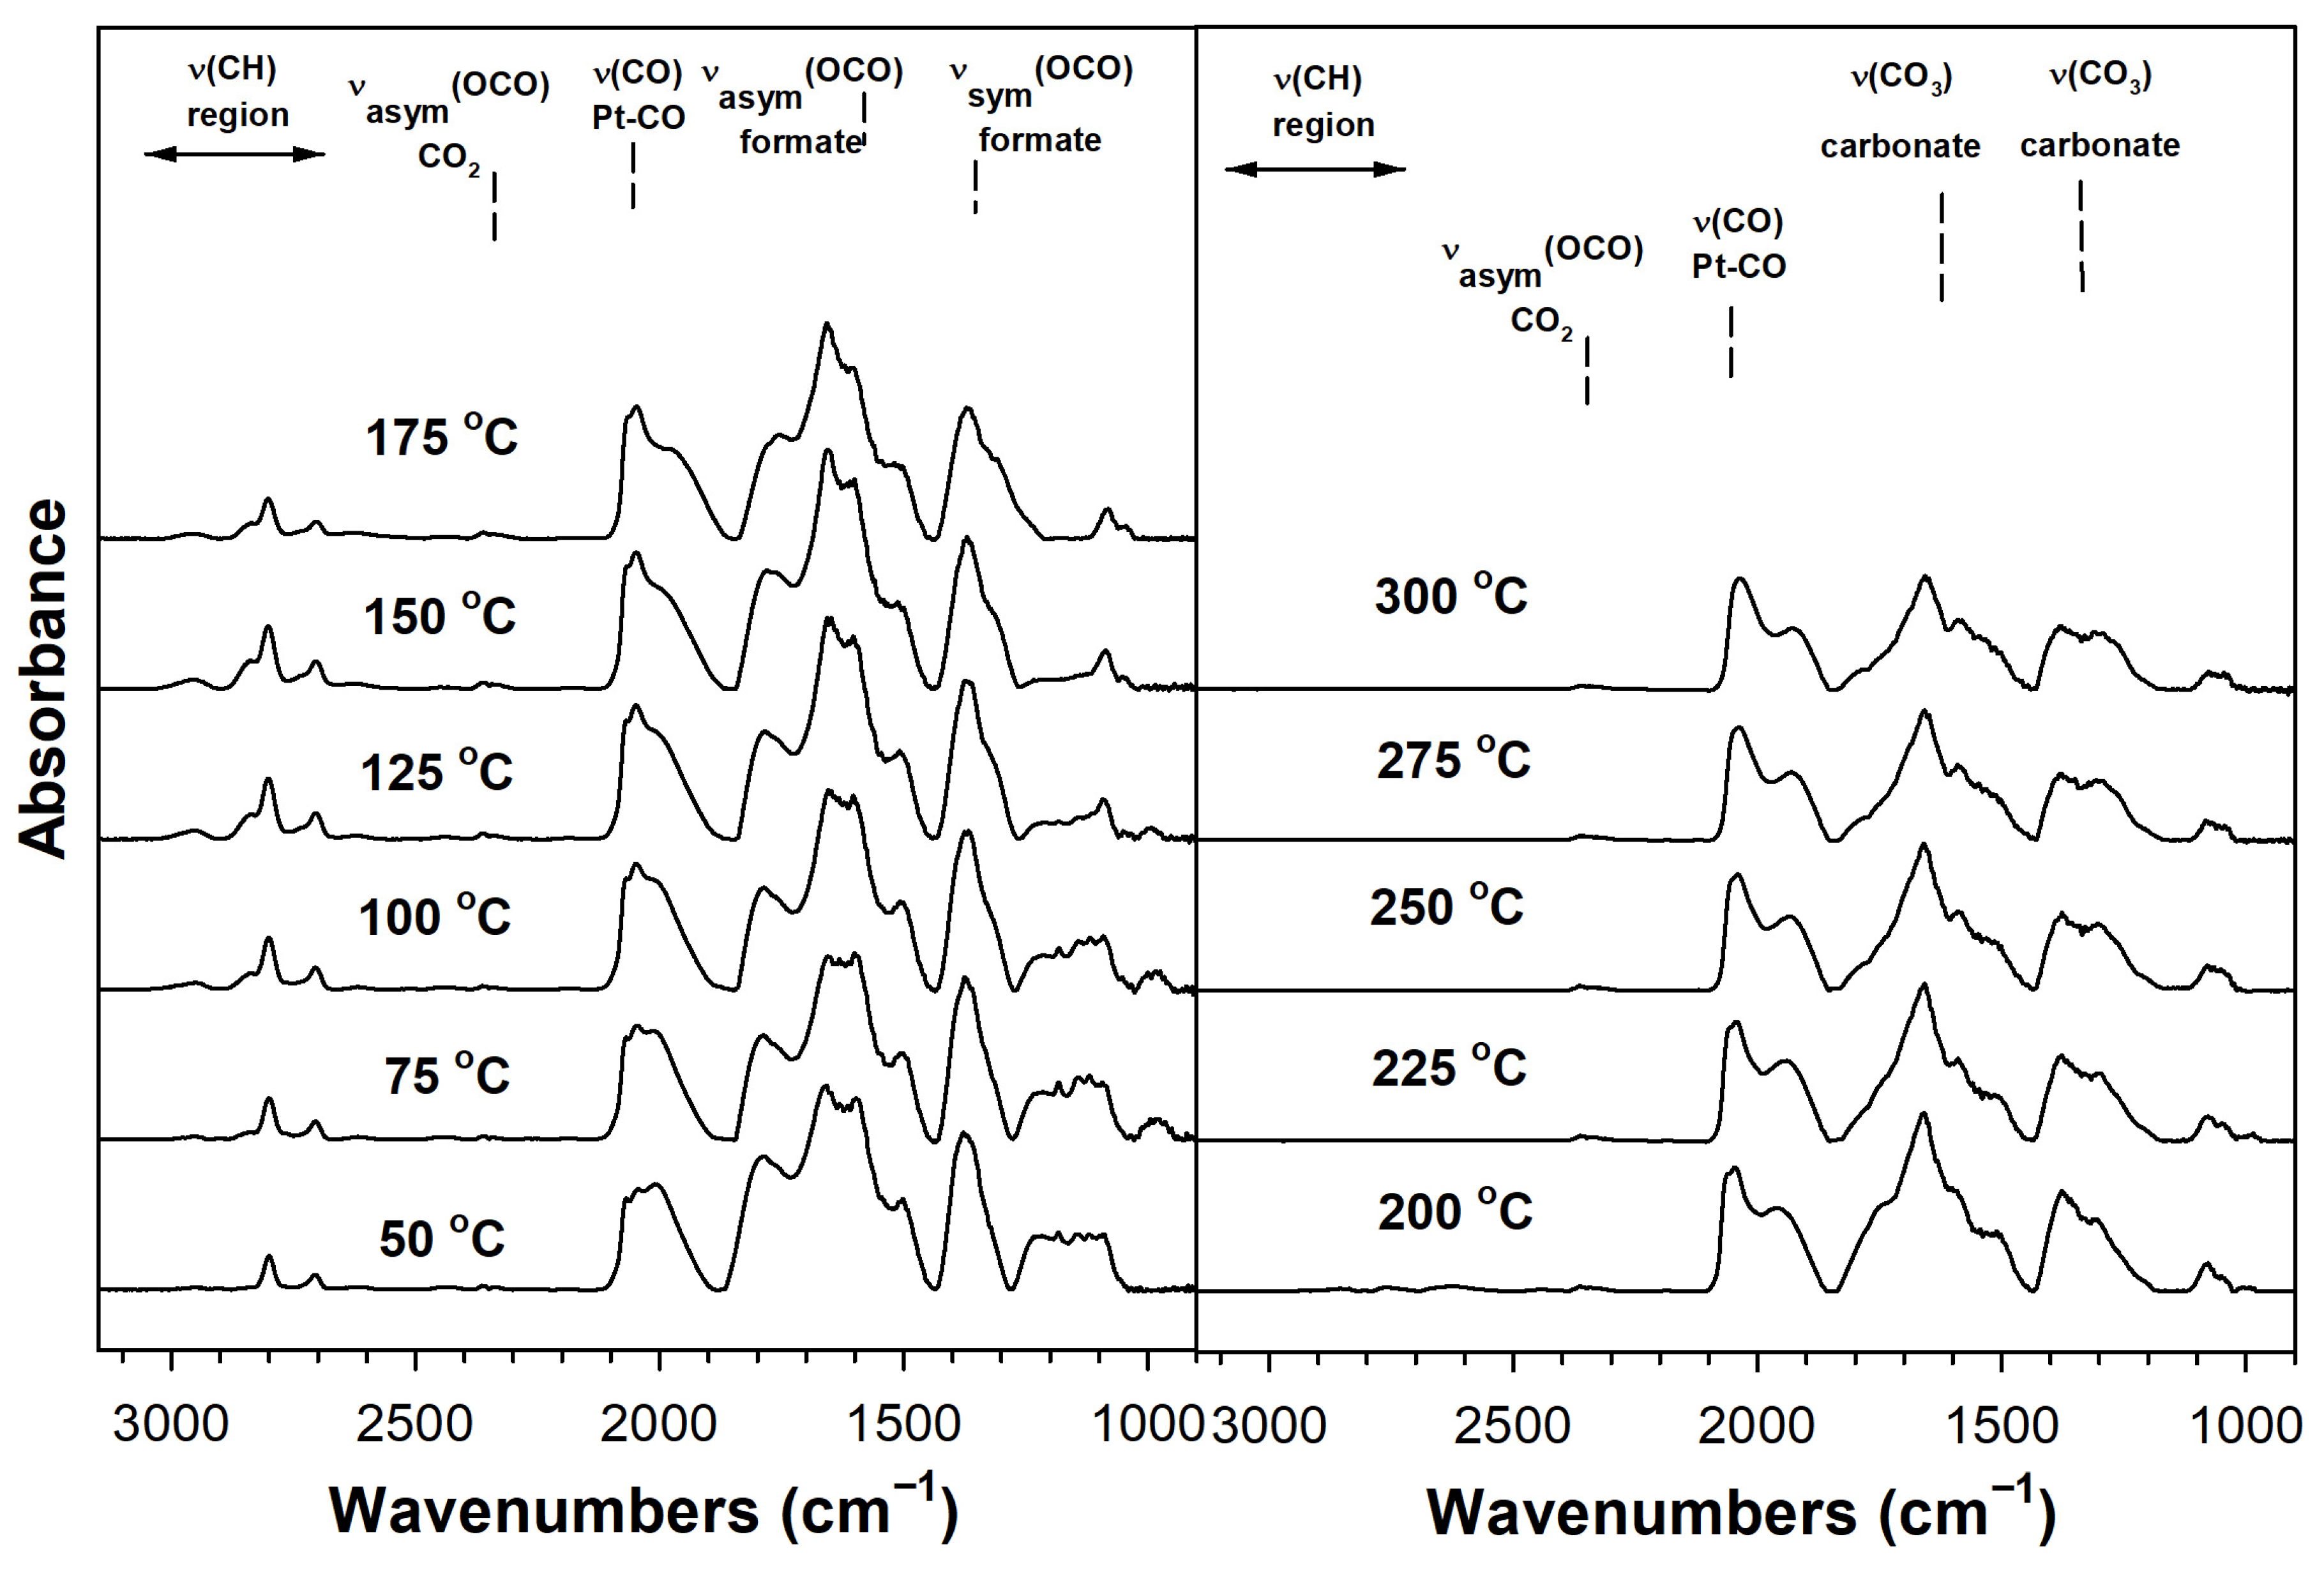
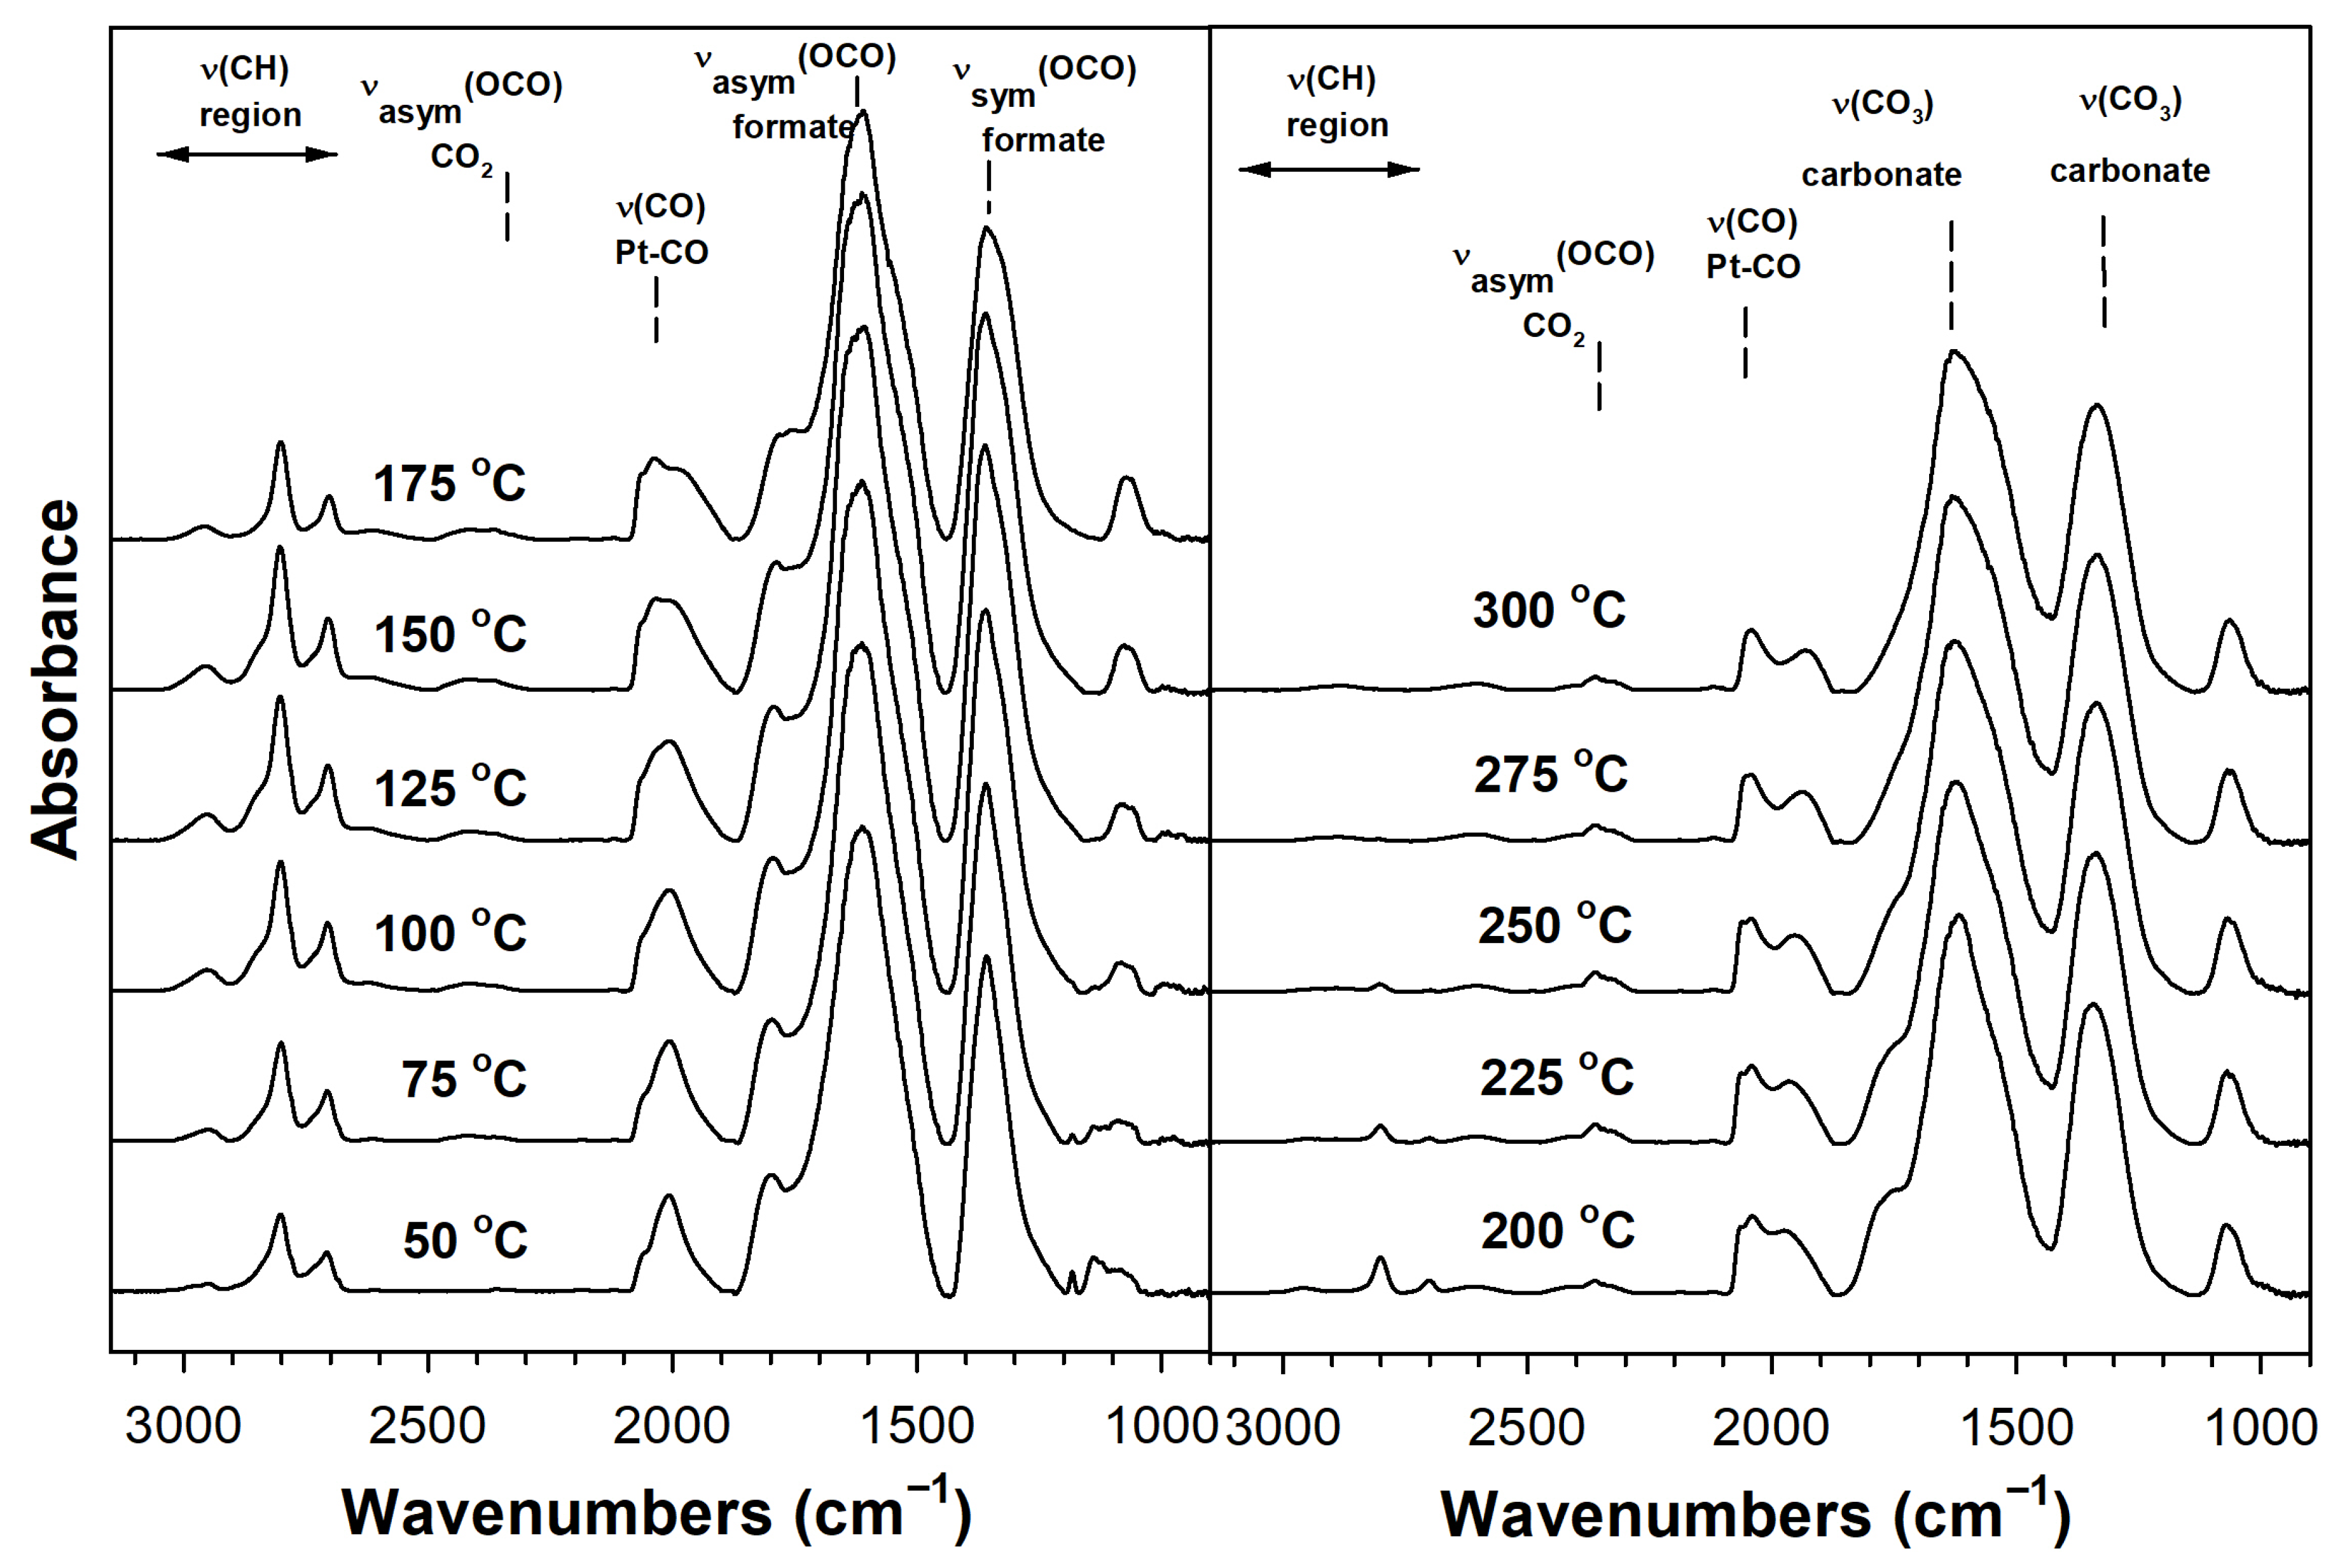
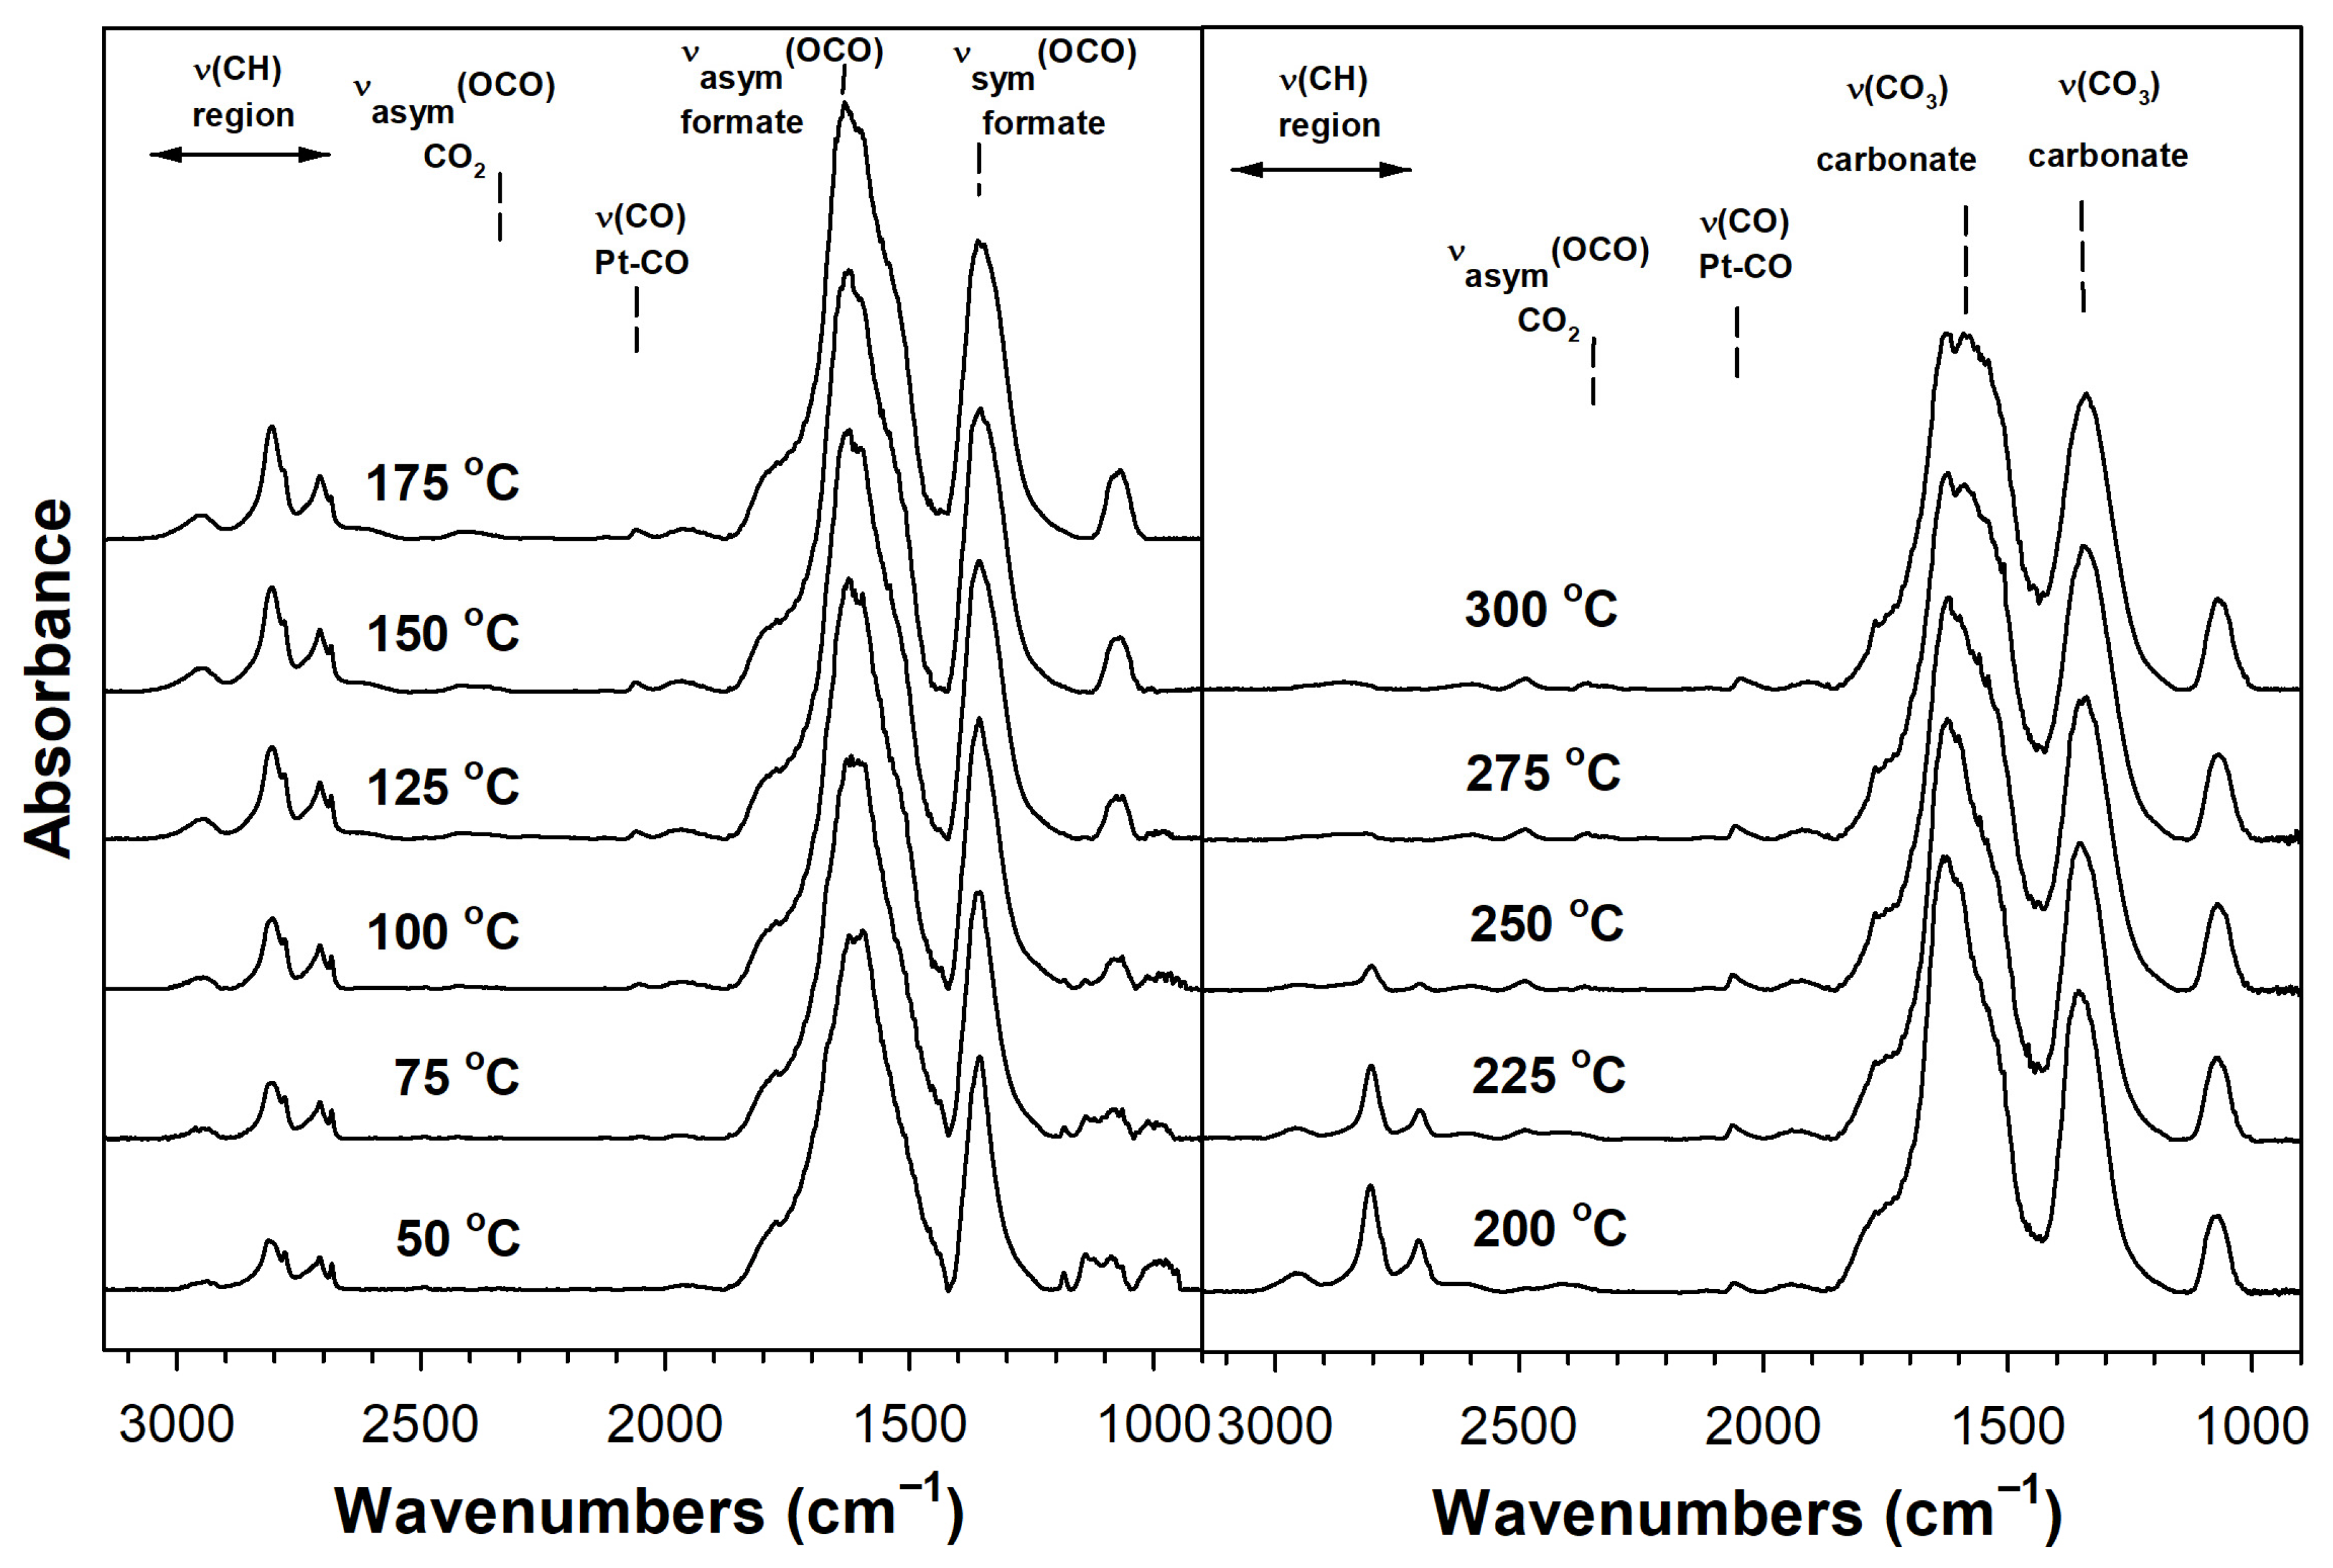
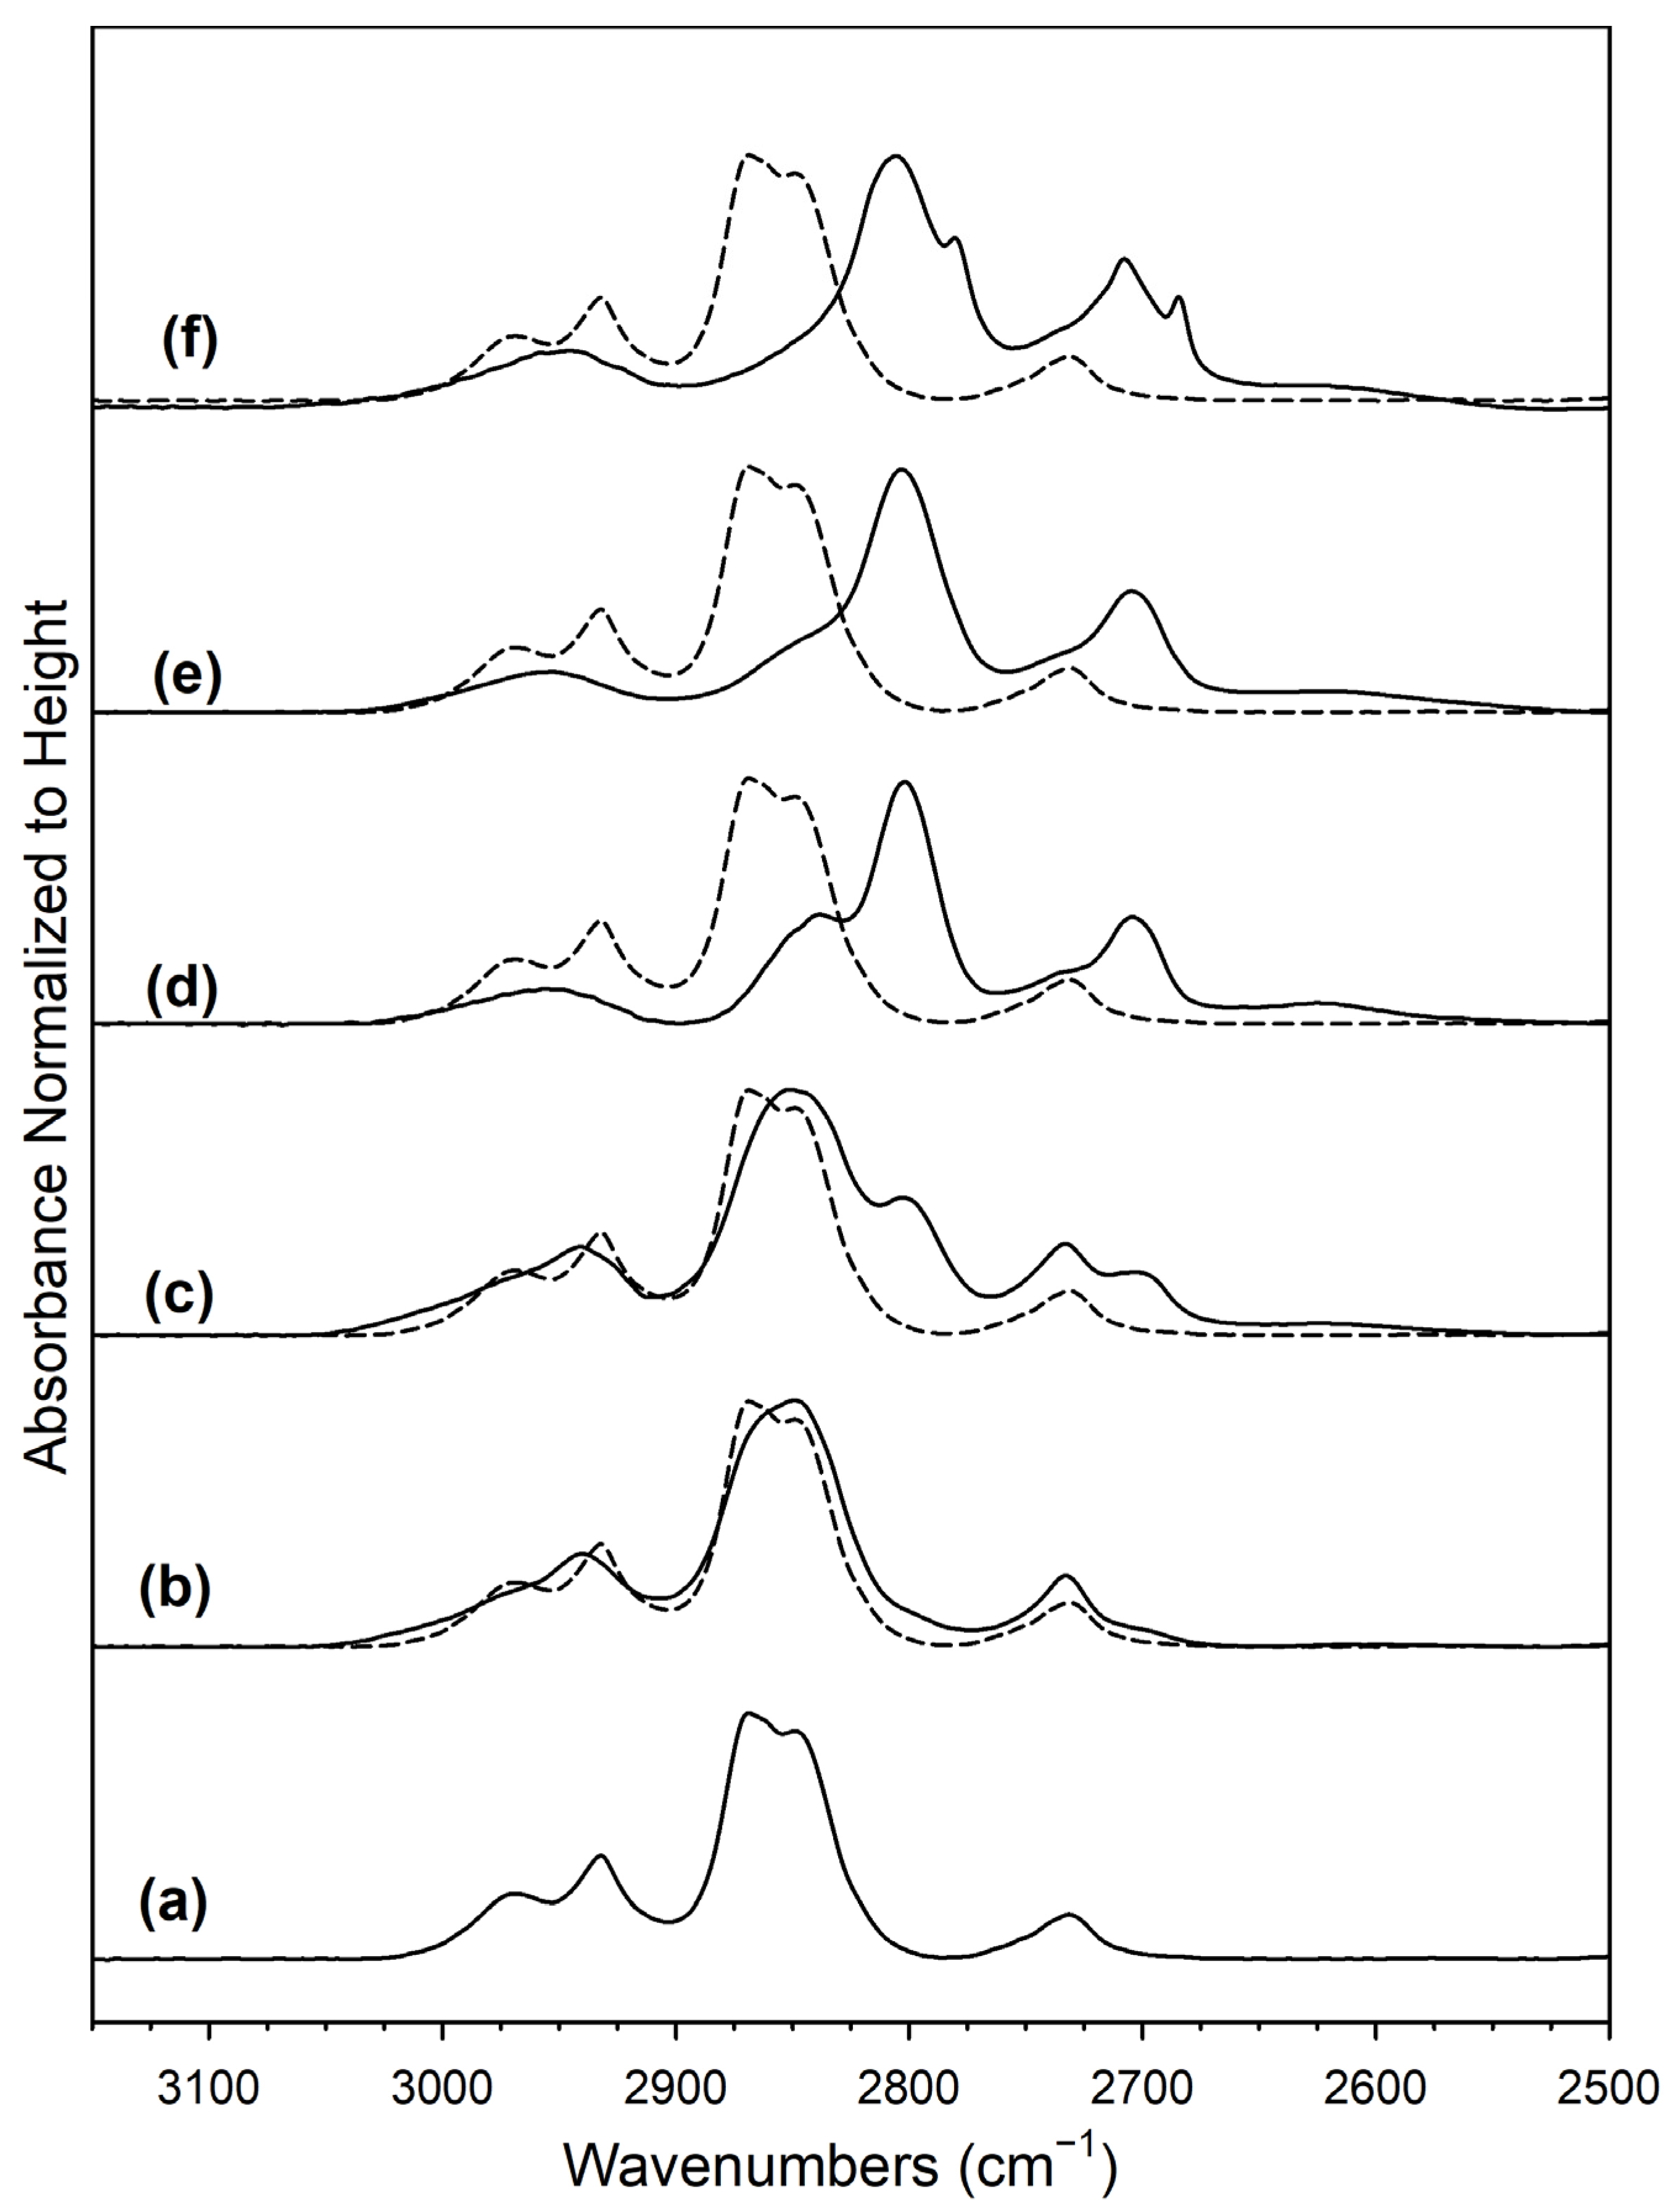
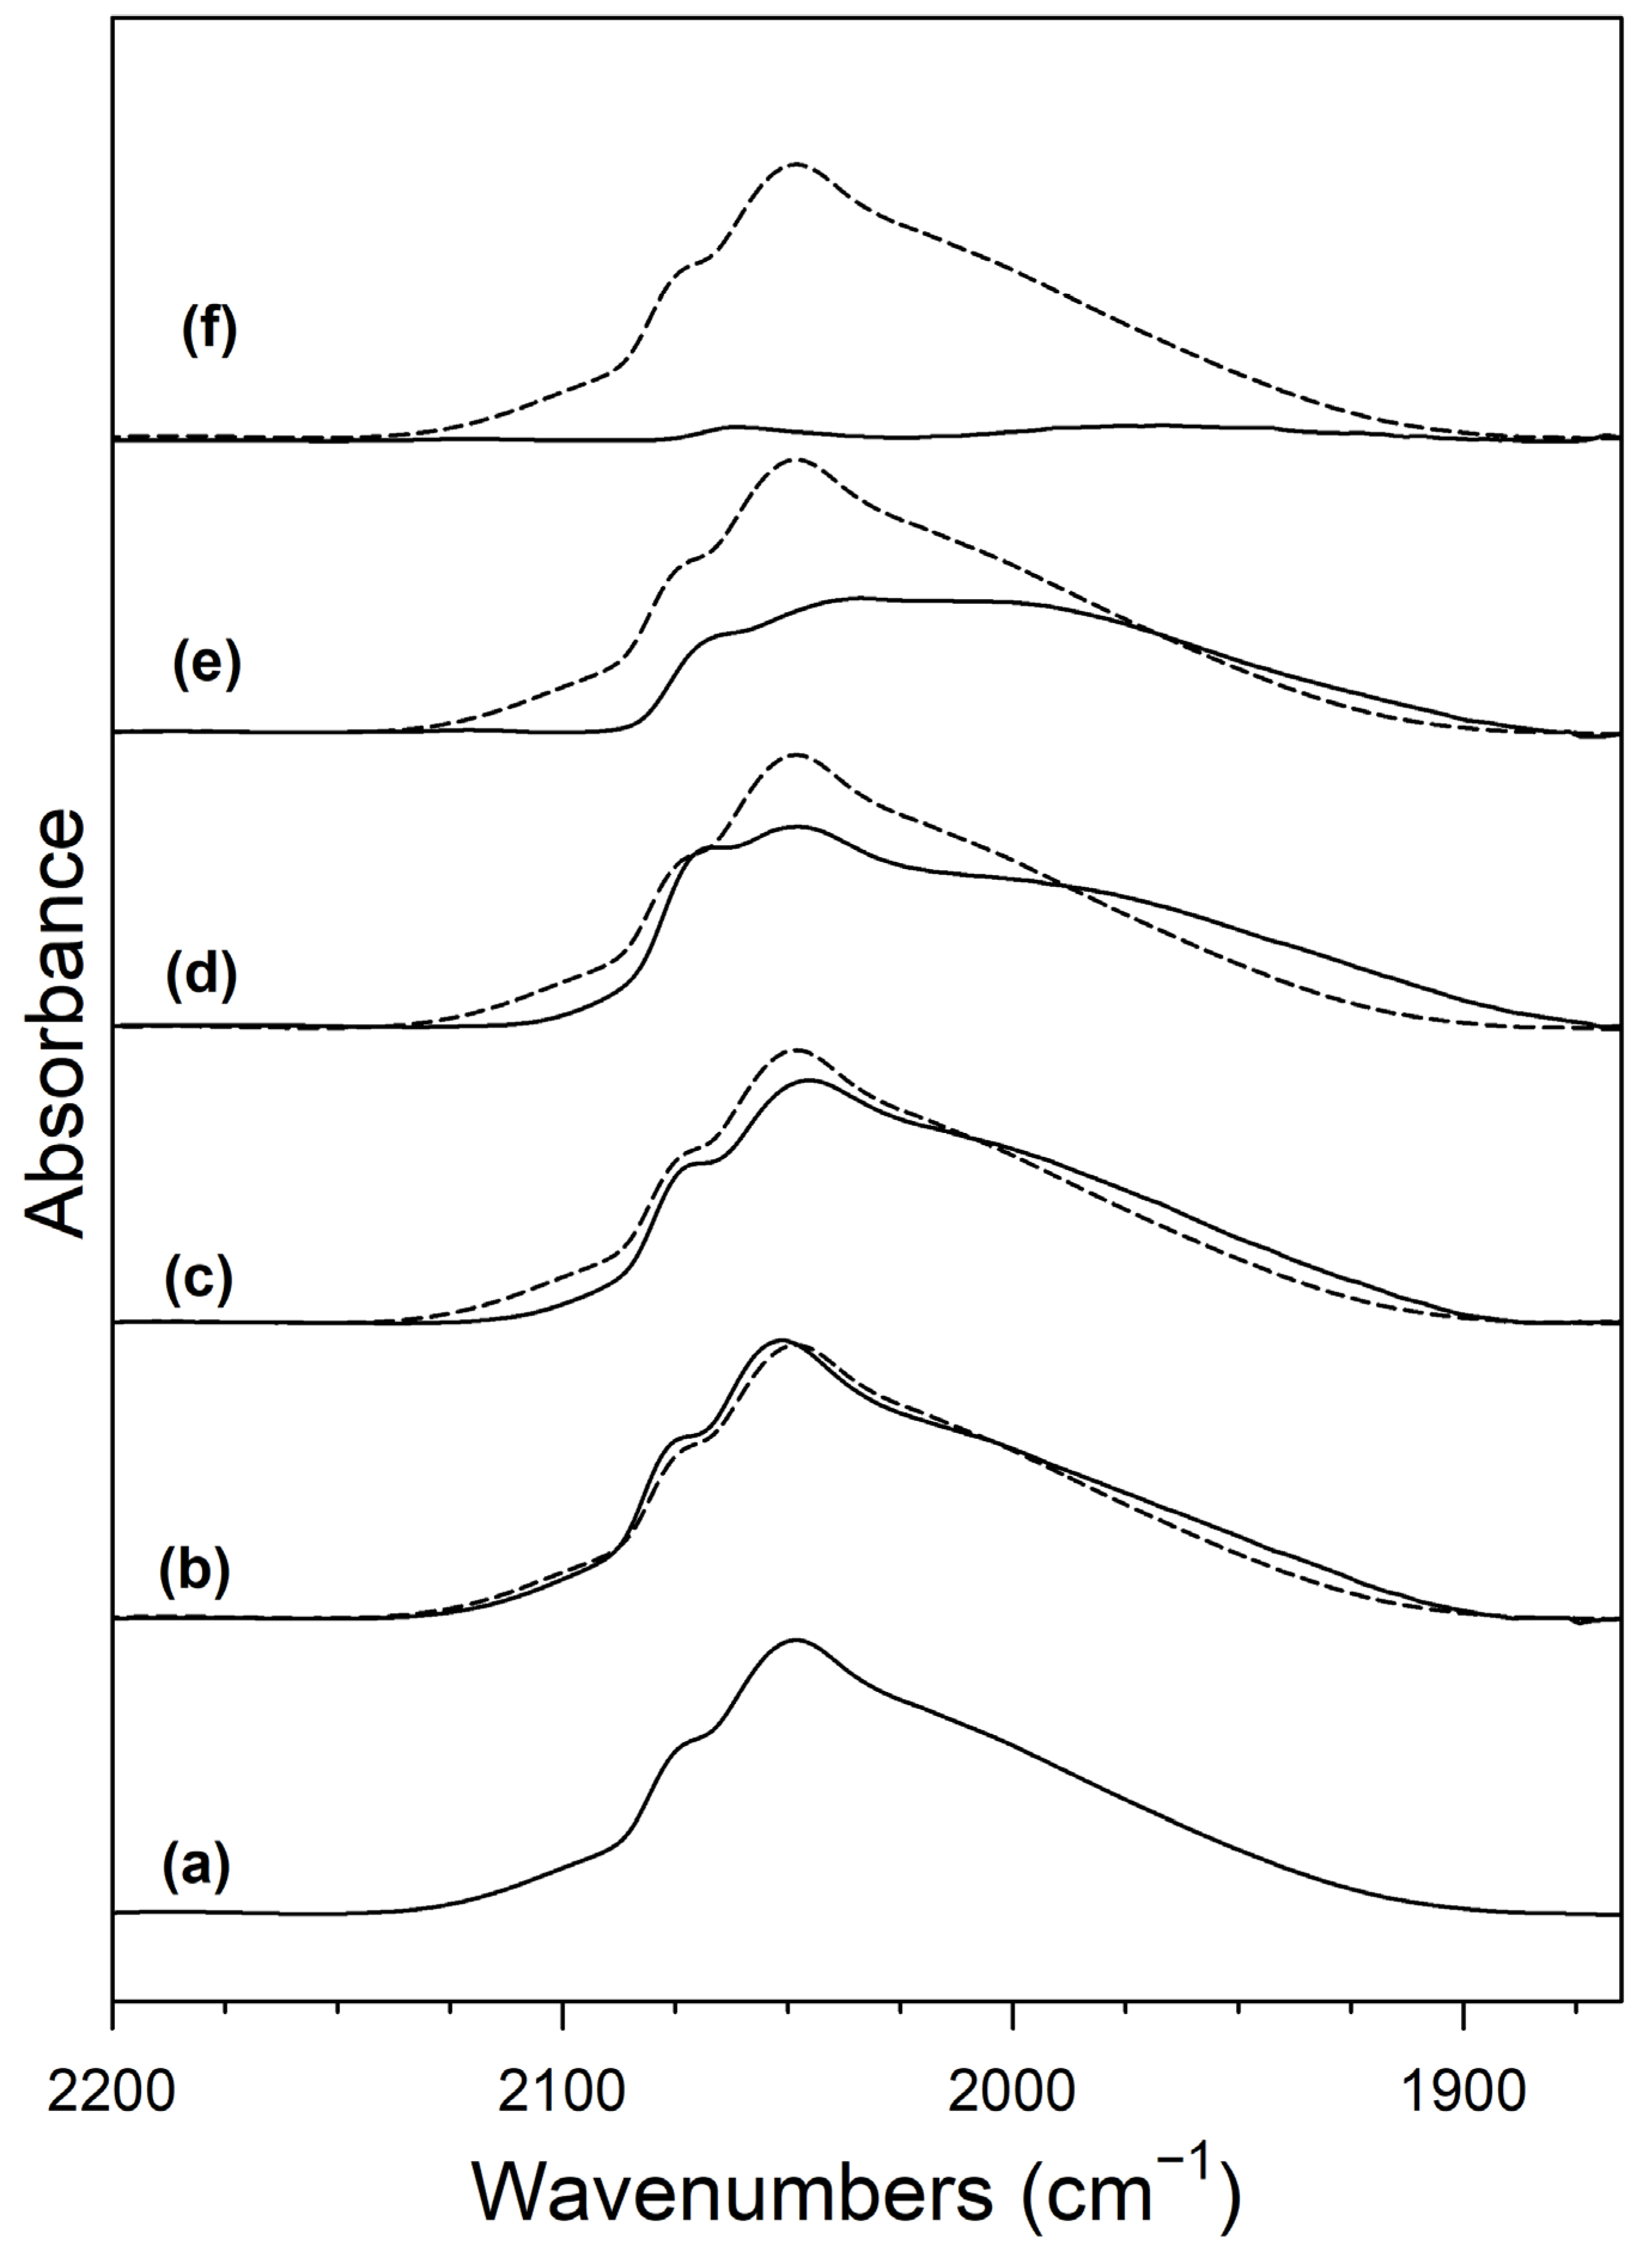
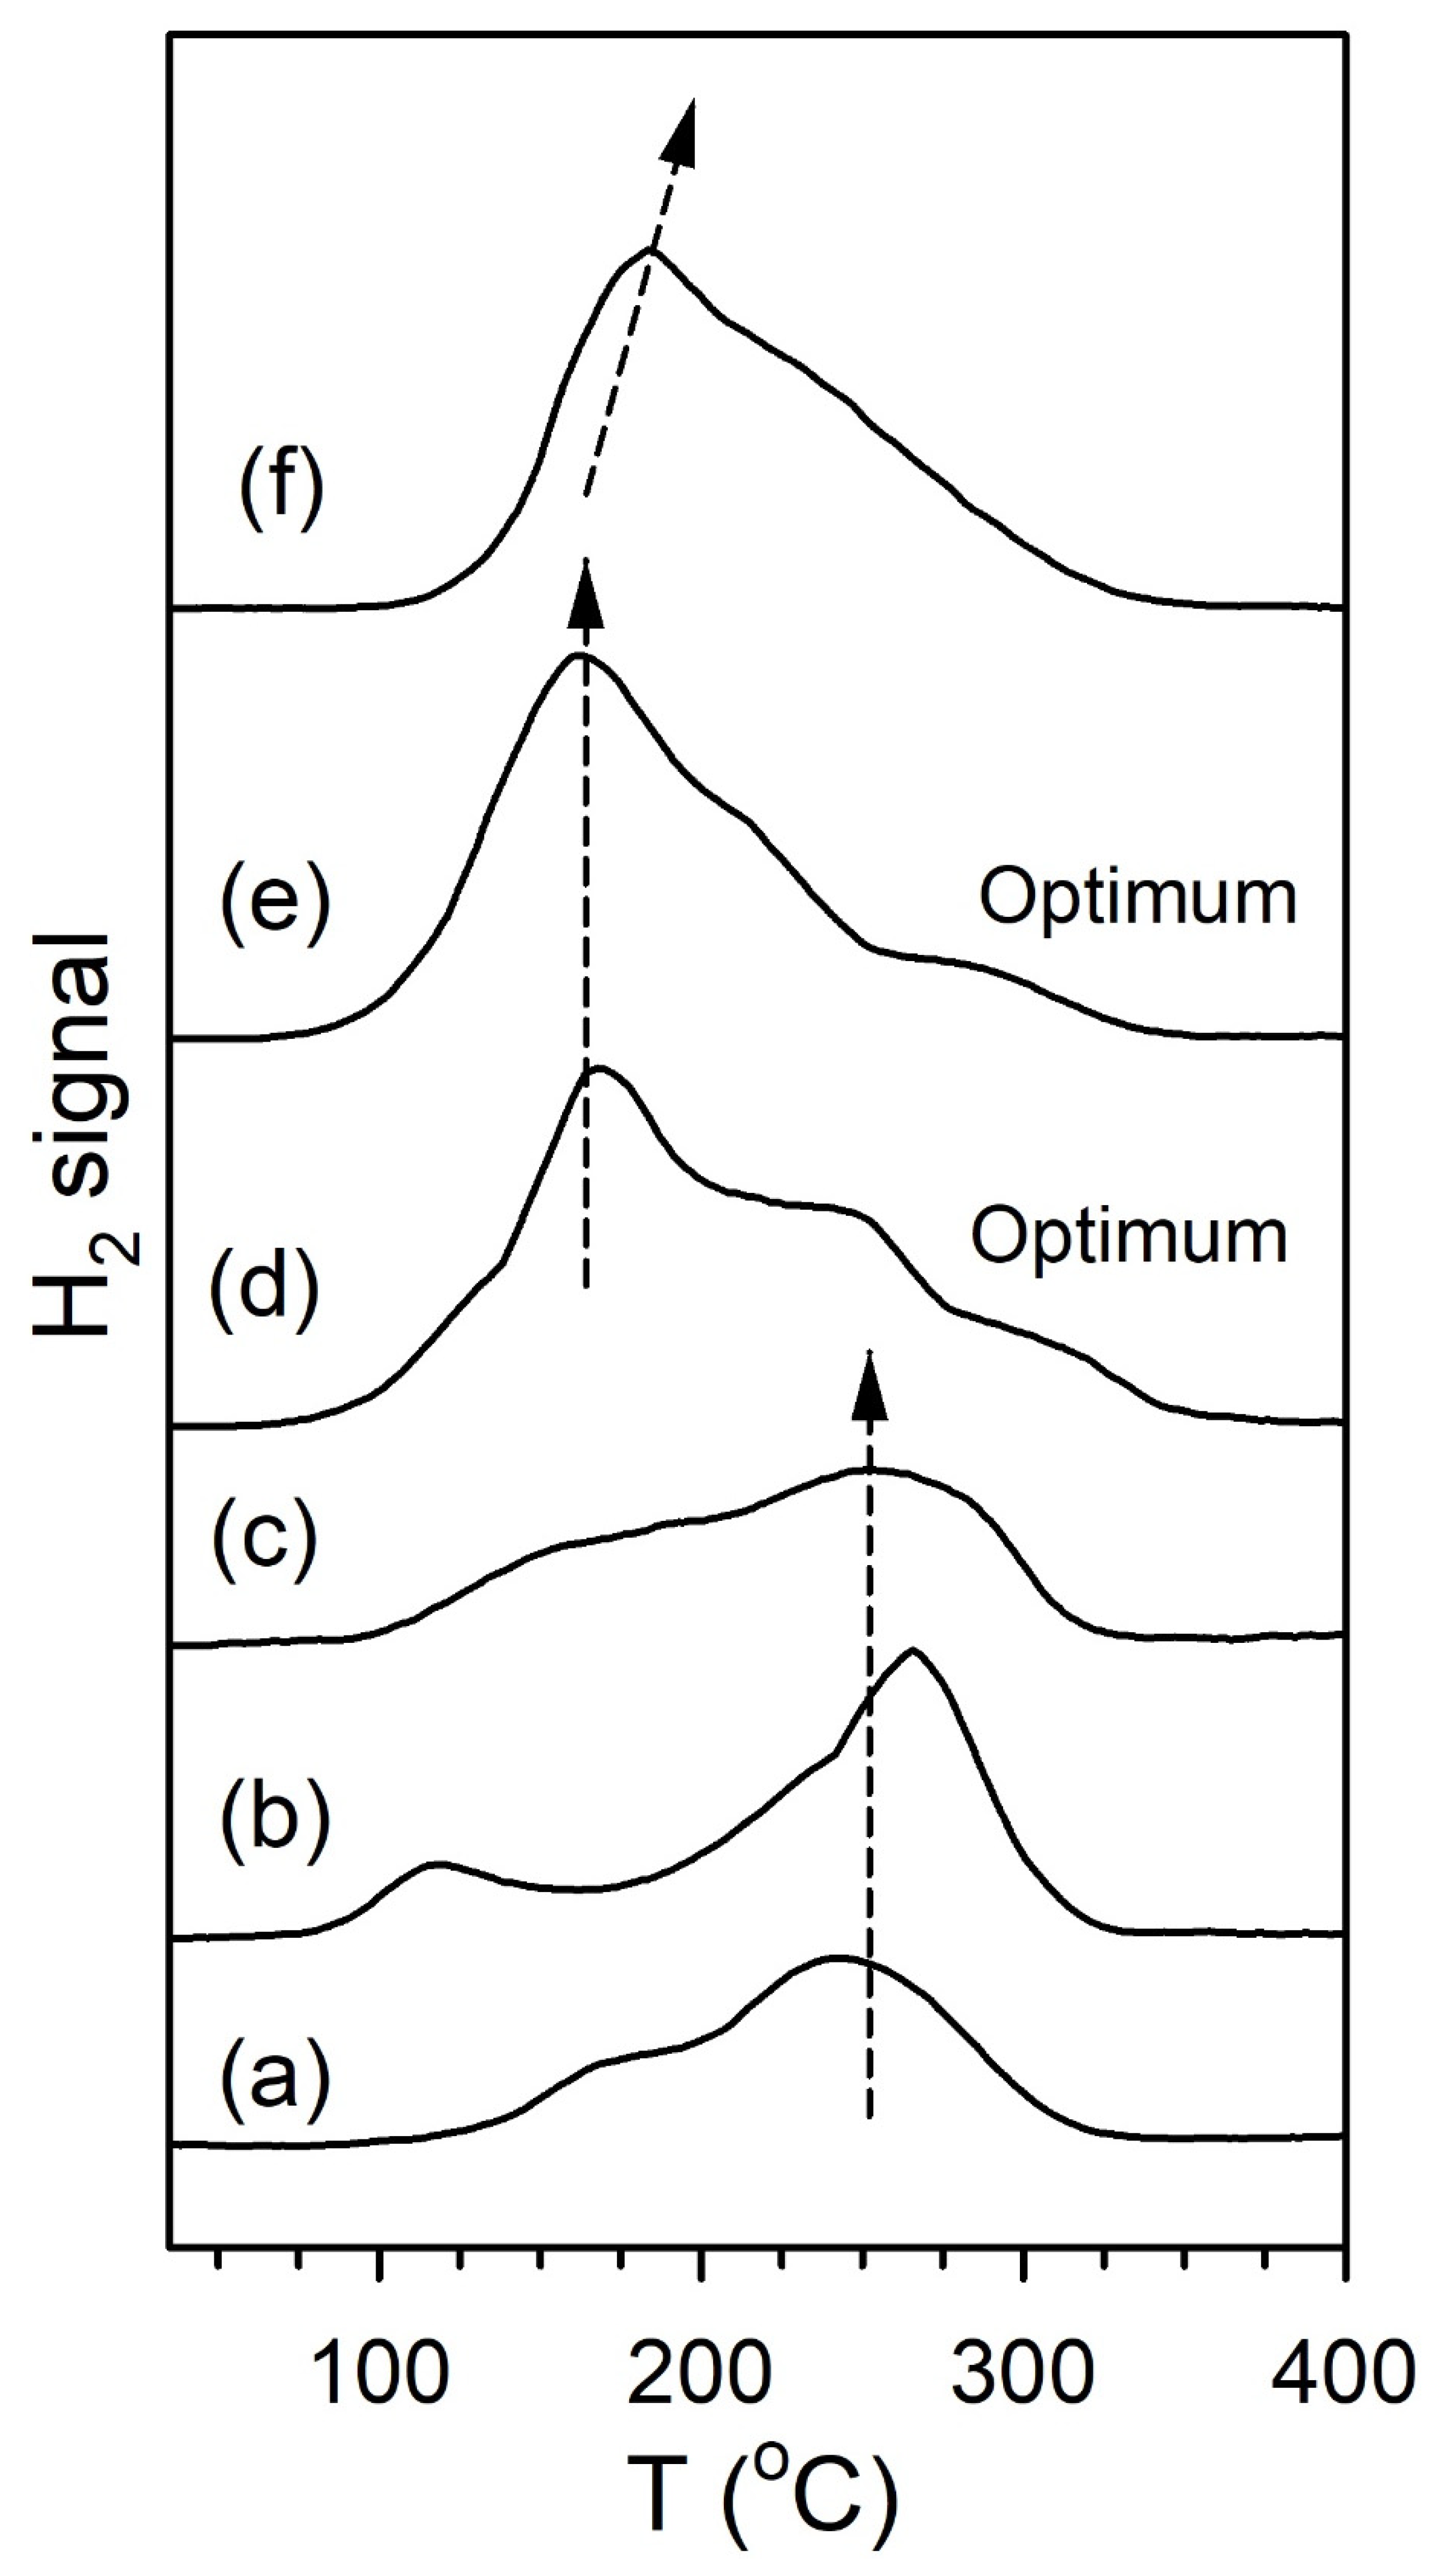
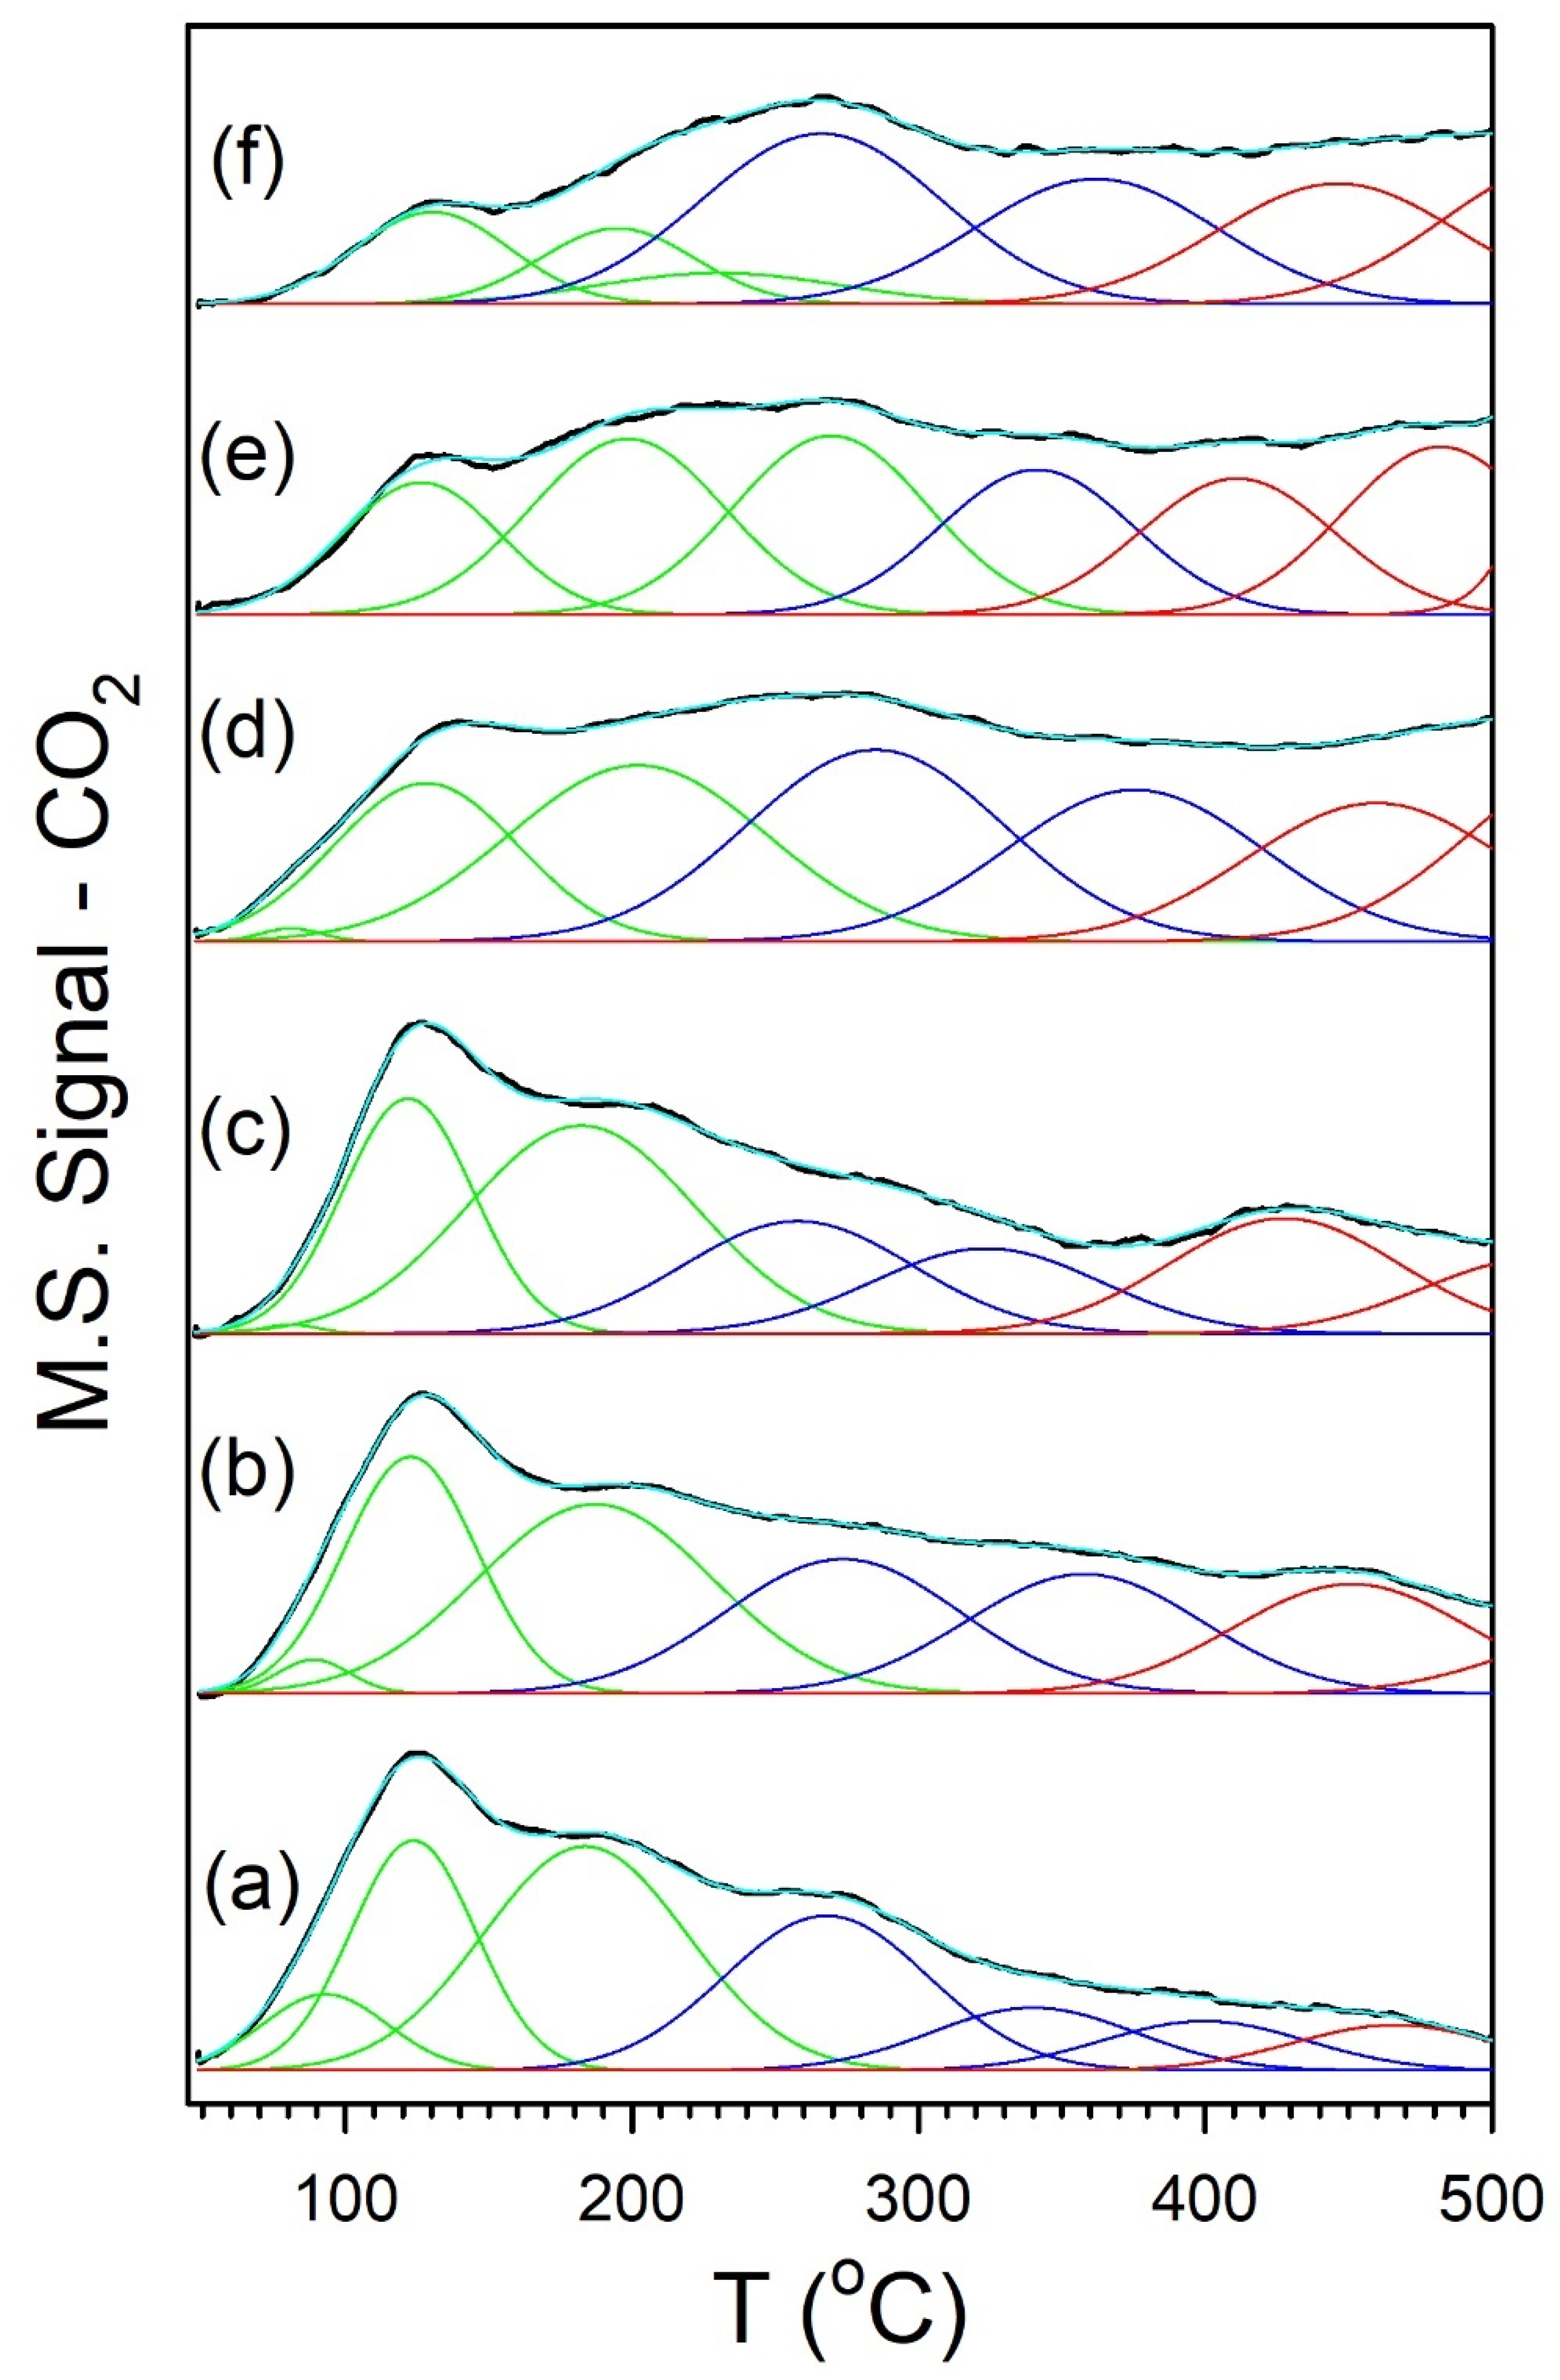
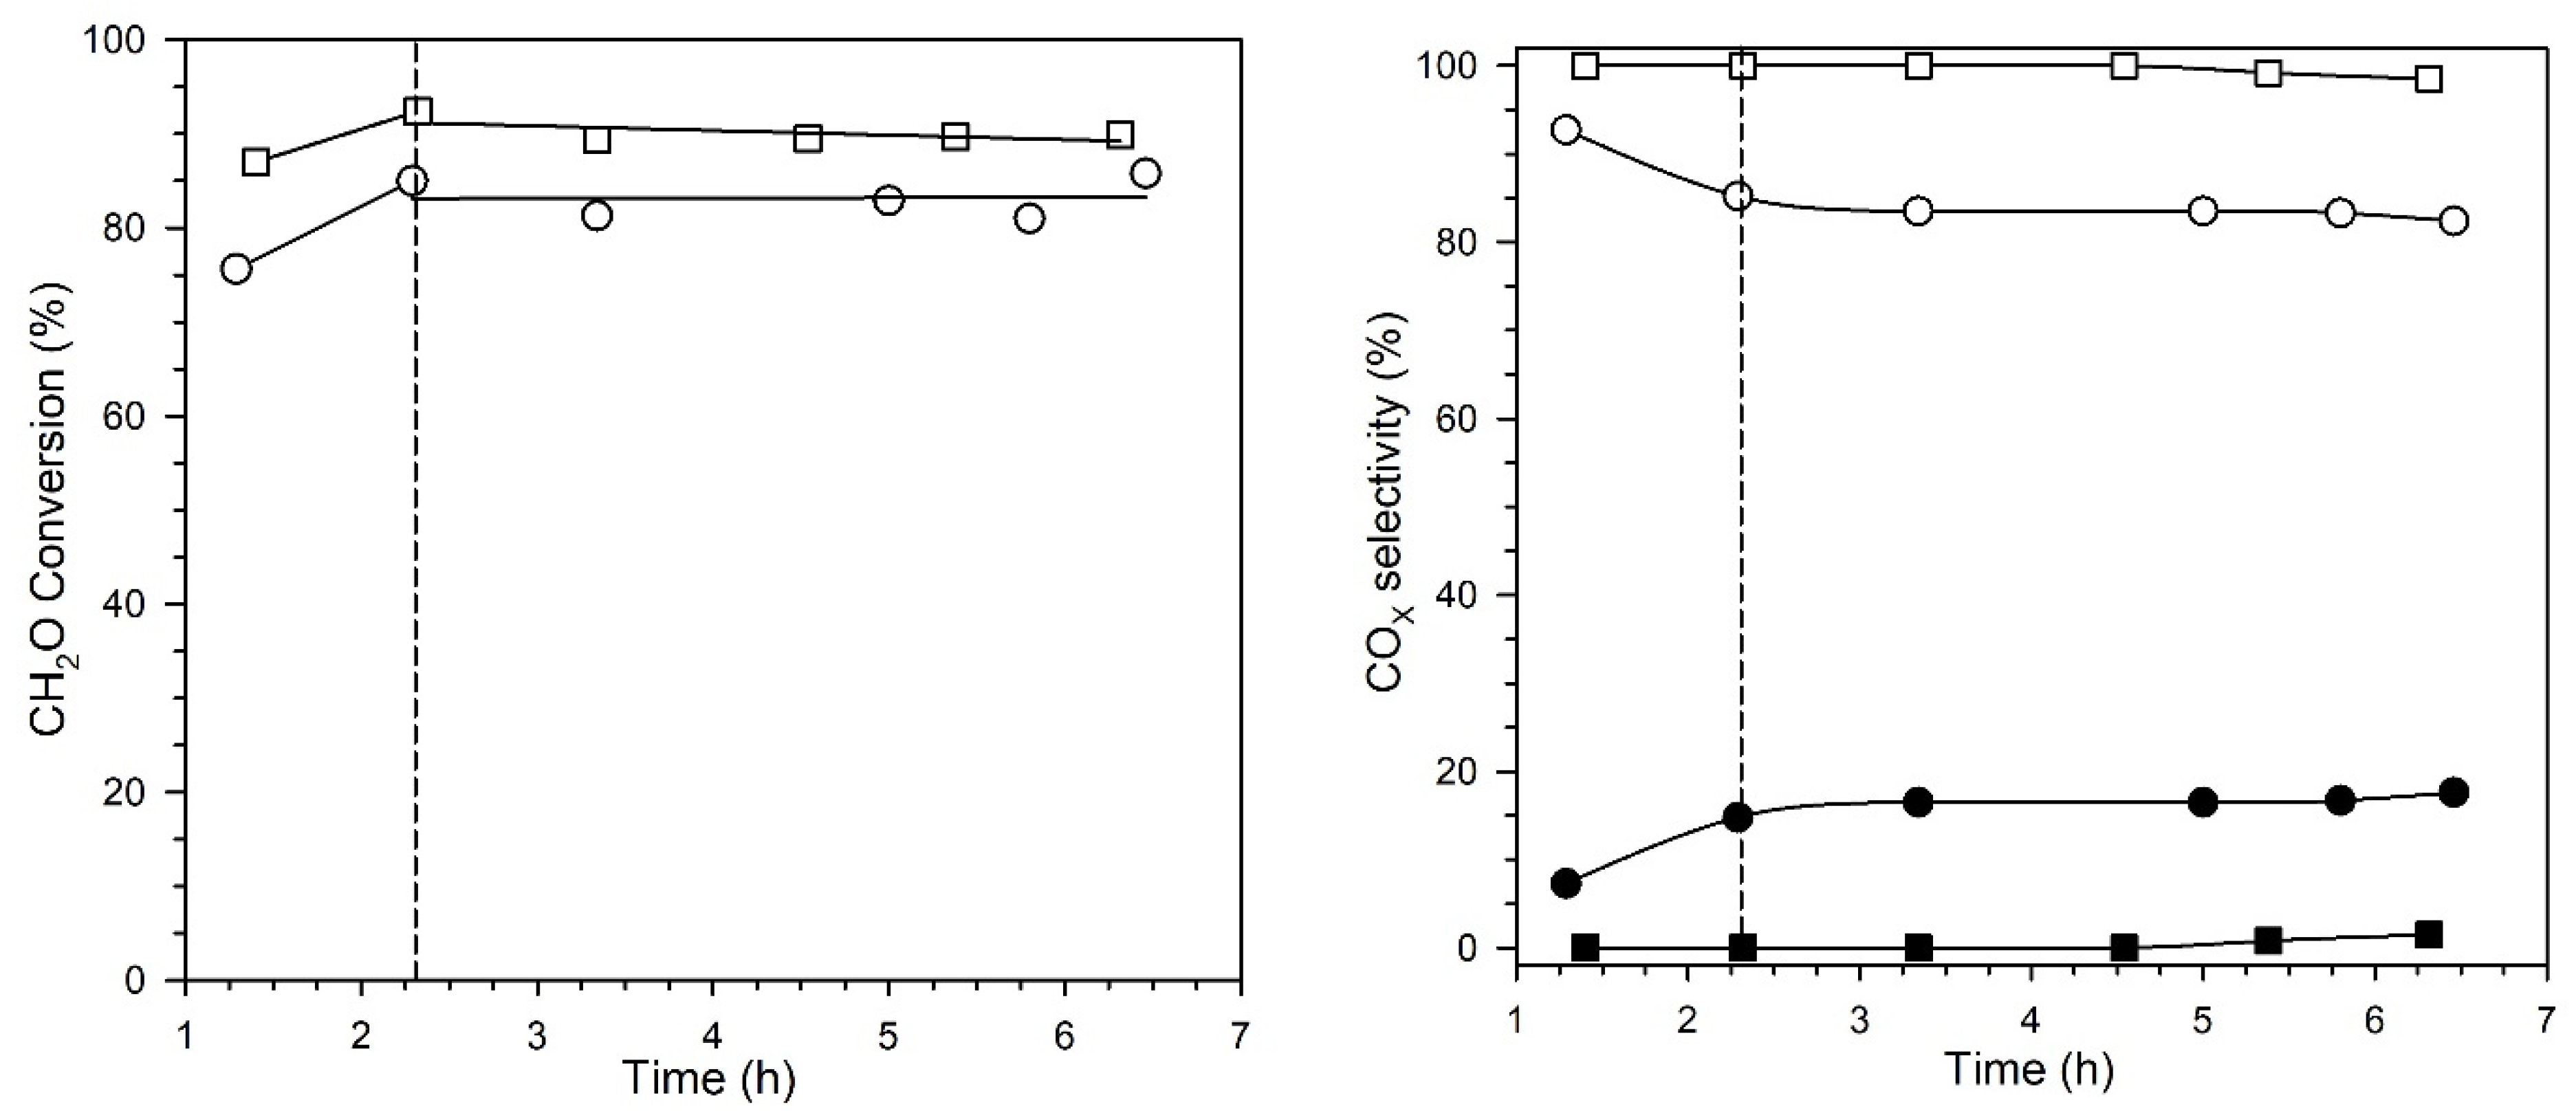
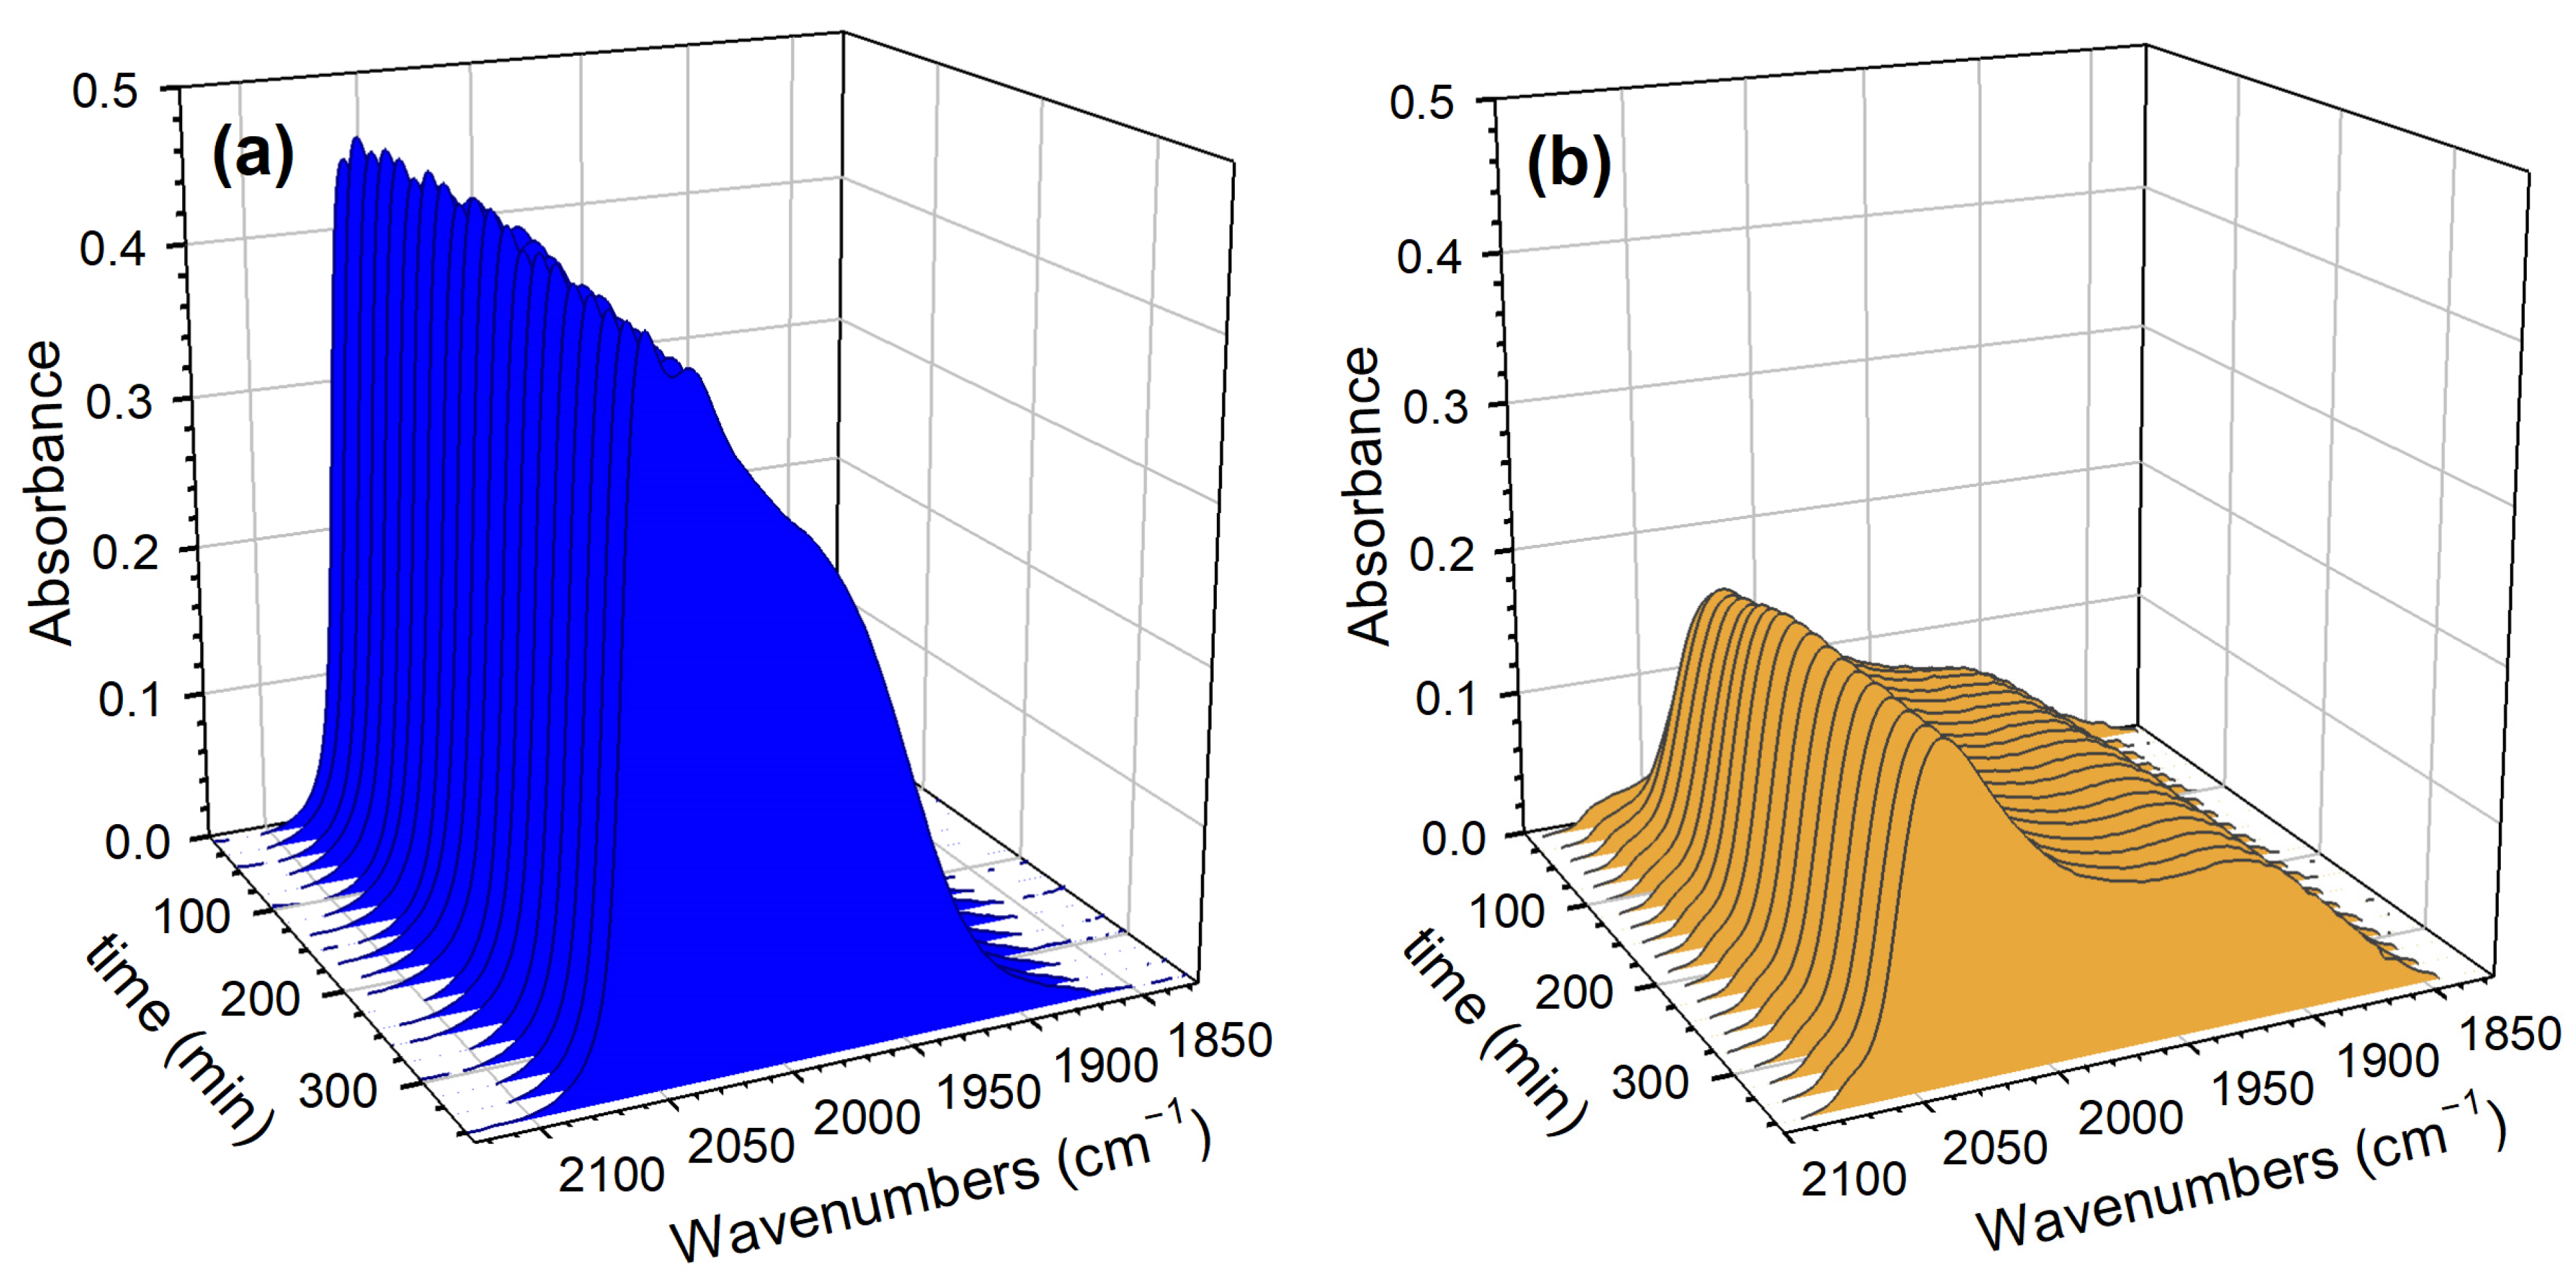
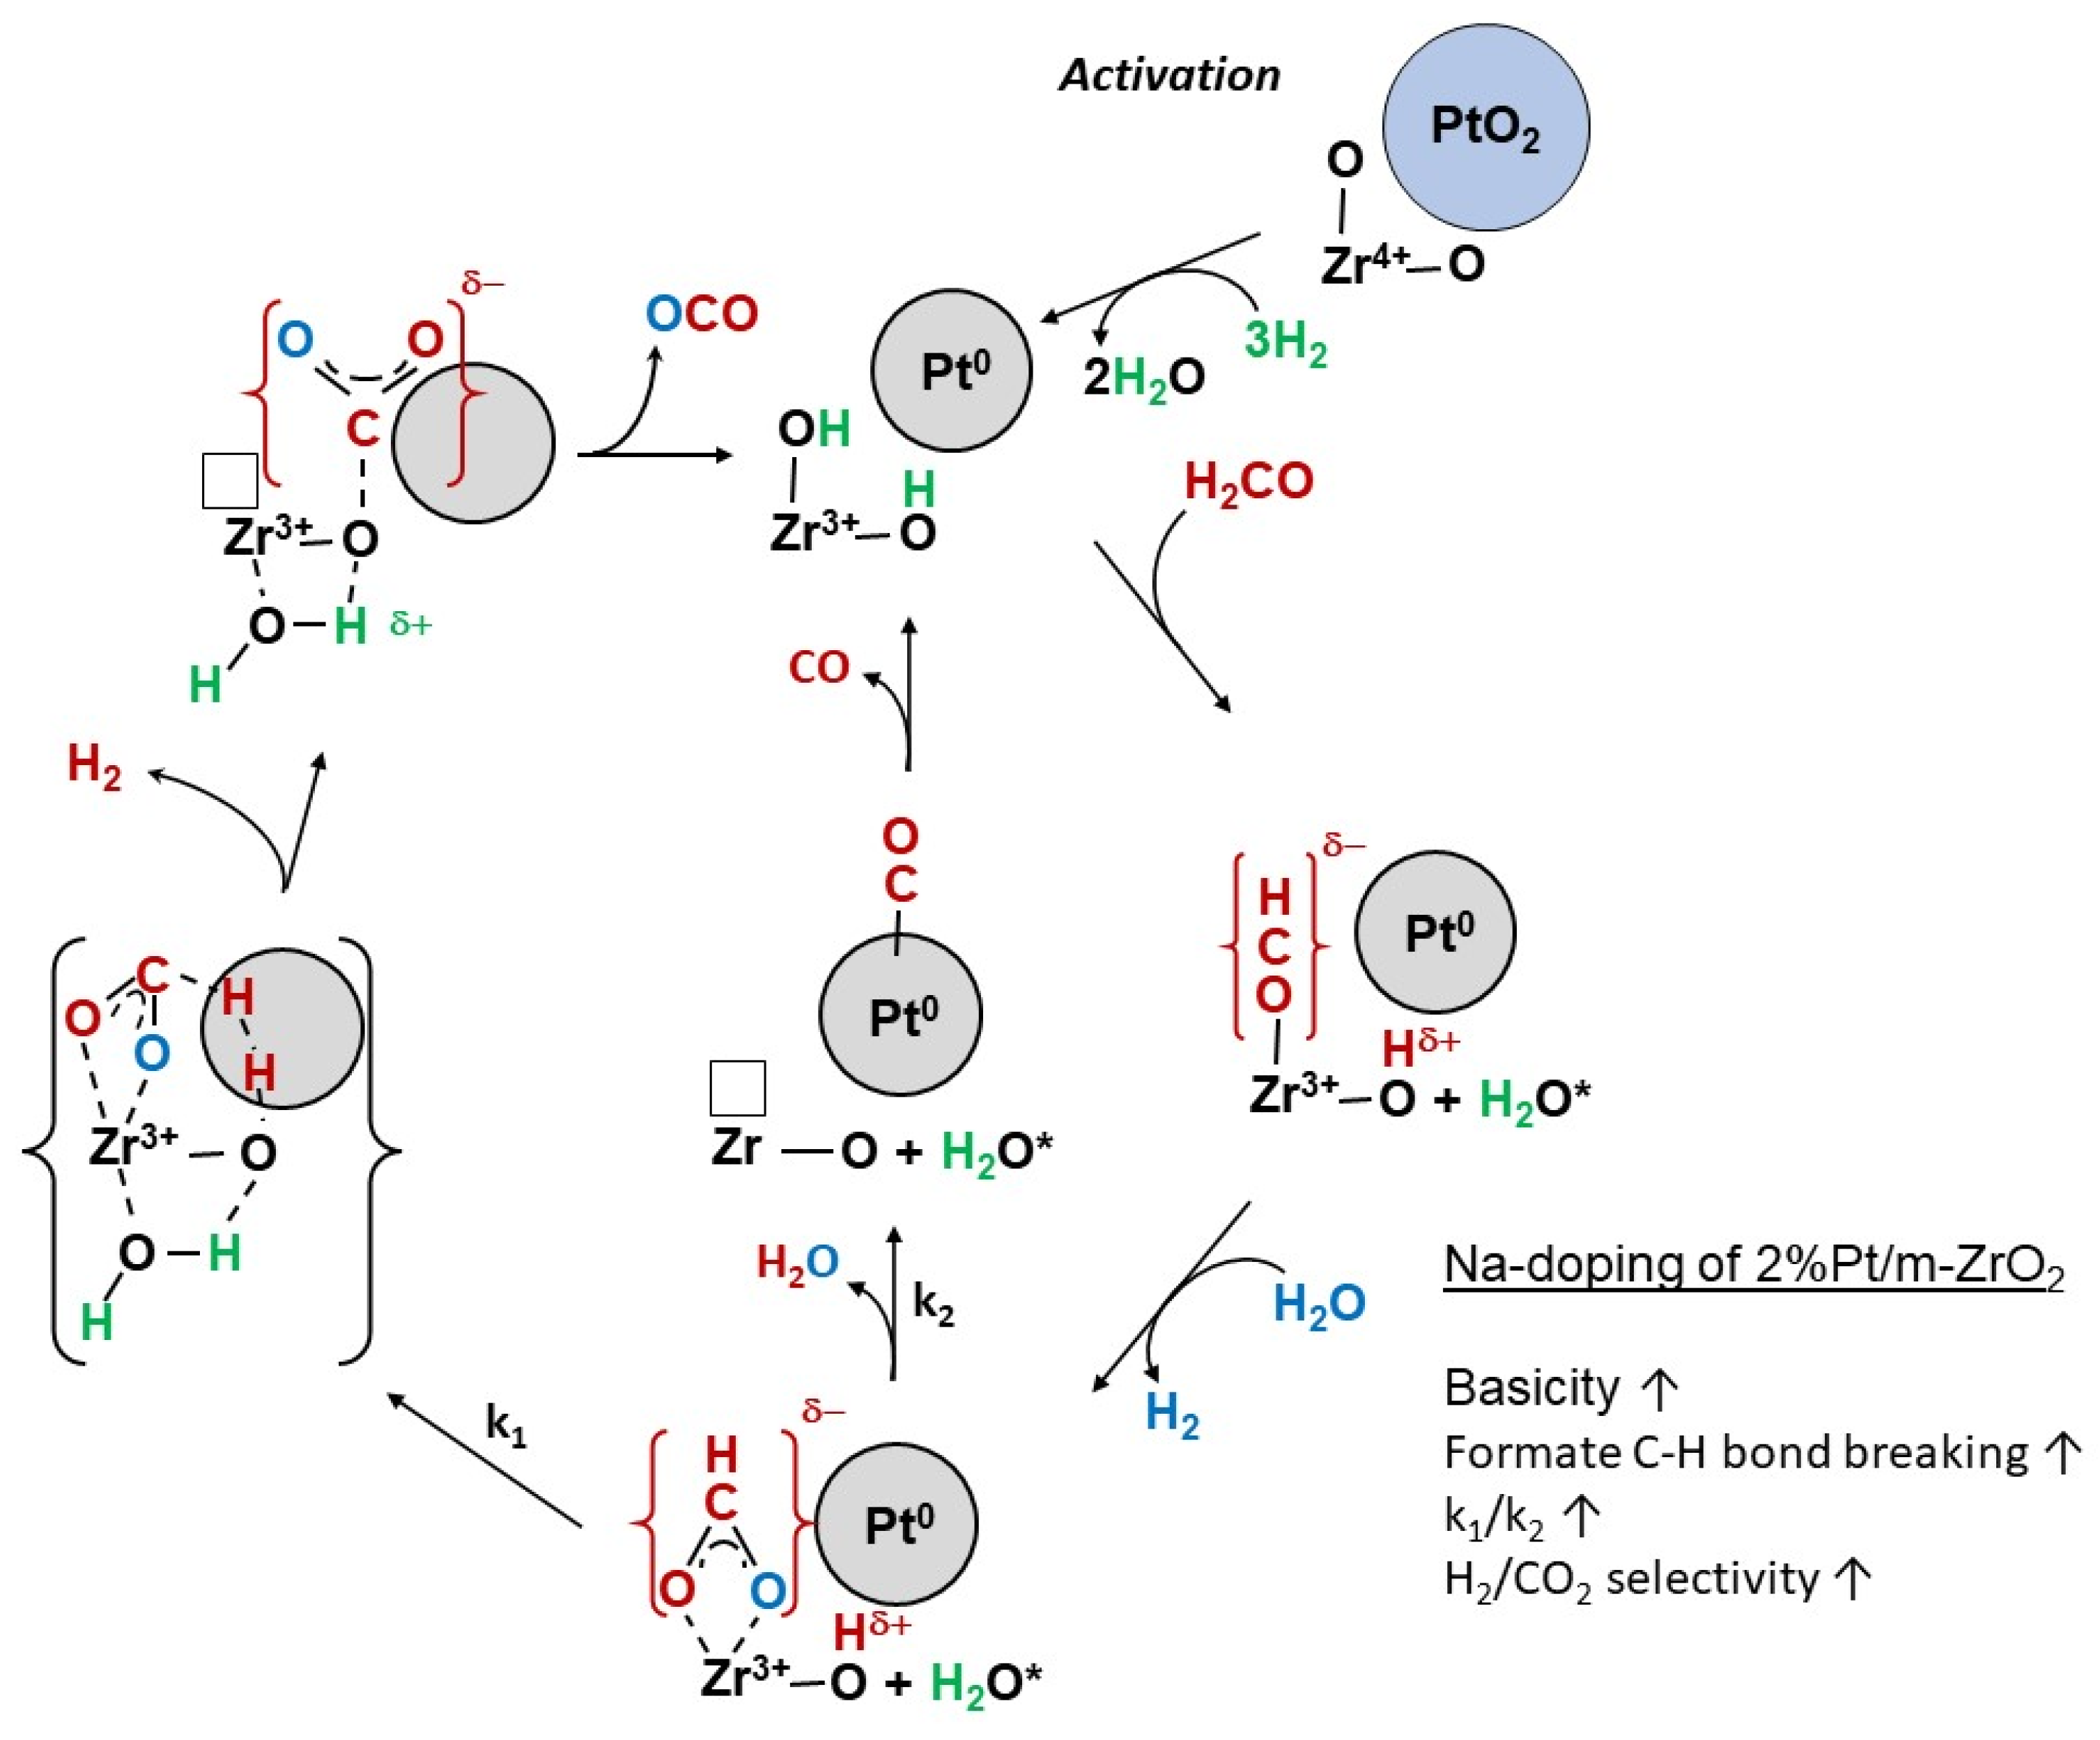
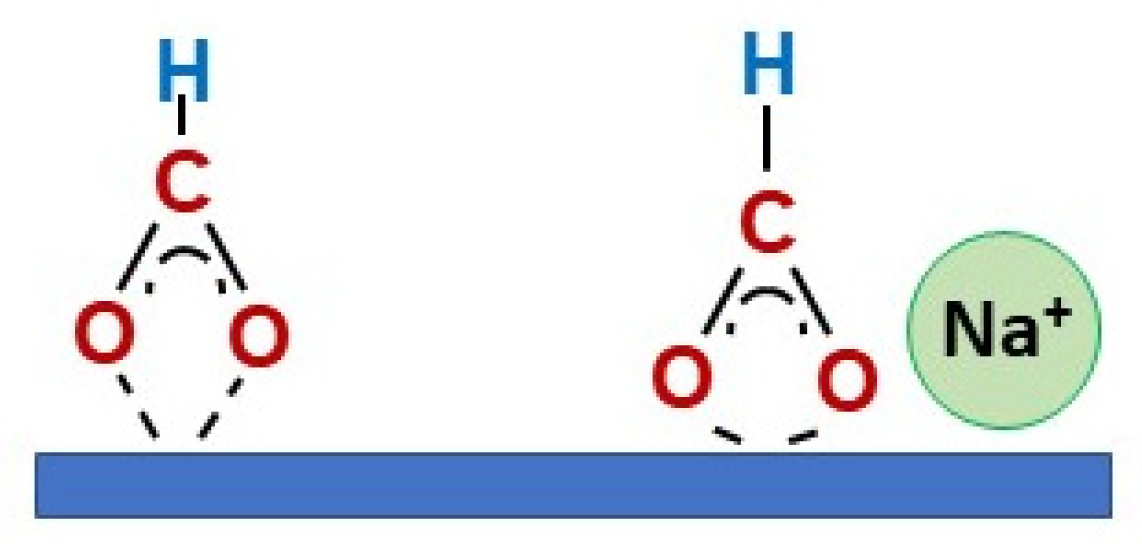
2. Results and Discussion

Catalyst Characterization

Table 1 provides BET surface area, BJH pore volume, and average pore size data for the catalysts studied. If the addition of Pt clusters does not contribute significantly to surface area but rather contributes solely to the mass, then the catalyst surface area should decrease from 106.6 m2/g to 104.1 m2/g. As adding Pt decreased specific surface area to 95.1 m2/g, this indicates that some Pt contributed to pore blocking. Adding Na further decreased the surface area, and the actual decrease in surface area is larger than the value that would be expected had Na only increased catalyst mass without contributing surface. This indicates that Na addition (assumed to be Na2CO3 in the calcined catalyst with a range of hydration) also results in some pore blocking. The differences between the expected and actual values increase as a function of Na loading, indicating that higher Na loadings exacerbate pore blocking.
In addition, specific volume is diminished and the average pore size increases, suggesting that Na addition tends to block the narrower pores. EXAFS analyses revealed that the Pt cluster size was not significantly impacted by Na addition, and all average Pt domain sizes were between 0.85 and 0.92 nm. Without considering surface coverage of Pt by Na, which will be shown to occur in subsequent infrared experiments, the expected dispersions fall within a narrow range of 86 to 91%. Figure 1 shows the TEM images of the H2-activated catalysts following passivation and, while most of the well-dispersed Pt clusters were approximately 1 nm in size, some larger agglomerates of up to 2.5 nm are also observed.
Temperature programmed reduction/mass spectrometry profiles are provided in Supplementary Information and are consistent with an activation mechanism involving (1) reduction of PtOX to Pt0, (2) H2 dissociation and spillover of hydrogen to the zirconia surface to produce reduced defect-associated Type II bridging OH groups, (3) and carbonate removal primarily be decarboxylation via reverse spillover from Pt0 clusters. Na addition adds more carbonate species to the surface of the catalyst, and as a result, more COX is liberated during the catalyst activation step.
Prior TPR-EXAFS/XANES experiments at the L2 and L3 edges of Pt showed that the Pt was completely reduced after H2 treatment at 300 °C. A XANES differences analysis of L3–L2 spectra taken after alignment of the EXAFS features resulted in a slightly increasing intensity trend, as summarized in the final column of Table 1; this suggests that Na does not enrich Pt clusters through a donation of electron charge. Furthermore, increasing the loading of Na tended to shift the point of 50% conversion of PtOX to Pt0 to higher temperatures, suggesting direct contact of Na with the surface of platinum that hindered the reduction rate.
Figure 2, Figure 3, Figure 4, Figure 5, Figure 6 and Figure 7 show the results of DRIFTS for the temperature-stepped reaction of formaldehyde in steam. A mechanism is provided in Scheme 1. Formaldehyde dissociates to the formyl anion and adsorbed H, displacing labile Type II OH groups to produce adsorbed H2O (i.e., H2O*). In all cases, with addition of H2O, the adsorbed formyl anion is readily converted to formate, achieving ν(CH) band maxima in the range of 125–175 °C, with little change in intensity over this range. Na addition increased the formate area intensity for all catalysts, suggesting that Na promotes the formation of active OH groups. Moreover, as highlighted in Figure 8, Na electronically weakens the formate ν(CH) bond resulting in a shift to lower wavenumbers in comparison to the unpromoted catalyst. The changes, which are tabulated in Table 2, are similar in nature to those observed from CO adsorption during water-gas shift experiments; band positions from these previous experiments are summarized in Table 1 for the purpose of comparison. The most important change occurs when the Na loadings reach optimal values of 1.8–2.5%Na; this is the same range of loading where step change improvement in water-gas shift activity were reported. Na also covers Pt0 sites, as shown in Figure 9, which shows the Pt-carbonyl band region. Based on the area percentages displayed in the caption of Figure 9, the majority of Pt0 surface sites remain available up to a loading of 2.5%Na. However, moving to 5%Na results in severe Pt0 site blocking.
Table 2 shows that there is a significant increase in the splitting between the asymmetric and symmetric ν(OCO) bands. This is consistent with Na addition increasing the surface basicity of the catalyst, resulting in an increase in bonding between the formate -CO2 functional group and the catalyst surface; this increase in bond strength weakens the formate CH bond, resulting in the decrease in ν(CH) band position, as shown in Scheme 2. Through formate C-H bond weakening, the steam-assisted formate dehydrogenation step occurs in a more facile manner when Na is present at loadings of 1.8%Na and 2.5%Na. As shown in the final column of Table 2, the formate is nearly completely decomposed to unidentate carbonate (i.e., adsorbed CO2) by 200 °C at these near-optimal loadings, which further decomposes at the metal-support interface, with H2O dissociating at the O-vacancy, thus completing the cycle.
To confirm this reactivity trend for formate, temperature programmed reaction of co-adsorbed formaldehyde and H2O was performed using mass spectrometry, and results are provided in Figure 10. The main H2 peak, representative of formate dehydrogenation, occurred between 150 °C and 175 °C for the 1.8%Na and 2.5%Na-doped catalysts, while catalysts with lesser amounts of Na (or no Na) had the main peak occurring between 200 °C and 300 °C. The profile of the catalyst with 5%Na was shifted upward in temperature (relative to optimum loadings of 1.8%Na and 2.5%Na), and this is due to excessive Na blocking Pt sites, thereby hindering Pt-catalyzed H-transfer.
For the purpose of verification, CO2 TPD was carried out using TPD-MS, and results of curve fitting are shown in Figure 11, with ranges for CO2 desorption compiled in Table 3. CO2 is an acidic molecule and, as such, it should tend to desorb at higher temperatures with increasing catalyst basicity due to Na addition. Na blocking of Pt0 sites at high Na loading (e.g., 5%Na) should hinder Pt-catalyzed CO2 desorption as well, exacerbating the trend of higher temperature CO2 desorption. As shown in Figure 11 and Table 3, CO2 desorption requires higher temperature with both the addition of Na, as well as increasing the Na doping level. This is consistent with the higher basicity shown previously by the increased splitting of the ν(OCO) asymmetric and symmetric bands of formate.
The unpromoted and 2.5%Na promoted catalyst were tested for 6.5 h at 300 °C for FSR, and catalytic testing results are shown in Figure 12. There is an initial induction period prior to recording the 2 h point for both catalysts. The catalysts have a similar formaldehyde conversion (average values of 83 and 90% for the undoped and Na-doped catalysts, respectively, from 2 to 6.5 h) at 300 °C. Higher conversion can be reached at low temperature with this Pt/m-ZrO2 system in comparison with NiO catalysts, where conversions higher than 80% were reached only in the temperature range of ~400–450 °C [13,14]. Averaging over the points from 2 to 6.5 h, the addition of sodium increases the CO2 selectivity from 83.5% to 99.5% by improving the decarboxylation and dehydrogenation decomposition pathway of formate. This is in line with the results of in situ DRIFTS and temperature programmed reaction of FSR, where Na promotes the facile cleaving of the formate C–H bond, facilitating the dehydrogenation/decarboxylation pathway. Over the 6.5 h runs, the CH2O conversion was stable, and this is attributed to the low temperature (300 °C) and high H2O/CH2O ratio used. For example, during ethanol steam high H2O/C2H5OH ratio helps to prevent the formation of coke during the reaction [5].
The primary focus of this work is on the selectivity changes associated with Na-doping rather than catalyst stability. Long term testing would be needed in the future to assess catalyst aging phenomena. To shed light on possible structural changes of Pt with time, in situ DRIFTS was conducted for a 6 h period for the unpromoted and 2.5%Na doped 2%Pt/m-ZrO2 catalysts, and time-on-stream results are reported in Figure 13. The Pt carbonyl ν(CO) and formate/carbonate ν(OCO) bands change very little for both catalysts, suggesting that Pt agglomeration or coke deposition on Pt are not significant over the 6 h run. Pt growth would be expected to result in an increase in high wavenumber bands (2060 cm−1) associated with linearly adsorbed CO and a decrease in the low wavenumber band region (2045–1875 cm−1) for CO adsorbed on Pt defects (corners, edges) associated with Pt defects. Defect sites, especially associated with small Pt particles, give greater electron back donation and thus the metal-carbon bond is strengthened, weakening the carbon-oxygen bond and resulting in lower wavenumber ν(CO) bands [34]. In contrast, carbon deposition would be expected to attenuate the ν(CO) band intensities, and this was not detected either.
To assess the presence of carbon-containing species in the used catalysts, temperature programmed oxidation (TPO) was conducted using both TCD and MS (CO2 and H2O signals), as shown in Figure 14. Regarding the TCD signal (Figure 14, bottom), both catalysts have a rising baseline with increasing temperature, which is consistent with the replacement of defect (e.g., O- vacancy) associated Type II bridging OH groups by oxygen. In agreement with this, the MS signal of H2O (Figure 14, middle) for both catalysts rises with increasing temperature. In the TCD signal of the 2%Pt/m-ZrO2 catalyst (Figure 14, bottom), there is a sharp peak centered at 80–150 °C (maximum at 120 °C), and there is a corresponding peak located in the MS signal of CO2. This indicates oxidation of carbon-containing species, which are catalyzed by Pt resulting in a low temperature peak. Typically, TPO of coke deposits on Pt catalysts appear between 200 °C and 600 °C [35] and thus, the lower temperature oxidation suggests that the species responsible for the TPO peak may be residual unreacted oxygenates (i.e., carbon that is already in a partially oxidized chemical state), such as adsorbed formaldehyde, formate, or carbonate. There is also a very broad low intensity feature from 150 °C to 500 °C in both the TCD and MS signals of CO2 associated with the oxidation of a small fraction of carbonaceous species located further from Pt particles where the oxidation catalysis is hindered. In contrast, peaks in the Na-doped catalyst range from 280 °C to 740 °C. The intensity of this series of peaks is similar to that of the unpromoted catalyst. However, there are two factors to consider. Firstly, Na doping attenuates the activity of Pt and should therefore hinder the catalysis of oxidation. Secondly, Na increases the basicity of the catalyst (as shown previously), such that any CO2 formed from the oxidation of carbon-containing species will adsorb on the catalyst surface and require higher temperature for desorption. There is also a sharp peak in both the TCD and CO2 MS profiles positioned at ~800 °C for the Na-doped catalyst. It is assigned to the decomposition of well-structured sodium carbonate to Na2O, which is known to occur near the melting temperature of sodium carbonate. In summary, no evidence of catalyst deactivation due to significant coke formation was detected following the 6 h run, in agreement with the high stability observed for both catalysts in the catalytic reaction tests.

3. Materials and Methods

3.1. Catalyst Preparation

Sodium doped 2%Pt/m-ZrO2 catalysts having Na loadings of 0.5%, 1%, 1.8%, 2.5%, and 5%Na by weight were prepared by incipient wetness impregnation (IWI). Monoclinic phase zirconia (Thermo Fisher Part No. 43815, Waltham, MA 02451, USA) (63–125 μm) was impregnated with 2% Pt using aqueous Pt(NH3)4(NO3)2 (Alfa Aesar Part No. 88960, Haverhill, MA 01835, USA). Following calcination in air in a muffle furnace, the catalyst was divided into several portions and was promoted by the appropriate amount of aqueous NaNO3 using the IWI method. Impregnations were followed by drying and calcination in air at 350 °C for 4 h using the muffle furnace.

3.2. Characterization

3.2.1. BET Surface Area

Catalysts were outgassed in vacuum at 160 °C until the pressure was below 6.7 Pa. Each catalyst sample was cooled in vacuum to cryogenic temperatures, and a Micrometrics (Norcross, GA 30093, USA) 3-Flex system was used to measure porosity and surface area characteristics through nitrogen physisorption and following the BJH and BET methods.

3.2.2. TEM

TEM analysis was performed with FEI Talos F200X instrument (Thermo Fisher Scientific, Waltham, MA 02451, USA) equipped with BF, DF2, DF4, and HAADF detectors. The imaging was collected with a field emission gun using an accelerating voltage of 200 kV and a high speed Ceta 16M camera (Thermo Fisher Scientific, Waltham, MA 02451, USA). Velox software (Windows 10, 64-bit) (Thermo Fisher Scientific, Waltham, MA 02451, USA) was used for data processing. Prior to the analysis, the samples were dispersed in ethanol, sonicated for 30 min, and then a droplet of the suspension was added to a carbon-coated copper grid (300 mesh) and dried in air overnight.

3.2.3. Temperature Programmed Reduction/Mass Spectrometry

Temperature programmed reduction (TPR) experiments were conducted using an Altamira AMI-300R (Altamira Instruments, Pittsburgh, PA 15238, USA) instrument equipped with a mass spectrometer from Hiden Analytical (Warrington WA5 7UN, UK). 10% H2/He was flowed while increasing the temperature from 50 to 1000 °C at 10 °C/min while the mass signals of hydrogen, water, carbon monoxide, and carbon dioxide were monitored.

3.2.4. Temperature Programmed Desorption, Reaction, and Oxidation

Temperature programmed desorption (TPD) of CO2 experiments were conducted on an Altamira AMI-300R (Altamira Instruments, Pittsburgh, PA 15238, USA). Catalysts were reduced at 300 °C using a reducing gas of 33%H2/He flowing at 30 cm3/min. After reduction, the catalyst was cooled to 225 °C under hydrogen flow. Next, 50 cm3/min He was bubbled through water and flowed through the system for 15 min. Subsequently, the catalyst was exposed to the same reducing gas for 15 min, followed by a purge of 50 cm3/min He. This procedure allowed for the formation of bridging OH at oxygen vacancy sites on the catalyst surface. The catalyst was cooled to 50 °C and 4%CO2/He was flowed at 30 cm3/min. The system was then slowly heated to 500 °C to desorb the CO2.
Temperature programmed reaction of the steam reforming of formaldehyde was also conducted using the Altamira AMI-300R. Catalysts were reduced at 300 °C using a reducing gas of 33%H2/He flowing at 30 cm3/min. After reduction, the catalyst was cooled to 50 °C under helium flow (30 cm3/min). Next, a 25 µL injection of 16%formaldehyde/90%H2O (Pierce, ThermoFisher 28906, Waltham, MA 02451, USA) was made into a heated port (130 °C). The catalyst was then ramped in 30 cm3/min of argon gas at 10 °C/min and the mass signal of H2 was followed. All gases used in this work were from Airgas (San Antonio, TX 78219, USA).
Temperature programmed oxidation (TPO) was also carried out (Altamira AMI-300R unit) on used catalysts (90 to 100 mg) and the mass signals of CO2 and H2O were followed in addition to the TCD signal. 50 cm3/min of 5%O2/helium was flowed while the temperature was ramped at 10 °C/min to 900 °C.

3.2.5. DRIFTS

A Nicolet iS-10 FTIR spectrometer (ThermoFisher, Waltham, MA 02451, USA) was used to conduct steam reforming of formaldehyde experiments. A background spectrum in 100 cm3/min of helium was recorded at ambient temperature (512 scans). To reduce the catalyst, 200 cm3/min of a 1:1 H2:He mixture was flowed at 300 °C for one hour during which three background spectra were recorded (512 scans each). Following reduction, the temperature was reduced to 50 °C in flowing helium and another background spectrum was recorded (512 scans). 250 µL of 16%formaldehyde/90%H2O mixture (Pierce, ThermoFisher 28906, Waltham, MA 02451, USA) were injected into a heated port (130 °C) and 512 scans were recorded for one hour in 100 cm3/min of helium purge gas. A second stream of helium was bubbled through a water saturator held in a water bath at 31 °C, and the saturated vapor (4.4% H2O, balance He) was flowed across the catalyst at 30 cm3/min. The temperature was stepped in 25 °C increments until 300 °C and 256 scans were averaged at each point.

3.2.6. Reaction Testing

The activity of the catalysts was tested in a fixed bed reactor. Briefly, 80 mg of catalyst (63–106 µm) was diluted with 300 mg of SiO2 beads and activated using 100 cm3/min H2 at 350°C for 1 h. Next, the temperature was cooled to 300°C, and the gas was changed to a mixture containing 37.9% H2O, 6.6% CH2O (balance N2) at P = 1 atm, GHSV = 89,000 Ncm3/h/gcat. The products were analyzed by using an SRI 8610 GC (SRI Instruments, Torrance, CA 90503, USA) equipped with by molecular sieve and silica. Additionally, the SRI 8610 GC contains a TCD, methanizer, and flame ionization detector.

4. Conclusions

The reactivity of formaldehyde during steam reforming was investigated using undoped and Na-doped Pt/m-ZrO2 catalysts; the weight percentages of Na used were 0.5%Na, 1%Na, 1.8%Na, 2.5%Na, and 5%Na. By carrying out temperature-stepped reaction of adsorbed formaldehyde using steam, DRIFTS experiments showed that formaldehyde, adsorbed at reduced defect sites on zirconia, rapidly converts to formate species by reacting with mobile Type II OH species. The formate species reached a maximum surface concentration at 125–175 °C. Above 175 °C, the reactivity of surface formate decomposition was dependent on Na loading. Optimal loadings of 1.8%Na and 2.5%Na allowed formate to decompose to near completion by 200 °C. Na addition increases the basicity of the catalyst surface. This was verified by CO2 temperature programmed desorption experiments, where Na addition resulted in upward shifts in CO2 desorption temperature. Furthermore, increased basicity by Na addition was further confirmed by analyzing the splitting between the formate νasym(OCO) and νsym(OCO) bands, where Na addition resulted in significant increases. Stronger basicity results in a greater interaction between the -CO2 functional group of formate and the catalyst surface, and this in turn weakens the formate C-H bond, promoting dehydrogenation. In agreement with this, a pronounced shift in the ν(CH) band of formate to lower wavenumbers was observed after doping the catalyst with Na, and the greatest shifts were found at and above loadings of 1.8%Na. In situ DRIFTS and temperature-programmed reaction/mass spectrometry experiments of the steam reforming of formaldehyde showed that Na doping promotes the decarboxylation and dehydrogenation decomposition pathway of formate. This was confirmed by fixed bed reaction tests, where Na addition of 2.5% increased the CO2 selectivity from 83.5% to 99.5%. Moreover, higher conversion could be reached at lower temperature in comparison with the catalytic testing results of NiO catalysts reported in the open literature. At a loading of 5%Na, Na significantly blocked Pt0 sites; this tended to hinder H-transfer. As such, the decomposition rate of the formate intermediate was slower in comparison to the rates obtained at optimum loadings of 1.8%Na and 2.5%Na. At conversions greater than 80%, the catalysts were stable for 6.5 h. DRIFTS of steady state formaldehyde steam reforming showed that the structure of Pt did not change significantly. TPO results suggest that little coking occurred over testing period.

Supplementary Materials

The following supporting information can be downloaded at: https://www.mdpi.com/article/10.3390/catal12111294/s1, Figure S1: TPR-MS profiles of catalysts.

Author Contributions

Reaction testing, characterization, formal analysis, conceptualization, writing, M.M. Catalyst preparation, catalyst characterization, formal analysis, writing, E.S.G., Z.R. and C.D.W. Catalyst preparation, supervision, resources, D.C.C. Catalyst characterization, data curation, resources, supervision, A.J.K. Conceptualization, catalyst preparation, catalyst characterization, formal analysis, writing, resources, supervision, G.J. All authors have read and agreed to the published version of the manuscript.

Funding

Argonne’s research was supported in part by the U.S. Department of Energy (DOE), Office of Fossil Energy, National Energy Technology Laboratory (NETL). Advanced photon source was supported by the U.S. Department of Energy, Office of Science, Office of Basic Energy Sciences, under contract number DE-AC02-06CH11357. MRCAT operations are supported by the Department of Energy and the MRCAT member institutions. CAER research was supported by the Commonwealth of Kentucky.

Acknowledgments

Gary Jacobs would like to thank UTSA and the State of Texas for financial support through startup funds.

Conflicts of Interest

The authors declare no conflict of interest.

References

  1. Anil, S.; Indraja, S.; Singh, R.; Appari, S.; Roy, B. A review on ethanol steam reforming for hydrogen production over Ni/Al2O3 and Ni/CeO2 based catalyst powders. Int. J. Hydrog. Energy 2022, 47, 8177–8213. [Google Scholar] [CrossRef]
  2. Ogo, S.; Sekine, Y. Recent progress in ethanol steam reforming using non-noble transition metal catalysts: A review. Fuel Proc. Tech. 2020, 199, 106238. [Google Scholar] [CrossRef]
  3. Bac, S.; Keskin, S.; Avci, A.K. Recent advances in materials for high purity H2 production by ethanol and glycerol steam reforming. Int. J. Hydrog. Energy 2020, 45, 34888–34917. [Google Scholar] [CrossRef]
  4. Bepari, S.; Kuila, D. Steam reforming of methanol, ethanol and glycerol over nickel-based catalyst: A review. Int. J. Hydrog. Energy 2020, 45, 18090–18113. [Google Scholar] [CrossRef]
  5. Mattos, L.V.; Jacobs, G.; Davis, B.H.; Noronha, F.B. Production of hydrogen from ethanol: Review of reaction mechanism and catalyst deactivation. Chem. Rev. 2012, 112, 4094–4123. [Google Scholar] [CrossRef] [PubMed]
  6. Sharma, Y.C.; Kumar, A.; Prasad, R.; Upadhyay, S.N. Ethanol steam reforming for hydrogen production: Latest and effective catalyst modification strategies to minimize carbonaceous deactivation. Renew. Sust. Energy Rev. 2017, 74, 89–103. [Google Scholar] [CrossRef]
  7. Iulianelli, A.; Ribeirinha, P.; Mendes, A.; Basile, A. Methanol steam reforming for hydrogen generation via conventional and membrane reactors: A review. Renew. Sust. Energy Rev. 2014, 29, 355–368. [Google Scholar] [CrossRef] [Green Version]
  8. Palo, D.R.; Dagle, R.A.; Holladay, J.D. Methanol steam reforming for hydrogen production. Chem. Rev. 2007, 107, 3992–4021. [Google Scholar] [CrossRef]
  9. Jacobs, G.; Davis, B.H. In situ DRIFTS investigation of the steam reforming of methanol over Pt/ceria. Appl. Catal. A Gen. 2005, 285, 43–49. [Google Scholar] [CrossRef]
  10. Charisiou, N.D.; Polychronopoulou, K.; Asif, A.; Goula, M.A. The potential of glycerol and phenol towards H2 production using steam reforming reaction: A review. Surf. Coat. Tech. 2018, 352, 92–111. [Google Scholar] [CrossRef]
  11. Charisiou, N.D.; Siakavelas, G.; Tzounis, L.; Dou, B.; Sebastian, V.; Hinder, S.J.; Baker, M.A.; Polychronopoulou, K.; Goula, M.A. Ni/Y2O3–ZrO2 catalyst for hydrogen production through the glycerol steam reforming reaction. Int. J. Hydrogen Energy 2020, 45, 10442–10460. [Google Scholar] [CrossRef]
  12. Martinelli, M.; Jacobs, G.; Shafer, W.D.; Davis, B.H. Effect of alkali on C-H bond scission over Pt/YSZ catalyst during water-gas shift, steam-assisted formic acid decomposition and methanol steam reforming. Catal. Today 2017, 291, 29–35. [Google Scholar] [CrossRef]
  13. Chu, L.; Gu, S.; Jin, Q.; Zhu, P.; Shen, Y.; Li, P. Hydrogen production from formaldehyde steam reforming using recyclable NiO/NaF catalyst. Int. J. Hydrog. Energy 2020, 45, 28752–28763. [Google Scholar] [CrossRef]
  14. Chu, L.; Shen, Y. Hydrogen production from formaldehyde steam reforming using recyclable NiO/NaCl catalyst. Appl. Surf. Sci. 2020, 532, 147376. [Google Scholar] [CrossRef]
  15. Lorenz, H.; Friedrich, M.; Armbruester, M.; Kloetzer, B.; Penner, S. ZnO is a CO2-selective steam reforming catalyst. J. Catal. 2013, 297, 151–154. [Google Scholar] [CrossRef] [PubMed] [Green Version]
  16. Bielz, T.; Lorenz, H.; Amann, P.; Klotzer, B.; Penner, S. Water-gas shift and formaldehyde reforming activity determined by defect chemistry of polycrystalline In2O3. J. Phys. Chem. 2011, 115, 6622–6628. [Google Scholar] [CrossRef]
  17. Jin, Q.; Wang, A.; Lu, B.; Xu, X.; Shen, Y.; Zeng, Y. Steam reforming of formaldehyde for generating hydrogen and coproducing carbon nanotube for enhances photosynthesis. Catal. Sci. Tech. 2020, 10, 4436–4447. [Google Scholar] [CrossRef]
  18. Jin, Q.; Shen, Y.; Cai, Y.; Chu, L.; Zeng, Y. Resource utilization of waste V2O5-based deNOX catalysts for hydrogen production from formaldehyde and water via steam reforming. J. Hazard. Mat. 2020, 381, 120934. [Google Scholar] [CrossRef]
  19. Li, X.; Lim, K.H. DFT studies of steam reforming of formaldehyde on Cu, PdZn and Ir. ChemCatChem 2012, 4, 1311–1320. [Google Scholar] [CrossRef]
  20. Bo, J.-Y.; Zhang, S.; Lim, K.H. Steam reforming of formaldehyde on Cu(100) surface: A density functional study. Catal. Lett. 2009, 129, 444–448. [Google Scholar] [CrossRef]
  21. Lim, K.H.; Chen, Z.-X.; Neyman, K.M.; Roesch, N. Comparative theoretical study of formaldehyde decomposition on PdZn, Cu, and Pd Surfaces. J. Phys. Chem. B 2006, 110, 14890–14897. [Google Scholar] [CrossRef] [PubMed]
  22. Chenu, E.; Jacobs, G.; Crawford, A.C.; Keogh, R.A.; Patterson, P.M.; Sparks, D.E.; Davis, B.H. Water-gas Shift: An examination of unpromoted and Pt promoted MgO and tetragonal and monoclinic ZrO2 by in-situ DRIFTS. Appl. Catal. B Environ. 2005, 59, 45–56. [Google Scholar] [CrossRef]
  23. Azzam, K.G.; Babich, I.V.; Seshan, K.; Lefferts, L. Bifunctional catalysts for single-stage water-gas shift reaction in fuel cell applications. J. Catal. 2007, 251, 153–162. [Google Scholar] [CrossRef]
  24. Petallidou, K.C.; Kalamaras, C.M.; Efstathiou, A.M. The effect of La3+, Ti4+ and Zr4+ dopants on the mechanism of WGS on ceria-doped supported Pt catalysts. Catal. Today 2014, 228, 183–193. [Google Scholar] [CrossRef]
  25. Martinelli, M.; Jacobs, G.; Graham, U.M.; Shafer, W.D.; Cronauer, D.C.; Kropf, A.J.; Marshall, C.L.; Khalid, S.; Visconti, C.G.; Lietti, L.; et al. Water-gas shift: Characterization and testing of nanoscale YSZ supported Pt catalysts. Appl. Catal. A Gen. 2015, 497, 184–197. [Google Scholar] [CrossRef] [Green Version]
  26. Martinelli, M.; Jacobs, G.; Graham, U.M.; Davis, B.H. Methanol steam reforming: Na doping of Pt/YSZ provides fine tuning of selectivity. Catalysts 2017, 7, 148. [Google Scholar] [CrossRef] [Green Version]
  27. Pigos, J.M.; Brooks, C.J.; Jacobs, G.; Davis, B.H. Low temperature water-gas shift: Assessing formates as potential intermediates over Pt/ZrO2 and Na doped Pt/ZrO2 catalysts employing the SSITKA-DRIFTS technique. In Advances in Fischer-Tropsch Synthesis, Catalysts and Catalysis; CRC Press, Taylor & Francis Group: Boca Raton, FL, USA, 2010; Chapter 19; pp. 365–394. [Google Scholar] [CrossRef]
  28. Pigos, J.M.; Brooks, C.J.; Jacobs, G.; Davis, B.H. Low temperature water-gas shift: Characterization of Pt-based ZrO2 catalyst promoted with Na discovered by combinatorial methods. Appl. Catal. A General 2007, 319, 47–57. [Google Scholar] [CrossRef]
  29. Martinelli, M.; Alhraki, N.; Castro, J.D.; Matamoros, M.E.; Jacobs, G. Effect of Na loading on Pt/ZrO2 catalysts for low temperature water-gas shift for the production and purification of hydrogen. In New Dimensions in Production and Utilization of Hydrogen; Nanda, S., Vo, D.-V., Tri, P.N., Eds.; Elsevier Books: Amsterdam, The Netherlands, 2020; Chapter 6; pp. 143–160. ISBN 9780128195536. [Google Scholar]
  30. Shido, T.; Iwasawa, Y. Reactant-promoted reaction mechanism for water-gas shift reaction on Rh-doped CeO2. J. Catal. 1993, 141, 71–81. [Google Scholar] [CrossRef]
  31. Martinelli, M.; Castro, J.D.; Alhraki, N.; Matamoros, M.E.; Kropf, A.J.; Cronauer, D.C.; Jacobs, G. Effect of sodium loading on Pt/ZrO2 during ethanol steam reforming. Appl. Catal. A General 2021, 610, 117947. [Google Scholar] [CrossRef]
  32. Martinelli, M.; Watson, C.D.; Jacobs, G. Sodium doping of Pt/m-ZrO2 promotes C-C scission and decarboxylation during ethanol steam reforming. Internat. J. Hydrogen Energy 2020, 45, 18490–18501. [Google Scholar] [CrossRef]
  33. Binet, C.; Daturi, M.; Lavalley, J.-C. IR study of polycrystalline ceria properties in oxidised and reduced states. Catal. Today 1999, 50, 207–225. [Google Scholar] [CrossRef]
  34. Zhu, X.; Xie, Y.; Liu, C.-J.; Zhang, Y.-P. Stability of Pt particles on ZrO2 support during partial oxidation of methane: DRIFT studies of adsorbed CO. J. Molec. Catal. A 2008, 282, 67–73. [Google Scholar] [CrossRef]
  35. Jongpatiwuta, S.; Trakarnroek, S.; Rirksomboon, T.; Osuwan, S.; Resasco, D.E. n-Octane aromatization on Pt-containing non-acidic large pore zeolite catalysts. Catal. Lett. 2005, 100, 7–15. [Google Scholar] [CrossRef]
Figure 1. TEM image for (top) 2%Pt/m-ZrO2 and (bottom) 2.5%Na-2%Pt/m-ZrO2.
Catalysts 12 01294 g001
Figure 2. DRIFTS of steam reforming of formaldehyde over 2%Pt/m-ZrO2.
Catalysts 12 01294 g002
Figure 3. DRIFTS of steam reforming of formaldehyde over 0.5%Na-2%Pt/m-ZrO2.
Catalysts 12 01294 g003
Figure 4. DRIFTS of steam reforming of formaldehyde over 1%Na-2%Pt/m-ZrO2.
Catalysts 12 01294 g004
Figure 5. DRIFTS of steam reforming of formaldehyde over 1.8%Na-2%Pt/m-ZrO2.
Catalysts 12 01294 g005
Figure 6. DRIFTS of steam reforming of formaldehyde over 2.5%Na-2%Pt/m-ZrO2.
Catalysts 12 01294 g006
Figure 7. DRIFTS of steam reforming of formaldehyde over 5%Na-2%Pt/m-ZrO2.
Catalysts 12 01294 g007
Scheme 1. Proposed mechanism for steam reforming of formaldehyde.
Catalysts 12 01294 sch001
Scheme 2. Increased basicity of the catalyst surface by Na+ addition strengthens the interaction between the surface and the -CO2 functional group of formate, weakening the C-H bond.
Catalysts 12 01294 sch002
Figure 8. ν(CH) stretching region of DRIFTS of steam reforming of adsorbed formaldehyde at 100 °C for (a) 2%Pt/m-ZrO2, and the same with (b) 0.5%Na, (c) 1%Na, (d) 1.8%Na, (e) 2.5%Na, and (f) 5%Na.
Catalysts 12 01294 g008
Figure 9. ν(CO) stretching region of Pt carbonyls in DRIFTS of steam reforming of adsorbed formaldehyde at 150 °C for (a) 2%Pt/m-ZrO2, and the same with (b) 0.5%Na, (c) 1%Na, (d) 1.8%Na, (e) 2.5%Na, and (f) 5%Na. Using the unpromoted catalyst as a reference, the ratio of promoted/unpromoted areas follows the trend: (a) 100% (reference), (b) 104%, (c) 97%, (d) 93%, (e) 64%, (f) 1%.
Catalysts 12 01294 g009
Figure 10. TP-reaction-MS of adsorbed formaldehyde/H2O, including (a) 2%Pt/m-ZrO2, and the same with (b) 0.5%Na, (c) 1%Na, (d) 1.8%Na, (e) 2.5%Na, and (f) 5%Na.
Catalysts 12 01294 g010
Figure 11. CO2 TPD profiles for (a) 2%Pt/m-ZrO2, and the same catalyst with (b) 0.5%Na, (c) 1%Na, (d) 1.8%Na, (e) 2.5%Na, and (f) 5%Na. Maxima (green) < 250 °C, (blue) 250–400 °C, (red) > 400 °C.
Catalysts 12 01294 g011
Figure 12. (left) CH2O conversion and (right) COx selectivity, including (filled) CO selectivity and (unfilled) CO2 selectivity for (circles) 2%Pt/m-ZrO2 and (squares) 2.5%Na-2%Pt/m-ZrO2 catalysts.
Catalysts 12 01294 g012
Figure 13. In situ DRIFTS of steady state formaldehyde steam reforming at 300 °C for (a) 2%Pt/m-ZrO2, and the same catalyst with (b) 2.5%Na. Conditions: 50 ccm, 4.5%H2O, 0.72%CH2O, balance He.
Catalysts 12 01294 g013
Figure 14. Temperature programmed oxidation after 6 h of time on-stream (in situ DRIFTS) of (black) 2%Pt/m-ZrO2 and (red) 2.5%Na-2%Pt/m-ZrO2, including (bottom) TCD signal, (middle) H2O MS signal, and (top) CO2 MS signal.
Catalysts 12 01294 g014
Table 1. Summary of prior characterization by BET, BJH, EXAFS, DRIFTS, TPD of CO2, and XANES from [31] unless otherwise noted.
SampleExpected As
(m2/g)
Actual As (BET)
(m2/g)
Vp (BJH Des)
(cm3/g)
Dp (BJH Des)
(Å)
Pt0 Size from EXAFS
(nm)
Expected
%Pt Disp.
Formate
ν(CH)
CO Ads.
(cm−1)
Formate Decomp.
T (°C)
TP-rxn **
XANES
% of Pt L3 Minus L2 Area Rel. to No Na
ZrO2106.6106.60.32496-----
2%Pt/m-ZrO2104.195.10.279930.84932868,
2863, 2848
304100
Pt/ZrO2 with
0.5%Na100.8–102.994.20.269930.8792(2868, 2856), 2845275108
1.0%Na97.5–101.794.10.272940.92902869, 2862, 2847(wk 190), 287115
1.8%Na92.1–99.771.80.232940.88 *91 *(2850), 2833, 2800-156 *
2.5%Na87.5–98.066.40.216970.91912802190, 270135
5.0%Na70.9–91.846.10.1581020.86862803(wk 212), 280180
* new batch using the same preparation method. ** this column of data corresponds to earlier batches prepared using the same preparation method [29].
Table 2. Formate ν(CH) band region at the maximum intensity (125–175 °C) and other relevant vibrational positions during temperature stepped formaldehyde/H2O reaction using the assignments of Binet et al. [33]. Carbonate band positions were recorded at 300 °C.
CatalystBand Position (cm−1)Δ(OCO)
Formate
(cm−1)
ν(CH)δ(CH) + νsym(OCO)2δ(CH)ν(OCO) Formateν(OCO) Carbonate% of Formate Band Area at 200 °C Relative to Maximum Area
(3050–2500 cm−1)
2%Pt/ZrO2 (reference)2850, 28682968, 2934(2758), 2731sy 1377, 1359, 1317
asy 1576
1745, 1553, 1436, 1350, 1138–1025
199

27
0.5%Na-2%Pt/ZrO22849 (2862)(2971), 29392733
(2702)
sy, 1379, 1359, 1322
asy 1632, 1586
(1745), 1644, (1595–1460), 1441, 1341, (1309), 1268, 1060
253

94
1%Na-2%Pt/ZrO22851,
2803
(2969), 29412733
(2625)
sy 1377, 1367, 1321
asy 1648, 1605, 1508
(1745), 1650, (1591, 1531), 1354, 1299, 1272, 1069
271

33
1.8%Na-2%Pt/ZrO22838,
2802
2956(2735),
2704, 2625
sy (1430–1382), 1371, (1340–1268)
asy 1655, (1634–1550)
(1780, 1745), 1659, 1591, (1555–1460), 1382, 1315, 1294, 1079
284

15
2.5%Na-2%Pt/ZrO2(2851)
2803
2954(2735),
2705,
(2661–2538)
sy 1361
asy 1609
(1745) 1625, 1335, 1064
248

17
5%Na-2%Pt/ZrO22805
(2784)
2955(2737)
2708, 2685
sy (1366–1423), 1360, 1348
asy (1651, 1642), 1632, (1605, 1557–1475)
(1772, 1745), 1625, 1590, 1565, (1540), 1447, 1339, 1070
272

78
Table 3. Results of fitting CO2 TPD profiles with Gaussian peaks. Gaussian peak area percentages having maxima within various temperature ranges are shown.
Catalyst%
T < 250 °C
%
250 °C < T < 400 °C
%
T > 400 °C
2%Pt/m-ZrO2543412
0.5%Na-2%Pt/m-ZrO2483716
1%Na-2%Pt/m-ZrO2512920
1.8%Na-2%Pt/m-ZrO2374419
2.5%Na-2%Pt/m-ZrO2333730
5%Na-2%Pt/m-ZrO2235026
Publisher’s Note: MDPI stays neutral with regard to jurisdictional claims in published maps and institutional affiliations.

