Article

Catalytic Oxidative Decomposition of Dimethyl Methyl Phosphonate over CuO/CeO2 Catalysts Prepared Using a Secondary Alkaline Hydrothermal Method

1
Key Laboratory of Superlight Materials and Surface Technology, Ministry of Education, College of Material Sciences and Chemical Engineering, Harbin Engineering University, Harbin 150001, China
2
State Key Laboratory of NBC Protection for Civilian, Beijing 102205, China
3
Key Laboratory of Polyoxometalate Science of Ministry of Education, Northeast Normal University, Changchun 130024, China
*
Authors to whom correspondence should be addressed.
These authors contributed equally to this work.
Catalysts 2022, 12(10), 1277; https://doi.org/10.3390/catal12101277
Submission received: 30 August 2022 / Revised: 12 October 2022 / Accepted: 16 October 2022 / Published: 19 October 2022

Abstract

:
Bimetallic synergism plays an important role in lattice-doped catalysts. Therefore, lattice-doped bimetallic CuO/CeO2 catalysts were prepared by secondary alkaline hydrothermal reaction. During this process, the CeO2 nanomaterials were partially dissolved and recrystallized; thus, Cu ions were doped into the CeO2 lattice. The physical and chemical properties of CeO2, CuO/CeO2, and CuO were investigated. H2 temperature-programmed reduction characterization showed that the oxidation activity of CuO/CeO2 was significantly improved. X-ray photoelectron spectroscopy results showed that electron transfer occurred between Ce and Cu in the CuO/CeO2 catalyst. Additionally, Raman characterization confirmed the strong interaction between Cu and Ce. After CuO was loaded, the thermal catalytic decomposition performance of the catalyst was significantly improved with respect to the sarin simulant dimethyl methyl phosphonate (DMMP); with an increase in the Cu/Ce ratio, the performance first strengthened and then weakened. Additionally, the reaction tail gas and catalyst surface products were analyzed using mass spectrometry and ion chromatography, and the changes in the surface products during the thermal catalytic decomposition of DMMP were characterized at different temperatures using in situ diffuse reflectance infrared Fourier transform spectroscopy. Finally, the catalytic reaction pathways of DMMP on CeO2, CuO/CeO2, and CuO were inferred. The study results not only demonstrate an effective catalyst for the removal of nerve agent but also a feasible preparation method for lattice-doped bimetallic catalysts in the field of environmental protection.

1. Introduction

The threat posed by chemical warfare agents (CWAs) in terrorist incidents, wars, and conflicts has not yet been addressed. Research on the degradation of CWAs is crucial for human health and national security [1]. Traditional and currently used protection methods involve adsorption through carbon-based materials. However, the adsorption capacity of carbon-based materials is limited, and weak adsorption can lead to secondary pollution [2,3]. Recent studies have shown that the catalytic oxidation and decomposition of CWAs by metal oxides is an effective method, with the advantage of destroying the molecular structure of CWAs and generating low-toxicity or non-toxic products [4,5,6,7,8]. From the perspective of CWAs treatment, protection time, which specifically refers to the time required for complete conversion of CWAs, is an important parameter for evaluating catalyst performance [9].
Sarin, a typical nerve CWA, has been repeatedly used in military conflicts and terrorist attacks, causing massive casualties of troops and innocent civilians [2]. Therefore, it is significant to study the catalytic degradation of sarin. Sarin is an organic phosphate ester. The chemical structure of sarin is shown in Figure 1a. Its poisoning mechanism involves the combination of organophosphate ester with the acetylcholinesterase (AchE) to form a stable phosphoryl cholinesterase, which inhibits the activity of the enzyme and paralyzes the nervous system [1,10]. The poisoning mechanism of sarin is similar to that of organophosphorus pesticides. Dimethyl methyl phosphonate (DMMP) is often used as a simulant for organophosphorus pesticides [11]. Owing to its similar molecular structure (Figure 1b), low toxicity, and similar poisoning mechanism, DMMP is also frequently used as a simulant for sarin [12,13,14].
Metal oxides, such as Al2O3 [15], MgO [16], Y2O3 [7], TiO2 [17], Fe2O3 [18], CuO [19,20], CeO2 [21,22], and others, have a good P-OCH3 bond-breaking ability and are widely used for DMMP decomposition. The decomposition products of DMMP on monovalent metal oxides include methanol, dimethyl ether, and methylphosphonic acid, whereas the products on variable metal oxides can be further oxidized to CO, CO2, and POX. The main reason for this is that the redox couple of the metal ions in the reaction can provide a low-energy reaction path for the oxidation reaction.
Variable-valence CeO2 has an excellent oxygen storage/release capacity and can be reversibly changed between Ce3+ and Ce4+, accompanied by the generation and elimination of oxygen vacancies, making it widely applicable in heterogeneous catalysis [23]. Chen et al. reported that DMMP completely decomposed on ceria films using vacuum heating, forming products of methanol, formaldehyde, CO, and H2 [21]. Li et al. studied the interaction of DMMP with CeO2 on different surfaces using density functional theory [22]. Loading transition metal oxides onto CeO2 nanomaterials is an effective method to further improve the catalytic activity of the catalysts. CuO/CeO2 is one of the most widely studied two-component, non-noble metal catalysts, and the strong interaction between CuO and CeO2 promotes electron transfer between Cu and Ce, as well as oxygen migration in CeO2. Presently, CuO/CeO2 catalysts are commonly used in CO oxidation and hydrogenation reactions, VOC degradation, water gas shift reactions, and CO2 hydrogenation reactions [24,25,26,27,28]. However, CuO/CeO2 catalysts have not yet been studied for the catalytic oxidation of DMMP. Therefore, the performance and reaction mechanism of the CuO/CeO2 catalyst for the thermal catalytic decomposition of DMMP were comprehensively investigated in this study.
Traditional preparation methods for CuO/CeO2 include the one-time hydrothermal, impregnation, and deposition precipitation methods [29,30,31,32]. George et al. prepared a CuO/CeO2 catalyst using ammonia solution and acid solution post-synthesis modification methods and reported significantly improved catalytic CO activity [33,34]. Zhou et al. prepared highly dispersed CuO/CeO2 catalysts using a secondary solvothermal method (ethanol as the solvent) to mix a CeO2 support with Cu(NO3)2 dissolved in an ethanol solution, then dried and calcined it after the reaction [35]. Inspired by the above method, solid CeO2 was mixed with a Cu(NO3)2 solution, and a given concentration of NaOH solution was added for the secondary alkaline hydrothermal method. The addition of NaOH resulted in the dissolution and recrystallization of CeO2 during the reaction. During this process, Cu was doped into the CeO2 lattice, which increased the interaction between Cu and Ce, promoted electron transfer between Cu and Ce, and formed a Cu-V-Ce (V is donated as oxygen vacancy) structure. Thus, the performance of the CuO/CeO2 catalyst further improved.
The traditional impregnation and deposition precipitation methods have low utilization rates of raw materials, and when the loading amount increased, serious agglomeration occurs. In our study, high-loading and uniform-distribution CuO were prepared using the secondary alkaline hydrothermal method. This method is characterized by a high utilization rate of raw materials. According to the ICP results obtained in the present study, the theoretical loading of CuO is comparable to actual loading.
In this study, three types of CeO2, CuO/CeO2, and CuO catalysts were prepared. First, a CeO2 support was prepared using a hydrothermal method. Secondly, CuO/CeO2 catalysts with varying Cu/Ce ratios were prepared using the CeO2 support mixed with Cu(NO3)2 solution and NaOH solution by the alkaline hydrothermal method. In order to study the changes in physicochemical properties and catalytic performance after CeO2-supported CuO, CuO was also prepared by a hydrothermal method for comparison. The structure was characterized using X-ray diffraction (XRD) and transmission electron microscopy (TEM). The surface elemental distribution, redox properties, and surface intermediate products were analyzed using X-ray photoelectron spectroscopy (XPS), H2-temperature-programmed reduction (H2-TPR), O2-temperature-programmed desorption (O2-TPD), and in situ diffuse reflectance infrared Fourier transform spectroscopy (in situ DRIFTS). The reaction path was deduced for the thermal decomposition of DMMP on the catalyst. In this study, CuO/CeO2 catalysts with high loading and uniform distribution were synthesized, and the initial morphology of CuO was not changed. The dissolution and recrystallization of CeO2 in the alkali–thermal process promoted the doping of Cu into the CeO2 lattice, and bimetallic synergism enhanced the catalytic performance. The results of this study provide a reference for the design and optimization of CWA decomposition catalysts.

2. Results and Discussion

2.1. Characteristics of CuO/CeO2 Catalysts

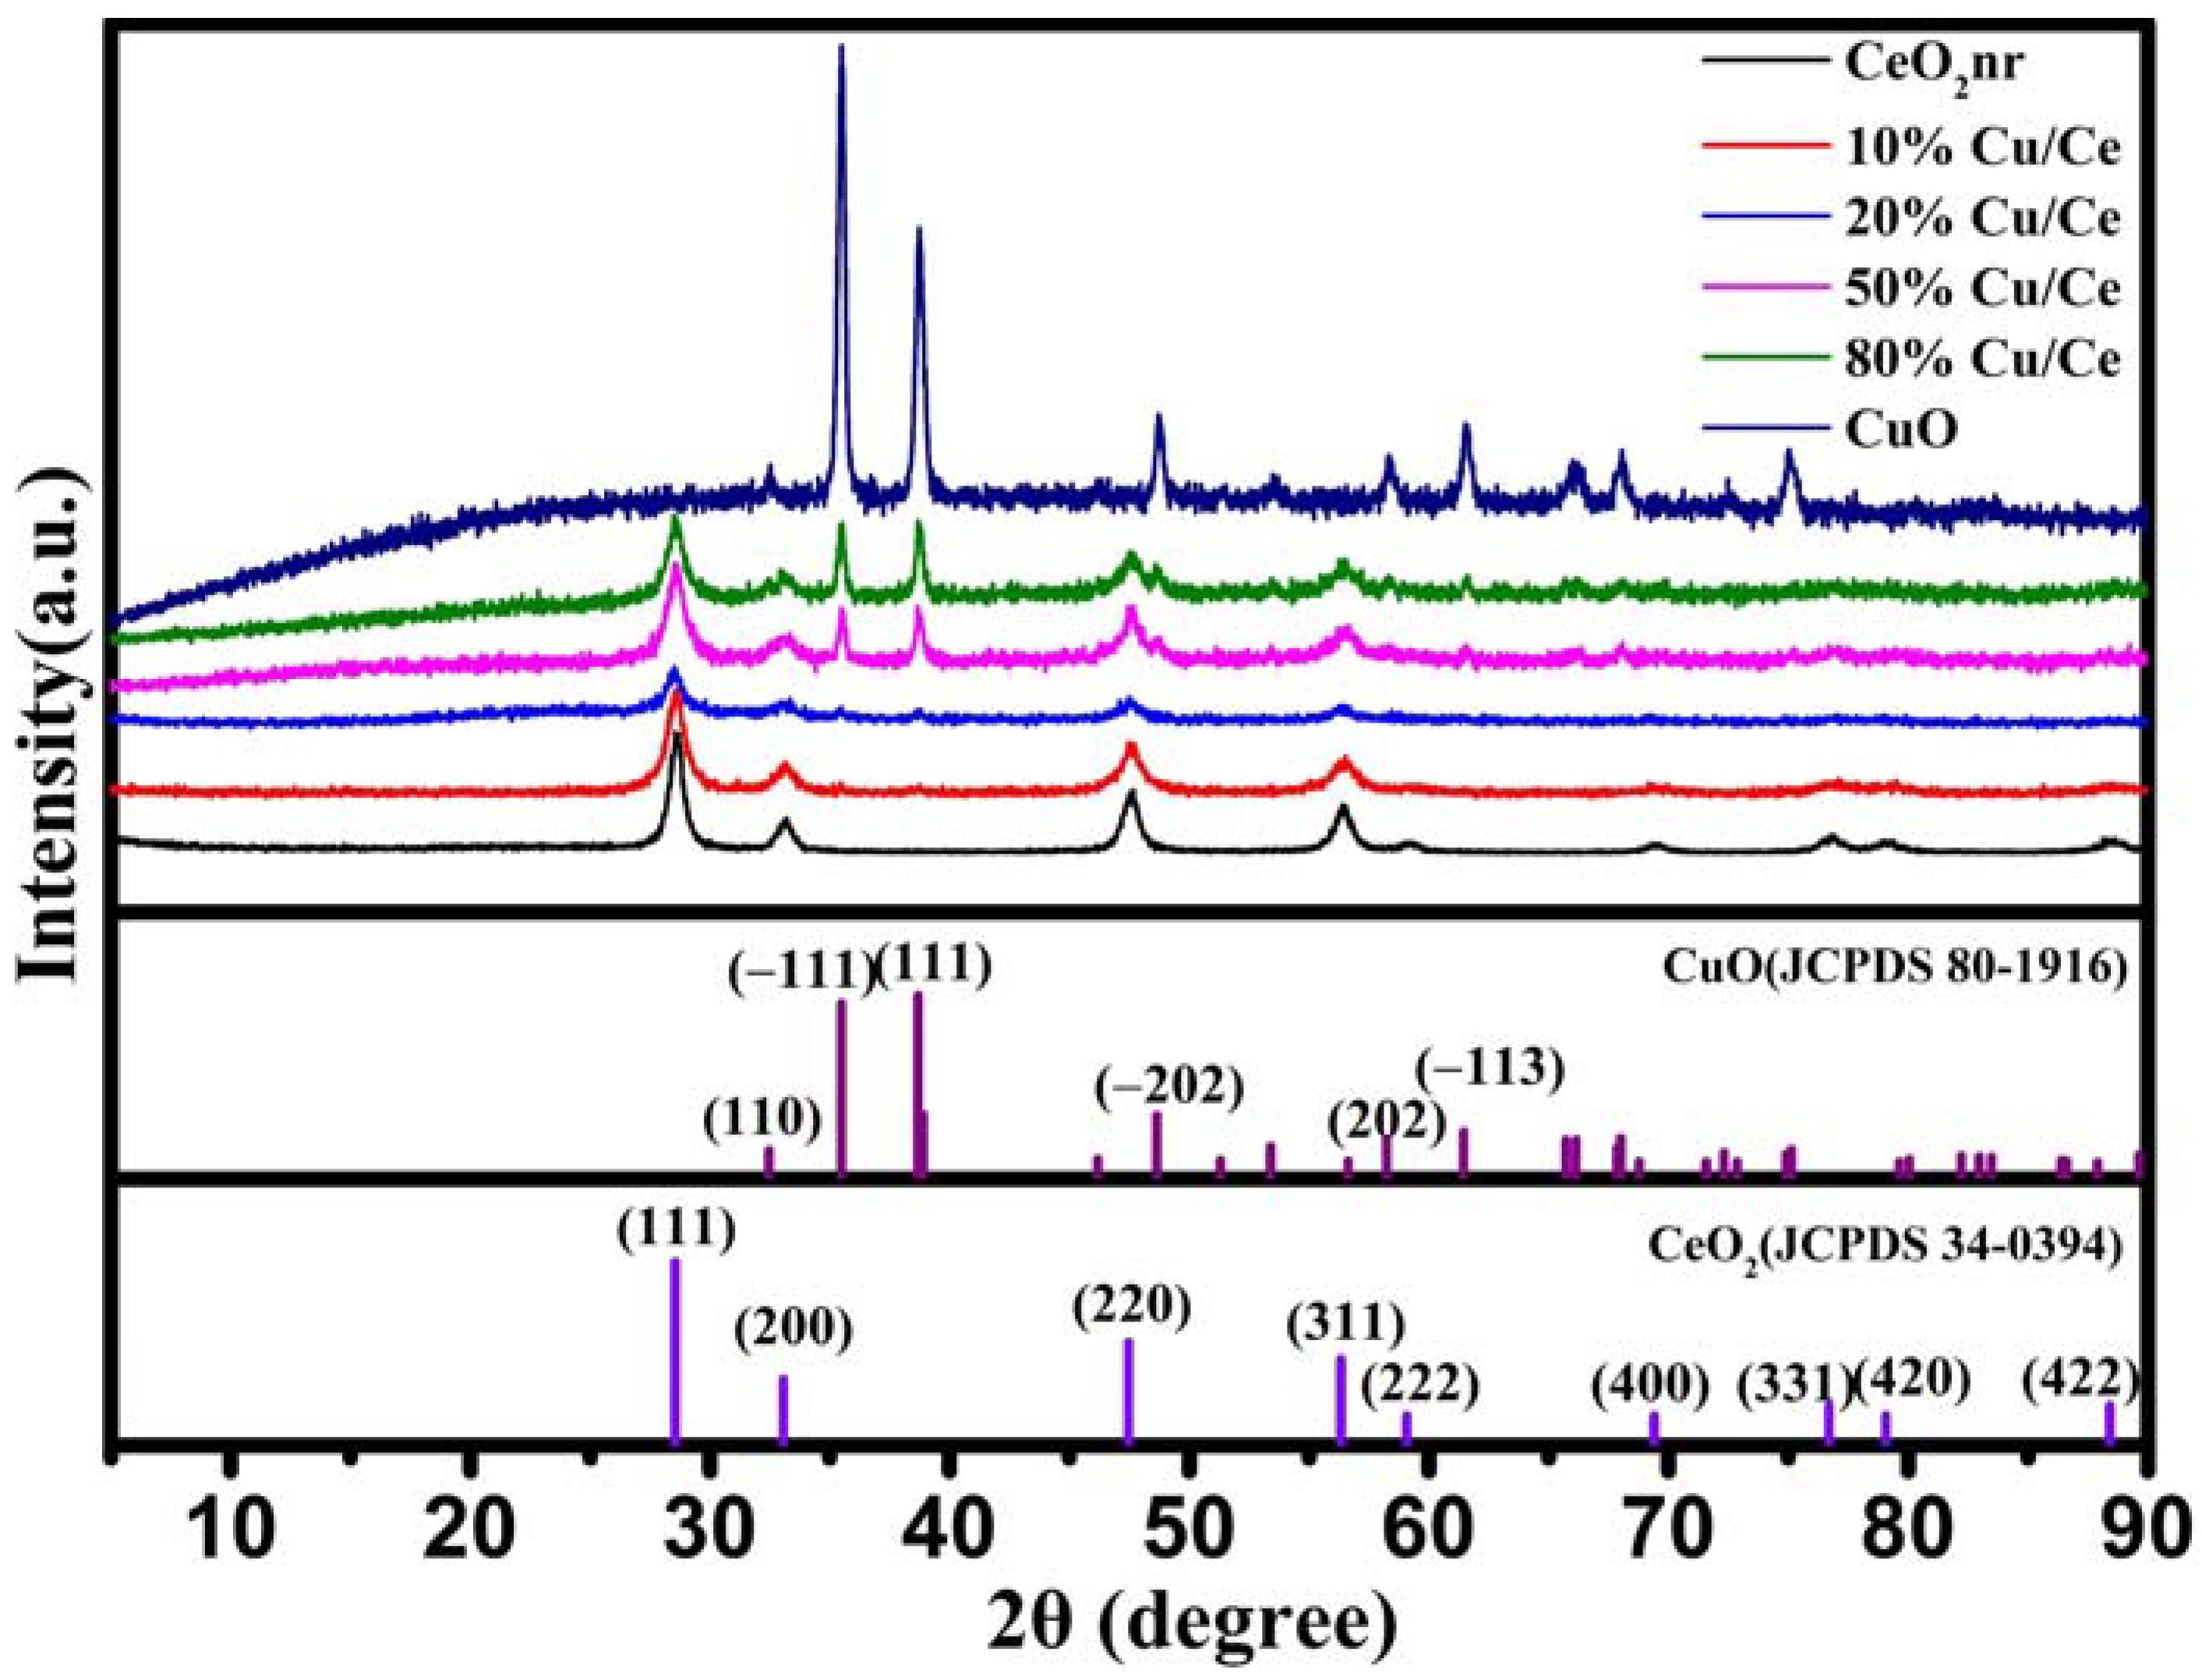
The as-prepared materials were characterized using XRD to identify crystal phases (Figure 2). The Figure 2 shows that the CeO2 and CuO diffraction patterns match the characteristic peaks of the fluorite structure of CeO2 (JCPDS 34-0394) and the monoclinic structure of CuO (JCPDS 80-1916), respectively. The intensity of the CuO diffraction peaks gradually increased with increased Cu/Ce ratio, and some CeO2 diffraction peaks disappeared. When the Cu/Ce ratio was 10%, weak diffraction peaks appeared at 36.49° and 38.68°, corresponding to the (−111) and (111) crystal planes of the CuO diffraction peaks, respectively. This phenomenon may have been caused by the low loading of CuO. When the Cu/Ce ratio was 50%, the intensities of the diffraction peaks of the (−111) and (111) crystal planes increased, and new diffraction peaks appeared at 48.6° and 61.6°, corresponding to the (−202) and (−113) crystal planes of CuO, respectively. The crystalline size of the catalyst was calculated using the Scherrer equation, as shown in Table 1. Owing to the smaller Cu diffraction peaks in 10%Cu/Ce and 20%Cu/Ce, the crystalline size of CuO could not be calculated. Table 1 shows that the grain sizes of CeO2 and CuO prepared using the secondary alkaline method did not change significantly.
The actual ratio of Cu/Ce determined by ICP-OES was higher than the theoretically calculated value (Table 1), indicating that CeO2 was partially dissolved in the secondary alkaline hydrothermal environment. The specific surface area (SBET) of the samples was determined using the N2 adsorption–desorption method. As shown in Table 1, the SBET of the CuO/CeO
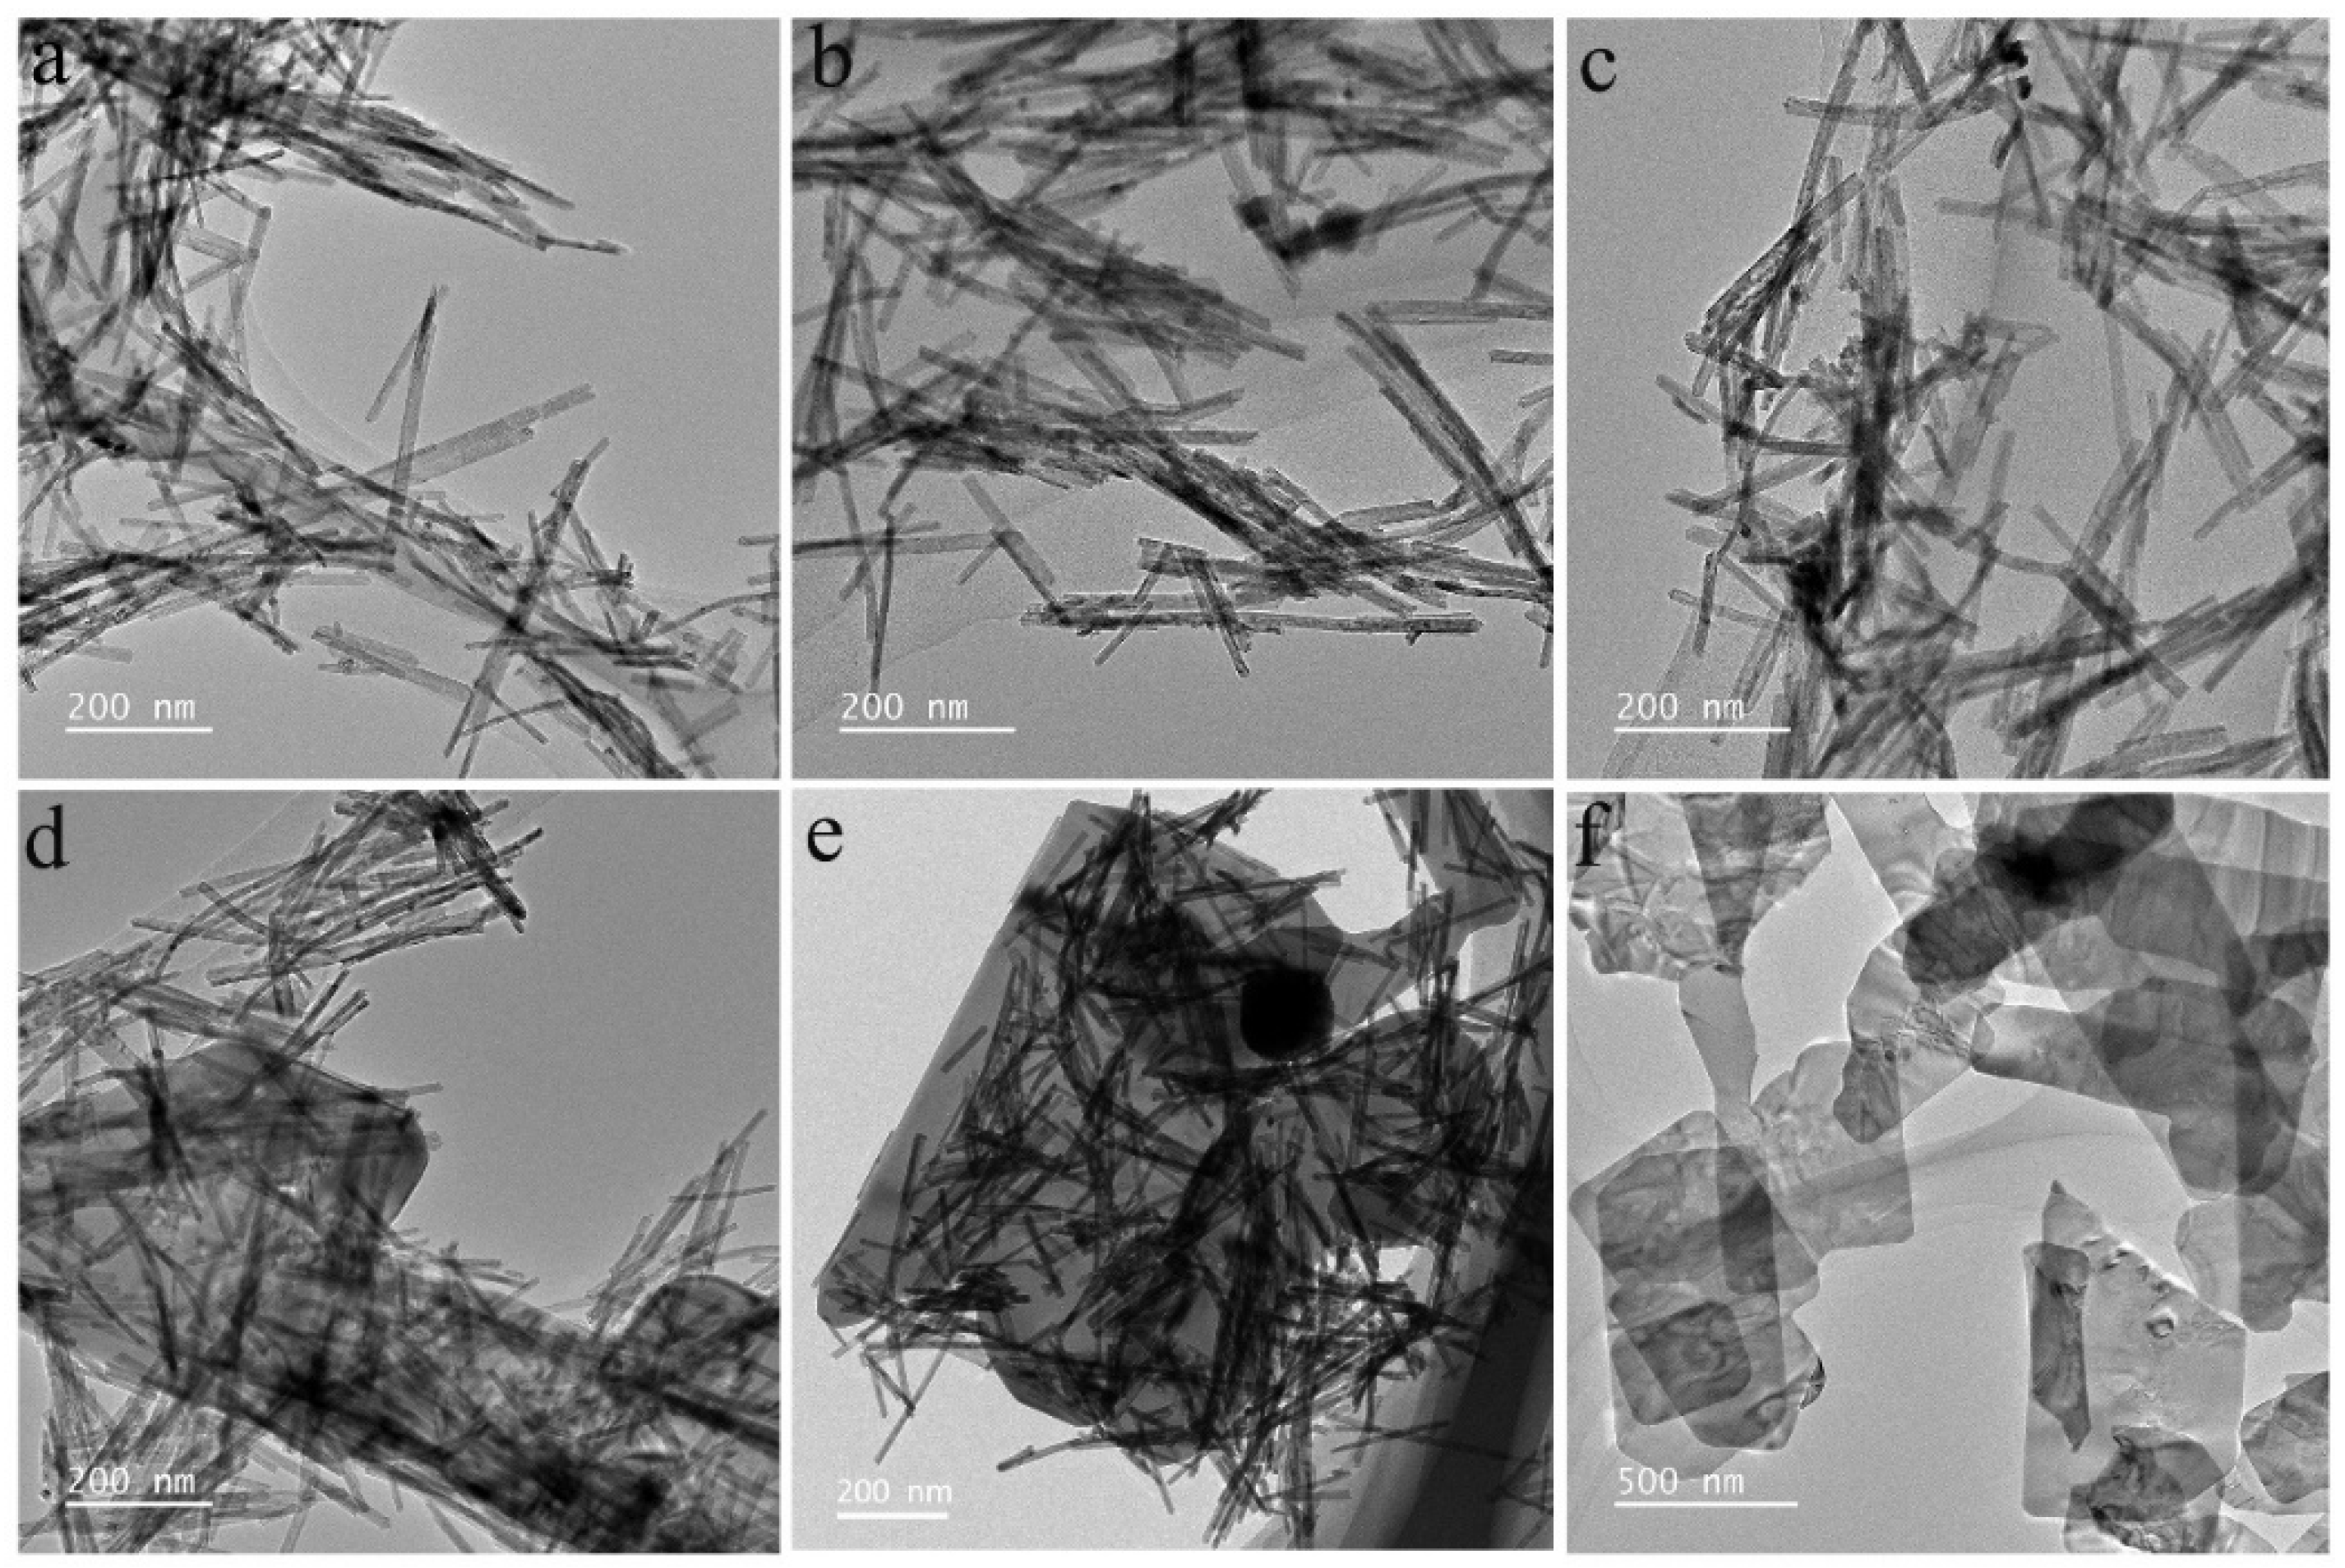
2 catalyst decreased, mainly due to the formation of sheet-morphology CuO (Figure 3f). The SBET of sheet-morphology CuO is significantly lower than that of CeO2 (Table 1). Therefore, the SBET of the CuO/CeO2 catalyst decreased with increased in CuO doping. Moreover, the SBET of 50% Cu/Ce and 80% Cu/Ce catalysts decrease more significantly compared with that of 10% Cu/Ce and 20%Cu/Ce catalysts as a result of the appearance of a large amount of sheet-morphology CuO (Figure 3d,e) on CeO2 nanorods.
Figure 3 shows a TEM image of the CuO/CeO2 catalyst. Figure 3a,f shows that the morphologies of pure CeO2 and CuO were nanorods and nanoplates, respectively. Figure 3b–e shows TEM images of the CuO/CeO2 catalysts with Cu/Ce ratios of 10, 20, 50, and 80%, respectively. The morphology of the CeO2 nanorods did not change after loading with CuO, and when the Cu/Ce ratio was 50 and 80%, CuO nanoplates began to appear (Figure 3d,e). 
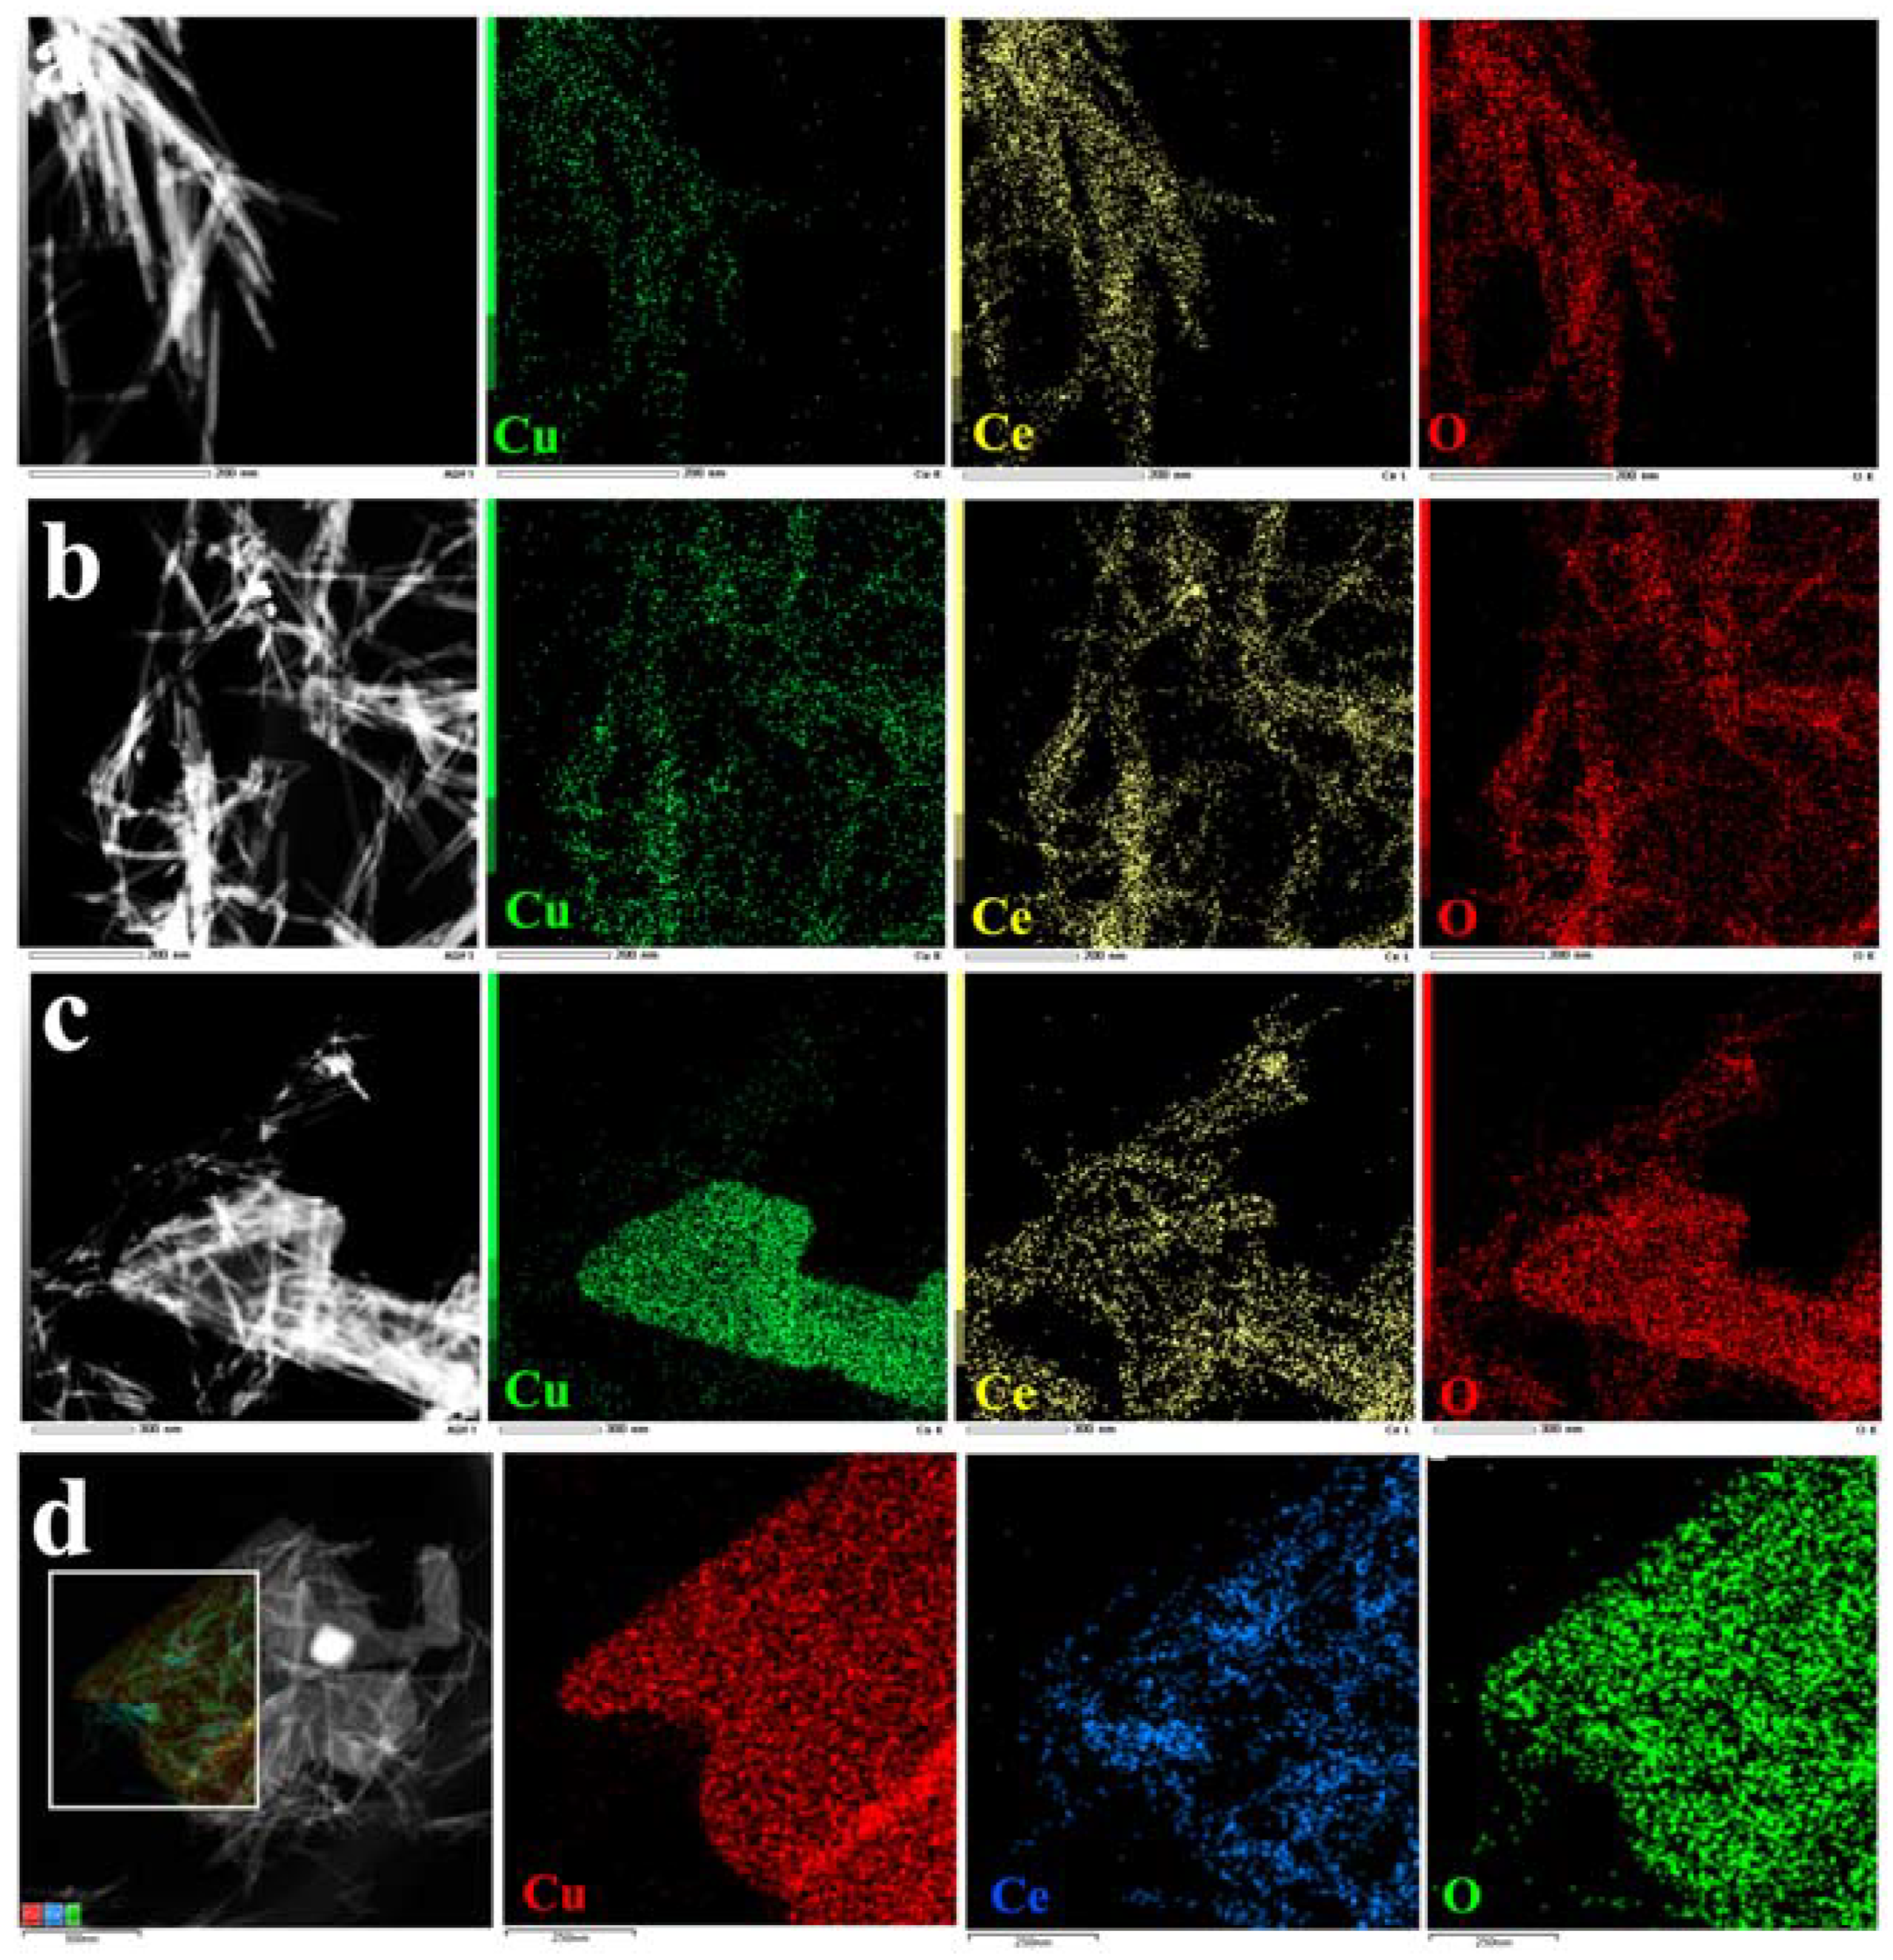
Figure 4 shows EDX images of the Cu/Ce catalysts with varying loading ratios, demonstrating that Cu was evenly distributed on the CeO nanorods (Figure 4a,b).
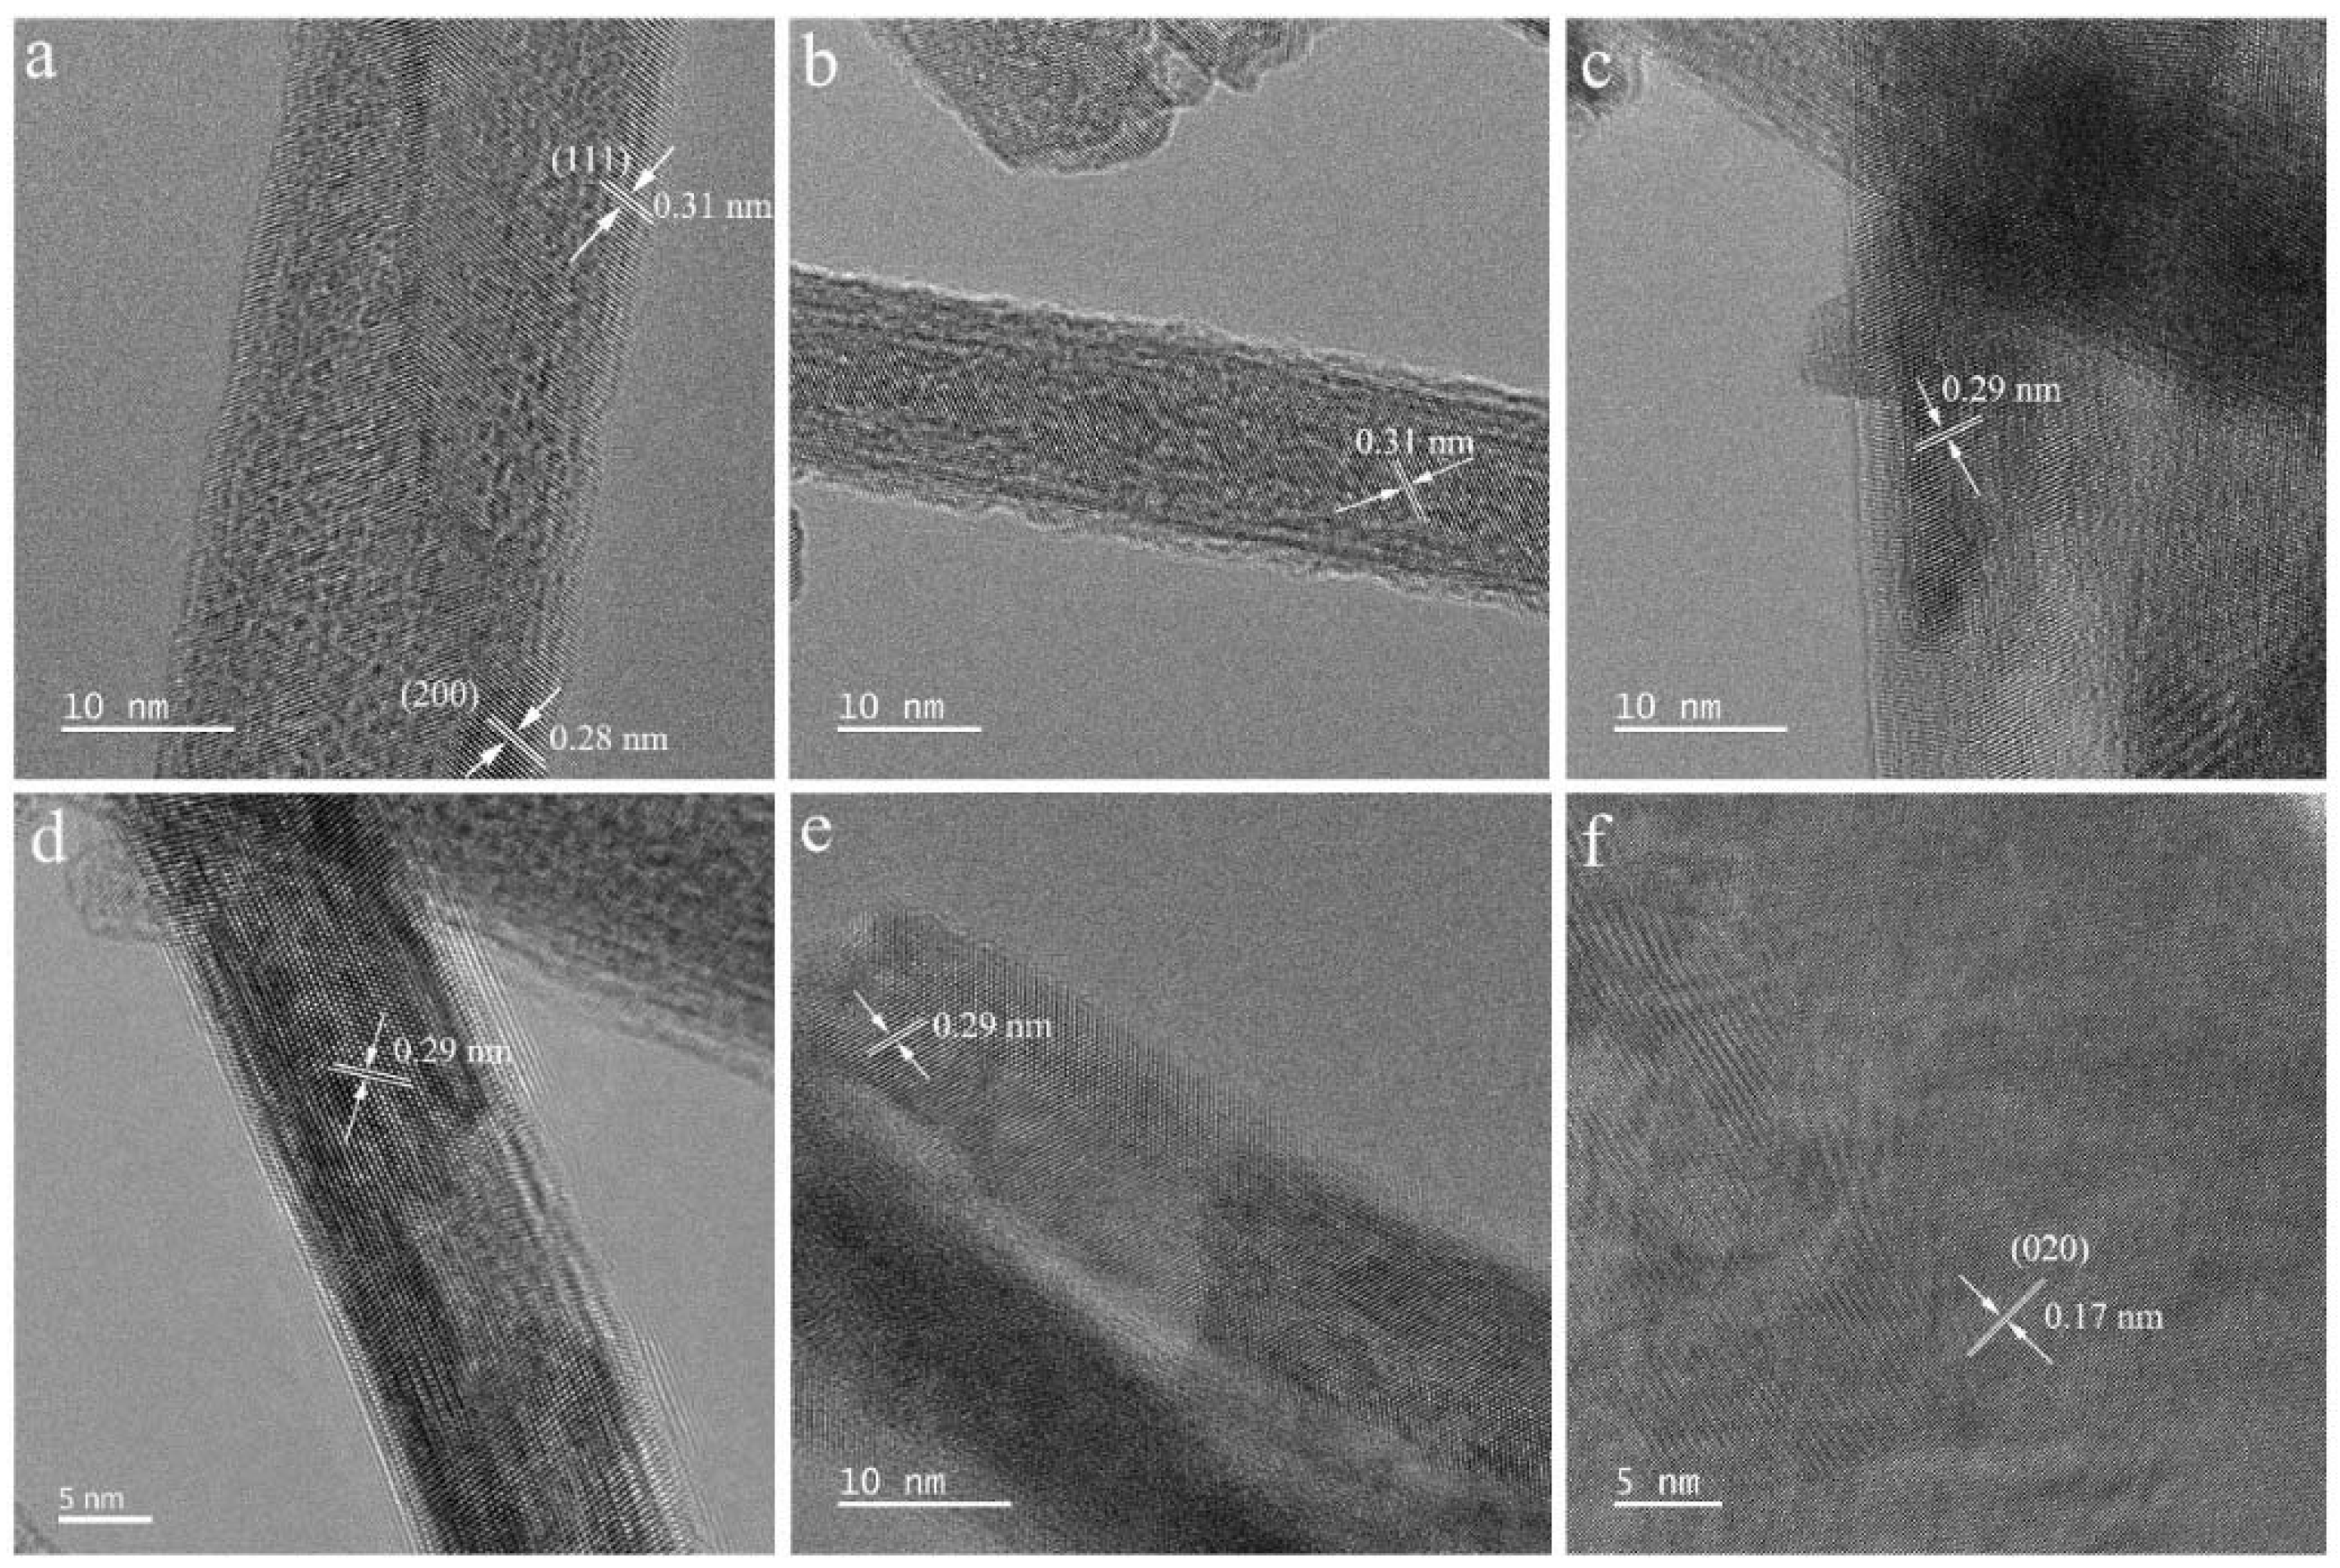
Figure 5 shows HRTEM images of the catalysts. The exposed (111) and (200) crystal planes of the CeO2 nanorods correspond to the lattice fringes at 0.31 and 0.28 nm, respectively (Figure 5a); the exposed (020) crystal planes of the CuO nanoplates correspond to the lattice fringes at 0.17 nm (Figure 5f). Figure 4c–e shows that a lattice spacing of 0.29 nm appeared with increasing CuO load due to the change in lattice spacing caused by the doping of Cu atoms into the CeO2 lattice.
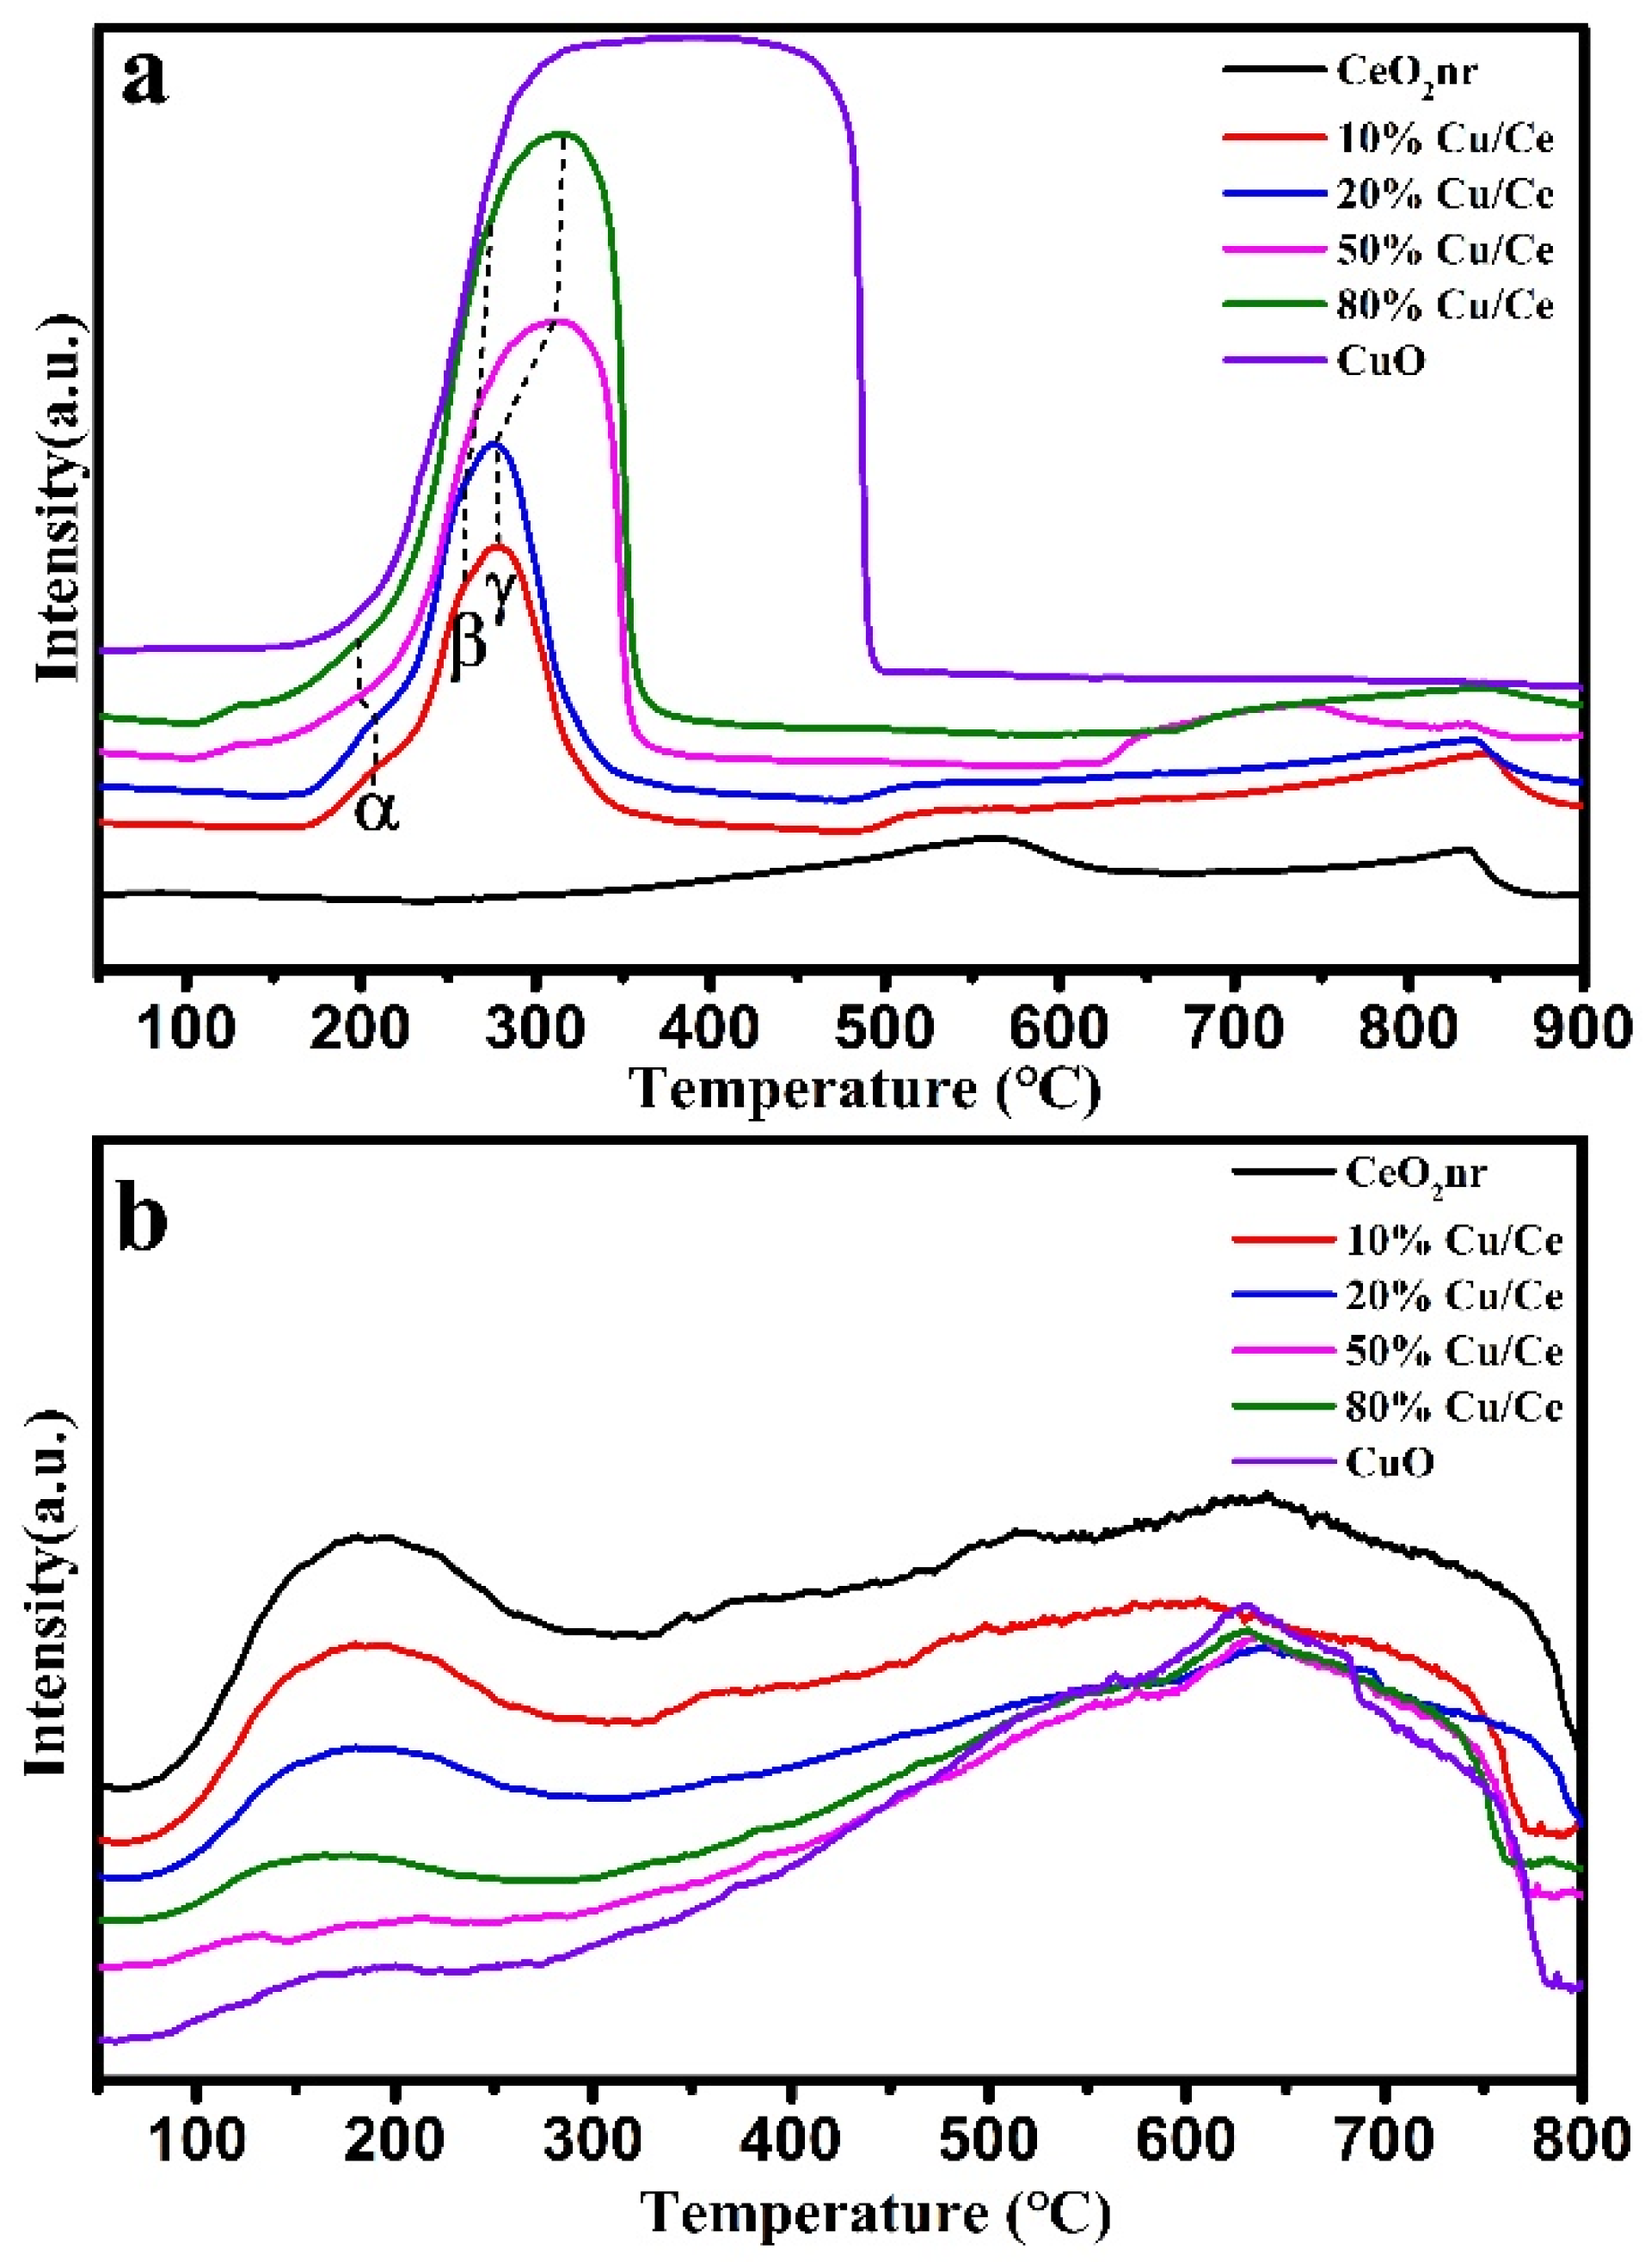
The oxidation activity of the catalyst material was characterized using H2-TPR (Figure 6a and Table 2). There are usually two reduction peaks of CeO2: a peak at approximately 675 °C corresponding to the surface oxygen reduction peak of CeO2 and a peak at approximately 835 °C corresponding to the bulk oxygen reduction peak of CeO2 [36]. A broad peak appeared in CuO at 170–500 °C, which may be due to the closeness of the surface oxygen and bulk oxygen reduction peaks of CuO, such that the two peaks cannot be completely separated. CuO/CeO2 has three main peaks at 170–202 °C, 250 °C, and 275 °C, which are denoted by α, β, and γ, respectively. The α peak corresponds to CuOx, which interacts strongly with CeO2; the β peak corresponds to CuOx, which interacts weakly with CeO2; and the γ peak is attributed to bulk CuO [37]. The H2-TPR diagram (Figure 6) clearly shows that after CuO was loaded onto CeO2, the reduction temperature of the CuO/CeO2 catalyst was significantly lower than that of the CeO2, indicating that the loaded catalyst had more active oxygen. H2 consumption amounts of as-prepared catalyst were calculated using H2-TPR (Table 2). As shown in Table 2, the theoretical and the calculated value of H2 consumption increased with an increase in the Cu/Ce loading ratio. The calculated hydrogen consumption amount of 10%Cu/Ce catalyst exceeded theoretical values; however, with an increase in the Cu/Ce ratio, the theoretical calculated value exceeded the calculated value, implying a interaction between CeO2 and CuO species [38]. Evidently, the addition of CuO improved the CeO2 oxidation activity.
O2-TPD tests were performed on the CuO/CeO2 catalysts, CeO2, and CuO to investigate the desorption behavior of oxygen (Figure 6b and Table 3). Two types of oxygen exist in the catalyst, namely surface-adsorbed oxygen and lattice oxygen [39]. The peak at 180 °C is related to chemisorbed oxygen around the oxygen vacancies, and the peak at 640 °C is related to oxygen escaping from the lattice. As shown in Table 3, with an increase in the Cu/Ce ratio, the amount of oxygen adsorbed at low temperatures decreased, and the lattice oxygen at high temperatures increased.
XPS characterizations were used to obtain the composition information and determine the chemical state on the surface of CeO2, CuO, and CuO/CeO2. 
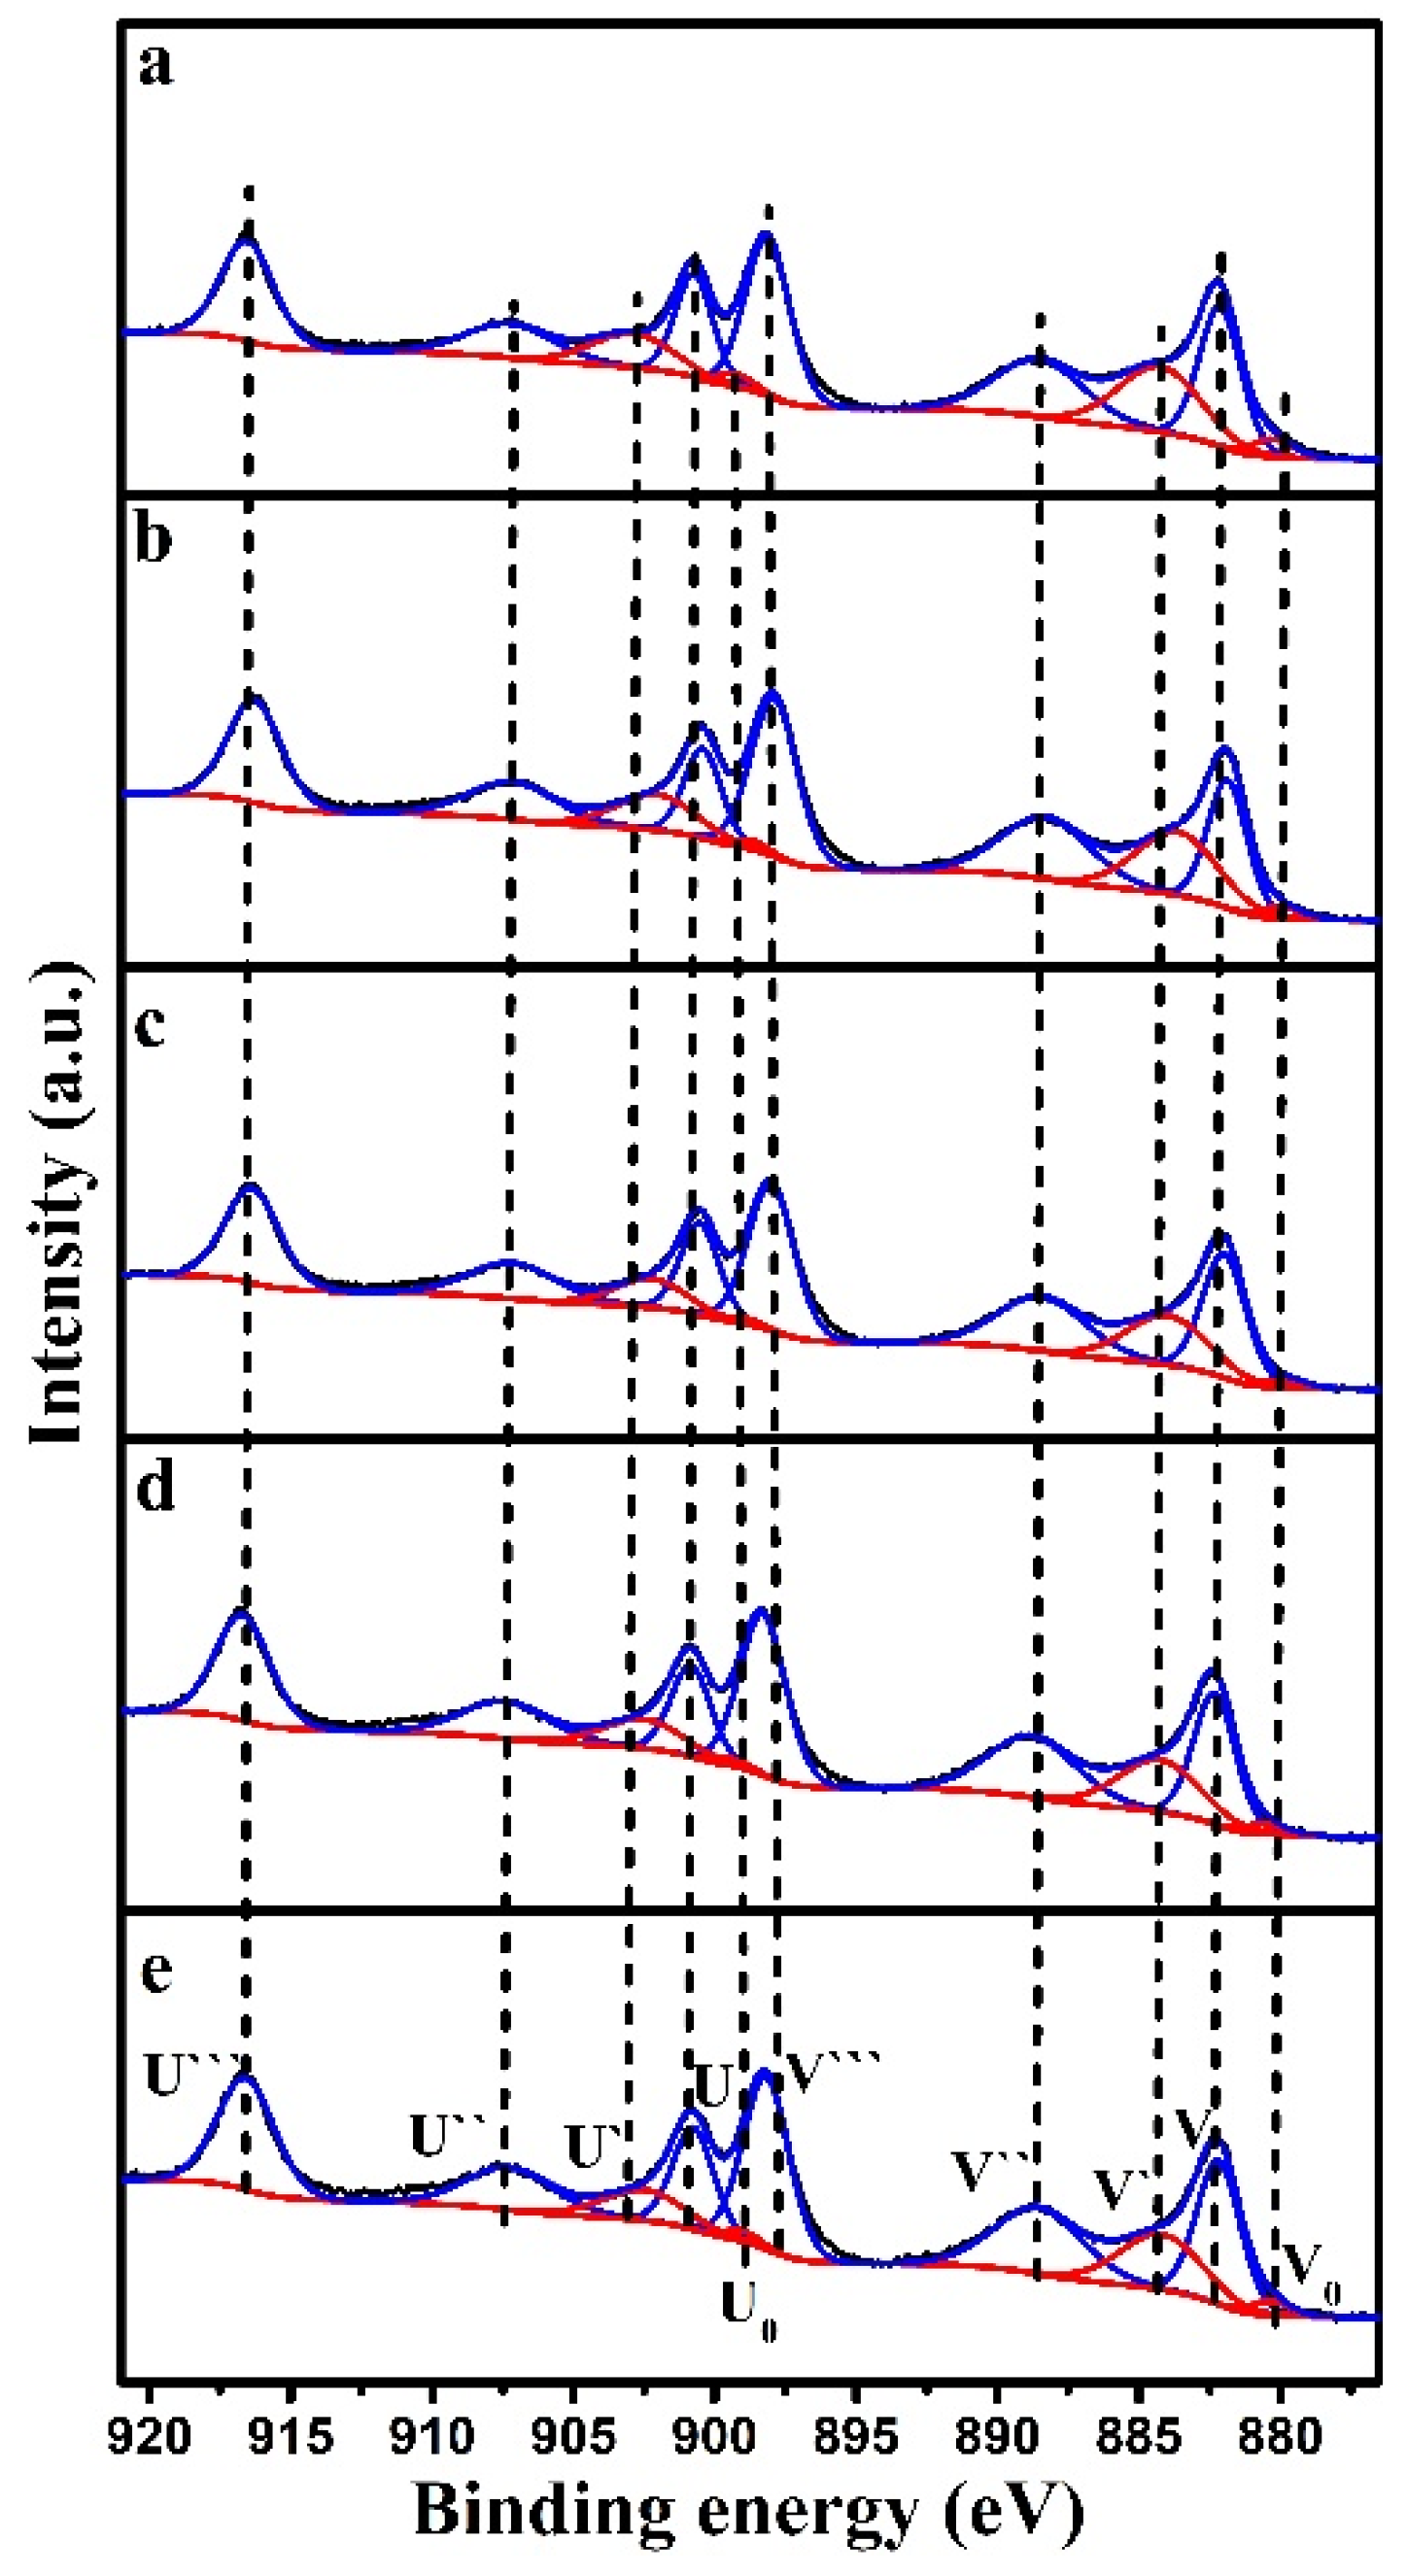
Figure 7 shows the Ce 3d XPS spectra of the CeO2 and CuO/CeO2 catalysts, which are deconvoluted into ten peaks [36,40,41]. The Ce 3d spectra are composed of two-group spin orbitals of the overlapping peaks, labeled as U0–U``` for 3d3/2 and V0–V``` for 3d5/2. The binding energy peaks of V (882.14 eV), V`` (888.51 eV), V``` (898.05 eV), U (900.63 eV), U`` (907.32 eV), and U``` (916.45 eV) are related to Ce4+, whereas the binding energy peaks of V0 (880.2 eV), V` (884.7 eV), U0 (898.65 eV), and U` (903.09 eV) are associated with Ce3+. The Ce3+ content was calculated using the peak area ratio of Ce3+/(Ce3+ + Ce4+), and the results are listed in Table 4. The Ce3+ content decreased after loading CuO. It has been speculated that a reversible reaction of Ce3+ + Cu2+ ↔ Ce4+ + Cu+ and 2Ce3+ + Cu2+ ↔ 2Ce4+ + Cu0 occurs on the surface of the CuO/CeO2 catalyst [42,43,44].
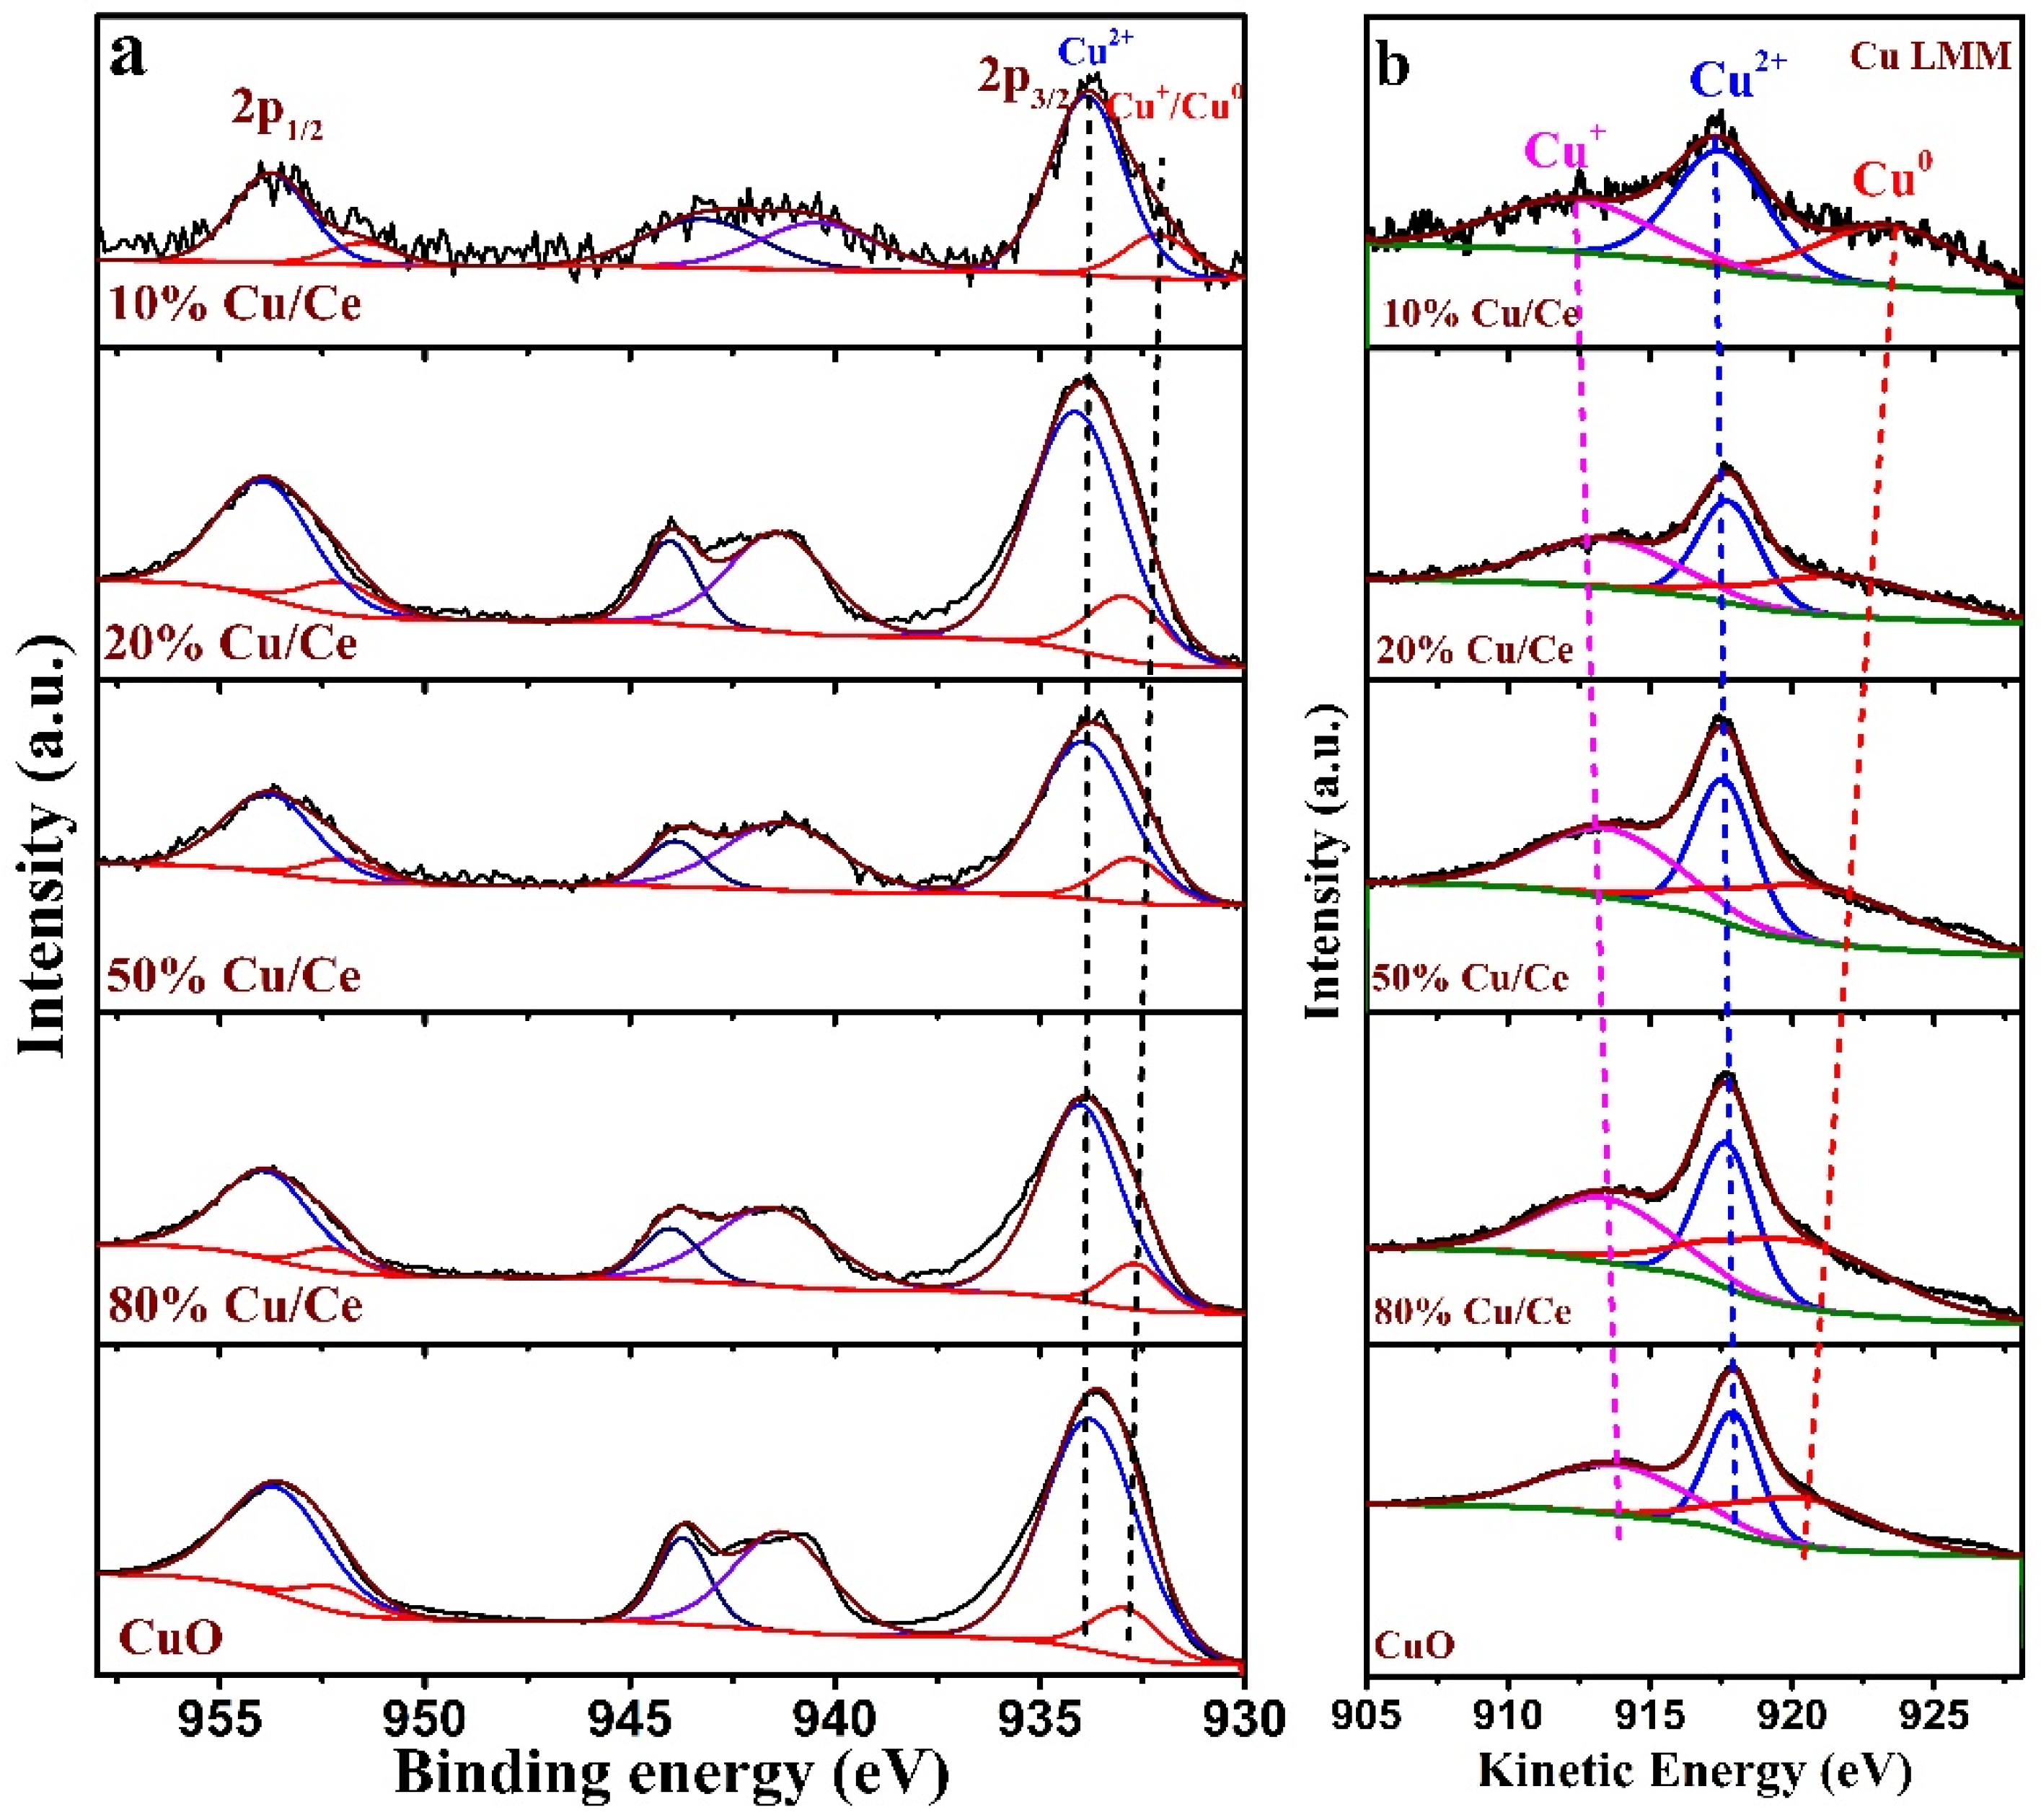
Figure 8 shows the Cu 2p spectra and Cu LMM Auger spectra of the CuO/CeO2 catalysts, where two characteristic peaks are visible, namely Cu 2p3/2 and Cu 2p1/2, along with a broad satellite peak in the Cu 2p spectra. The peaks centered at 934 and 954 eV correspond to Cu 2p3/2 and Cu 2p1/2, respectively, and the broad satellite peak is in the range of 937–947 eV. The peaks located at 934 eV and the corresponding satellite peaks are associated with Cu2+, and the peaks located at 932–933 eV are associated with Cu+ or/and Cu0 [38,45]. The two reduced states (Cu+ and Cu0) are difficult to distinguish in the Cu 2p spectra [46,47,48,49]. In order to distinguish Cu+ and Cu0, Auger Cu LMM spectra were used. The broad feature in the kinetic energy spectra consists of three peaks at 917.5 eV, 913.2–916.0 eV, and 918.5 eV–919 eV, which are assigned to Cu2+, Cu+, and Cu0 species, respectively [45,50,51,52]. Although the Cu LMM Auger spectra show that both Cu0 and Cu+ occur simultaneously in the prepared catalysts, the presence of Cu0 species possible due to the photoreduction in the XPS test [37,49]. Table 4 presents the calculated Cu0 and Cu+ to Cu2+ ratios; it is clear that (Cu0 + Cu+)/Cu2+ is related to the change in Ce3+ content (ΔCe3+), which further indicates that reversible reactions of Ce3+ + Cu2+ ↔ Ce4+ + Cu+ and 2Ce3+ + Cu2+ ↔ 2Ce4+ + Cu0 occurred on the surface of the CuO/CeO2 catalyst. The (Cu0 + Cu+)/Cu2+ of 20%Cu/Ce, 50%Cu/Ce, and 80%Cu/Ce were nearly the same and correspond to a minimal change in ΔCe3+.
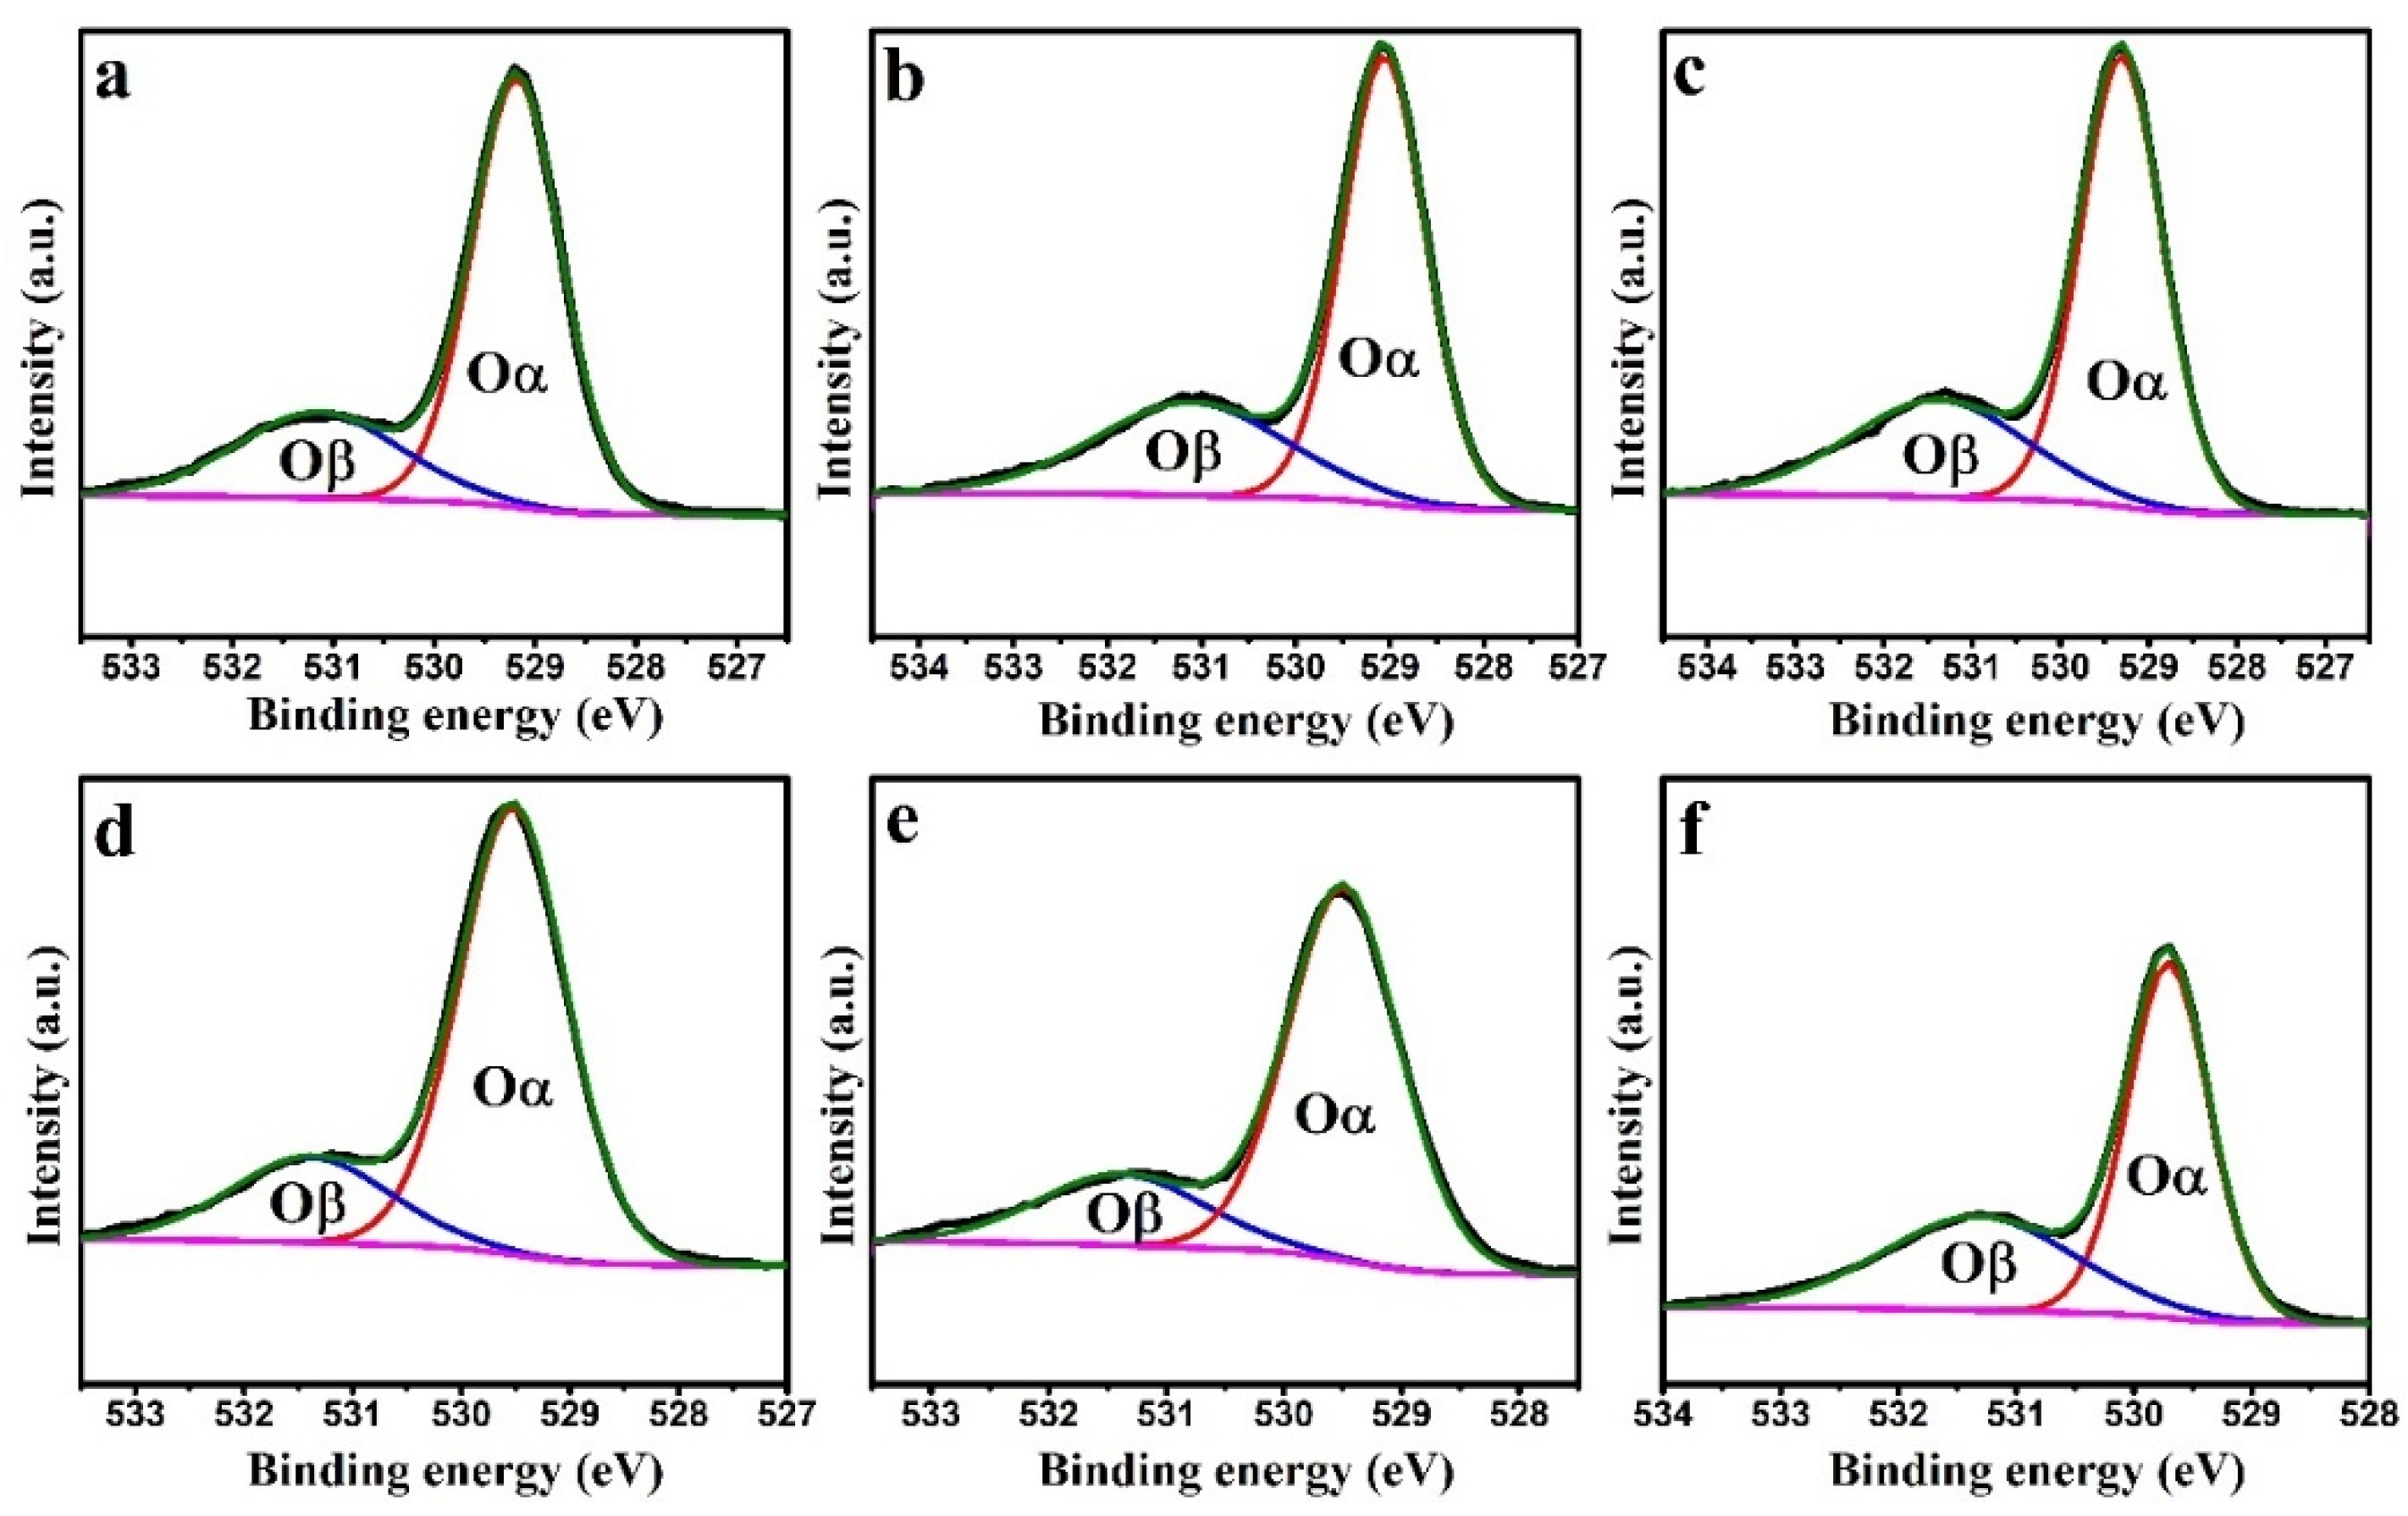
Figure 9 shows that the O1s spectra of the CeO2, CuO, and CuO/CeO2 catalysts were deconvoluted into two distinct peaks [36]. The low-binding-energy peak located at 528.5–529.5 eV (denoted as Oα) was attributed to surface lattice oxygen. The higher-binding-energy peak located at 530–531.5 eV (denoted as Oβ) was attributed to oxygen vacancies, surface-adsorbed O2−/O, surface-adsorbed O2, hydroxyl groups, and carbonates [39,53]. The Oα and Oβ contents were calculated based on the areas of the deconvoluted peaks (Table 4). With an increase in the Cu/Ce ratio, the Oβ content decreased, whereas the Oα content increased; this trend is consistent with the O2-TPD results.
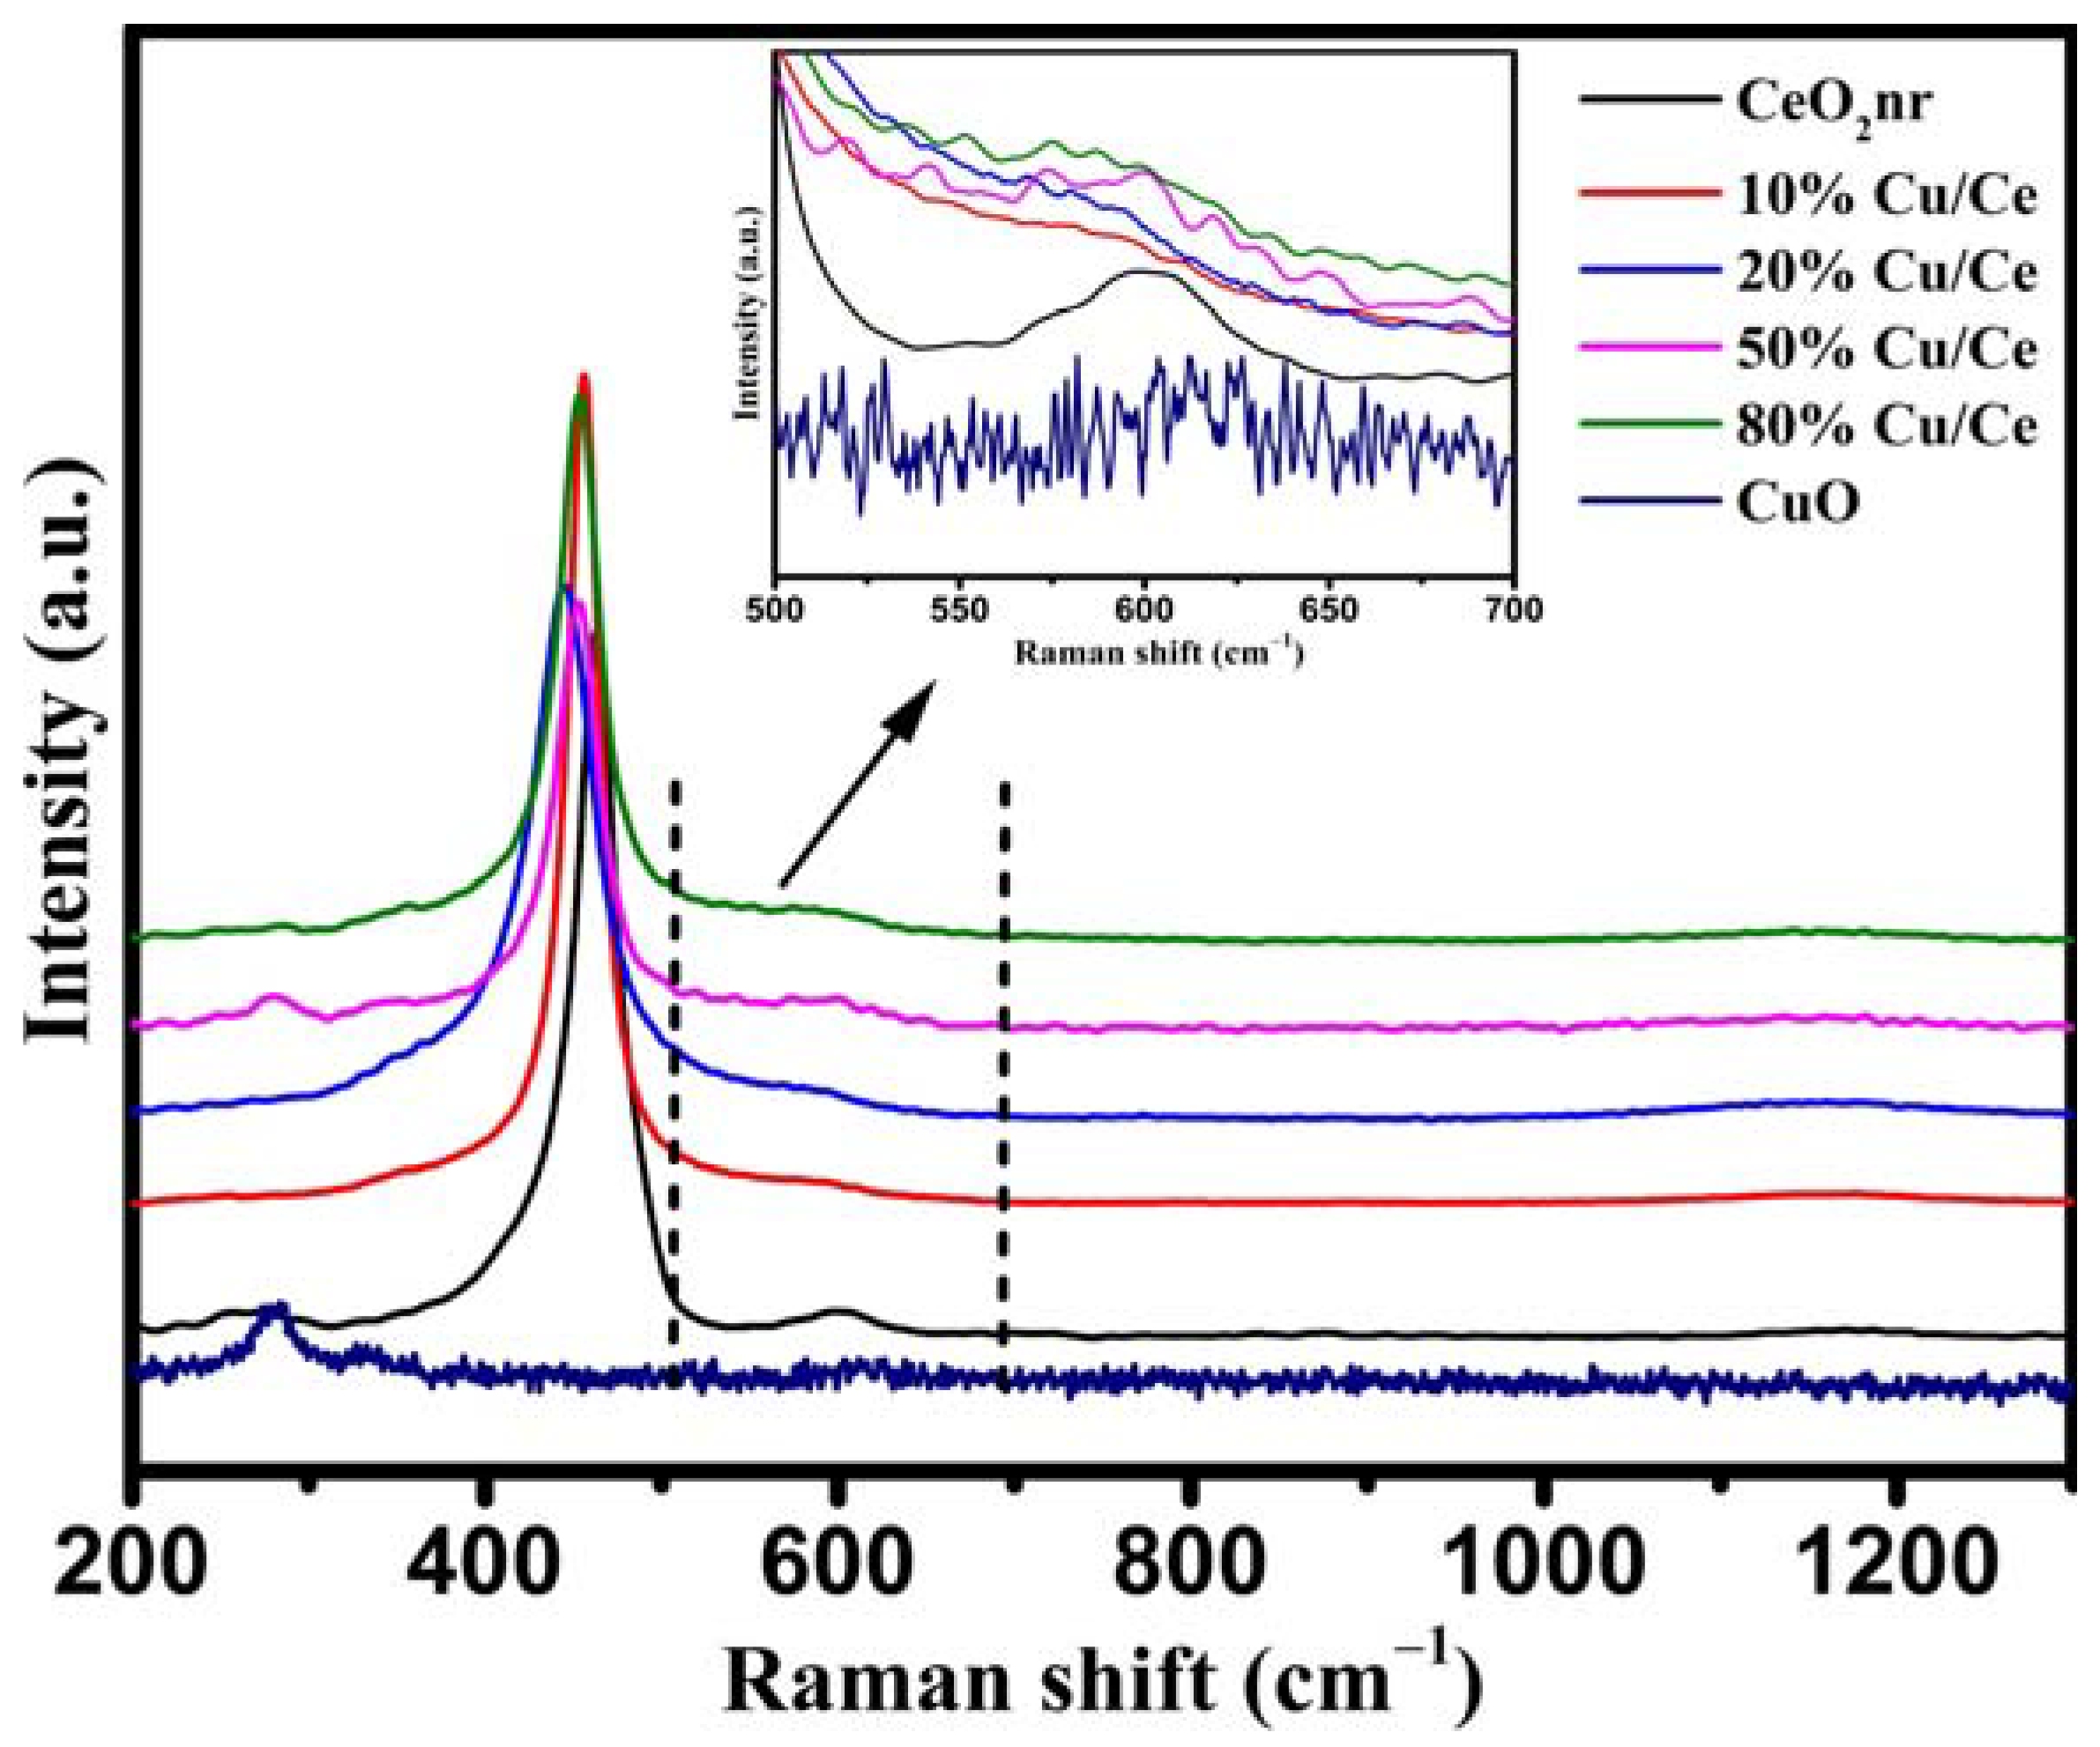
Visible Raman spectroscopy provides additional information about the lattice vibrations and internal defects of catalysts. Figure 10 shows that a strong band was detected at 450–460 cm−1, which was ascribed to the Raman-active vibrational F2g mode of CeO2 with a fluorite-type structure. Another broad peak located at approximately 598 cm−1 was also detected (Figure 10 inset), which corresponds to the defect-induced (D) mode associated with O vacancies caused by the presence of Ce3+ [36]. The F2g mode of CeO2 shifted from 463 to 445 cm−1 for the CuO/CeO2 catalysts, which is generally attributed to the shrinkage and distortion of the CeO2 lattice caused by the electronic redistribution of the Cu-V-Ce structure. The ratio of the two peak intensities between the defect-induced (D) mode and the F2g mode (ID/IF2g) represents the relative concentration of O vacancies (Table 4) [54,55]. The ID/IF2g first increased and then decreased with an increase in the Cu/Ce ratio, and 50%Cu/Ce exhibited the highest O vacancy concentration of 0.083.

2.2. Catalytic Performance Testing

Protection time is an important parameter for the evaluation of catalyst performance [9]. Figure 11 presents the protection times of the six catalysts against DMMP, as shown in Table 3. The protection times of the catalysts were ranked in the following order: 50%Cu/Ce (322 min) > 20%Cu/Ce (266 min) > 10%Cu/Ce (252 min) > 80%Cu/Ce (140 min) > CeO2 (140 min) > CuO (56 min). The protection time of the CuO/CeO2 catalyst was significantly improved after loading with CuO. The protection time first increased and then decreased with an increasing Cu/Ce ratio, and 50%Cu/Ce exhibited the longest protection time. The variation trend of protection time is the same as that of oxygen vacancy concentration in Raman, indicating that the importance of oxygen vacancies in the catalytic DMMP reaction. A comparison of protection time on various reported catalysts is summarized in Table 5.

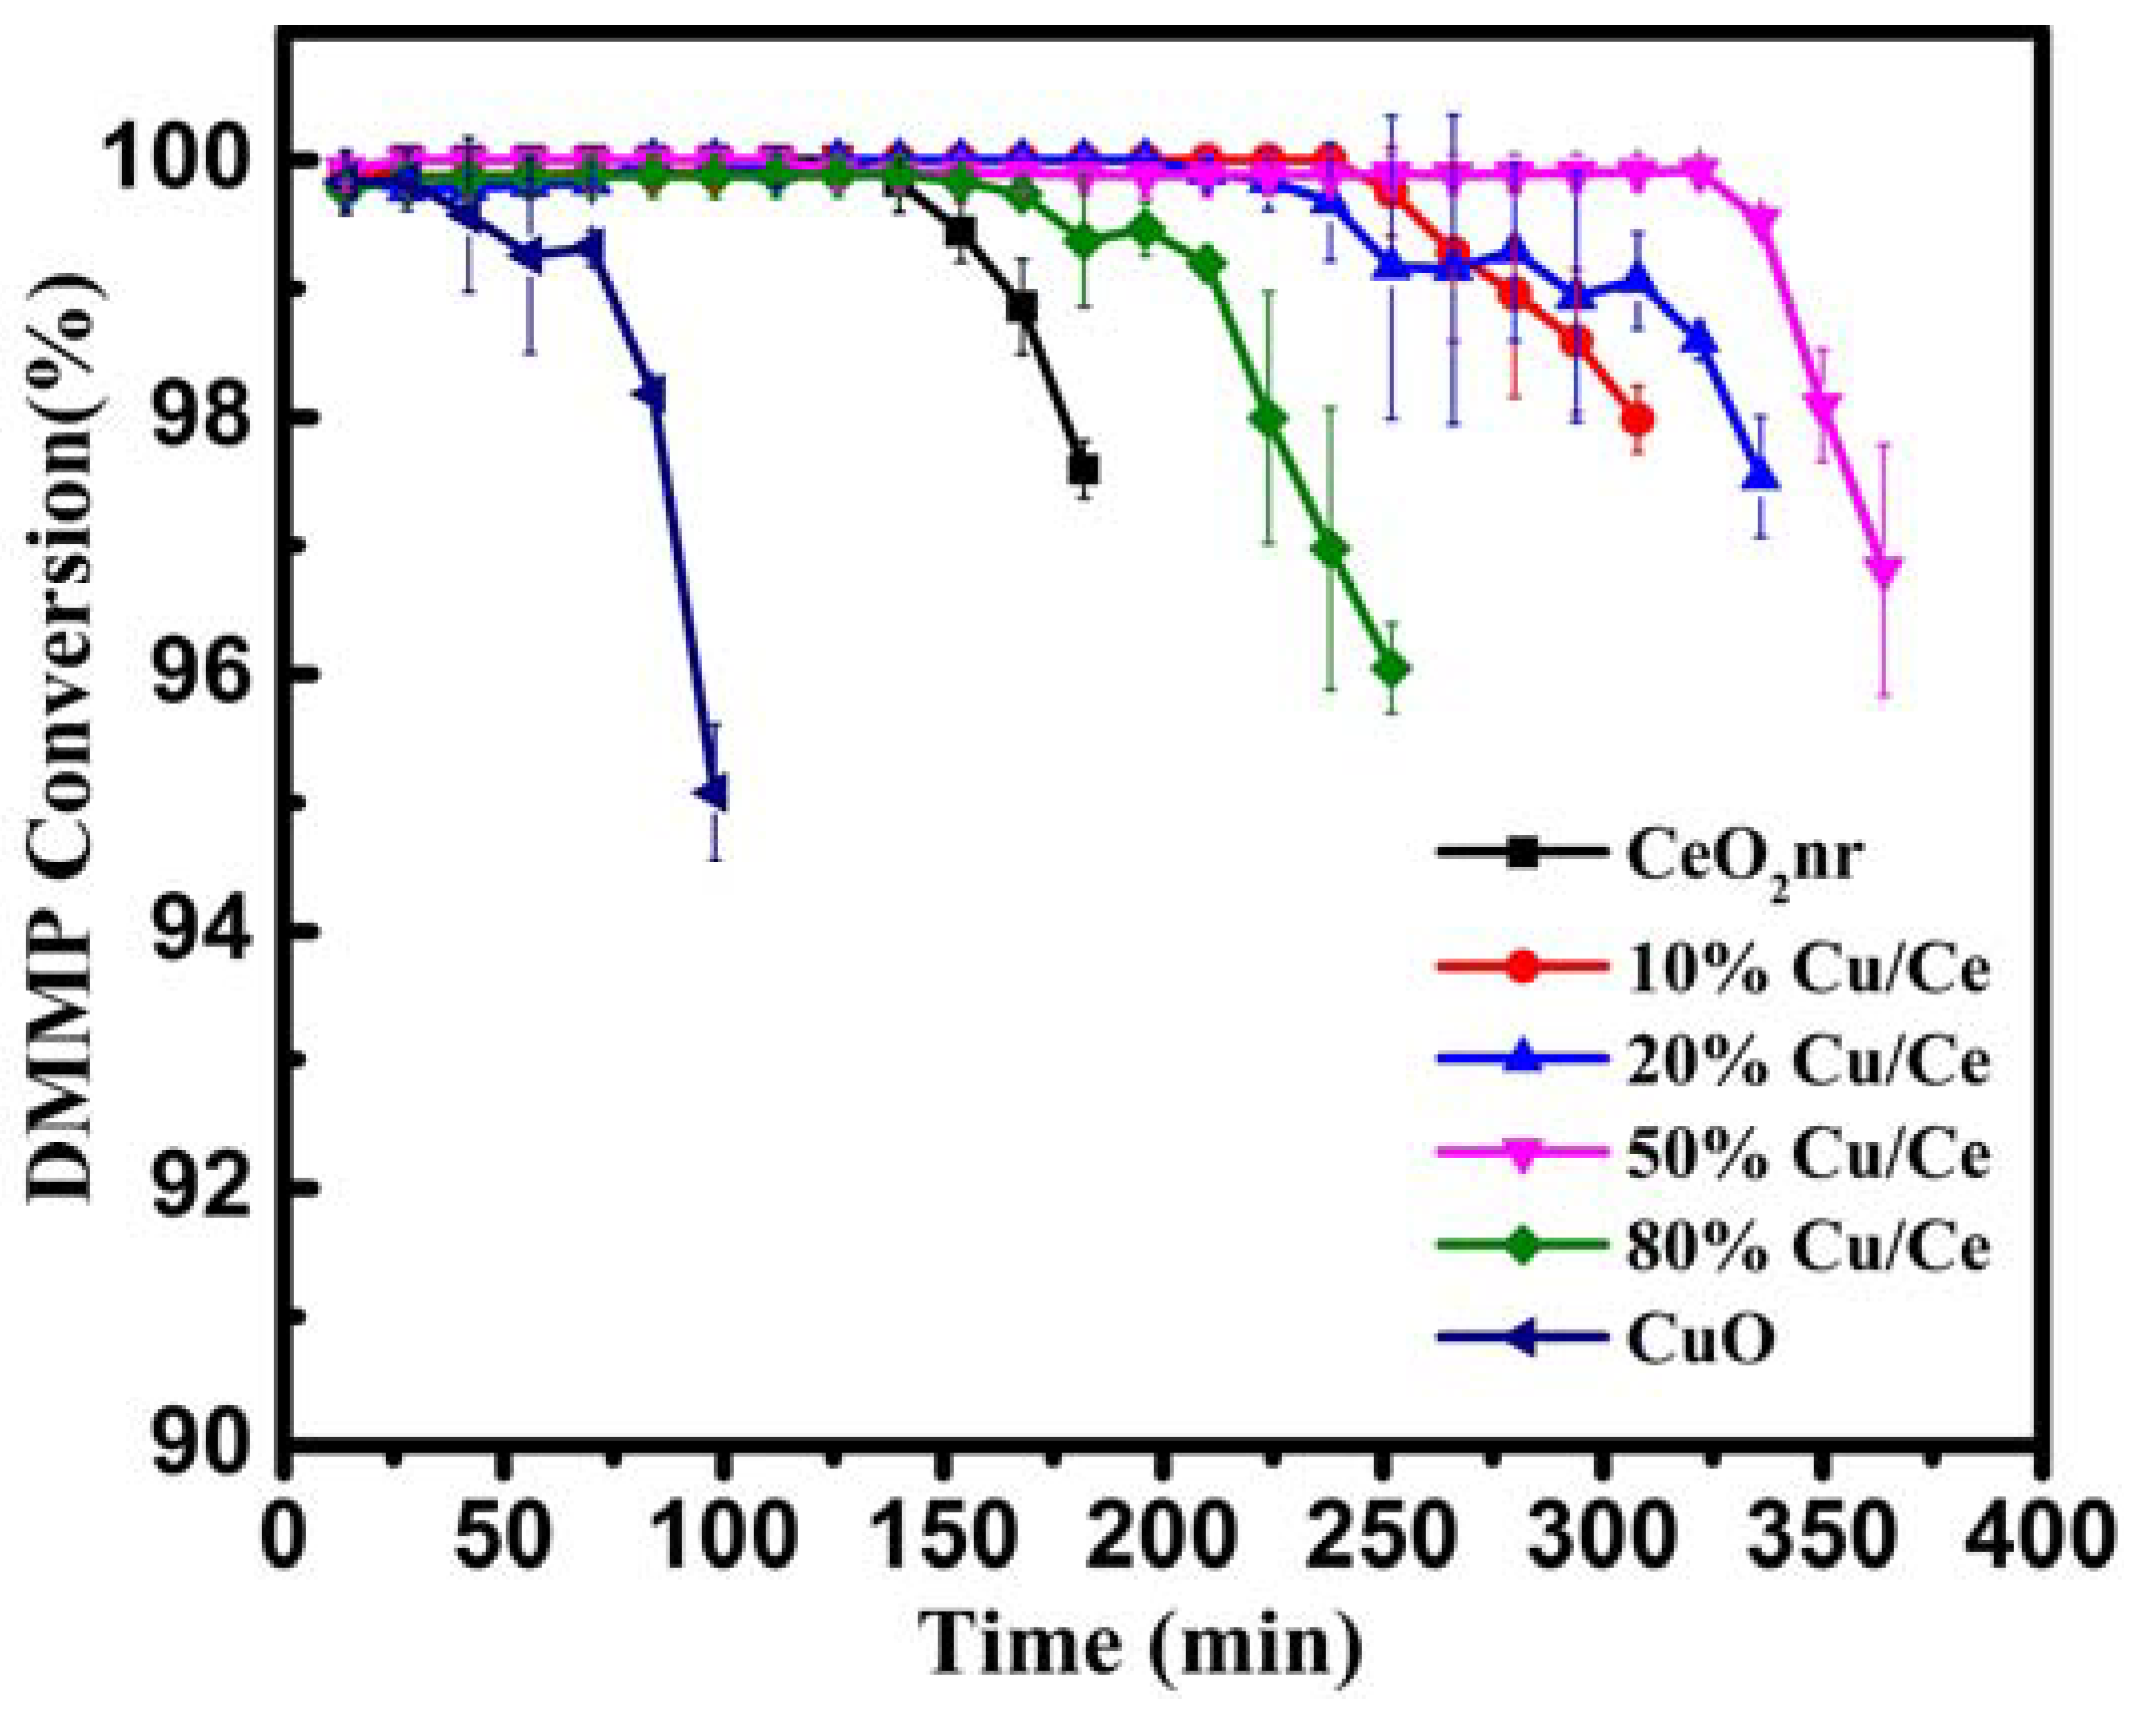
2.3. Reaction Mechanism for the Thermocatalytic Decomposition of DMMP

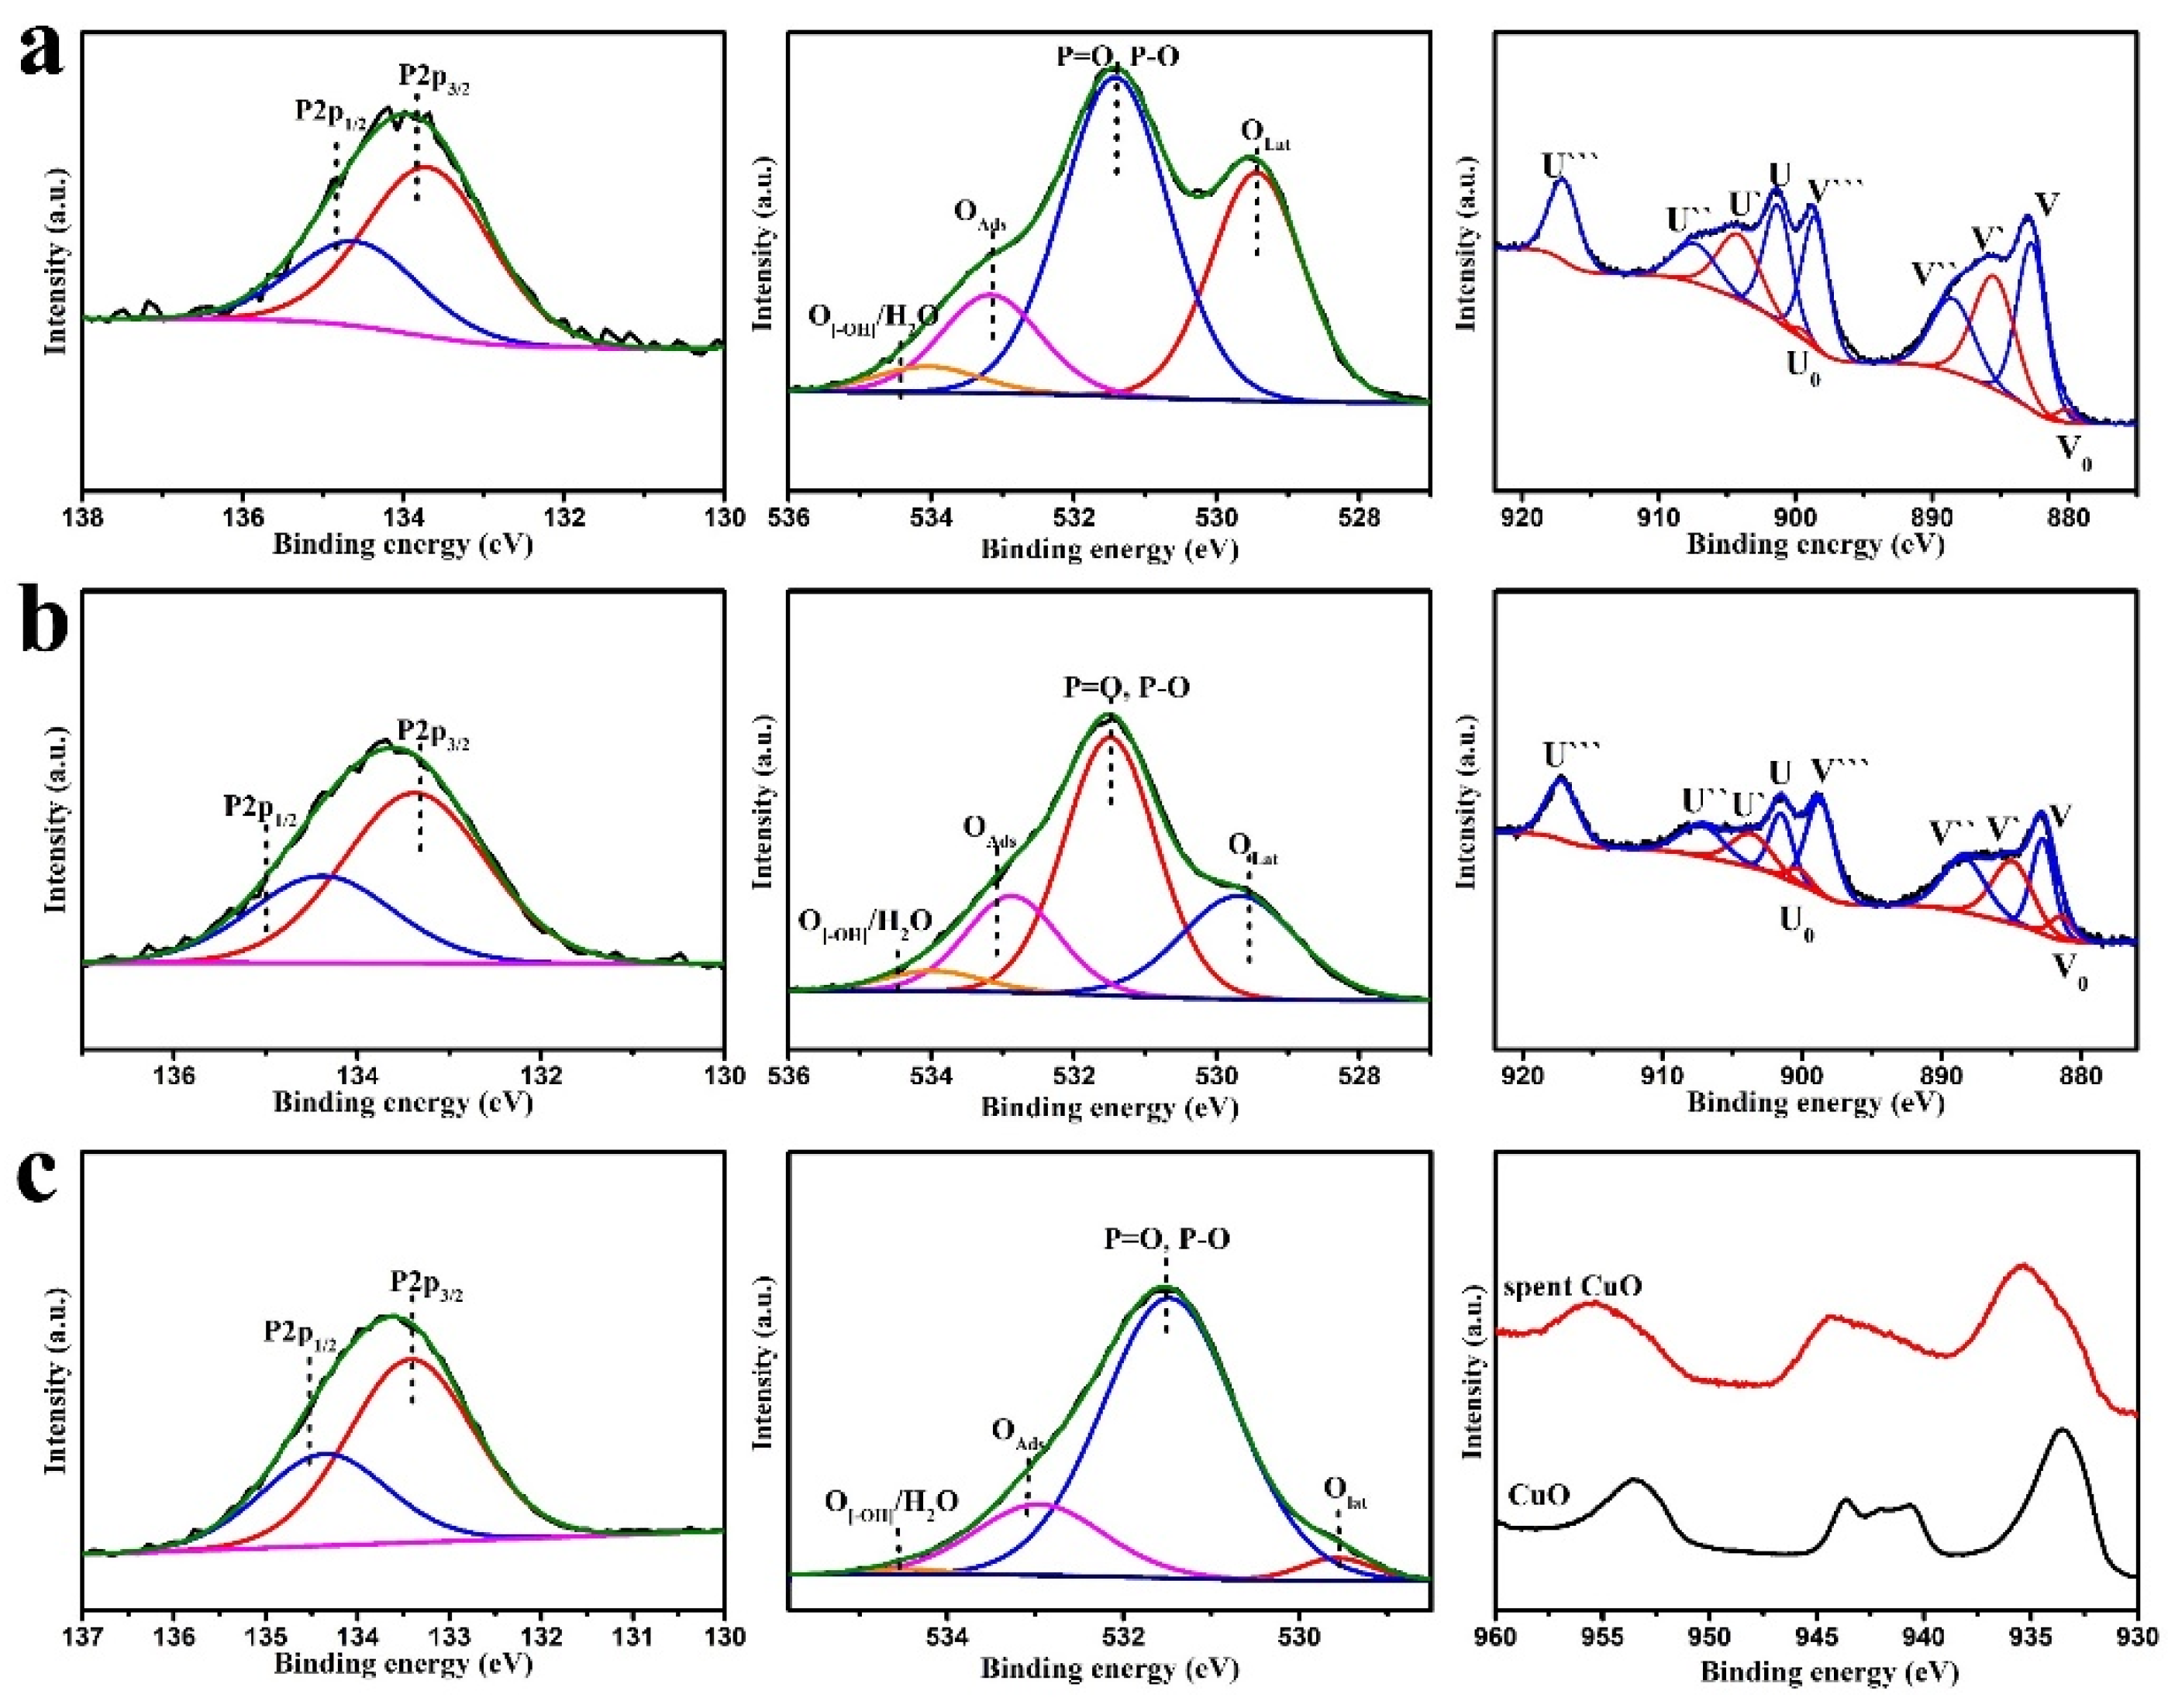
50%Cu/Ce catalyst with the longest protection time, CeO2, and CuO were selected to investigate the DMMP thermocatalytic decomposition mechanism. After the protection-time test, XPS analyses were performed on the deactivated catalyst; the results are shown in Figure 12. A P2p peak was obvious on the spent catalysts, indicating that the deactivated catalyst surface was covered with P species. The O1s spectrum of the deactivated catalyst was fitted to four peaks, namely surface lattice oxygen (Oα), P–O, adsorbed oxygen (OAds), and adsorbed water/hydroxyl oxygen [19]. The appearance of the P–O peak indicates the formation of P–O byproducts on the catalyst surface. Oα contents before and after the catalytic decomposition of DMMP were calculated (Table 6). It is obvious that the proportion of Oα in the deactivated catalyst was significantly lower that of the fresh catalyst, which indicates that lattice oxygen participates in the reaction and may play an important role in the catalytic oxidative decomposition of DMMP. Figure 12c shows the Cu2p spectra of CuO before and after the reaction. The Cu2p3/2 peak changed from 534 to 535.5 eV, with a broad satellite peak at 935–945 eV. The Cu2p satellite peak of CuO in the deactivated catalyst was similar to that of Cu2p3/2 when comparing the Cu2p of copper carbonate and copper phosphate, and the peak position was consistent with that of Cu2p3/2. Therefore, copper phosphate and copper carbonate products were speculated to exist on the surface of the deactivated catalyst.
The phosphorus-containing byproducts on the surface of the deactivated catalysts were qualitatively analyzed using ion chromatography, which showed the presence of PO43− and methyl phosphonate species, as shown in Table 7. DMMP decomposition amounts and the corresponding P element amounts are presented in Table 7. Mass spectrometry was used to qualitatively analyze the tail gas produced by the catalytic decomposition of DMMP on CeO2, 50%Cu/Ce, and CuO to determine its composition. 
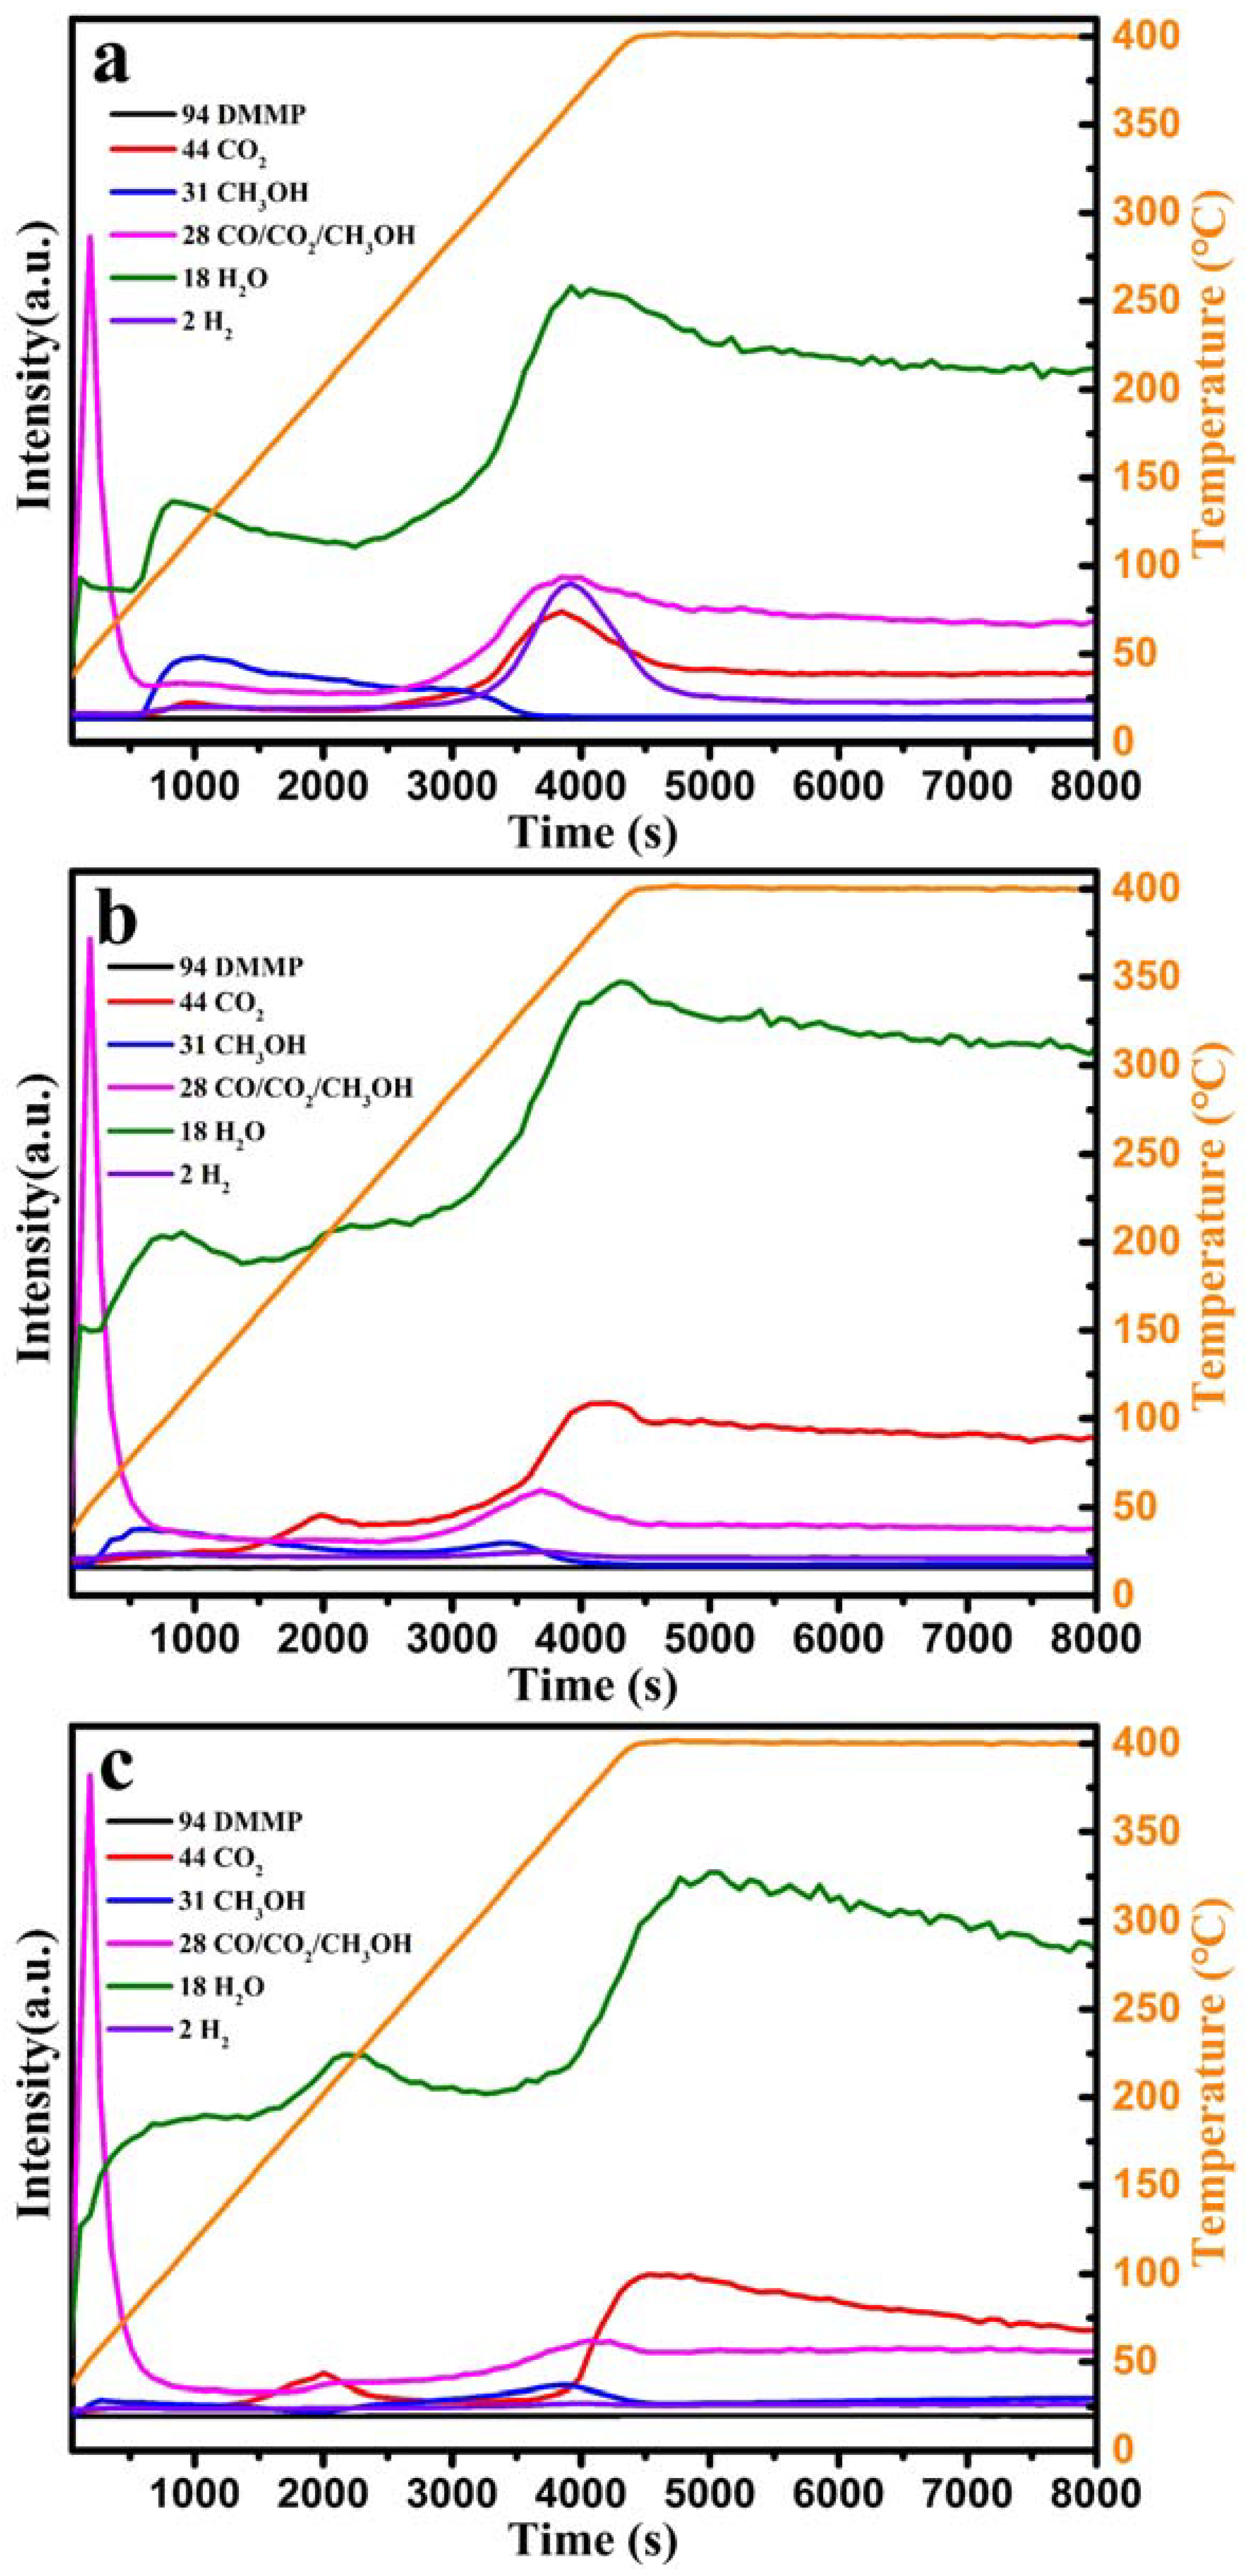
Figure 13 shows the mass spectra of the tail gas generated by CeO2, 50%Cu/Ce, and CuO, demonstrating that methanol, CO2, H2O, and H2 were detected in the reaction tail gas. Additionally, except for the fragment mass-to-charge ratio of methanol and CO2 (28), the mass-to-charge ratio of CO was 28. Therefore, gas chromatography was used to determine the presence of CO in the generated exhaust gas. CO was detected in the reaction tail gas of CeO2 and CuO; however, no CO was detected for 50%Cu/Ce, indicating that the oxidative activity of the 50%Cu/Ce catalyst was higher than that of CeO2 and CuO.
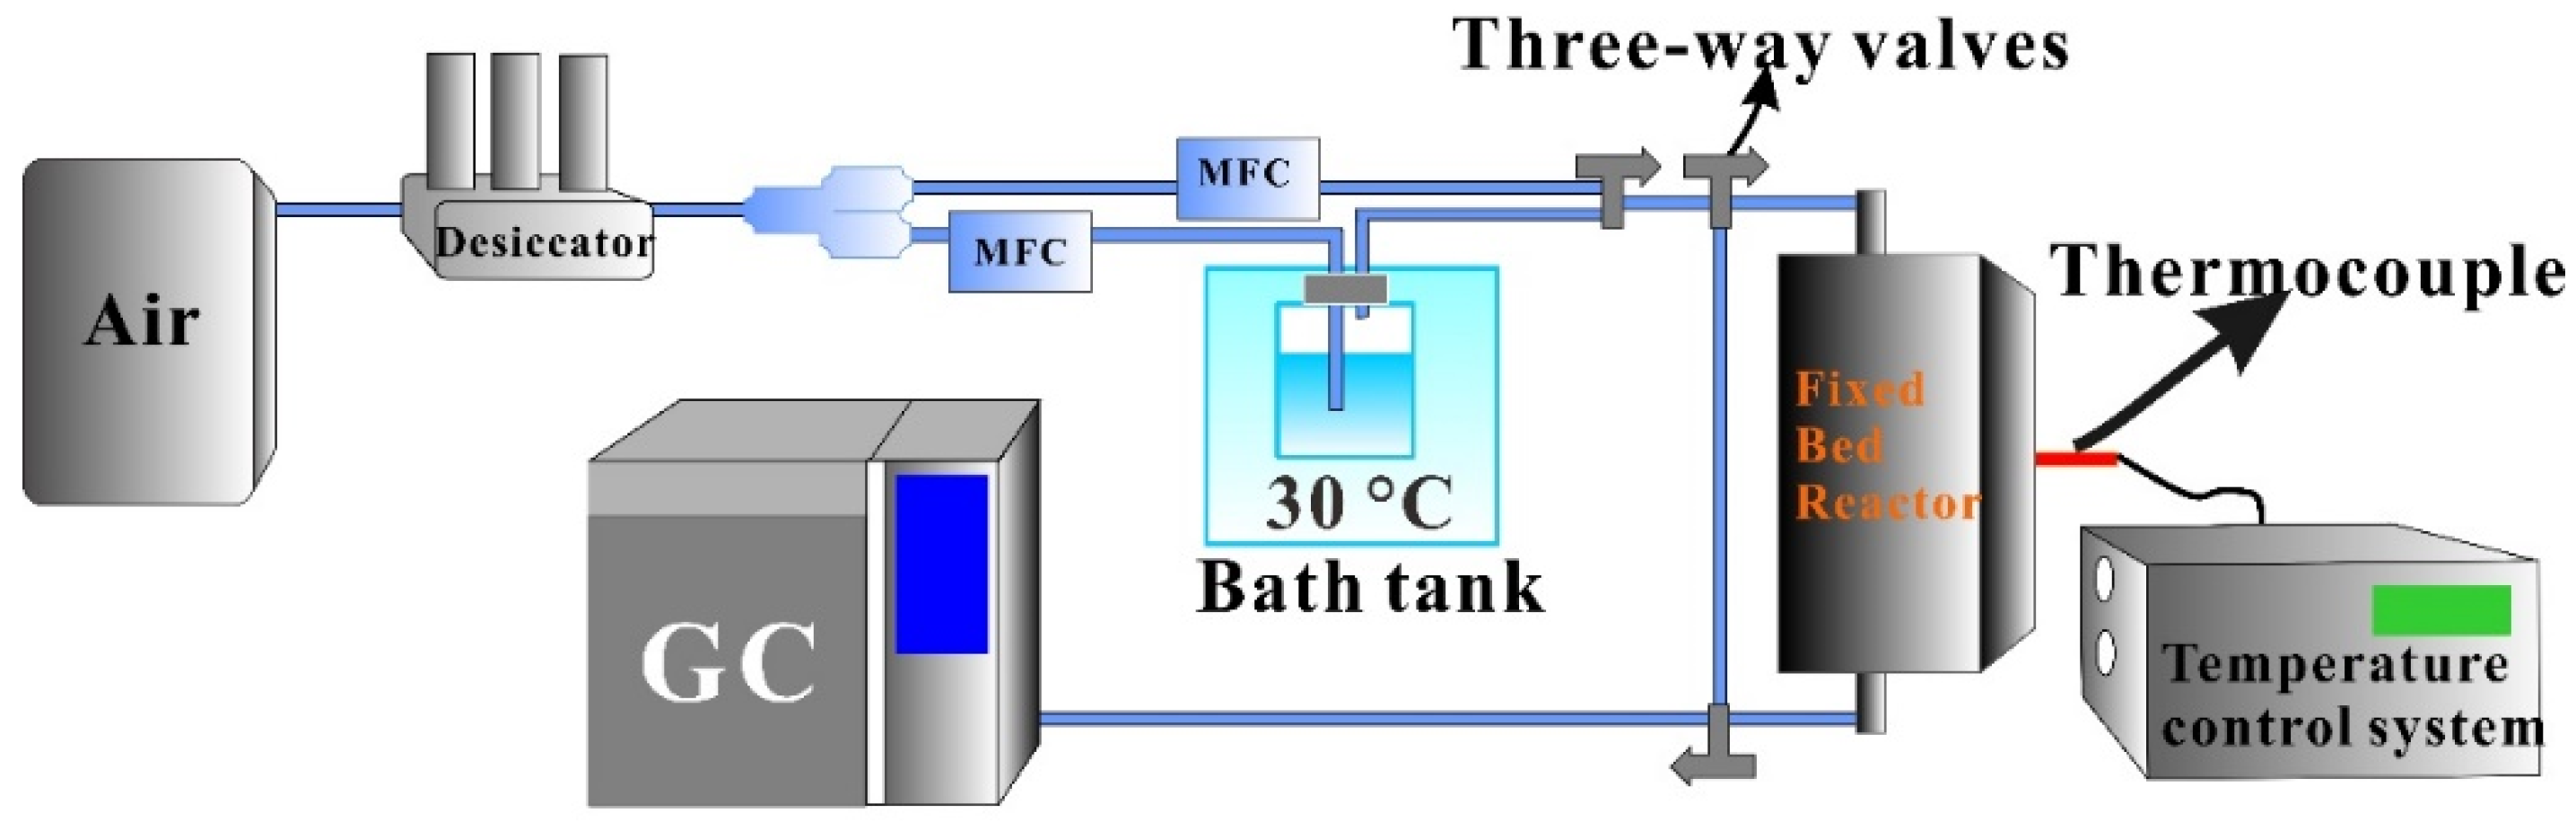
The in situ DRIFTS of DMMP on CeO2, 50%Cu/Ce, and CuO at varying temperatures were determined to ascertain the species change of DMMP on the surface of the three catalysts. As shown in 
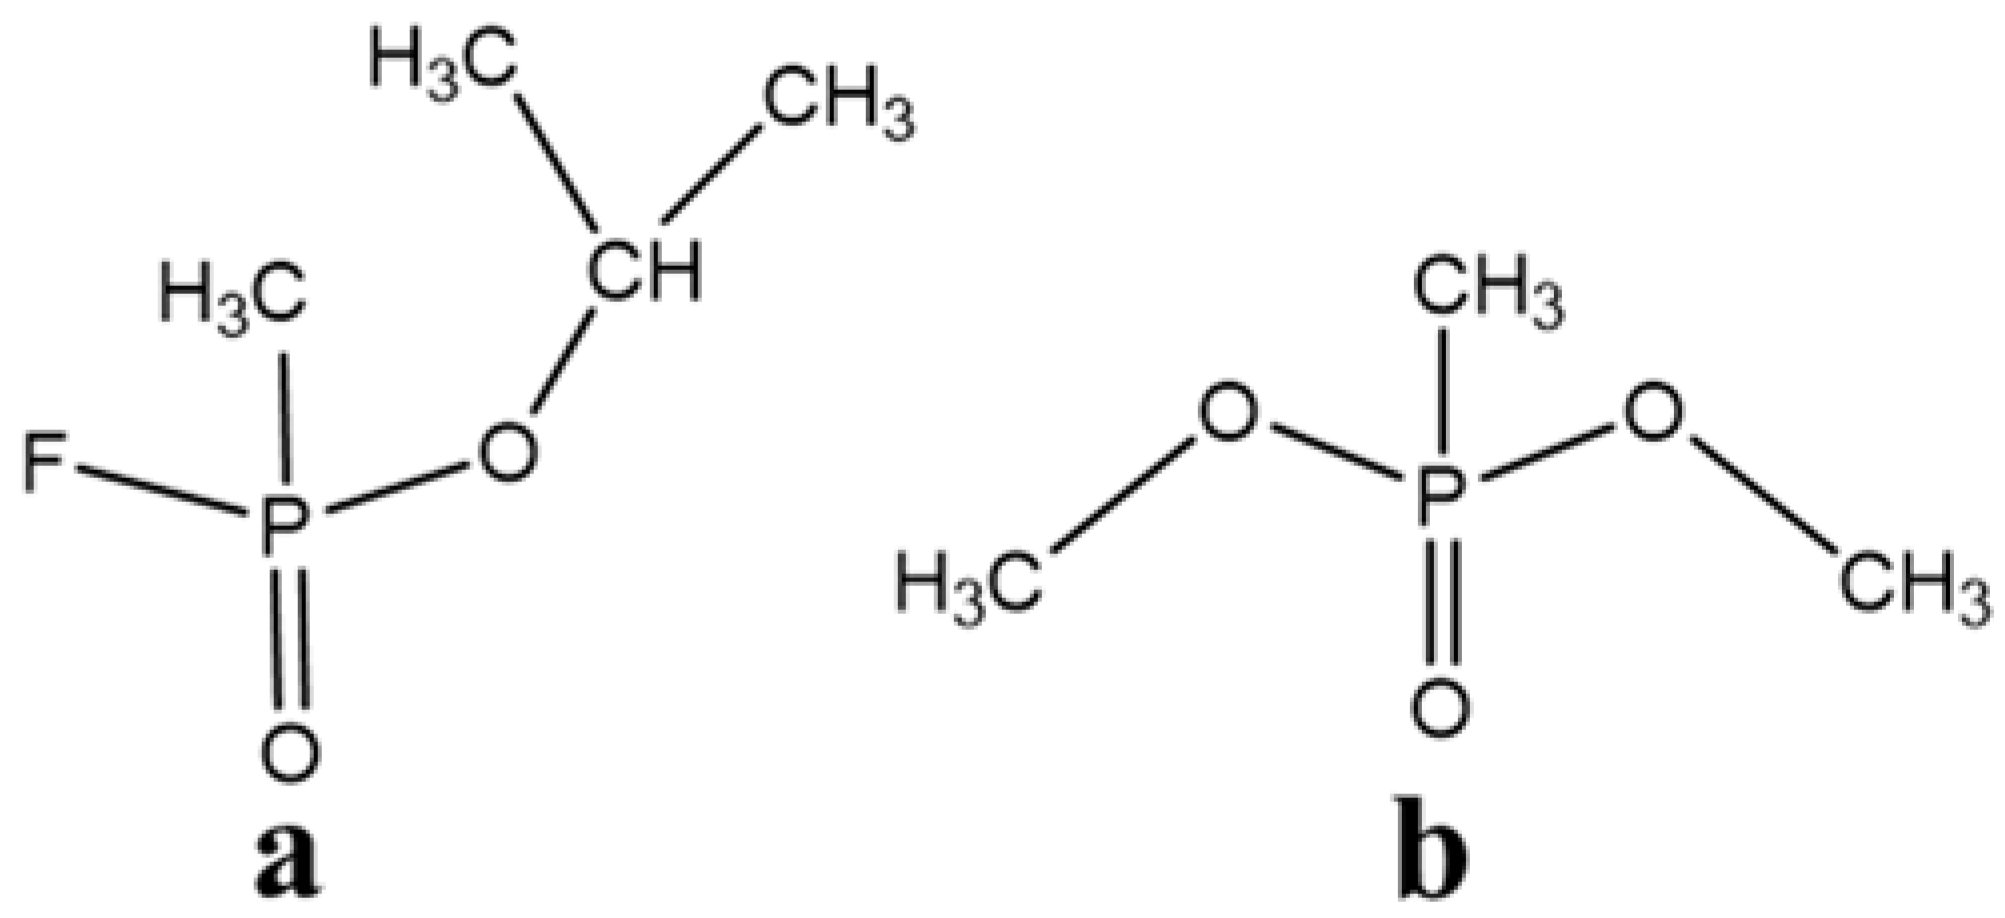
Figure 1, the molecular structure of DMMP contains P–CH3, O–CH3, P=O, P–O, P–C, C–O, and C–H bonds. The vibration peaks of chemical bonds in DMMP are mainly distributed in two regions. C–H bond-stretching vibrations of P–CH3 and O–CH3 are located in the high-frequency region from approximately 2800 cm−1 to 3200 cm−1, whereas stretching vibrations of P=O, C–O, and P–O, as well as deformation vibrations and rocking vibrations of PCH3 and OCH3 are located in the low-frequency region from 800 cm−1 to 1500 cm−1. The corresponding functional groups of the DMMP molecules were consistent with those reported in the literature [58,59], as shown in Table 8. The corresponding functional groups of surface species on CeO2, 50%Cu/Ce, and CuO are shown in Table 9. The characteristic peak located at 3500–3800 cm−1 was attributed to the stretching vibration of the surface hydroxyl groups [60,61]. As the temperature increased, hydroxyl vibration peaks of the negative-going OH bands were observed. The depletion of the surface hydroxyl groups may have originated from the formation of H bonds between the DMMP molecules and surface hydroxyl groups of CeO2, CuO, and Cu/Ce or from the surface hydroxyl groups participating in the DMMP decomposition reaction [59,62] (Figure 14, Figure 15 and Figure 16). 
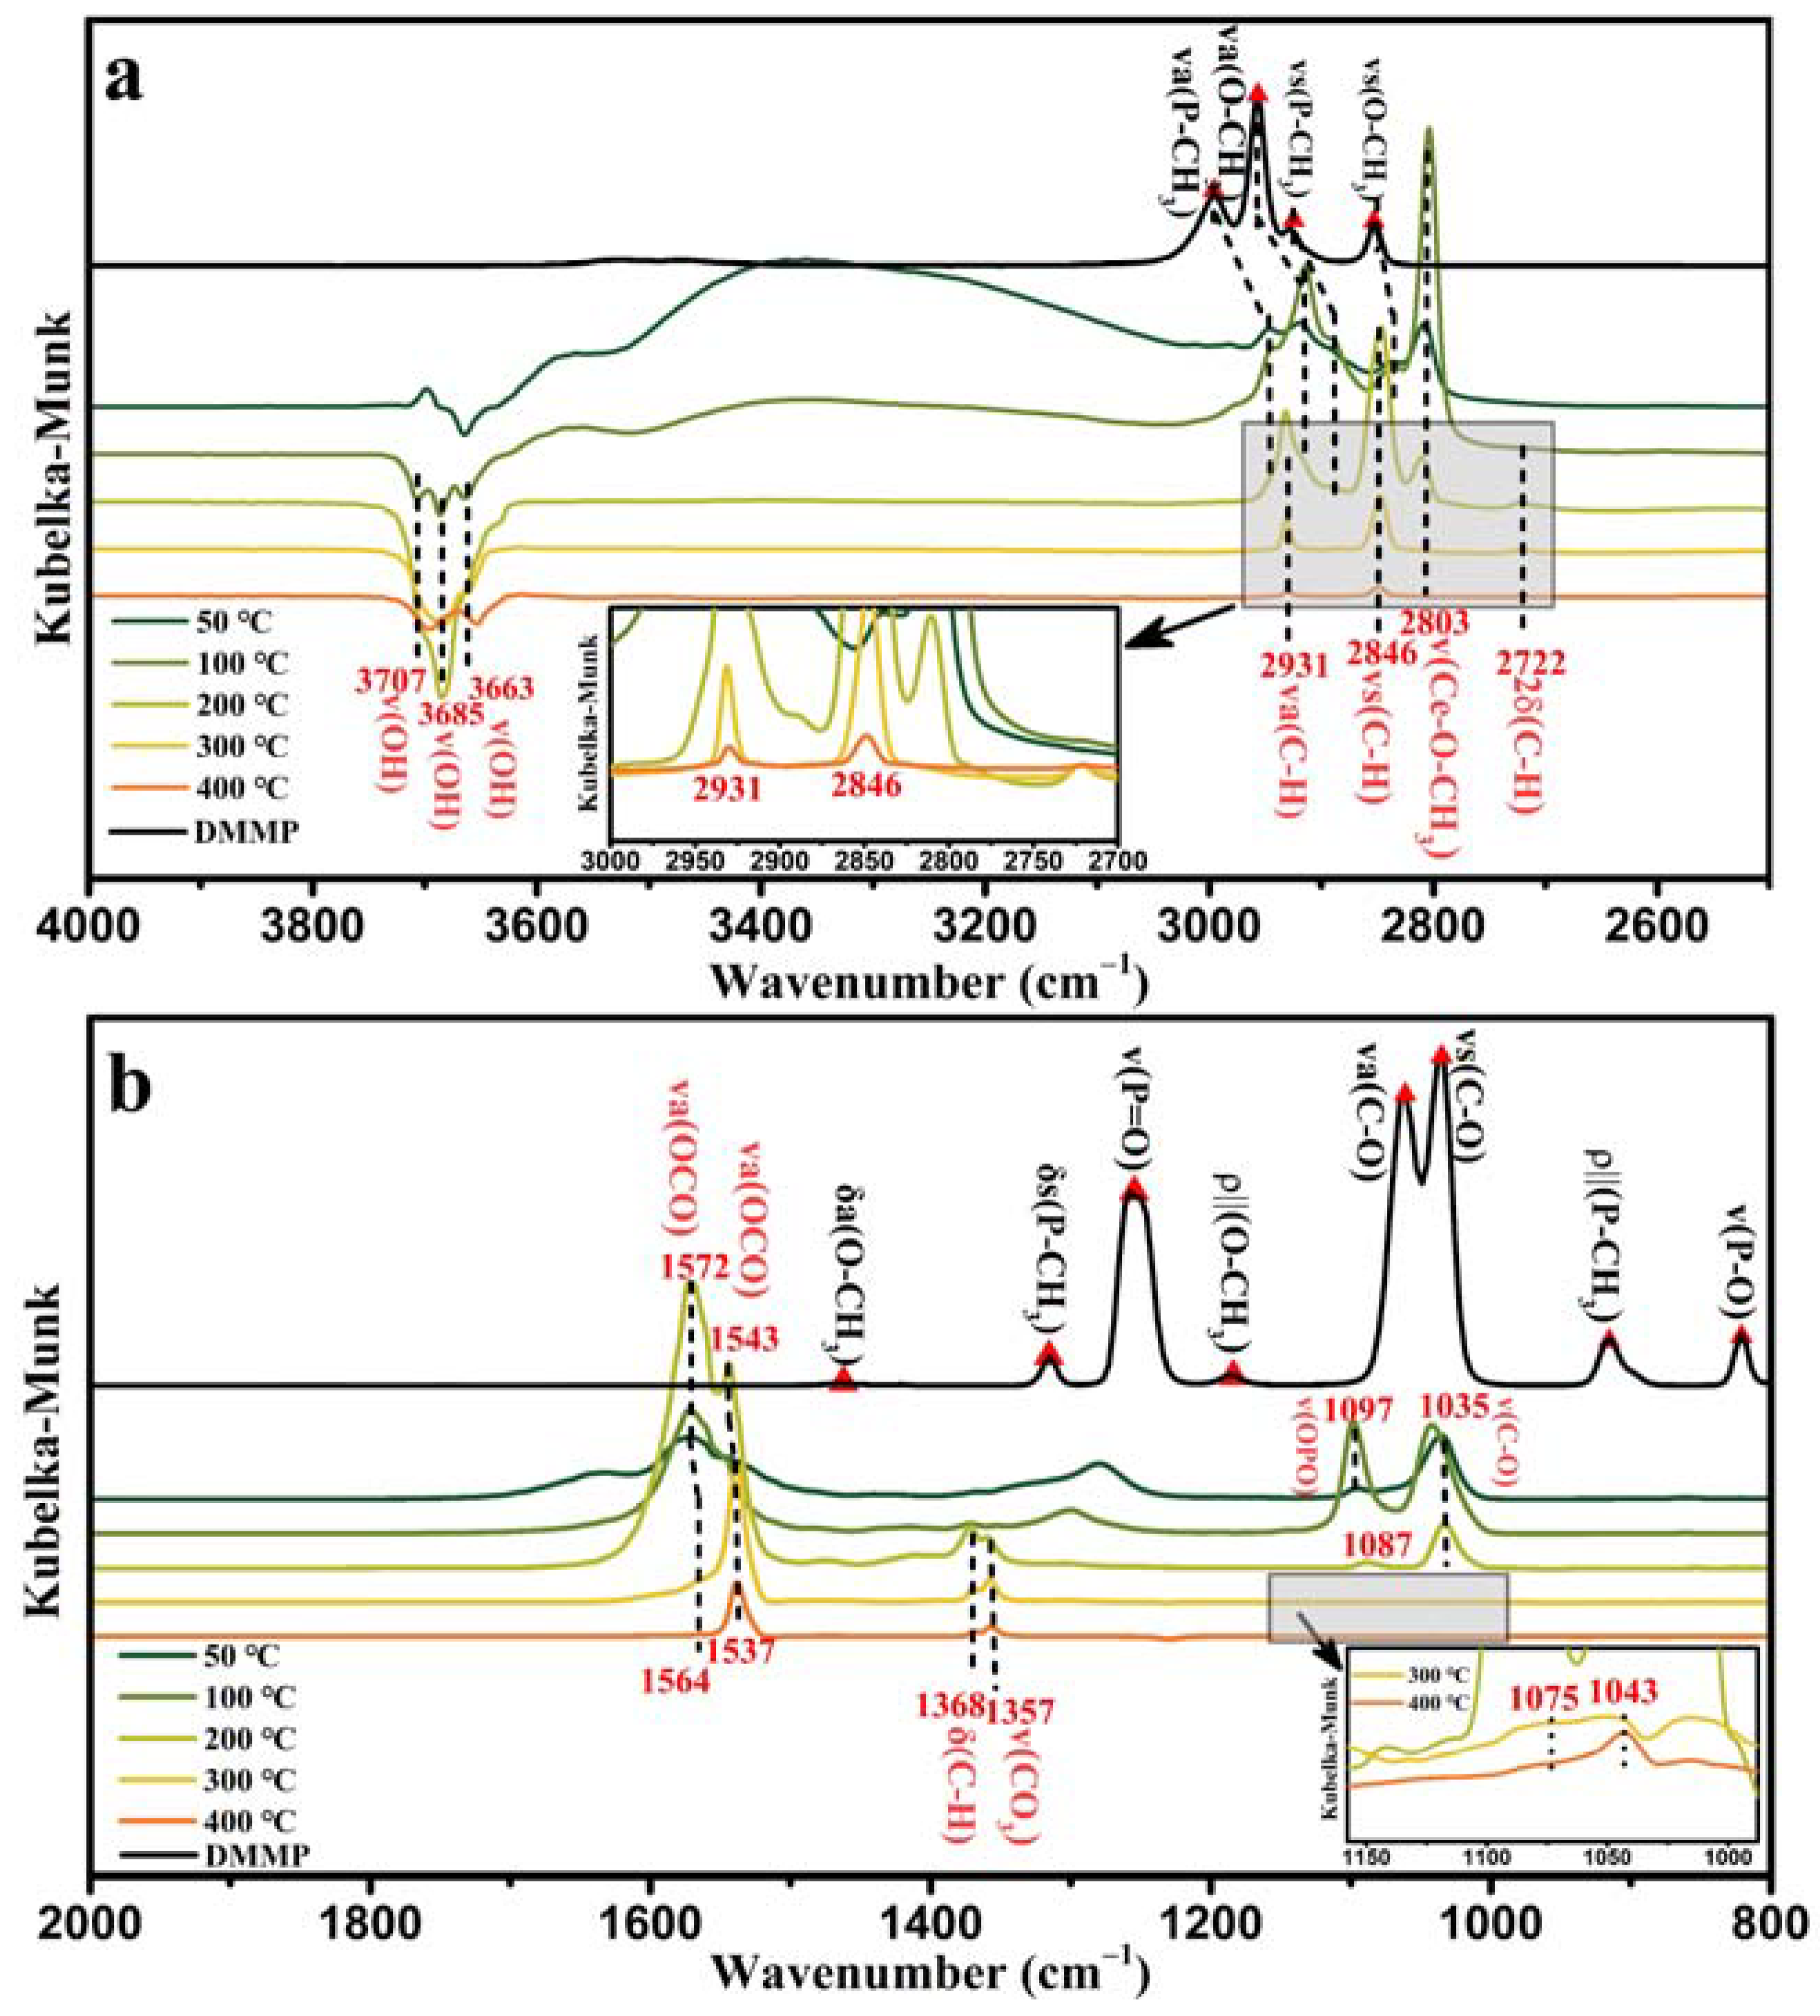
Figure 14a shows the in situ DRIFTS of CeO2 in the high-frequency region.
The characteristic infrared peaks of νa(P–CH3), νa(O–CH3), νs(P–CH3), and νs(O–CH3) in the DMMP molecules gradually weakened with increasing temperature and disappeared at 400 °C. New characteristic peaks simultaneously appeared at 2931 cm−1 and 2846 cm−1, and the peak intensity weakened with increasing temperature. Therefore, we speculated that these two peaks correspond to the ν(C–H) vibrational modes of the intermediates generated during DMMP decomposition. Morris et al. reported that cleavage of P–OCH3 led to the formation of methoxy groups, which combined with Ti ions to form surface methoxy groups. The vibrational peak of the surface methoxy shifts to a lower frequency than that of DMMP [63]. A similar phenomenon was observed in the in situ DRIFTS of CeO2. Therefore, the peak at 2803 cm−1 was attributed to ν(Ce–O–CH3). Figure 14a shows a partially enlarged view of the 2600–2900 cm−1 band in the high-frequency region, which clearly demonstrates that the peak disappeared when the temperature reached 400 °C. This indicates that the methoxy group in Ce–O–CH3 is an unstable intermediate product that can be completely decomposed by the CeO2 catalyst at 400 °C. The vibrational peak at 2722 cm−1 shown in Figure 14a was assigned to the 2δ(C–H) vibrational mode of the formate product [61]. The characteristic infrared peaks of DMMP molecules in the mid–low frequency range of CeO2 in situ DRIFTS (Figure 14b), δa(O–CH3), δa(P–CH3), ν(P=O), ρ‖(O–CH3), νa(C–O), νs(C–O), ρ‖(P–CH3), and ν(P–O), disappeared at 400 °C. The vibrational peaks at 1572–1564 cm−1 and 1537 cm−1 belong to the vibrational mode of bidentate (bdt) formate νa(OCO), and the δ(CH) vibrational mode of the formate appeared at 1368 cm−1 [61]. Additionally, the vibrational mode ν(CO3) of the carbonate appeared at 1357 cm−1 [60].
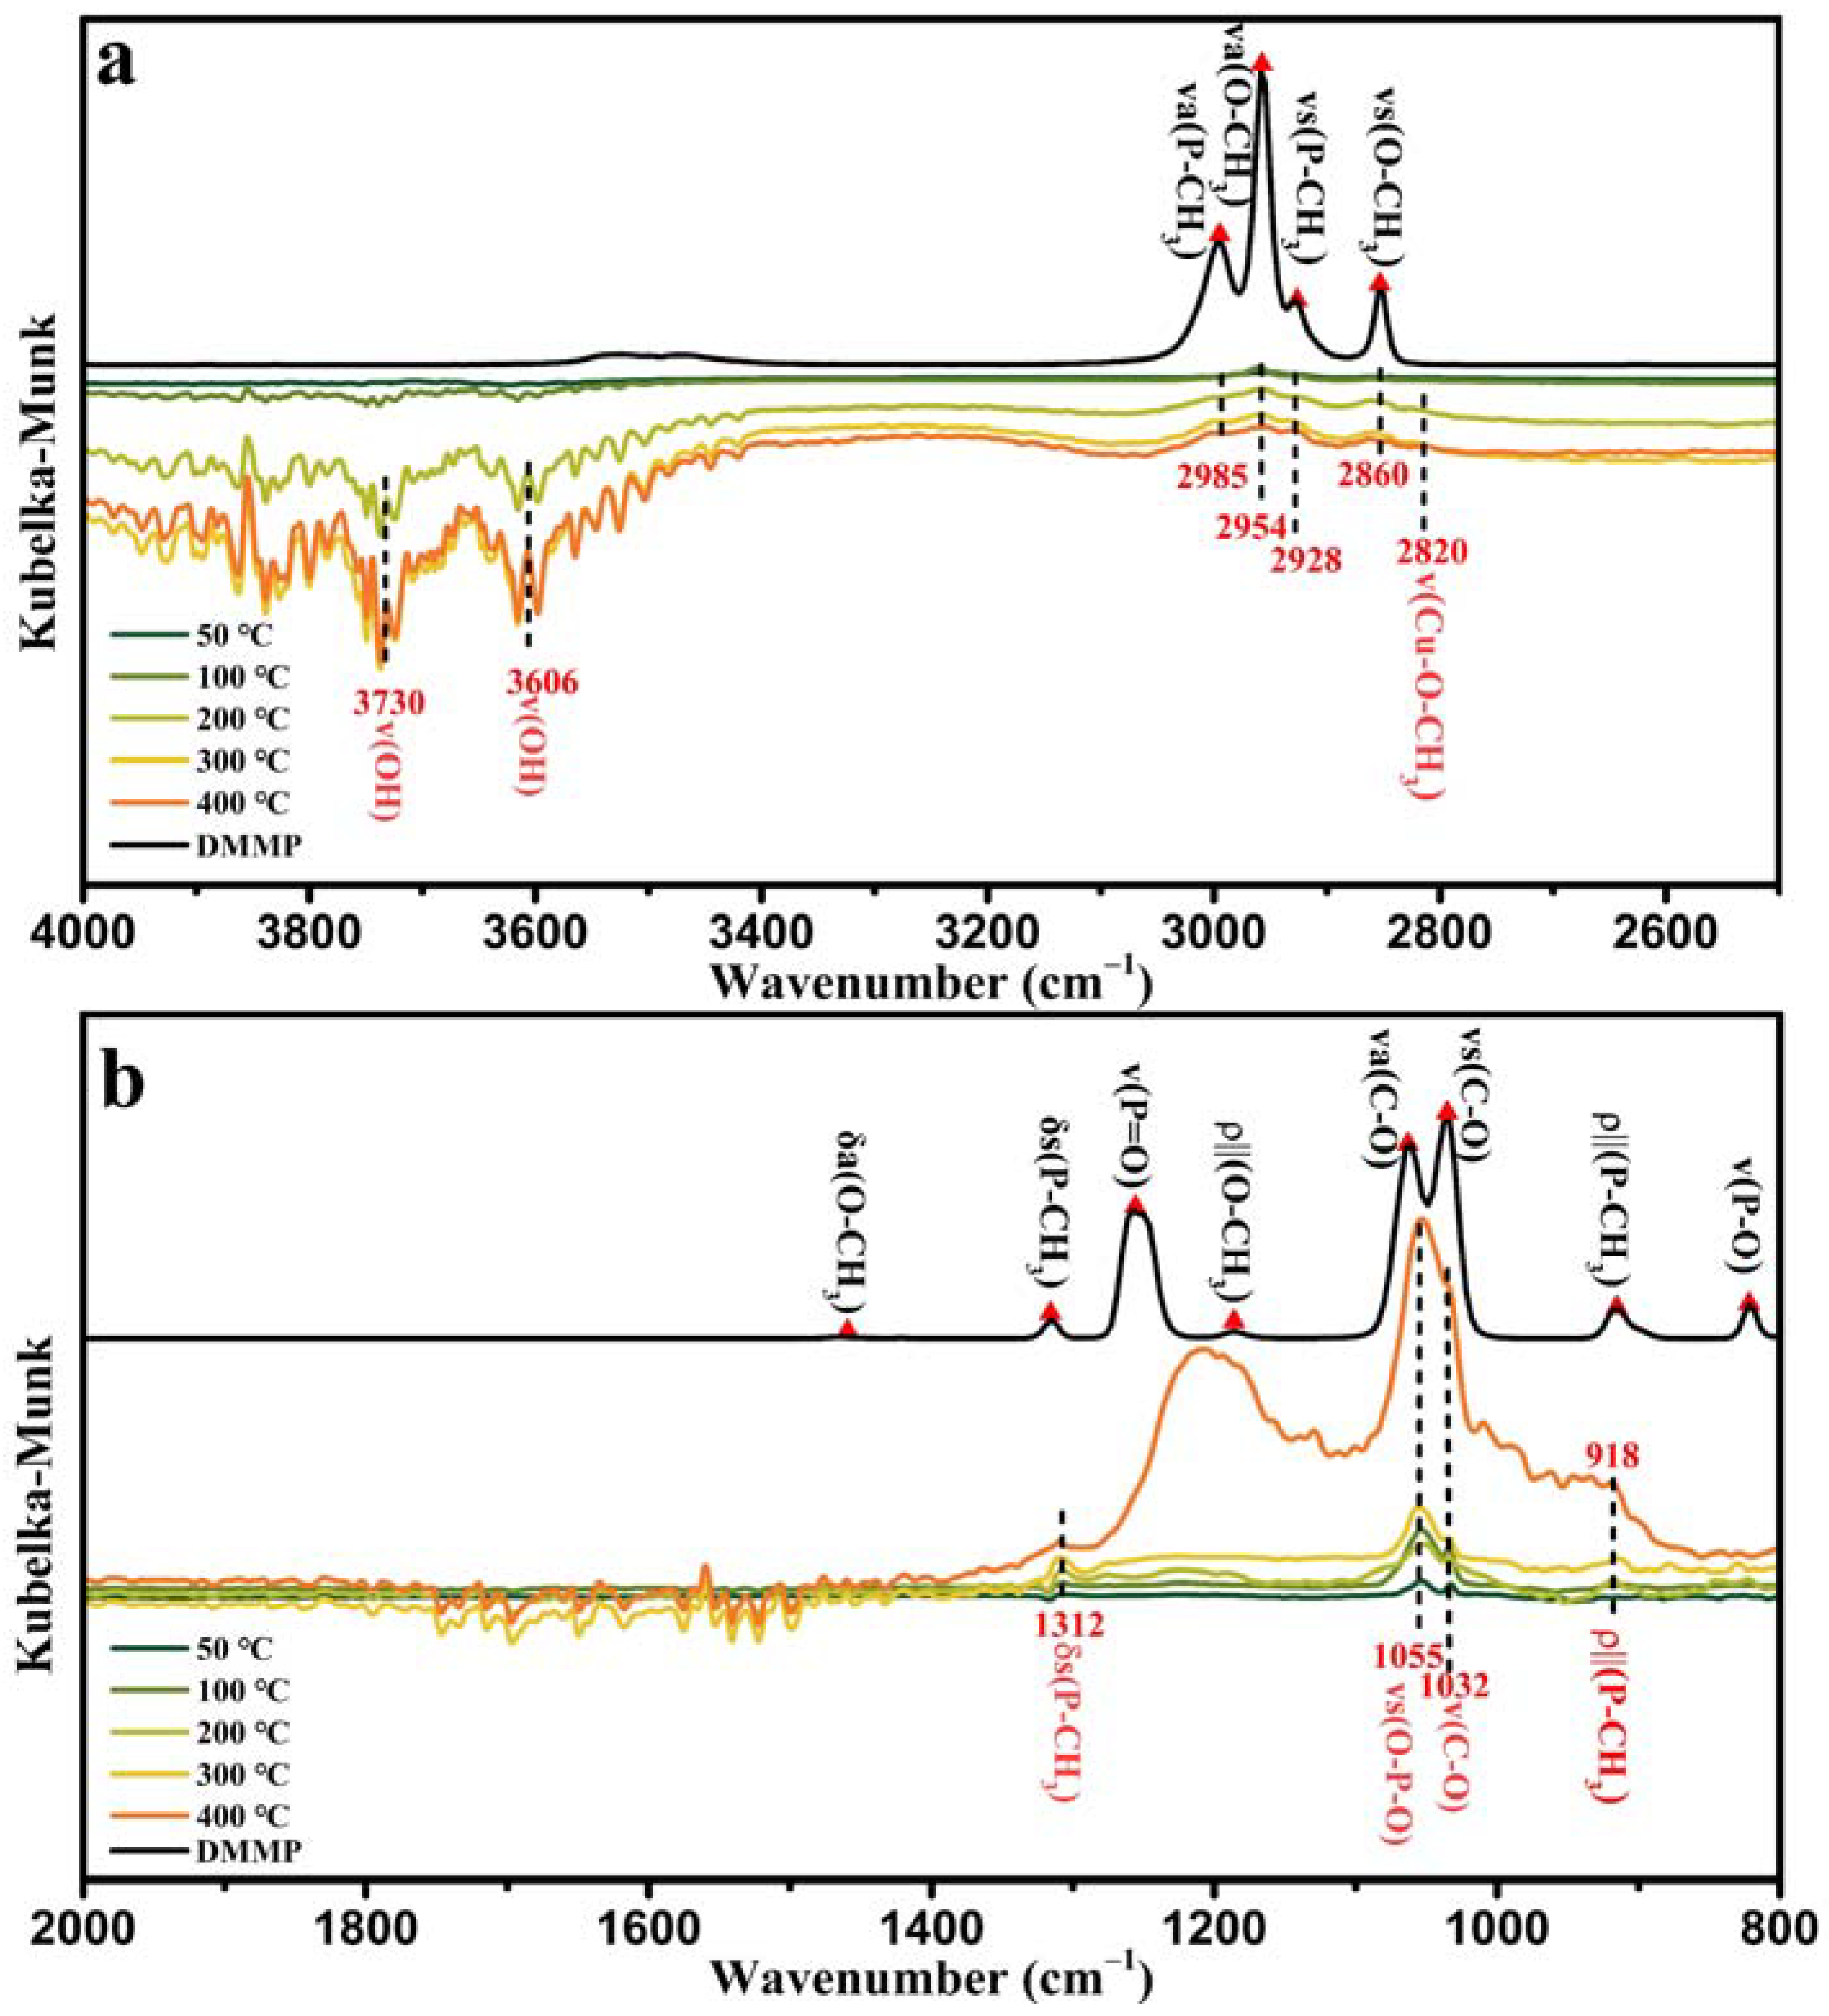
Figure 15 shows the in situ DRIFTS spectra of CuO at varying temperatures. CuO exhibited a multimodal overlap at 3100–2800 cm−1 in the high-frequency region of the in situ DRIFTS. Moreover, the in situ DRIFTS spectral peak signal of CuO in the high-frequency region was relatively weak, and it was impossible to directly distinguish the peak attribution in this region. The ν(C–H) characteristic peak of the intermediate product appeared in this region with reference to the in situ infrared spectrum of CeO2 (Figure 15a). Therefore, we speculated that the CuO peaks in this region might be the ν(C–H) characteristic peaks of the undecomposed DMMP itself and the ν(C–H) characteristic peaks of the partially decomposed DMMP products. This is similar to the in situ DRIFTS spectrum of CeO2; a ν(Cu–O–CH3) vibrational peak was also generated on the CuO surface at 2820 cm−1. The in situ DRIFTS (Figure 15b) in the mid–low frequency region clearly shows that the ν(P=O) vibration mode in DMMP disappeared, and a new bridging P species νs(O–P–O) appeared at 1055 cm−1, implying an interaction between the phosphoryl oxide and catalyst surface [21,64]. The disappearance of the ν(P–O) vibration mode in DMMP indicated that the methoxy group was separated from the DMMP molecules, and the disappearance of the δa(O–CH3), ρ‖(O–CH3), νa(C–O), and νs(C–O) vibration modes in DMMP indicated that the methoxy group completely decomposed. Although the characteristic peaks of ρ‖(P–CH3) and δs(P–CH3) in DMMP were still visible, these characteristic peaks were speculated to be characteristic peaks of methyl-containing products. At 400 °C, the peak intensities of the two bands at 1290–1150 and 1100–1000 cm−1 significantly increased, indicating that a large number of phosphorus and carbon oxygen products were produced on the surface of CuO at 400 °C [21,65].
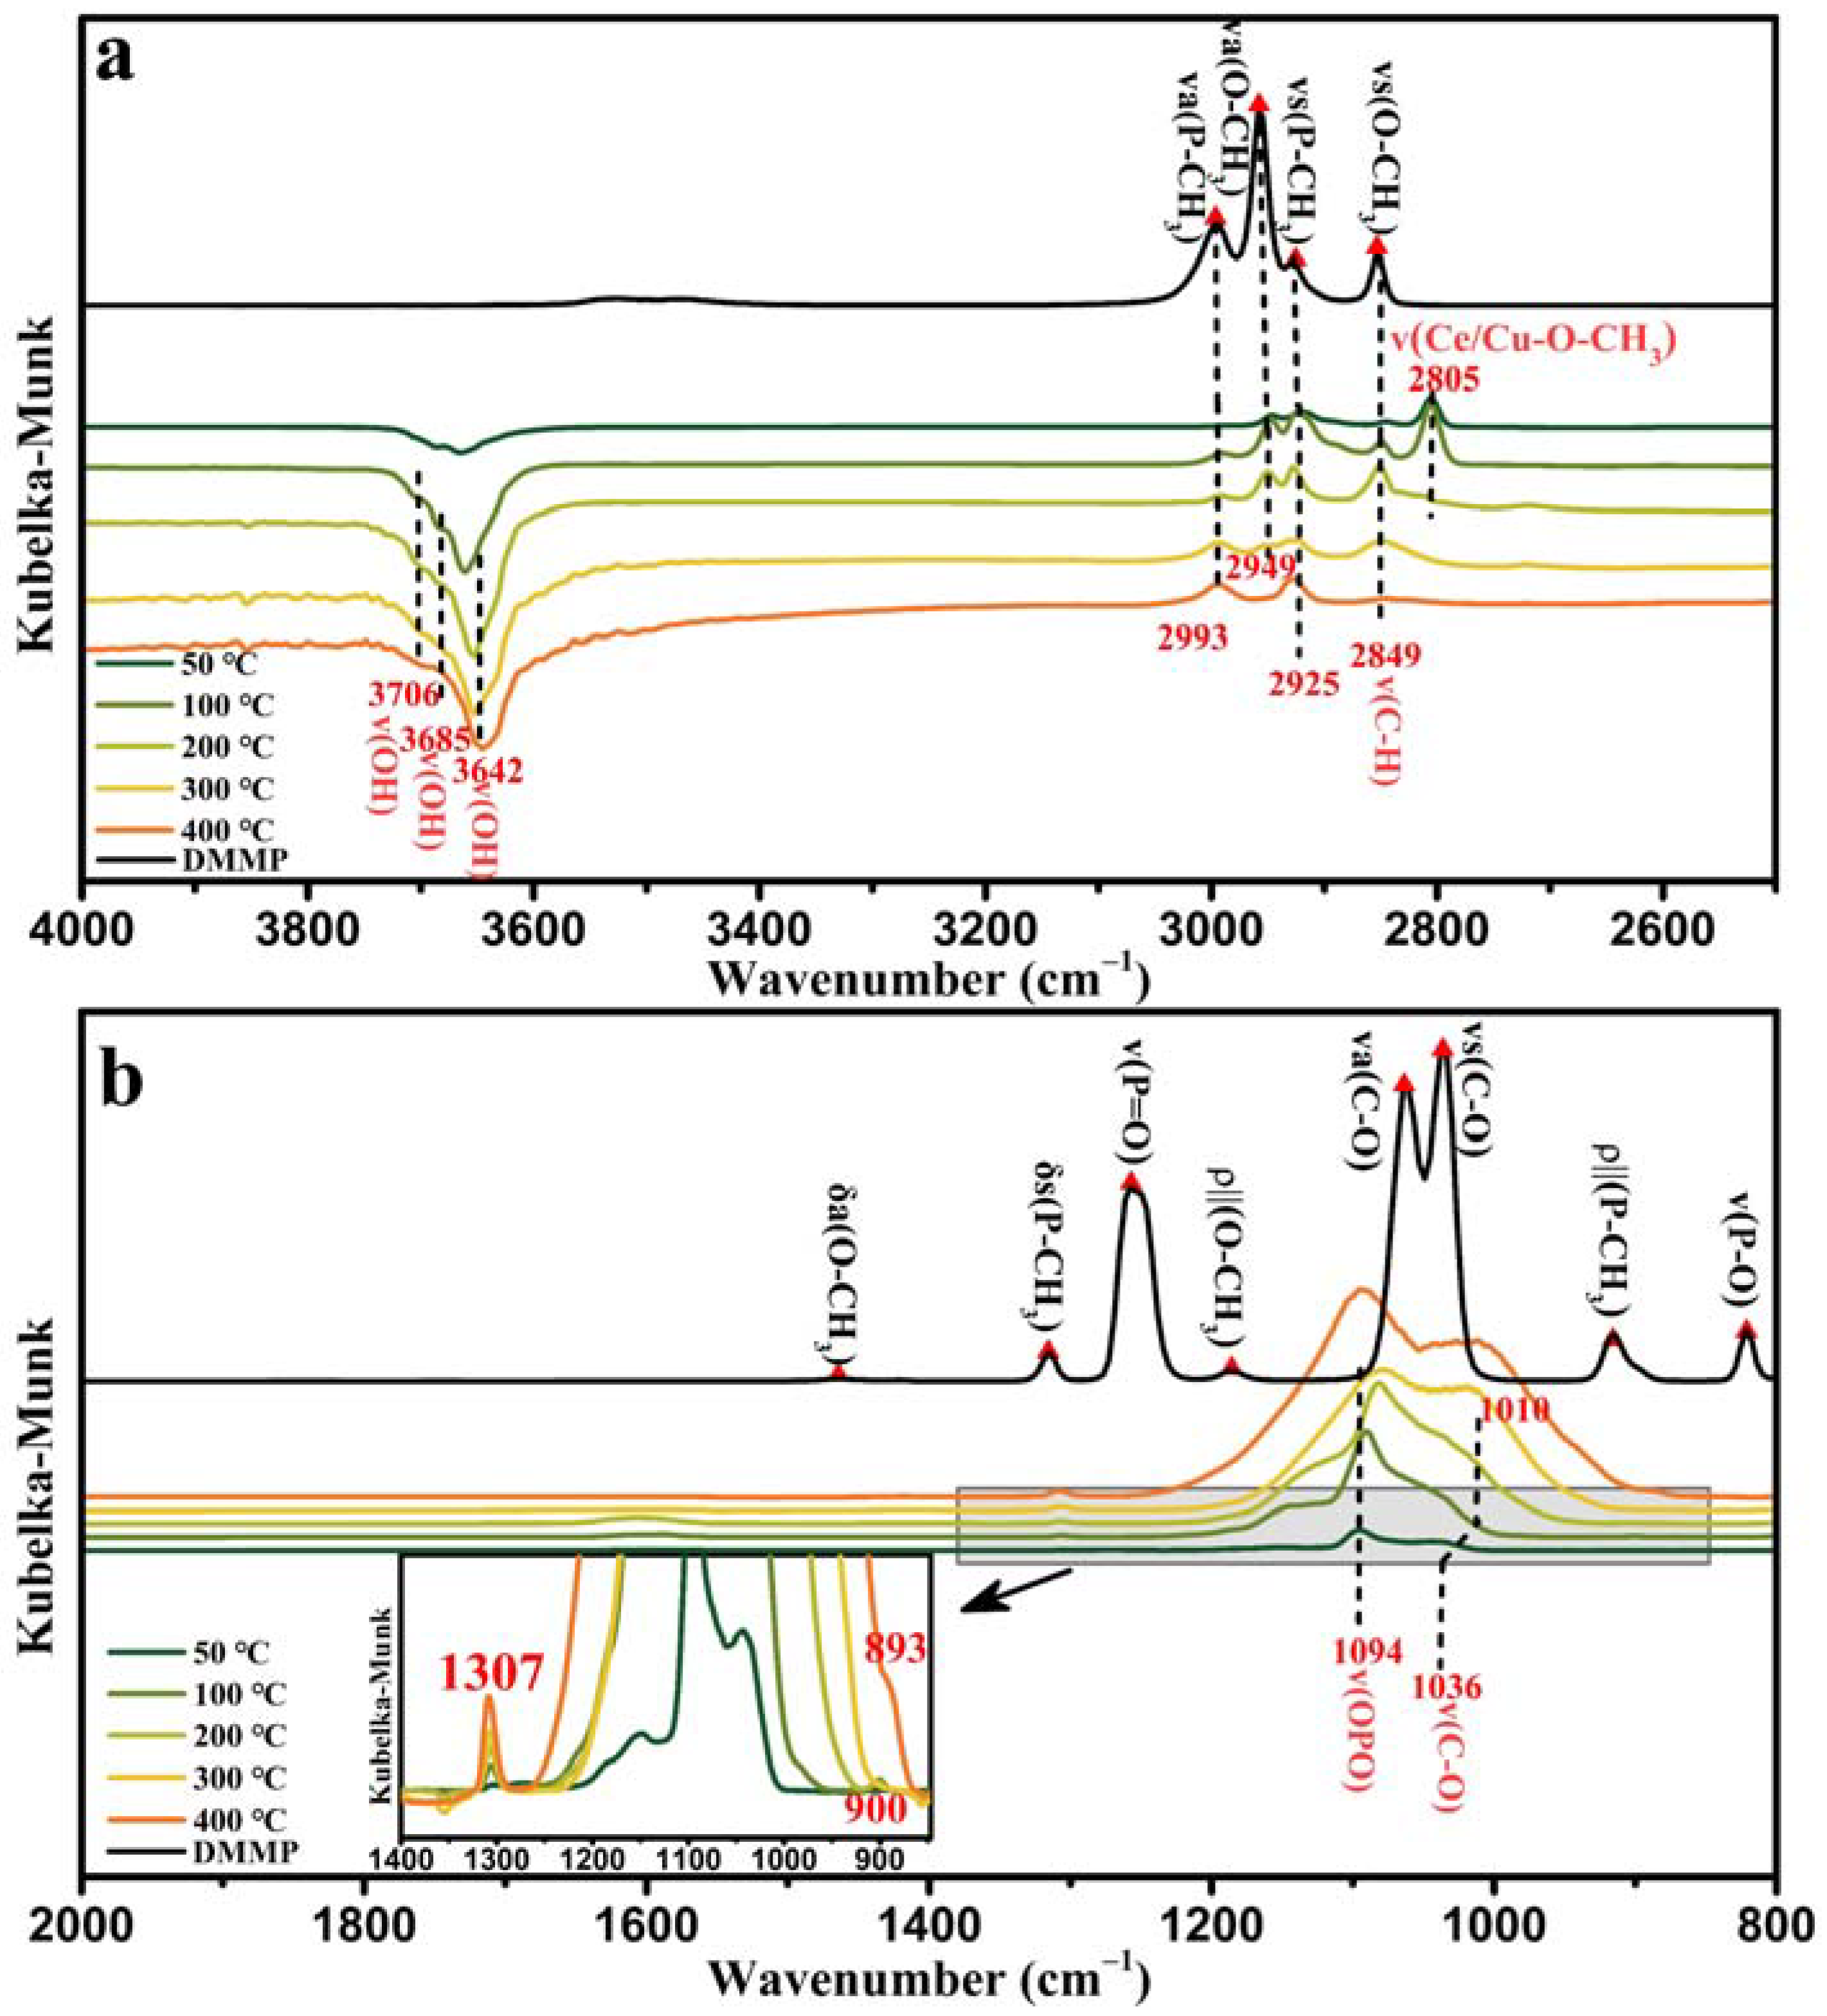
Figure 16 shows the in situ DRIFTS spectra of 50%Cu/Ce at varying temperatures. In the in situ DRIFTS (Figure 16a) in the high-frequency region of 50%Cu/Ce, the stretching vibration mode νa(P–CH3) of DMMP molecules shifted from 2996 to 2993 cm−1; νs(P–CH3) shifted from 2927 to 2925 cm−1, and the peak did not decay with increasing temperature. Therefore, we speculated that the vibration peaks of ν(P–CH3) at 2993 cm−1 and 2925 cm−1 were the DMMP decomposition products. The stretching vibration mode νa(O–CH3) in DMMP shifted from 2958 to 2949 cm−1, and the stretching vibration of νa(O–CH3) weakened with increasing temperature, disappearing at 400 °C. The vibrational mode of νs(O–CH3) in DMMP was similar to that of CeO2; therefore, we speculated that the peak at 2849 cm−1 is the ν(C–H) vibrational mode of the intermediate product generated during the decomposition of DMMP. Similar to CeO2 and CuO, the ν(Ce/Cu–O–CH3) vibrational mode of the unstable intermediate appeared near 2805 cm−1 in the 50%Cu/Ce in situ DRIFTS and disappeared at 400 °C. The spectral characteristic peaks in the low-frequency region of the in situ DRIFTS (Figure 16b) of 50%Cu/Ce at 400 °C were similar to those of CuO, i.e., the methoxy group in DMMP completely decomposed. A methyl-containing product peak was present at 1307 cm−1. Large quantities of phosphorus and carbon oxygen products were produced in the 1250–900 cm−1 band, and the magnified image of the 1350–850 cm−1 band shows that the 1307 cm−1 and 900–893 cm−1 bands are characteristic peaks of methyl-containing products.
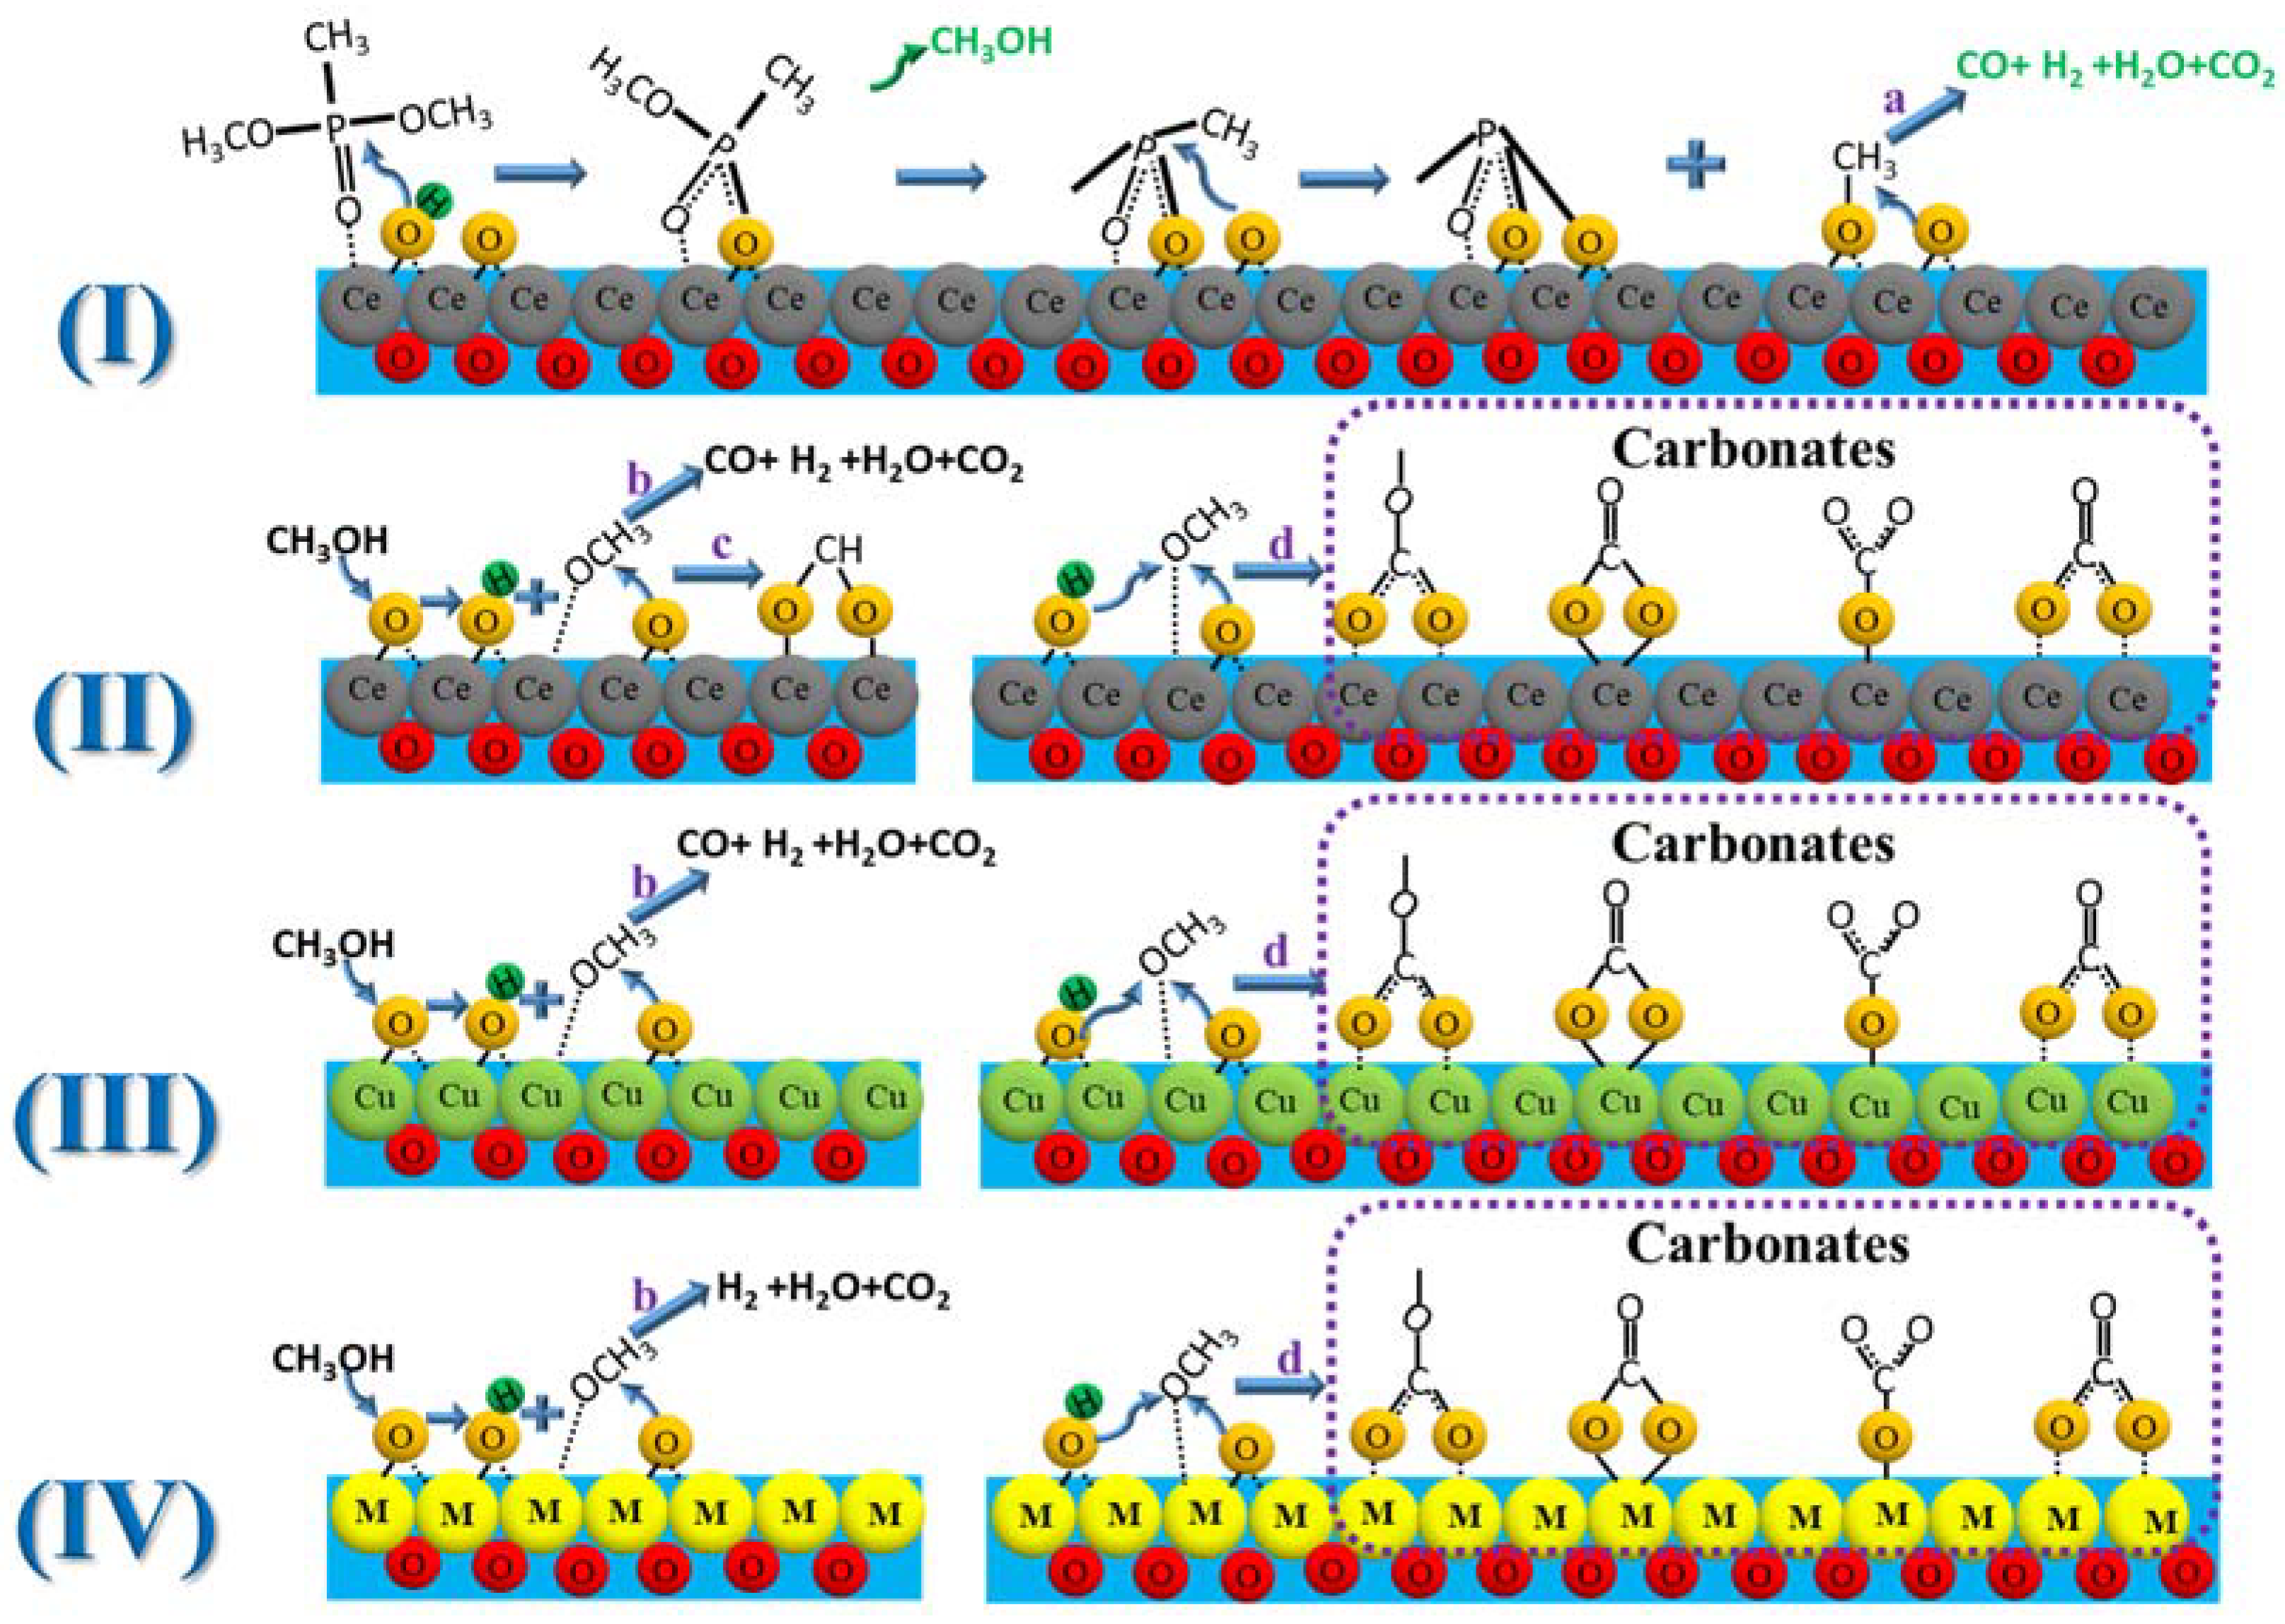
The reaction pathways for the catalytic decomposition of DMMP on CeO2, CuO, and CuO/CeO2 were speculated using the combined ion chromatography, mass spectrometry, and in situ DRIFTS data (Scheme 1). Scheme 1(I) shows the presumed reaction pathway for the decomposition of DMMP on the surface of CeO2. First, the electron-rich O in DMMP combines with Ce or surface hydroxyl groups on the surface of CeO2. The surface hydroxyl groups nucleophilically attack P, breaking the P–OCH3 bond, and combine the methoxy group with H to generate gaseous methanol. Simultaneously, methyl phosphates with bridged O–P–O structures formed on the surface [4,21,59] The surface lattice O in CeO2 nucleophilically attacks the methyl group in methyl phosphate, forming a POx species on the CeO2 surface, and the methyl group is further dehydrogenated to CO, H2, CO2, and H2O (Scheme 1a). According to Wu et al., methanol can induce a series of side reactions on the CeO2 surface [61]. First, in Scheme 1(II) methanol reacts with the CeO2 surface lattice O to form surface methoxy Ce–O–CH3. The methoxy groups continue to react with the surface lattice O or hydroxyl groups, fully dehydrogenating to form CO, H2, CO2, and H2O (Scheme 1b) and partially dehydrogenating to form formate (Scheme 1c) [66], which reacts with the surface lattice O and completely dehydrogenates to form carbonate (Scheme 1d) [67]. Based on the in situ DRIFTS data, we speculated that the carbonates may contain one or more species, including polydentate, bidentate, bridged, and monodentate carbonates, due to the broadband nature of their vibrational modes. The catalytic decomposition pathways of DMMP on CuO and CuO/CeO2 are essentially the same as those on CeO2 (Scheme 1(I)). The difference is that there is no formate in the decomposition products of the CuO and CuO/CeO2 catalytic decomposition of DMMP (Scheme 1c), and no CO is generated in the decomposition products of the CuO/CeO2 catalytic decomposition of DMMP. This indicates that the synergistic effect of the bimetals enhances the selectivity for the fully catalytic oxidation product of DMMP, CO2.
Various mechanisms have been proposed over ceria-based catalysts in the literature [68,69,70], which can be generally broken down into three main categories: the Eley-Rideal mechanism [71], the Langmuir-Hinshelwood mechanism [72], and the Mars-van-Krevelen mechanism [73,74]. In catalytic reactions at higher temperatures, the mechanism of CeO2-based materials is mainly the Mars-van-Krevelen mechanism. The Mars-van-Krevelen mechanism consists of a redox cycle. First, reactant molecules interact with the lattice oxygen on the catalyst surface, and oxygen vacancies are formed on the catalyst surface. Then, the oxygen vacancies are refilled by gaseous oxygen or oxygen atoms from the bulk. Kinetic experimentation is needed in future studies to verify the thermal catalytic DMMP decomposition mechanism of as-prepared materials reported in the present study.

3. Materials and Methods

3.1. Synthesis of CeO2 Catalyst

Ce(NO3)3·6H2O (99.9%) and NaOH (99.9%) were obtained from Macklin, Shanghai, China. First, 2.6 g Ce(NO3)3·6H2O was dissolved in deionized water (10 mL). Then, 21.6 g NaOH was dissolved in 45 mL of deionized water. The Ce(NO3)3 solution was added dropwise to the NaOH solution and continuously stirred at room temperature for 30 min. This mixture was hydrothermally treated in 100 mL Teflon-lined autoclaves for 24 h at 100 °C. After naturally cooling to room temperature, the products were centrifuged and washed several times with deionized water and ethanol. The precipitate was dried at 100 °C for 8 h and used for the synthesis of CuO/CeO2 catalysts. Then, the precipitate was calcined at 400 °C for 4 h and used for characterization, catalytic performance testing, and reaction mechanism analysis.

3.2. CuO/CeO2 Catalyst Preparation

A secondary alkaline hydrothermal approach was adopted to load CuO on CeO2 nanorod supports to synthesize CuO/CeO2 catalysts. Specifically, 3 g of the precipitates was fully dispersed in 10 mL of deionized water, including the calculated amount of Cu(NO3)2·3H2O, and slurries were obtained with 30 min of continuous stirring. Then, 10.8 g of NaOH was dissolved in 45 mL of deionized water. The NaOH solution was dropped into the slurry and stirred for 30 min. The mixture slurries were hydrothermally treated in a 100 mL Teflon-lined autoclave for 24 h at 100 °C. After naturally cooling to room temperature, the products were centrifuged and washed several times with deionized water and ethanol, dried at 100 °C for 8 h, and calcined at 400 °C for 4 h in air. Four types of CuO/CeO2 catalysts were prepared using 0.87, 1.74, 4.36, and 6.97 g of Cu(NO3)2·3H2O and labeled as 10%Cu/Ce, 20%Cu/Ce, 50%Cu/Ce, and 80%Cu/Ce, respectively.

3.3. Synthesis of CuO Catalyst

CuO was prepared using a hydrothermal method. First, 8.7 g of Cu(NO3)2·3H2O was fully dispersed in deionized water (10 mL). Then, 10.8 g of NaOH was dissolved in 45 mL of deionized water. The Cu(NO3)2 solution was added dropwise to the NaOH solution and continuously stirred at room temperature for 30 min. This mixture was hydrothermally treated in 100 mL Teflon-lined autoclaves for 24 h at 100 °C. After naturally cooling to room temperature, the products were centrifuged and washed several times with deionized water and ethanol. The precipitates were dried at 100 °C for 8 h and calcined at 400 °C for 4 h in air.

3.4. Characterization of CuO/CeO2 Catalysts

XRD analyses were performed on a 9 kW SmartLab (Rigaku, Saitama, Japan) with Cu Kα radiation (λ = 1.5418 Å). The Cu and Ce contents were analyzed using inductively coupled plasma optical emission spectrometry (ICP-OES; Agilent 725 ES, Santa Clara, CA, USA). N2 adsorption–desorption measurements were performed on a Nova 4200e Quantachrome surface area analyzer (Quantachrome Instruments, Boynton Beach, FL, USA) at 77 K and calculated using the Brunauer–Emmett–Teller (BET) model. TEM images and energy-dispersive X-ray spectroscopy (EDX) images of the samples were obtained using a TECNAI F20 electron microscope. H2-TPR was performed using an AutoChem II 2920 instrument (Micromeritics, Norcross, GA, USA). The samples (60 mg) were heated to 300 °C at 50 mL/min of He for 3 h and cooled to 50 °C. Temperature-programmed reduction was performed by heating the sample at 10 °C/min from 50 to 900 °C in an H2/Ar mixture (10% H2, 90% Ar, 50 mL/min). O2-TPD analyses were performed on an AutoChem II 2920 (Micromeritics, Norcross, GA, USA) as follows. The sample (60 mg) was first treated with He (50 mL/min) at 300 °C for 3 h to remove adsorbed impurities. After cooling to 50 °C, the sample was exposed to O2/Ar (10% O2, 90% Ar, 30 mL/min) for 1 h. Then, the sample was purged with He (30 mL/min) for 1 h. Finally, the sample was heated to 800 °C at 10 °C/min in He (30 mL/min). XPS measurements were conducted using a Thermo Fisher ESCALAB 250Xi (Waltham, MA, USA) system with Al-Kα radiation. The binding energy was calibrated using the C 1s peak (284.8 eV) as the internal standard. The XPS data were analyzed using Avantage software v5.976 (Thermo Fisher). All peaks of the corrected spectra were fitted with a Gaussian–Lorentzian shape function to fit the data. Raman spectroscopy was performed on a HORIBA LabRAM HR Evolution (Longjumeau, France) with 532 nm laser excitation. In situ DRIFTS spectra were acquired during the reaction process using a Nicolet iS50 instrument (Thermo Fisher Scientific, Waltham, MA, USA) to monitor the DMMP thermal catalytic decomposition reaction. During the reaction, 64 scans were recorded at an 8 cm−1 resolution (to minimize collection time) to form the spectra shown.

3.5. Thermal Catalytic Decomposition Performance Tests

The performances of the catalysts were evaluated using a custom-built catalytic evaluation system (Figure 17). Compressed air at 100 mL/min was used as the carrier gas. The compressed air flowed through a bubbler filled with DMMP at 30 °C to create a DMMP vapor stream. To avoid DMMP vapor condensation, the temperature of the gas line was maintained at 100 °C. Under these conditions, the inlet DMMP concentration was 8.46 g/m3. A gas chromatograph (Agilent 6890N, chromatographic column DB-1701, Santa Clara, CA, USA) equipped with a flame ionization detector was used for online analysis. A blank DMMP decomposition experiment was conducted in an empty reactor to verify the thermal stability of DMMP at 400 °C. Then, 0.46 g of CuO/CeO2 catalysts (20–40 mesh) was loaded in a 4 mm reaction tube with a catalytic temperature of 400 °C and a gas hourly space velocity (GHSV) of 20,000 h−1. The catalytic decomposition performance was expressed in terms of the protection time (Protection time is defined as the duration of DMMP conversion at 100%). The DMMP conversion rate is defined by Equation (1).
DMMP   conversion   rate = 1 C out C in × 100 %
where Cout is the content of DMMP in the reaction tail gas, and Cin is the initial content of DMMP created by the bubbler.

3.6. Characterization of Products in the Thermal Catalytic Decomposition Reaction

Thermal catalytic decomposition microreactions were performed in a CATLAB microreactor (Hiden Analytical, Warrington, UK). First 0.05 g CuO/CeO2 was loaded in the reaction tube and dried for 2 h at 300 °C under He (100 mL/min). After the sample naturally cooled to room temperature, it was heated to 400 °C at 10 °C/min. A given concentration of DMMP vapor was introduced to the reaction tube using an 80% Ar and 20% O2 mixture bubbled in a flask containing DMMP at 10 °C with a constant flux of 50 mL/min. The reaction tail gas was monitored using an HPR-20 mass spectrometer (Hiden Analytical, Warrington, UK). Ion chromatography was performed on an ICS-5000 instrument (Thermo Scientific, Waltham, MA, USA). The spent catalyst was dissolved in aqua regia and hydrofluoric acid, with a 15 mM KOH buffer used as eluent.

4. Conclusions

CeO2 nanorods were used as catalyst supports to prepare CuO/CeO2 catalysts with varying loading ratios using a secondary hydrothermal method. The addition of NaOH during the secondary hydrothermal process partially dissolved CeO2. During the recrystallization process, Cu was doped into the CeO2 lattice, resulting in more defects in the CeO2 lattice and the formation of a Cu–V–Ce structure, which facilitated oxygen transfer. This preparation method provides a new and feasible method for lattice-doped bimetallic catalysts. Furthermore, the performance of CeO2, CuO/CeO2, and CuO in the thermal catalytic decomposition of DMMP was investigated. The load of CuO considerably improved the protection time as compared to the CeO2 and CuO catalysts. Among the Cu/Ce catalysts with varying ratios, the protection time first increased and then decreased with an increasing loading ratio, and the 50%Cu/Ce catalyst had the longest protection time. A strong interaction was generated between CeO2 and CuO through electron transfer, and the bimetallic synergy between Cu and Ce enhanced the catalytic decomposition performance of the CeO2. The catalytic reaction pathways of CeO2, CuO, and CuO/CeO2 were similar, and the gas-phase products were CH3OH, CO2, H2O, and H2. However, CO was still present in the gas-phase products of CeO2 and CuO, whereas the gas phase of CuO/CeO2 was CO2, indicating that the CuO/CeO2 bimetallic catalyst had higher selectivity for CO2. Carbonate and formate byproducts were formed on the CeO2 catalyst surface, whereas only carbonates were formed on the surfaces of the CuO and CuO/CeO2 catalysts. The accumulation of P–O and C–O products on the surface of the three catalysts resulted in their eventual deactivation. This study preliminarily revealed the mechanism of the CuO/CeO2 catalyst for catalysis of the decomposition of DMMP, which can inform the design of catalysts for the efficient degradation of chemical poisons in the future.

Author Contributions

W.K. and S.Z. designed the experiments, made the main contribution to the experimental works, and managed the experimental and writing process as co-first authors; X.W. and Q.H. assisted in accomplishing a part of the experimental works and characterizations; S.Z., P.Y. and Y.D. provided the concept of this research, participated in the guidance of this work, and provided advice on the synthesis of CeO2 supports and catalyst characterization as the corresponding authors. Y.Y. participated in the guidance of this work and provided advice on the synthesis of CeO2 supports and catalyst characterization as the corresponding authors. All authors have read and agreed to the published version of the manuscript.

Funding

This work was financially supported by the National Natural Science Foundation of China (No. 21701186) and the Fundamental Research Funds from State Key Laboratory of NBC Protection for Civilian (SKLNBC 2019-04), China.

Conflicts of Interest

The authors declare no conflict of interest.

References

  1. Jang, Y.J.; Kim, K.; Tsay, O.G.; Atwood, D.A.; Churchill, D.G. Update 1 of: Destruction and Detection of Chemical Warfare Agents. Chem. Rev. 2015, 115, PR1–PR76. [Google Scholar] [CrossRef] [PubMed]
  2. Monji, M.; Ciora, R.; Liu, P.K.T.; Parsley, D.; Egolfopoulos, F.N.; Tsotsis, T.T. Thermocatalytic decomposition of dimethyl methylphosphonate (DMMP) in a multi-tubular, flow-through catalytic membrane reactor. J. Membr. Sci. 2015, 482, 42–48. [Google Scholar] [CrossRef]
  3. Nawala, J.; Jozwik, P.; Popiel, S. Thermal and catalytic methods used for destruction of chemical warfare agents. Int. J. Environ. Sci. Technol. 2019, 16, 3899–3912. [Google Scholar] [CrossRef] [Green Version]
  4. Mitchell, M.B.; Sheinker, V.N.; Mintz, E.A. Adsorption and Decomposition of Dimethyl Methylphosphonate on Metal Oxides. J. Phys. Chem. B 1997, 101, 11192–11203. [Google Scholar] [CrossRef]
  5. Mitchell, M.B.; Sheinker, V.N.; Cox, W.W.; Gatimu, E.N.; Tesfamichael, A.B. The Room Temperature Decomposition Mechanism of Dimethyl Methylphosphonate (DMMP) on Alumina-Supported Cerium Oxide—Participation of Nano-Sized Cerium Oxide Domains. J. Phys. Chem. B 2004, 108, 1634–1645. [Google Scholar] [CrossRef]
  6. Bermudez, V.M. Quantum-Chemical Study of the Adsorption of DMMP and Sarin on γ-Al2O3. J. Phys. Chem. C 2007, 111, 3719–3728. [Google Scholar] [CrossRef]
  7. Gordon, W.O.; Tissue, B.M.; Morris, J.R. Adsorption and decomposition of dimethyl methylphosphonate on Y2O3 nanoparticles. J. Phys. Chem. C 2007, 111, 3233–3240. [Google Scholar] [CrossRef]
  8. Mukhopadhyay, S.; Schoenitz, M.; Dreizin, E.L. Vapor-phase decomposition of dimethyl methylphosphonate (DMMP), a sarin surrogate, in presence of metal oxides. Def. Technol. 2021, 17, 1095–1114. [Google Scholar] [CrossRef]
  9. Cao, L.; Segal, S.R.; Suib, S.L.; Tang, X.; Satyapal, S. Thermocatalytic Oxidation of Dimethyl Methylphosphonate on Supported Metal Oxides. J. Catal. 2000, 194, 61–70. [Google Scholar] [CrossRef]
  10. Gupta, R.C. (Ed.) Handbook of Toxicology of Chemical Warfare Agents; Academic Press Ltd.; Elsevier Science Ltd.: London, UK, 2009. [Google Scholar]
  11. Woo, T.G.; Cha, B.J.; Kim, Y.D.; Seo, H.O. Positive Effects of Impregnation of Fe-oxide in Mesoporous Al-Oxides on the Decontamination of Dimethyl Methylphosphonate. Catalysts 2019, 9, 898. [Google Scholar] [CrossRef]
  12. Zammataro, A.; Santonocito, R.; Pappalardo, A.; Trusso Sfrazzetto, G. Catalytic Degradation of Nerve Agents. Catalysts 2020, 10, 881. [Google Scholar] [CrossRef]
  13. Liu, Y.; Howarth, A.J.; Vermeulen, N.A.; Moon, S.-Y.; Hupp, J.T.; Farha, O.K. Catalytic degradation of chemical warfare agents and their simulants by metal-organic frameworks. Coord. Chem. Rev. 2017, 346, 101–111. [Google Scholar] [CrossRef]
  14. Picard, B.; Chataigner, I.; Maddaluno, J.; Legros, J. Introduction to chemical warfare agents, relevant simulants and modern neutralisation methods. Org. Biomol. Chem 2019, 17, 6528–6537. [Google Scholar] [CrossRef]
  15. Sheinker, V.N.; Mitchell, M.B. Quantitative Study of the Decomposition of Dimethyl Methylphosphonate (DMMP) on Metal Oxides at Room Temperature and Above. Chem. Mater. 2002, 14, 1257–1268. [Google Scholar] [CrossRef]
  16. Zhanpeisov, N.U.; Zhidomirov, G.M.; Yudanov, I.V.; Klabunde, K.J. Cluster Quantum Chemical Study of the Interaction of Dimethyl Methylphosphonate with Magnesium Oxide. J. Phys. Chem. 1994, 98, 10032–10035. [Google Scholar] [CrossRef]
  17. Panayotov, D.A.; Morris, J.R. Thermal Decomposition of a Chemical Warfare Agent Simulant (DMMP) on TiO2: Adsorbate Reactions with Lattice Oxygen as Studied by Infrared Spectroscopy. J. Phys. Chem. C 2009, 113, 15684–15691. [Google Scholar] [CrossRef]
  18. Walenta, C.A.; Xu, F.; Tesvara, C.; O’Connor, C.R.; Sautet, P.; Friend, C.M. Facile Decomposition of Organophosphonates by Dual Lewis Sites on a Fe3O4(111) Film. J. Phys. Chem. C 2020, 124, 12432–12441. [Google Scholar] [CrossRef]
  19. Trotochaud, L.; Head, A.R.; Buchner, C.; Yu, Y.; Karslioglu, O.; Tsyshevsky, R.; Holdren, S.; Eichhorn, B.; Kuklja, M.M.; Bluhm, H. Room temperature decomposition of dimethyl methylphosphonate on cuprous oxide yields atomic phosphorus. Surf. Sci. 2019, 680, 75–87. [Google Scholar] [CrossRef]
  20. Wang, L.; Denchy, M.; Blando, N.; Hansen, L.; Bilik, B.; Tang, X.; Hicks, Z.; Bowen, K.H. Thermal Decomposition of Dimethyl Methylphosphonate on Size-Selected Clusters: A Comparative Study between Copper Metal and Cupric Oxide Clusters. J. Phys. Chem. C 2021, 125, 11348–11358. [Google Scholar] [CrossRef]
  21. Chen, D.A.; Ratliff, J.S.; Hu, X.; Gordon, W.O.; Senanayake, S.D.; Mullins, D.R. Dimethyl methylphosphonate decomposition on fully oxidized and partially reduced ceria thin films. Surf. Sci. 2010, 604, 574–587. [Google Scholar] [CrossRef]
  22. Li, T.; Tsyshevsky, R.; Algrim, L.; McEntee, M.; Durke, E.M.; Eichhorn, B.; Karwacki, C.; Zachariah, M.R.; Kuklja, M.M.; Rodriguez, E.E. Understanding Dimethyl Methylphosphonate Adsorption and Decomposition on Mesoporous CeO2. ACS Appl. Mater. Interfaces 2021, 13, 54597–54609. [Google Scholar] [CrossRef] [PubMed]
  23. Montini, T.; Melchionna, M.; Monai, M.; Fornasiero, P. Fundamentals and Catalytic Applications of CeO2-Based Materials. Chem. Rev. 2016, 116, 5987–6041. [Google Scholar] [CrossRef] [PubMed]
  24. Wang, W.-W.; Du, P.-P.; Zou, S.-H.; He, H.-Y.; Wang, R.-X.; Jin, Z.; Shi, S.; Huang, Y.-Y.; Si, R.; Song, Q.-S.; et al. Highly Dispersed Copper Oxide Clusters as Active Species in Copper-Ceria Catalyst for Preferential Oxidation of Carbon Monoxide. ACS Catal. 2015, 5, 2088–2099. [Google Scholar] [CrossRef]
  25. Reis, C.G.M.; Almeida, K.A.; Silva, T.F.; Assaf, J.M. CO preferential oxidation reaction aspects in a nanocrystalline CuO/CeO2 catalyst. Catal. Today 2020, 344, 124–128. [Google Scholar] [CrossRef]
  26. Delimaris, D.; Ioannides, T. VOC oxidation over CuO-CeO2 catalysts prepared by a combustion method. Appl. Catal. B Environ. 2009, 89, 295–302. [Google Scholar] [CrossRef]
  27. Djinović, P.; Batista, J.; Pintar, A. WGS reaction over nanostructured CuO–CeO2 catalysts prepared by hard template method: Characterization, activity and deactivation. Catal. Today 2009, 147, S191–S197. [Google Scholar] [CrossRef]
  28. Wang, Y.; Chen, Z.; Han, P.; Du, Y.; Gu, Z.; Xu, X.; Zheng, G. Single-Atomic Cu with Multiple Oxygen Vacancies on Ceria for Electrocatalytic CO2 Reduction to CH4. ACS Catal. 2018, 8, 7113–7119. [Google Scholar] [CrossRef]
  29. Zhang, X.; Su, L.; Kong, Y.; Ma, D.; Ran, Y.; Peng, S.; Wang, L.; Wang, Y. CeO2 nanoparticles modified by CuO nanoparticles for low-temperature CO oxidation with high catalytic activity. J. Phys. Chem. Solids 2020, 147, 109651. [Google Scholar] [CrossRef]
  30. Xie, Y.; Wu, J.; Jing, G.; Zhang, H.; Zeng, S.; Tan, X.; Zou, X.; Wen, J.; Su, H.; Zhong, C.-J.; et al. Structural origin of high catalytic activity for preferential CO oxidation over CuO/CeO2 nanocatalysts with different shapes. Appl. Catal. B Environ. 2018, 239, 665–676. [Google Scholar] [CrossRef]
  31. Ren, Z.; Peng, F.; Li, J.; Liang, X.; Chen, B. Morphology-Dependent Properties of Cu/CeO2 Catalysts for the Water-Gas Shift Reaction. Catalysts 2017, 7, 48. [Google Scholar] [CrossRef]
  32. Kappis, K.; Papadopoulos, C.; Papavasiliou, J.; Vakros, J.; Georgiou, Y.; Deligiannakis, Y.; Avgouropoulos, G. Tuning the Catalytic Properties of Copper-Promoted Nanoceria via a Hydrothermal Method. Catalysts 2019, 9, 138. [Google Scholar] [CrossRef] [Green Version]
  33. Papavasiliou, J.; Vakros, J.; Avgouropoulos, G. Impact of acid treatment of CuO-CeO2 catalysts on the preferential oxidation of CO reaction. Catal. Commun. 2018, 115, 68–72. [Google Scholar] [CrossRef]
  34. Papavasiliou, J.; Rawski, M.; Vakros, J.; Avgouropoulos, G. A Novel Post-Synthesis Modification of CuO-CeO2 Catalysts: Effect on Their Activity for Selective CO Oxidation. ChemCatChem 2018, 10, 2096–2106. [Google Scholar] [CrossRef]
  35. Guo, X.; Qiu, Z.; Mao, J.; Zhou, R. Doping effect of transition metals (Zr, Mn, Ti and Ni) on well-shaped CuO/CeO2 (rods): Nano/micro structure and catalytic performance for selective oxidation of CO in excess H2. Phys. Chem. Chem. Phys. PCCP 2018, 20, 25983–25994. [Google Scholar] [CrossRef]
  36. López, J.M.; Gilbank, A.L.; García, T.; Solsona, B.; Agouram, S.; Torrente-Murciano, L. The prevalence of surface oxygen vacancies over the mobility of bulk oxygen in nanostructured ceria for the total toluene oxidation. Appl. Catal. B Environ. 2015, 174–175, 403–412. [Google Scholar] [CrossRef] [Green Version]
  37. Tang, X.; Zhang, B.; Li, Y.; Xu, Y.; Xin, Q.; Shen, W. CuO/CeO2 catalysts: Redox features and catalytic behaviors. Appl. Catal. A Gen. 2005, 288, 116–125. [Google Scholar] [CrossRef]
  38. Wang, C.; Cheng, Q.; Wang, X.; Ma, K.; Bai, X.; Tan, S.; Tian, Y.; Ding, T.; Zheng, L.; Zhang, J.; et al. Enhanced catalytic performance for CO preferential oxidation over CuO catalysts supported on highly defective CeO2 nanocrystals. Appl. Surf. Sci. 2017, 422, 932–943. [Google Scholar] [CrossRef]
  39. Zou, Q.; Zhao, Y.; Jin, X.; Fang, J.; Li, D.; Li, K.; Lu, J.; Luo, Y. Ceria-nano supported copper oxide catalysts for CO preferential oxidation: Importance of oxygen species and metal-support interaction. Appl. Surf. Sci. 2019, 494, 1166–1176. [Google Scholar] [CrossRef]
  40. Afzal, S.; Quan, X.; Lu, S. Catalytic performance and an insight into the mechanism of CeO2 nanocrystals with different exposed facets in catalytic ozonation of p-nitrophenol. Appl. Catal. B Environ. 2019, 248, 526–537. [Google Scholar] [CrossRef]
  41. Wang, Q.Y.; Yeung, K.L.; Banares, M.A. Operando Raman-online FTIR investigation of ceria, vanadia/ceria and gold/ceria catalysts for toluene elimination. J. Catal. 2018, 364, 80–88. [Google Scholar] [CrossRef]
  42. Wang, F.; Büchel, R.; Savitsky, A.; Zalibera, M.; Widmann, D.; Pratsinis, S.E.; Lubitz, W.; Schüth, F. In Situ EPR Study of the Redox Properties of CuO–CeO2 Catalysts for Preferential CO Oxidation (PROX). ACS Catal. 2016, 6, 3520–3530. [Google Scholar] [CrossRef]
  43. Polster, C.S.; Nair, H.; Baertsch, C.D. Study of active sites and mechanism responsible for highly selective CO oxidation in H2 rich atmospheres on a mixed Cu and Ce oxide catalyst. J. Catal. 2009, 266, 308–319. [Google Scholar] [CrossRef]
  44. Sedmak, G.; Hočevar, S.; Levec, J. Kinetics of selective CO oxidation in excess of H2 over the nanostructured Cu0.1Ce0.9O2-catalyst. J. Catal. 2003, 213, 135–150. [Google Scholar] [CrossRef]
  45. Liu, Z.; Wang, Q.; Wu, J.; Zhang, H.; Liu, Y.; Zhang, T.; Tian, H.; Zeng, S. Active Sites and Interfacial Reducibility of CuxO/CeO2 Catalysts Induced by Reducing Media and O2/H2 Activation. ACS Appl. Mater. Interfaces 2021, 13, 35804–35817. [Google Scholar] [CrossRef]
  46. Davó-Quiñonero, A.; Bailón-García, E.; López-Rodríguez, S.; Juan-Juan, J.; Lozano-Castelló, D.; García-Melchor, M.; Herrera, F.C.; Pellegrin, E.; Escudero, C.; Bueno-López, A. Insights into the Oxygen Vacancy Filling Mechanism in CuO/CeO2 Catalysts: A Key Step Toward High Selectivity in Preferential CO Oxidation. ACS Catal. 2020, 10, 6532–6545. [Google Scholar] [CrossRef]
  47. May, Y.A.; Wang, W.-W.; Yan, H.; Wei, S.; Jia, C.-J. Insights into facet-dependent reactivity of CuO–CeO2 nanocubes and nanorods as catalysts for CO oxidation reaction. Chin. J. Catal. 2020, 41, 1017–1027. [Google Scholar] [CrossRef]
  48. Davó-Quiñonero, A.; Such-Basáñez, I.; Juan-Juan, J.; Lozano-Castelló, D.; Stelmachowski, P.; Grzybek, G.; Kotarba, A.; Bueno-López, A. New insights into the role of active copper species in CuO/Cryptomelane catalysts for the CO-PROX reaction. Appl. Catal. B Environ. 2020, 267, 118372. [Google Scholar] [CrossRef]
  49. Qi, L.; Yu, Q.; Dai, Y.; Tang, C.; Liu, L.; Zhang, H.; Gao, F.; Dong, L.; Chen, Y. Influence of cerium precursors on the structure and reducibility of mesoporous CuO-CeO2 catalysts for CO oxidation. Appl. Catal. B Environ. 2012, 119–120, 308–320. [Google Scholar] [CrossRef]
  50. Zhang, Y.D.; Liang, L.; Chen, Z.Y.; Wen, J.J.; Zhong, W.; Zou, S.B.; Fu, M.L.; Chen, L.M.; Ye, D.Q. Highly efficient Cu/CeO2-hollow nanospheres catalyst for the reverse water-gas shift reaction: Investigation on the role of oxygen vacancies through in situ UV-Raman and DRIFTS. Appl. Surf. Sci. 2020, 516, 146035. [Google Scholar] [CrossRef]
  51. Zhang, X.-m.; Tian, P.; Tu, W.; Zhang, Z.; Xu, J.; Han, Y.-F. Tuning the Dynamic Interfacial Structure of Copper–Ceria Catalysts by Indium Oxide during CO Oxidation. ACS Catal. 2018, 8, 5261–5275. [Google Scholar] [CrossRef]
  52. He, C.; Yu, Y.; Yue, L.; Qiao, N.; Li, J.; Shen, Q.; Yu, W.; Chen, J.; Hao, Z. Low-temperature removal of toluene and propanal over highly active mesoporous CuCeOx catalysts synthesized via a simple self-precipitation protocol. Appl. Catal. B Environ. 2014, 147, 156–166. [Google Scholar] [CrossRef]
  53. Torrente-Murciano, L.; Gilbank, A.; Puertolas, B.; Garcia, T.; Solsona, B.; Chadwick, D. Shape-dependency activity of nanostructured CeO2 in the total oxidation of polycyclic aromatic hydrocarbons. Appl. Catal. B Environ. 2013, 132–133, 116–122. [Google Scholar] [CrossRef] [Green Version]
  54. Deng, Y.Q.; Shi, X.B.; Wei, L.Q.; Liu, H.; Li, J.; Ou, X.M.; Dong, L.H.; Li, B. Effect of intergrowth and coexistence CuO-CeO2 catalyst by grinding method application in the catalytic reduction of NOx by CO. J. Alloys Compd. 2021, 869, 159231. [Google Scholar] [CrossRef]
  55. Papadopoulos, C.; Kappis, K.; Papavasiliou, J.; Vakros, J.; Kuśmierz, M.; Gac, W.; Georgiou, Y.; Deligiannakis, Y.; Avgouropoulos, G. Copper-promoted ceria catalysts for CO oxidation reaction. Catal. Today 2020, 355, 647–653. [Google Scholar] [CrossRef]
  56. Graven, W.M.; Weller, S.W.; Peters, D.L. Catalytic conversion of a organophosphate vapor over platinum-alumina. Ind. Eng. Chem. Process Des. Dev. 1966, 5, 183. [Google Scholar] [CrossRef]
  57. Lee, K.Y.; Houalla, M.; Hercules, D.M.; Hall, W.K. Catalytic Oxidative Decomposition of Dimethyl Methylphosphonate over Cu-Substituted Hydroxyapatite. J. Catal. 1994, 145, 223–231. [Google Scholar] [CrossRef]
  58. Lee, K.; Houalla, M.; Hercules, D.; Hall, W. Vibrational spectra and possible conformers of dimethylmethylphosphonate by normal mode analysis. Spectrochim. Acta 1989, 45A, 1015–1024. [Google Scholar]
  59. Rusu, C.N.; Yates, J.T. Adsorption and Decomposition of Dimethyl Methylphosphonate on TiO2. J. Phys. Chem. B 2000, 104, 12292–12298. [Google Scholar] [CrossRef]
  60. Binet, C.; Daturi, M.; Lavalley, J.-C. IR study of polycrystalline ceria properties in oxidised and reduced states. Catal. Today 1999, 50, 207–225. [Google Scholar] [CrossRef]
  61. Wu, Z.; Li, M.; Mullins, D.R.; Overbury, S.H. Probing the Surface Sites of CeO2 Nanocrystals with Well-Defined Surface Planes via Methanol Adsorption and Desorption. ACS Catal. 2012, 2, 2224–2234. [Google Scholar] [CrossRef]
  62. Kanan, S.M.; Lu, Z.; Tripp, C.P. A Comparative Study of the Adsorption of Chloro- and Non-Chloro-Containing Organophosphorus Compounds on WO3. J. Phys. Chem. B 2002, 106, 9576–9580. [Google Scholar] [CrossRef]
  63. Panayotov, D.A.; Morris, J.R. Uptake of a chemical warfare agent simulant (DMMP) on TiO2: Reactive adsorption and active site poisoning. Langmuir 2009, 25, 3652–3658. [Google Scholar] [CrossRef] [PubMed]
  64. Jeon, S.; Schweigert, I.V.; Pehrsson, P.E.; Balow, R.B. Kinetics of Dimethyl Methylphosphonate Adsorption and Decomposition on Zirconium Hydroxide Using Variable Temperature In Situ Attenuated Total Reflection Infrared Spectroscopy. ACS Appl. Mater. Interfaces 2020, 12, 14662–14671. [Google Scholar] [CrossRef] [PubMed]
  65. Isahak, W.N.R.W.; Ramli, Z.A.C.; Ismail, M.W.; Ismail, K.; Yusop, R.M.; Hisham, M.W.M.; Yarmo, M.A. Adsorption–desorption of CO2 on different type of copper oxides surfaces: Physical and chemical attractions studies. J. CO2 Util. 2013, 2, 8–15. [Google Scholar] [CrossRef]
  66. Huttunen, P.K.; Labadini, D.; Hafiz, S.S.; Gokalp, S.; Wolff, E.P.; Martell, S.M.; Foster, M. DRIFTS investigation of methanol oxidation on CeO2 nanoparticles. Appl. Surface Sci. 2021, 554, 149518. [Google Scholar] [CrossRef]
  67. Albrecht, P.M.; Mullins, D.R. Adsorption and reaction of methanol over CeO(X)(100) thin films. Langmuir 2013, 29, 4559–4567. [Google Scholar] [CrossRef]
  68. Ruiz Puigdollers, A.; Schlexer, P.; Tosoni, S.; Pacchioni, G. Increasing Oxide Reducibility: The Role of Metal/Oxide Interfaces in the Formation of Oxygen Vacancies. ACS Catal. 2017, 7, 6493–6513. [Google Scholar] [CrossRef] [Green Version]
  69. Yang, C.; Miao, G.; Pi, Y.; Xia, Q.; Wu, J.; Li, Z.; Xiao, J. Abatement of various types of VOCs by adsorption/catalytic oxidation: A review. Chem. Eng. J. 2019, 370, 1128–1153. [Google Scholar] [CrossRef]
  70. He, C.; Cheng, J.; Zhang, X.; Douthwaite, M.; Pattisson, S.; Hao, Z. Recent Advances in the Catalytic Oxidation of Volatile Organic Compounds: A Review Based on Pollutant Sorts and Sources. Chem. Rev. 2019, 119, 4471–4568. [Google Scholar] [CrossRef]
  71. Bashir, S.M.; Idriss, H. The reaction of propylene to propylene-oxide on CeO2: An FTIR spectroscopy and temperature programmed desorption study. J. Chem. Phys. 2020, 152, 044712. [Google Scholar] [CrossRef]
  72. Hu, C.Q. Catalytic combustion kinetics of acetone and toluene over Cu0.13Ce0.87Oy catalyst. Chem. Eng. J. 2011, 168, 1185–1192. [Google Scholar] [CrossRef]
  73. Menon, U.; Galvita, V.V.; Constales, D.; Alexopoulos, K.; Yablonsky, G.; Marin, G.B. Microkinetics for toluene total oxidation over CuO–CeO2/Al2O3. Catal. Today 2015, 258, 214–224. [Google Scholar] [CrossRef]
  74. Mi, R.; Li, D.; Hu, Z.; Yang, R.T. Morphology Effects of CeO2 Nanomaterials on the Catalytic Combustion of Toluene: A Combined Kinetics and Diffuse Reflectance Infrared Fourier Transform Spectroscopy Study. ACS Catal. 2021, 11, 7876–7889. [Google Scholar] [CrossRef]
Figure 1. The chemical structure of (a) sarin and (b) DMMP.
Catalysts 12 01277 g001
Figure 2. XRD patterns of the as-prepared CuO/CeO2 catalysts.
Catalysts 12 01277 g002
Figure 3. TEM images of the CuO/CeO2 catalysts: (a) CeO2nr, (b) 10%Cu/Ce, (c) 20%Cu/Ce, (d) 50%Cu/Ce, (e) 80%Cu/Ce, and (f) CuO.
Catalysts 12 01277 g003
Figure 4. EDX maps of various elements in the CuO/CeO2 catalysts: (a) 10%Cu/Ce, (b) 20%Cu/Ce, (c) 50%Cu/Ce, and (d) 80%Cu/Ce.
Catalysts 12 01277 g004
Figure 5. HRTEM images of the CuO/CeO2 catalysts: (a) CeO2nr, (b) 10%Cu/Ce, (c) 20%Cu/Ce, (d) 50%Cu/Ce, (e) 80%Cu/Ce, and (f) CuO.
Catalysts 12 01277 g005
Figure 6. (a) H2-TPR and (b) O2-TPD profiles of the CuO/CeO2 catalysts.
Catalysts 12 01277 g006
Figure 7. Ce 3d XPS spectra of the CuO/CeO2 catalysts: (a) CeO2nr, (b) 10%Cu/Ce, (c) 20%Cu/Ce, (d) 50%Cu/Ce, and (e) 80%Cu/Ce.
Catalysts 12 01277 g007
Figure 8. (a) Cu 2p XPS spectra and (b) Cu LMM spectra of the CuO/CeO2 catalysts.
Catalysts 12 01277 g008
Figure 9. O1s XPS spectra of the CuO/CeO2 catalysts: (a) CeO2, (b) 10%Cu/Ce, (c) 20%Cu/Ce, (d) 50%Cu/Ce, (e) 80%Cu/Ce, and (f) CuO.
Catalysts 12 01277 g009
Figure 10. Raman spectra of the CeO2-supported CuO catalysts.
Catalysts 12 01277 g010
Figure 11. Effects of different Cu/Ce ratios of the CeO2-supported CuO catalysts on protection time. Reaction temperature, 400 °C; inlet DMMP concentration, 8.46 g/m3; catalyst weight, 0.46 g CuO/CeO2 catalysts; size, 20–40 mesh; and GHSV, 20,000 h−1.
Catalysts 12 01277 g011
Figure 12. XPS spectra of the catalysts after the protection test: (a) CeO2, (b) 50%Cu/Ce, and (c) CuO.
Catalysts 12 01277 g012
Figure 13. Mass spectrometry analysis of the tail gas generated from DMMP thermocatalytic decomposition on (a) CeO2, (b) 50%Cu/Ce, and (c) CuO.
Catalysts 12 01277 g013
Figure 14. In situ DRIFTS spectra of CeO2 at varying temperatures in (a) the high-frequency region and (b) in the mid–low frequency region, the inset is a magnified image of the tagged area.
Catalysts 12 01277 g014
Figure 15. In situ DRIFTS spectra of CuO at varying temperatures in (a) the high-frequency region and (b) in the mid–low frequency region.
Catalysts 12 01277 g015
Figure 16. In situ DRIFTS spectra of 50%Cu/Ce at varying temperatures in (a) the high-frequency region and (b) in the mid–low frequency region, the inset is a magnified image of the tagged area.
Catalysts 12 01277 g016
Scheme 1. Proposed reaction pathways for the decomposition of DMMP, (I) the main reaction pathway for the decomposition of DMMP on CeO2, (II) the side reaction pathways for the decomposition of DMMP on CeO2; (III) the side reaction pathways for the decomposition of DMMP on CuO; (IV) the side reactions pathways for the decomposition of DMMP on CuO/CeO2 (M: Cu or Ce).
Catalysts 12 01277 sch001
Figure 17. Schematic diagram of the catalytic evaluation system. MFC denotes mass flow meter, and the reaction tube size is 4 mm.
Catalysts 12 01277 g017
Table 1. Physical properties of the as-prepared CuO/CeO2 catalysts.
CatalystCeO2 Crystallinity Size (nm)CuO Crystallinity Size (nm)Cu/Ce (wt%)BET (m2/g)
CeO2nr10.8//91
10%Cu/Ce9.01/10.51%91.5
20%Cu/Ce10.01/23.92%77.5
50%Cu/Ce10.5928.1453.06%66.6
80%Cu/Ce10.9328.1488.32%63.2
CuO/21.41/23.4
Table 2. H2 consumption amounts of as-prepared catalyst calculated by H2-TPR.
CatalystTR (°C)Total H2 Consumption (mmol/gcat)Theoretical H2 Consumption (mmol/gcat)
αβγ
10%Cu/Ce2072602782.61.53
20%Cu/Ce2072592762.893.09
50%Cu/Ce1992683153.225.53
80%Cu/Ce1972713163.627.46
CuO3756.7515.75
CeO2nr5491.53/
Table 3. The amounts of O2 desorbed by O2-TPD from as-prepared catalyst samples.
CatalystPeak Position (°C)Desorption O2 (mmol/gcat)Peak Position (°C)Desorption O2 (mmol/gcat)Total Desorption O2 (mmol/gcat)
CeO2nr1801.266431.612.87
10%Cu/Ce1800.996411.672.66
20%Cu/Ce1820.726401.792.51
50%Cu/Ce1800.516521.92.41
80%Cu/Ce//6582.152.15
CuO//6602.342.34
Table 4. XPS and Raman catalytic performance characterization.
CatalystXPSRamanProtection Time (min)
Ce3+Oβ/OallOα/Oall(Cu0+Cu+)/Cu2+F2g (cm−1)ID/IF2g
CeO2nr23.81%26.98%73.02%/4630.04140
10%Cu/Ce22.77%32.28%67.72%1.554560.031252
20%Cu/Ce18.69%31.23%68.77%2.214450.052266
50%Cu/Ce18.86%24.12%75.88%2.334530.083322
80%Cu/Ce18.78%22.13%77.87%2.444530.064140
CuO/33.64%66.36%///56
Table 5. A comparison of protection time on various catalysts.
CatalystReaction ConditionProtection TimeReference
0.5%Pt-Al2O3396 °C; DMMP concentration, 3.5 g/m3; flow rate 8.85 L/min12 hGraven et al. [56]
Cu2-HA400 °C; DMMP concentration, 3.58 g/m3; flow rate, 100 mL/min7.5 hLee et al. [57]
1.2%Pt-Al2O3400 °C; DMMP concentration, 3.58 g/m3; flow rate, 100 mL/min17 h
10% V/Al2O3400 °C; DMMP concentration 1300 ppm; flow rate, 50 mL/min12.5 hCao et al. [9]
1% Pt/Al2O38.5 h
10% Cu/Al2O37.5 h
Al2O34.0 h
10% Fe/Al2O33.5 h
10% Ni/Al2O31.5 h
10% V/SiO225 h
CeO2400 °C; DMMP concentration, 8.46 g/m3; flow rate, 100 mL/min2.33 hThis work
10%Cu/Ce4.2 h
20%Cu/Ce4.43 h
50%Cu/Ce5.36 h
80%Cu/Ce2.33 h
CuO0.93 h
Table 6. Oα contents before and after the catalytic decomposition of DMMP.
CatalystBefore DecompositionAfter Decomposition
ReactionReaction
CeO273.02%37.94%
50%CuCe75.88%25.74%
CuO66.36%5.57%
Table 7. Content of PO43−, methyl phosphonate species, DMMP decomposition, and P element on various catalysts after the catalytic decomposition of DMMP.
SamplePO43− (mg/g)Methyl Phosphonate Species (mg/g)DMMP (mg/g)P (mg/g)
CeO23.10481.9941257.564.13
50%Cu/Ce0.22770.4502592.17147.48
CuO1.62790.4276102.725.57
Table 8. IR frequencies and assignments of DMMP.
Vibrational ModeIR Frequencies (cm−1)
DMMP [40]DMMP Gas Phase [41]DMMP Liquid Phase This Study
νa(P–CH3)299230142996
νa(O–CH3)295729622958
νs(P–CH3)292629242927
νs(O–CH3)285228602854
δa(O–CH3)146514671465
δs(O–CH3)1450//
δs(P–CH3)131713141315
ν(P=O)124212761257
ρ‖(O–CH3)11861188 (1190)1187
νa(C–O)105810701061
νs(C–O)103410491034
ρ‖(P–CH3)916914914
ν(P–O)822816821
ν(P–O)789//
ν(P–C)714//
Table 9. IR frequencies and assignments of the surface species.
Vibrational ModeIR Frequencies (cm−1)
CeO250%Cu/CeCuO
ν(OH)370737063730
ν(OH)36853685/
ν(OH)366336423606
νa(P–CH3)294429932985
νa(O–CH3)291329492954
νs(P–CH3)288929252928
νs(O–CH3)2834/2860
νa(C–H)2931//
νs(C–H)28462849/
ν(Ce–O–CH3)28032805/
ν(Cu–O–CH3)//2820
2δ(C–H)2722//
ν(OCO)1572–1564//
ν(OCO)1537//
δ(CH)1368//
ν(CO3)1357//
δs(P–CH3)/13071312
ν(P–O)/1152/1150/
ν(OPO)1097/1087/107510941055
ν(C–O)10351036/10101032
ρ‖(P–CH3)/903–893918`
Publisher’s Note: MDPI stays neutral with regard to jurisdictional claims in published maps and institutional affiliations.

