Article

Ex Situ Upgrading of Extra Heavy Oil: The Effect of Pore Shape of Co-Mo/γ-Al2O3 Catalysts

1
Department of Physical Chemistry, Kazan Federal University, Kazan 420008, Russia
2
Key Laboratory of Enhanced Oil Recovery in Carbonate Fractured-Vuggy Reservoirs, CNPC, Urumqi 830011, China
3
SINOPEC Northwest Company of China Petroleum and Chemical Corporation, Urumqi 830011, China
4
Department of Petroleum Engineering, Institute of Geology and Petroleum Technologies, Kazan Federal University, Kazan 420008, Russia
*
Authors to whom correspondence should be addressed.
Catalysts 2022, 12(10), 1271; https://doi.org/10.3390/catal12101271
Submission received: 14 September 2022 / Revised: 7 October 2022 / Accepted: 14 October 2022 / Published: 18 October 2022

Abstract

:
Co-Mo/γ-Al2O3 catalysts with different pore shapes were synthesized for the ex situ upgrading of extra heavy oils by hydrodesulfurization (HDS), hydrodemetallization (HDM), and hydrodeasphaltization (HDA). The catalysts were synthesized using aluminum oxides that were prepared by various methods. It was found that using the product obtained by the thermochemical activation of gibbsite leads to the formation of slit-shaped pores in aluminum oxide, while the application of the hydroxide deposition method by the precipitation of sodium aluminate and nitric acid gives cylindrical pores in aluminum oxide. Co-Mo catalysts synthesized using these two types of pores exhibit different catalytic activities. The catalyst synthesized on a carrier with cylindrical pores exhibited a higher catalytic activity in sulfur, heavy metals, and asphaltenes removal reactions that are synthesized on a carrier with slit-like pores. This is because the presence of cylindrical pores leads to a decrease in diffusion restrictions when removing large molecules of asphaltenes and sulfur-containing and metal-containing compounds.

1. Introduction

The constant increase in the consumption of fuels and the depletion of light and medium oil reserves lead to an increase in demand for the development and use of heavy oils and waste from refineries [1,2,3]. Heavy oil is characterized by a high viscosity resulting from the high content of resins and asphaltenes that usually contain a lot of sulfur and heavy metals [4,5,6,7]. The high viscosity of heavy crudes increases the difficulties in their extraction, transportation, and processing [8,9]. Therefore, the development of technologies that can reduce the viscosity of heavy oils as well as the content of sulfur and heavy metals to obtain light distillates is an urgent task.
Asphaltenes are the large molecules of polyaromatic compounds whose structure includes heteroatoms: S, N, O, and metals [10,11]. These asphaltenes molecules are dispersed and stabilized in resin fractions. During hydroprocessing, resin molecules are primarily transformed. At the same time, asphaltenes adsorb on the surface of catalysts and block pores [12,13]. Heavy oils also contain vanadium and nickel. These metals are present in porphyrin structures [14]. These structures are of considerable size and usually do not deeply penetrate into the catalyst granules. Vanadium and nickel are adsorbed as sulfides with a crystal size of 2–30 nm [15,16,17] Metal sulfides are adsorbed inside the pores and block the diffusion of the initial molecules and reaction products. Vanadium and nickel can also be adsorbed on the active centers of MoS2, leading to irreversible deactivation of catalysts [18].
Heavy oil upgrading is a complex task and consists of the development of catalysts with certain granule size, pore diameter, pore size distribution, total pore volume, and specific surface area [19,20,21]. These parameters are important for the optimal distribution of the active phase and achieving high activity in hydrodesulfurization (HDS), hydrodemetallization (HDM), and hydrodearomatization (HDA) reactions. For the HDS process, the specific surface area is an important parameter. The higher it is, the more active the catalyst is in the reactions of HDS, hydrodenitrogenation (HDN), and hydrogenation of unsaturated compounds (HR) [22] In this case, the catalysts are usually characterized by low activity in the removal of metals. In contrast, HDM processes require catalysts with large pore diameter and pore volume [23]. However, in this case, the reactions of HDS, HDA and HR proceed at a low rate. A study by Luo et al. showed that a catalyst with an average pore diameter of 20 nm is active in metal removal reactions [5]. An increase in the pore diameter above this value leads to a decrease in the speed of the dementalization process. In 1986, Shimura et al. In addition indicated that catalysts with a pore diameter of 20 nm are also active in the cracking reactions of asphaltenes [24]. In addition, Kobayashi et al. determined that the optimal pore diameters for the reactions of vanadium removal and cracking of asphaltenes are 10 and 15 nm, respectively [25]. In addition, pore size and total pore volume are important in the process of catalyst deactivation. Many researchers showed that catalysts with larger pore diameter and volume are deactivated at a lower rate [11,26,27].
Currently, most papers present data on the effect of pore size, pore volume, and specific surface area on the performance of catalysts during the hydroprocessing of heavy oils. The effect of pore shape on the processes of HDS, HDM, and HDA has been rarely reported. It is well known that for aluminum oxides, the pores can have different shapes: cylindrical, slit-shaped, bottle-shaped and various combinations thereof. The shape of the pores as well as the pore diameter, the specific surface area and the total pore volume can affect the distribution of the active component and the diffusion of reaction molecules and reaction products and thus significantly influence the activity of catalysts in the processing of heavy oils, which contain a significant amount of large macromolecules of resins and asphaltenes. In this study, the first goal is to evaluate the influence of the pore shape of catalysts on the hydrotreatment of heavy oils. To achieve this, the Co-Mo catalysts were synthesized using γ-Al2O3 with different pore shape prepared by different methods. The second goal is to develop effective catalysts for the ex situ upgrading of extra heavy oils in the oilfield or in the gathering and transportation station to reduce the viscosity of extra heavy oil for easing their transportation. The upgraded oil can also be reinjected into wellbore to mix with the extra heavy oil for viscosity reduction for improving oil production.

2. Results and Discussion

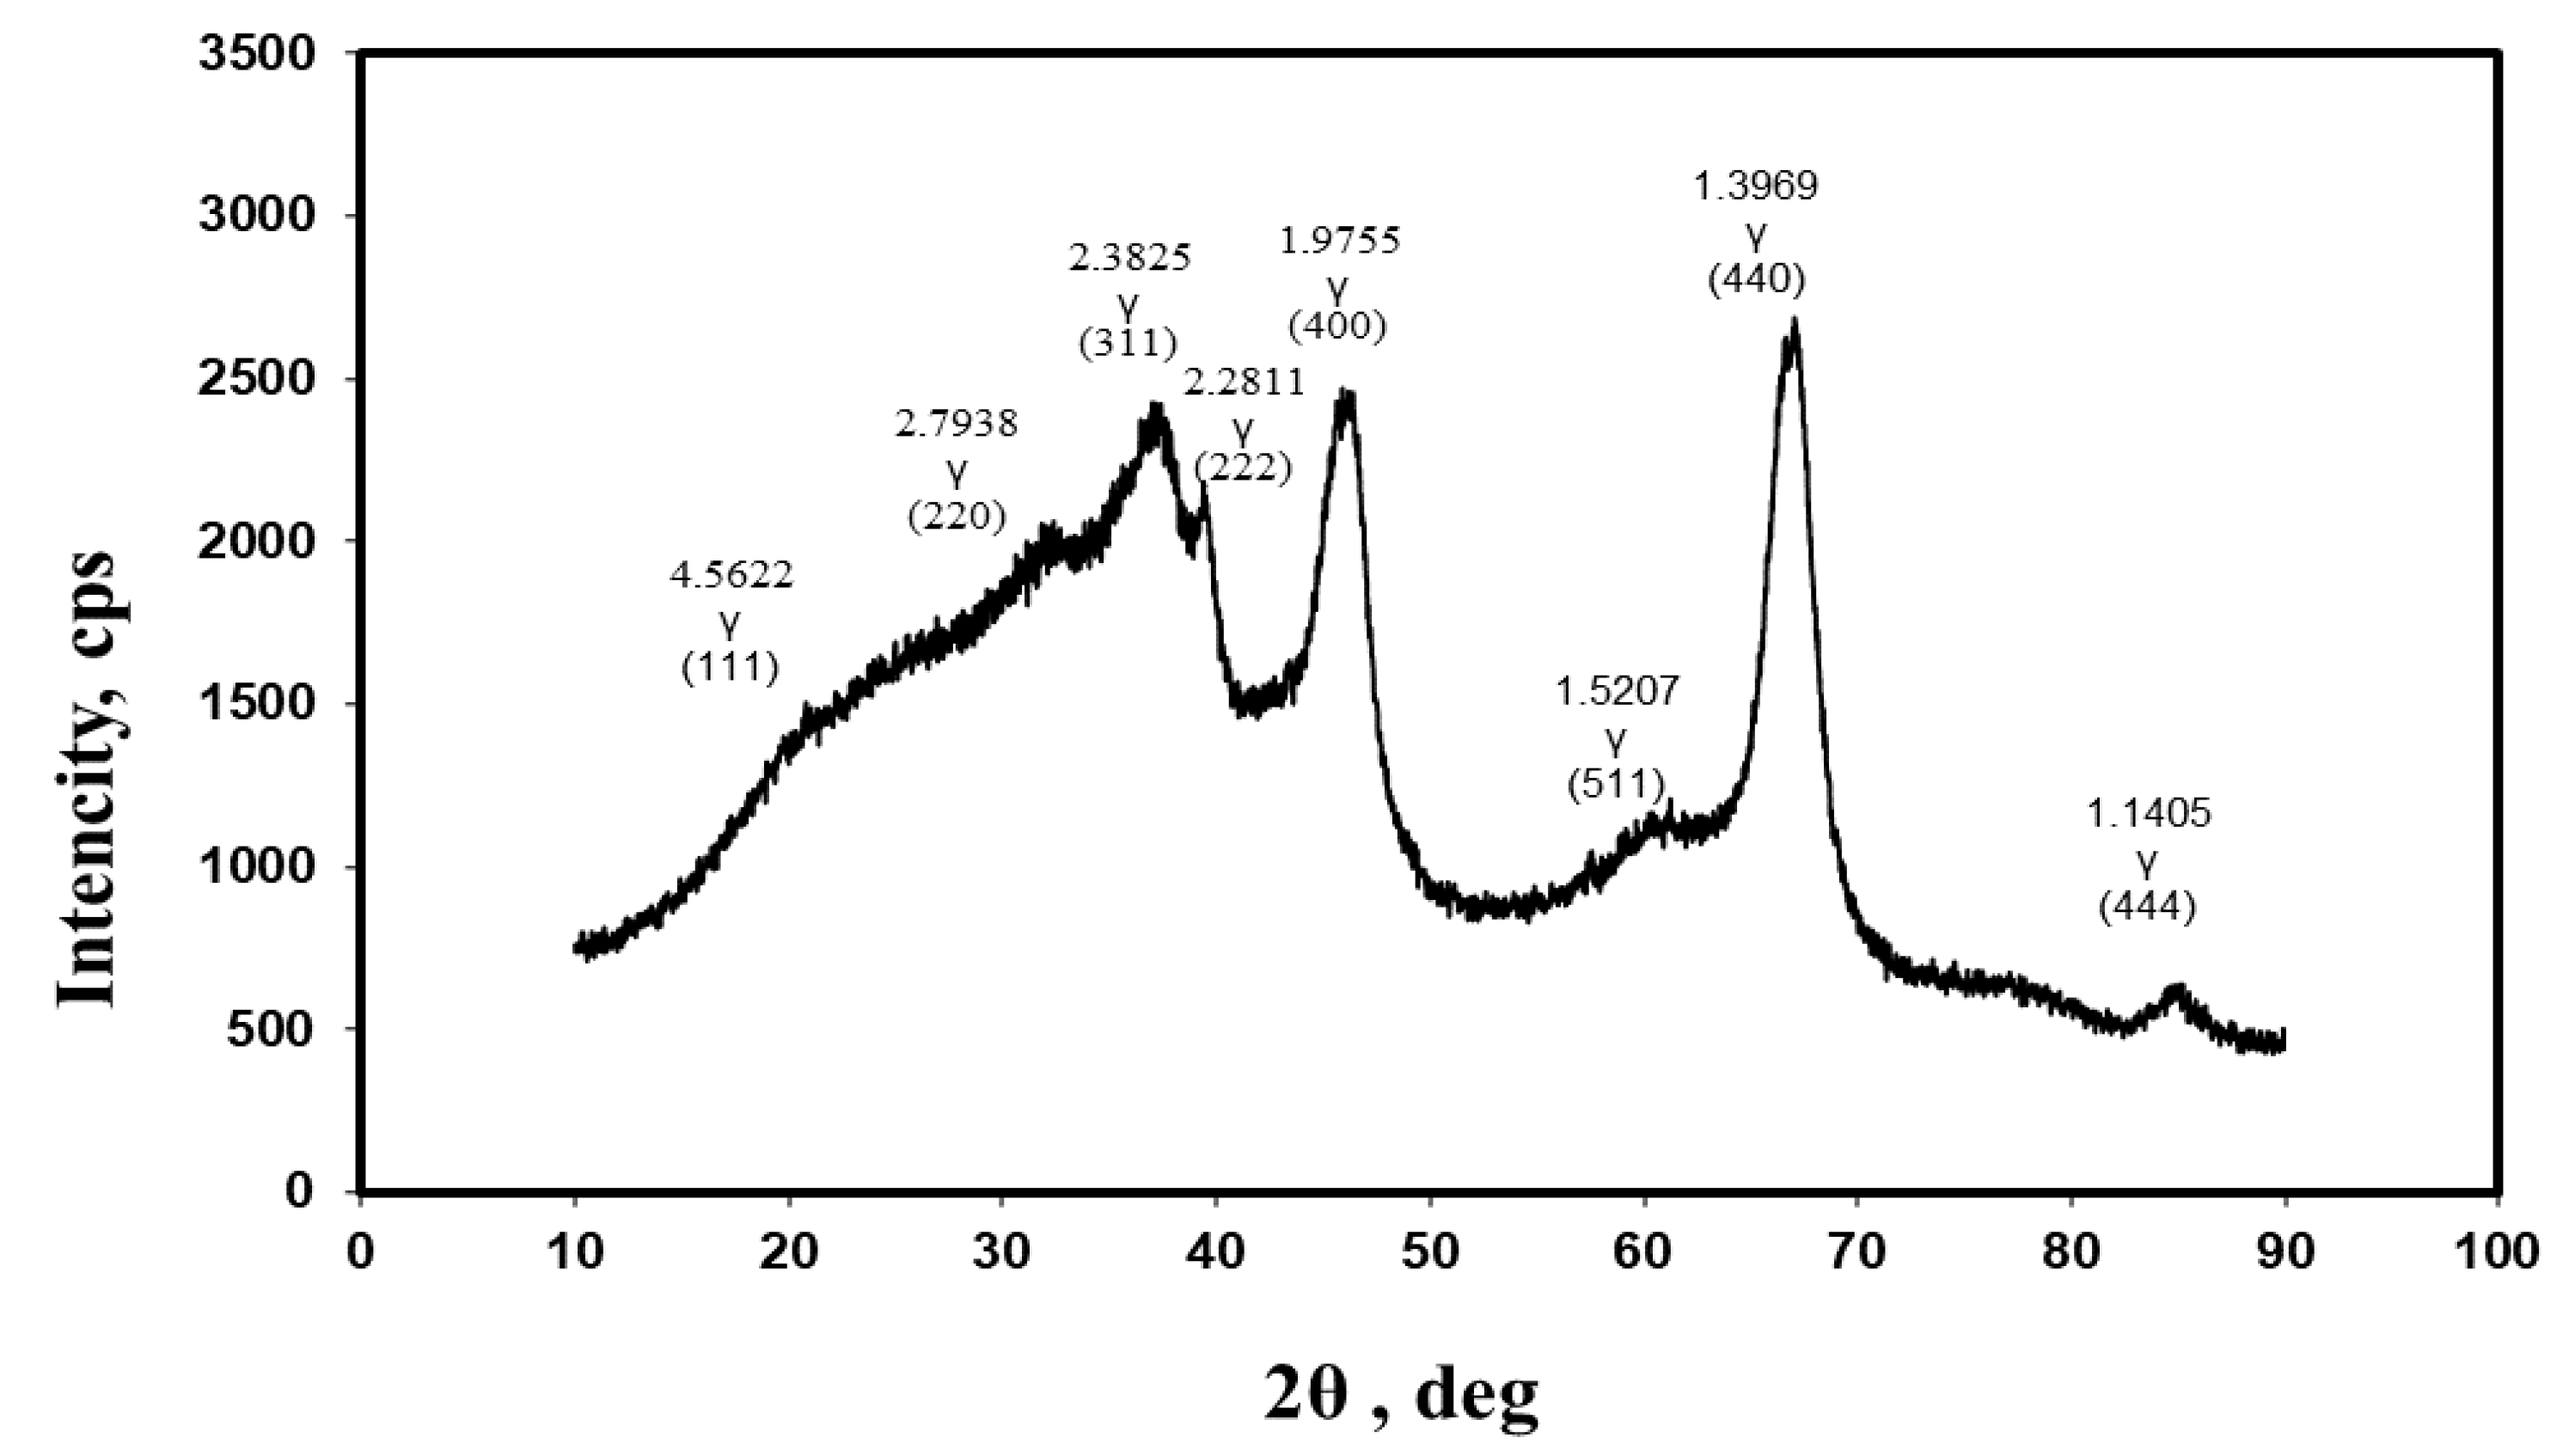
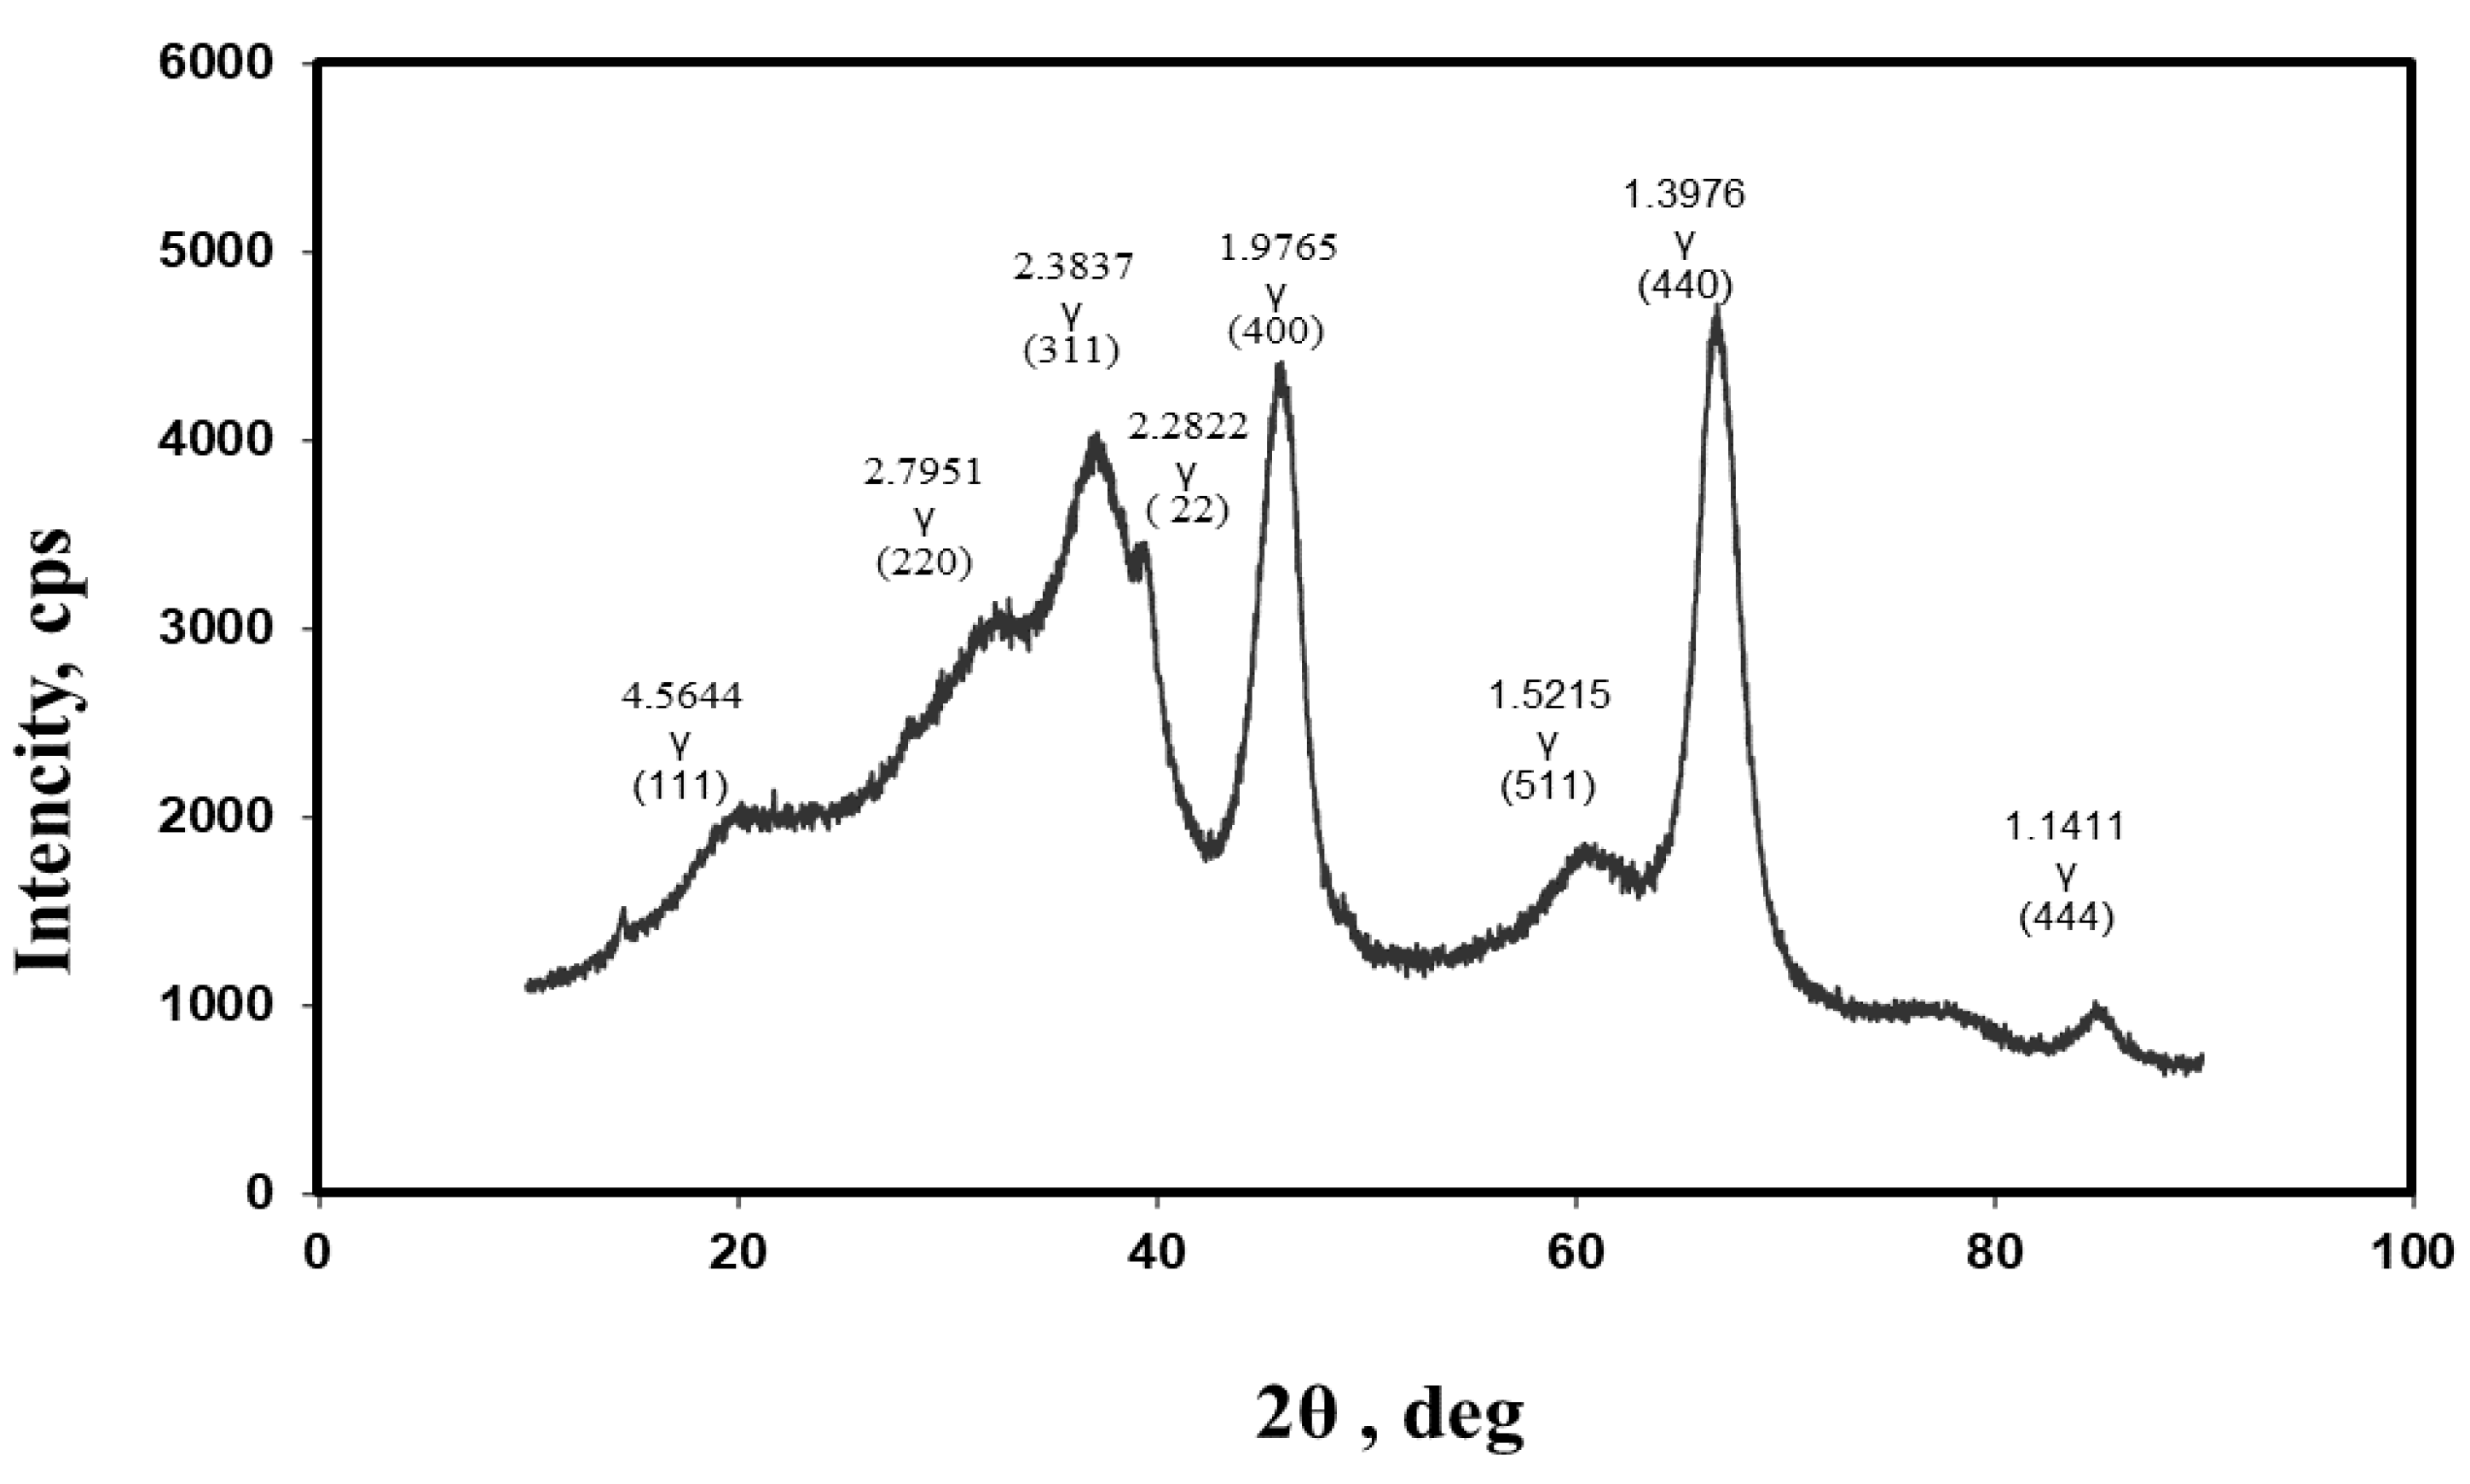
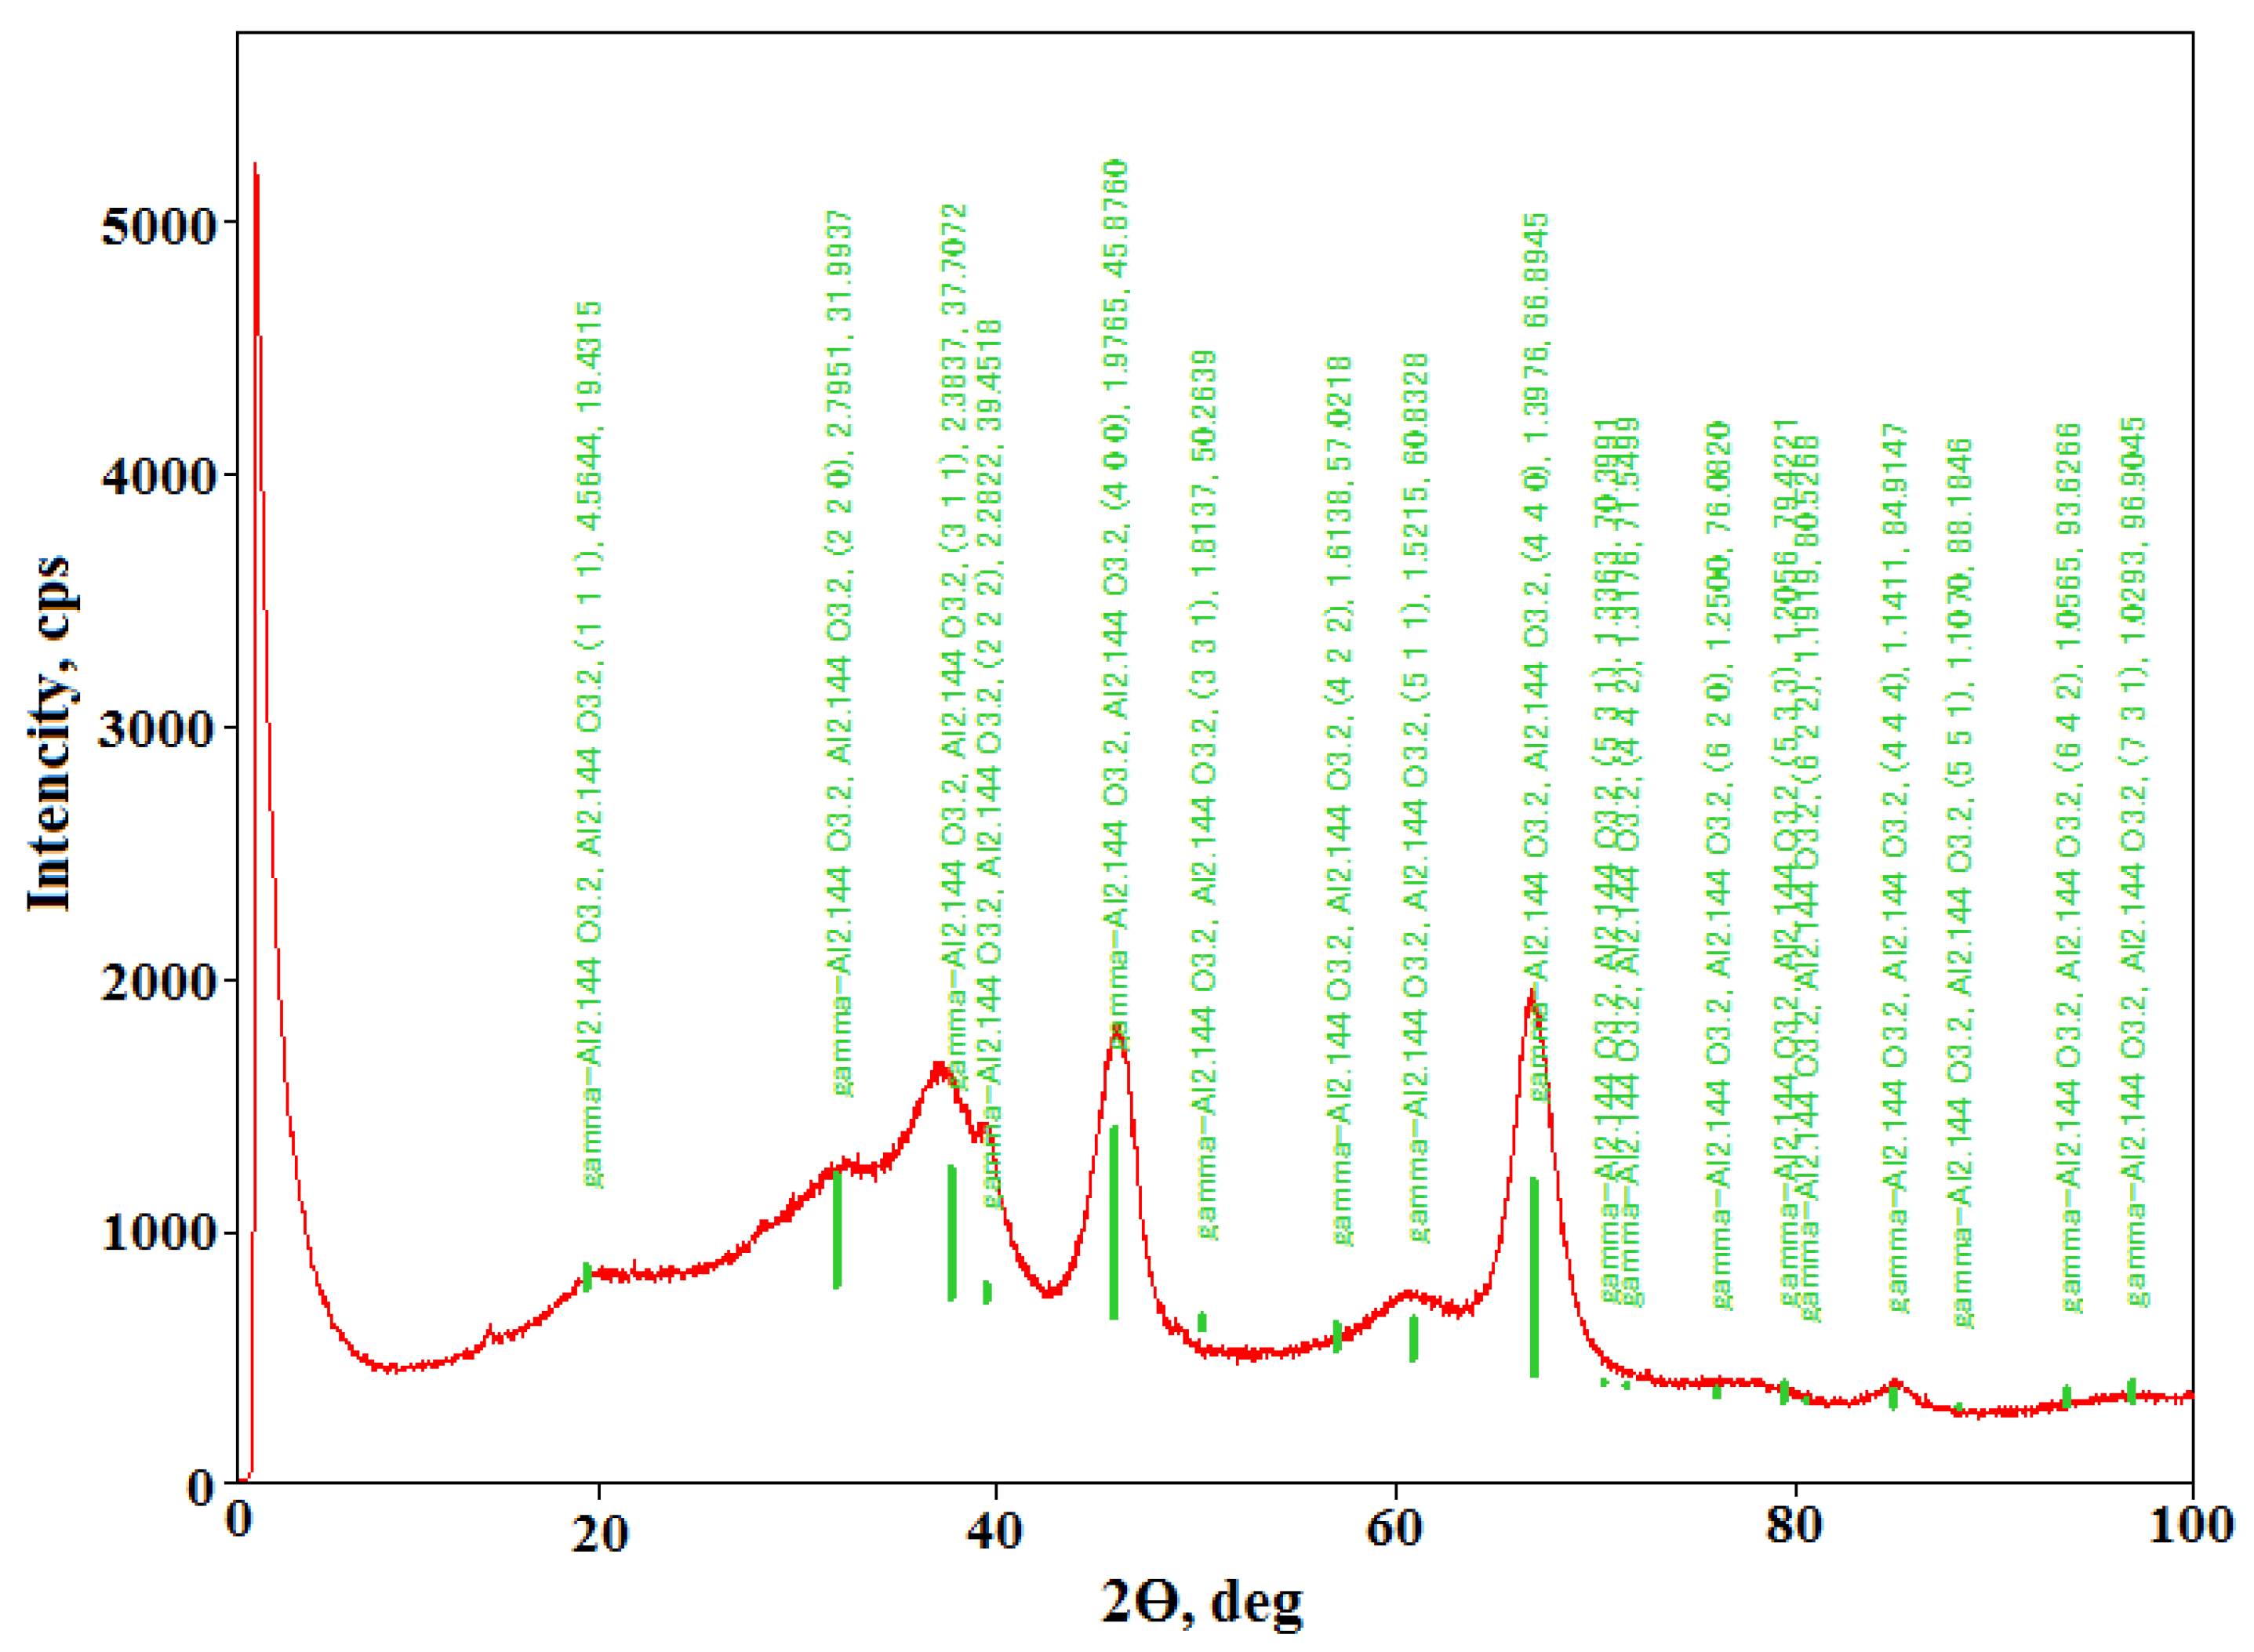
2.1. Phase Analysis of Aluminum Oxides

The characteristic peaks of γ-Al2O3 in the region of 2θ = 2.932, 4.6761, 3.2482, 1.998 are observed (Figure 1 and Figure 2). According to the XRD analysis, the C1 and C2 carriers are γ-Al2O3 [28]. These peaks coincide with the peaks of simulated aluminum oxide (Figure 3). The medium coherent-scattering regions of C1 according to planes (440) and (400) have more intensive reflexes and are equal to 84.9 and 39.1 Å, respectively. For the C2 carrier, the sizes of crystallites corresponding to planes (440) and (400) are larger and equal to 94.5 and 54.6 Å, respectively. The smaller values of the coherent-scattering regions of C1 indicate a lower degree of its crystallinity.

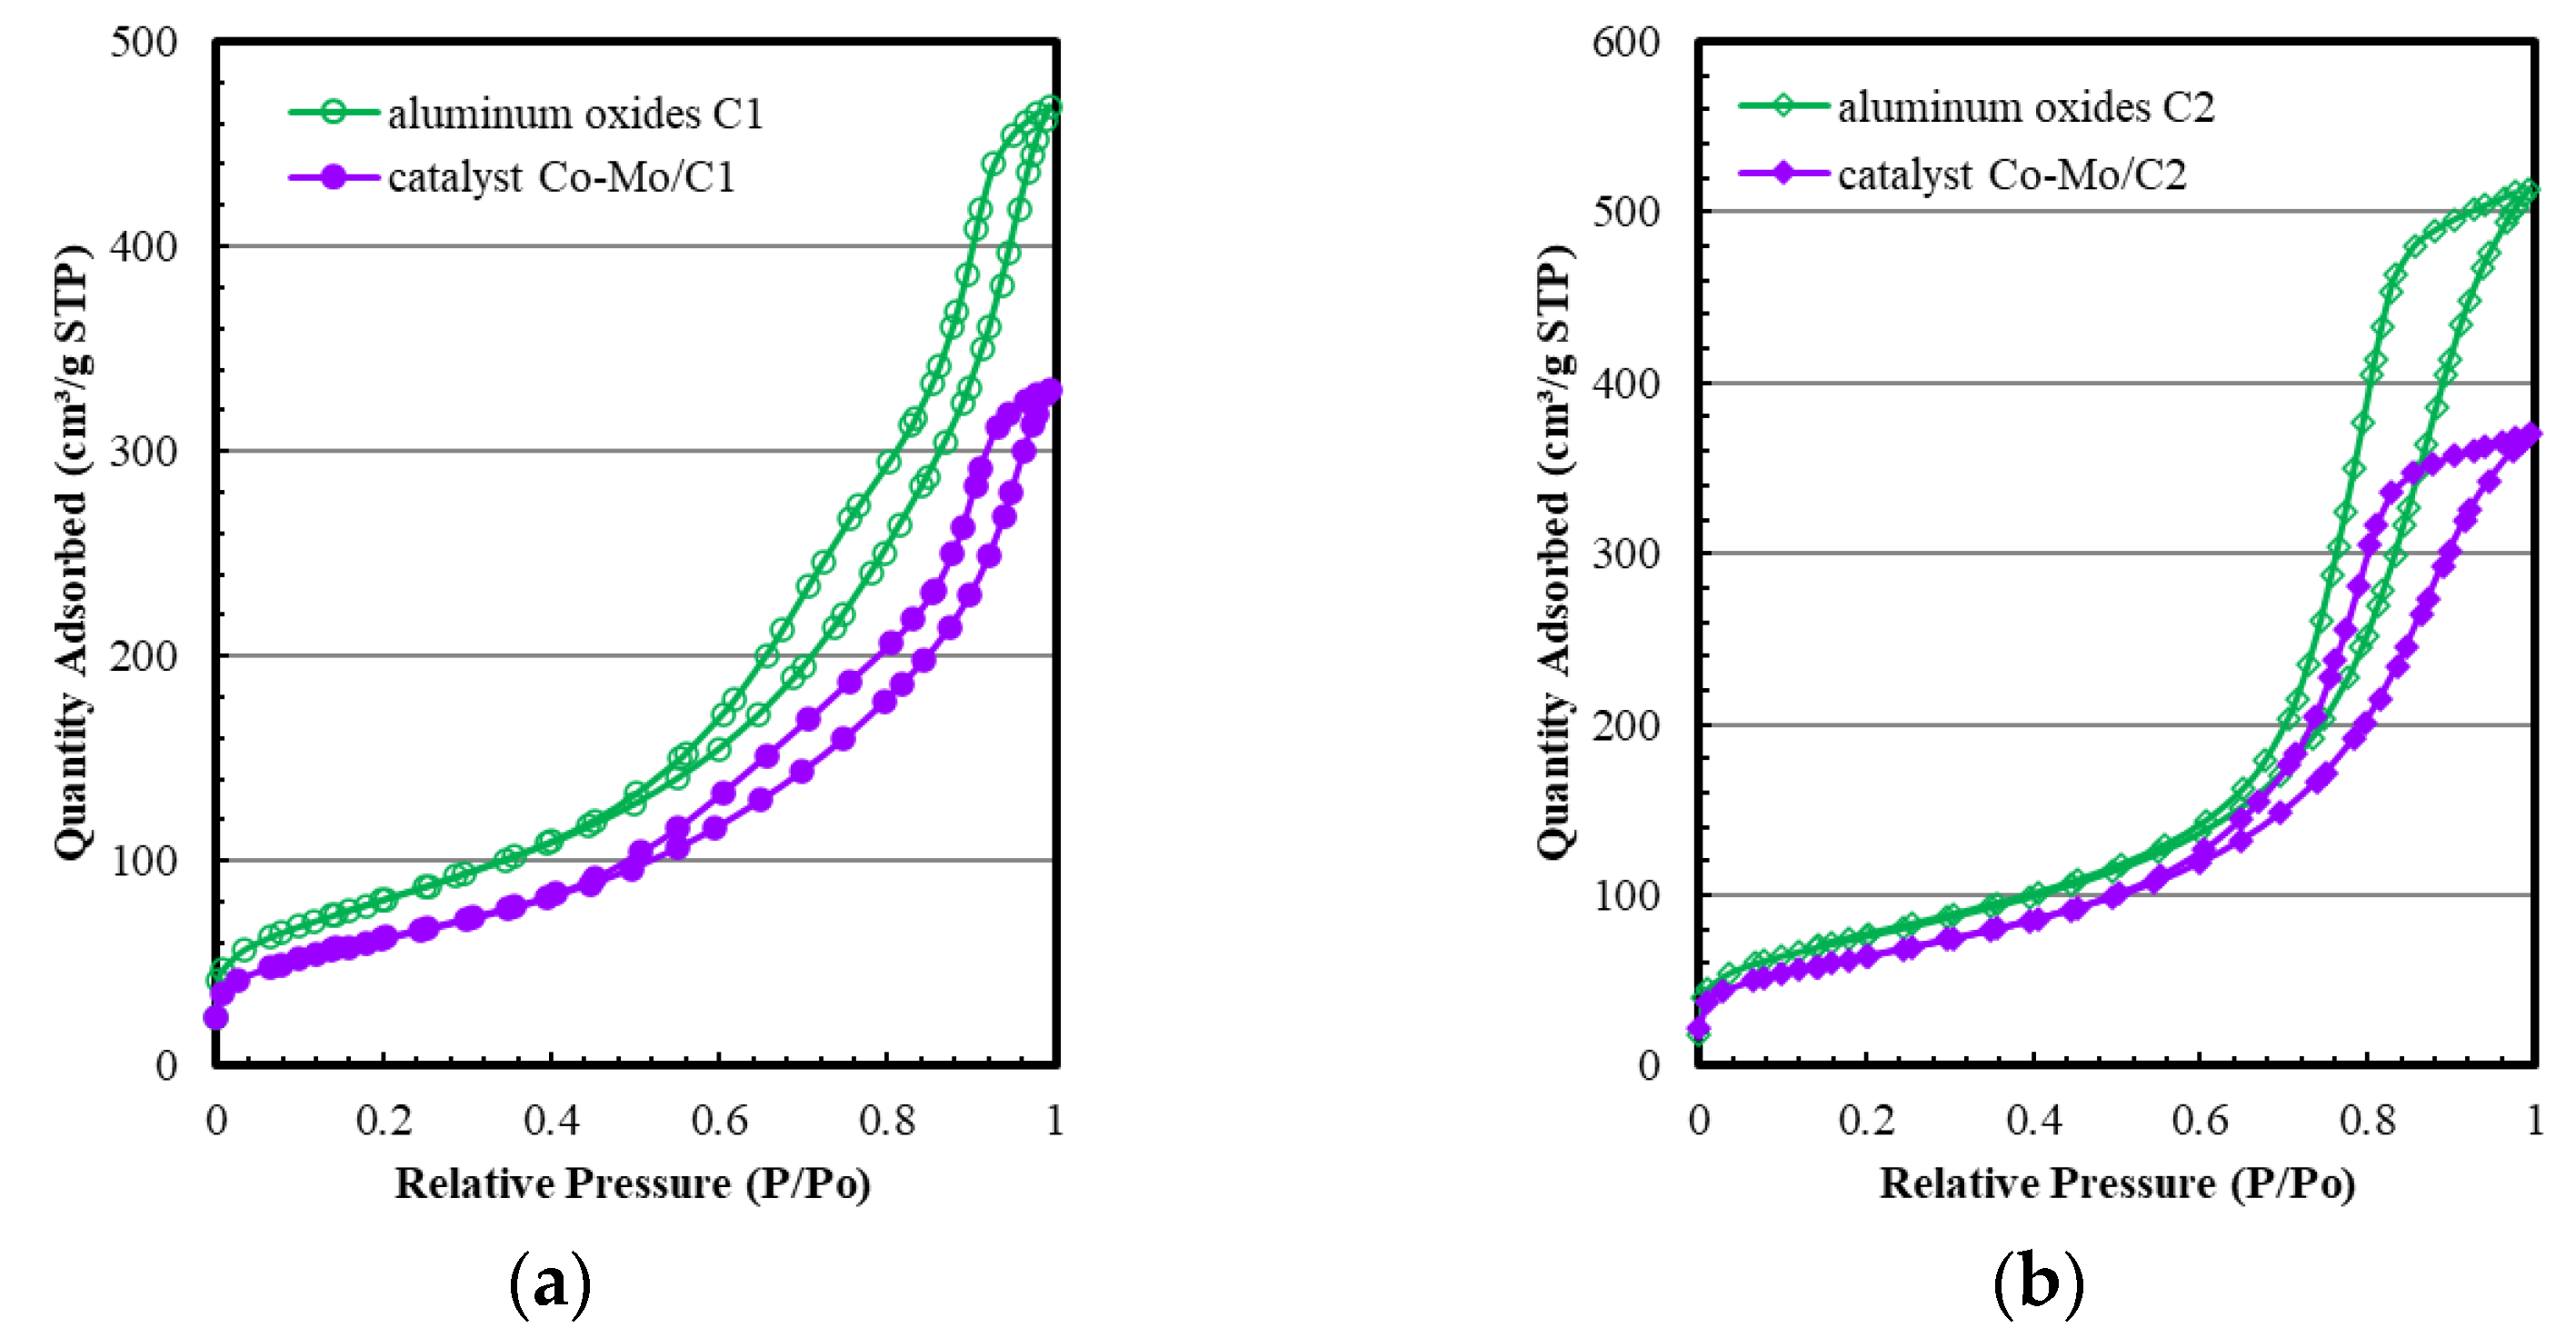
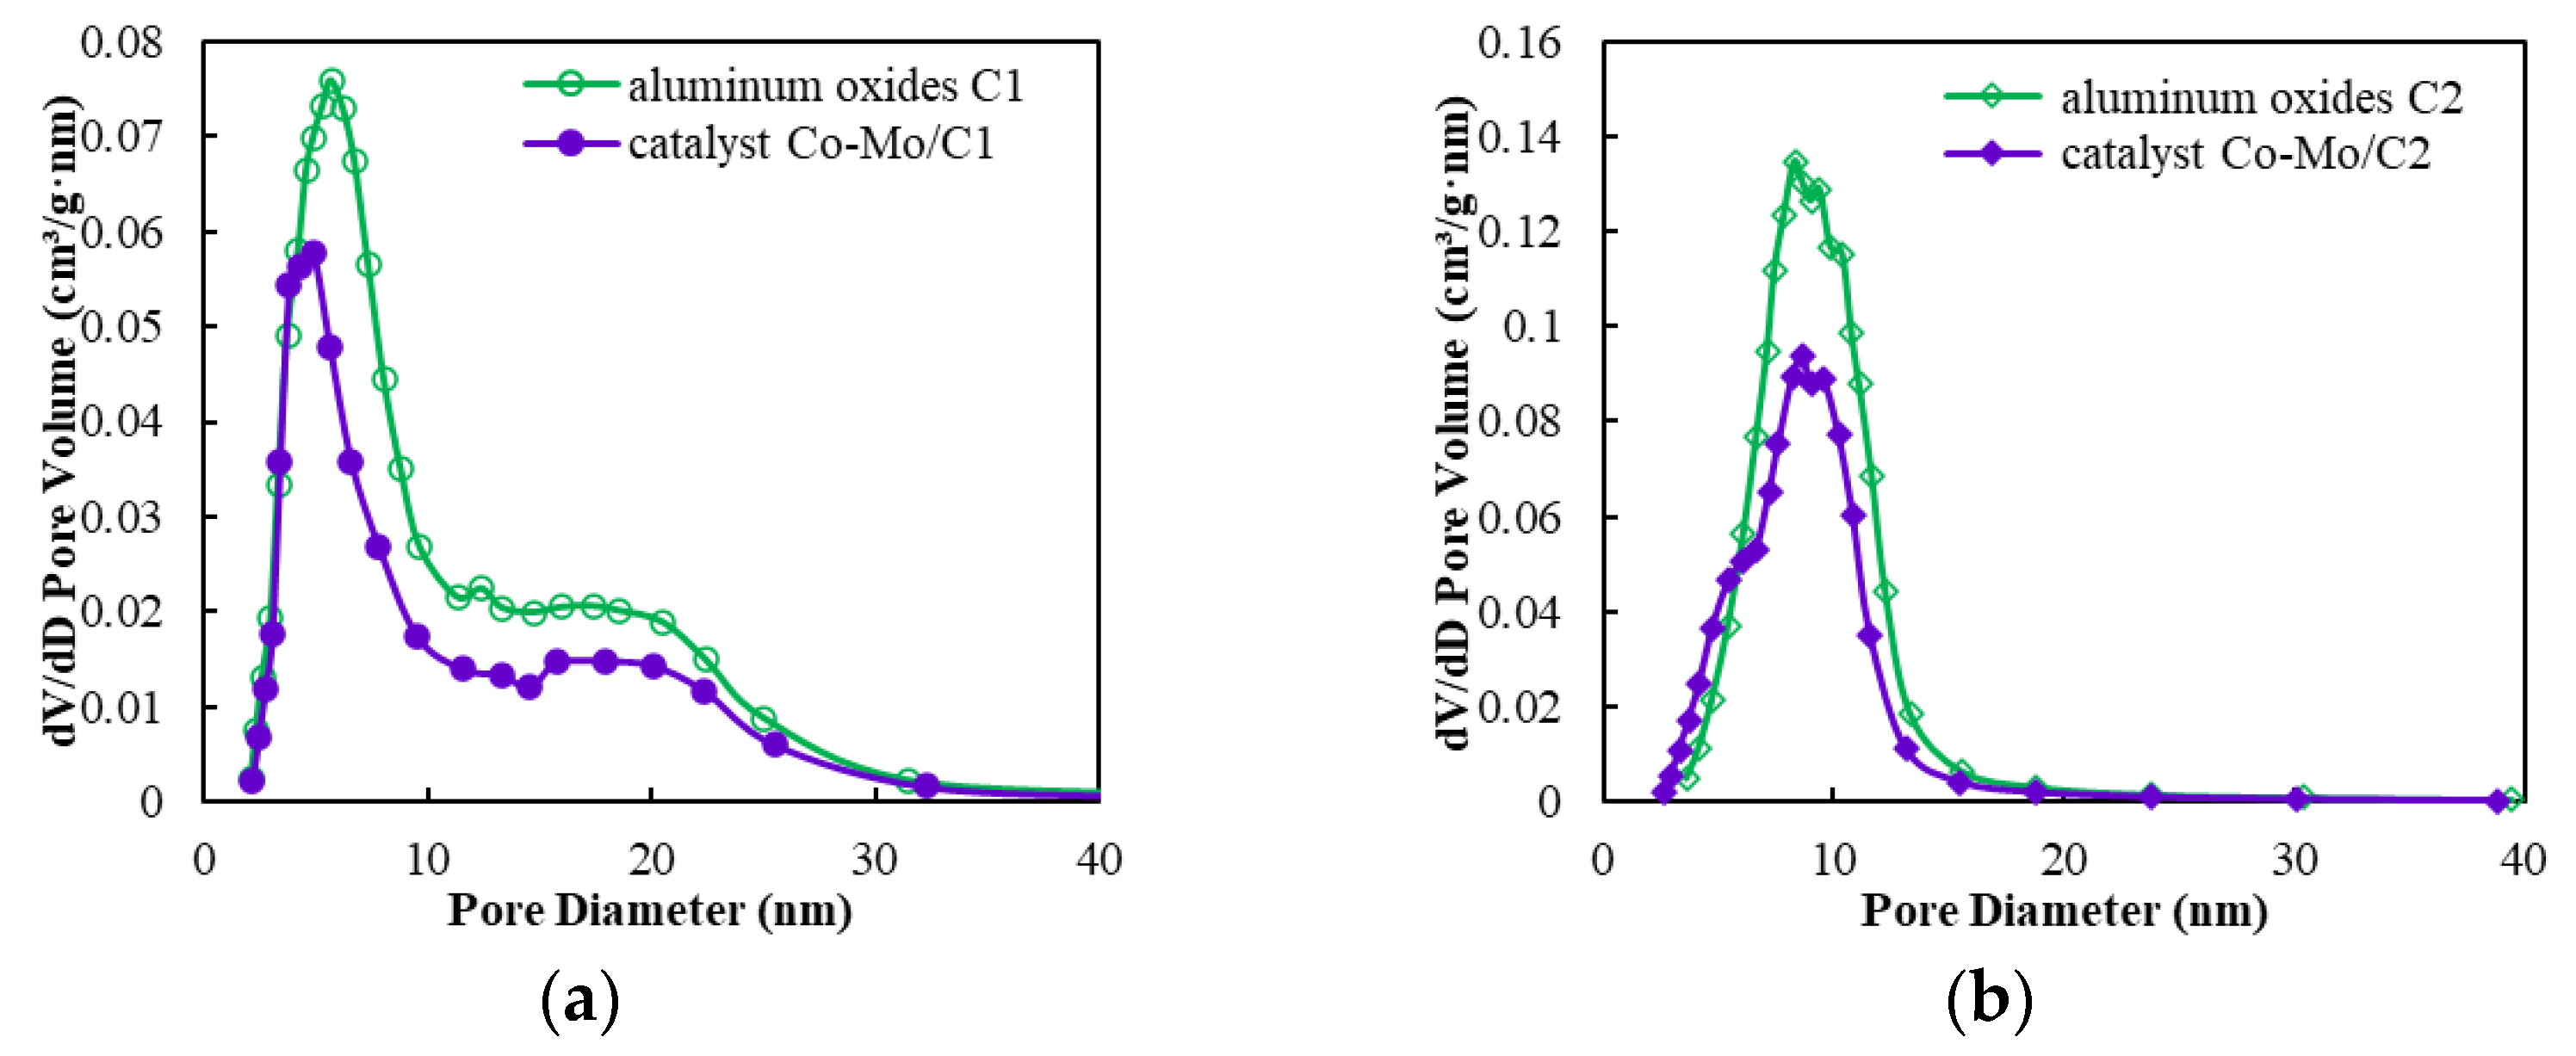
2.2. The Pore Structure of Aluminum Oxides

The porous system of the C1 carrier is described by the nitrogen adsorption isotherm of type II according to the BDDT classification (Figure 4). The first section is due to monolayer and multilayer adsorption, at low and medium relative pressures (P/P0). Further adsorption of nitrogen is accompanied by an increase in the thickness of the layers of adsorbed nitrogen and their subsequent clamping with pore filling at high relative pressures. The C1 carrier is characterized by a hybrid H3-H4 (IUPAC) hysteresis loop (Figure 4) [29]. This indicates the presence of slotted pores in the sample.
Aluminum oxide C2 has a type IV adsorption isotherm (Figure 4). The adsorption isotherm is characterized by two sites. In the first area, there is a slow increase in absorption of nitrogen at low relative pressure (P/P0), which corresponds to monolayer and multilayer adsorption on the pore walls. In the second site, there is a sharp jump at medium relative pressure, which is caused by capillary condensation in the mesopores. The hysteresis loop is of the H1 type. This indicates the presence of cylindrical pores open on all sides.
The carrier C1 is characterized by a bi-monomodal structure with a maximum pore volume distribution at diameter D = 6.2 nm and a shoulder in the pore region of 15–25 nm (Figure 4). The specific surface area of aluminum oxide is 294 m2/g, and the porometric volume is 0.74 cm3/g. The average pore diameter is 8.3 nm. Analysis of the pore size distribution shows that the pores with a diameter of 2–5 nm account for 17.6% of the total pore volume. The shares of pores with diameters of 5–11 nm and more than 11 nm are 36.5 and 45.9%, respectively (Table 1).
On the pore size distribution curve of aluminum oxide C2, there is one maximum at a diameter of 8.7 nm. The specific surface area and porometric volume of this oxide are 277 m2/g and 0.81 cm3/g, respectively. The average pore diameter is 9.0 nm. The share of pores with a diameter of 2–5 nm is 3.0% of the total pore volume. The share of pores with a diameter of 5–11 and more than 11 nm is 68.5 and 28.5% (Table 1).
Nitrogen isothermal adsorption–desorption analysis indicates that the application of metals did not induce any change in the shape of pores (Figure 4). This indicates a uniform distribution of the active phase on the surface of aluminum oxides without pore blocking. However, as expected, the application of Co-Mo to aluminum oxides leads to a change in other parameters of the porous structure. Total pore volume and specific surface area were decreased by 0.22–0.24 cm3/g and 45–70 m2/g, respectively. The two catalysts have similar values of specific surface area, pore volume, and average pore diameter (Table 1). On the distribution curves of pore diameters by size, there is a decrease in the intensity of maximums (Figure 5). The distribution of active components occurs in pores with diameters of 5–11 and ˃11 nm, and their volumes were decreased by 0.112–0.155 cm3/g and 0.100–0.140 cm3/g, respectively.

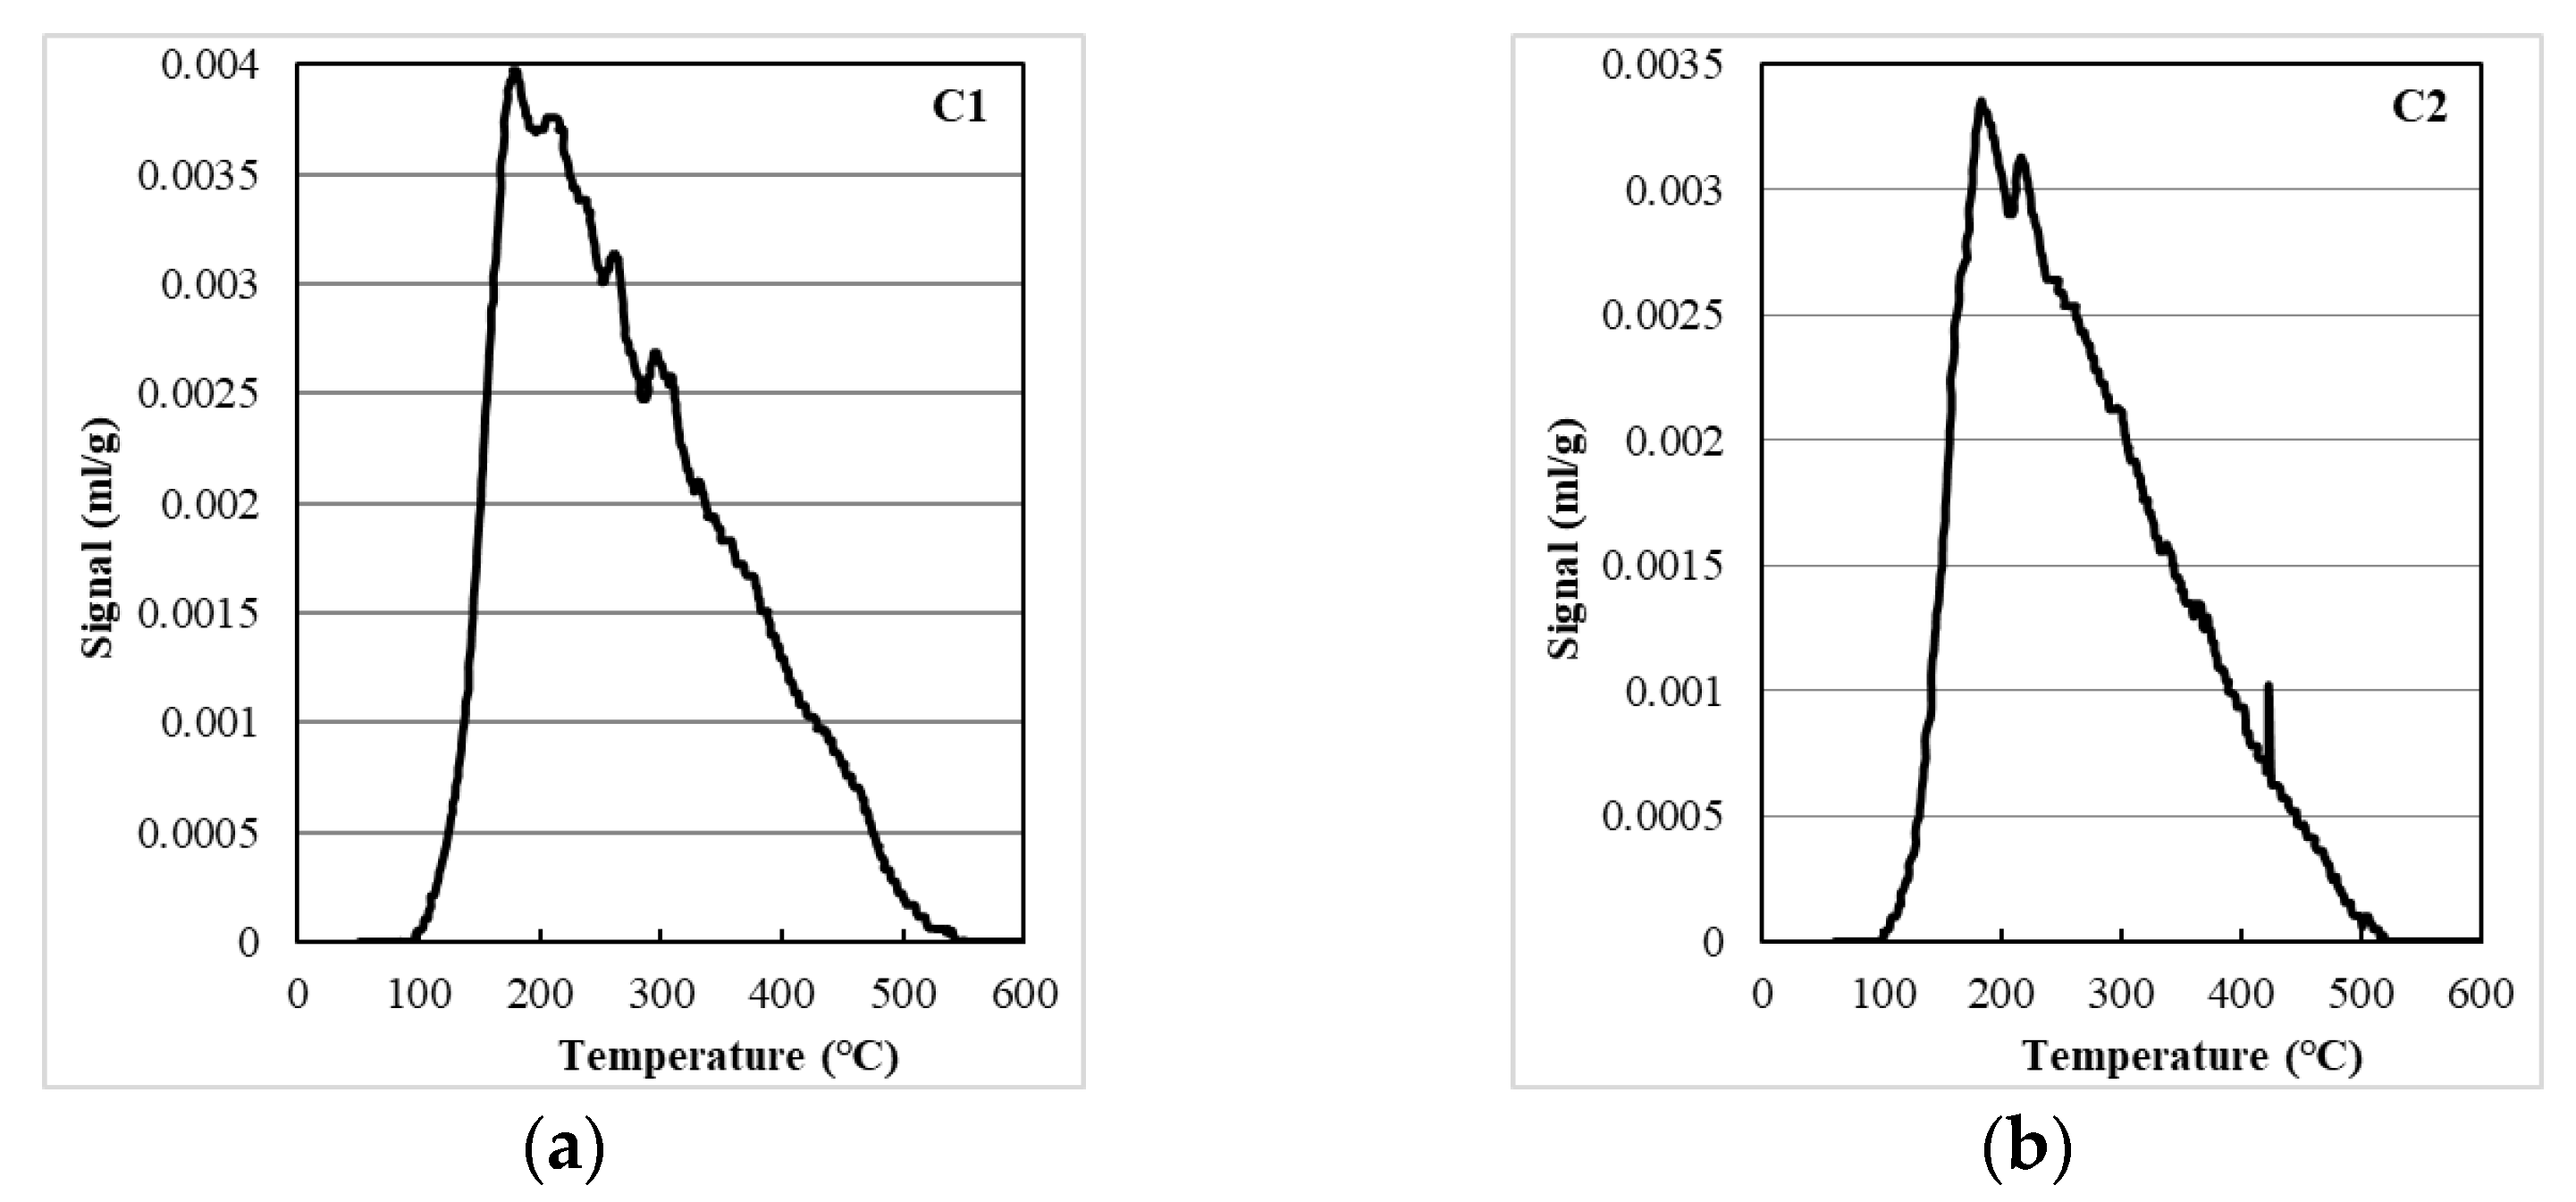
2.3. The Total Acidity of the Bronsted and Lewis Centers of Aluminum Oxides and Catalysts

The ammonia thermal desorption curve of the C1 carrier shows one maximum at 180 °C with a broadening in the high-temperature region up to 545 °C (Figure 6). The total concentration of acid centers in this sample is 475 μmol/g (Table 2).
To estimate the strength of acid centers and their concentration, the ammonia desorption spectrum was divided into four temperature regions corresponding to the different strengths of acid centers. The greatest contribution to the total concentration of acid centers falls on the weak and medium centers, and their shares are 49 and 31%, respectively. The shares of strong and very strong acid centers are 17% (79 µmol/g) and 4% (17 µmol/g), respectively.
For the C2 carrier, the total concentration of acid centers is 371 μmol/g, which is less in comparison to that of the carrier C1. The numbers of weak, medium, and strong centers are 186, 149, and 79 μmol/g, respectively. The concentration of very strong centers is 9 μmol/g. The higher total concentration of acidic centers of aluminum oxide C1, compared with the carrier C2, is probably due to the lower degree of the crystallinity of C1 according to X-ray diffraction analysis.
The application of metals leads to approximately the same decrease in the number of acid centers for the two catalysts (Table 2). At the same time, cobalt and molybdenum interact mainly with weak and medium acid centers. Probably, an approximately equal interaction of metals with acid centers for the two catalysts and insignificant interaction with strong and very strong centers are caused by using a chelating agent at the application stage. According to the literature data [30], it prevents the interaction of metals during their application to the strong centers. At the same time, its removal at the stage of calcination does not significantly affect the additional interaction of metals with acidic centers.

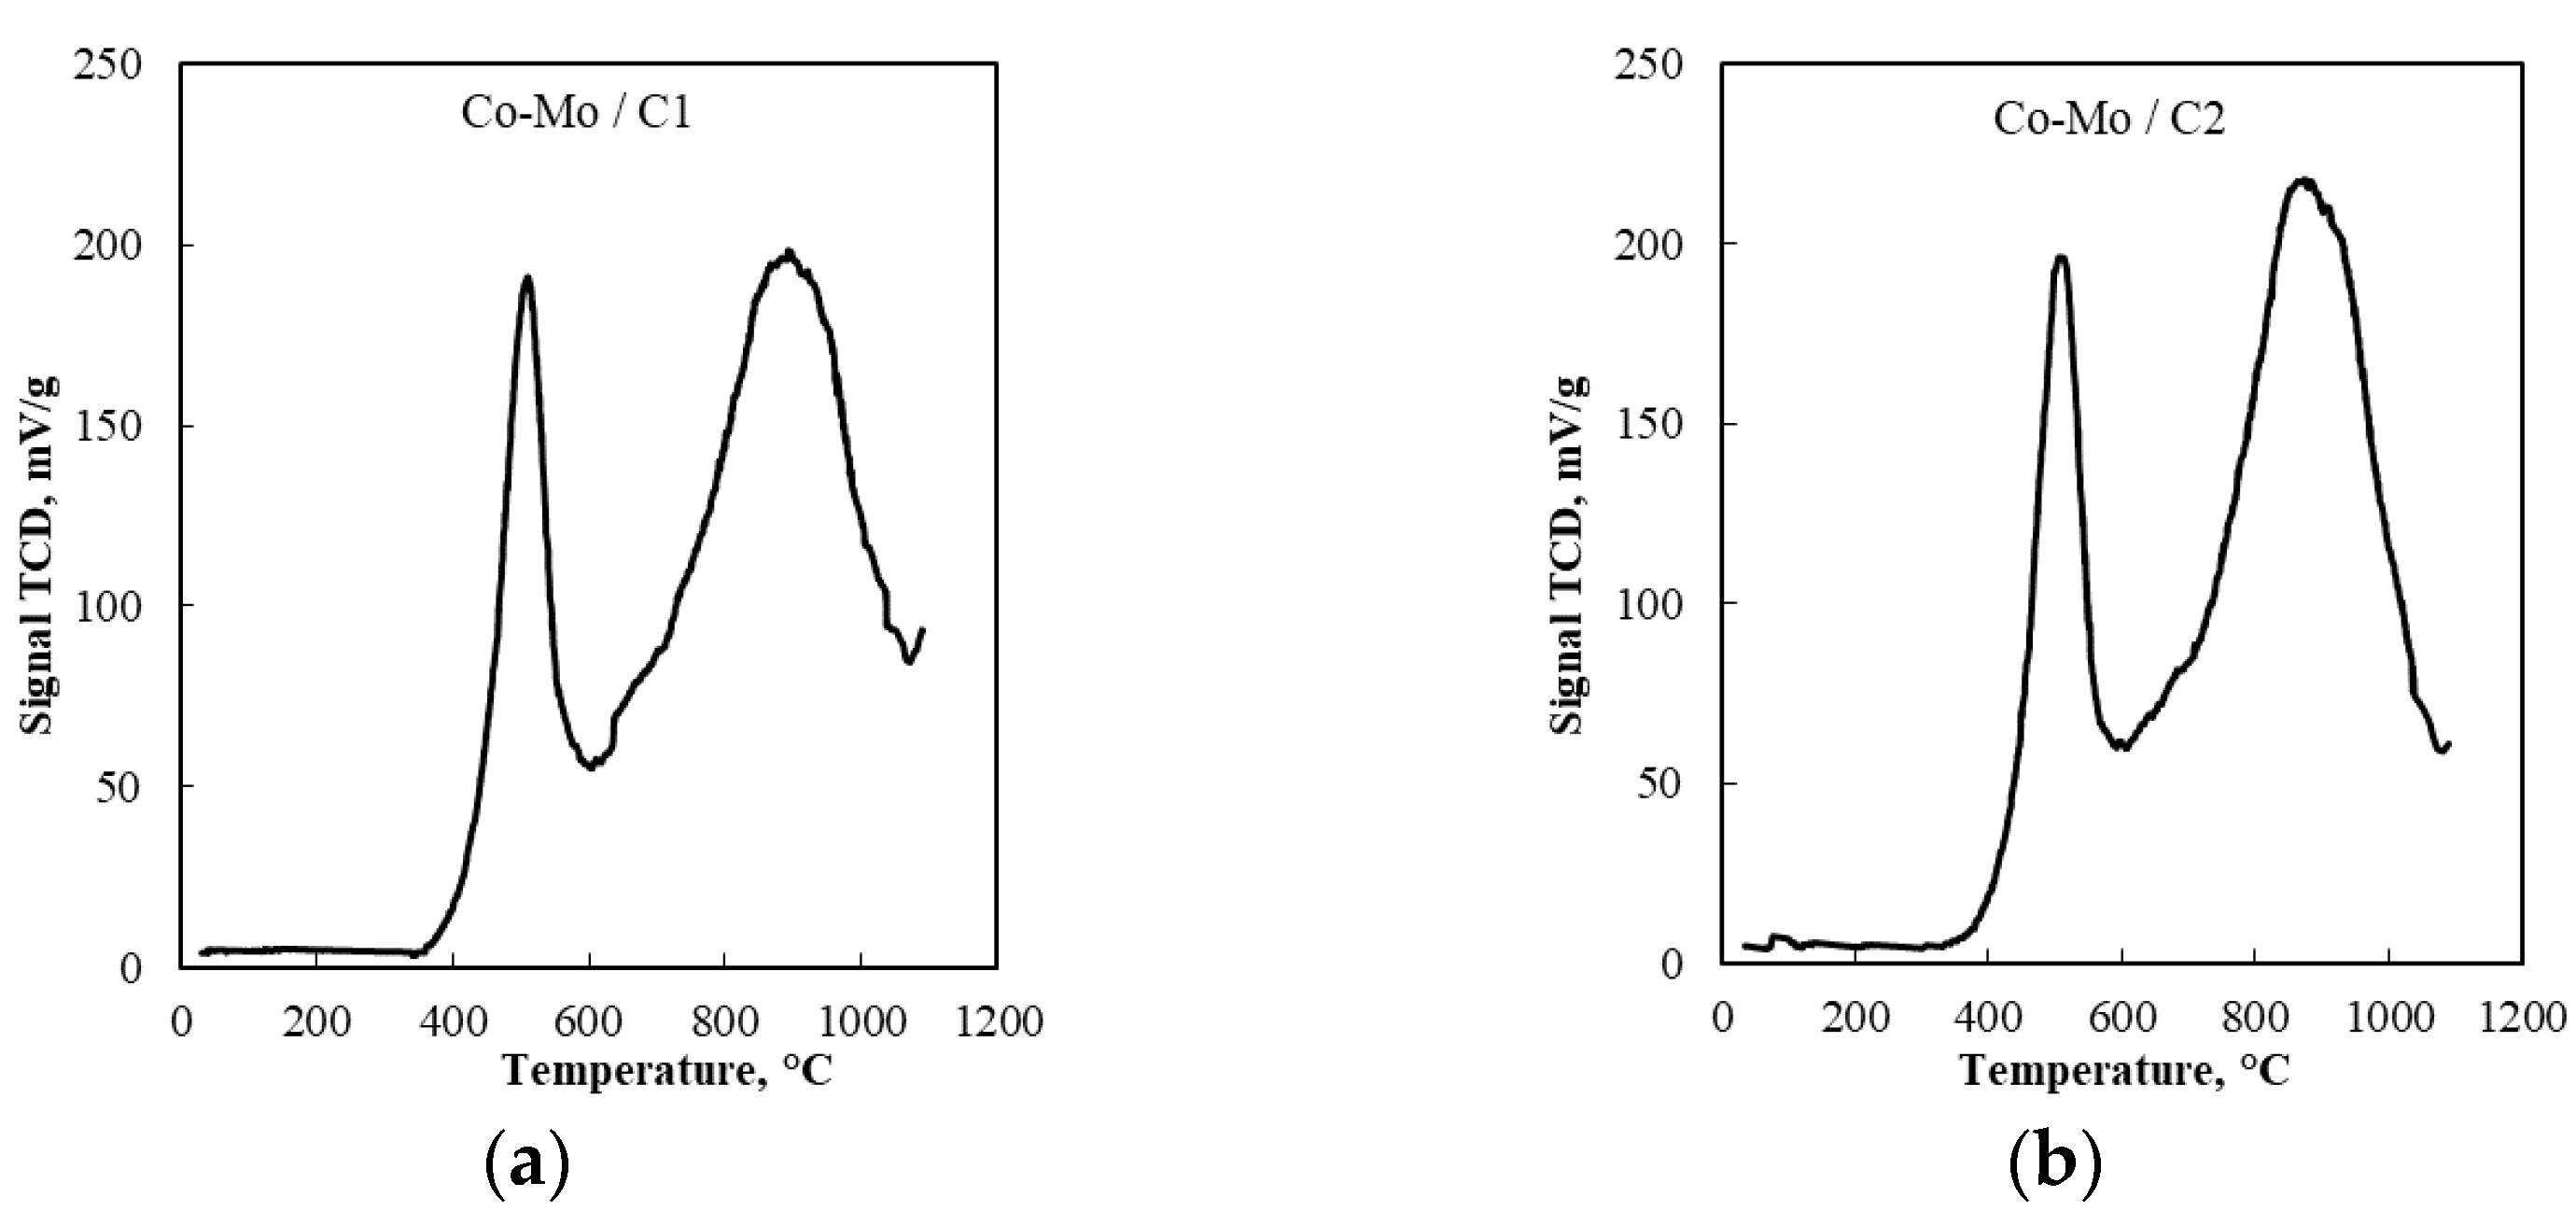
2.4. Temperature-Programmable Catalyst Reduction

The reduction of the Co-Mo/C1 sample pre-oxidized at 400 °C is accompanied by the appearance of two hydrogen absorption peaks on the spectra with maxima at 512 and 897 °C, respectively (Figure 7). The first low-temperature peak is due to the metals weakly bound to the carrier surface, which forms an active CoMoS phase of type II during sulfidation. The second high-temperature peak is due to the reduction of metals strongly bound to the aluminum oxide. Their sulfidation proceeds with the formation of the inactive CoMoS phase of type I [30,31].
The spectra of the temperature-programmed reduction of Co-Mo/C2 catalyst show two peaks at 511 and 875 °C, respectively. The intensity of these peaks is comparable to the intensity of the peaks for the Co-Mo/C1 catalyst (Table 3). This indicates that the amount of weakly and strongly bonded metals is approximately the same for the two catalysts. At the same time, it was shown in [32] that the increase in the total number of acid centers was accompanied by an increase in the number of strongly bound metals with the aluminum oxide surface. Probably, in our case, the lack of dependence of the number of acid centers on the number of strongly bound metals on the surface is due to the use of a chelating agent. Chelate agents are used in reference [29], which reduces the degree of interaction of metals with acid centers.

2.5. Catalytic Effect of Catalysts

For the Co-Mo/C1 catalyst, the content of resins and asphaltenes decreases from 7.98 and 11.68 wt.% to 2.09 and 2.42 wt.%, respectively (Table 4); the concentration of sulfur in the reaction products decreases from 2.18 to 0.94 wt.%; and the concentration of vanadium and nickel decreases from 0.080 and 0.010 wt.% to 0.015 and 0.006 wt.%, respectively (Table 5).
For the Co-Mo/C2 catalyst, a slightly stronger reduction in asphaltenes content is observed but a lower degree of reduction in resins content. The content of resins and asphaltenes in the upgraded oil is 2.36 and 2.24 wt.%, respectively. The reduction of sulfur and vanadium is more significant compared with Co-Mo/C1 catalyst. The Co-Mo catalysts based on C1 and C2 carriers are characterized by similar specific surface area parameters, total pore volume, and average pore diameter. In addition, the catalysts have the same amount of weak and strong surface-bound metals. Therefore, it can be concluded that the differences in the decrease degree of sulfur, metals, and asphaltenes depend on the pore shape of the two catalysts. The Co-Mo/C1 catalyst is characterized by slit-shaped pores, and the Co-Mo/C2 sample is characterized by a cylindrical pore shape. Slit-shaped pores are formed by thin needles and plates having an elongated shape [33]. The presence of elongated slit-like pores leads to diffusion limitations in the removal of large molecules of asphaltenes, sulfur-containing, and metal-containing compounds, which thus reduces the activity of the Co-Mo/C1 catalyst. The work in [22] also shows that the presence of diffusion limitations leads to a decrease in the rate of the processes of hydrodemetallization and hydrodeasphalting.
Table 6 shows the viscosity reduction effect the two catalysts. For the measurements of viscosity, the diesel fraction was removed to remove the initially added diesel for dilution, and the diesel fraction in the initial extra heavy oil was restored (the amount of diesel fraction added was equal to the content of the diesel fraction in the original extra heavy oil). In the restoring process of diesel fraction into the upgraded oil, the content of newly produced diesel was not considered. Considering that more light fractions were produced during the upgrading process, the viscosity of upgraded oil might be lower than the values shown in Table 6. In comparison to the initial viscosity of the extra heavy oil (28,200 mPa∙s), the viscosity of the upgraded oil was significantly decreased, which indicates that the developed catalysts have an excellent catalytic effect. The viscosity upgraded oil by the Co-Mo/C2 catalyst (449 mPa∙s) is lower than that by the Co-Mo/C1 catalyst (485 mPa∙s), which is consistent with the SARA fractions results since the viscosity of the oil strongly depends on the amount of asphaltenes in it. The lower viscosity obtained by Co-Mo/C2 catalyst can be attributed to its cylindrical pore structure at a lower number of acid centers, which leads to lower diffusion limitations. This contributes to the free access of asphaltene molecules to the active centers and, accordingly, resulting in a stronger reduction in the viscosity of the oil. In addition, the C1 carrier has a higher content of acid centers than the C2 carrier, which leads to a higher rate of gas phase formation (see material balance part).
The high catalytic activity shown in this paper is in good agreement with the results of the work where Co-Mo/γ-Al2O3 was used as catalysts for in situ upgrading of heavy oil in toe-to-heel air injection process [34]. However, a higher degree of viscosity reduction in our work is achieved, which is probably due to the difference in upgrading technique. In addition, in our work, hydrogen was used in the process, while in their work, steam was used as the possible hydrogen source.
In addition, a material balance calculation was performed for the two catalysts (Table 7). For Co-Mo/C1, the amount of formed liquid phase of hydrocarbons is 96.73 wt.%. The amount of byproducts of coke and gas phase hydrocarbons is 0.54 and 2.73 wt.%, respectively. For Co-Mo/C2, the amount of liquid phase hydrocarbons is 97.72 wt.%, which is higher than that for Co-Mo/C1; in addition, the amount of formed coke and gas phase hydrocarbons is less (0.33 and 1.95 wt.%, respectively). The lower amount of byproducts for Co-Mo/C2 compared to Co-Mo/C1 is due to the lower number of acid centers and correspondingly to a lower rate of formation of gaseous hydrocarbons. Moreover, the presence of cylindrical pores for the C2 carrier provides a higher diffusion of reaction molecules and a decrease in the formation of coke. Previous studies have also shown that the reduction of diffusion of large hydrocarbon molecules because of a reduction in average pore diameter and total pore volume results in an increase in coke formation and a decrease in catalyst operation time [11,26,27].

3. Materials and Methods

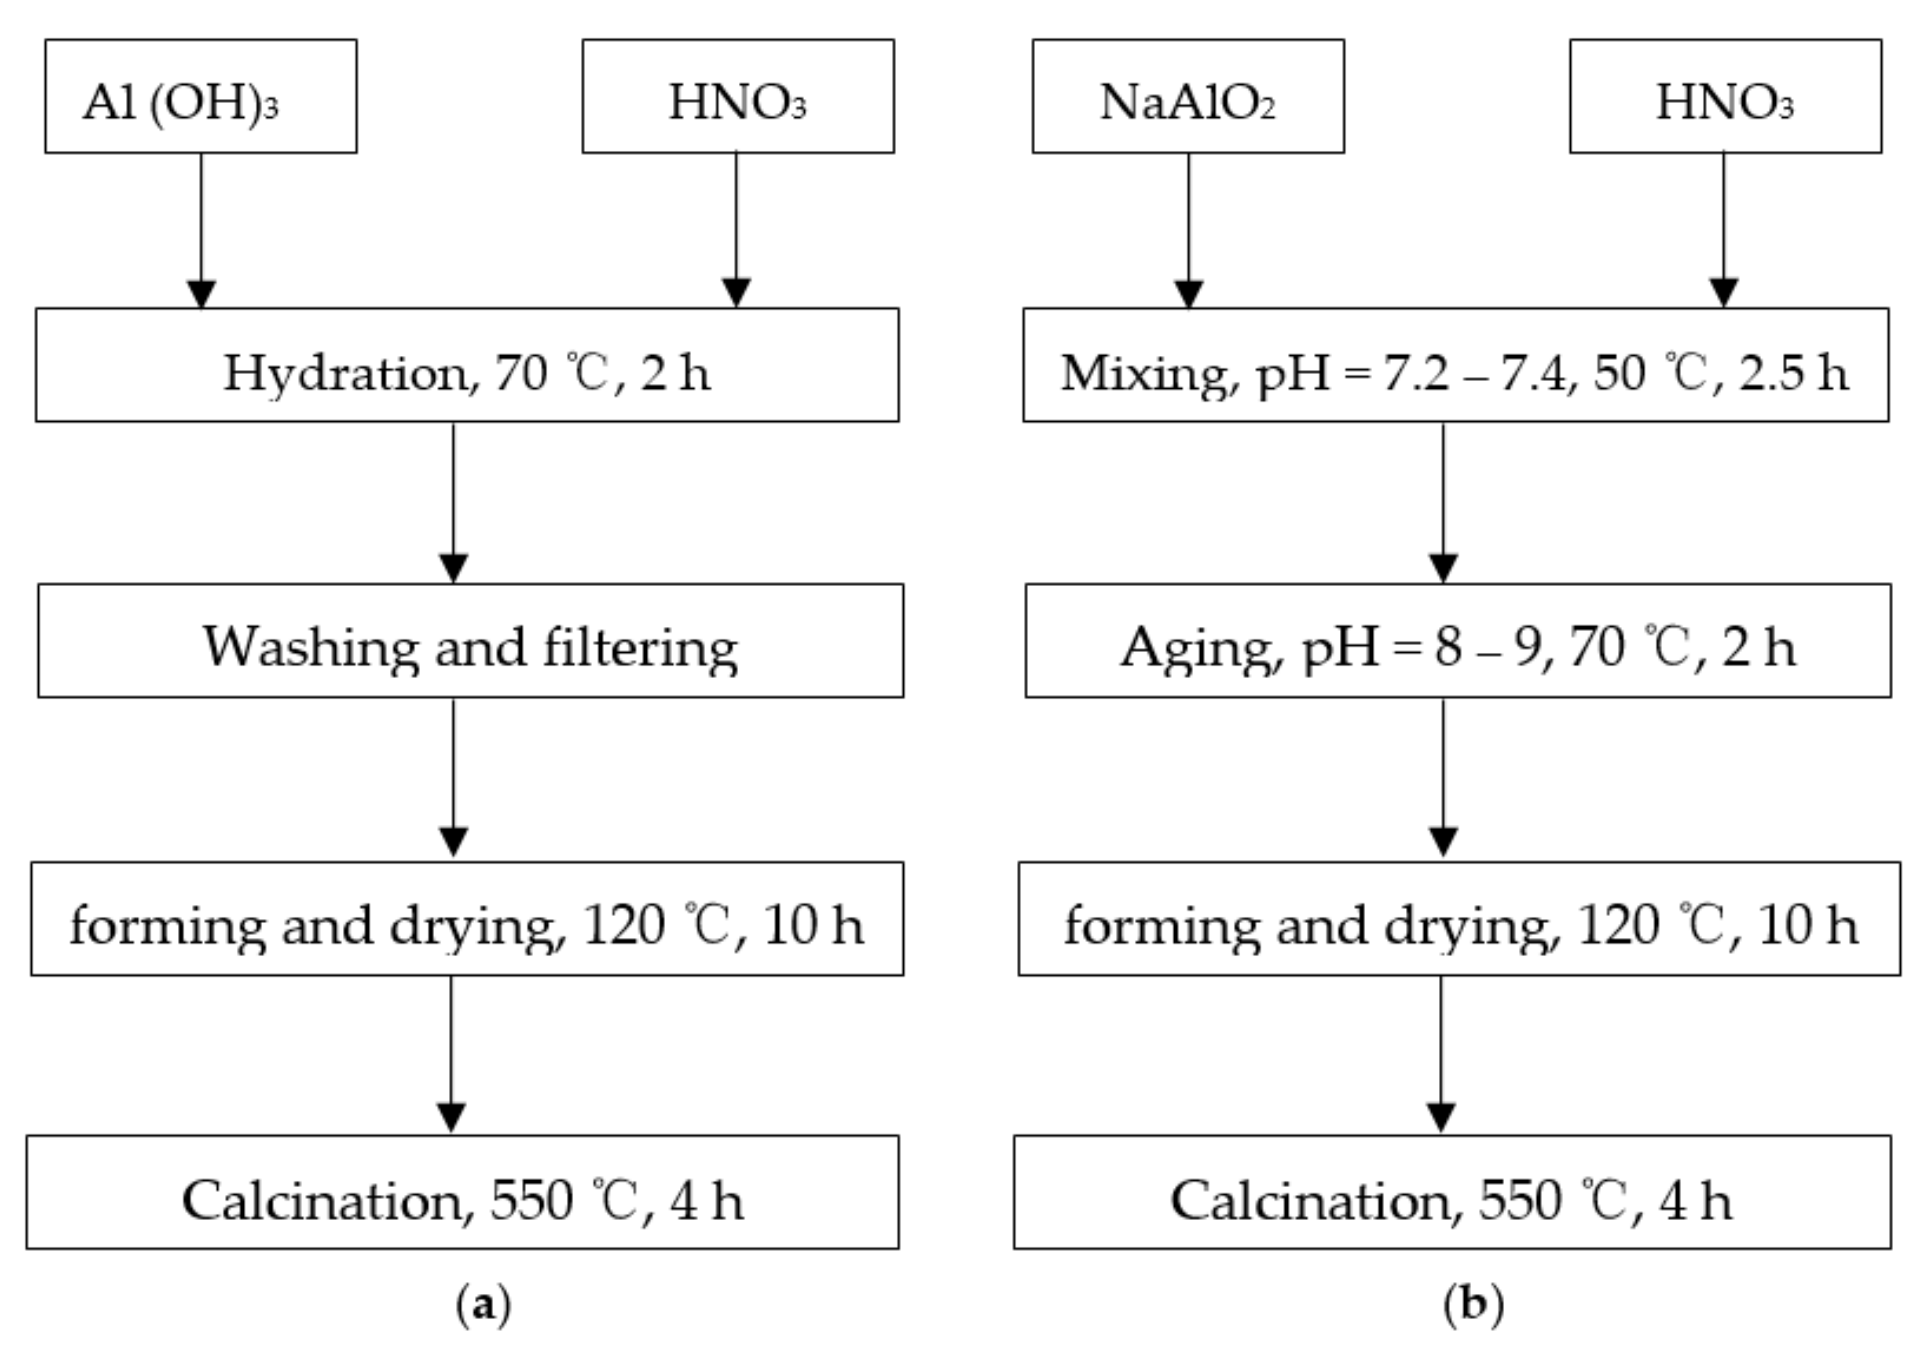
3.1. Synthesis of Aluminum Oxides and Catalysts

To study the effect of pore structure, including pore diameter, pore volume, specific surface area, and pore shape of aluminum oxides on the properties of catalysts, two types of carriers based on trilobal γ-Al2O3 were used (Figure 8).
The first carrier (C1) was obtained from the aluminum hydroxide of pseudoboehmite morphology, which was synthesized from the product of the thermochemical activation of gibbsite (Figure 8a). This aluminum hydroxide was hydrated at 70 °C for 2 h in aqueous nitric acid solution, then conducted hydrothermal treatment at 120 °C for 4 h. The obtained aluminum hydroxide was filtered, washed with distilled water. Then, aluminum hydroxide was molded in the form of trefoil. Pellets were dried for 10 h at 120 °C and then calcined at 550 °C for 4 h.
The process of obtaining aluminum oxide extrudates (C2) is shown in Figure 8b. This carrier was obtained from aluminum hydroxide of pseudoboehmite morphology synthesized by precipitation from solutions of sodium aluminate and nitric acid. Sodium aluminate and nitric acid solutions after mixing were kept under constant stirring for 2.5 h at pH = 7.2–7.4 and temperature 50 °C. Then, the temperature and pH were raised to 70 °C and 8–9, respectively, for 2 h more. The aluminum hydroxide precipitate was filtered and washed with distilled water. The obtained aluminum hydroxide was molded in the form of trefoil. Aluminum hydroxide granules were dried at 120 °C for 10 h and calcined at 550 °C for 4 h.
Co-Mo catalysts were synthesized by co-deposition of metals on the surface of aluminum oxides C1 and C2 by moisture absorption from aqueous solutions of metal salts. Molybdenum was from ammonium paramolybdate. Cobalt was from cobalt nitrate. Additionally, a chelating agent was introduced into the solution of metal salts. After the application of metal salts, the carrier was dried at 120 °C and calcined at 450 °C for 4 h. The composition of the catalysts is shown in Table 8.

3.2. Characterization of Aluminum Oxides and Catalysts

The phase composition of the catalyst was studied by X-ray powder diffraction (XRPD) on a MiniFlex 600 diffractometer (Rigaku, Japan) equipped with a D/teX Ultra detector with Cu Kα radiation (40 kV, 15 mA) in a range from 2–100° with a step of 0.05°. The specific surface area and pore volume were measured by low-temperature nitrogen adsorption on an Autosorb-iQ-MP (Quantachrome, Boynton Beach, FL, USA), based on the accepted surface area of nitrogen molecules taken as 0.162 nm2. Nitrogen adsorption isotherms were obtained at 196 °C after degassing the samples at 300 °C to a residual pressure of 0.013 Pa. The pore volume and pore size distribution were calculated from the desorption branch of the isotherm, using the standard Barrett–Joyner–Highland procedure.
The acidic center concentration was determined by the thermoprogrammed desorption of ammonia (NH3–TPD) method using an AutoChem 2950 HP (Micromeritics, Norcross, GA, USA) analyzer. For this purpose, a sample of 0.5 g was loaded into the quartz reactor, followed by the degassing of the instrument in an electric furnace at 550 ℃; the heating rate was 10 °C/min, and the carrier gas flow rate (He) was 10 mL/min. The support was saturated with a mixture of 10% NH3 in He at room temperature for an hour. Following that, the sample was purged with argon at 100 ℃ to remove the physically adsorbed ammonia.
Thermal programmed reduction of catalysts was performed on a AutoChem 2950 HP device (Micromeritics). Then, 0.1 g catalyst in the form of 0.25–0.5 mm fraction was loaded in a U-shaped quartz reactor. For moisture removal, the sample was dried in an argon current at 120 °C for 1 h, then cooled to 40 °C. Then, instead of argon, a gas mixture containing 5% H2 in argon was fed into the reactor at a rate of 30 mL/min, and the sample was heated to 1000 °C at a rate of 10 °C/min. Hydrogen absorption was measured using a thermal conductivity detector.
Determination of the group composition of oils by SARA analysis was carried out according to ASTM D 4124. The oil was separated into saturated, aromatics, resins, and asphaltenes. In this method, asphaltenes are first separated from other hydrocarbon components by using n-heptane as solvent (the oil-to-solvent ratio was 1:40 by weight). The remaining components, called maltenes, were separated by passing them through a chromatographic column with an adsorbent (Aluminum oxide, Al2O3). N-heptane was carefully poured into a 44 cm long and 20 cm inner diameter chromatographic column. The collected fraction contained saturates. Next, toluene was poured into the column to collect the fraction of aromatic hydrocarbons. Then, a mixture toluene/isopropyl alcohol prepared in the ratio of 1:1 was passed through the column to collect the fraction containing resins (Resins). After extraction by distillation, the solvents were separated from all three fractions at the rotary evaporator to constant mass.

3.3. Upgrading Experiments for Reducing Oil Viscosity

The catalysts were tested on a laboratory setup that included an isothermal reactor, feed pumps, gas flow regulators, and hydrogenate separation. Catalyst granules in the form of a trefoil were loaded into the reactor in the amount of 5 milliliters. The catalyst was pre-mixed evenly with silicon carbide in the volume ratio of silicon carbide: catalyst-2: 1. The length of the catalyst granule was 2–5 mm, and the diameter of the circumscribed circle was 1.4 mm. After the catalyst was loaded into the reactor, the drying stage was carried out in hydrogen current at pressure 20 kgf/cm2 and temperature 150 °C for 2 h. Viscosity reduction experiments were carried out using extra heavy oil (obtained from SINOPEC Northwest Company of China Petroleum and Chemical Corporation) with a dynamic viscosity of 28,200 mPa∙s (50 °C). The saturates, aromatics, resins, and asphaltenes (SARA) fractions and the viscosity–temperature data of the extra heavy oil are presented in Table 9. Due to the high viscosity, the initial oil cannot move very well and thus was pre-diluted with a diesel fraction in a volume ratio of 1: 1.5. Another purpose of dilution using diesel fraction is to reduce the initial concentration of asphaltenes, which can avoid coke formation during treatment process, especially when temperature is higher than 360 °C. The diesel fraction was preliminarily hydrotreated before use. The total feed rate of the mixture of oil and diesel fraction was 5 milliliters per hour. Hydrocracking was carried out under 4.0 MPa. The volume flow rate of feedstock was 1.0 h−1, and the volume ratio of H2 to feedstock was 600 nL/L. During the first 10 h, the temperature in the reactor was 360 °C, then the temperature was raised to 380 °C, held for 10 h, and then, the temperature was raised to 410 ℃. Liquid products were accumulated for 6 h and analyzed by various methods. The group composition of the crudes and refined oil was determined by liquid adsorption chromatography (LC) on alumina with the release of the hydrocarbon part and two groups of benzene and alcohol benzene resins. At the beginning of the adsorption separation, asphaltenes were pre-precipitated using a standard procedure in 40 times the amount of hexane. The kinematic oil viscosity of the crudes and refined oil was determined on a Brookfield DV2T analyzer (AMETEK Brookfield, Middleboro, MA, USA). The hydrocarbon composition of the gas phase of the reaction products was found by gas chromatography on a Chromos GC-1000 (Chromos, Dzerzhinsk, Nizhny Novgorod Region, Russia) with a flame ionization detector. A Valco PLOT VP-Alumina KCl capillary column (VICI Metronics, Poulsbo, WA, USA) with a length of 50 m and an alumina phase of 10 μ was used.

4. Conclusions

Aluminum oxide (C1) synthesized from the product of thermochemical activation of gibbsite is characterized by elongated slit-shaped pores. Aluminum oxide extrudates (C2) obtained from the pseudobemite-morphology aluminum hydroxide synthesized by the precipitation of sodium aluminate and nitric acid have cylindrical pores. Both Co-Mo catalysts synthesized using these two types of aluminum oxides showed excellent viscosity reduction effects, which makes them promising for ex situ upgrading of extra heavy oil in the field. The catalyst synthesized on the carrier with slit-shaped pores is characterized by a lower activity in the reactions of removal of sulfur, heavy metals, and asphaltenes in comparison to the catalyst on the carrier with cylindrical pores. The presence of slotted pores leads to additional diffusion limitations in the removal of large asphaltenes molecules as well as sulfur-containing and metal-containing compounds.

Author Contributions

Conceptualization, A.A.L., B.D., C.Y. and M.A.V.; methodology, A.Y.K., A.A.S. and I.R.I.; validation, A.Y.K., A.A.S., A.I.L. and I.R.I.; formal analysis, A.A.A.-M., X.Z. and L.L.; investigation, A.Y.K., A.A.S., A.I.L., A.A.A.-M., R.A.Z. and I.R.I.; resources, B.D., L.L., C.C., C.Y., A.A.L. and M.A.V.; data curation, I.R.I., C.Y., M.A.V. and A.A.L.; writing—original draft preparation, I.R.I., X.Z. and A.A.A.-M.; writing—review and editing, I.R.I. and C.Y.; visualization, I.R.I. and C.Y.; supervision, C.Y., I.R.I., L.L. and M.A.V.; project administration, B.D., L.L., C.C., C.Y. and M.A.V.; funding acquisition, C.Y., A.A.L. and M.A.V. All authors have read and agreed to the published version of the manuscript.

Funding

This research was funded by the Ministry of Science and Higher Education of the Russian Federation under agreement no. 075-15-2022-299 within the framework of the development program for a world-class Research Center “Efficient development of the global liquid hydrocarbon reserves”.

Acknowledgments

The authors are thankful for the support and permission to publish this work from the SINOPEC Northwest Company of China Petroleum and Chemical Corporation.

Conflicts of Interest

The authors declare no conflict of interest.

References

  1. Ghanavati, M.; Shojaei, M.J.; Ahmad Ramazani, S.A. Effects of Asphaltene Content and Temperature on Viscosity of Iranian Heavy Crude Oil: Experimental and Modeling Study. Energy Fuels 2013, 27, 7217–7232. [Google Scholar] [CrossRef]
  2. Nassar, N.N.; Hassan, A.; Pereira-Almao, P. Effect of the Particle Size on Asphaltene Adsorption and Catalytic Oxidation onto Alumina Particles. Energy Fuels 2011, 25, 3961–3965. [Google Scholar] [CrossRef]
  3. Muraza, O.; Galadima, A. Aquathermolysis of Heavy Oil: A Review and Perspective on Catalyst Development. Fuel 2015, 157, 219–231. [Google Scholar] [CrossRef]
  4. Lesueur, D. The Colloidal Structure of Bitumen: Consequences on the Rheology and on the Mechanisms of Bitumen Modification. Adv. Colloid Interface Sci. 2009, 145, 42–82. [Google Scholar] [CrossRef] [PubMed]
  5. Luo, P.; Gu, Y. Effects of Asphaltene Content on the Heavy Oil Viscosity at Different Temperatures. Fuel 2007, 86, 1069–1078. [Google Scholar] [CrossRef]
  6. Sharma, A.; Mullins, O.C. Insights into Molecular and Aggregate Structures of Asphaltenes Using HRTEM. In Asphaltenes, Heavy Oils, and Petroleomics; Springer: Berlin/Heidelberg, Germany, 2007; pp. 205–229. [Google Scholar] [CrossRef]
  7. Ancheyta, J.; Speight, J.G. Heavy Oils and Residua. In Hydroprocessing of Heavy Oils and Residua; CRC Press: Boca Raton, FL, USA, 2007; pp. 1–14. [Google Scholar] [CrossRef]
  8. Al-Muntaser, A.A.; Varfolomeev, M.A.; Suwaid, M.A.; Feoktistov, D.A.; Yuan, C.; Klimovitskii, A.E.; Gareev, B.I.; Djimasbe, R.; Nurgaliev, D.K.; Kudryashov, S.I.; et al. Hydrogen Donating Capacity of Water in Catalytic and Non-Catalytic Aquathermolysis of Extra-Heavy Oil: Deuterium Tracing Study. Fuel 2021, 283, 118957. [Google Scholar] [CrossRef]
  9. Suwaid, M.A.; Varfolomeev, M.A.; Al-muntaser, A.A.; Yuan, C.; Starshinova, V.L.; Zinnatullin, A.; Vagizov, F.G.; Rakhmatullin, I.Z.; Emelianov, D.A.; Chemodanov, A.E. In-Situ Catalytic Upgrading of Heavy Oil Using Oil-Soluble Transition Metal-Based Catalysts. Fuel 2020, 281, 118753. [Google Scholar] [CrossRef]
  10. Yi, S.; Babadagli, T.; Li, H.A. Use of Nickel Nanoparticles for Promoting Aquathermolysis Reaction during Cyclic Steam Stimulation. SPE J. 2018, 23, 145–156. [Google Scholar] [CrossRef]
  11. Rodríguez, E.; Félix, G.; Ancheyta, J.; Trejo, F. Modeling of Hydrotreating Catalyst Deactivation for Heavy Oil Hydrocarbons. Fuel 2018, 225, 118–133. [Google Scholar] [CrossRef]
  12. Trimm, D.L. Deactivation, Regeneration and Disposal of Hydroprocessing Catalysts. In Studies in Surface Science and Catalysis; Elsevier: Amsterdam, The Netherlands, 1989; Volume 53, pp. 41–60. [Google Scholar] [CrossRef]
  13. Sheu, E.Y. Petroleum Asphaltene—Properties, Characterization, and Issues. Energy Fuels 2002, 16, 74–82. [Google Scholar] [CrossRef]
  14. Ohtsuica, T. Catalyst for Hydrodesulfurization of Petroleum Residua. Catal. Rev. 1977, 16, 291–325. [Google Scholar] [CrossRef]
  15. Beaton, W.I.; Bertolacini, R.J. Resid Hydroprocessing at Amoco. Catal. Rev. 1991, 33, 281–317. [Google Scholar] [CrossRef]
  16. Tropsoe, H.; Clausen, B.S.; Massoth, F.E. Hydrotreating Catalysis: Science and Technology; Springer: Berlin/Heidelberg, Germany, 1996. [Google Scholar]
  17. Kohli, K.; Prajapati, R.; Maity, S.K.; Sau, M.; Garg, M.O. Deactivation of Hydrotreating Catalyst by Metals in Resin and Asphaltene Parts of Heavy Oil and Residues. Fuel 2016, 175, 264–273. [Google Scholar] [CrossRef]
  18. Mitchell, P.C.H. Hydrodemetallisation of Crude Petroleum: Fundamental Studies. Catal. Today 1990, 7, 439–445. [Google Scholar] [CrossRef]
  19. Pham, H.H.; Kim, K.H.; Go, K.S.; Nho, N.S.; Kim, W.; Kwon, E.H.; Jung, R.H.; Lim, Y.-i.; Lim, S.H.; Pham, D.A. Hydrocracking and Hydrotreating Reaction Kinetics of Heavy Oil in CSTR Using a Dispersed Catalyst. J. Pet. Sci. Eng. 2021, 197, 107997. [Google Scholar] [CrossRef]
  20. Sámano, V.; Rana, M.S.; Ancheyta, J. An Easy Approach Based on Textural Properties to Evaluate Catalyst Deactivation during Heavy Oil Hydrotreating. Catal. Commun. 2020, 133, 105823. [Google Scholar] [CrossRef]
  21. Badoga, S.; Ganesan, A.; Dalai, A.K.; Chand, S. Effect of Synthesis Technique on the Activity of CoNiMo Tri-Metallic Catalyst for Hydrotreating of Heavy Gas Oil. Catal. Today 2017, 291, 160–171. [Google Scholar] [CrossRef]
  22. Rana, M.S.; Ancheyta, J.; Rayo, P.; Maity, S.K. Effect of Alumina Preparation on Hydrodemetallization and Hydrodesulfurization of Maya Crude. Catal. Today 2004, 98, 151–160. [Google Scholar] [CrossRef]
  23. Salimi, M.; Tavasoli, A.; Rosendahl, L. Optimization of γ-Alumina Porosity via Response Surface Methodology: The Influence of Engineering Support on the Performance of a Residual Oil Hydrotreating Catalyst. Microporous Mesoporous Mater. 2020, 299, 110124. [Google Scholar] [CrossRef]
  24. Shlmura, M.; Shlroto, Y.; Takeuchi, C. Effect of Catalyst Pore Structure on Hydrotreating of Heavy Oil. Ind. Eng. Chem. Fundam. 1986, 25, 330–337. [Google Scholar] [CrossRef]
  25. Kobayashi, S.; Kushiyama, S.; Aizawa, R.; Koinuma, Y.; Inoue, K.; Shimizu, Y.; Egi, K. Kinetic Study on the Hydrotreating of Heavy Oil. 2. Effect of Catalyst Pore Size. Ind. Eng. Chem. Res. 1987, 26, 2245–2250. [Google Scholar] [CrossRef]
  26. Quann, R.J.; Ware, R.A.; Hung, C.W.; Wei, J. Catalytic Hydrodemetallation of Petroleum. In Advances in Chemical Engineering; Elsevier: Amsterdam, The Netherlands, 1988; Volume 14, pp. 95–259. [Google Scholar] [CrossRef]
  27. Ancheyta, J. Deactivation of Heavy Oil Hydroprocessing Catalysts; John Wiley & Sons: Hoboken, NJ, USA, 2016. [Google Scholar] [CrossRef]
  28. Rudolph, M.; Motylenko, M.; Rafaja, D. Structure Model of γ-Al2O3 Based on Planar Defects. IUCrJ 2019, 6, 116–127. [Google Scholar] [CrossRef] [PubMed] [Green Version]
  29. Gregg, S.J.; Sing, K.S.W. Adsorption, Surface Area, and Porosity; Academic Press: London, UK, 1982. [Google Scholar]
  30. Al-Dalama, K.; Stanislaus, A. Temperature Programmed Reduction of SiO2-Al2O3 Supported Ni, Mo and NiMo Catalysts Prepared with EDTA. Thermochim. Acta 2011, 520, 67–74. [Google Scholar] [CrossRef]
  31. Hassan, A.; Ahmed, S.; Ali, M.A.; Hamid, H.; Inui, T. A Comparison between β- and USY-Zeolite-Based Hydrocracking Catalysts. Appl. Catal. A Gen. 2001, 220, 59–68. [Google Scholar] [CrossRef]
  32. Henker, M.; Wendlandt, K.P.; Anisimov, A.V.; Karakhanov, E.A. Molybdenum-Containing Catalysts in the Reactions of Cumene Cracking and Thiophene Hydrocracking. Pet. Chem. USSR 1990, 30, 135–140. [Google Scholar] [CrossRef]
  33. Danilevich, V.V.; Klimov, O.V.; Nadeina, K.A.; Gerasimov, E.Y.; Cherepanova, S.V.; Vatutina, Y.V.; Noskov, A.S. Novel Eco-Friendly Method for Preparation of Mesoporous Alumina from the Product of Rapid Thermal Treatment of Gibbsite. Superlattices Microstruct. 2018, 120, 148–160. [Google Scholar] [CrossRef]
  34. Hart, A.; Leeke, G.; Greaves, M.; Wood, J. Downhole Heavy Crude Oil Upgrading UsingCAPRI: Effect of Steam upon Upgrading and Coke Formation. Energy Fuels 2014, 28, 1811–1819. [Google Scholar] [CrossRef]
Figure 1. XRD pattern of aluminum oxide C1.
Catalysts 12 01271 g001
Figure 2. XRD pattern of aluminum oxide C2.
Catalysts 12 01271 g002
Figure 3. XRD pattern of modeled γ-aluminum oxide.
Catalysts 12 01271 g003
Figure 4. (a) Nitrogen adsorption–desorption isotherms for aluminum oxides C1 and catalysts. (b) Nitrogen adsorption–desorption isotherms for aluminum oxides C2 and catalysts.
Catalysts 12 01271 g004
Figure 5. (a) Pore size distribution for aluminum oxides C1 and catalysts. (b) Pore size distribution for aluminum oxides C2 and catalysts.
Catalysts 12 01271 g005
Figure 6. (a) Temperature-programmable desorption profiles of aluminum oxides C1. (b) Temperature-programmable desorption profiles of aluminum oxides C2.
Catalysts 12 01271 g006
Figure 7. (a) Temperature-programmable catalyst reduction of Co-Mo/C1. (b) Temperature-programmable catalyst reduction of Co-Mo/C2.
Catalysts 12 01271 g007
Figure 8. Schemes of syntheses of granular aluminum oxides (a) based on the product of the thermochemical activation of gibbsite; (b) based on precipitation of sodium aluminate and nitric acid.
Catalysts 12 01271 g008
Table 1. Characteristics of aluminum oxides and catalysts.
SampleS, m2/gV, cm3/gD, nmPore Volume
2–5 nm5–11 nm˃11 nm
N%N%N%
C12940.748.30.13017.60.27036.50.34045.9
Co-Mo/C12240.528.00.11822.70.15830.50.24046.8
C22770.819.00.0243.00.55368.50.23028.5
Co-Mo/C22320.588.00.0529.00.41772.50.10618.5
Table 2. The number of acid centers of aluminum oxides and catalysts based on the results of temperature-programmed ammonia desorption.
Sample∑NWeak
Td < 250
Medium
250 ≤ Td < 350
Strong
350 ≤ Td < 450
Very Strong
Td ≥ 450
N%N%N%N%
C147523049149317917174
Co-Mo/C132415748101315316135
C23711865012233541592
Co-Mo/C2229115508035301342
N—number of acid centers, μmol/g, Td—ammonia desorption temperature, °C.
Table 3. Results of temperature-programmed catalyst reduction.
SampleAmount of Absorbed Hydrogen (μmol/g)/Temperature of Peak Maximum (°C)Ratio of Peak
Intensities
III/(I + II)
Total Absorbed
Hydrogen,
μmol/g
IIIIII
Co-Mo/C1345.3/512-1182.9/8973.41528.2
Co-Mo/C2342.2/511-1142.1/8753.31484.3
Table 4. SARA fractions.
SampleHydrocarbon Content, wt.%
SaturatedAromaticResinsAsphaltenes
Extra heavy oil + diesel fraction65.5914.757.9811.68
Co-Mo/C183.14 ± 0.6513.45 ± 0.232.09 ± 0.072.42 ± 0.09
Co-Mo/C280.09 ± 0.5315.31 ± 0.322.36 ± 0.092.24 ± 0.09
Table 5. Sulfur, vanadium and nickel content in feedstock and reaction products.
SampleElement Content, wt.%
SulfurVanadiumNickel
Extra heavy oil + diesel fraction2.180.0800.010
Co-Mo/C10.67 ± 0.050.015 ± 0.00150.006 ± 0.0007
Co-Mo/C20.43 ± 0.030.010 ± 0.00100.008 ± 0.0006
Table 6. Viscosity of the initial extra heavy oil and upgraded oil.
SampleViscosity, mPa∙s at 50 °C
The initial extra heavy oil28,200
The upgraded oil by Co-Mo/C1485 ± 7.3
The upgraded oil by Co-Mo/C2449 ± 5.1
Table 7. Material balance for upgrading processes.
SampleYield, wt.%
LiquidCokeGas
Co-Mo/C196.73 ± 0.280.54 ± 0.072.73 ± 0.12
Co-Mo/C297.72 ± 0.370.33 ± 0.051.95 ± 0.10
Table 8. Composition of catalysts.
SampleMolybdenum ConcentrationCobalt Concentration
Co-Mo/C116.44.2
Co-Mo/C216.54.1
Table 9. The composition and properties of the extra heavy oil.
SARA Fractions, wt.%
SaturatedAromaticResinsAsphaltenes
38.7220.3617.7523.12
Viscosity, mPa∙s
40 °C50 °C60 °C70 °C80 °C90 °C95 °C
244,80028,20013,30038001800800580
Publisher’s Note: MDPI stays neutral with regard to jurisdictional claims in published maps and institutional affiliations.

