Article

Glycerol Valorization over ZrO2-Supported Copper Nanoparticles Catalysts Prepared by Chemical Reduction Method

1
Catalysis Laboratory, Physical Chemistry Department, Faculty of Chemical Sciences, Universidad de Concepción, Concepción, Casilla 160-C, Chile
2
Laboratorio de Química Inorgánica y Organometálica, Departamento de Química Analítica e Inorgánica, Facultad de Ciencias Químicas, Universidad de Concepción, Concepción, Casilla 160-C, Chile
3
Department of Chemistry and Biochemistry, Faculty of Sciences, University of Porto, 4099-002 Porto, Portugal
*
Author to whom correspondence should be addressed.
Catalysts 2021, 11(9), 1040; https://doi.org/10.3390/catal11091040
Submission received: 1 August 2021 / Revised: 15 August 2021 / Accepted: 24 August 2021 / Published: 28 August 2021
(This article belongs to the Special Issue Metallic Nanoparticles and Metal-Mediated Synthesis in Catalysis)

Abstract

:
Copper nanoparticles (NPs) and ZrO2-supported copper NPs (Cu NPs/ZrO2) were synthesized via a chemical reduction method applying different pH (4, 7 and 9) and evaluated in a glycerol dehydration reaction. Copper NPs were characterized with transmission electron microscopy (TEM) and UV–vis spectroscopy. Transmission electron microcopy (TEM) results revealed a homogeneous distribution of copper NPs. A hypsochromic shift was identified with UV–vis spectroscopy as the pH of the synthesis increased from pH = 4 to pH = 9. Zirconia-supported copper NPs catalysts were characterized using N2 physisorption, X-ray diffraction (XRD), TEM, X-ray photoelectron spectroscopy (XPS), temperature-programmed reduction (TPR), temperature-programmed desorption of ammonia (NH3-TPD) and N2O chemisorption. The presence of ZrO2 in the chemical reduction method confirmed the dispersion of the copper nanoparticles. X-ray diffraction indicated only the presence of tetragonal zirconia patterns in the catalysts. XPS identified the Cu/Zr surface atomic ratio of the catalysts. TPR patterns showed two main peaks for the Cu NPS/ZrO2 pH = 9 catalyst; the first peak between 125 and 180 °C (region I) was ascribed to more dispersed copper species, and the second one between 180 and 250 °C (region II) was assigned to bulk CuO. The catalysts prepared at pH = 4 and pH = 7 only revealed reduction at lower temperatures (region I). Copper dispersion was determined by N2O chemisorption. With NH3-TPD it was found that Cu NPs/ZrO2 pH = 9 exhibited the highest total quantity of acidic sites and the highest apparent kinetic constant, with a value of 0.004 min−1. The different pH applied to the synthesis media of the copper nanoparticles determined the resultant copper dispersion on the ZrO2 support, providing active domains for glycerol conversion.

Graphical Abstract

1. Introduction

Biomass is a strategic alternative for energy generation due to its renewable nature [1,2,3,4] and is currently converted into different valuable products through thermochemical and biological methods [5], including H2 production via steam reforming of bio-oils [6,7,8], biomass gasification via the Fischer–Tropsch process [9], fermentation of carbohydrates [10], production of bio-methanol from synthesis gas [11], production of bio-oils from biomass pyrolysis [12] and production of biodiesel from the transesterification of triglycerides derived from biomass [13,14].
Glycerol generated from biodiesel is a platform molecule with the potential to carry out transformation towards other products with higher value-addition. Several studies have been carried out on glycerol dehydration reactions on different metals and supports [15,16,17,18,19]. Three main products are formed by glycerol dehydration: acetol, 3-hydroxypropanal and its subsequent dehydration to acrolein [20,21]. The dehydration routes to acetol and acrolein are competitive. Acetol can be formed via direct dehydration of glycerol and subsequent keto–enol tautomerization. The acrolein pathway proceeds through the dehydrogenation–hydrogenation pathway of 1,3 propanediol (1,3-PDO). Instead of hydrogenating the 3-hydroxypropanal, another hydroxyl group is eliminated, resulting in the stable π–system of acrolein [20,22]. The acetol pathway is promoted by acidic Lewis sites and the acrolein pathway is promoted by acidic Brönsted–Lowry sites.
Heterogeneous catalysts have been used for glycerol dehydration. Glycerol can be adsorbed onto different metal oxides with acidic supports such as ZrO2, TiO2, Al2O3, cerium, niobium, SiO2 and some types of aluminosilicates [23]. Acidity–basicity is the key parameter in catalyst activity and selectivity for glycerol dehydration [24]. Different metals have been reported as active phases in the dehydration of glycerol, including both noble and transition metals [25]. It has been reported that noble metals are highly active materials; however, they promote undesired cleavage of glycerol’s C–C bond. Transition metals are less active than the noble metals, but they present higher selectivity and considerably lower economic costs, which have motivated more extensive research [26,27,28]. Copper-based mixed oxides derived from hydrotalcite as catalyst were investigated in glycerol dehydration to acetol, revealing that the optimized catalyst attained glycerol conversion higher than 90% with 60% acetol selectivity [29]. Dehydration of glycerol to acetol was also studied over Cu–MgF2 catalysts, and an acetol yield of 45.5% was observed [30]. The effect of different supports for copper as catalyst for glycerol hydrogenolysis to 1,2 propanediol (1,2-PDO) was investigated in previous research and 78.5% glycerol conversion with a 79% 1,2-PDO yield was observed [31]. Copper, nickel and Cu–Ni catalysts supported on Al2O3 and ZSM-5 were tested in glycerol hydrogenolysis to 1,2-PDO, and all catalysts converted glycerol at rates higher than 90% [32]. Selective dehydration of glycerol on copper-based catalysts was investigated over copper supported on γ-Al2O3, ZrO2 and SiO2. Cu/ZrO2 exhibited the highest acetol yield at 20% of glycerol conversion [33]. The Lewis acid sites of ZrO2 are water tolerant [20]; therefore, it is a highly favorable support for glycerol transformation in a water medium. ZrO2 is a material with remarkable hydrothermal stability; it has acid-base properties and oxidation–reduction capacities. Tolerant Lewis acid sites in the catalytic system are necessary for systems in contact with the aqueous environment. It should also be mentioned that ZrO2 is a low-cost material.
Copper is known to selectively produce acetol from glycerol dehydration [34]. Efforts to improve the stability of copper nanoparticles (NPs) have encouraged the development of novel methods of catalyst preparation [35].
Chemical reduction is a widely used method for the synthesis of copper NPs due to its low cost and operational simplicity [36]. The reduction method involves the precipitation of copper NPs from copper precursors via reducing agents such as sodium borohydride, ascorbic acid, hydrazine, phosphines and cetyltrimethylammonium bromide [37,38]. The chemical reduction method allows for control of the size and morphology of the particles in a colloidal solution. Different methods are used to control the morphology and size of the NPs, such as modifying the pH of the reaction medium [39] and the use of chemical templates such as surfactants [40]. Furthermore, the solvent in which NPs are synthesized also has a role in dispersing and stabilizing the NPs.
The stabilizing surfactants introduce electrostatic interactions, van der Waals interactions or polar bonds [41]. In addition, they prevent particle agglomeration. Polymers such as PEG (polyethylene glycol) and PVP (polyvinylpyrrolidone) are commonly used to control the metal particle size. Together with these polymers, alcohols such as ethylene glycol, glycerol and ethanol are also commonly used as solvents to disperse the metal NPs formed during synthesis [42].
The chemistry of a colloidal solution is strongly affected by the pH, ionic strength and presence of organic molecules [43]. In particular, the pH of the colloidal solution is a parameter of great importance within the chemical reduction method. Metal oxide NPs have superficial hydroxyl groups, which could be protonated or deprotonated depending on the pH of the solution, generating positive or negative partial charges, respectively. The pH for which the partial surface charge is zero (neutral surface charge) is called the zero charge point (pHpzc). When the pH of the colloidal solution is lower than pHpzc, the hydroxyl groups of the metal oxide NPs are protonated, and conversely, when the pH is higher than pHpzc, the hydroxyl groups will be deprotonated. Thus, in this case, the partial charge on the metal oxide NP’s surface within the colloidal solution is negatively charged [43]. This effect is more pronounced as the pH of the colloidal solution deviates further from the pHpzc.
The presence of a solid surface of a metal oxide in the colloidal synthesis medium may induce nucleation of the metal NPs in the colloidal solution onto the solid surface. The distribution of metal NPs in a colloidal solution onto the solid surface usually relies, on the one hand, on the electrostatic interaction, van der Waals interactions, or polar bonds of the surfactant agents, and on the other hand, on the surface groups of the solid surface. The main phenomenon that occurs is electrostatic adsorption caused by the potential difference between the solid surface and the metal NPs in the colloidal solution [43,44,45].
It must be added that the solid surface of an oxide has terminal hydroxyl groups. Thus, below the pHpzc, the hydroxyl groups of the solid surface are also protonated, and the surface is positively charged, adsorbing anionic species [43,44,45]. By contrast, above the pHpzc, the hydroxyl groups of the solid surface are deprotonated, and the surface of the oxide remains negatively charged, interacting with cationic species [44]. The electrostatic repulsion between the metal NPs of the colloidal solution and the solid surface of a metal oxide can modulate the agglomeration and/or stability of the resultant metal NPs distributed on the solid surface. This is vital for the achievement of active and stable supported heterogeneous catalysts [45].
Here, Cu/ZrO2 catalysts were prepared by chemical reduction of copper NPs in the presence of ZrO2 as solid metal oxide. Syntheses were performed under different pH (4, 7 and 9) to tentatively modulate the size of the Cu NPs. ZrO2 supported copper NPs were evaluated in the dehydration of glycerol to acetol. In this respect, it was expected that the primary hydroxyl groups of the glycerol molecules would undergo activation by the Cu species. Crude glycerol is obtained as a by-product of biodiesel production and represents 10 wt.% of the produced biodiesel. Crude glycerol contains impurities such as water. Therefore, it is relevant to investigate the catalytic conversion of an aqueous solution of glycerol as a strategy to develop active copper catalysts [20].

2. Results

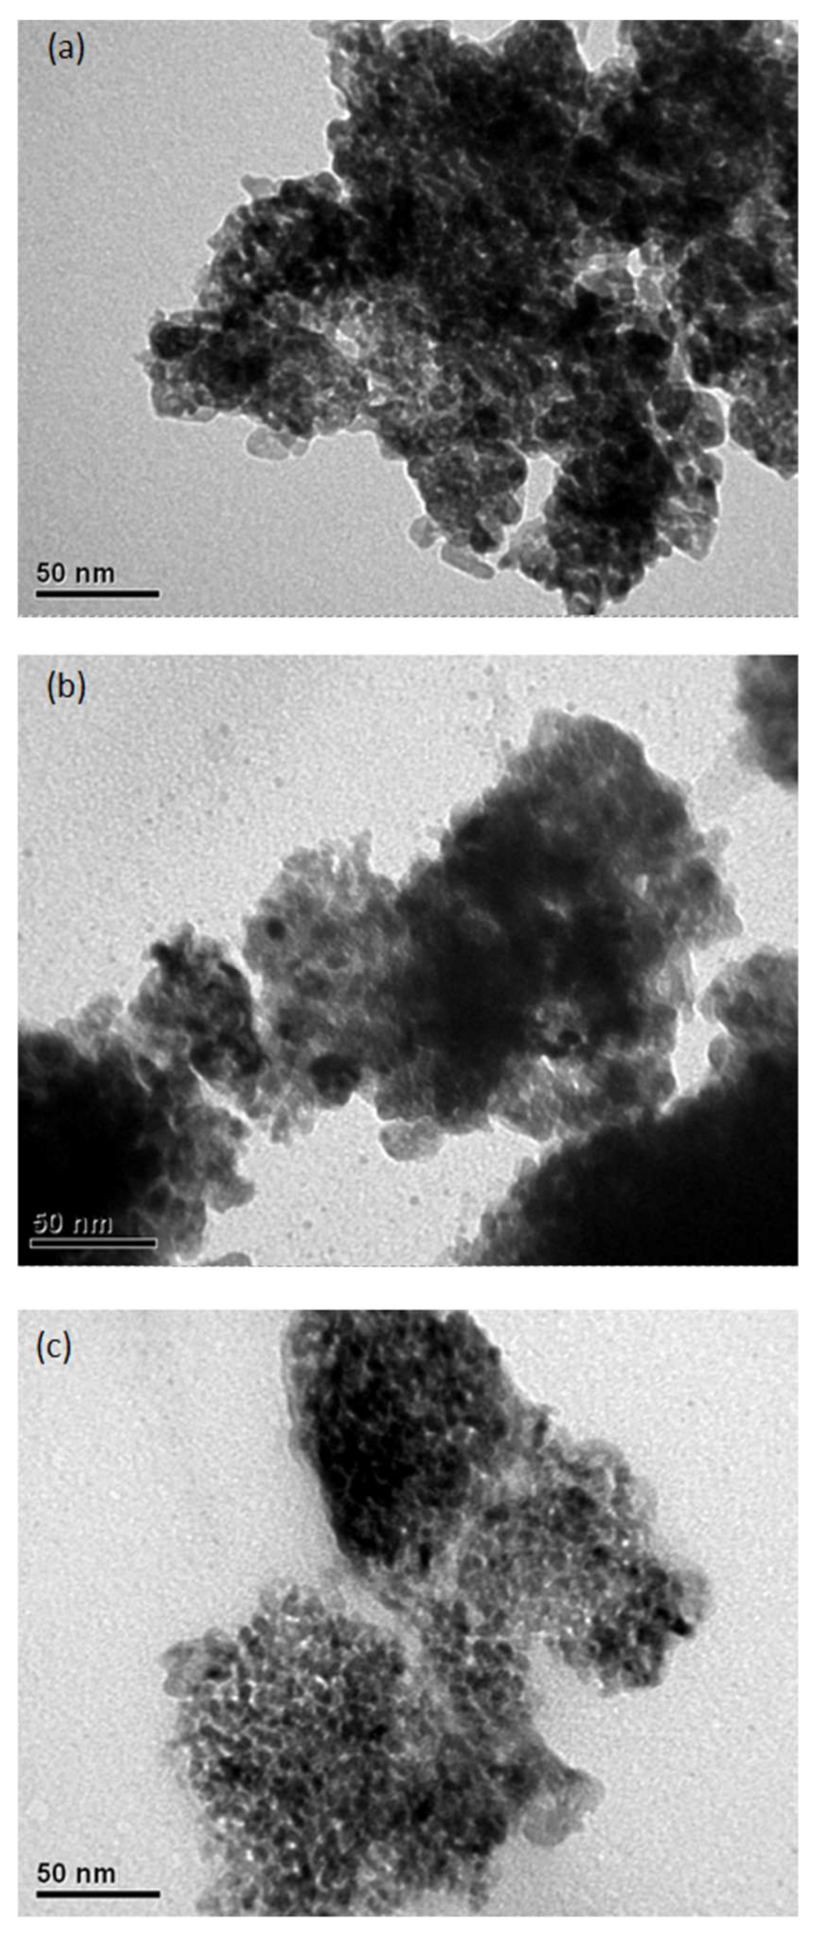
2.1. Copper NPs Characterization

Figure 1a,c,e displays TEM images of the pure copper NPs obtained through the chemical reduction method regulated at different pH (4, 7 and 9) in the synthesis medium. The dark spots correspond to the copper NPs and the lighter background corresponds to the carbon matrix of the sample holder. The copper nanoparticles were homogeneously dispersed in all experimental conditions. By contrast, TEM images of the catalysts (Figure 2) revealed that the copper nanoparticles were highly dispersed over the ZrO2 support.
To perform the particle count, ImageJ software was used. Based on simple inspection, the particles obtained were spherical in shape and despite being stored for a long time did not present agglomeration over time. Figure 1b,d,f shows histograms of the copper nanoparticles’ distribution in each of the resultant samples produced via chemical reduction. It is noticeable that all samples had a narrow size distribution of copper NPs with average copper particle size in the range between 6 and 8 nm.

2.2. UV–Visible Spectroscopy of Cu-NPs

The obtained dark red powder of Cu NPs (pH = 4, 7 and 9) was unstable; when these nanoparticles were exposed to air, the color of the solutions changed to dark green/blue, suggesting that copper(I) oxide, Cu2O, was formed in each case (Supplementary Materials Figure S1). This change in solution color could be proved by the obtained UV–vis spectra of each nanomaterial (pH = 4, 7 and 9). The samples were prepared following the protocol details described in Section 4.3.1. Combination deconvoluted absorption bands are shown in the Supplementary Materials Figure S1 and summarized in Supplementary Materials Table S3. The obtained absorption bands were in the 218–328 nm range and could be attributed to the characteristic band-gap of resulting Cu2O nanoparticles stabilized by glycerol molecules in the corresponding colloidal solutions [46]. The analysis of the UV–vis spectra did not exhibit relevant absorption bands in the range of 560–600 nm (Supplementary Materials Figure S1c), which are generally ascribed to air-stable Cu nanoparticles [11]. Supplementary Materials Figure S1c indicates that the most active material was catalyst Cu NPs pH = 9, with an absorption maxima band at the deconvoluted wavelength of 264 nm. In this regard, the most important contribution of the material to the catalysis reaction could be attributed to the Cu2O presence on the surface. Considering these results, we propose the direct synthesis of supporting Cu nanoparticles on ZrO2 for catalytic applications.

2.3. Copper Catalyst Characterization

Supplementary Materials Figure S2a shows the N2 adsorption–desorption isotherms of each of the catalysts prepared under different pH conditions. The adsorption isotherms of N2 exhibited the characteristics of mesoporous materials of type IV with a distinct hysteresis loop observed in the range of 0.45–0.8 [47]. Supplementary Materials Figure S2b shows the pore size distributions of each catalyst and the support. The Barrett–Joyner–Halenda (BJH) method was used to calculate the pore-size distribution of the desorption counterpart. A major peak at about 4 nm was observed in the mesoporous range. An H2-type hysteresis loop was observed for either the ZrO2 support or the copper catalysts.
Table 1 presents a summary of the physisorption results. It is noticed that the specific surface area (SBET) and pore volume (Vp) of the ZrO2 support decreased when copper was added to the support during the chemical reduction method (see Section 4, Materials and Methods). The specific surface area of the ZrO2 support was found to be 146 m2/g. The deposited copper species could block the pores and voids of the support. Cu NP catalysts exhibited specific surface area values in the range of 136 m2/g to 129 m2/g. This decrease could be caused by consumption of the surface hydroxyl groups of the support through a superficial reaction with the oxidized species, and the agglomeration process of the copper species inside ZrO2 pores during preparation of the catalysts [48]. The total pore volume also followed a decreasing trend which may be due to pore blocking of the support by crystallites of copper species. Previous work reported the adsorption of Cu onto ZrO2 surface hydroxyl sites upon deposition. Such deposition predominates at lower copper weight loadings and facilitates higher levels of dispersion [49]. Apart from this, it is reported that oxygen vacancies stabilize Cu+, which is often invoked as a key specie for activity in catalytic reactions [50]. Evidence that copper interacted with the pore walls of the ZrO2 support is the decrease in the pore volume of the zirconia support when the copper nanoparticles were introduced via the chemical reduction method (Table 1).
Supplementary Materials Figure S3 shows the X-ray diffraction profiles of each material. Supplementary Materials Figure S3 indicates that the crystallite phase observed corresponds to the tetragonal phase of ZrO2. All materials exhibited diffraction peaks at 2θ = 30.3°, 35.2°, 50.6° and 60.2°, which are ascribed to tetragonal ZrO2 in agreement with the JCPDS standard (170923). Furthermore, there was no indication of the presence of monoclinic ZrO2, nor metallic copper species or copper(II) oxide species. The diffraction peaks of the metallic copper species according to the JCPDS standard (04–0836) should be visible at 2θ = 43°, 50° and 60°.
It has been argued that to observe crystalline CuO distinguishable from ZrO2 patterns, a copper load higher than 3 wt.% must be used. The presence of copper species on ZrO2 patterns becomes particularly visible at percentages higher than 10 wt.% [26,48]. CuO bulk formation occurs for a Cu/SSA ratio (copper charge/specific support area ratio) equal to or higher than 4.5 Cu atoms/nm2 of support. Considering that the ZrO2 support used in the present work had a specific area of 146 m2/g, the appearance of CuO bulk would occur for copper loading equal to or higher than at about 7 wt.%. No structural change in ZrO2 XRD patterns (Supplementary Materials Figure S4) was observed, which can be ascribed the presence of either amorphous or highly dispersed copper particles [51]. Previous work has also reported that highly crystalline CuO is detected from around 4 wt.% of Cu for 100 m2/g of γ–Al2O3 [52].
Figure 3 shows the temperature-programmed reduction (TPR) profiles of each catalyst. As summarized in Table 2, all samples presented reduction profiles between 125 and 180 °C. For the catalysts synthesized at pH = 4 and 7, a reduction peak was observed at low temperature region I (125–180 °C). The catalyst prepared at pH = 9 showed reduction peaks at region I and region II, with reduction peak at a higher temperature (180–250 °C).
Reduction peaks at lower temperatures have been ascribed to highly dispersed CuO species. Higher temperature peaks correspond to less dispersed species (CuO bulk) which may interact weakly with the support [48]. Shimokawabe et al. [53] reported that the lowest temperature peak corresponded to highly dispersed CuO and/or copper(II) ions in an octahedral environment of ZrO2 support. It has also been reported elsewhere that highly dispersed copper(II) oxide on a SiO2 support was reduced more easily than bulk CuO [48,53].
It is important to highlight the existence of these two main reduction temperature regions: (i) a low temperature region I (125–180 °C) and (ii) a high temperature region II (180–250 °C). It is commonly accepted that the reduction temperature of supported copper oxide species is related to a distinct interaction with the ZrO2 surface and to different sizes of copper NPs [48,53]. The higher heterogeneity in the size of the copper particles in the Cu NPs/ZrO2 pH = 9 sample must be taken in account. Particularly noticeable in the Cu NPs/ZrO2 pH = 9 sample was the presence of peaks in regions I and II, which suggests a more heterogeneous size distribution of copper particles compared to the Cu NPs/ZrO2 pH = 7 and Cu NPs/ZrO2 pH = 4 samples.
It is also reported that the first peak observed at region I was due to the one-step reduction of copper(II) oxide species that weakly interacted with the support (CuO → Cu0) and, in addition, to the partial reduction of dispersed copper species that strongly interacted with the support (CuO → Cu2O). Cu2O can be more difficult to reduce than the CuO bulk. In this respect, it is reported that the reduction observed at region II in the TPR profile of Cu NPs/ZrO2 pH = 9 sample was caused by a subsequent reduction of Cu2O (Cu+) to Cu0 [54]. A higher reduction temperature of Cu2O compared to CuO is consistent with the higher apparent activation energy, 27.4 kcal mol−1 compared to 14.5 kcal mol−1, respectively [55].
The difference in Tmax from the first reduction peak does not necessarily indicate a difference in the dispersion of CuO species, as reported by Chary et al. [48] in their catalytic study examining copper content up to percentages of 2.7 wt.%. For the Cu NPs/ZrO2 pH = 9 catalyst it should be mentioned that the copper species generated in the synthesis must have mainly existed as Cu(OH)2, due to hydrolysis promoted by the pH of the synthesis during the chemical reduction method, which could react with the hydroxyl surface groups of the zirconia support, generating Cu species that strongly interacted with the support [56].
Copper dispersion in the catalysts was investigated by combining N2O chemisorption and TPR experiments in a two-step protocol. Prior to adsorptive decomposition of N2O, the Cu NP catalysts were reduced in a flow of hydrogen at 200 °C for 2 h. Supplementary Materials Figure S4 shows the TPR profiles after the N2O adsorptive decomposition on each catalyst. Judging by the reduction profiles of the catalysts in the TPR analysis (Supplementary Materials Figure S4), the presence of more homogeneous distributions and more dispersed copper species is noted for the Cu NPs/ZrO2 pH = 4 and Cu NPs/ZrO2 pH = 7 catalysts. On the other hand, the Cu NPs/ZrO2 pH = 9 catalyst may have presented a population of less dispersed copper species, implied by the CuO bulk in reduction region II. Higher amounts of N2O adsorbed in Cu NPs/ZrO2 pH = 4 and Cu NPs/ZrO2 pH = 7 reinforce the results observed by TPR (Figure 3).
Table 2 summarizes the dispersion results and copper particle diameter ( d ¯ p ) determined by N2O adsorption. Copper dispersion (D (%)) was expressed in terms of the exposed copper at the surface divided by the total quantity of copper. In this respect Cu NPs/ZrO2 pH = 4 and Cu NPs/ZrO2 pH = 7 exhibited the highest copper dispersions with values of about 54%, whereas Cu NPs/ZrO2 pH = 9 exhibited the lowest dispersion with a value of 42.3%. Copper particle size determined by N2O decomposition varied from 1.8 to 2.3 nm.
XPS measurement was performed to evaluate the surface composition and possible Cu and Zr chemical states in the as-prepared catalysts. The surface atomic percentages and Cu/Zr ratio are presented in Table 3. The percentage of Cu was around 2%, although there was a slight decrease from pH = 4 to pH = 9 in accordance with the Cu/Zr atomic ratio, which also decreases with pH. The Cu 2p/Zr 3d atomic ratio observed for the Cu NPs/ZrO2 pH = 9 sample was the lowest, which can be tentatively associated with lower dispersion, as suggested by N2O analysis (Table 3). XPS intensity ratio of Cu 2p/Zr 3d reflects the copper dispersion on the ZrO2 support [48].
The XPS survey spectra prove the presence of Cu, Zr and O (Supplementary Materials Figure S5, Supplementary Materials), and the high-resolution spectra of Cu 2p and Zr 3d ions in all of the prepared materials are recorded in Figure 4. In the Cu 2p spectra a broad peak was observed at approximately 933.0 eV (Cu 2p3/2) which is indicative of the presence of two different species attributed to Cu(0) and Cu(I). In addition, a peak of approximately 935.0 eV was observed, indicating the presence of Cu(II) along with weak shake-up satellites at 941.5 and 962.5 eV. The satellite at 941.5 eV is characteristic of the presence of Cu(II) hydroxide [57]. From the XPS analysis of Cu 2p spectra it was not possible to unambiguously distinguish Cu(0) from Cu(I) [58]. The Cu LMM can be used to distinguish these species. The peaks at 568, 569 and 570 eV can be attributed to Cu(0), Cu(II) and Cu(I) species, respectively, [59] as was observed in the magnification of survey spectra for all catalysts (Supplementary Materials Figure S6).
Analysis of the modified Auger parameter has been already performed by other authors to evaluate the oxidation state of Cu [60]. Table 4 presents the calculated Auger parameters for the three Cu NPs catalysts. It is noteworthy to mention that the 1849.13 eV value obtained for the spectra of Cu NPs/ZrO2 pH = 7 is very similar to the expected value of 1849.17 eV attributed to Cu2O [61]. Despite this evidence it is not possible to discount the presence of Cu(0) complementing the presence of the other two components Cu(II) and Cu(I) in all of the as-prepared catalysts, demonstrating an incomplete reduction of the catalyst and a potential oxidation of Cu2O surfaces due to atmosphere exposure.
The Zr 3d spectra are shown in Figure 4b. All spectra are well described with one doublet with the Zr3d5/2 binding energy at approximately 182.5 eV. Based on the biding energy values of Zr 3d5/2 and Zr 3d3/2 it is suggested that the zirconium oxide was present in a single type of oxide with an oxidation state of +4 [57]. The difference between the Zr 3d3/2 and Zr 3d5/2 binding energies was 2.43 eV and the ratio of the integral intensities of its components was 3:2.
The total quantity of acid sites was determined using NH3-TPD. NH3-TPD profiles (Figure S7) exhibit a maximum temperature at approximately 400 °C for the Cu NPs/ZrO2 pH = 7 and Cu NPs/ZrO2 pH = 9 samples. The NH3-TPD profile of the Cu NPs/ZrO2 pH = 4 catalyst exhibits a peak at 300 °C together with a tail suggesting a wide distribution of strength of acidic sites. The Cu NPs/ZrO2 pH = 9 catalyst presented the highest total amount of acid sites, as shown in Table 2.
The strength of the solid acid sites can be distinguished by the different ranges of temperatures for NH3 desorption: weak (120–300 °C), moderate (300–450 °C) and strong (above 450 °C) [20,62,63]. The total acidities determined for the Cu nanoparticle catalysts correlate well with typical catalysts for glycerol dehydration such as H-ZSM-5 and aluminosilicate supported heteropoly acids, with total acidity values of 0.2–0.9 mmol g−1 [64] and 0.2–0.4 mmol g−1 [65], respectively.

2.4. Catalyst Activity

Figure 5 shows the glycerol conversion glycerol progress over time for the copper nanoparticle catalysts. It is important to emphasize that pure ZrO2 did not yield noticeable glycerol conversion in the absence of Cu NPs under the same experimental conditions. In this respect, copper NPs provided active sites for the selective glycerol dehydration to acetol, which agrees with previous work [20].
ZrO2 support may induce interaction with copper NPs. The highest glycerol conversion was observed for the Cu NPs/ZrO2 pH = 9 catalyst, reaching 40% at about 2 h. The Cu NPs/ZrO2 pH = 4 and Cu NPs/ZrO2 pH = 7 samples were less active under our experimental conditions, exhibiting a glycerol conversion of at about 15% at 150 min.
The reaction was identified as first order relative to glycerol. For further insights into the intrinsic catalytic activity, the apparent kinetic constant (k) was calculated by fitting the conversion data up to 120 min of reaction for first order and the corresponding values are presented in Table 5.
The apparent kinetic constant values (k) reported in Table 5 suggest that the catalytic transformation of glycerol had a structurally sensitive character. Cu NPs/ZrO2 pH = 9 exhibited a kinetic constant value about three times higher than the values observed for the Cu NPs/ZrO2 pH = 7 and Cu NPs/ZrO2 pH = 4 samples. The results show that the chemical reduction method induced significant catalytic properties at different pH values in the synthesis medium.

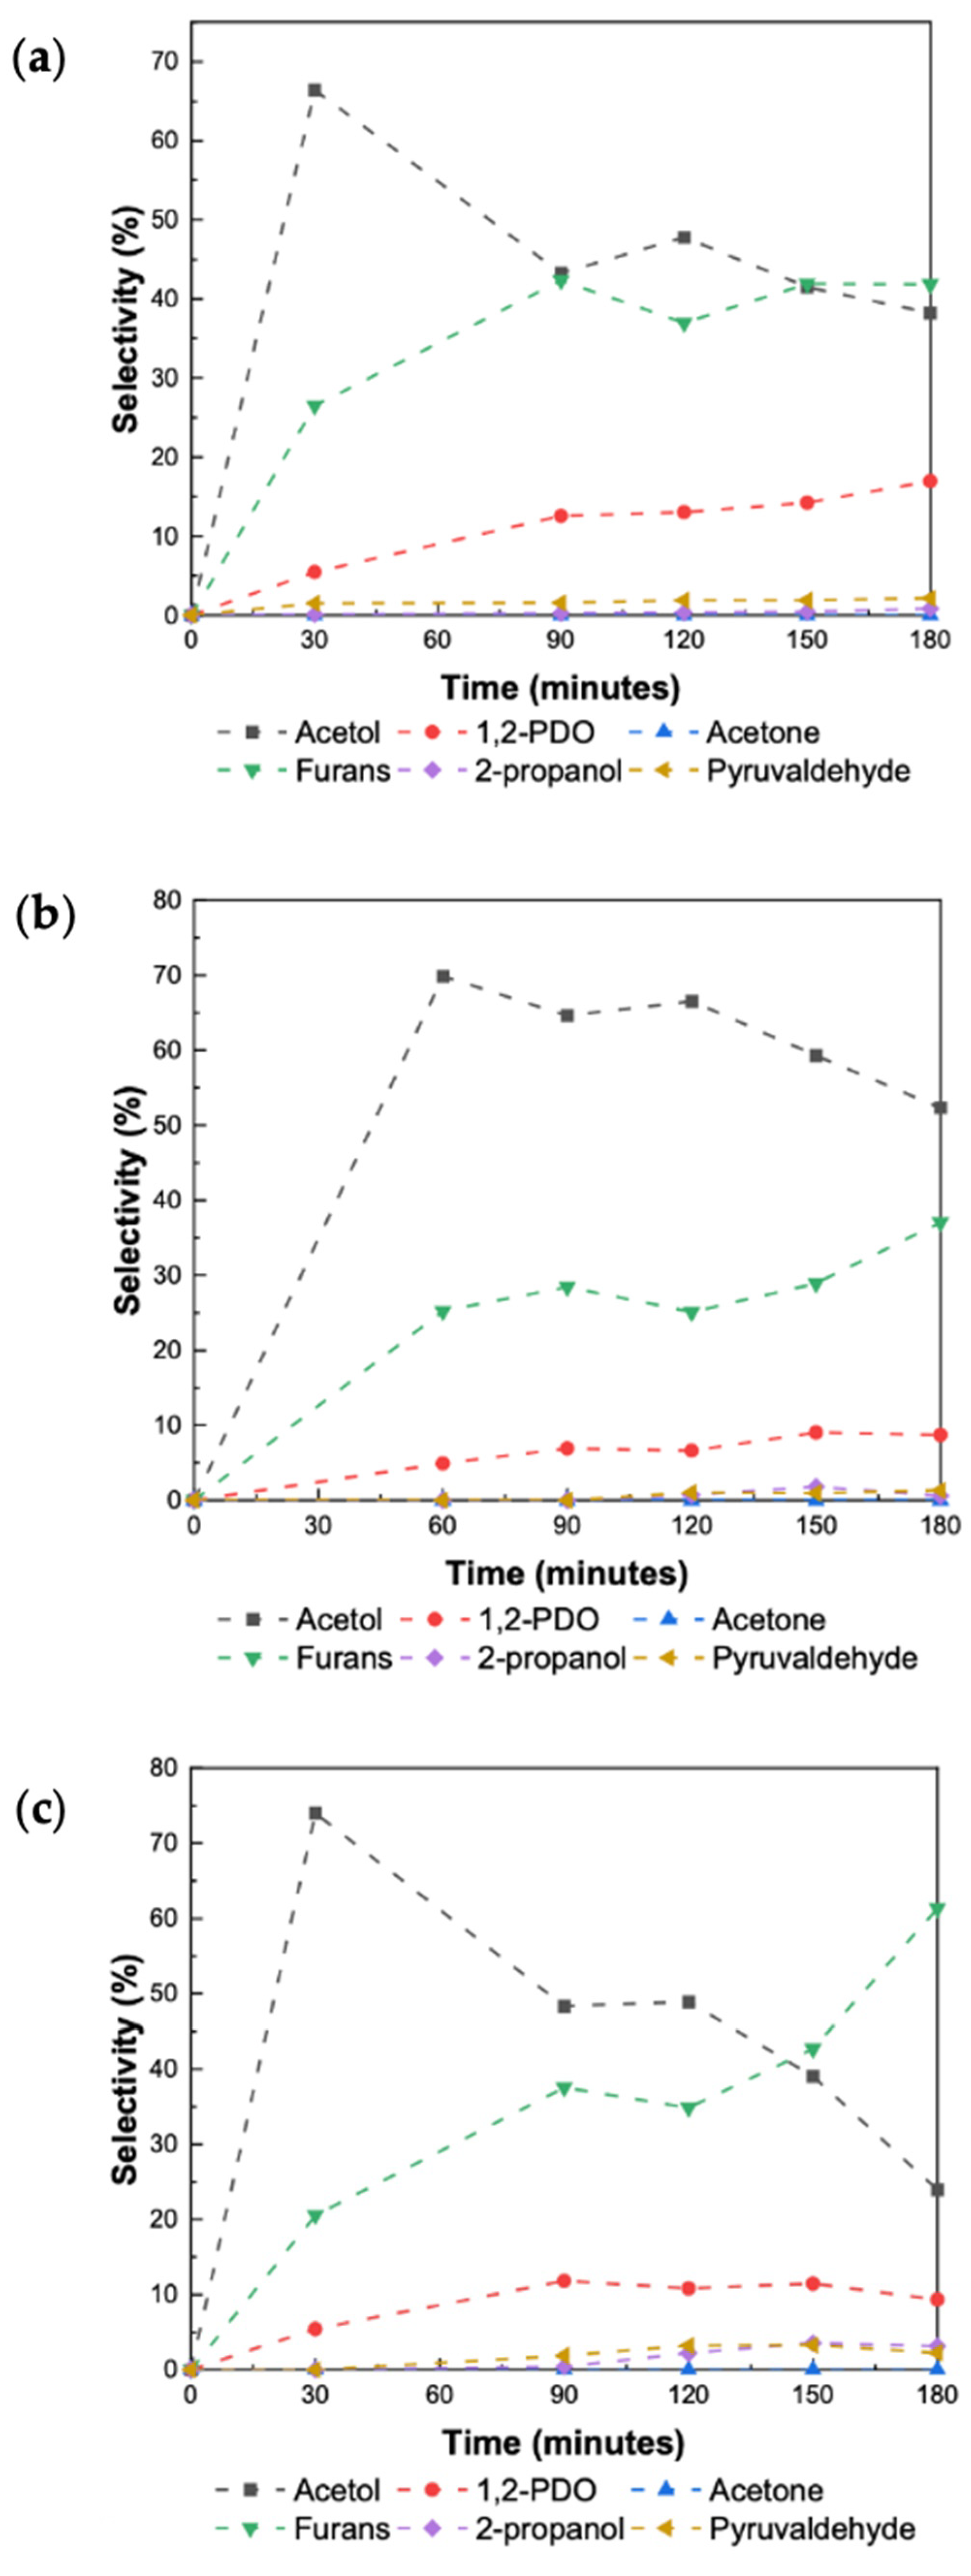
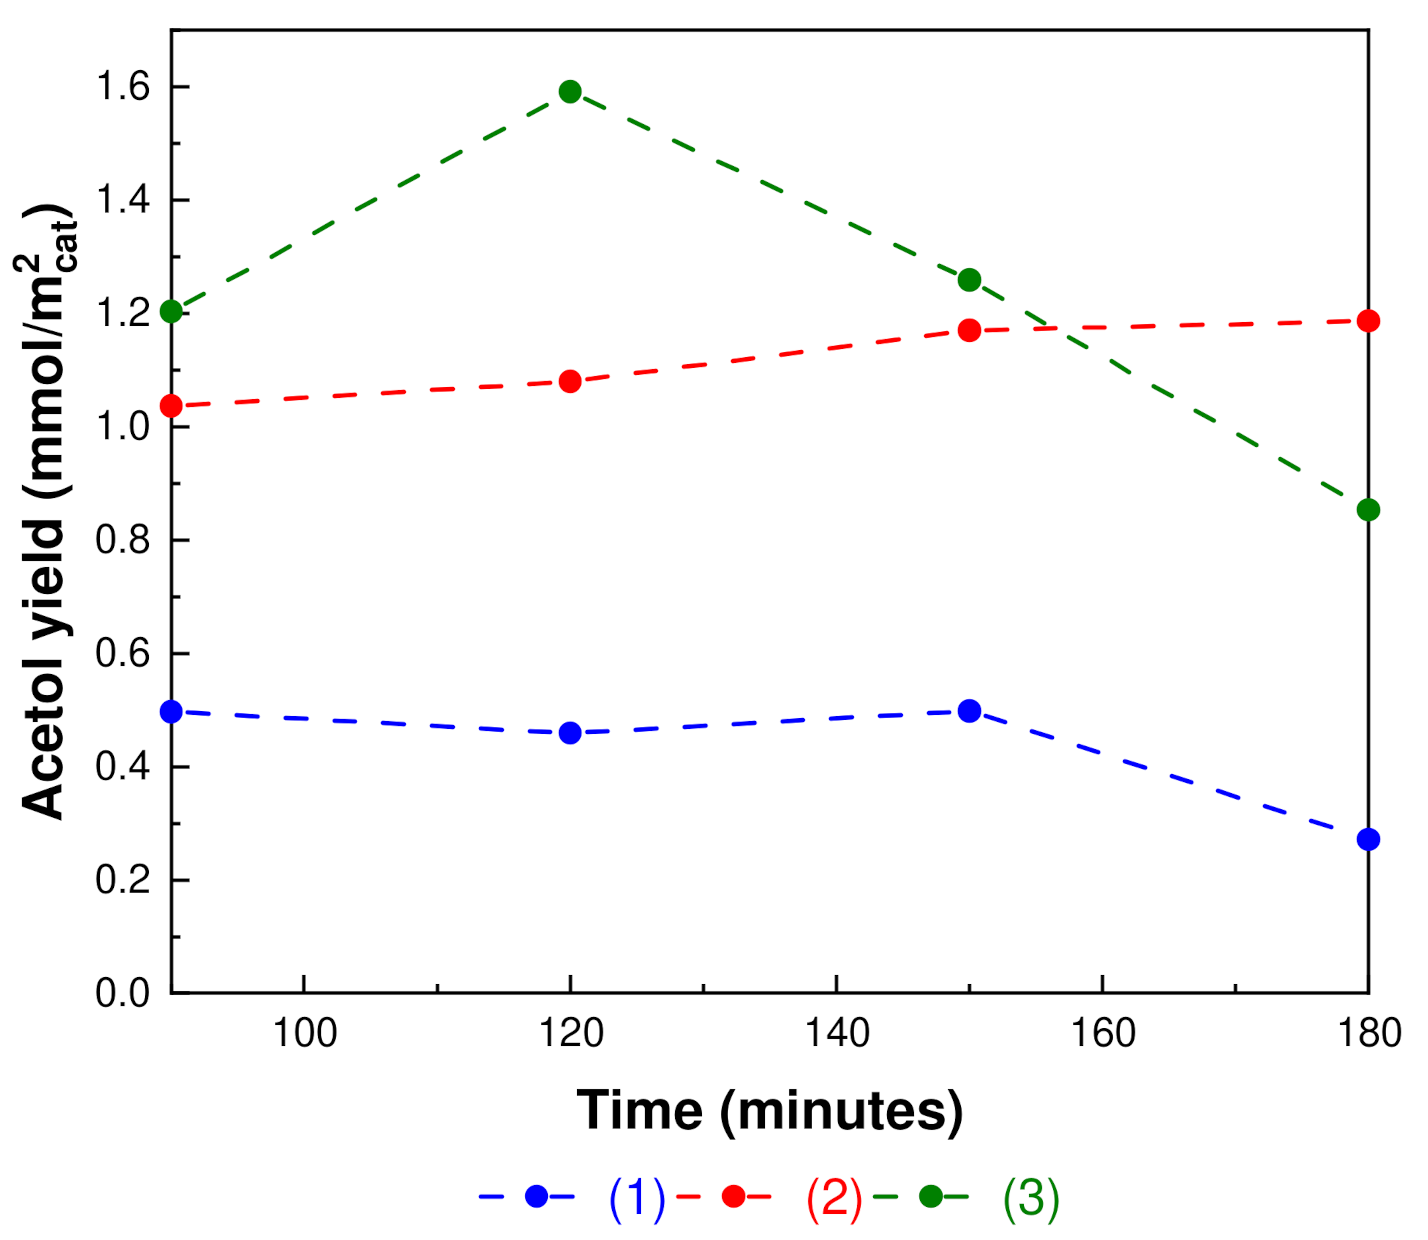
2.5. Selectivity and Yield to Acetol

Different reaction routes have been suggested for the formation of acetol from glycerol. One route involves the direct dehydration of acetol [66] and in another proposed route, glycerol dehydrogenates to form glyceraldehyde or dihydroxyacetone, in order to undergo further hydrogenation to form acetol [67]. Under our experimental conditions we did not observe glyceraldehyde or dihydroxyacetone, which may be due to their high reactivity and instability relative to acetol. The formation of acetol and the absence of 3-hydroxypropanal mirrors the chemo-selectivity of copper in the preferential dehydration of glycerol.
The relationship between acetol selectivity and 1,2-PDO, as shown in Supplementary Materials Figure S8, may provide elements to understand the acetol yield during the reaction. It is observed for all catalysts that selectivity towards acetol decreased as the reaction time increased, which was probably caused by the formation of 1,2-PDO and other acetol by-products.
Figure 6 indicates that acetol was consumed to form other products, and the 1,2-PDO was not the only by-product produced from acetol. The formation of furans was also visible as the reaction time increased, especially with the Cu NPs/ZrO2 pH = 9 catalyst. It is important to mention that the present study of selective glycerol dehydration was carried out in an inert atmosphere. Under our reaction conditions the formation of 1,2-propanediol was identified, which is a value-added product. It must be emphasized that the aqueous phase of dehydration of glycerol was evaluated without external hydrogen addition.
Most of the related investigations of glycerol conversion to 1,2-propanediol (1,2-PDO) have been performed under a highly pressurized hydrogen atmosphere, employing H2 from an external supply. In this respect, the need for an external hydrogen source and the requirement of high hydrogen pressure is the main disadvantage of past studies. To overcome this inherent drawback, one promising alternative is to produce the required hydrogen in situ directly in the reaction mixture under the process conditions. Here, we reported the formation of 1,2-propanediol from glycerol under an inert atmosphere and autogenous pressure. This is a promising alternative approach to produce value-added compounds from glycerol without the use of hydrogen. It has been reported that the hydrogen is generated in situ through the dehydrogenation paths of glycerol conversion [68]. These hydrogen species may hydrogenate the formed acetol, producing 1,2-PDO.
Thus, the synthesis of 1,2-PDO from glycerol-derived acetol presents a greener production method [33]. Alternatively, the 1,2-PDO formed could also be produced from the hydrogenation of acetol by 2-propanol which could act as a hydrogen molecule donor. Acetone and 2-propanol were detected in smaller amounts. Acetone can be formed by dehydration of 1,2-PDO and 2-propanol through hydrogenation of acetol. Pyruvaldehyde, which was also observed, can be formed through the dehydrogenation of acetol.
It is important to add that 1,2-PDO may suffer a second dehydration to form acetone, which in turn could undergo a second hydrogenation step to form 2-propanol. This may also explain the small quantities of 2-propanol and acetone observed. Along with these products, there was also the generation of a furan family. Figure 7 shows the yield of acetol observed for each catalyst, expressed in terms of the of specific surface area of the corresponding catalyst. It is observed that after 90 min of reaction the yield of acetol was highest for the Cu NPs/ZrO2 pH = 9 catalyst, followed by Cu NPs/ZrO2 pH = 7 and finally by Cu NPs/ZrO2 pH = 4. After 2 h of reaction the acetol yields decreased.
Finally, a decrease in glycerol conversion during reusability has been reported in the literature. Montassier et al. ascribed this decrease to copper sintering of Cu/C treated in the presence of water in the reaction medium [69]. Adsorbed carbonaceous species deposits generated during the reaction, such as oligomerization on acid surface sites, are another source of deactivation [70]. Apart from these issues, the oxidative environment due to the aqueous medium must be considered as another source of deactivation. It is important to remark that the presence of metallic copper species in the catalyst surface is essential to glycerol conversion. As a result, in the present study where the reaction started with the catalyst calcined instead of reduced, no activity was noticed. In addition, a recovered catalyst (Cu NPs/ZrO2 pH = 7) after the reaction, when characterized with SEM-EDS (Supplementary Materials Figure S10), revealed an approximately 0.6% decrease in copper loading compared to its pre-reaction state (Supplementary Materials Figure S9b).

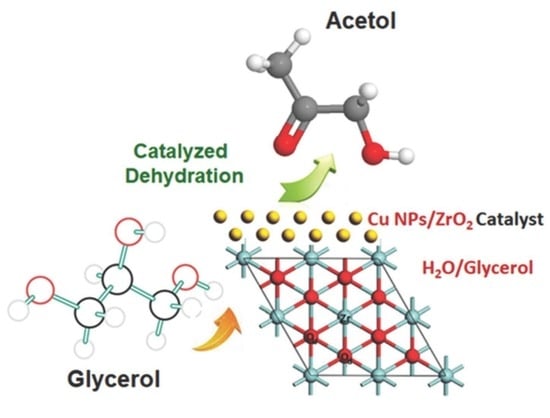
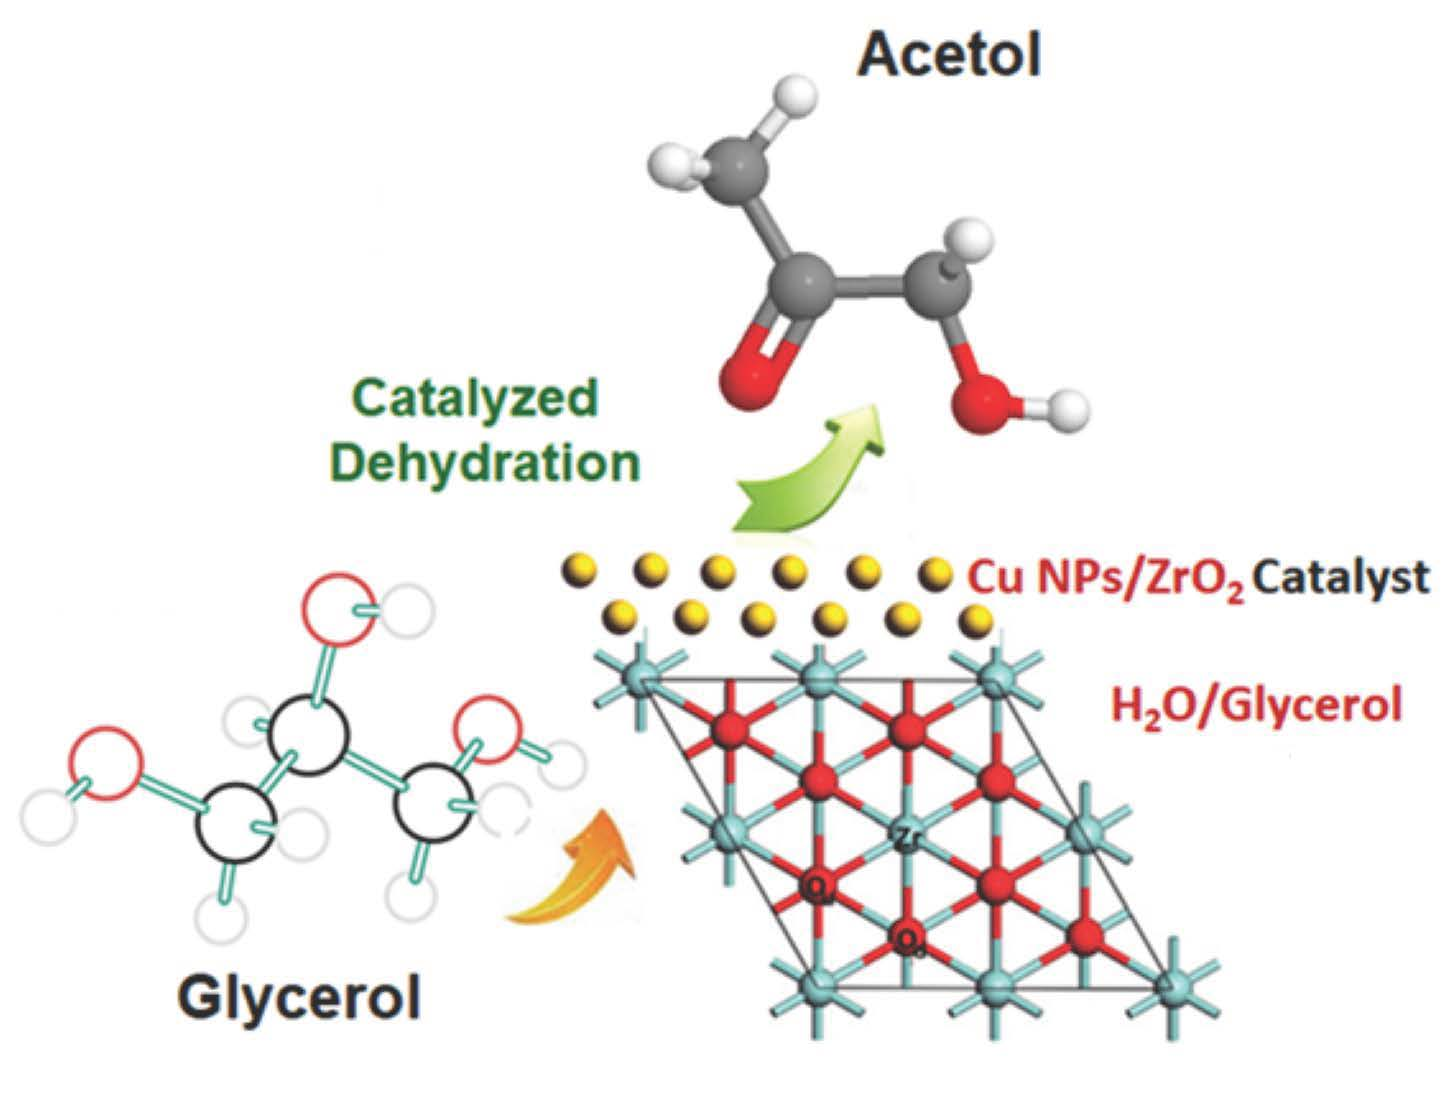
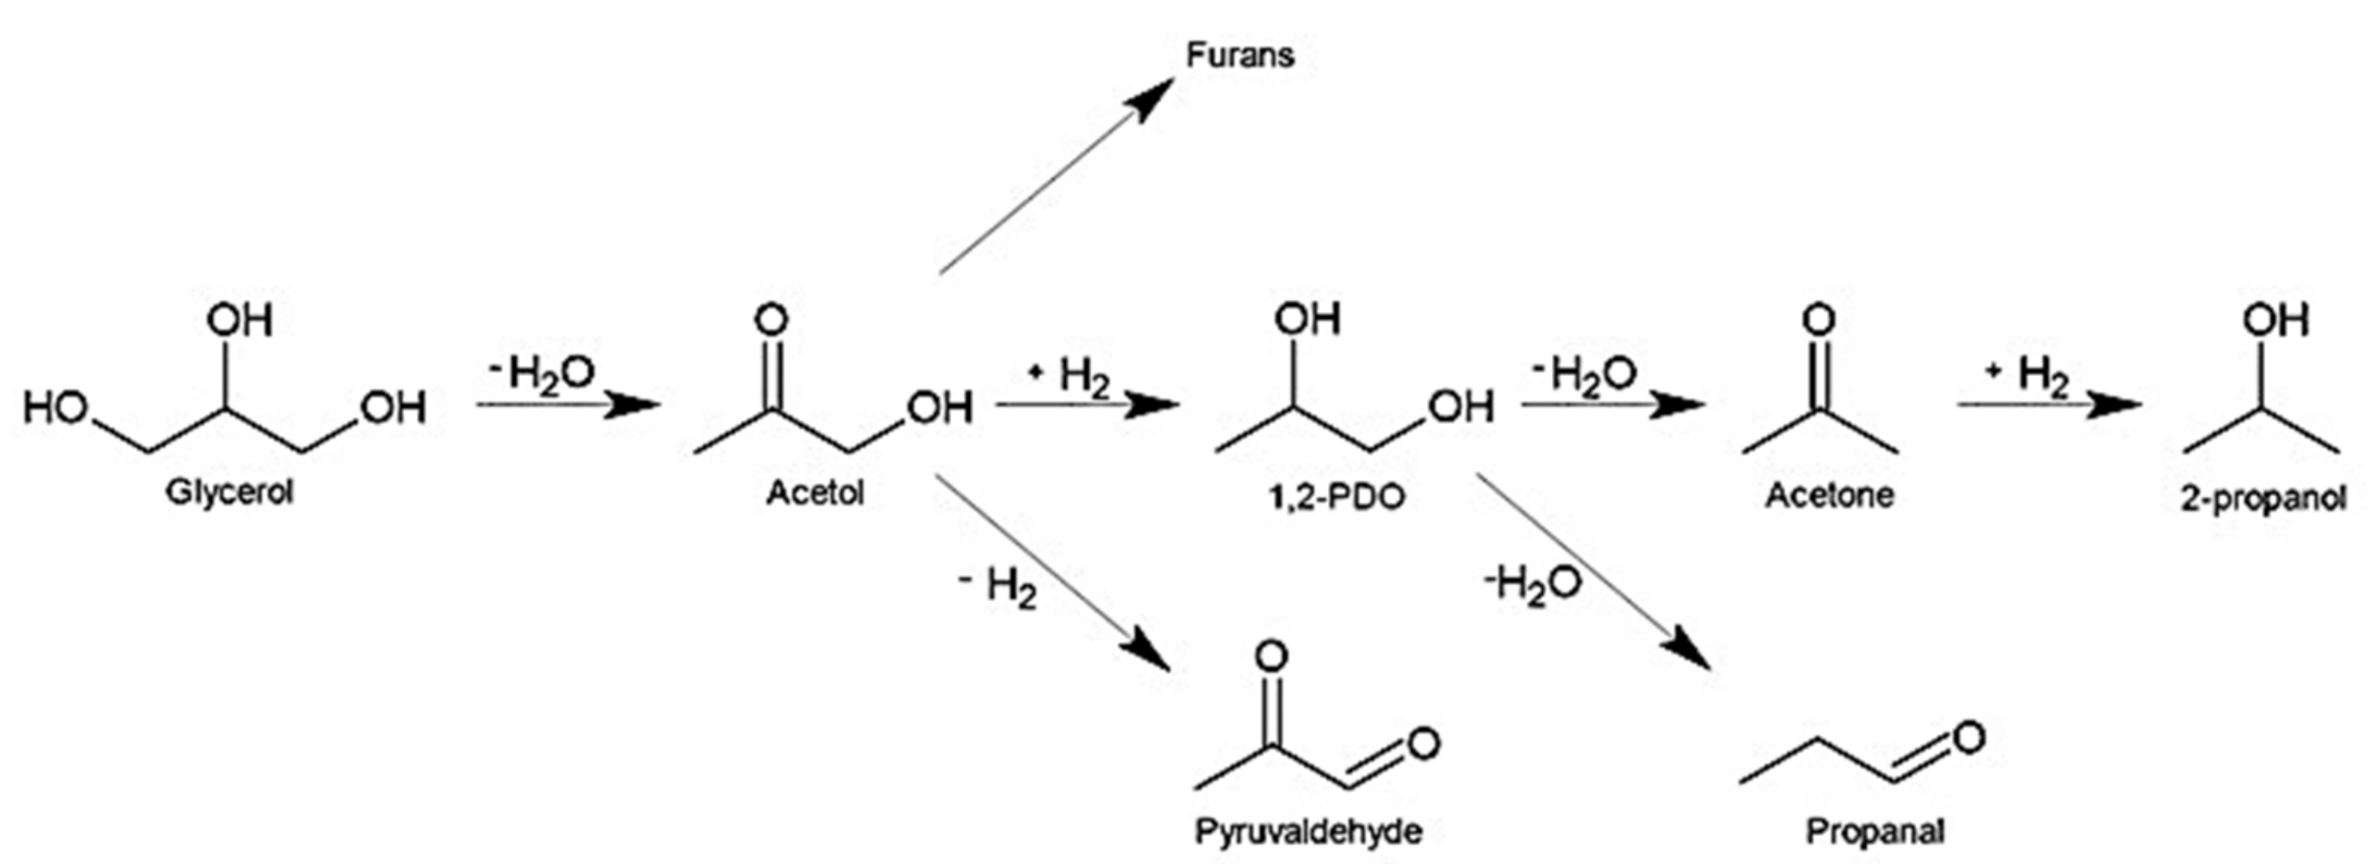
2.6. General Chemical Route

In light of the results stated above, the following general mechanism is proposed (Figure 8):
The formation of furans was observed in a greater proportion in the Cu NPs/ZrO2 pH = 9 catalyst. This dehydration route was promoted by Lewis acid sites [15]. As shown in the analysis of TPD-NH3, the higher acidity of the Cu NPs/ZrO2 pH = 9 catalyst allows for the achievement of high selectivity towards furans. Previous research proposed that furan derivatives are the result of a catalytic cyclisation of acetol, due to aldol condensation of carbonyl compounds such as acetol and pyruvaldehyde [25].

3. Discussion

A homogeneous distribution and greater dispersion of copper species were suggested by TPR and N2O adsorption results, particularly for the Cu NPs/ZrO2 pH = 4 and Cu NPs/ZrO2 pH = 7 catalysts, exhibiting copper dispersion at about 54% (Table 2). On the other hand, TPR and XPS of the Cu NPs/ZrO2 pH = 9 sample suggested less dispersed species and larger heterogeneity, attributed to the presence of CuO bulk species ascribed to a peak in a high reduction temperature at region II (180–250 °C). Based on N2O adsorption, a copper dispersion of 42.3% was observed for the Cu NPs/ZrO2 pH = 9 catalyst. It must be also emphasized that Cu NPs/ZrO2 pH = 9 exhibited the highest apparent kinetic constant (k). Usually, catalytic activity tended to increase as the metal dispersion increased. Therefore, copper size effects cannot completely account for the observed differences in activity obtained for the Cu NP catalysts.
Different aspects can be mentioned to tentatively rationalize the difference between the apparent kinetic constant values of the catalysts. Firstly, it must be mentioned that under our experimental conditions the transformation of glycerol was performed in a water medium. Water may produce some oxidation of metallic copper species. In this respect, it is reported that copper particles with larger particle size are more resistant to water oxidation compared to more dispersed copper particles, which exhibit a larger fraction of exposed atoms and thus higher accessibility to water [71]. This resulted in a harsher deactivation condition for the Cu NPs/ZrO2 pH = 7 and Cu NPs/ZrO2 pH = 4 catalysts, particularly during the initial minutes of the reaction. The deactivation was caused by the adverse effect of water, which can promote copper oxidation. Other possible causes of deactivation, such as copper sintering, coke and leaching as mentioned in previous research, could be considered [33,72]. It has been reported that the active species involved in glycerol dehydration are metallic copper species. It is commonly accepted that glycerol deoxygenation may occur through dehydrogenation–dehydration–hydrogenation [73,74]. The main role of the metallic Cu is to provide active sites for the activation of glycerol, while copper oxide species which have the role of Lewis acid sites may favor the polarization of glycerol [62]. In this respect, the Cu NPs/ZrO2 pH = 9 catalyst may remain more active during the reaction. It must be also added that the presence of water in the aqueous phase reaction may shield the Lewis acid sites, suppressing the active acid sites. Other possibilities such as sintering and coke formation cannot be discarded as having potential adverse effects on catalytic activity. Taking into account such considerations, the acid sites of the Cu NPs/ZrO2 pH = 9 catalyst must have expressed some benefit, as it possessed the highest total quantity of total acid sites as determined by TPD-NH3 (Table 2), explaining the difference in the kinetic constant (k) observed for the copper nanoparticles catalysts.
Table 6 exhibits our results compared with previous studies from the literature examining conversion of glycerol and selectivity to 1,2-propanediol over temperature, pressure and time.

4. Materials and Methods

4.1. Copper Nanoparticles Synthesis

Three sets of copper nanoparticles (NPs) were prepared via chemical reduction at three different pH values, regulated by an appropriate buffer solution (pH = 4, 7 and 9) obtained from Merck. The buffer composition in each case was: pH 9: boric acid/potassium chloride/sodium hydroxide, pH 7: disodium hydrogen phosphate/potassium dihydrogen phosphate and pH 4: citric acid/sodium hydroxide/hydrogen chloride. Details of the synthesis protocol are presented in Supplementary Materials Table S1 (Supplementary Information). Firstly, 5.0 mL of glycerol was added into three 500 mL round-bottom flasks under vigorous stirring. Secondly, copper(II) nitrate trihydrate (0.5 mol/L) was added to each flask. Once the copper precursor was completely dissolved, a suitable buffer dissolution of the pH was added to each flask. Finally, 6.0 mL of hydrazine monohydrate was added to each flask to induce the reduction of copper species [36,40,41]. Each resultant system was allowed to react for 10 h. After the reaction, the copper NPs obtained in the flask were centrifuged and washed several times with 28.0 mL of ethanol. Finally, they were stored in conical tubes suspended in ethanol. Before TEM analysis one drop of copper nanoparticles in ethanol was added to 10 mL of additional ethanol (10 times dilution) and sonicated before being dropped onto the carbon grids.

4.2. Zirconia-Supported Copper Nanoparticles Catalysts

Details of the synthesis protocol are presented in Supplementary Materials Table S2 (Supplementary Information). ZrO2 was obtained in irregularly sized pellets. To homogenize the pellet size, the pellets were ground in a ceramic mortar and then sieved in a mesh of between 60–120 °C. Finally, ZrO2 was calcined in a muffle at 400 °C for 4 h with a heating ramp of 5 °C/min from room temperature (RT) up to 400 °C. After calcination, ZrO2 was stored in a desiccator.
The preparation of the copper NPs supported by calcined ZrO2 was as follows: first, 5.0 mL of glycerol was added into a 500 mL three-neck round-bottom flask under vigorous stirring. Second, 285 mg of copper(II) nitrate trihydrate was added into the glycerol. The resultant mixture was stirred until completely dissolved. After that, 2.0 g of ZrO2 was added. The nominal copper loading in the catalyst was 3.5 wt.% relative to the ZrO2 support. Three flasks containing the same quantity and the same glycerol solution were prepared. 10 mL of a suitable pH buffer solution was added to each flask. A different pH buffer (pH = 4, 7 and 9) was added to each flask. After this, 6.0 mL of hydrazine monohydrate was added to each flask to reduce the copper species. Each resultant mixture was stirred overnight and then filtered on a quartz frit and washed with a mixture of acetone and water. Finally, each resultant solid material was dried at 100 °C overnight and stored in a desiccator. The catalysts were labeled as Cu NPs/ZrO2 pH = 4, Cu NPs/ZrO2 pH = 7 and Cu NPs/ZrO2 pH = 9. Before catalytic testing, the samples were reduced in a flow of H2 at 200 °C for 2 h. The results of energy-dispersive X-ray spectroscopy (EDS) matched with respect to the nominal values of the copper loading (Supplementary Materials Figure S9).

4.3. Copper Materials Characterization

4.3.1. Cu Nanoparticles (NPs)

UV–visible spectroscopy was performed using a Merck Spectroquant Prove 600. A suspension of copper NPs in ethanol was deposited in a quartz cuvette with a 1 cm optical path and diluted to 50 wt.% with additional ethanol until the cuvette was filled. Subsequently, the suspension was placed into the spectrophotometer. Wavelength scans from 200 to 800 nm were configured and the respective spectra were recorded. UV–vis was performed for the three suspensions of copper NPs in ethanol (pH = 4, 7 and 9). Finally, the UV–vis spectra obtained were plotted as wavelength (nm) versus absorbance (a.u.) and deconvolved to obtain the shifts of each band, and each absorption peak. TEM analysis of the copper nanoparticles (NPs) was performed using a Jeol Model JEM-1200 EXII. Prior to analysis, the samples were dispersed in an alcohol suspension and sonicated. A drop of the suspension was placed over a copper grid with a holey carbon film.

4.3.2. Zirconia-Supported Copper Nanoparticles Catalysts

The textural properties of the copper nanoparticle catalysts were analyzed via N2 physisorption using a Micromeritrics ASAP 2010. Before the analysis, about 100 mg of the sample was degassed under vacuum at 120 °C for 4 h. The specific surface area of the catalysts was calculated using the BET equation. The total pore volume was calculated as P/P0 equal to 0.99. The average pore size was determined via the Barret–Joyner–Halenda (BJH) method, using the desorption isotherm branch.
X-ray diffraction was performed in a Bruker diffractometer model D4Endeavor equipped with a nickel filter and a Cu–Kα-ray source (λ = 0.154 nm). The analysis conditions were 40 kV and 20 mA. The diffractograms were measured at a range of Bragg angles (2θ) between 10° and 90° at 0.02 counts per second.
Before the temperature-programmed reduction (TPR), approximately 100 mg of catalyst was oxidized at 200 °C in air flow of 50 mL/min for 2 h. The TPR was carried out using 10% H2/Ar with a flow rate of 50 mL/min, increasing the temperature from room temperature to 800 °C at a heating rate of 5 °C/min. A TCD detector was used to monitor the TPR. The water formed during the reduction process was trapped in a salt/ice cooling bath.
The catalysts were reduced at 200 °C in a H2 flow of 50 mL/min for 2 h and then cooled to 40 °C under a He flow of 50 mL/min before the temperature-programmed desorption of ammonia (NH3-TPD). A flow of 50 mL/min of NH3 was used to saturate the sample surface for 10 min. The physisorbed NH3 was removed in a He flow of 50 mL/min and the system was heated from 40 to 75 °C under this He flow. Finally, during TPD analysis, the system was heated from 75 to 800 °C at rate of 5 °C/min. A TCD detector monitored the desorption of NH3.
XPS chemical analysis was carried out using a Kratos Axis Ultra HAS spectrometer, with a hemispheric analyzer using a Mg Kα X-ray radiation source (hv = 1253.6 eV), conducted at 10 mA and 15 kV. The binding energies of the XPS spectra were referred to the C1s component (BE = 285 eV).
The copper catalyst was reduced in a flow of 5% H2/Ar (20 mL/min) at 5 °C/min from 25 °C to 200 °C, maintaining the maximum temperature for 2 h before N2O analysis. The adsorption capacity and dispersion of copper were determined by N2O chemisorption with an Autochem II 2920. Selective oxidation of the copper surface to Cu2O was performed under a 20% N2O/Ar flow (20 mL/min) at 40 °C (N2O + 2Cusurface → Cu2Osurface + N2). Subsequently, the Cu2O surface was reduced in a flow of 5% H2/Ar (20 mL/min) at 5 °C/min from 25 °C to 900 °C (H2 + Cu2Osurface → 2Cusurface + H2O). Surface copper was calculated considering the stoichiometry of N2O/Cu = 0.5 mol N 2 O / mol Cu 0 and dispersion (D) was determined as the ratio between the amount of surface copper and the total nominal content of copper. The copper nanoparticle diameter ( d ¯ p ) was determined by:
d ¯ p = 6 v m / a m D
The parameter am is the surface area occupied by an atom m on a polycrystalline surface, which in the case of copper is 7.14 × 10⁻²⁰ m2/copper atom. The term vm is the volume occupied by an atom m in the bulk of metal, which for copper is 1.17 × 10⁻²⁹ m3/copper atom [85].

4.3.3. Glycerol Dehydration

The catalysts were tested in a glycerol dehydration reaction using a 300 mL batch reactor containing 60 mL of 80 wt.% aqueous glycerol solution. Subsequently, 500 mg of each freshly reduced copper catalyst sample was introduced into the glycerol aqueous solution. The reactor was then closed and purged with N2 to ensure an inert atmosphere. The mixture was stirred at 800 rpm. The reactor was heated to 190 °C and allowed to reach autogenous pressure, and if required, additional N2 was added to achieve a working pressure of 20 bar. The catalytic reaction was carried out for 3 h, with samples being taken every half hour. The samples were analyzed in an XL auto system gas chromatograph equipped with an FID detector and a Nukol capillary column (30 m long, 0.53 mm internal diameter and a film thickness of 0.5 µm). Helium was used as carrier gas. To measure the progress of the reaction, the glycerol conversion (X) and product selectivity (Si) were calculated at each sampling time as follows:
X = M o l e s   o f   g l y c e r o l   c o n v e r t e d I n i t i a l   m o l e s   o f   g l y c e r o l × 100 %
S i = M o l e s   o f   C   i n   t h e   p r o d u c t   i M o l e s   o f   C   i n   t h e   i n i t i a l   q u a n t i t y   o f   g l y c e r o l × 100 %
The yield was expressed as:
Y i e l d   t o   s p e c i f i c   p r o d u c t   % = S e l e c t i v i t y   t o   s p e c i f i c   p r o d u c t × C o n v e r s i o n 100

5. Conclusions

Copper NP catalysts with varying synthesized pH were deposited on ZrO2 after preparation via the chemical reduction method. XRD results revealed only the presence of tetragonal ZrO2, suggesting that the copper NPs deposited on ZrO2 were highly dispersed. The TPR of copper catalysts suggested that the Cu NPs/ZrO2 pH = 4 and Cu NPs/ZrO2 pH = 7 catalysts exhibited more homogeneous dispersion of copper species compared with the Cu NPs/ZrO2 pH = 9 catalyst. The results of TPR were corroborated by N2O chemisorption based on the values obtained for dispersion and average particle size. Metallic copper was essential for the dehydration of glycerol using acetol. The aqueous reaction medium could be a vector of deactivation, particularly for the Cu NPs/ZrO2 pH = 4 and Cu NPs/ZrO2 pH = 7 samples. The copper dispersion could not completely explain the observed differences in activity obtained for the Cu NP catalysts. Total acidity and catalyst reducibility must also be considered. Finally, it is noteworthy that the main products obtained in the dehydration of glycerol were acetol, 1,2-PDO, pyruvaldehyde, furan derivatives, and to a lesser extent acetone and 2-propanol. The Cu NPs/ZrO2 pH = 9 catalyst was the most active catalyst for the formation of acetol.

Supplementary Materials

The following are available online at https://www.mdpi.com/article/10.3390/catal11091040/s1, Table S1: Compounds used in the synthesis of copper nanoparticles (Cu NPs), Table S2: Compounds used in the synthesis of copper nanoparticles (Cu NPs) in the presence of ZrO2, Table S3. Absorption maxima band of Cu NPs synthesized at pH = 4, 7 and 9, Figure S1: UV–vis spectra of (a) Cu NPs pH = 4 and (b) Cu NPs pH = 7 collected in ethanol at 22 °C. (a) (1) 218 nm, (2) 293 nm; (b) (1) 204 nm, (2) 216 nm and (3) 280 nm. (c) (1) 218 nm, (2) 264 nm, and (3) 328 nm, Figure S2: (a) N2 adsorption desorption isotherms at 77 K. (b) Pore size distribution. (1) Cu NPs/ZrO2 pH = 4, (2) Cu NPs/ZrO2 pH = 7, (3) Cu NPs/ZrO2 pH = 9, and (4) ZrO2, Figure S3: XRD pattern of ZrO2 and copper NPs catalysts. (1) Cu NPs/ZrO2 pH = 4, (2) Cu NPs/ZrO2 pH = 7, (3) Cu NPs/ZrO2 pH = 9, and (4) ZrO2. * tetragonal phase of ZrO2, Figure S4: TPR profiles after the N2O adsorptive decomposition on each catalyst. (1) Cu NPs/ZrO2 pH = 4, (2) Cu NPs/ZrO2 pH = 7, (3) Cu NPs/ZrO2 pH = 9, Figure S5: XPS survey spectra of Cu NPs/ZrO2 catalysts, Figure S6: XPS survey spectra magnification of Cu NPs/ZrO2 catalysts in the Cu LMM region, Figure S7: TPD profile of pre-adsorbed NH3 on the Cu NPs/ZrO2 catalysts. (1) Cu NPs/ZrO2 pH = 4, (2) Cu NPs/ZrO2 pH = 7, (3) Cu NPs/ZrO2 pH = 9. Figure S8: Selectivity to acetol versus selectivity to 1,2-PDO during the reaction. (1) Cu NPs/ZrO2 pH = 4, (2) Cu NPs/ZrO2 pH = 7, (3) Cu NPs/ZrO2 pH = 9, Figure S9: SEM-EDS image (left) and elemental mapping (right) of the copper nanoparticle catalysts: (a) Cu NPs/ZrO2 pH = 4, (b) Cu NPs/ZrO2 pH = 7, (c) Cu NPs/ZrO2 pH = 9, Figure S10: SEM-EDS image (left) and elemental mapping (right) of the copper nanoparticles/ZrO2 catalyst: Cu NPs/ZrO2 pH = 7 after glycerol conversion.

Author Contributions

Conceptualization, R.J.C. and N.N.; Validation, J.G.; Investigation, R.J.C., N.N., R.J.C., R.A. and A.F.P.; Formal analysis, R.J.C. and N.N.; Supervision, R.J.C. and N.N.; Writing—original draft preparation, R.J.C., N.N. and A.F.P.; Writing—review and editing, R.J.C., N.N. and A.F.P.; Funding acquisition, R.J.C., N.N. and A.F.P. All authors have read and agreed to the published version of the manuscript.

Funding

R.J.C. is grateful for FONDECYT (Chile) grant No. 1180243 and N.N. is grateful for FONDECYT grant No. 1201680 for financial support. J.G. thanks FONDECYT grant No. 1180243 for support of an undergraduate scholarship (UdeC). The authors acknowledge the assistance of the staff of the Electron Microscopy Laboratory at VRID, Universidad de Concepción, Chile. A.F. Peixoto thanks FCT for funding through program DL 57/2016—Norma transitória. The work was also supported through the project UIDB/50006/2020, funded by FCT/MCTES through Portuguese funds.

Conflicts of Interest

The authors declare no conflict of interest.

References

  1. Jefferson, M. Sustainable energy development: Performance and prospects. Renew. Energy 2006, 31, 571–582. [Google Scholar] [CrossRef]
  2. Cadenas, A.; Cabezudo, S. Biofuels as Sustainable Technologies: Perspectives for Less Developed Countries. Technol. Forecast. Soc. Chang. 1998, 58, 83–103. [Google Scholar] [CrossRef]
  3. Türe, S.; Uzun, D.; Türe, I.E. The potential use of sweet sorghum as a non-polluting source of energy. Energy 1997, 22, 17–19. [Google Scholar] [CrossRef]
  4. Sheehan, J.; Camobreco, V.; Duffield, J.; Graboski, M.; Shapouri, H. An Overview of Biodiesel and Petroleum Diesel Life Cycles; U.S. Department of Energy (DOE) and and the U.S. Department of Agriculture (USDA): Golden, CO, USA, 1998.
  5. Demirbas, A. Progress and recent trends in biofuels. Prog. Energy Combust. Sci. 2007, 33, 1–18. [Google Scholar] [CrossRef]
  6. Trane, R.; Dahl, S.; Skjøth-Rasmussen, M.S.; Jensen, A.D. Catalytic steam reforming of bio-oil. Int. J. Hydrogen Energy 2012, 37, 6447–6472. [Google Scholar] [CrossRef]
  7. Liu, Y.; Guo, X.; Rempel, G.L.; Ng, F.T.T. The Promoting Effect of Ni on Glycerol Hydrogenolysis to 1,2-Propanediol with In Situ Hydrogen from Methanol Steam Reforming Using a Cu/ZnO/Al2O3 Catalyst. Catalysts 2019, 9, 412. [Google Scholar] [CrossRef] [Green Version]
  8. Mitta, H.; Seelam, P.K.; Ojala, S.; Keiski, R.L.; Balla, P. Tuning Y-zeolite based catalyst with copper for enhanced activity and selectivity in vapor phase hydrogenolysis of glycerol to 1,2-propanediol. Appl. Catal. A Gen. 2018, 550, 308–319. [Google Scholar] [CrossRef]
  9. Molino, A.; Chianese, S.; Musmarra, D. Biomass gasification technology: The state of the art overview. J. Energy Chem. 2016, 25, 10–25. [Google Scholar] [CrossRef]
  10. Umeta, M.; Faulks, R.M. The effect of fermentation on the carbohydrates in tef (Eragrostis tef). Food Chem. 1988, 27, 181–189. [Google Scholar] [CrossRef]
  11. Yin, X.; Leung, D.Y.C.; Chang, J.; Wang, J.; Fu, Y.; Wu, C. Characteristics of the Synthesis of Methanol Using Biomass-Derived Syngas. Energy Fuels 2005, 19, 305–310. [Google Scholar] [CrossRef]
  12. Isahak, W.N.R.W.; Hisham, M.W.M.; Yarmo, M.A.; Yun Hin, T. A review on bio-oil production from biomass by using pyrolysis method. Renew. Sustain. Energy Rev. 2012, 16, 5910–5923. [Google Scholar] [CrossRef]
  13. Barakos, N.; Pasias, S.; Papayannakos, N. Transesterification of triglycerides in high and low quality oil feeds over an HT2 hydrotalcite catalyst. Bioresour. Technol. 2008, 99, 5037–5042. [Google Scholar] [CrossRef] [PubMed]
  14. Demirbaş, A. Biodiesel from vegetable oils via transesterification in supercritical methanol. Energy Convers. Manag. 2002, 43, 2349–2356. [Google Scholar] [CrossRef]
  15. Foo, G.S.; Wei, D.; Sholl, D.S.; Sievers, C. Role of Lewis and Brønsted Acid Sites in the Dehydration of Glycerol over Niobia. ACS Catal. 2014, 4, 3180–3192. [Google Scholar] [CrossRef]
  16. Sun, D.; Yamada, Y.; Sato, S.; Ueda, W. Glycerol hydrogenolysis into useful C3 chemicals. Appl. Catal. B Environ. 2016, 193, 75–92. [Google Scholar] [CrossRef] [Green Version]
  17. Azri, N.; Ramli, I.; Nda-Umar, U.I.; Shamsuddin, M.R.; Saiman, M.I.; Taufiq-Yap, Y.H. Copper-dolomite as effective catalyst for glycerol hydrogenolysis to 1,2-propanediol. J. Taiwan Inst. Chem. Eng. 2020, 112, 34–51. [Google Scholar] [CrossRef]
  18. Mitta, H.; Devunuri, N.; Sunkari, J.; Mutyala, S.; Balla, P.; Perupogu, V. A highly active dispersed copper oxide phase on calcined Mg9Al2.7-Ga2.3O2 catalysts in glycerol hydrogenolysis. Catal. Today 2021, 375, 204–215. [Google Scholar] [CrossRef]
  19. Mishra, N.K.; Kumar, P.; Srivastava, V.C.; Štangar, U.L. Synthesis of Cu-based catalysts for hydrogenolysis of glycerol to 1,2-propanediol with in-situ generated hydrogen. J. Environ. Chem. Eng. 2021, 9, 105263. [Google Scholar] [CrossRef]
  20. Alhanash, A.; Kozhevnikova, E.F.; Kozhevnikov, I.V. Gas-phase dehydration of glycerol to acrolein catalysed by caesium heteropoly salt. Appl. Catal. A Gen. 2010, 378, 11–18. [Google Scholar] [CrossRef]
  21. Basu, S.; Shree, V.; Sen, A.K. Role of cerium as a promoter and process optimization studies for dehydration of glycerol to acetol over copper chromite catalyst. J. Rare Earths 2021. [Google Scholar] [CrossRef]
  22. Wang, Y.; Xiao, Y.; Xiao, G. Sustainable value-added C3 chemicals from glycerol transformations: A mini review for heterogeneous catalytic processes. Chin. J. Chem. Eng. 2019, 27, 1536–1542. [Google Scholar] [CrossRef]
  23. Suganuma, S.; Hisazumi, T.; Taruya, K.; Tsuji, E.; Katada, N. Influence of Acidic Property on Catalytic Activity and Selectivity in Dehydration of Glycerol. ChemistrySelect 2017, 2, 5524–5531. [Google Scholar] [CrossRef]
  24. Yun, D.; Yun, Y.S.; Kim, T.Y.; Park, H.; Lee, J.M.; Han, J.W.; Yi, J. Mechanistic study of glycerol dehydration on Brønsted acidic amorphous aluminosilicate. J. Catal. 2016, 341, 33–43. [Google Scholar] [CrossRef]
  25. Suprun, W.; Lutecki, M.; Haber, T.; Papp, H. Acidic catalysts for the dehydration of glycerol: Activity and deactivation. J. Mol. Catal. A Chem. 2009, 309, 71–78. [Google Scholar] [CrossRef]
  26. Gabrysch, T.; Peng, B.; Bunea, S.; Dyker, G.; Muhler, M. The Role of Metallic Copper in the Selective Hydrodeoxygenation of Glycerol to 1,2-Propanediol over Cu/ZrO2. ChemCatChem 2018, 10, 1344–1350. [Google Scholar] [CrossRef]
  27. Gandarias, I.; Arias, P.L.; Requies, J.; Güemez, M.B.; Fierro, J.L.G. Hydrogenolysis of glycerol to propanediols over a Pt/ASA catalyst: The role of acid and metal sites on product selectivity and the reaction mechanism. Appl. Catal. B Environ. 2010, 97, 248–256. [Google Scholar] [CrossRef]
  28. Maris, E.P.; Davis, R.J. Hydrogenolysis of glycerol over carbon-supported Ru and Pt catalysts. J. Catal. 2007, 249, 328–337. [Google Scholar] [CrossRef]
  29. Mazarío, J.; Concepción, P.; Ventura, M.; Domine, M.E. Continuous catalytic process for the selective dehydration of glycerol over Cu-based mixed oxide. J. Catal. 2020, 385, 160–175. [Google Scholar] [CrossRef]
  30. Célerier, S.; Morisset, S.; Batonneau-Gener, I.; Belin, T.; Younes, K.; Batiot-Dupeyrat, C. Glycerol dehydration to hydroxyacetone in gas phase over copper supported on magnesium oxide (hydroxide) fluoride catalysts. Appl. Catal. A Gen. 2018, 557, 135–144. [Google Scholar] [CrossRef] [Green Version]
  31. Azri, N.; Irmawati, R.; Nda-Umar, U.I.; Saiman, M.I.; Taufiq-Yap, Y.H. Effect of different supports for copper as catalysts on glycerol hydrogenolysis to 1,2-propanediol. J. King Saud Univ.-Sci. 2021, 33, 101417. [Google Scholar] [CrossRef]
  32. Freitas, I.C.; Manfro, R.L.; Souza, M.M.V.M. Hydrogenolysis of glycerol to propylene glycol in continuous system without hydrogen addition over Cu-Ni catalysts. Appl. Catal. B Environ. 2018, 220, 31–41. [Google Scholar] [CrossRef]
  33. Chimentão, R.J.; Hirunsit, P.; Torres, C.S.; Ordoño, M.B.; Urakawa, A.; Fierro, J.L.G.; Ruiz, D. Selective dehydration of glycerol on copper based catalysts. Catal. Today 2021, 367, 58–70. [Google Scholar] [CrossRef]
  34. Zhu, S.; Gao, X.; Zhu, Y.; Zhu, Y.; Zheng, H.; Li, Y. Promoting effect of boron oxide on Cu/SiO2 catalyst for glycerol hydrogenolysis to 1,2-propanediol. J. Catal. 2013, 303, 70–79. [Google Scholar] [CrossRef]
  35. Gawande, M.B.; Goswami, A.; Felpin, F.-X.; Asefa, T.; Huang, X.; Silva, R.; Zou, X.; Zboril, R.; Varma, R.S. Cu and Cu-Based Nanoparticles: Synthesis and Applications in Catalysis. Chem. Rev. 2016, 116, 3722–3811. [Google Scholar] [CrossRef] [PubMed] [Green Version]
  36. Tan, K.S.; Cheong, K.Y. Advances of Ag, Cu, and Ag–Cu alloy nanoparticles synthesized via chemical reduction route. J. Nanoparticle Res. 2013, 15, 1537. [Google Scholar] [CrossRef]
  37. Tamilvanan, A.; Balamurugan, K.; Ponappa, K.; Kumar, B.M. Copper Nanoparticles: Synthetic Strategies, Properties and Multifunctional Application. Int. J. Nanosci. 2014, 13, 1430001. [Google Scholar] [CrossRef]
  38. Chattopadhyay, D.P.; Patel, B.H. Characterization and Stabilization of Nanosized Copper Particles. Int. J. Pure Appl. Sci. Technol. 2012, 9, 1–8. [Google Scholar]
  39. Rajesh, K.M.; Ajitha, B.; Ashok Kumar Reddy, Y.; Suneetha, Y.; Sreedhara Reddy, P. Synthesis of copper nanoparticles and role of pH on particle size control. Mater. Today Proc. 2016, 3, 1985–1991. [Google Scholar] [CrossRef]
  40. Chandra, S.; Kumar, A.; Tomar, P.K. Synthesis and characterization of copper nanoparticles by reducing agent. J. Saudi Chem. Soc. 2014, 18, 149–153. [Google Scholar] [CrossRef] [Green Version]
  41. Dung Dang, T.M.; Tuyet Le, T.T.; Fribourg-Blanc, E.; Chien Dang, M. The influence of solvents and surfactants on the preparation of copper nanoparticles by a chemical reduction method. Adv. Nat. Sci. Nanosci. Nanotechnol. 2011, 2, 25004. [Google Scholar] [CrossRef]
  42. Peng, C.; Shen, C.; Zheng, S.; Yang, W.; Hu, H.; Liu, J.; Shi, J. Transformation of CuO Nanoparticles in the Aquatic Environment: Influence of pH, Electrolytes and Natural Organic Matter. Nanomater 2017, 7, 326. [Google Scholar] [CrossRef] [Green Version]
  43. Johnson, B.F.G. Nanoparticles in Catalysis. Top. Catal. 2003, 24, 147–159. [Google Scholar] [CrossRef]
  44. Brunelle, J.P. Preparation of Catalysts by metallic complex adsorption on mineral oxides. Pure Appl. Chem. 1978, 50, 1211–1229. [Google Scholar] [CrossRef]
  45. Munnik, P.; de Jongh, P.E.; de Jong, K.P. Recent Developments in the Synthesis of Supported Catalysts. Chem. Rev. 2015, 115, 6687–6718. [Google Scholar] [CrossRef] [PubMed]
  46. Salavati-Niasari, M.; Davar, F. Synthesis of copper and copper(I) oxide nanoparticles by thermal decomposition of a new precursor. Mater. Lett. 2009, 63, 441–443. [Google Scholar] [CrossRef]
  47. Merkus, H.G. Particle Size Measurements: Fundamentals, Practice, Quality, 1st ed.; Springer Science, Ed.; Particle Technology Series; Springer: Dordrecht, The Netherlands, 2009; ISBN 9781402090165. [Google Scholar]
  48. Chary, K.V.R.; Sagar, G.V.; Srikanth, C.S.; Rao, V.V. Characterization and Catalytic Functionalities of Copper Oxide Catalysts Supported on Zirconia. J. Phys. Chem. B 2007, 111, 543–550. [Google Scholar] [CrossRef] [PubMed]
  49. Souma, Y.; Kawasaki, H. Synthesis of tert.-Alkanoic acid catalyzed by Cu(CO)n+ and Ag(CO)2+ under atmospheric pressure. Catal. Today 1997, 36, 91–97. [Google Scholar] [CrossRef]
  50. Tada, S.; Katagiri, A.; Kiyota, K.; Honma, T.; Kamei, H.; Nariyuki, A.; Uchida, S.; Satokawa, S. Cu Species Incorporated into Amorphous ZrO2 with High Activity and Selectivity in CO2-to-Methanol Hydrogenation. J. Phys. Chem. C 2018, 122, 5430–5442. [Google Scholar] [CrossRef]
  51. López-Suárez, F.E.; Bueno-López, A.; Illán-Gómez, M.J. Cu/Al2O3 catalysts for soot oxidation: Copper loading effect. Appl. Catal. B Environ. 2008, 84, 651–658. [Google Scholar] [CrossRef] [Green Version]
  52. Águila, G.; Gracia, F.; Araya, P. CuO and CeO2 catalysts supported on Al2O3, ZrO2, and SiO2 in the oxidation of CO at low temperature. Appl. Catal. A Gen. 2008, 343, 16–24. [Google Scholar] [CrossRef]
  53. Shimokawabe, M.; Asakawa, H.; Takezawa, N. Characterization of copper/zirconia catalysts prepared by an impregnation method. Appl. Catal. 1990, 59, 45–58. [Google Scholar] [CrossRef]
  54. Huang, Z.; Cui, F.; Kang, H.; Chen, J.; Zhang, X.; Xia, C. Highly Dispersed Silica-Supported Copper Nanoparticles Prepared by Precipitation−Gel Method: A Simple but Efficient and Stable Catalyst for Glycerol Hydrogenolysis. Chem. Mater. 2008, 20, 5090–5099. [Google Scholar] [CrossRef]
  55. Volanti, D.P.; Sato, A.G.; Orlandi, M.O.; Bueno, J.M.C.; Longo, E.; Andrés, J. Insight into Copper-Based Catalysts: Microwave-Assisted Morphosynthesis, In Situ Reduction Studies, and Dehydrogenation of Ethanol. ChemCatChem 2011, 3, 839–843. [Google Scholar] [CrossRef]
  56. Yin, M.; Wu, C.-K.; Lou, Y.; Burda, C.; Koberstein, J.T.; Zhu, Y.; O’Brien, S. Copper Oxide Nanocrystals. J. Am. Chem. Soc. 2005, 127, 9506–9511. [Google Scholar] [CrossRef] [PubMed]
  57. Sekar, K.; Chuaicham, C.; Balijapalli, U.; Li, W.; Wilson, K.F.; Lee, A.; Sasaki, K. Surfactant- and template-free hydrothermal assembly of Cu2O visible light photocatalysts for trimethoprim degradation. Appl. Catal. B Environ. 2021, 284, 119741. [Google Scholar] [CrossRef]
  58. Chang, X.; Liu, A.-F.; Cai, B.; Luo, J.-Y.; Pan, H.; Huang, Y.-B. Catalytic Transfer Hydrogenation of Furfural to 2-Methylfuran and 2-Methyltetrahydrofuran over Bimetallic Copper–Palladium Catalysts. ChemSusChem 2016, 9, 3330–3337. [Google Scholar] [CrossRef]
  59. Gong, W.; Chen, C.; Zhang, Y.; Zhou, H.; Wang, H.; Zhang, H.; Zhang, Y.; Wang, G.; Zhao, H. Efficient Synthesis of Furfuryl Alcohol from H2-Hydrogenation/Transfer Hydrogenation of Furfural Using Sulfonate Group Modified Cu Catalyst. ACS Sustain. Chem. Eng. 2017, 5, 2172–2180. [Google Scholar] [CrossRef]
  60. Beinik, I.; Hellström, M.; Jensen, T.N.; Broqvist, P.; Lauritsen, J.V. Enhanced wetting of Cu on ZnO by migration of subsurface oxygen vacancies. Nat. Commun. 2015, 6, 8845. [Google Scholar] [CrossRef] [Green Version]
  61. Biesinger, M.C. Advanced analysis of copper X-ray photoelectron spectra. Surf. Interface Anal. 2017, 49, 1325–1334. [Google Scholar] [CrossRef]
  62. Wu, G.-S.; Wang, L.-C.; Liu, Y.-M.; Cao, Y.; Dai, W.-L.; He, H.-Y.; Fan, K.-N. Implication of the role of oxygen anions and oxygen vacancies for methanol decomposition over zirconia supported copper catalysts. Appl. Surf. Sci. 2006, 253, 974–982. [Google Scholar] [CrossRef]
  63. Tanabe, K.; Misono, M.; Hattori, H.; Ono, Y. New Solid Acids and Bases: Their Catalytic Properties; Elsevier Science: Amsterdam, The Netherlands, 1990; ISBN 9780080887555. [Google Scholar]
  64. Kim, Y.T.; Jung, K.-D.; Park, E.D. A comparative study for gas-phase dehydration of glycerol over H-zeolites. Appl. Catal. A Gen. 2011, 393, 275–287. [Google Scholar] [CrossRef]
  65. Martin, A.; Armbruster, U.; Atia, H. Recent developments in dehydration of glycerol toward acrolein over heteropolyacids. Eur. J. Lipid Sci. Technol. 2012, 114, 10–23. [Google Scholar] [CrossRef]
  66. Dasari, M.A.; Kiatsimkul, P.-P.; Sutterlin, W.R.; Suppes, G.J. Low-pressure hydrogenolysis of glycerol to propylene glycol. Appl. Catal. A Gen. 2005, 281, 225–231. [Google Scholar] [CrossRef]
  67. Montassier, C.; Giraud, D.; Barbier, J. Polyol Conversion by Liquid Phase Heterogeneous Catalysis Over Metals. In Heterogeneous Catalysis and Fine Chemicals; Guisnet, M., Barrault, J., Bouchoule, C., Duprez, D., Montassier, C., Pérot, G., Eds.; Elsevier: Amsterdam, The Netherlands, 1988; Volume 41, pp. 165–170. ISBN 0167-2991. [Google Scholar]
  68. Yfanti, V.-L.; Lemonidou, A.A. Mechanistic study of liquid phase glycerol hydrodeoxygenation with in-situ generated hydrogen. J. Catal. 2018, 368, 98–111. [Google Scholar] [CrossRef]
  69. Montassier, C.; Dumas, J.M.; Granger, P.; Barbier, J. Deactivation of supported copper based catalysts during polyol conversion in aqueous phase. Appl. Catal. A Gen. 1995, 121, 231–244. [Google Scholar] [CrossRef]
  70. Chimentão, R.J.; Miranda, B.C.; Szanyi, J.; Sepulveda, C.; Santos, J.B.O.; Correa, J.V.S.; Llorca, J.; Medina, F. Sources of deactivation during glycerol conversion on Ni/γ-Al2O3. Mol. Catal. 2017, 435, 49–57. [Google Scholar] [CrossRef]
  71. Xia, X.; Xie, C.; Cai, S.; Yang, Z.; Yang, X. Corrosion characteristics of copper microparticles and copper nanoparticles in distilled water. Corros. Sci. 2006, 48, 3924–3932. [Google Scholar] [CrossRef]
  72. Miranda, B.C.; Chimentão, R.J.; Szanyi, J.; Braga, A.H.; Santos, J.B.O.; Gispert-Guirado, F.; Llorca, J.; Medina, F. Influence of copper on nickel-based catalysts in the conversion of glycerol. Appl. Catal. B Environ. 2015, 166–167, 166–180. [Google Scholar] [CrossRef] [Green Version]
  73. Wawrzetz, A.; Peng, B.; Hrabar, A.; Jentys, A.; Lemonidou, A.A.; Lercher, J.A. Towards understanding the bifunctional hydrodeoxygenation and aqueous phase reforming of glycerol. J. Catal. 2010, 269, 411–420. [Google Scholar] [CrossRef]
  74. Roy, D.; Subramaniam, B.; Chaudhari, R.V. Aqueous phase hydrogenolysis of glycerol to 1,2-propanediol without external hydrogen addition. Catal. Today 2010, 156, 31–37. [Google Scholar] [CrossRef]
  75. Zhou, J.; Zhang, J.; Guo, X.; Mao, J.; Zhang, S. Ag/Al2O3 for glycerol hydrogenolysis to 1,2-propanediol: Activity, selectivity and deactivation. Green Chem. 2012, 14, 156–163. [Google Scholar] [CrossRef]
  76. Furikado, I.; Miyazawa, T.; Koso, S.; Shimao, A.; Kunimori, K.; Tomishige, K. Catalytic performance of Rh/SiO2 in glycerol reaction under hydrogen. Green Chem. 2007, 9, 582–588. [Google Scholar] [CrossRef] [Green Version]
  77. Durán-Martín, D.; Ojeda, M.; Granados, M.L.; Fierro, J.L.G.; Mariscal, R. Stability and regeneration of Cu–ZrO2 catalysts used in glycerol hydrogenolysis to 1,2-propanediol. Catal. Today 2013, 210, 98–105. [Google Scholar] [CrossRef]
  78. Yuan, Z.; Wang, J.; Wang, L.; Xie, W.; Chen, P.; Hou, Z.; Zheng, X. Biodiesel derived glycerol hydrogenolysis to 1,2-propanediol on Cu/MgO catalysts. Bioresour. Technol. 2010, 101, 7088–7092. [Google Scholar] [CrossRef]
  79. Vasiliadou, E.S.; Lemonidou, A.A. Investigating the performance and deactivation behaviour of silica-supported copper catalysts in glycerol hydrogenolysis. Appl. Catal. A Gen. 2011, 396, 177–185. [Google Scholar] [CrossRef]
  80. Liu, Y.; Mai, C.T.Q.; Ng, F.T.T. Glycerol Hydrogenolysis with In Situ Hydrogen Produced via Methanol Steam Reforming: The Promoting Effect of Pd on a Cu/ZnO/Al2O3 Catalyst. Catalysts 2021, 11, 110. [Google Scholar] [CrossRef]
  81. Xia, S.; Zheng, L.; Wang, L.; Chen, P.; Hou, Z. Hydrogen-free synthesis of 1,2-propanediol from glycerol over Cu–Mg–Al catalysts. RSC Adv. 2013, 3, 16569–16576. [Google Scholar] [CrossRef]
  82. Seguel, J.; García, R.; Chimentão, R.J.; García-Fierro, J.L.; Ghampson, I.T.; Escalona, N.; Sepúlveda, C. Thermal Modification Effect on Supported Cu-Based Activated Carbon Catalyst in Hydrogenolysis of Glycerol. Materials 2020, 13, 603. [Google Scholar] [CrossRef] [Green Version]
  83. Yuan, J.; Li, S.; Yu, L.; Liu, Y.; Cao, Y. Efficient catalytic hydrogenolysis of glycerol using formic acid as hydrogen source. Chin. J. Catal. 2013, 34, 2066–2074. [Google Scholar] [CrossRef]
  84. Yin, H.; Zhang, C.; Yin, H.; Gao, D.; Shen, L.; Wang, A. Hydrothermal conversion of glycerol to lactic acid catalyzed by Cu/hydroxyapatite, Cu/MgO, and Cu/ZrO2 and reaction kinetics. Chem. Eng. J. 2016, 288, 332–343. [Google Scholar] [CrossRef]
  85. Ertl, G.; Knözinger, H.; Schüth, F.; Weitkamp, J. Handbook Of Heterogeneous Catalysis; Wiley-VCH: Weinheim, Germany, 2008; Volume 1, ISBN 978-3-527-31241-2. [Google Scholar]
Figure 1. TEM images of the copper nanoparticles (NPs) obtained via the chemical reduction method (a) pH = 4, (c) pH = 7 and (e) pH = 9. Histograms of the Cu NPs (b) pH = 4, (d) pH = 7 and (f) pH = 9. ADP = Average Particle Diameter.
Catalysts 11 01040 g001
Figure 2. TEM images of the copper nanoparticles/ZrO2 catalysts. (a) Cu NPs/ZrO2 pH = 4, (b) Cu NPs/ZrO2 pH = 7, (c) Cu NPs/ZrO2 pH = 9.
Catalysts 11 01040 g002
Figure 3. TPR analysis. (1) Cu NPs/ZrO2 pH = 4, (2) Cu NPs/ZrO2 pH = 7, (3) Cu NPs/ZrO2 pH = 9.
Catalysts 11 01040 g003
Figure 4. High-resolution XPS spectra of the Cu 2p (a) and Zr 3d (b). (1) Cu NPs/ZrO2 pH = 4, (2) Cu NPs/ZrO2 pH = 7, (3) Cu NPs/ZrO2 pH = 9.
Catalysts 11 01040 g004
Figure 5. Glycerol conversion as a function of reaction time and catalyst. (1) Cu NPs/ZrO2 pH = 4, (2) Cu NPs/ZrO2 pH = 7, (3) Cu NPs/ZrO2 pH = 9.
Catalysts 11 01040 g005
Figure 6. Selectivity of the different products versus time observed for reactions using the copper catalysts: (a) Cu NPs/ZrO2 pH = 4, (b) Cu NPs/ZrO2 pH = 7 and (c) Cu NPs/ZrO2 pH = 9.
Catalysts 11 01040 g006
Figure 7. Yield of acetol after 90 min of reaction. (1) Cu NPs/ZrO2 pH = 4, (2) Cu NPs/ZrO2 pH = 7, (3) Cu NPs/ZrO2 pH = 9.
Catalysts 11 01040 g007
Figure 8. General chemical pathway proposed for catalyzed glycerol dehydration.
Catalysts 11 01040 g008
Table 1. Specific surface area and pore volume calculated from N2—adsorption.
SampleSpecific Surface Area SBET (m2/g)Pore Volume (cm3/g)Pore Diameter (nm)
Cu NPs/ZrO2 pH = 41290.1314.1
Cu NPs/ZrO2 pH = 71340.1374.1
Cu NPs/ZrO2 pH = 91360.1434.2
ZrO21460.1564.3
Table 2. Adsorption properties, exposed copper atoms and dispersion of copper catalysts.
SampleTmax (°C) 1Tmax (°C) 2NH3 (mmol/gcat) 3N2O (µmol/gcat) 4Copper
(g Cu/gcat) 5
D (%) d ¯ p ( nm )
Cu NPs/ZrO2 pH = 4153.71.31510.019154.81.8
Cu NPs/ZrO2 pH = 7163.51.11490.018954.11.8
Cu NPs/ZrO2 pH = 9161.4206.31.51160.014842.32.3
1 First TPR peak (region I). 2 Second TPR peak (region II). 3 Total NH3 consumption (µmol/gcat) by NH3-TPD. 4 N2O consumed by adsorption. 5 Exposed copper resulting from N2O adsorption.
Table 3. Surface atomic percentages as determined by XPS.
MaterialAtomic Surface %Cu 2p/Zr 3d Atomic Ratio a
C 1sO 1sZr 3dCu 2p
Cu NPs/ZrO2 pH = 414.1763.3820.402.050.100
Cu NPs/ZrO2 pH = 711.1865.9820.871.970.094
Cu NPs/ZrO2 pH = 913.4364.6220.081.880.093
a Calculated by XPS.
Table 4. Cu 2p3/2 binding energy, Cu LMM kinetic energy and Auger parameter.
SampleCu 2p3/2 B.E. (eV)Cu LMM K.E. (eV)Modified Auger Parameter a
Cu NPs/ZrO2 pH = 4932.88916.781849.66
Cu NPs/ZrO2 pH = 7933.38915.751849.13
Cu NPs/ZrO2 pH = 9933.05917.611850.66
a The sum of the B.E. of the Cu 2p3/2 and the K.E. of the Cu LMM Auger.
Table 5. Kinetic constant values for glycerol dehydration over Cu NP catalysts.
Samplek (min−1)
Cu NPs/ZrO2 pH = 40.0013
Cu NPs/ZrO2 pH = 70.0013
Cu NPs/ZrO2 pH = 90.0040
Table 6. Comparison of the results obtained in this work with other results from the literature in the liquid phase of catalytic valorization of glycerol over metal catalysts.
CatalystsT (°C)H2 Pressure (atm)Glycerol/Catalyst (g/g)Glycerol Conversion (%)Time (h)Selectivity to1,2–PDO (%)Ref.
Ag/Al2O322015.07.646.01096.0[75]
Rh/SiO212080.027.819.61034.6[76]
Pt/SiO2-Al2O322045.06.06.02431.9[27]
Cu/Dolomite20040.020.078.51079.0[17]
Cu/ZrO220040.041.612.8812.8[77]
Cu/MgO18030.07.172.02097.6[78]
Cu/SiO224078.9166.04.1590.1[79]
Cu/ZrO2190--- a160.040.0310.0This work
Cu/ZnO/Al2O3220--- a100.070.2663.0[80]
Cu0.4/Mg5.6Al2O8.6220--- a8.033.11091.7[81]
Cu/C22050150.016.6678.6[82]
Cu/ZrO22008010.085.0594.0[83]
Cu/MgO230--- a20.090.021.0[84]
a N2 atmosphere. T = temperature. Ref. = Reference.
Publisher’s Note: MDPI stays neutral with regard to jurisdictional claims in published maps and institutional affiliations.

