Article

Photocatalytic and Sonocatalytic Degradation of EDTA and Rhodamine B over Ti0 and Ti@TiO2 Nanoparticles

ICSM, Univ Montpellier, UMR 5257, CEA-CNRS-UM-ENSCM, Marcoule, F-30207 Bagnols sur Cèze, France
*
Author to whom correspondence should be addressed.
Catalysts 2021, 11(8), 928; https://doi.org/10.3390/catal11080928
Submission received: 24 June 2021 / Revised: 21 July 2021 / Accepted: 24 July 2021 / Published: 30 July 2021
(This article belongs to the Special Issue Trends in Environmental Applications of Advanced Oxidation Processes)

Abstract

:
Herein, we report a comparative study of photocatalytic (Xe-lamp) and sonocatalytic (345 kHz power ultrasound) degradation of Ethylenediaminetetraacetic acid (EDTA) and Rhodamine B (RhB) in the presence of Ti0 and Ti@TiO2 core-shell nanoparticles (NPs). Ti@TiO2 NPs have been obtained by sonohydrothermal treatment (20 kHz, 200 °C) of commercially available Ti0 NPs in pure water. The obtained material is composed of quasi-spherical Ti0 particles (30–150 nm) coated by 5–15 nm crystals of anatase. In contrast to pristine TiO2, the Ti@TiO2 NPs exhibit the extend photo response from UV to NIR light region due to the light absorption by nonplasmonic Ti core. EDTA can be oxidized effectively by photocatalysis in the presence of Ti@TiO2 NPs. By contrast, air passivated Ti0 nanoparticles was found to be inactive in the photocatalytic process for both EDTA and RhB. Photocatalytic degradation of EDTA over Ti@TiO2 NPs exhibits strong photothermal effect, which has been attributed to the higher yield of oxidizing radicals produced by light at higher bulk temperature. The efficiency of RhB photocatalytic degradation depends strongly on RhB concentration. At [RhB] ≥ 1 × 10⁻³ M, its photocatalytic degradation is not feasible due to a strong self-absorption. At lower concentrations, RhB photocatalytic degradation is observed, but at lower efficiency compared to EDTA. We found that the efficient sonochemical degradation of RhB does not require the presence of any catalysts. For both processes, EDTA and RhB, sonochemical and photocatalytic processes are more effective in the presence of Ar/O2 gas mixture compared to pure Ar. The obtained results suggest that the choice of the optimal technology for organic pollutants degradation can be determined by their optical and complexing properties.

1. Introduction

Within the progressive increase in the level of wastewater contamination, more efforts are directed towards finding promising methods for the removal of organic substances, such as dyes, chlorinated organics, antibiotics, complexing agents and other pollutants from wastewater [1,2]. Among the most common water contaminants are organic dyes. For instance, Rhodamine B (RhB) poses a major threat to human health, aquatic life and environmental safety. It is widely used in industry and its uncontrolled disposal into the environment can cause serious health problems, including major irritation to skin eyes and respiratory tract. Conventional wastewater treatment methods like ion exchange, ozonation, membrane separation, biological treatments and adsorption suffered from certain limitation concerning the high cost compared to their slow kinetics and low performance [3]. In addition, strong complexing reagents, like EDTA, are also of environmental concern since their release increases the mobility of heavy metals and radionuclides in groundwater [4]. EDTA removal throughout conventional aerobic biodegradation is hardly accessed [5] and hydrothermal thermolysis is energy consumable [6]. For such reasons, advanced oxidation processes (AOPs) have attracted a lot of attention, among which ultrasound-based degradation and photocatalysis seem quite promising [7,8]. Ultrasound technology has proven to be an efficient treatment method for toxic waste removal, either when used alone or in combination with other oxidation methods [9]. In some cases, organic waste decomposition under the action of ultrasound (US) is almost 10,000 times faster than the conventional natural aerobic oxidation [10]. Once liquids are subjected to US in the frequency range of ca. 20 kHz–1 MHz, microbubbles are formed in solution, they grow and eventually collapse releasing a large amount of energy inside, and around, the cavitation bubble [11]. The energy released from so-called the cavitation process is sufficient to split water vapor molecules, allowing the in situ production of hydroxyl radicals (OH·) [12]. The combination of US with catalysts, referred as sonocatalysis, often allows to enhance the efficiency of US treatment, but the mechanism of sonocatalysis is not fully understood and may differ depending on the catalyst [13].
Photocatalysis also emerged as a powerful AOPs towards the degradation of organic pollutants. This process originates from charge separation induced in catalytic materials by photon absorption. The electrons (e) and holes (h+) generated on the surface of catalysts upon photoexcitation can react with water and oxygen to form radicals, such as OH· and O2. These radical species have a strong oxidative/reductive potential providing breaking down organic pollutants [14]. Several studies have reported the kinetics and mechanisms of EDTA photocatalytic degradation on a typical semiconducting photocatalyst P25 TiO2 loaded by metallic nanoparticles (NPs) or doped by cations or anions for better catalytic performance [15]. Despite significant efforts, preparation of TiO2-based photocatalysts highly efficient under visible light is still a challenge. Other works reported the enhanced photocatalytic degradation of RhB using CdS NPs as a catalyst [3]. However, high toxicity does not allow its application in environmental remediation [16].
In general, photocatalysis and sonocatalysis are often considered as competing technologies. However, the comparative studies of these techniques are scarce in the literature. The aim of this work is to probe sonocatalysis driven by 345 kHz power US and photocatalysis under Xe lamp white light irradiation, as a simulator of the sunlight, for the degradation of RhB and EDTA molecules in aqueous solutions. Herein, air passivated titanium (Ti0) and Ti@TiO2 core-shell NPs were investigated as catalysts in selected systems. Very recently, sonocatalytic degradation of EDTA over these catalysts has been reported [17]. It was found that the combination of 345 kHz US with the metallic Ti0 NPs enhances the degradation of EDTA (C0 = 5 × 10⁻³ M) under Ar/20% O2 atmosphere, and the presence of TiO2 anatase NPs on the surface of the Ti0 reduces slightly its efficiency towards EDTA degradation. The suggested mechanism of EDTA sonocatalytic degradation involves the sonochemical oxidation of EDTA molecules by OH./HO2 radicals in solution and EDTA oxidation at the surface of Ti0 NPs in the presence of O2 activated by the cavitation event [17]. These results are being compared herein with those of the photocatalytic EDTA degradation results. Moreover, a detailed comparison between the photocatalytic and sonocatalytic RhB degradation mechanism is presented.

2. Results and Discussion

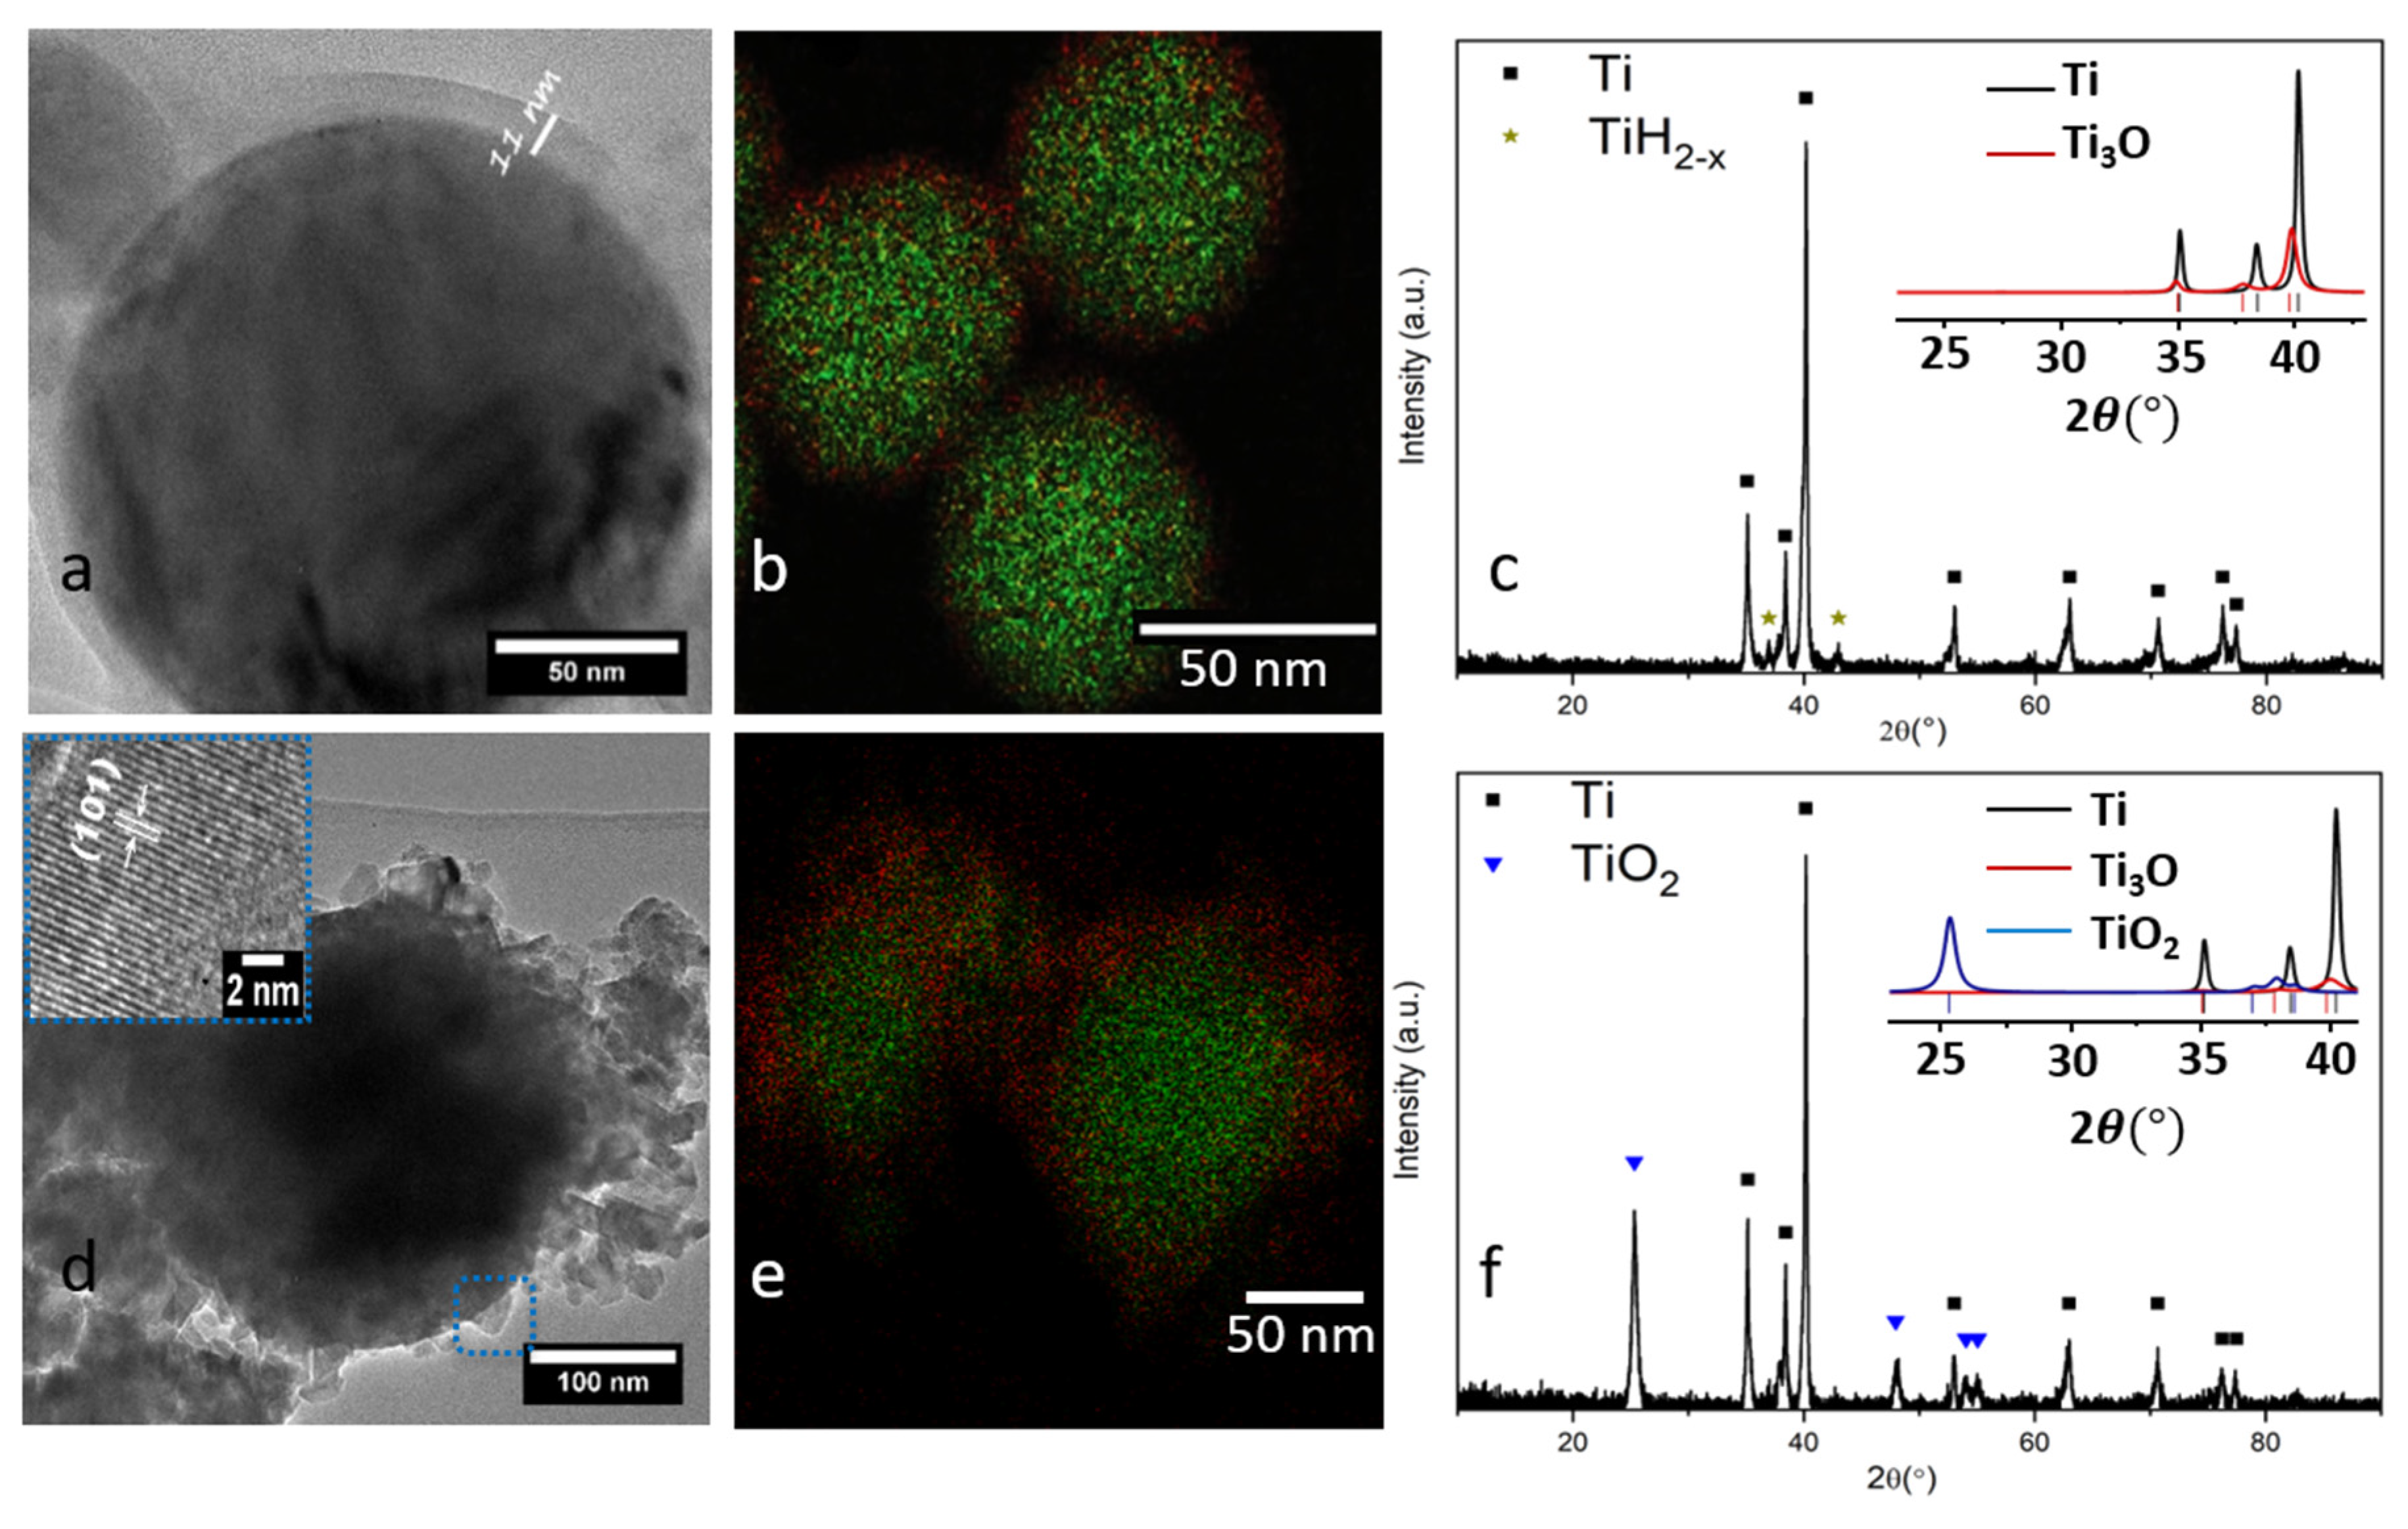
2.1. Structural, Chemical and Optical Properties of Ti0 and Ti@TiO2 NPs

TEM images show a quasi-spherical morphology of air-passivated Ti0 particles with an average size of around 30–150 nm without any crystals at the surface (Figure 1a). SHT treatment leads to the formation of nanocrystalline shell composed of 10–20 nm TiO2 particles (Figure 1d). The oxide layer, detected by EDX/STEM on the surface of initial Ti0 NPs, contributes to the presence of metastable Ti3O suboxide (Figure 1b), which has been proven upon Rietveld refinement of powder XRD data (Figure 1c, Table 1). On the other hand, the oxide layer on the surface of SHT treated Ti0 NPs corresponds mainly to TiO2 anatase (Figure 1d,e). Based on the phase composition shown in Table 1, we related the formation of TiO2 to the oxidation of both Ti3O (Equation (1)), and Ti0 (Equation (2)):
Ti3O + 5H2O → 3TiO2 + 5H2
Ti + 2H2O → TiO2 + 2H2
Recently, it has been reported [18] that the XPS spectrum of air passivated Ti NPs exhibits the presence of Ti0 and lower oxidation states of titanium (TiO, TixOy and Ti2O3) at the particle surface in agreement with the XRD analysis revealed the presence of titanium suboxide in Ti0 NPs. SHT treatment causes disappearance of Ti0, TiO, TixOy and Ti2O3 peaks, and the experimental XPS spectrum of Ti@TiO2 NPs can be fitted by defect-free TiO2 spectrum, indicating effective coating of metallic titanium core.
As also reported in our previous work [18], diffuse reflectance spectra for both Ti0 and Ti@TiO2 NPs exhibit a broad band in the UV-NIR spectral range corresponding to the interband transitions of metallic Ti0. The presence of TiO2 on the surface of the metallic NPs promotes the formation of a characteristic absorption peak around 298 nm. In addition, recent EIS study indicated a faster charge transfer at the interface of the particle and electrolyte for Ti@TiO2 compared to Ti0 NPs. In general, the presence of TiO2 enhances the charge transfer in such materials, which explains the higher photocatalytic activity of Ti@TiO2 NPs compared to that of Ti0 NPs [18].

2.2. EDTA Study

2.2.1. Kinetics of Photocatalytic EDTA Degradation

Degradation of EDTA under the white light of Xe lamp was studied in the presence of both air passivated Ti0 and Ti@TiO2 NPs under two different gas atmospheres Ar and Ar/20% O2. The kinetics of EDTA photocatalytic degradation tends to vary based on the choice of the catalyst, gas atmosphere and bulk temperature. Regardless of the chosen experimental conditions, all kinetic curves related to the photocatalytic degradation of 5 mM EDTA solution are fitted with the zero-order kinetic model. We have chosen this model in agreement to the previous study of EDTA photocatalytic degradation in the presence of TiO2 upon which the profiles for the time course of EDTA degradation at different concentrations were linear in the range of 3 to 5 mM [15].
The significant degradation of EDTA in the presence of Ti@TiO2 NPs was proven possible only when operating under Ar/20% O2 atmosphere (Figure 2a). Using Ar leads to a very low change in EDTA concentration throughout the 4 h of light treatment (Figure S1). Therefore, oxygen is a crucial factor for the efficient photocatalytic EDTA degradation process. The rate of photocatalytic EDTA degradation tends to increase within the increase of the reaction temperature: 3.6 ± 0.9 µmol L−1·min−1 at 40 °C, 5.8 ± 0.3 µmol·L−1·min−1 at 60 °C and 12 ± 0.1 µmol·L−1.min−1 at 80 °C. On the other hand, the rate of EDTA oxidation recorded with Ti0 NPs (Figure S2a) at 60 °C in Ar/20% O2 (1.62 ± 0.3 µmol·L−1.min−1) is approximately 4 times smaller than that recorded with Ti@TiO2 in the presence of Ar/20% O2. It is noteworthy that the photothermal effect in the process of EDTA degradation is somewhat similar to what was observed for the photocatalytic H2 production with Ti@TiO2 photocatalyst [18]. In contrast to EDTA degradation, the kinetics of TOC removal (Figure 2b) shows only a small decrease of ≤ 5%, indicating accumulation of intermediate products during EDTA photocatalytic degradation.
The stability of Ti@TiO2 catalyst was evaluated by measurements of Ti ionic species in solution after the photocatalytic experiment using ICP-OES analysis. Table 2 shows the high stability of Ti@TiO2 catalyst in the entire temperature range studied.

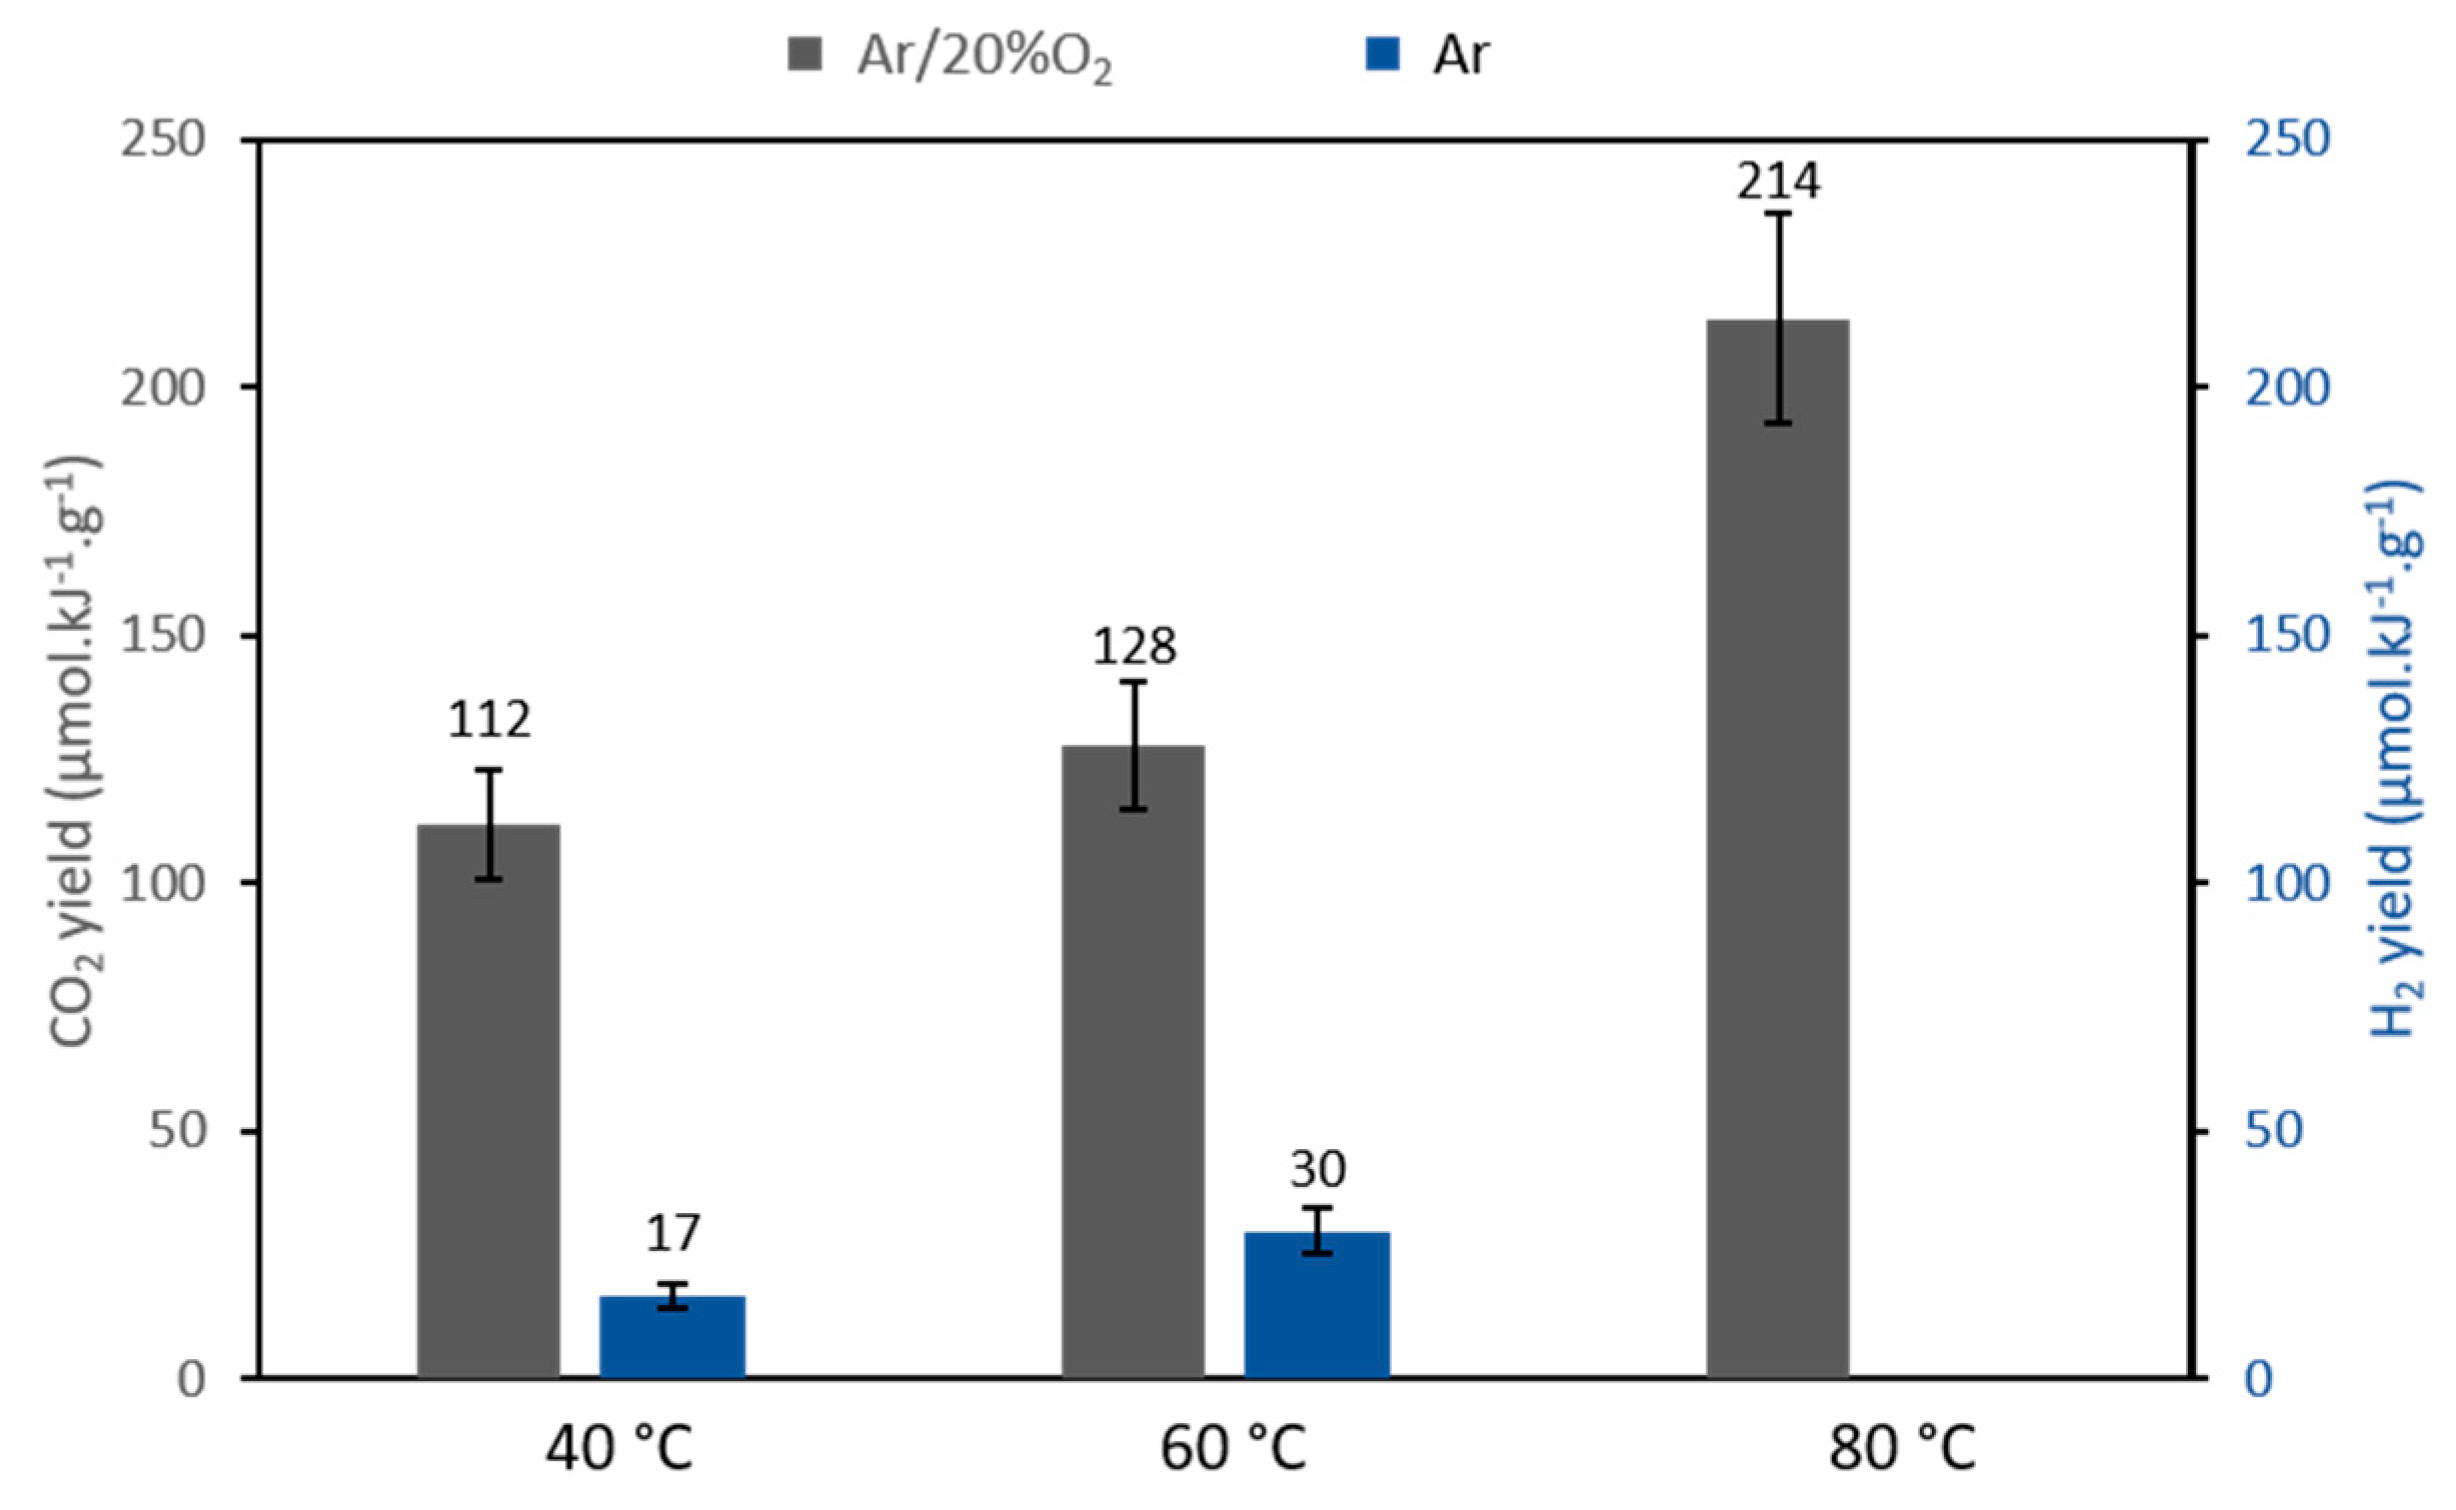
2.2.2. Gaseous Products Formation upon Photocatalytic EDTA Degradation

The photocatalytic degradation of EDTA in the presence of Ti@TiO2 NPs and Ar/O2 gas mixture is accompanied only by CO2 release (Figure S3) and hydrogen formation is not observed in this case. In pure Ar, some CO2 and H2 are formed in almost equal amounts (Figure S4). No significant release of CO2 gas is observed when using Ti0 NPs as the photocatalyst in Ar/O2, which agrees with the low EDTA degradation rate (Figure S2b). As shown in Figure 3, the calculated CO2 yields increases ca. 2 times when the bulk temperature increases from 40 to 80 °C confirming photothermal effect in studied system. The percentage of CO2 released within the temperature range 40 to 80 °C are estimated from TOC curves (Figure 2b) to be between 2 to 5.8% of the initial EDTA content while that calculated from the CO2 emission curves (Figure S3) is between 3.2 to 6%. It is worth noting that the pH increases from 4.6 to 5.8, 5.9 and 6.2 at 40, 60, and 80 °C, respectively during 4 h of photocatalytic process. As for sonochemical and sonocatalytic EDTA degradation, the increase of pH can be related to the reaction of reducing superoxide anion O2· (Equation (9)) with EDTA yielding tertiary iminium Schiff bases, which rapidly hydrolyses into aldehydes and strongly basic secondary amines [19]. Formation of H2 in pure Ar most likely can be attributed to the photocatalytic water splitting with EDTA as an electron hole scavenger. In the presence of O2, hydrogen atom produces oxidative HO2· radical as it will be discussed below.

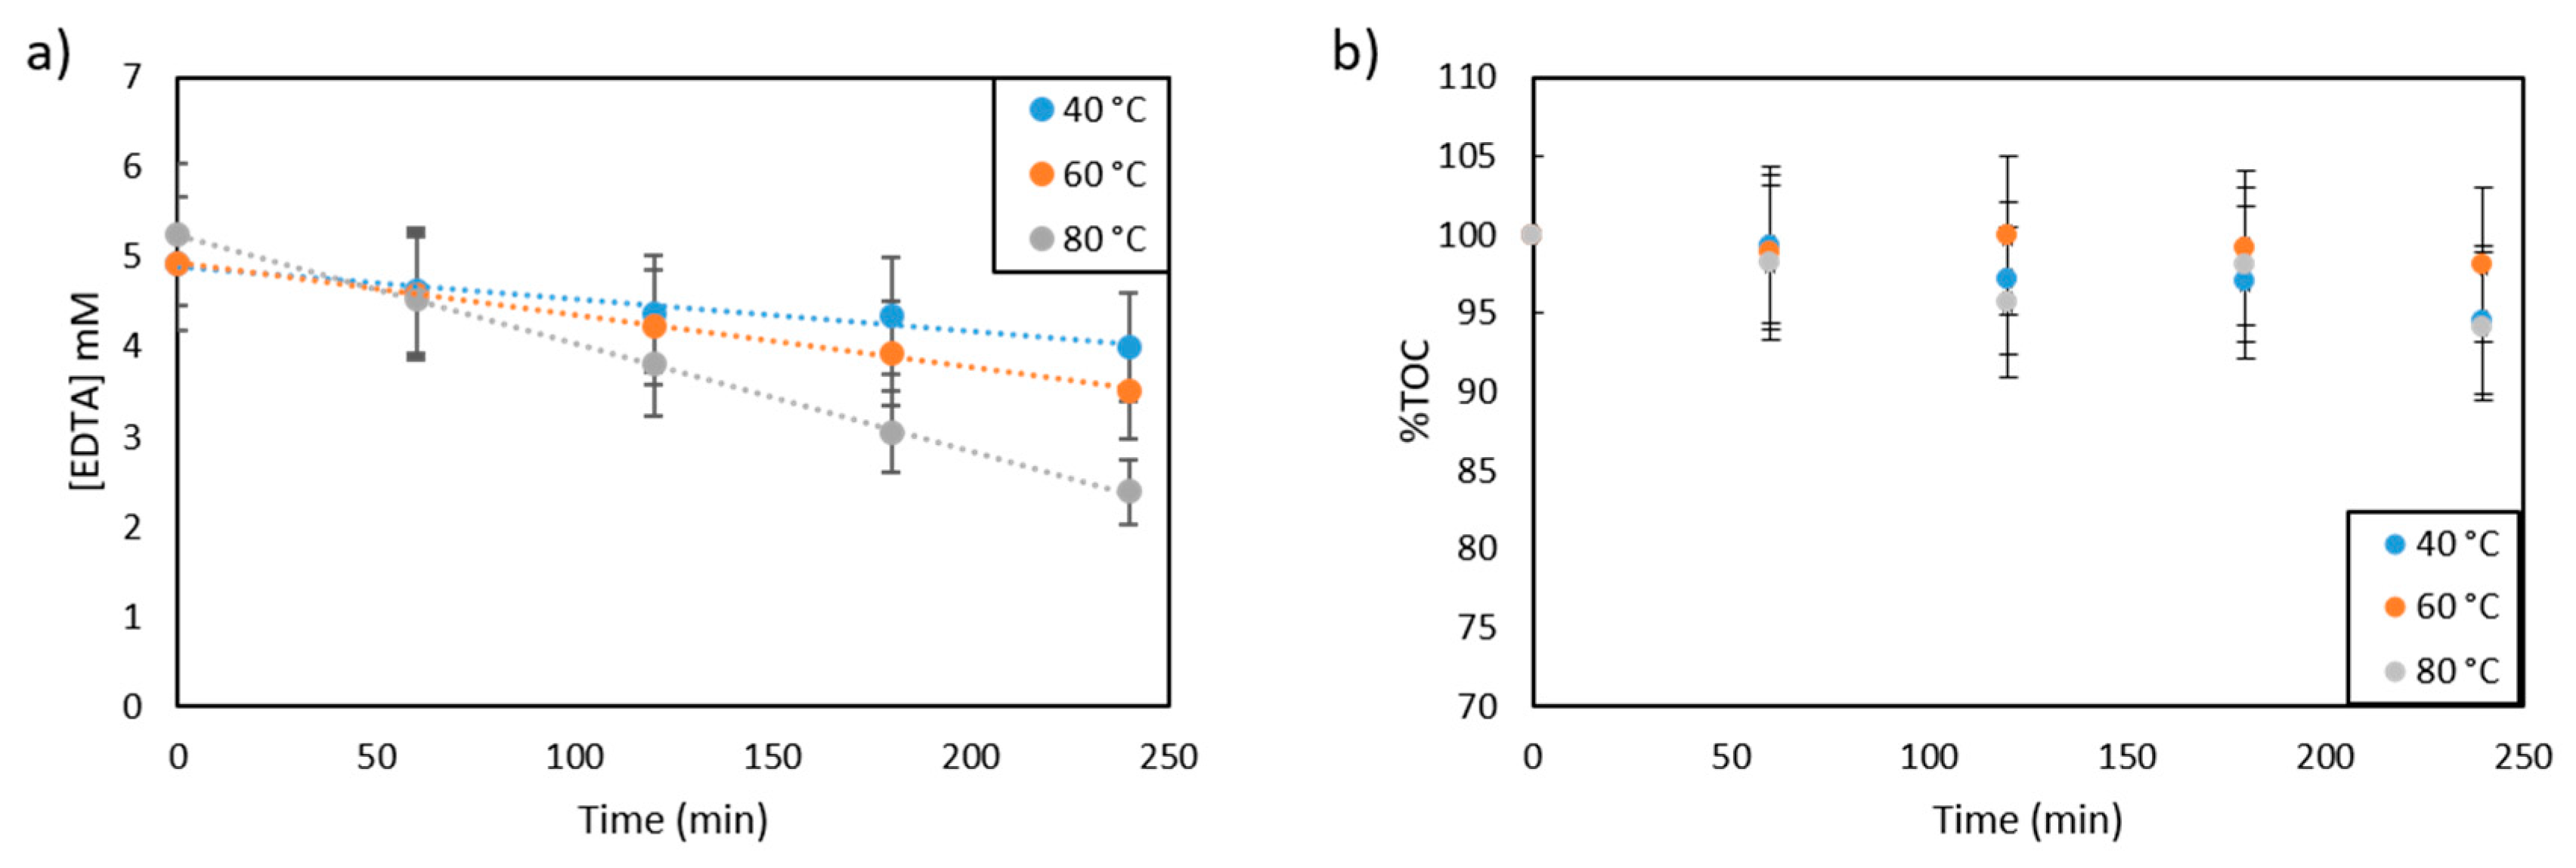
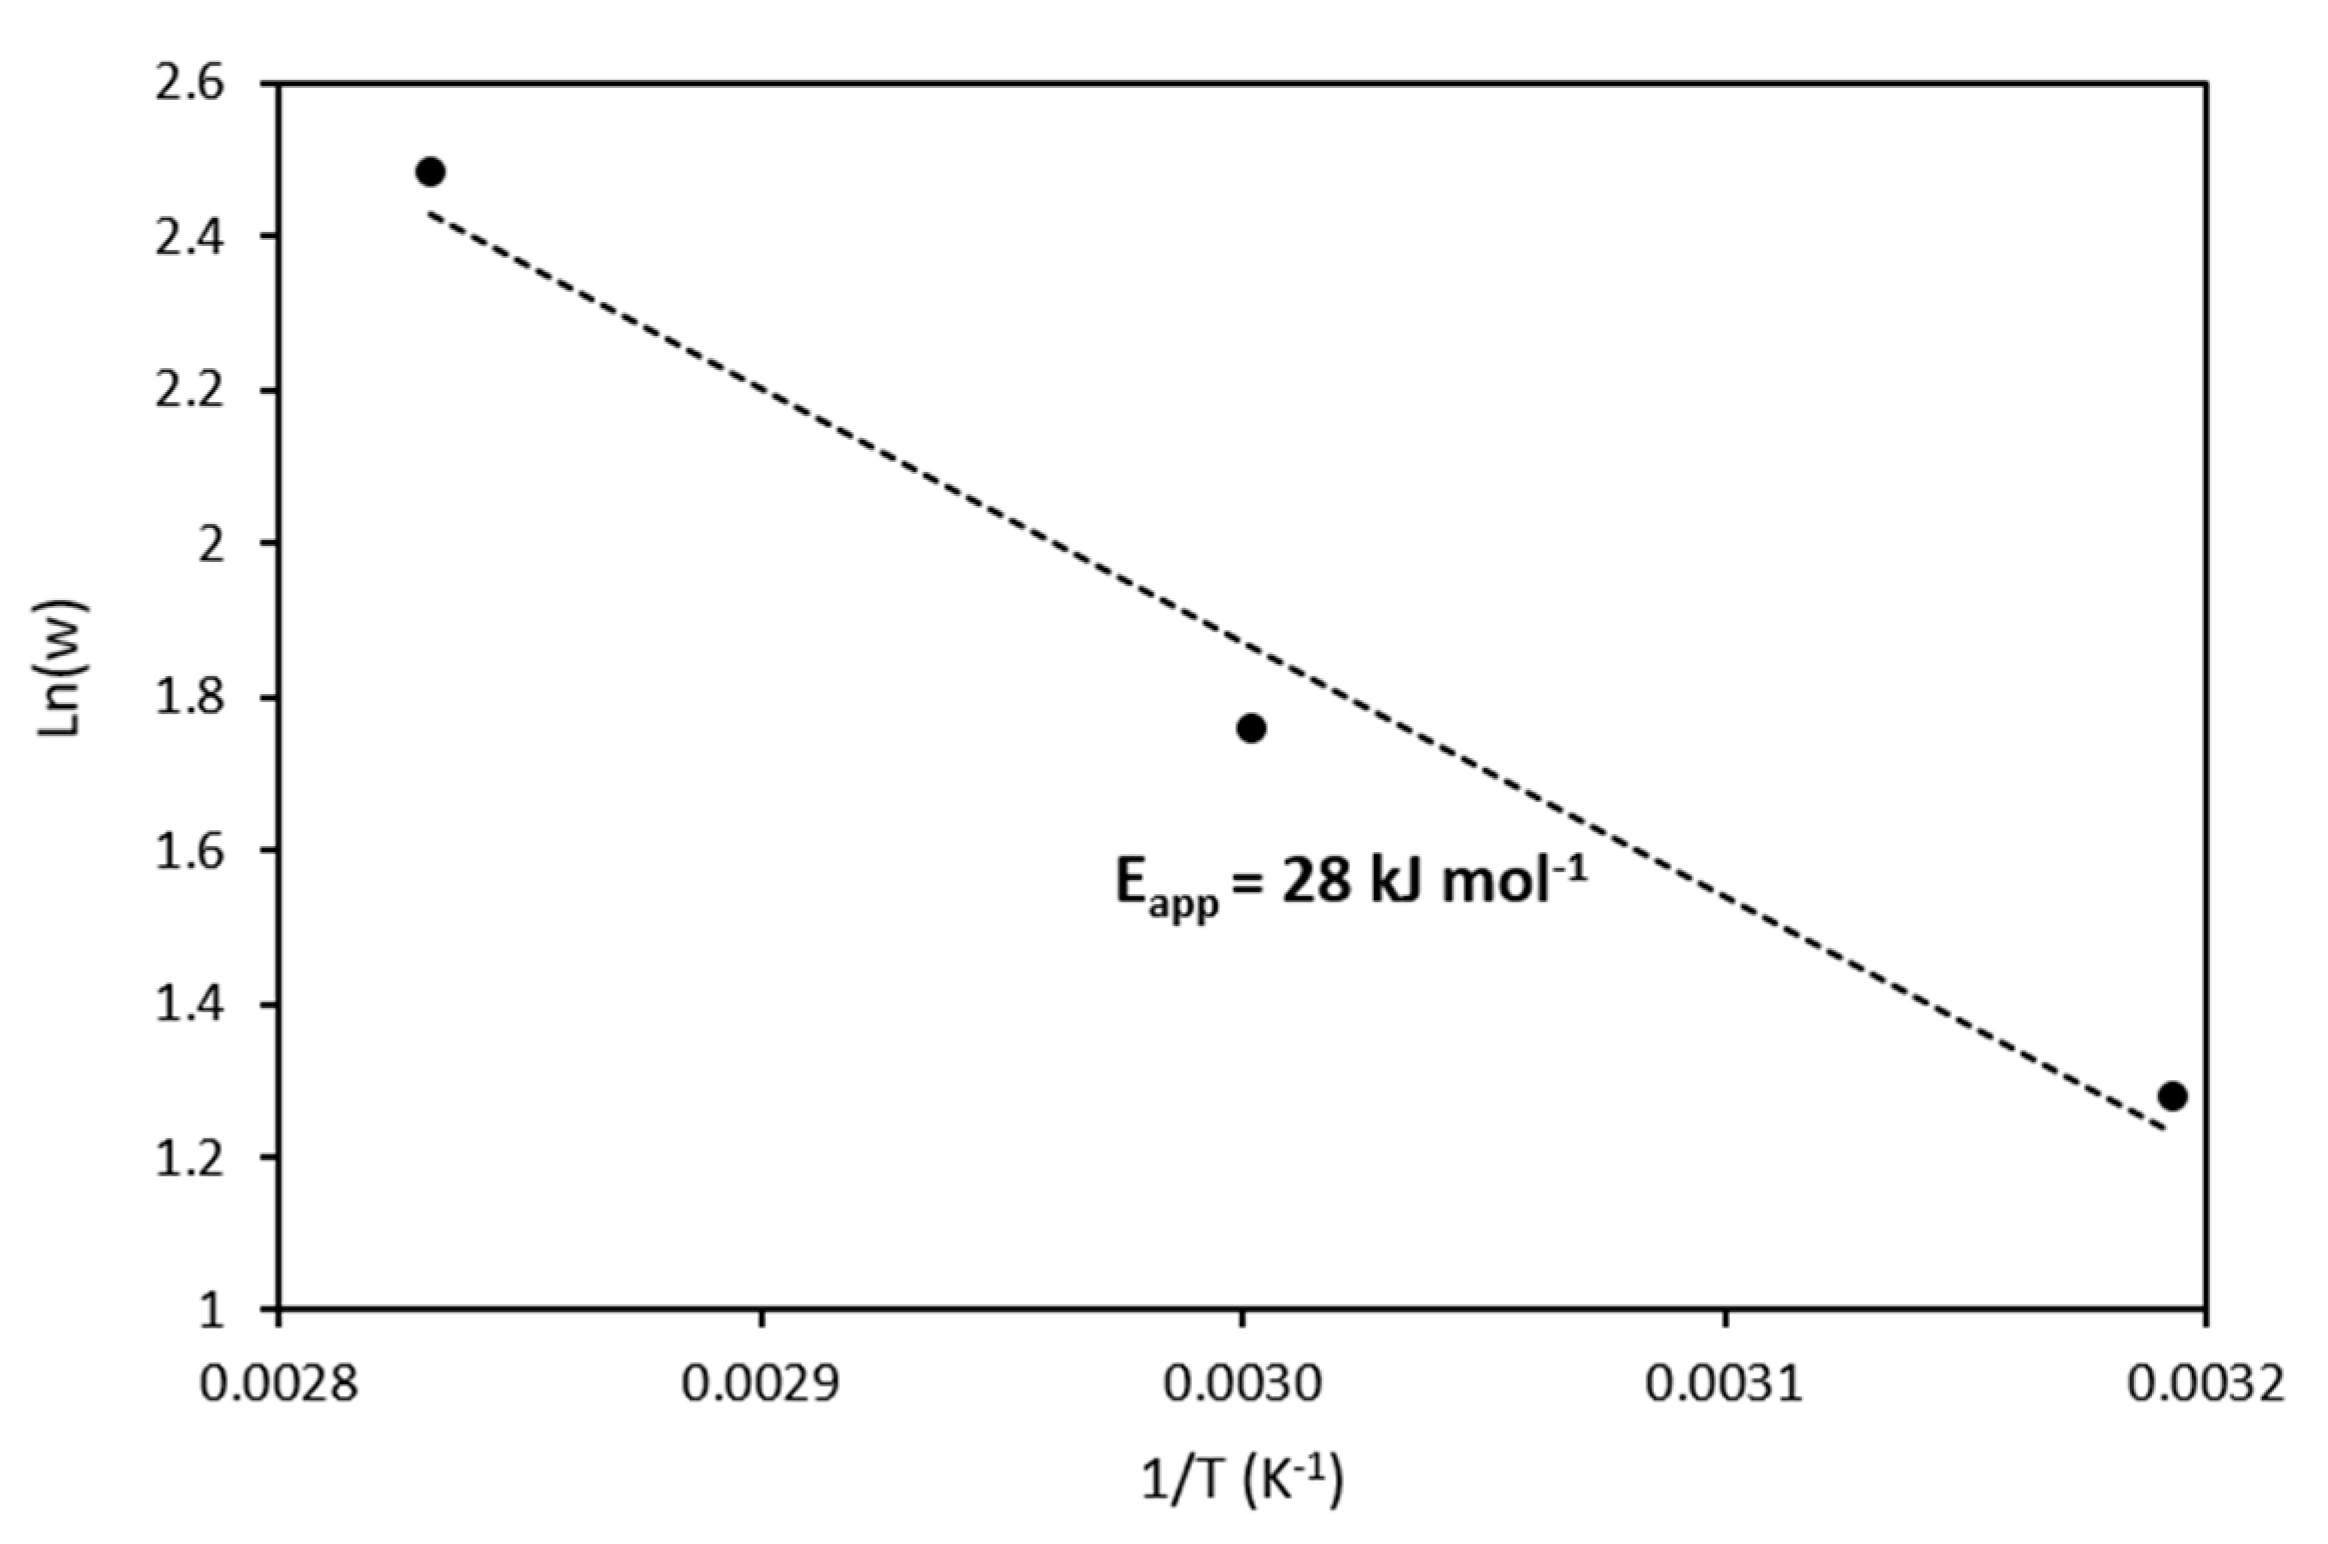
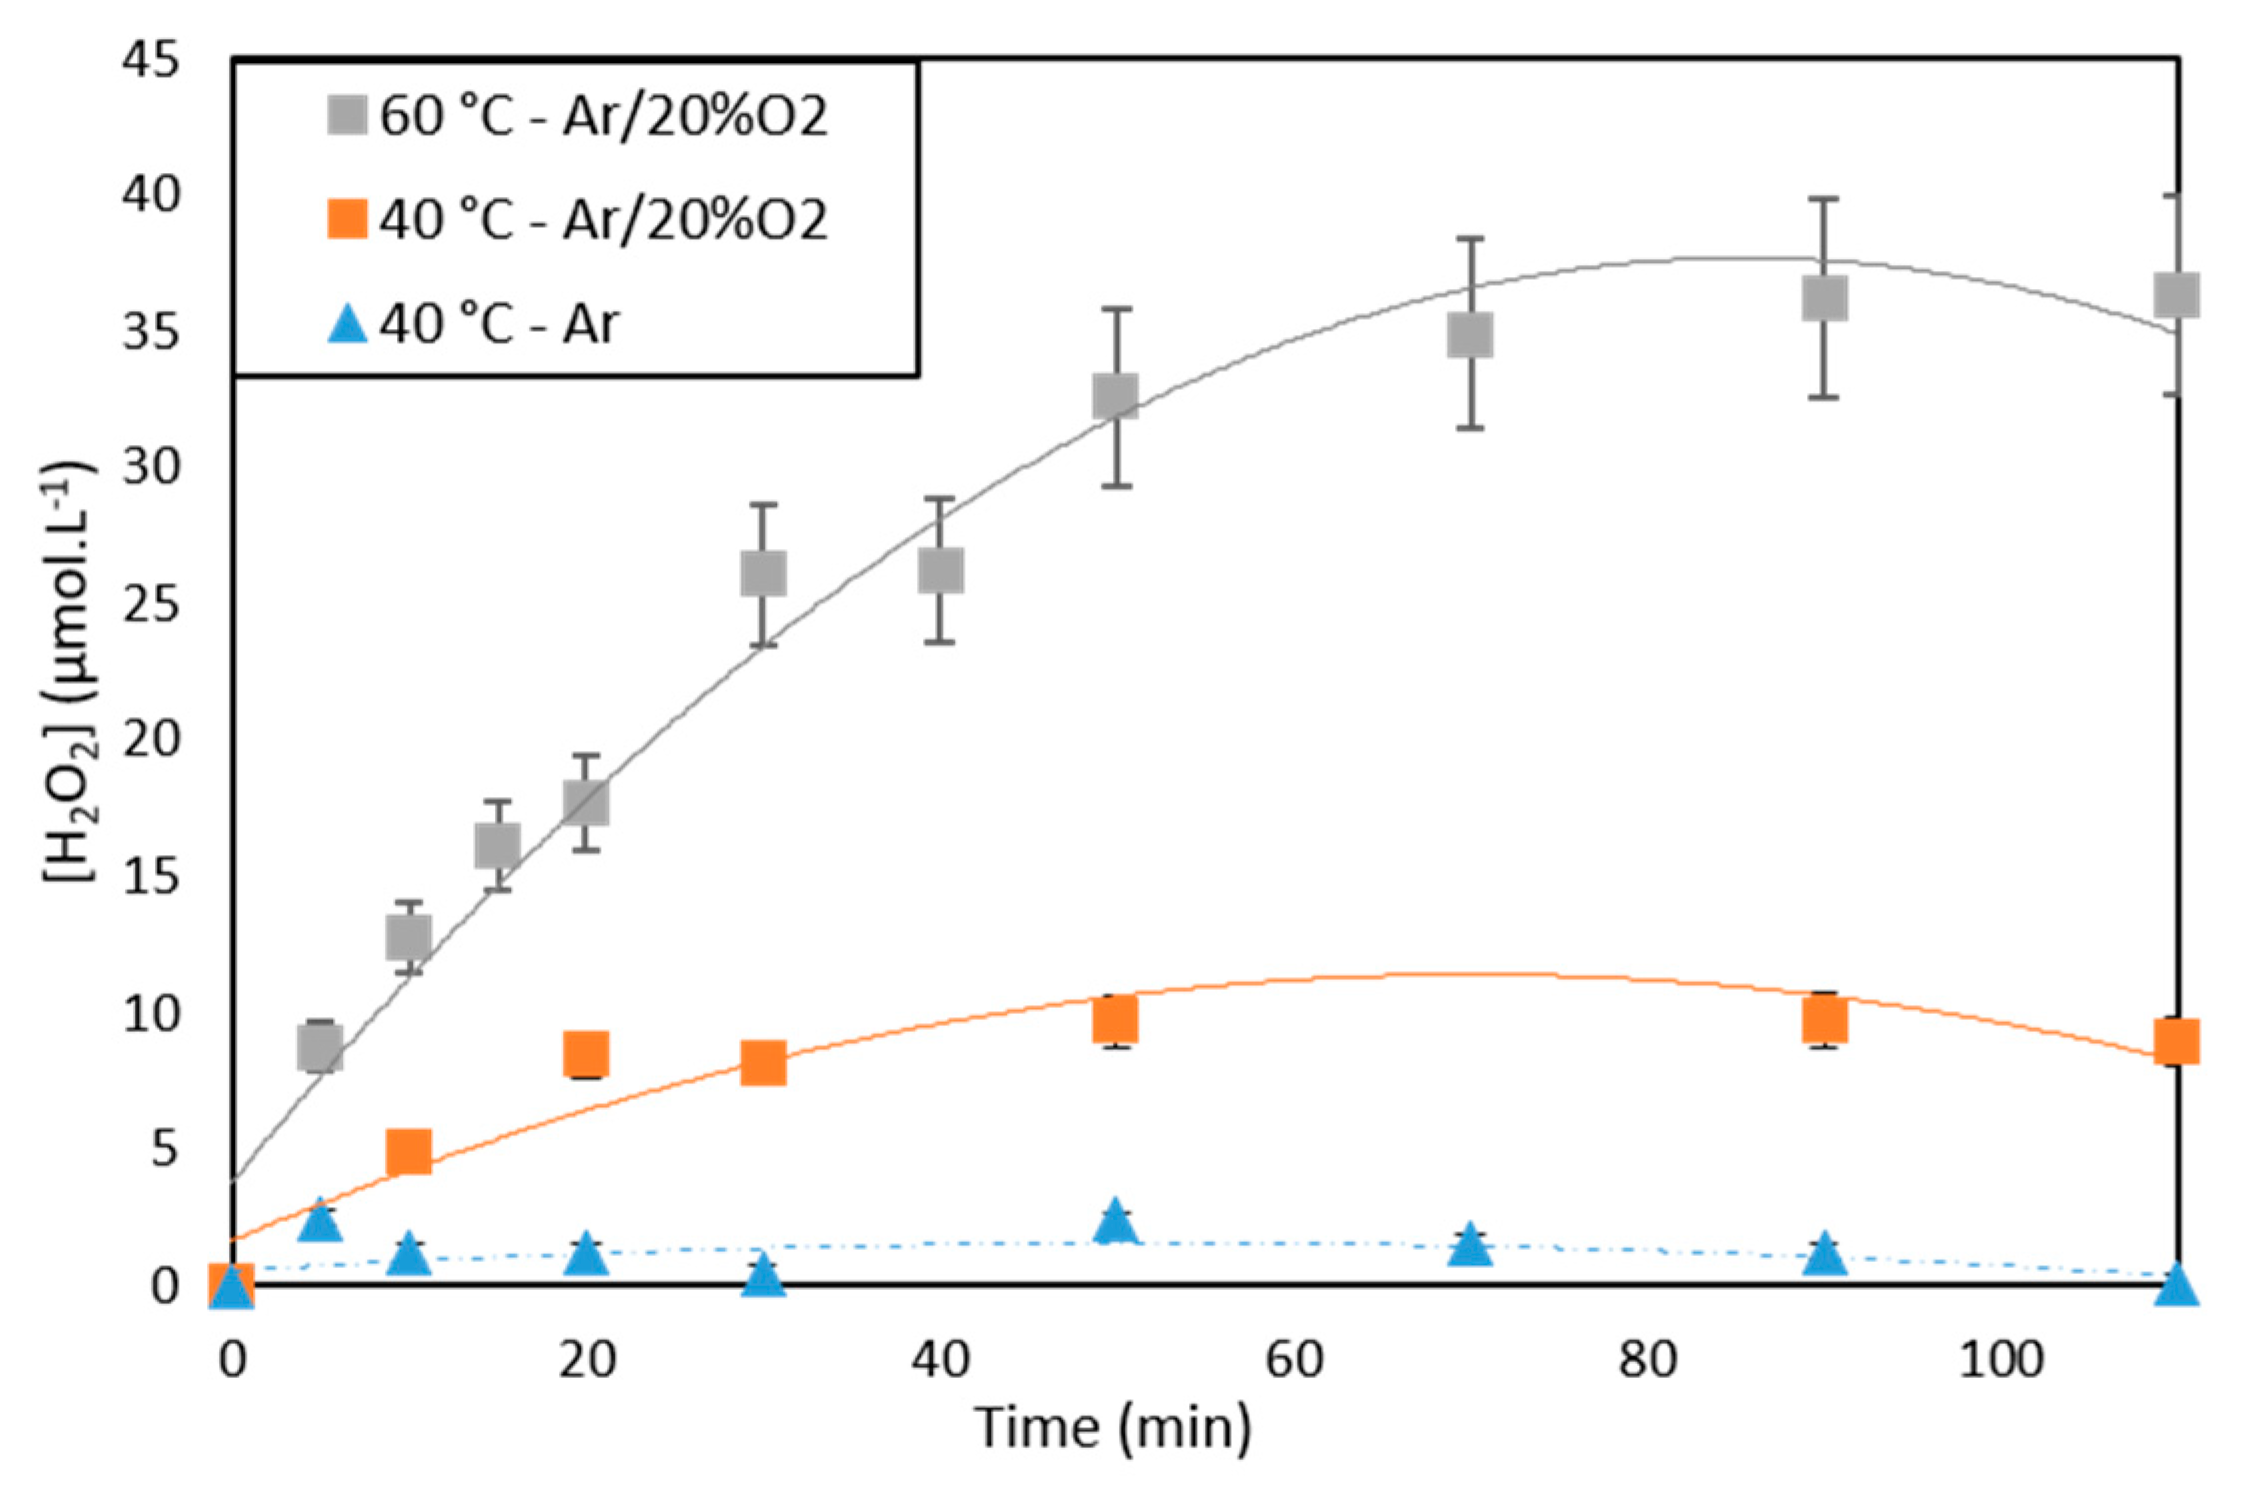
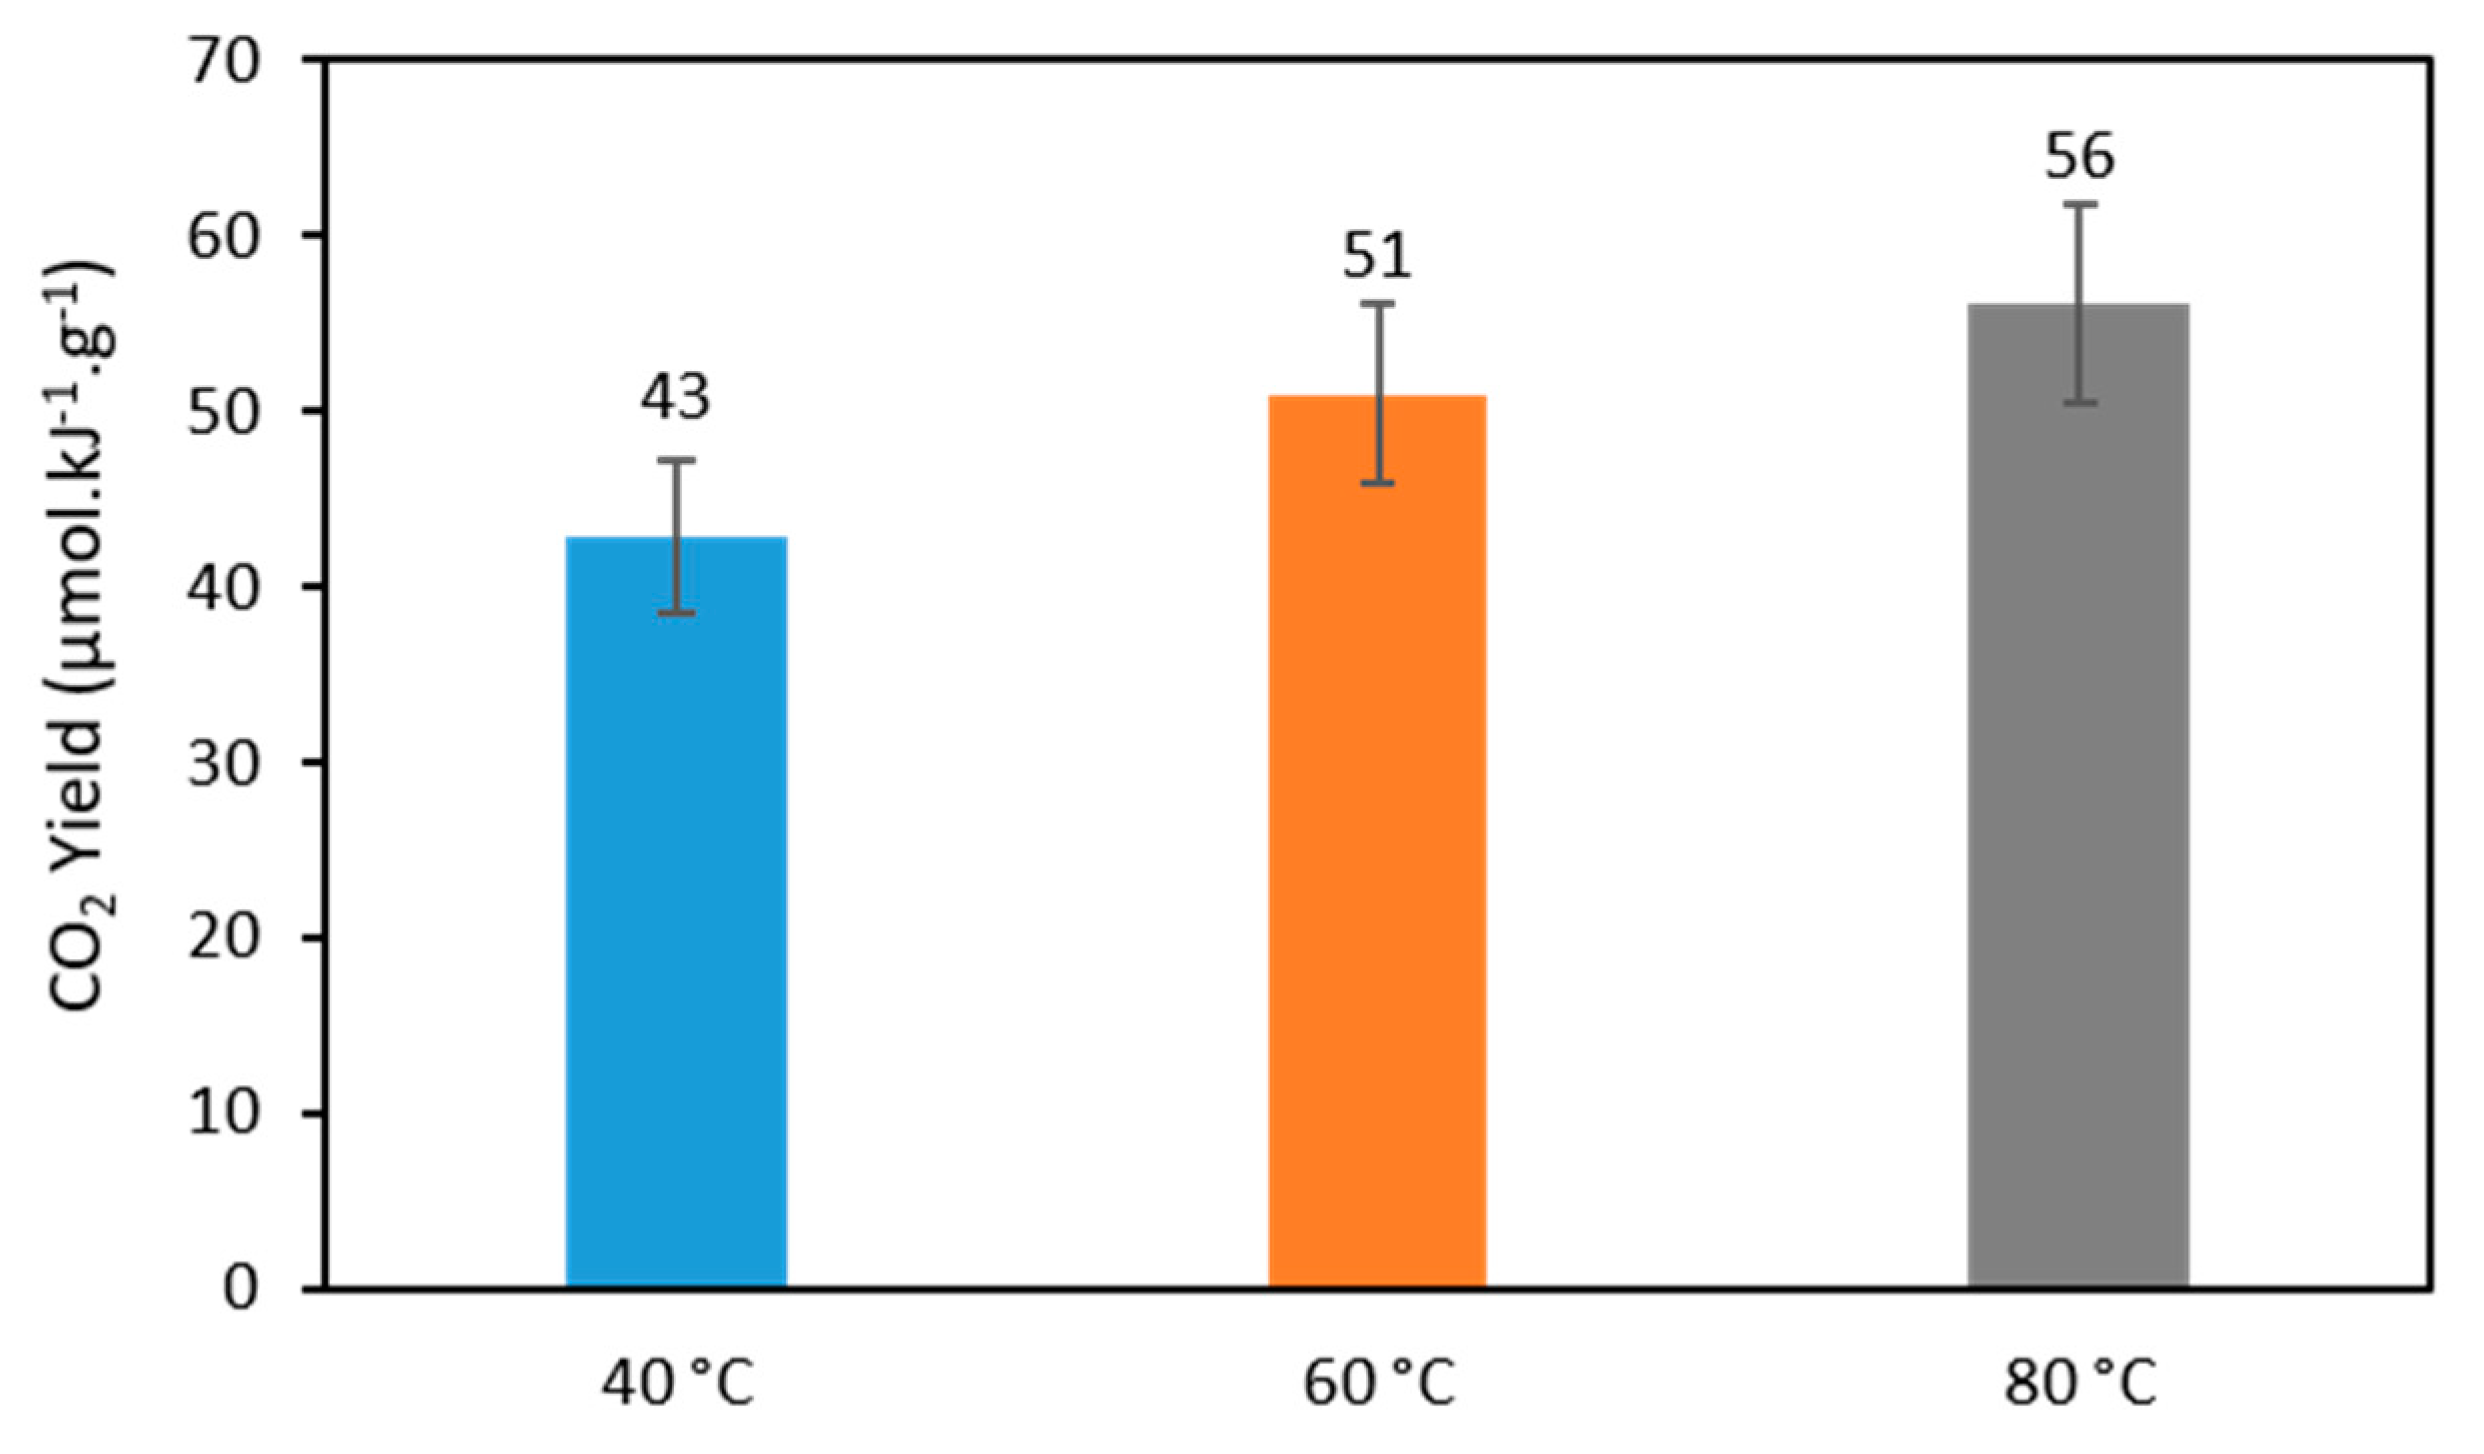
2.2.3. Effect of Temperature

Arrhenius plot for EDTA photocatalytic degradation is shown in Figure 4. The apparent activation energy Eact equal to 28 ± 8 kJ.mol−1 is quite similar to that of other photocatalytic processes studied with Ti@TiO2 NPs, and assigned to the diffusion of chemical species at the catalyst surface, rather than to the activation of the chemical bonds [20]. On the other hand, sonocatalytic EDTA degradation with the same catalyst shows very low temperature effect (Eact = 5.0 ± 1.2 kJ·mol−1) [18], indicating essential difference in the reaction mechanisms of photocatalytic and sonocatalytic processes.

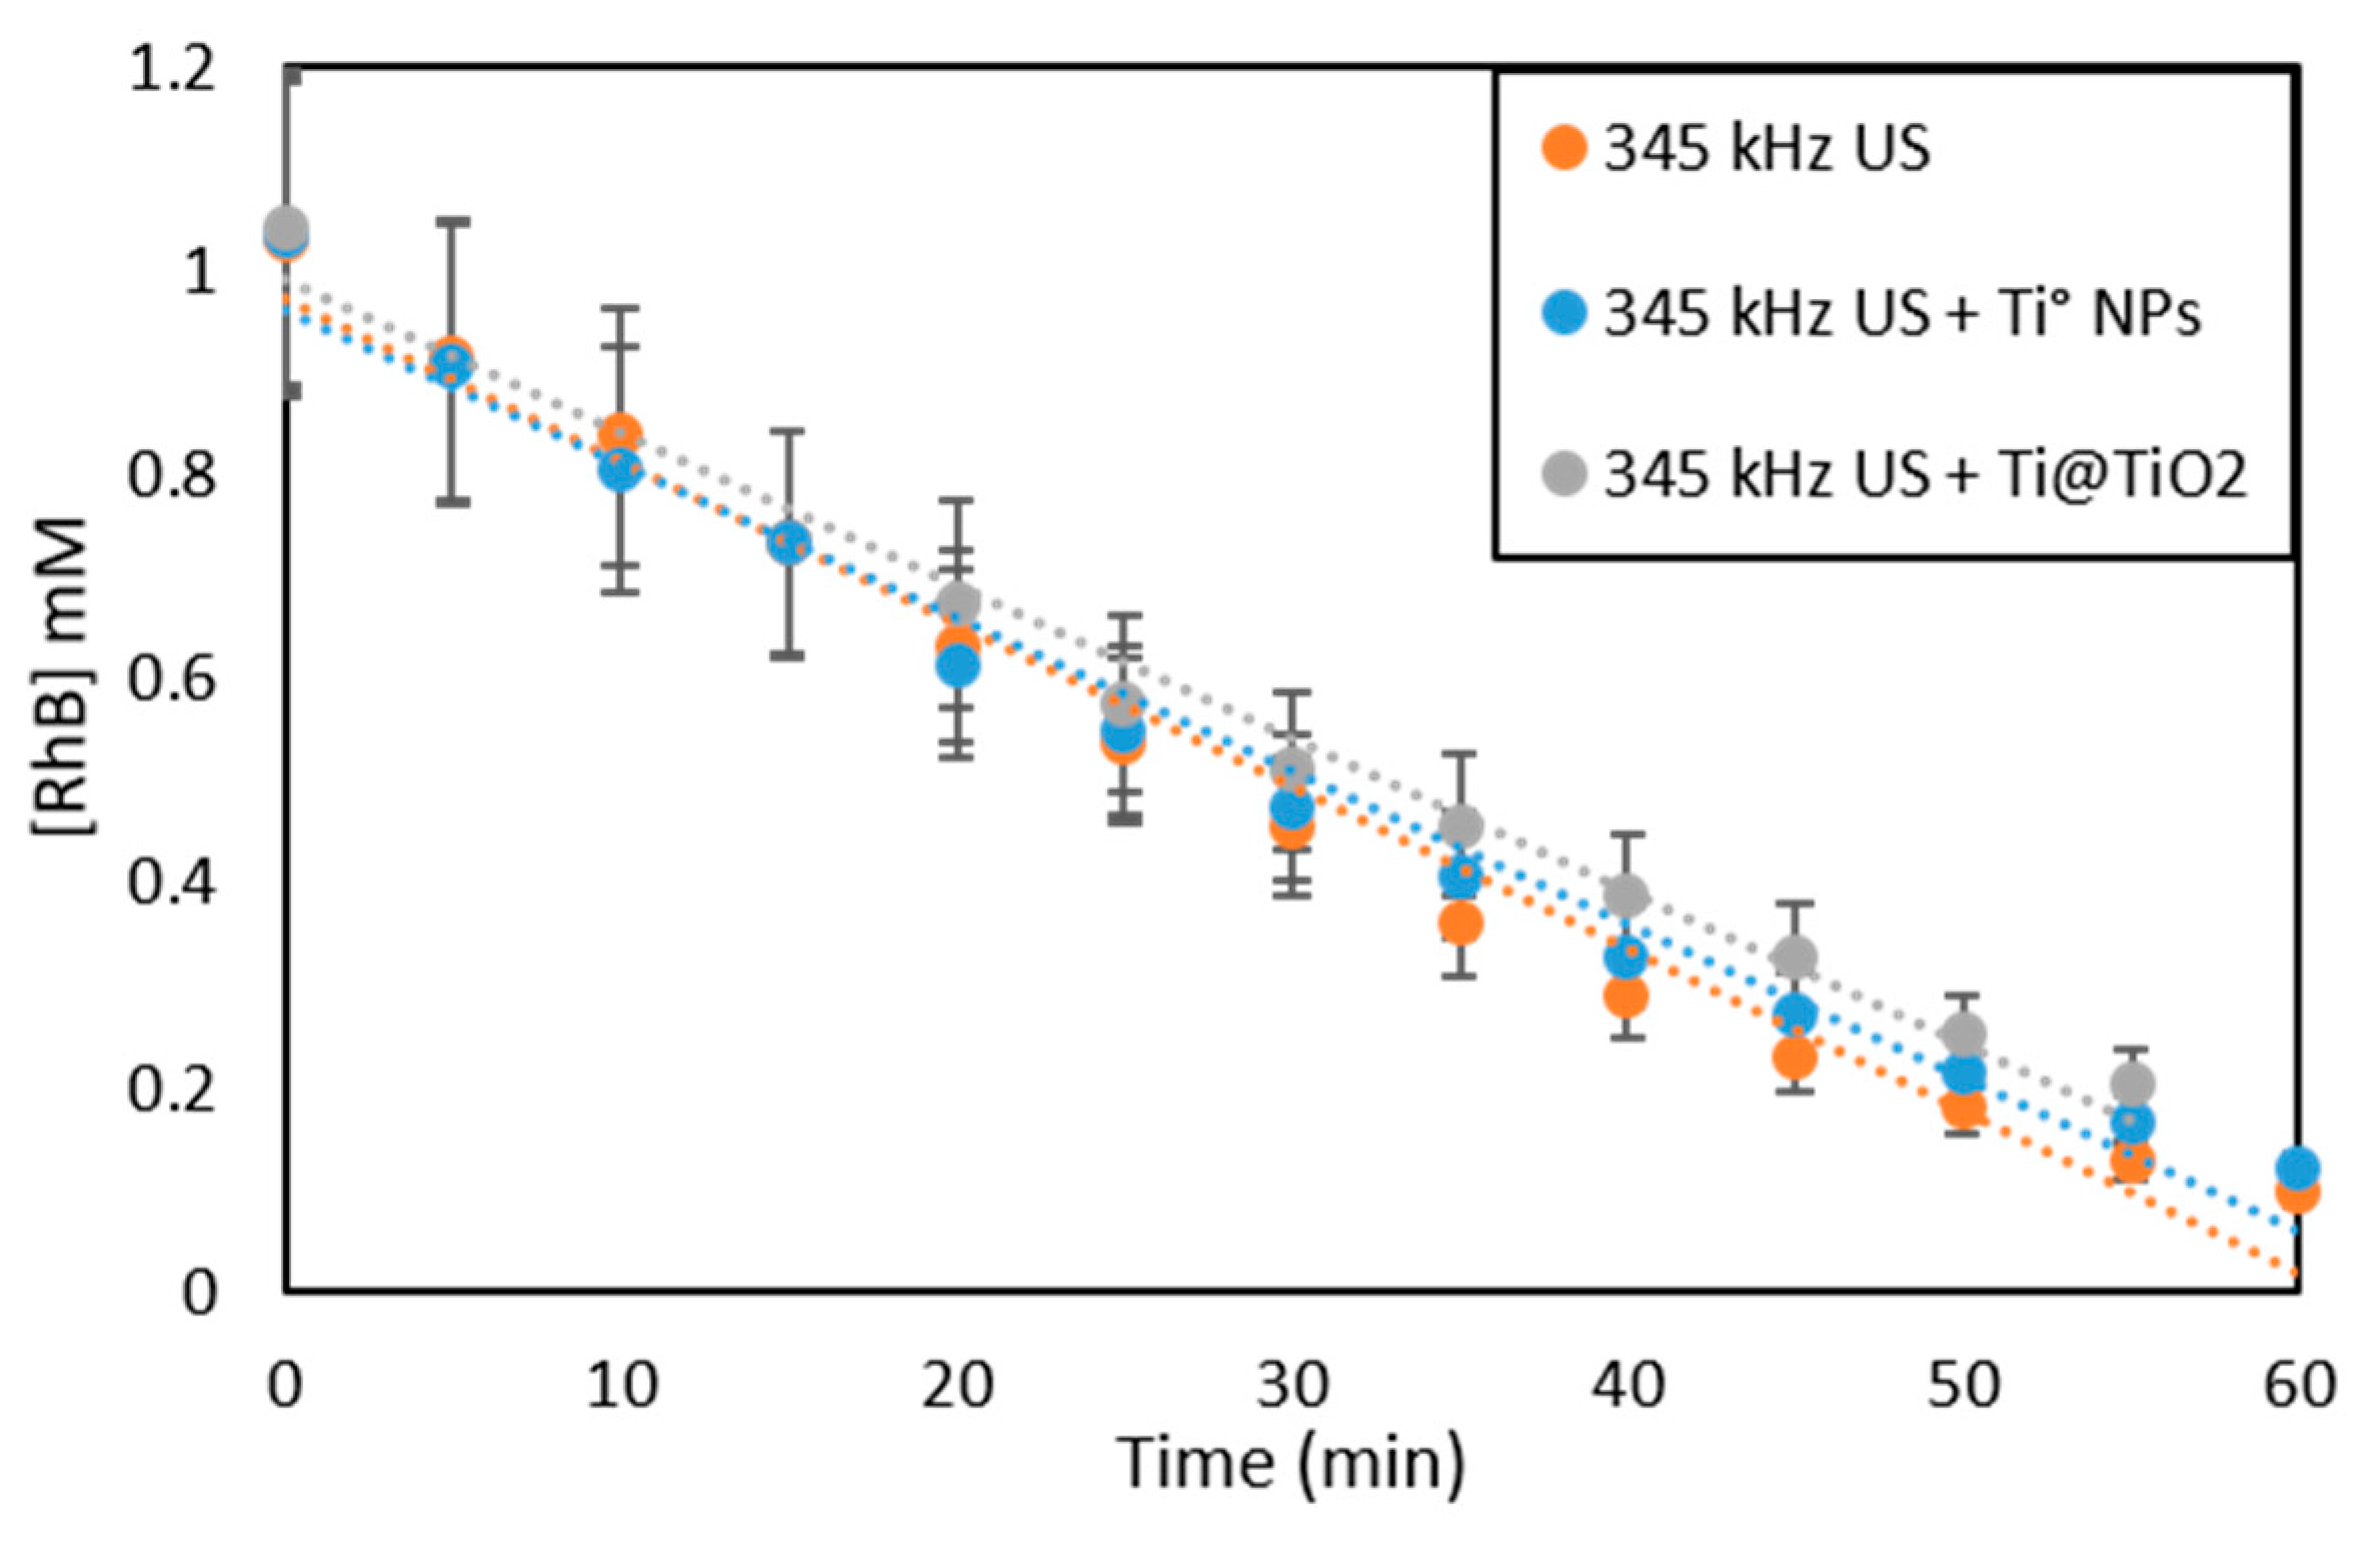
2.2.4. Comparison of Sonocatalytic and Photocatalytic EDTA Degradation

In this section, we compare the photocatalytic EDTA degradation studied in this work in the presence of Ar/O2 gas mixture and the sonocatalytic EDTA degradation reported recently at similar conditions [17]. The overall efficiency of photocatalysis and sonocatalysis can be evaluated upon comparing the yield of EDTA degradation, Y, using the following equation: Y = M∙P−1∙m−1, where M is the amount of degraded EDTA (μmol), P is the energy consumption (kJ), and m is the mass of catalyst (g). From the calculations summarized in Table 3, one can conclude that photocatalyisis over Ti@TiO2 NPs is much more efficient towards EDTA degradation than sonocatalysis with Ti@TiO2 and Ti0 NPs. On the other hand, Ti0 NPs show better sonocatalytic performance compared to that of photocatalysis.
The mechanism of EDTA sonocatalytic degradation with Ti0 and Ti@TiO2 NPs reported previously involves the degradation of EDTA by hydroxyl (OH), hydroperoxyl (HO2·) and superoxide (O2) radicals in solution and bubble/solution interface or by the catalytic degradation of EDTA at the surface of the catalyst (Ti or Ti@TiO2) by oxygen activated initially by the power US at the surface of titanium [17]. It was reported that sonocatalytic EDTA degradation yields several intermediate products shown in Figure S5a [21]. On the other hand, photocatalytic EDTA degradation process is initiated upon photon absorption by Ti@TiO2 NPs in a similar manner reported previously for the photothermal production of H2 using the same catalyst [18]. The photocatalytic mechanism can be expressed by Equations (3)–(10):
Ti@TiO2 + EDTA ⇄ Ti@TiO2·EDTA
Ti@TiO2·EDTA + hν → [e−Ti@TiO2h+]·EDTA
EDTA + 2h+ → Degradation products + 2H+
H2O + h+ → OH + H+
OH· + EDTA → Degradation products
e+ O2 → O2
O2 + H+⇄ HO2·, pKa = 4.8
HO2· + EDTA → Degradation products
After the electron-hole separation step (Equation (4)), the photogenerated hole (h+) can oxidize EDTA molecules directly into the degradation products (Equation (5)) or it can initially convert H2O molecules into hydroxyl radicals (OH·), which in return, oxidize EDTA molecules [22]. In the presence of O2 adsorbed at the surface of catalyst, the photo-generated electons would yield superoxide anion-radicals (O2 Equation (8)), which in return, can react with EDTA [23]. On the other hand, scavenging of e- would increase the yield of electron holes leading to the enhancement of EDTA photocatalytic degradation. It is worth noting that superoxide anion-radical can be converted to HO2· radical (Equation (9)), which can oxidize EDTA (Equation (10)). Furthermore, the reaction of O2 with EDTA gives tertiary iminium Shiff-bases which rapidly hydrolyses into aldehydes and strongly basic secondary amines [19]. This process can explain the increase of pH during EDTA photocatalytic degradation similar to that reported for sonocatalytic process [17]. Some similarity should be mentioned in the composition of intermediates for both processes, those are iminodiacetic acid, formic acid, oxalic acid, glycolic acid and acetic acid [15,21]. The principal schemes of intermediate products formation are shown in Figure S5. Recent studies highlighted a crucial role of photogenerated h+, OH· and O2 species [24,25] for efficient photocatalytic degradation of organic pollutants in agreement with the proposed mechanism.
The photothermal effect of EDTA degradation is a major finding of this work. In a previous research, the photothermal effect in the process of H2 production over Ti@TiO2 photocatalyst has been attributed to the diffusion of intermediates formed after hole scavenger degradation [18,20]. Alternatively, the improved photocatalytic degradation of EDTA at higher temperatures in Ar/O2 atmosphere can also be related to the higher concentration of OH· and HO2· radicals produced. To verify this assumption, we studied the formation of H2O2 during photocatalytic treatment of aqueous solutions saturated with Ar or Ar/O2 over Ti@TiO2 NPs at different temperatures. H2O2 is a stable product of OH· and HO2· radicals recombination and can be quantified in situ as TiO(O2) complex [26]. To assess TiO(O2) measurements, photocatalytic experiments were performed using 0.02 M TiOSO4/0.25 M H2SO4 solutions and Ti@TiO2 photocatalyst in the absence of EDTA. After irradiation with Xe lamp, the samples have been withdrawn and analysed spectrophotometrically after removal of catalytic particles with PTFE filter. As shown in Figure 5, the amount of H2O2 produced in the presence of Ar atmosphere is much lower than that produced in the presence of Ar/O2 at 40 °C in agreement with kinetics of EDTA photodegradation. Moreover, the initial rate of H2O2 formation in Ar/O2 at 60 °C is ca. 2 times higher than that produced at 40 °C. This observation clearly indicates that the observed photothermal effect is related to the improvement of photogenerated radical production with the increase of bulk temperature. In addition, Figure 5 reveals a plateau of H2O2 concentration reaching upon photolysis. Perhaps this is because of Ti@TiO2 NPs photocorrosion in acid medium. Figure S6 demonstrates the increase of titanium in 0.25 M H2SO4 solution upon irradiation with Xe lamp, and the rate of metallic titanium core dissolution increases with temperature. Dissolution of titanium metal in H2SO4 leads to the formation of Ti(III), which is rapidly oxidized by H2O2. Superposition of H2O2 formation and consumption yields, finally, its steady-state concentration. It is worth noting that in the absence of light Ti@TiO2 NPs are quite stable in 0.25 M H2SO4 solution.

2.2.5. Rhodamine B Degradation

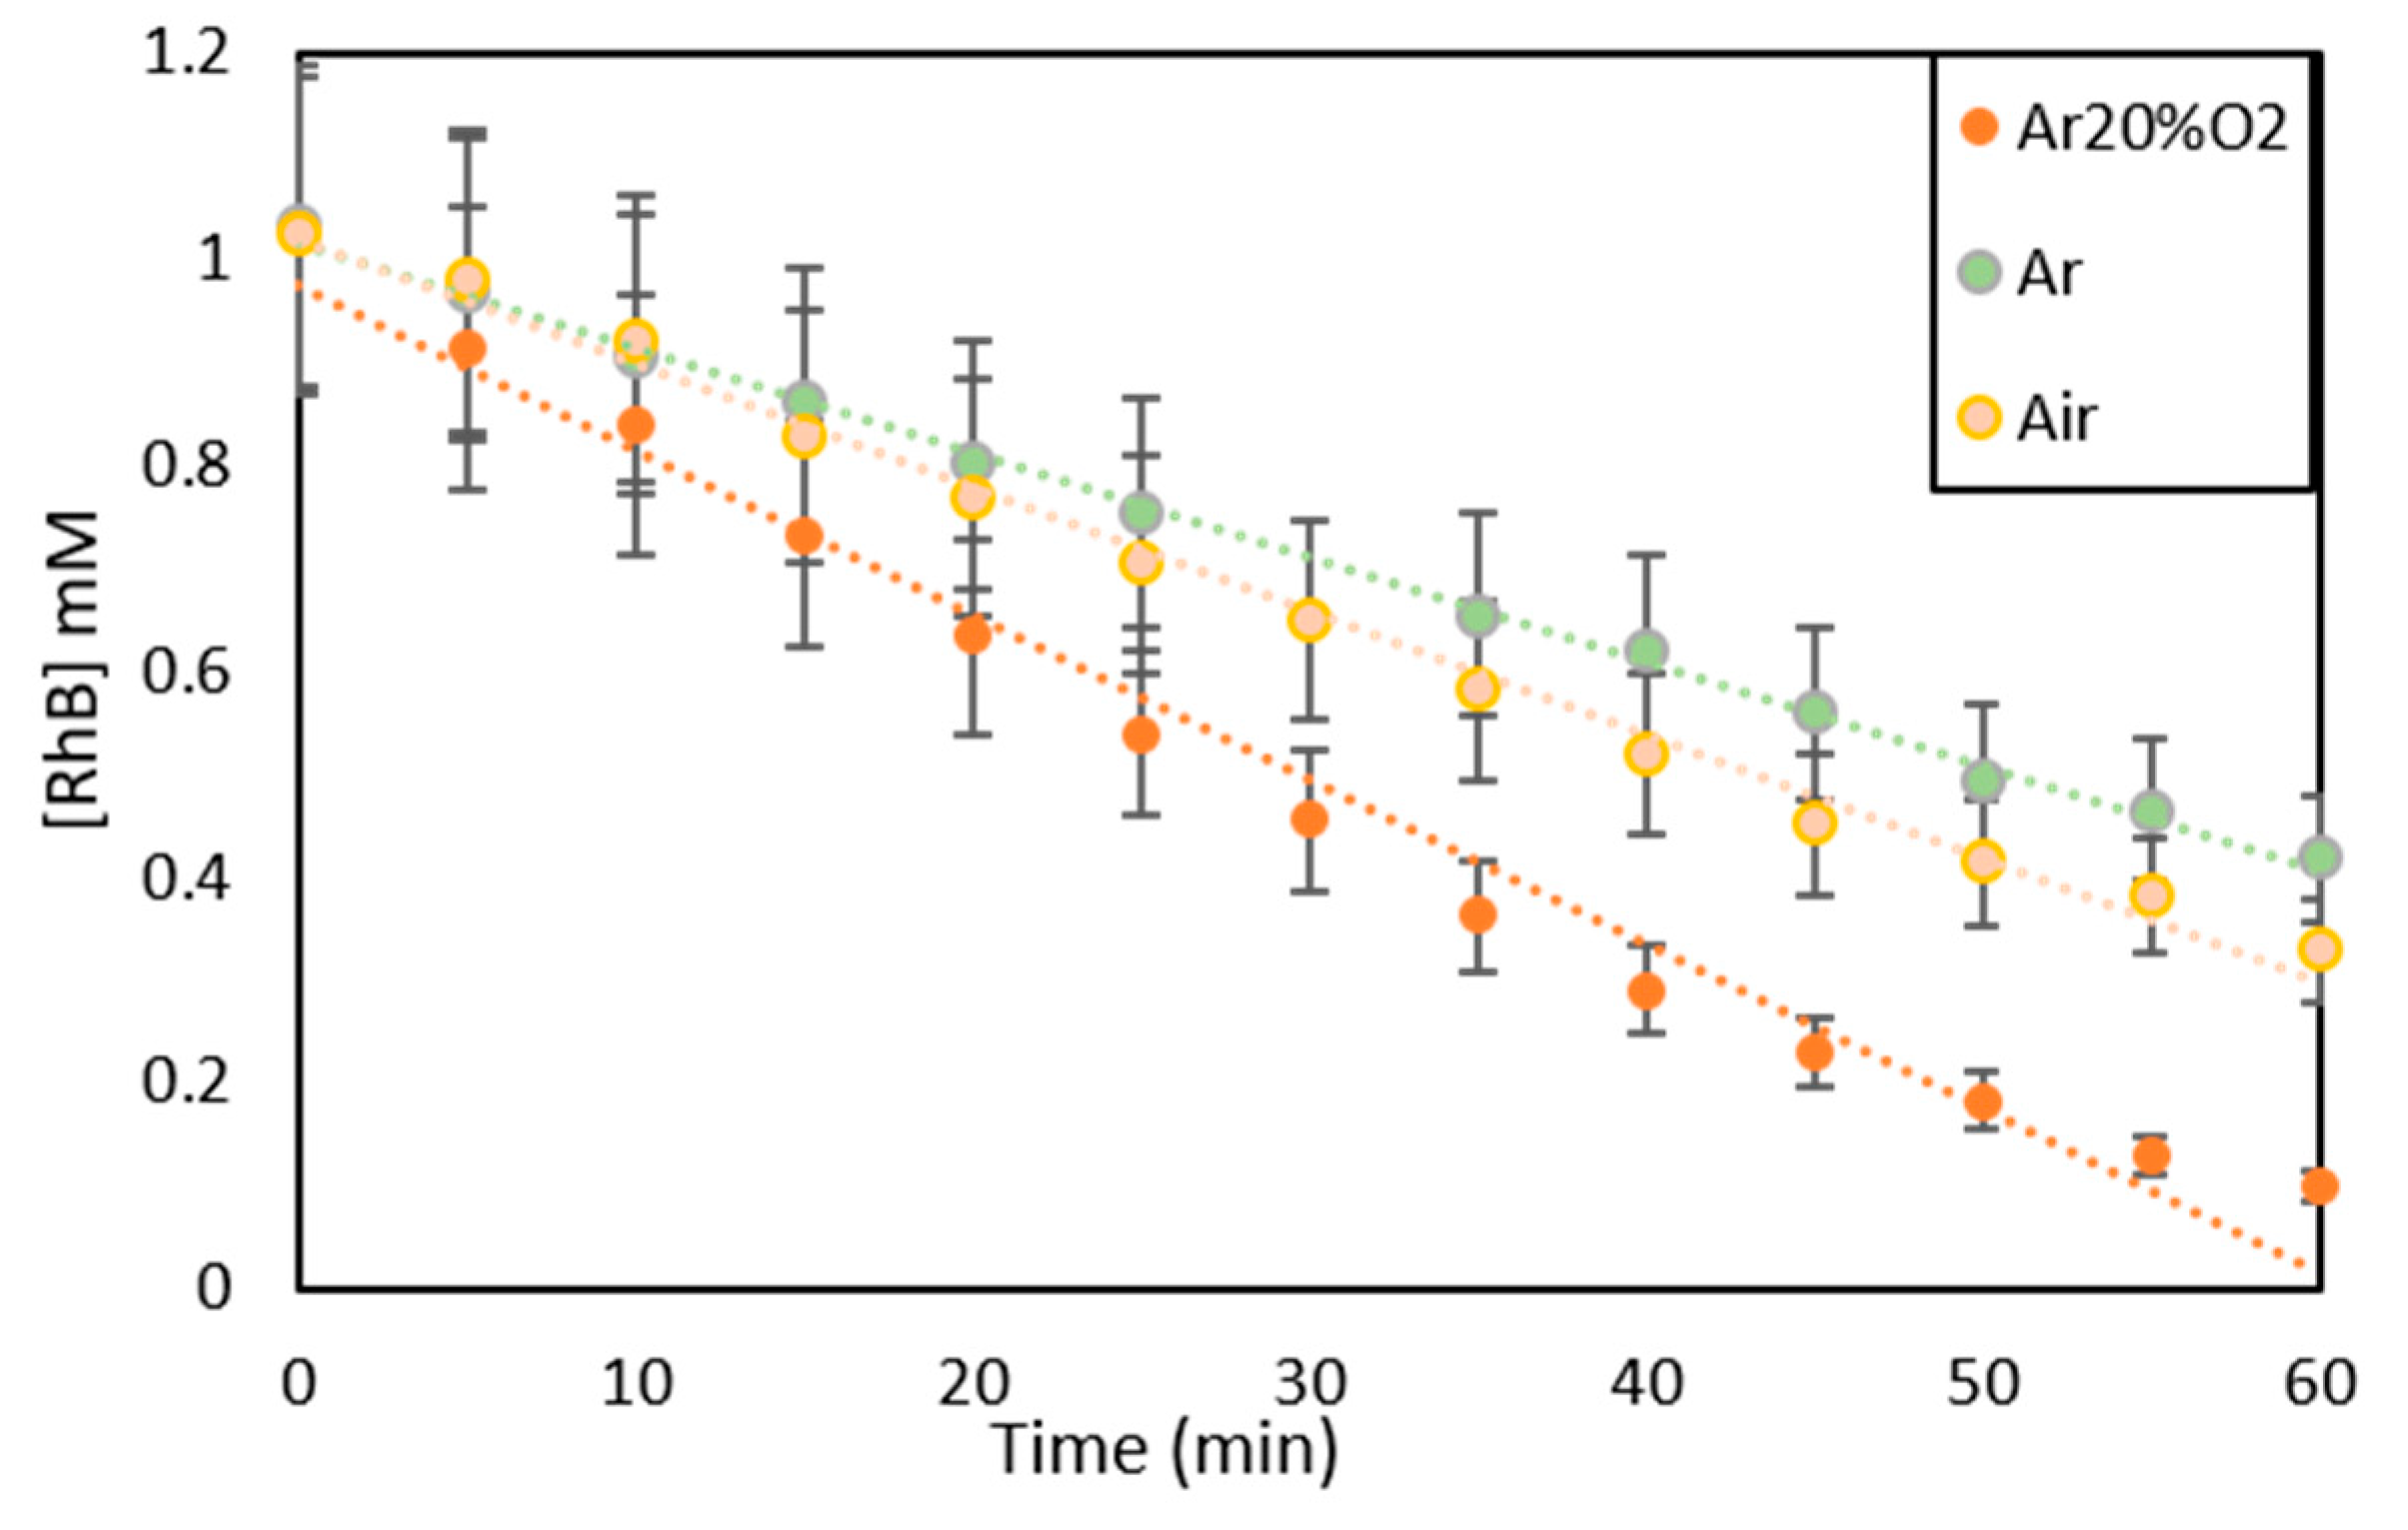
RhB Sonochemical Degradation

To evaluate the effect of 345 kHz power US on the kinetics of RhB degradation, a set of experiments have been carried out taking into account the initial concentration of RhB, the nature of the saturating gas, and the nature of catalyst.
At (RhB)0 ≤ 0.2 mM, only 15–20 min of ultrasonic treatment was sufficient for the total removal of RhB as it can be seen from the Figure S7a–d. On the other hand, at (RhB) = 1 mM (500 ppm), RhB degradation is observed over a longer time scale and follows zero-order kinetics (Figure 6). In fact, the kinetics of RhB removal is not influenced by Ti0 or Ti@TiO2 NPs (Figure 6 and Figure S8), indicating the absence of sonocatalytic effect in this system in contrast to EDTA sonochemical degradation [17].
Figure 7 shows better performance of the sonochemical process in the presence of Ar/O2 atmosphere compared to pure Ar or air. In addition, sonochemical degradation of RhB is more rapid than that of EDTA even in Ar and air (Table 4). In general, kinetic data point out significant difference in sonochemical mechanisms for RhB and EDTA, which can be assigned to the difference in physico-chemical properties of these molecules. It is well known that RhB readily forms dimers in aqueous solutions [27]. These relatively large and hydrophobic dimers enable to accumulate at cavitation bubble/solution interface thus providing RhB degradation not only by oxidizing radicals but also by interfacial pyrolytic decomposition [28].

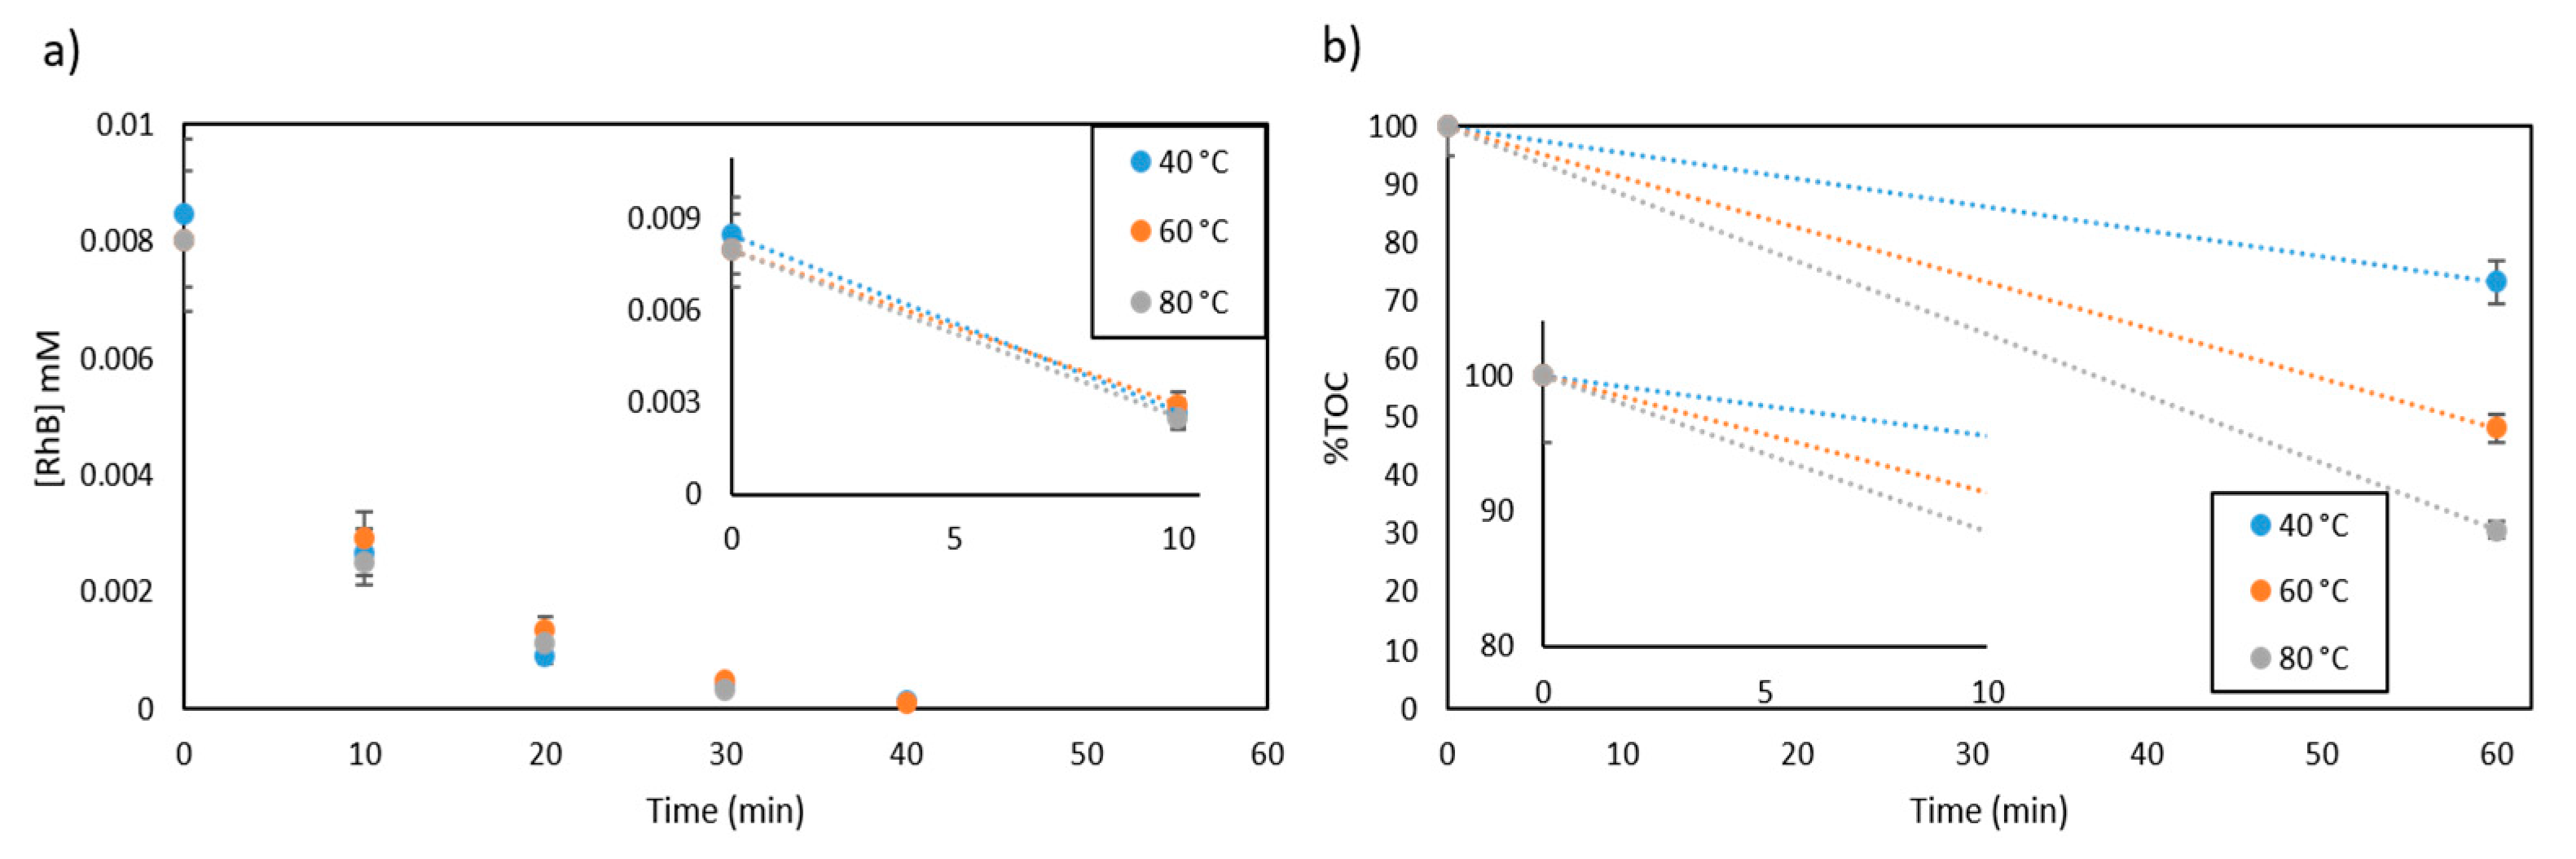
2.2.6. RhB Photocatalytic Degradation

In contrast to sonochemistry, at (RhB) = 1 mM photocatalytic degradation is not observed regardless of the chosen experimental conditions, such as temperature, nature of the catalyst and gas mixture (Figure S9). This can be related to the strong light self-absorption by RhB molecules (Figure S7a). It was previously reported that the initial concentration, in this case of RhB, is an important parameter determining the efficiency of photodegradation of the organic pollutant. The high concentration of RhB in photocatalytic processes can result in the decrease of light penetration into the suspension, thus, decreasing the overall efficiency of RhB degradation [29]. At (RhB) = 0.1 mM, some degradation is observed in the presence of Ar/O2 gas mixture with the rate ≤0.6 ± 0.1 µmol·L−1.min−1 (Figure S10). However, in pure Ar photocatalytic removal of RhB is not feasible at this concentration.
As the concentration of initial RhB solution is decreased to 0.01 mM, the photocatalytic process over Ti@TiO2 NPs and under Ar/O2 atmosphere becomes clearly observable. The initial degradation rate only weakly varies with temperature (Figure 8a) and is equal to 0.5 µmol.L−1.min−1. On the other hand, photothermal effect is observed for TOC removal (Figure 8b) and CO2 emission (Figure 9). Such a difference can be explained by the fact that CO2 emission (TOC removal) originates from intermediate product degradation, rather than from primary RhB molecule defunctionalisation.
The reaction intermediates of RhB photocatalytic degradation includes 4-(methoxycarbonyl) benzoic acid, 2-(methoxycarbonyl) benzoic acid, phthalic acid, isophthalic acid terephthalic acid, phthalic anhydride, 2-hydroxypentanedioic acid and maleic acid, etc [30]. Then, the products were further transformed to smaller organic products, CO2 and H2O following the similar mechanism as for photocatalytic EDTA degradation (Equations (3)–(10)). It is noteworthy to mention that the photothermal effect is less pronounced with RhB than with EDTA. Replacing Ar/O2 by Ar or Ti@TiO2 by Ti0 leads to a significant drop in RhB degradation rate (Figure S10). In general, the efficiency of RhB photocatalytic degradation is lower than of EDTA, which can be attributed to weaker complexing ability of RhB (or RhB dimer) compared to EDTA. According to the proposed mechanism of photocatalytic process (Equations (3)–(10)), the formation of surface complexes is important for efficient charge transfer after catalyst photoexcitation step.

3. Materials and Methods

3.1. Chemical Reagents

Na2H2EDTA·2H2O (98%, Fluka AG, Hamburg, Germany), Rhodamine B (C28H31ClN2O3, for fluorescence, Sigma Aldrich, India), titanium nanopowder (Ti, 99%, Nanostructured & Amorphous Materials, Inc., Los Angeles, CA, USA), TiO2 anatase (99%, 95% anatase, 5% rutile, US Research Nanomaterials, Inc., Houston, TX, USA) were used as received without further purification. All solutions were prepared with deionized water (Milli-Q, 18.2 MΩ.cm at 25 °C, Darmstadt, Germany). Air, Ar and Ar/O2 gas mixture with 20 vol.% of O2 and Ar of 99.999% purity were supplied by Air Liquide (Paris, France).

3.2. Catalyst Preparation

Ti@TiO2 core-shell nanoparticles (NPs) have been obtained by sonohydrothermal treatment (20 kHz, 200 °C) of commercially available Ti0 NPs in pure water [18,20]. It is worth noting that Ti0 NPs are potentially pyrophoric and cannot be used in catalysis as such. In this work, Ti0 NPs were passivated by storage in contact with air at room temperature for ca. 48 h. In a typical synthesis procedure, 2 g of air passivated Ti0 NPs are dispersed in 50 mL deionized H2O for 5 min using an ultrasonic bath. The dispersion is then transferred into the sonohyrothermal reactor (Figure S13) and heated at 200 °C (autogenic pressure P = 19 bar) under simultaneous ultrasonic treatment (f = 20 kHz, Pac = 17 W) for 3 h. After cooling, the treated particles are recovered by centrifugation (12 min, 9000 rpm), washed with deionized water and dried at room temperature under reduced pressure.

3.3. Catalyst Characterization

The crystal phase identification of the as-synthesized particles and air passivated Ti0 NPs was performed by X-ray diffraction (XRD) analysis. The XRD measurement was done using Bruker D8 Advance X-ray diffractometer equipped with a linear Lynx eye detector (Cu Kα1,2 radiation, λ = 1.54184 Å). The patterns were collected at room temperature in the range of 10–90 2θ degrees with a step size of 0.02 2θ degree and a counting time of 1.8 s·step−1. Rietveld refinement was performed on the XRD patterns to determine the different phase composition of our particles. The structure and morphology were examined by high-resolution transmission electron microscopy (HRTEM) and scanning transmission electron microscopy (STEM) coupled with EDX mapping (SDD Oxford detector, High Wycombe, UK). The analysis was performed using Jeol 2200FS (200 kV, Tokyo, Japan) microscope.

3.4. Experimental Setups

3.4.1. Photocatalytic Experiments

Photocatalytic degradation of EDTA and RhB has been performed using commercial anatase TiO2, air passivated Ti0 NPs and the as-synthesized Ti@TiO2 core-shell NPs. The experiments were carried out in a thermostated glass-made gas-flow cell (Figure S14a) adapted to mass spectroscopic analysis of the outlet gases [18]. For a typical experiment, 7.8 mg of the catalyst was dispersed in an ultrasonic bath (Pel = 100 W, f = 40 kHz) in 65 mL of 5 Mm EDTA solution or in 65 mL of 2.10−3 to 1 mM (1 to 500 ppm) RhB solutions and then placed into the photoreactor. Photolysis was performed using the white light of ASB-XE-175 W xenon lamp equipped with ozone blocking coatings. The lamp was placed at 8 cm away from the reactor and the light power at this distance was measured by X1-1 Optometer (Gigahertz-Optik GmbH, Türkenfeld, Germany) using UV-3710-4 (300–420 nm) and RW-3705-4 (400–1100 nm) calibrated detectors. The obtained values of light power were equal to 8.9 (1.07 W·cm−2) and 0.6 W (0.07 W·cm−2) for vis/NIR and UV spectral ranges respectively, which provides the close spectral match to solar spectrum. The solutions inside the reactor were stirred continuously and the temperature was kept constant at 40, 60 or 80 °C during photolysis. The gas flow (Ar or Ar/20% O2) through the reactor was kept constant at 58 mL·min−1 and controlled by a volumetric flowmeter. The gaseous products in the outlet gas were analysed using a Thermo Scientific PRIMA BT mass spectrometer. The H2 and CO2 formation rate was quantified using external calibration curves prepared with standard gas mixtures in argon (Messer). During photolysis, sample aliquots are taken at specified time intervals filtered using 0.2 µM PTFE filters and used for TOC and UV-vis spectroscopic analysis. The kinetics of RhB photocatalytic degradation are studied following the change in RhB absorption peak at 532 nm. On the other hand, EDTA kinetics are followed following the change in the absorption peak of (Fe-TPTZ)2+ complex where TPTZ stands for Bis (2,4,6-tripyridyl-s-triazine). Fe-TPTZ has an intense violet blue color. EDTA in the presence of Fe-TPTZ reacts with iron to form a complex, which decreases the color intensity of the mixture. The absorbance is directly proportional to the concentration of EDTA, as shown recently [31].

3.4.2. Sonocatalytic Experiments

For RhB degradation experiments under ultrasonic irradiation, a homemade thermostated glass reactor (Figure S14b) similar to the one reported in our previous work regarding the sonocatalytic degradation of EDTA was used [17]. High frequency ultrasonic treatment is supplied by 345 kHz transducer (25 cm2, ELAC Nautik, Kiel, Germany) fixed at the bottom of the glass reactor and connected to a generator with a maximal electric power of 125 W (T&C Power Conversion Inc., Rochester, NY, USA). For a typical degradation process, we use 200 mL of RhB solution with initial concentration of 5–500 mg·L−1. An additional amount of 2 g·L−1 of Ti0 NPs or Ti@TiO2 NPs is added to the RhB solution and the mixture obtained is dispersed for at least 5 min in an ultrasonic bath (Pel = 100 W, f = 40 kHz) and then transferred into the glass reactor. Prior sonochemical treatment, the mixture was saturated with the desired gas (Ar, Ar/20% O2 or air) for at least 20 min by bubbling through thin plastic tube at 200 mL.min−1 and kept constant throughout the entire experiment time. External control of the reaction temperature was provided by a Huber Unistat Tango thermo-cryostat (Offenburg, Germany). The internal temperature of the reaction mixture was kept constant at 40 °C through the entire ultrasonic treatment and monitored with a Pt 100 probe. Continuous mechanical stirring at a rate of 300 rpm was applied to maintain homogeneous suspension of the catalyst particles in solution. At a defined time interval, sample aliquots were taken and filtered with a 0.2 µm PTFE filter to remove solid particles. The filtered solution is then used to follow total organic carbon using a Shimadzu TOC-VCSH analyser calibrated with standard potassium phthalate solution and RhB concentration by absorption peak at 520 nm using a Thermo Scientific Evolution 220 UV-vis spectrophotometer.

4. Conclusions

In summary, this study pointed out that the choice of a suitable treatment process, sonochemistry, sonocatalysis or photocatalysis, for the degradation of organic pollutants in wastewater is highly dependent on the nature of chosen pollutant and the catalyst. For strongly complexing but weakly light absorbing species, like EDTA, photocatalysis is more efficient than sonocatalysis, and the use of catalyst influences greatly the kinetics of both processes. Faster sonocatalytic degradation is obtained in the presence of air passivated Ti0 NPs under Ar/20% O2 [17], while photocatalytic degradation of EDTA molecules is more efficient when using a core-shell photocatalyst, Ti@TiO2, also in the presence of Ar/20% O2. On the other hand, for strongly light absorbing, but weakly complexing, pollutants, like RhB, sonochemistry is much more efficient than photocatalysis. However, the presence of oxygen is required for both systems. The interesting finding of this work is a photothermal effect observed for EDTA, and, in less extent, for RhB degradation. Complementary studies have revealed that the observed photothermal effect of EDTA degradation can be attributed to the enhanced production of oxidizing radicals at higher temperature.

Supplementary Materials

The following are available online at https://www.mdpi.com/article/10.3390/catal11080928/s1, Figure S1: Kinetic curves of EDTA evolution during photolysis of 5 mM initial EDTA solutions under Ar atmosphere at 40 and 60 °C in the presence of Ti@TiO2 NPs; Figure S2: Kinetic curves of EDTA evolution (a) and CO2 emission profile (b) during photolysis of 5 mM initial EDTA solutions under Ar20%O2 atmosphere at 60 °C in the presence of Ti0 NPs; Figure S3: Typical carbon dioxide emission profiles obtained upon irradiating 5 mM EDTA solution under the white light of the Xe lamp and in the presence of Ti@TiO2 catalyst under Ar20%O2; Figure S4: Typical carbon dioxide (a) and hydrogen(b) emission profiles obtained upon irradiating 5 mM EDTA solution under the white light of the Xe lamp and in the presence of Ti@TiO2 catalyst under Ar; Figure S5: By-products of sonocatalytic [21] (a) and photocatalytic [15] (b) EDTA degradation; Figure S6: Evolution of titanium concentration in solution during photocatalytic experiments with 0.25 M H2SO4 solutions over Ti@TiO2 NPs at different temperatures in the presence of Ar/20%O2; Figure S7: Absorption spectrum of 10-2 mM (a), 10-1 mM (b) and 2 10-1 mM (c) RhB solution during sonolysis at 40 °C with 345 kHz in Ar20%O2. Major absorption peak of RhB is at 553 nm. [RhB] degradation profiles as a function of time 10-1 and 2 10-1 mM are shown in graph (d); Figure S8: Kinetics of RhB evolution upon ultrasonic treatment under Ar (a) and under Air (b) flux in the presence of solid particles; Figure S9: Variation of RhB concentraion upon photothermal treatment of 1 mM RhB solution with and without catalyst under Ar flux at 40 °C (a) and with Ti@TiO2 at 40 °C and 60 °C with Ar and Ar/20%O2; Figure S10: Variation of RhB concentraion upon photothermal treatment of 0.1 mM RhB solution with Ti@TiO2 catalyst under Ar (a) and under Ar/20%O2 (b); Figure S11: Variation of 0.01 mM initial RhB concentration upon photocatalytic treatment with Ti@TiO2 under Ar atmosphere (a) and with Ti0 under Ar/20%O2 atmosphere (b); Figure S12: Carbon dioxide emission profiles from photothermal treatment of 0.01 mM RhB solutions in the presence of Ti@TiO2 photocatalyst under Ar/20%O2 atmosphere at 40, 60 and 80 °C; Figure S13: Graphical sketch of sonohydrothermal reactor; Figure S14: Images of the thermostated photocatalytic cell (a) and the high frequency sonochemical reactor (b).

Author Contributions

All authors contributed equally. All authors have read and agreed to the published version of the manuscript.

Funding

This research received no external funding.

Conflicts of Interest

The authors declare no conflict of interest.

References

  1. Roy, M.; Saha, R. Dyes and their removal technologies from wastewater: A critical review. In Intelligent Environmental Data Monitoring for Pollution Management; Elsevier BV: Amsterdam, The Netherlands, 2021; pp. 127–160. [Google Scholar]
  2. Ortiz, I.; Rivero, M.J.; Margallo, M. Advanced oxidative and catalytic processes. In Sustainable Water and Wastewater Processing; Elsevier BV: Amsterdam, The Netherlands, 2019; pp. 161–201. [Google Scholar]
  3. Ullah, H.; Viglašová, E.; Galamboš, M. Visible Light-Driven Photocatalytic Rhodamine B Degradation Using CdS Nanorods. Processes 2021, 9, 263. [Google Scholar] [CrossRef]
  4. Severa, J.; Bàr, J. Handbook of Radioactive Contamination and Decontamination; Elsevier Science: Amsterdam, The Netherlands, 1991; Volume 47. [Google Scholar]
  5. Hinck, M.L.; Ferguson, J.; Puhaakka, J. Resistance of EDTA and DTPA to aerobic biodegradation. Water Sci. Technol. 1997, 35, 25–31. [Google Scholar] [CrossRef]
  6. Motekaitis, R.J.; Cox, X.B., III; Taylor, P.; Martell, A.E.; Miles, B.; Tvedt, T.J., Jr. Thermal degradation of EDTA chelates in aqueous solution. Can. J. Chem. 1982, 60, 1207–1213. [Google Scholar] [CrossRef]
  7. Oturan, M.A.; Aaron, J.-J. Advanced oxidation processes in water/wastewater treatment: Principles and applications. A review. Crit. Rev. Environ. Sci. Technol. 2014, 44, 2577–2641. [Google Scholar] [CrossRef]
  8. Bajpai, P. Emerging technologies for waste water treatment. In Ind Finish; Pulp and Paper Industry Emerging Waste Water Treatment Technologies: Kanpur, India, 2017; Volume 51, pp. 93–179. [Google Scholar]
  9. Wang, J.; Wang, Z.; Vieira, C.L.; Wolfson, J.M.; Pingtian, G.; Huang, S. Review on the treatment of organic pollutants in water by ultrasonic technology. Ultrason. Sonochemistry 2019, 55, 273–278. [Google Scholar] [CrossRef]
  10. Chitra, S.; Paramasivan, K.; Sinha, P.; Lal, K. Ultrasonic treatment of liquid waste containing EDTA. J. Clean. Prod. 2004, 12, 429–435. [Google Scholar] [CrossRef]
  11. Jorfi, S.; Pourfadakari, S.; Kakavandi, B. A new approach in sono-photocatalytic degradation of recalcitrant textile wastewater using MgO@Zeolite nanostructure under UVA irradiation. Chem. Eng. J. 2018, 343, 95–107. [Google Scholar] [CrossRef]
  12. Mason, T.J.; Lorimer, J.P. Applied Sonochemistry: The Uses of Power Ultrasound in Chemistry and Processing; Wiley: Weinhim, Germany, 2002. [Google Scholar]
  13. Qiu, P.; Park, B.; Choi, J.; Thokchom, B.; Pandit, A.B.; Khim, J. A review on heterogeneous sonocatalyst for treatment of organic pollutants in aqueous phase based on catalytic mechanism. Ultrason. Sonochem. 2018, 45, 29–49. [Google Scholar] [CrossRef]
  14. Choi, Y.; Lee, D.; Hong, S.; Khan, S.; Darya, B.; Lee, J.-Y.; Chung, J.; Cho, S.-H. Investigation of the synergistic effect of sonolysis and photocatalysis of titanium dioxide for organic dye degradation. Catalysts 2020, 10, 500. [Google Scholar] [CrossRef]
  15. Babey, P.; Emilio, C.; Ferreyra, R.; Gautier, E.; Gettar, R.; Litter, M. Kinetics and mechanisms of EDTA photocatalytic degradation with TiO2. Water Sci. Technol. 2001, 44, 179–185. [Google Scholar] [CrossRef]
  16. Godt, J.; Scheidig, F.; Grosse-Siestrup, C.; Esche, V.; Brandenburg, P.; Reich, A.; Groneberg, D. The toxicity of cadmium and resulting hazards for human health. J. Occup. Med. Toxicol. 2006, 1, 22. [Google Scholar] [CrossRef] [PubMed] [Green Version]
  17. El Hakim, S.; Chave, T.; Nikitenko, S.I. Sonocatalytic degradation of EDTA in the presence of Ti and Ti@TiO2 nanoparticles. Ultrason. Sonochem. 2021, 70, 105336. [Google Scholar] [CrossRef] [PubMed]
  18. El Hakim, S.; Chave, T.; Nada, A.A.; Roualdes, S.; Nikitenko, S.I. Tailoring noble metal-free Ti@TiO2 photocatalyst for boosting photothermal hydrogen production. Front. Catal. 2021, 1, 669260. [Google Scholar] [CrossRef]
  19. Höbel, B.; Von Sonntag, C. OH-Radical induced degradation of ethylenediaminetetraacetic acid (EDTA) in aqueous solution: A pulse radiolysis study. J. Chem. Soc. Perkin Trans. 1998, 2, 509–514. [Google Scholar] [CrossRef]
  20. Nikitenko, S.I.; Chave, T.; Cau, C.; Brau, H.-P.; Flaud, V. Photothermal Hydrogen production using noble-metal-free Ti@TiO2 core–shell nanoparticles under visible–NIR light irradiation. ACS Catal. 2015, 5, 4790–4795. [Google Scholar] [CrossRef]
  21. Parizot, L.; Chave, T.; Galvez, M.-E.; Dutilleul, H.; Da Costa, P.; Nikitenko, S.I. Sonocatalytic oxidation of EDTA in aqueous solutions over noble metal-free Co3O4/TiO2 catalyst. Appl. Catal. B Environ. 2019, 241, 570–577. [Google Scholar] [CrossRef]
  22. Babay, P.A.; Emilio, C.A.; Ferreyra, R.E.; Gautier, E.A.; Gettar, R.T.; Litter, M.I. Kinetics and mechanisms of EDTA photocatalytic degradation with TiO2 under different experimental conditions. Int. J. Photoenergy 2001, 3, 193–199. [Google Scholar] [CrossRef] [Green Version]
  23. Tang, W.; Chen, J.; Yin, Z.; Sheng, W.; Lin, F.; Xu, H.; Cao, S. Complete removal of phenolic contaminants from bismuth-modified TiO2 single-crystal photocatalysts. Chin. J. Catal. 2021, 42, 347–355. [Google Scholar] [CrossRef]
  24. Wang, F.; Feng, Y.; Chen, P.; Wang, Y.; Su, Y.; Zhang, Q.; Zeng, Y.; Xie, Z.; Liu, H.; Liu, Y.; et al. Photocatalytic degradation of fluoroquinolone antibiotics using ordered mesoporous g-C3N4 under simulated sunlight irradiation: Kinetics, mechanism, and antibacterial activity elimination. Appl. Catal. B Environ. 2018, 227, 114–122. [Google Scholar] [CrossRef]
  25. Liu, S.-H.; Tang, W.-T.; Chou, P.-H. Microwave-assisted synthesis of triple 2D g-C3N4/Bi2WO6/rGO composites for ibuprofen photodegradation: Kinetics, mechanism and toxicity evaluation of degradation products. Chem. Eng. J. 2020, 387, 124098. [Google Scholar] [CrossRef]
  26. O’Sullivan, D.W.; Tyree, M. The kinetics of complex formation between Ti(IV) and hydrogen peroxide. Int. J. Chem. Kinet. 2007, 39, 457–461. [Google Scholar] [CrossRef]
  27. Setiawan, D.; Kazaryan, A.; Martoprawiro, M.; Filatov, M. A first principles study of fluorescence quenching in rhodamine B dimers: How can quenching occur in dimeric species? Phys. Chem. Chem. Phys. 2010, 12, 11238–11244. [Google Scholar] [CrossRef] [PubMed] [Green Version]
  28. Chiha, M.; Merouani, S.; Hamdaoui, O.; Baup, S.; Gondrexon, N.; Pétrier, C. Modeling of ultrasonic degradation of non-volatile organic compounds by Langmuir-type kinetics. Ultrason. Sonochem. 2010, 17, 773–782. [Google Scholar] [CrossRef] [PubMed]
  29. Akbal, F. Photocatalytic degradation of organic dyes in the presence of titanium dioxide under UV and solar light: Effect of operational parameters. Environ. Prog. 2005, 24, 317–322. [Google Scholar] [CrossRef]
  30. Zhao, G.; Liu, L.; Li, C.; Yu, J.; Jiao, F. Synthesis, characterization and enhanced visible light photocatalytic activity of Bi2WO6/Ni–Al layered double hydroxide composites. J. Mater. Sci. Mater. Electron. 2018, 29, 14008–14021. [Google Scholar] [CrossRef]
  31. Kratochvil, B.; White, M.C. Spectrophotometric determination of microgram quantities of (ethylenedinitrilo)tetraacetic acid with bis(2/4,6-tripyridyl-s-triazine)iron(ll). UTC, 1962. Anal. Chem. 1965, 37, 111–113. Available online: https://pubs.acs.org/sharingguidelines (accessed on 29 July 2021). [CrossRef]
Figure 1. TEM images, STEM/EDX mapping and XRD diffraction patterns of air passivated Ti0 NPs (ac) and Ti@TiO2 NPs (df). Green dots—Ti, red dots—O.
Catalysts 11 00928 g001
Figure 2. Kinetic curves of EDTA evolution and (a) TOC abatement curves (b) during photolysis of 5 mM initial EDTA solutions under Ar/20% O2 atmosphere at 3 different temperatures in the presence of Ti@TiO2 NPs (catalyst concentration 0.12 g·L−1, V = 65 mL, Plight = 9.5 W).
Catalysts 11 00928 g002
Figure 3. Yields of CO2 for Ar/20% O2 atmosphere (grey) and H2 for Ar atmosphere (blue) yields obtained upon photocatalytic degradation of 5 mM EDTA solution over Ti@TiO2 catalyst under Ar/20% O2 and Ar at different temperatures (catalyst concentration 0.12 g·L−1, V = 65 mL, PXe = 9.5 W).
Catalysts 11 00928 g003
Figure 4. Arrhenius plot for the photocatalytic EDTA degradation in the presence of Ti@TiO2 NPs under Ar/O2 atmosphere, W is an EDTA degradation rate assuming zero-order kinetics.
Catalysts 11 00928 g004
Figure 5. H2O2 concentration produced during photocatalytic experiments with 0.02 M TiOSO4/0.25 M H2SO4 solutions over Ti@TiO2 NPs at different temperatures (catalyst concentration 2 g L−1, V = 65 mL). Concentration of TiO(O2) complex equal to that of formed H2O2 was monitored at 410 nm (ε = 626 cm−1·M−1) [26].
Catalysts 11 00928 g005
Figure 6. Kinetic curves of RhB evolution upon sonolysis of homogeneous RhB solution and sonochemical oxidation of RhB in the presence of Ti0 and Ti@TiO2 NPs in Ar/20% O2 at (catalyst concentration 2 g L−1, T= 40 °C).
Catalysts 11 00928 g006
Figure 7. Kinetics of RhB evolution upon sonolysis of RhB with 345 kHz US in the absence of any solid particles under different gas atmospheres (VRhB = 200 mL, T=40 °C).
Catalysts 11 00928 g007
Figure 8. Kinetic curves of 0.01 mM RhB degradation and (a) TOC removal (b) in the presence of Ti@TiO2 NPs under Ar/20% O2 flux at three different temperatures. Catalyst concentration 0.12 g−1·L−1.
Catalysts 11 00928 g008
Figure 9. Calculated CO2 yield from the photothermal treatment of 0.01 mM RhB solutions in the presence of Ti@TiO2 photocatalyst under Ar/20% O2 atmosphere at 40, 60 and 80 °C (catalyst concentration 0.12 g−1·L−1 V = 60 mL, PXe light = 9.5 W). Emission profiles of CO2 emission are shown in Figure S14.
Catalysts 11 00928 g009
Table 1. Variation in the composition of air passivated Ti0 NPs and Ti@TiO2 obtained from the Rietveld refinement of their XRD patterns [18].
Samplesmol.%
TiTi3OTiO2
Air passivated Ti08614-
Ti@TiO262335
Table 2. Concentration and percentage of Ti species leached into treated EDTA solution after 4 h of Xe light irradiation with Ti@TiO2 catalyst in Ar/O2 atmosphere.
Temperature (°C)[Ti] (mg·L−1)%Ti (± 5%)
400.260.27
600.320.33
800.40.41
Table 3. Calculated yields of EDTA degradation using Ti@TiO2 and Ti0 NPs at 40 °C under Ar/20% O2 atmosphere in two different processes. Time of treatment was 4 h for each system.
ProcessCatalystM (μmol)P (kJ)m (g)Y (μmol·kJ−1·g−1)
PhotocatalysisTi@TiO2601187.8 × 10−365
Ti0<11187.8 × 10−3<1
Sonocatalysis [17]Ti@TiO23547200.41.5
Ti07807200.42.7
Table 4. Comparison of RhB and EDTA degradation rate (R) obtained upon sonolysis by 345 kHz power US at 40 °C obtained under Ar, Ar/20% O2 and Air.
Ar 20%O2ArAir
RRhB (µmol−1 L−1 min−1)16 ± 1.310 ± 0.312 ± 0.6
REDTA (µmol−1 L−1 min−1)6.42 ± 0.434 ± 0.03Not calculated
Publisher’s Note: MDPI stays neutral with regard to jurisdictional claims in published maps and institutional affiliations.

