Article

The Amino Acids Motif -32GSSYN36- in the Catalytic Domain of E. coli Flavorubredoxin NO Reductase Is Essential for Its Activity

Instituto de Tecnologia Química e Biológica António Xavier, Universidade Nova de Lisboa, Av. da República, 2780-157 Oeiras, Portugal
*
Authors to whom correspondence should be addressed.
Catalysts 2021, 11(8), 926; https://doi.org/10.3390/catal11080926
Submission received: 8 July 2021 / Revised: 28 July 2021 / Accepted: 29 July 2021 / Published: 30 July 2021
(This article belongs to the Special Issue Perspectives in Bioinorganic Catalysis)

Abstract

:
Flavodiiron proteins (FDPs) are a family of modular and soluble enzymes endowed with nitric oxide and/or oxygen reductase activities, producing N2O or H2O, respectively. The FDP from Escherichia coli, which, apart from the two core domains, possesses a rubredoxin-like domain at the C-terminus (therefore named flavorubredoxin (FlRd)), is a bona fide NO reductase, exhibiting O2 reducing activity that is approximately ten times lower than that for NO. Among the flavorubredoxins, there is a strictly conserved amino acids motif, -G[S,T]SYN-, close to the catalytic diiron center. To assess its role in FlRd’s activity, we designed several site-directed mutants, replacing the conserved residues with hydrophobic or anionic ones. The mutants, which maintained the general characteristics of the wild type enzyme, including cofactor content and integrity of the diiron center, revealed a decrease of their oxygen reductase activity, while the NO reductase activity—specifically, its physiological function—was almost completely abolished in some of the mutants. Molecular modeling of the mutant proteins pointed to subtle changes in the predicted structures that resulted in the reduction of the hydration of the regions around the conserved residues, as well as in the elimination of hydrogen bonds, which may affect proton transfer and/or product release.

1. Introduction

Depending on the concentration, nitric oxide (NO) has different roles in living systems [1]. While at nanomolar concentrations it acts as a signaling molecule, at higher concentrations it can be quite harmful, affecting multiple cellular processes through the inhibition of a wide range of enzymes, particularly those containing transition metals. In fact, one of the defense mechanisms used by the mammalian innate immune system to fight pathogens is based on the production of NO through the inducible nitric oxide synthases in phagocytic cells, namely macrophages [2]. Besides NO and its derived reactive species, oxygen reactive species are also produced by the immune system’s NADPH oxidases to combat invading microorganisms [3]. Oxygen itself may also be toxic, particularly to anaerobic organisms (e.g., [4,5]). To tackle the effects of NO and O2 exposure, organisms have acquired throughout evolution enzymatic mechanisms capable of removing these potentially harmful molecules. One of these mechanisms involves a family of cytoplasmic enzymes named flavodiiron proteins (FDPs), which are capable of protecting cells by reducing O2 and/or NO to water and nitrous oxide, respectively (for recent views, see [6,7]):
O 2 + 4 e + 4 H + 2   H 2 O
2 NO + 2 e + 2 H + N 2 O +   H 2 O
FDPs were initially discovered in anaerobic organisms and considered as oxygen-detoxifying enzymes [8]. However, in 2002, Gardner and coworkers [9,10] reported a striking observation: Escherichia (E.) coli cells grown anaerobically, after exposure to NO for a certain amount of time, exhibited NO reducing activity. This activity was attributed to the E. coli FDP by studying a deletion mutant of its encoding gene. This proposal was confirmed in vitro, through amperometric measurements of NO consumption by the isolated enzyme [11]. Enzymes with dual activity, i.e., capable of reducing NO or O2 with similar rates, were later discovered (e.g., [12,13]). Two FDPs that are clearly selective for NO are those from E. coli and Salmonella enterica and their expression is significantly upregulated in cell cultures exposed to authentic NO solutions or NO releasers under anaerobic or microaerobic conditions [9,14,15,16,17].
Proteins belonging to the FDP family have a common structural core in the N-terminal part composed of a metallo-β-lactamase-like domain harboring the catalytic diiron center and a flavodoxin-like domain containing one flavin mononucleotide (FMN) molecule [18,19,20,21]. Bioinformatics analysis of the available genomes enabled the identification of nine different classes of FDPs (from A to I), based on the number and nature of additional domains at the C-terminus [7,22].
The flavodiiron protein from E. coli, also known as flavorubredoxin (FlRd), is an example of a class B FDP. It contains an extra rubredoxin-like domain at its C-terminus that acts as the electron accepting site towards its redox partner, an NADH-flavorubredoxin oxidoreductase, similar to NADH:rubredoxin oxidoreductases [11,23,24]. Class B FDPs are apparently restricted to the Proteobacteria phylum of the beta, delta and gamma classes. E. coli FDP has a clear preference for NO as its substrate, with an in vitro turnover rate ca. 10 times higher than that for O2. Experiments with the whole enzyme and with its truncated rubredoxin domain showed that the catalytic activity is not related to the presence of this extra domain [11].
Until now no structural determinants have been identified among FDPs that could explain their substrate selectivity; in particular, in all FDPs studied, for which there is a 3D structure of the holo-enzyme, the amino acid ligands to the diiron site are strictly conserved (H79-x-E81-x-D83H84-x62-H147-x18-D166-x60-H227, E. coli FDP numbering), irrespective of their relative reactivities towards NO or O2 [6,7,25]. The catalytic center of FDP belongs to the large category of histidine/carboxylate diiron sites (e.g., [26]) and is unrelated to the binuclear catalytic centers of the respiratory haem-copper or haem-iron O2 and NO reductases, respectively [6]. It is also unique among diiron proteins in having the metal site in almost Van der Waals contact with the flavin mononucleotide.
Analysis of all class B FDP amino acid sequences available in the databanks revealed a conserved amino acids motif -G[S,T]SYN-, located near to the catalytic diiron site at the metallo-β-lactamase-like domain. In order to understand the role of these conserved amino acids in E. coli FlRd, seven site-directed mutants were constructed, changing the hydrophilicity of those residues: S33V, S33D, S34V, S34D, S33V_S34V, Y35F and N36L. Their biochemical, spectroscopic and enzymatic properties were evaluated, and the data were analyzed in the framework of homology models based on the structure of the wild type enzyme.

2. Results

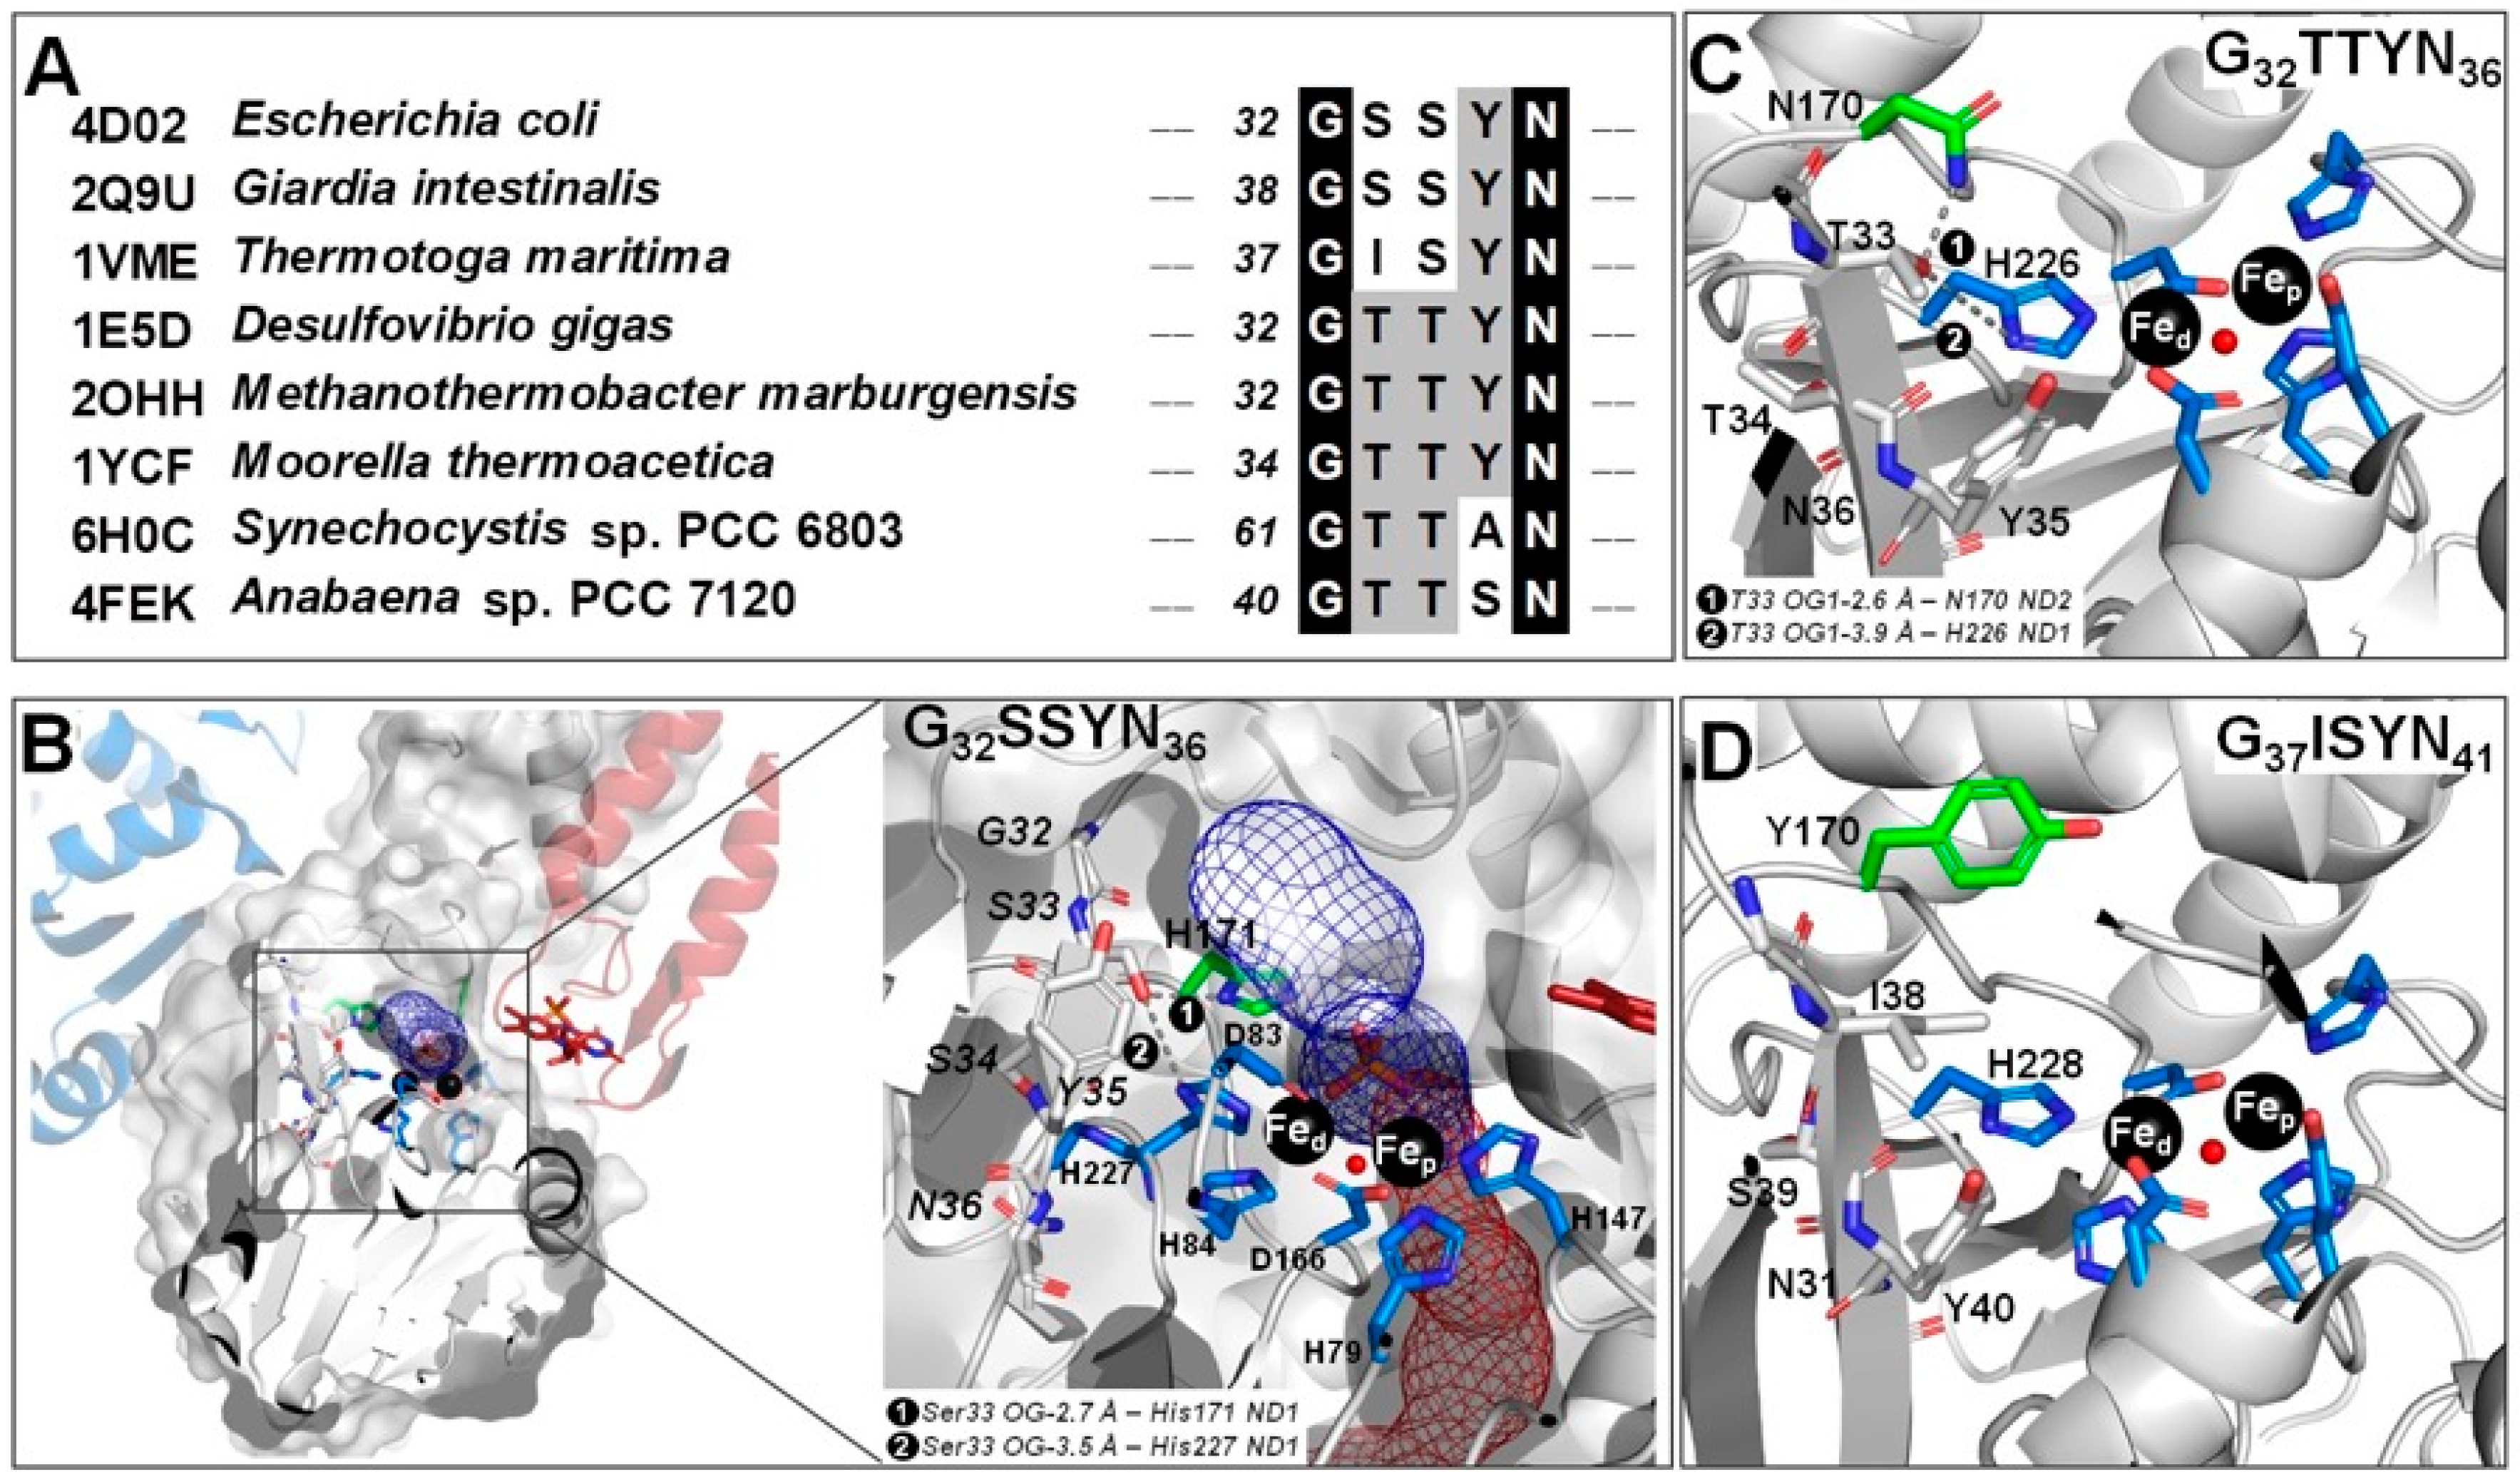
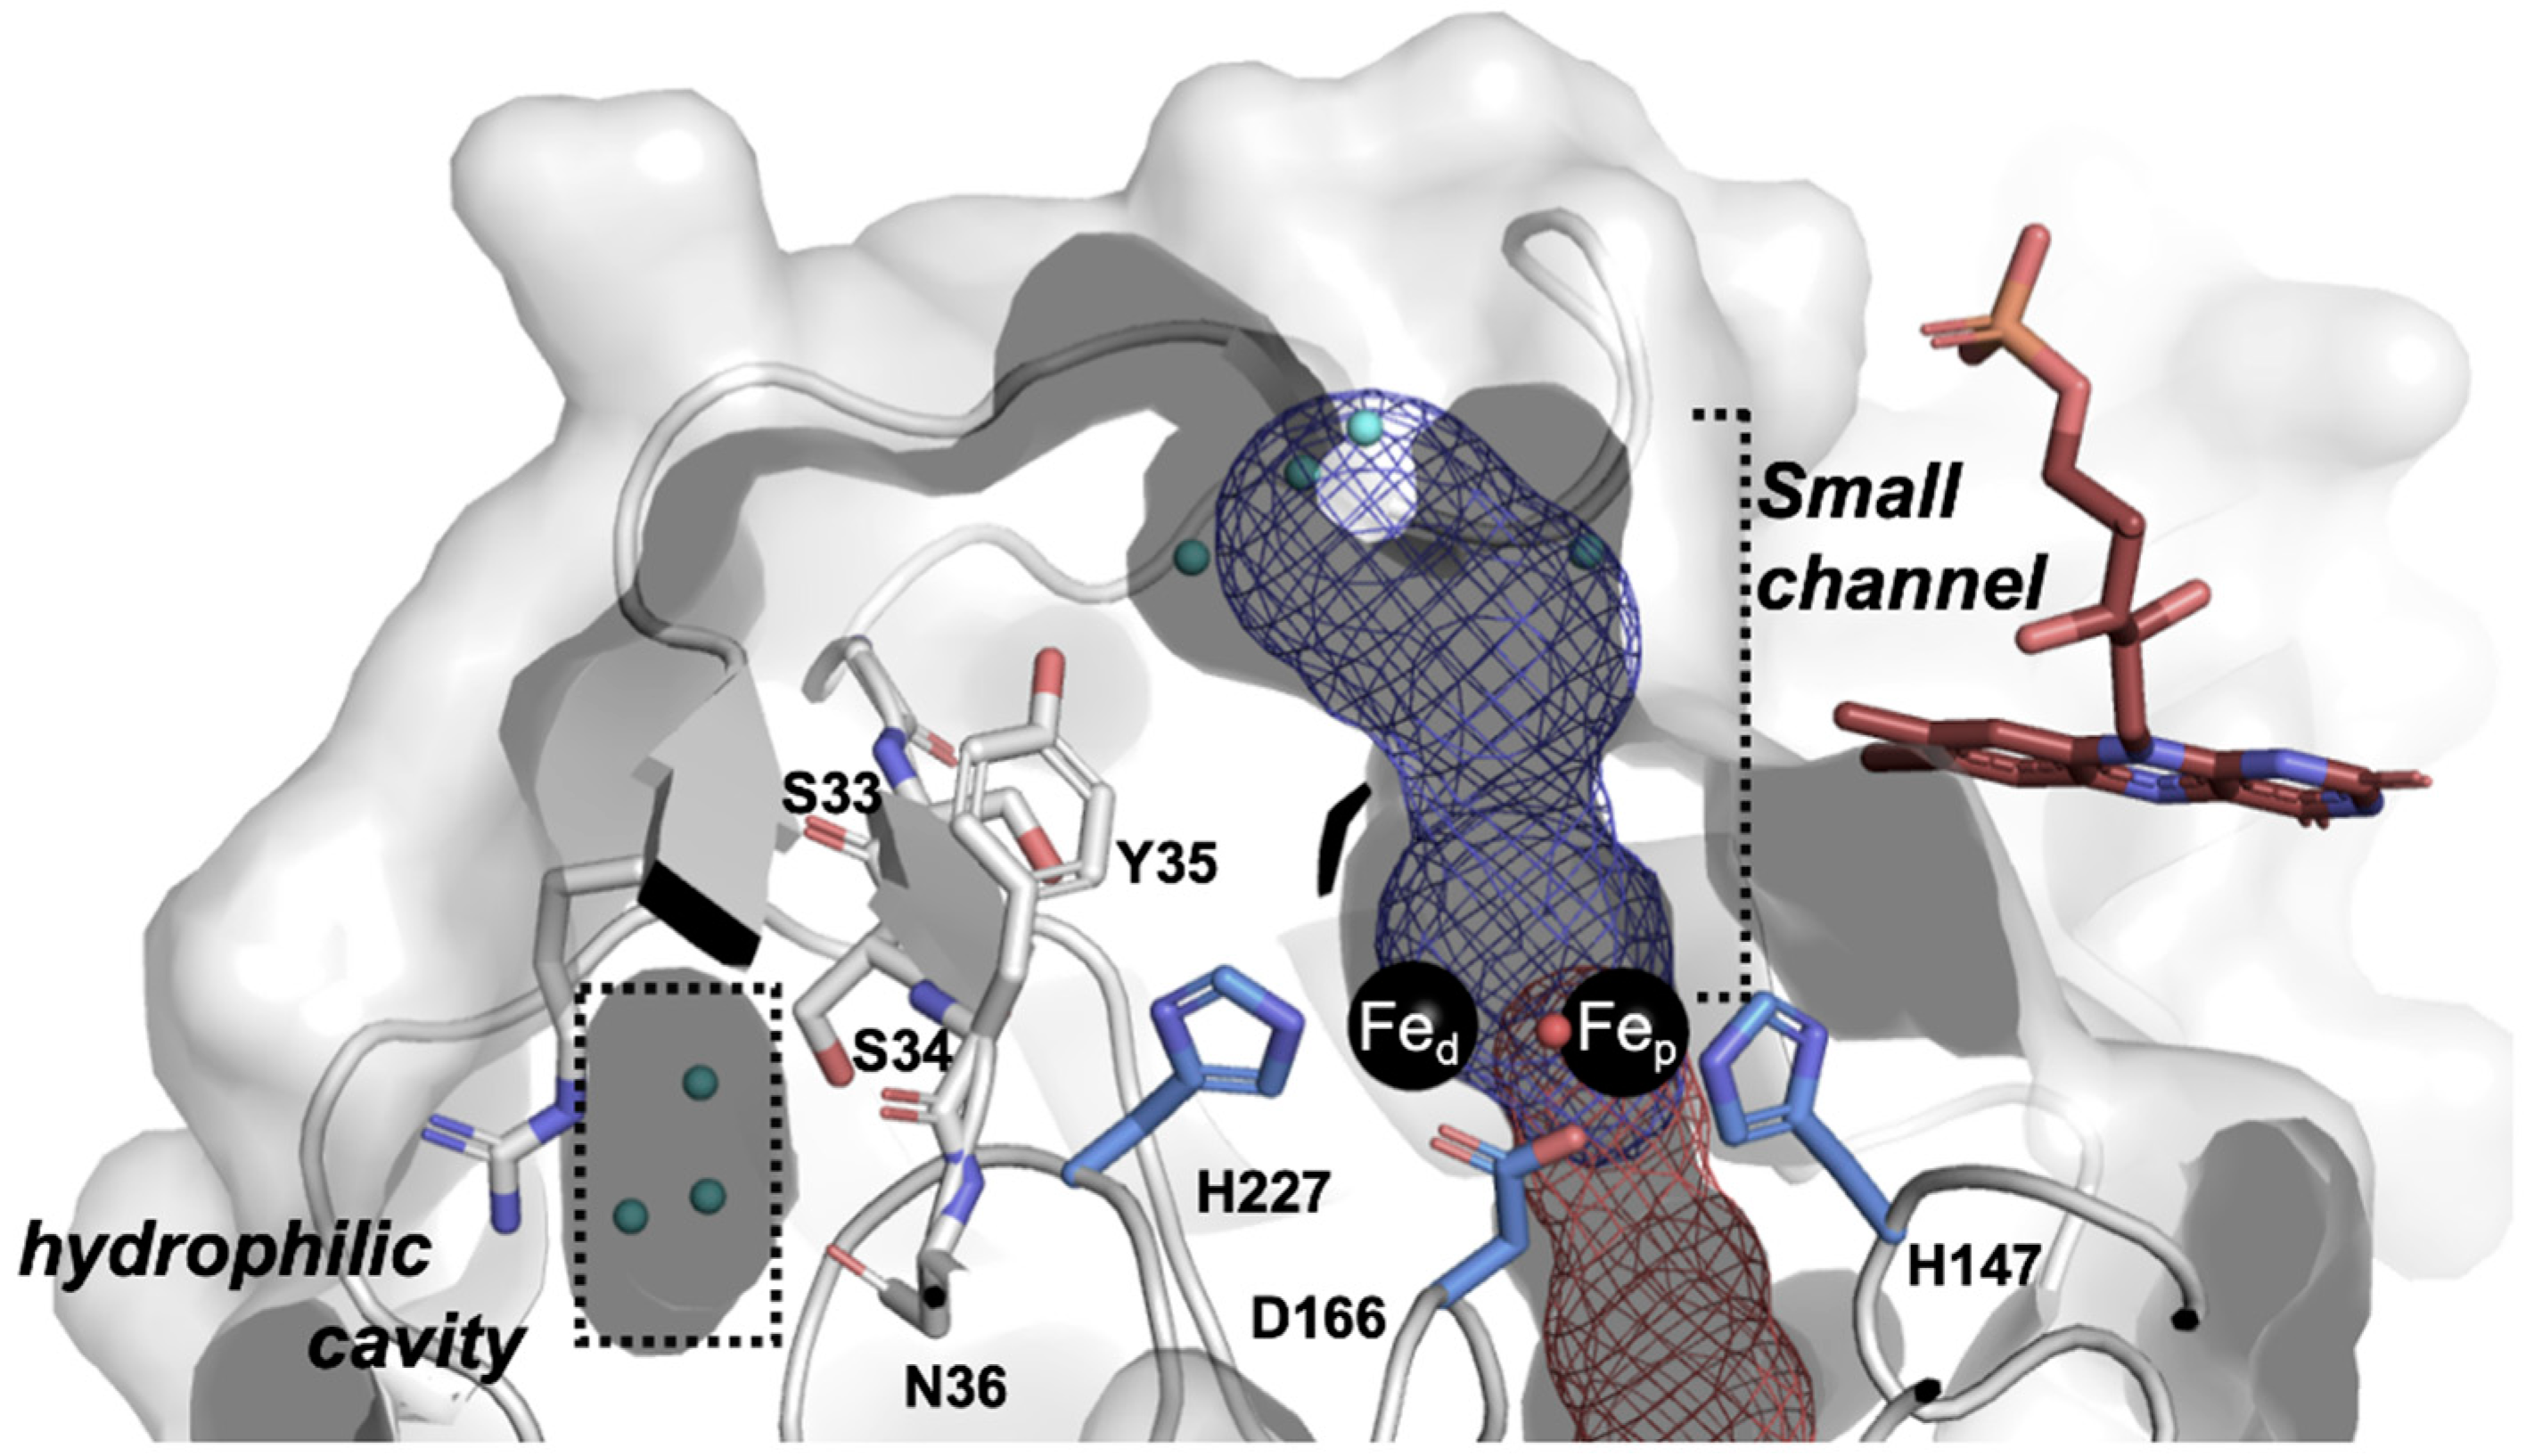
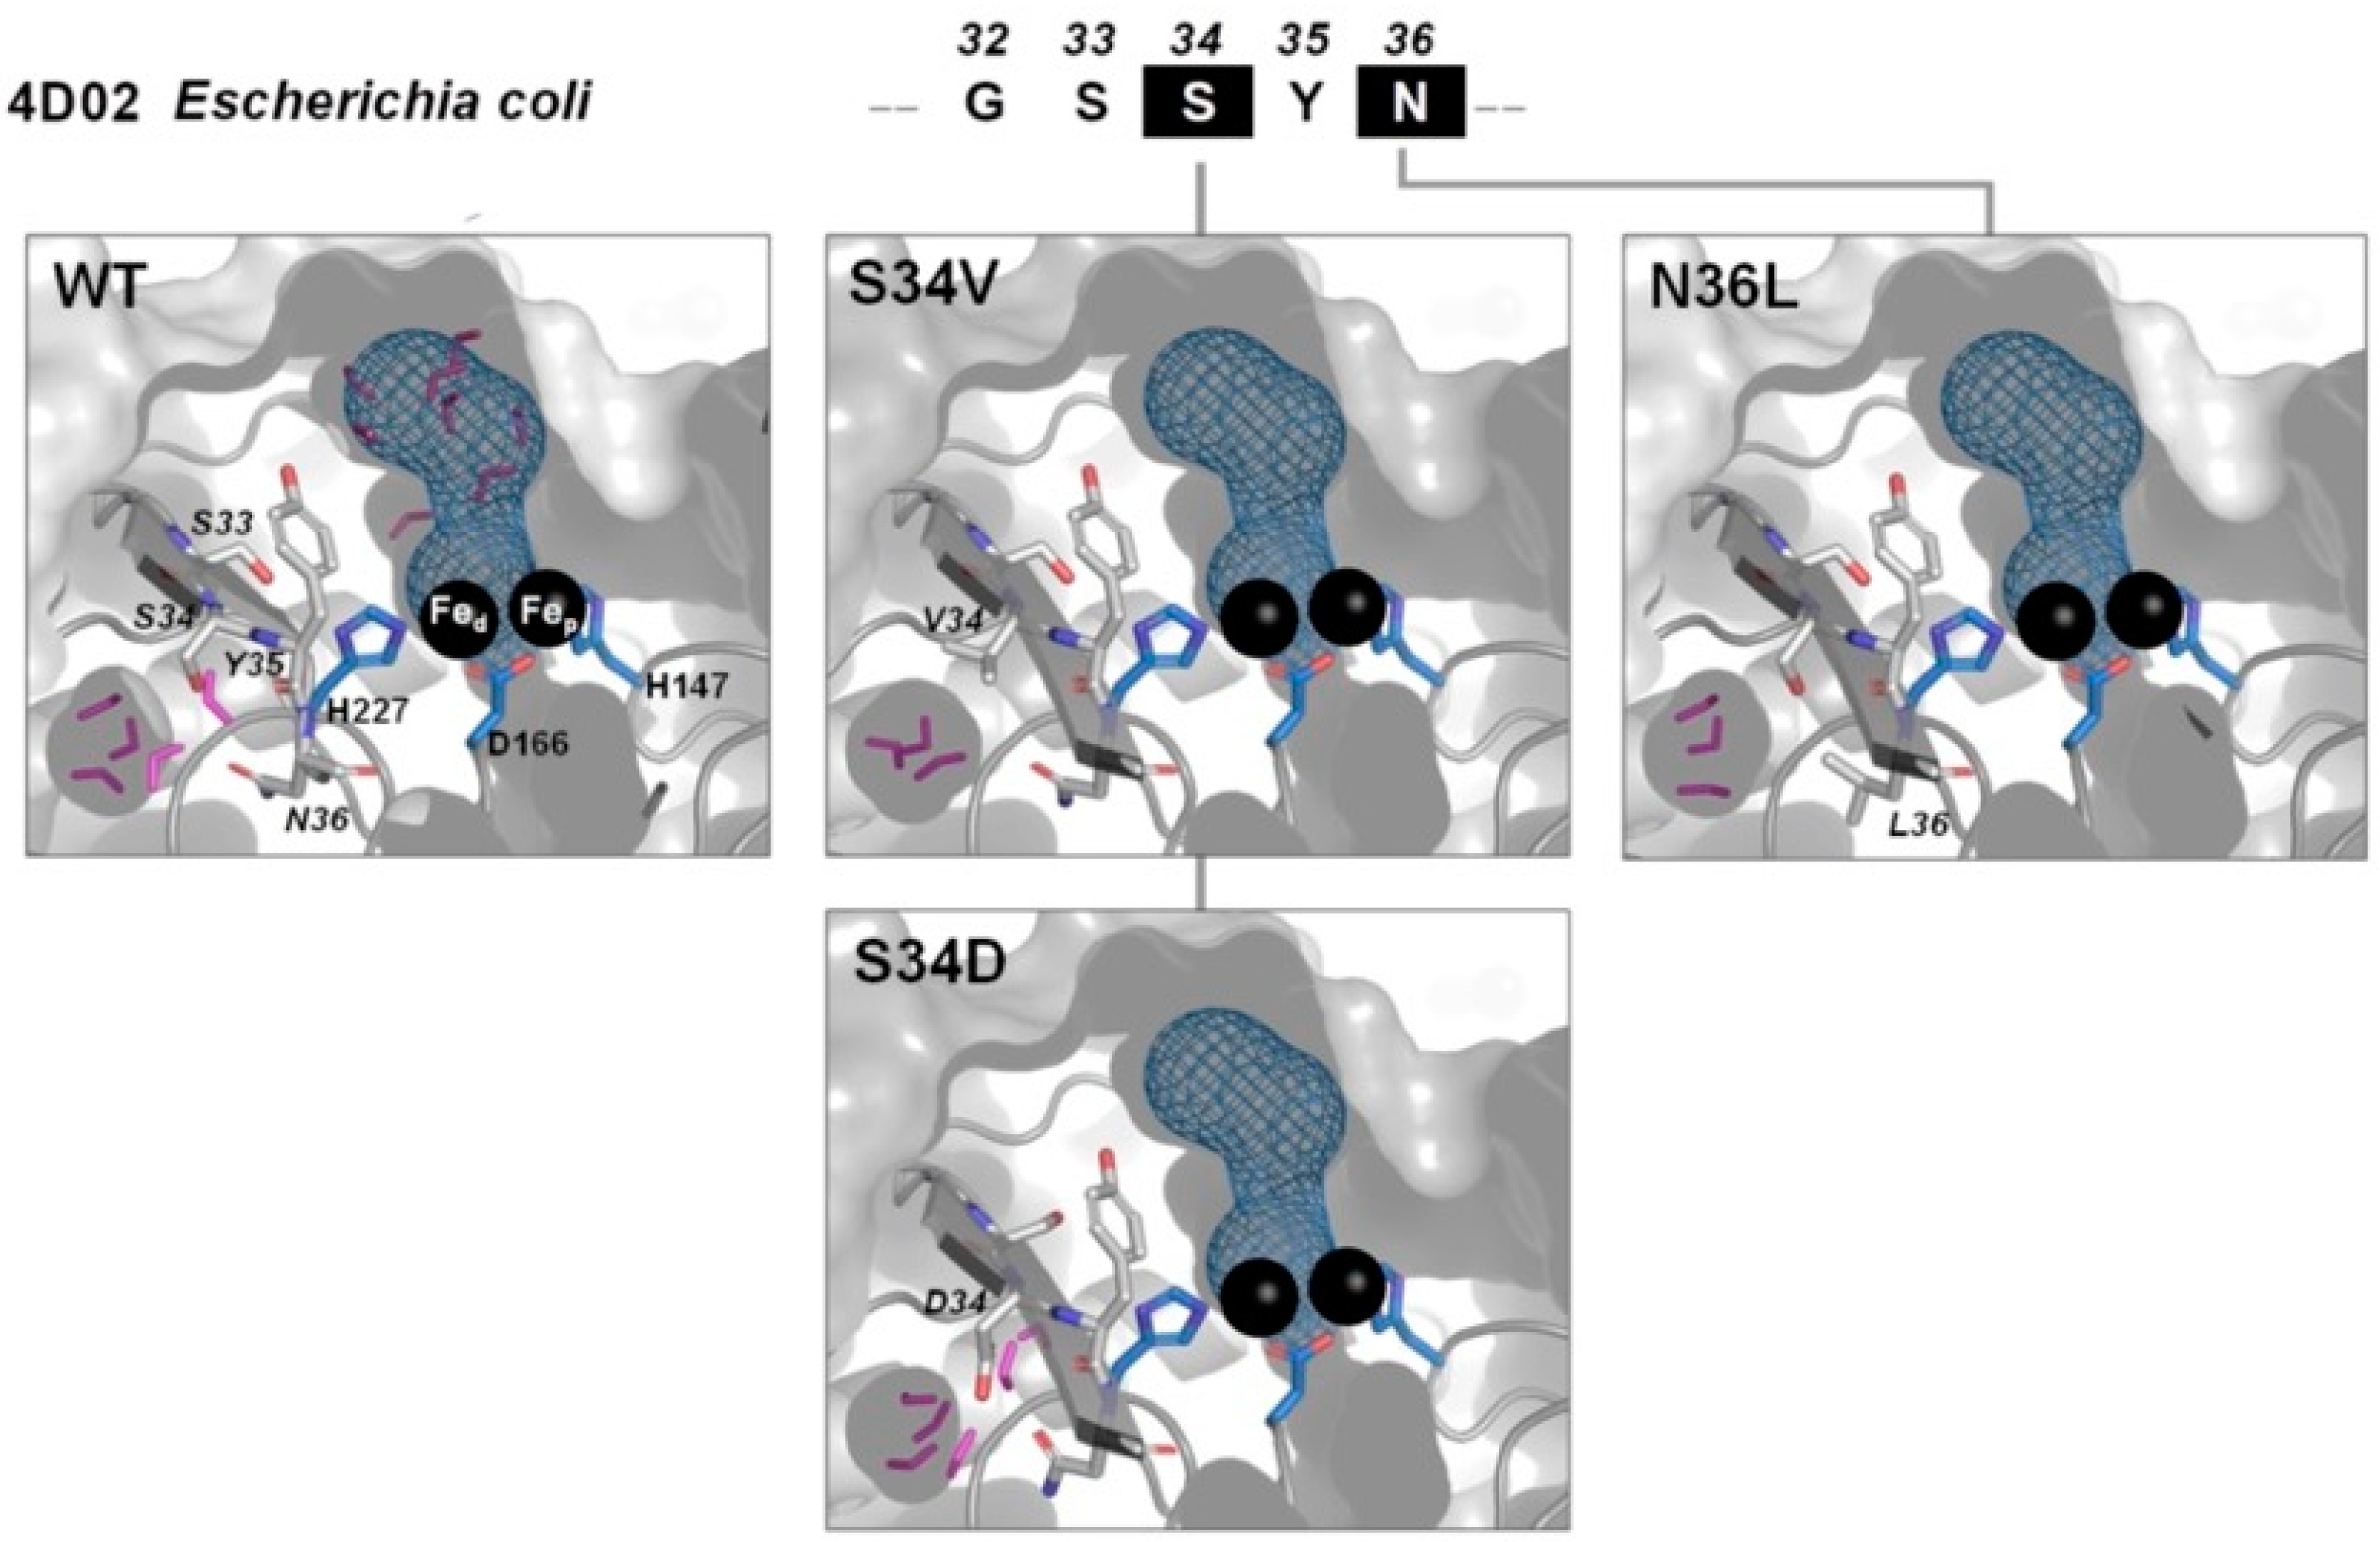
2.1. The -G[S,T]SYN- Motif

Since early on in the study of flavodiiron proteins, a short amino acids motif, G-[S,T,I]-[T,S]-Y-N-[A,S]-Y-[F,L,A]-[I,M,V], of mostly polar residues, close to the N-terminus (residues ~30–40), was found to be highly conserved and proposed to be a characteristic sequence fingerprint that could make it possible to identify FDPs [27]. Presently, with the large number of FDP amino acid sequences available, it is known that this motif is less conserved and shorter. However, in the case of class B FDPs, the motif -G[S,T]SYN- is almost fully conserved, as the only variation occurs in the first serine residue which, in some cases, is conservatively substituted by a threonine.
The variation of that motif among the FDPs that have been structurally characterized so far (which include NO- and O2-selective FDPs, as well as ambivalent ones) is shown in Figure 1A. The motif is in the β-lactamase domain and is part of the 6th β-sheet (β6) belonging to the four β-chains (β3–β6) of the beta-hairpin typical of FDPs [20], and the amino acids are within 7 Å of the catalytic diiron center (measured to Fed, where d-distal relates to the position in relation to the FMN). Quite importantly, none of these amino acid residues directly interacts with the metal center, the shortest distance being 3.5 Å between the hydroxyl oxygen of Ser33 and the nitrogen (ND1) of His227, one of the ligands to the distal iron ion. This Ser33 (OH) also forms a hydrogen bond at 2.7 Å with His171 (ND1) (Figure 1B). When this serine is substituted by a threonine this arrangement is conserved, as occurs in the FDP from Desulfovibrio gigas [18], but in this case the distance between Thr33 (OH) and the iron ligand His226 (ND1) is ca. 3.9 Å (Figure 1C). When these S/T residues are substituted by an isoleucine, as in Thermotoga maritima FDP (1VME), there is no hydrogen bond interaction (Figure 1D).
Most of the residues of the motif are not accessible to the solvent, mainly due to the region between residues 13 to 20, which includes the β3-sheet and a loop. Importantly, the residues His171 (hydrogen bonded to the Ser33) and Tyr35 are part of the small channel previously proposed to be a putative product exit route (Figure 1B and Figure 2) in which His171 is located in the active site pocket at the bottom of the channel and Tyr35 is directed to the entrance of the channel close to the external surface [14]. While the substitution of Ser33 by valine can be expected to disturb the hydrogen bond with His171, the substitution of Tyr35 by phenylalanine may perturb the putative product exit route. The other two residues, Ser34 and Asn36, are located close to a hydrophilic pocket where several water molecules are localized in the E. coli FDP crystal structure (Figure 2).
In an a priori analysis, the importance of this amino acids motif is not predictable, despite its conservation. Searches in sites for specific amino acid motifs indicated that S34 has a high potential to be phosphorylated (e.g., http://www.cbs.dtu.dk/services/NetPhosBac/ (accessed on 16 April 2020), but its spatial location hinders its accessibility for such a post-translational modification.

2.2. Proteins Characterization

E. coli FlRd wild type (wt) and site-directed mutants were successfully overexpressed in E. coli and purified to homogeneity. The quaternary structures were determined by size exclusion chromatography: the site-directed mutants were isolated as homotetramers, similarly to the wt protein (data not shown).
The iron and flavin contents were also determined (Table 1). As in almost all FDPs characterized so far, the iron and flavin contents per protein molecule were lower than expected (i.e., three iron atoms and one FMN molecule per protein monomer). In the case of iron, incorporation varied between 57% (1.7 iron atoms/protein) and 90% (2.7 iron atoms/protein), while for FMN the incorporation fluctuated between 40% and 80%. As discussed below, these variations were considered when comparing the enzymatic activities.
The thermal stabilities of the wt and mutant proteins were also assessed. The melting temperatures (Tm) of the wt and site-directed mutants were evaluated by determining the changes in molar ellipticities at 225 nm as a function of temperature (Table 1). The Tms obtained for the mutant proteins were similar within ±5 °C, with the exceptions of the S34V and Y35F mutants, which presented melting temperatures ca. 10 °C lower when compared with the other mutants and with the wt enzyme. This decrease was not observed in the double mutant S33V_S34V, and in the absence of the 3D structures of these mutants it is not possible to explain these differences in melting temperatures.

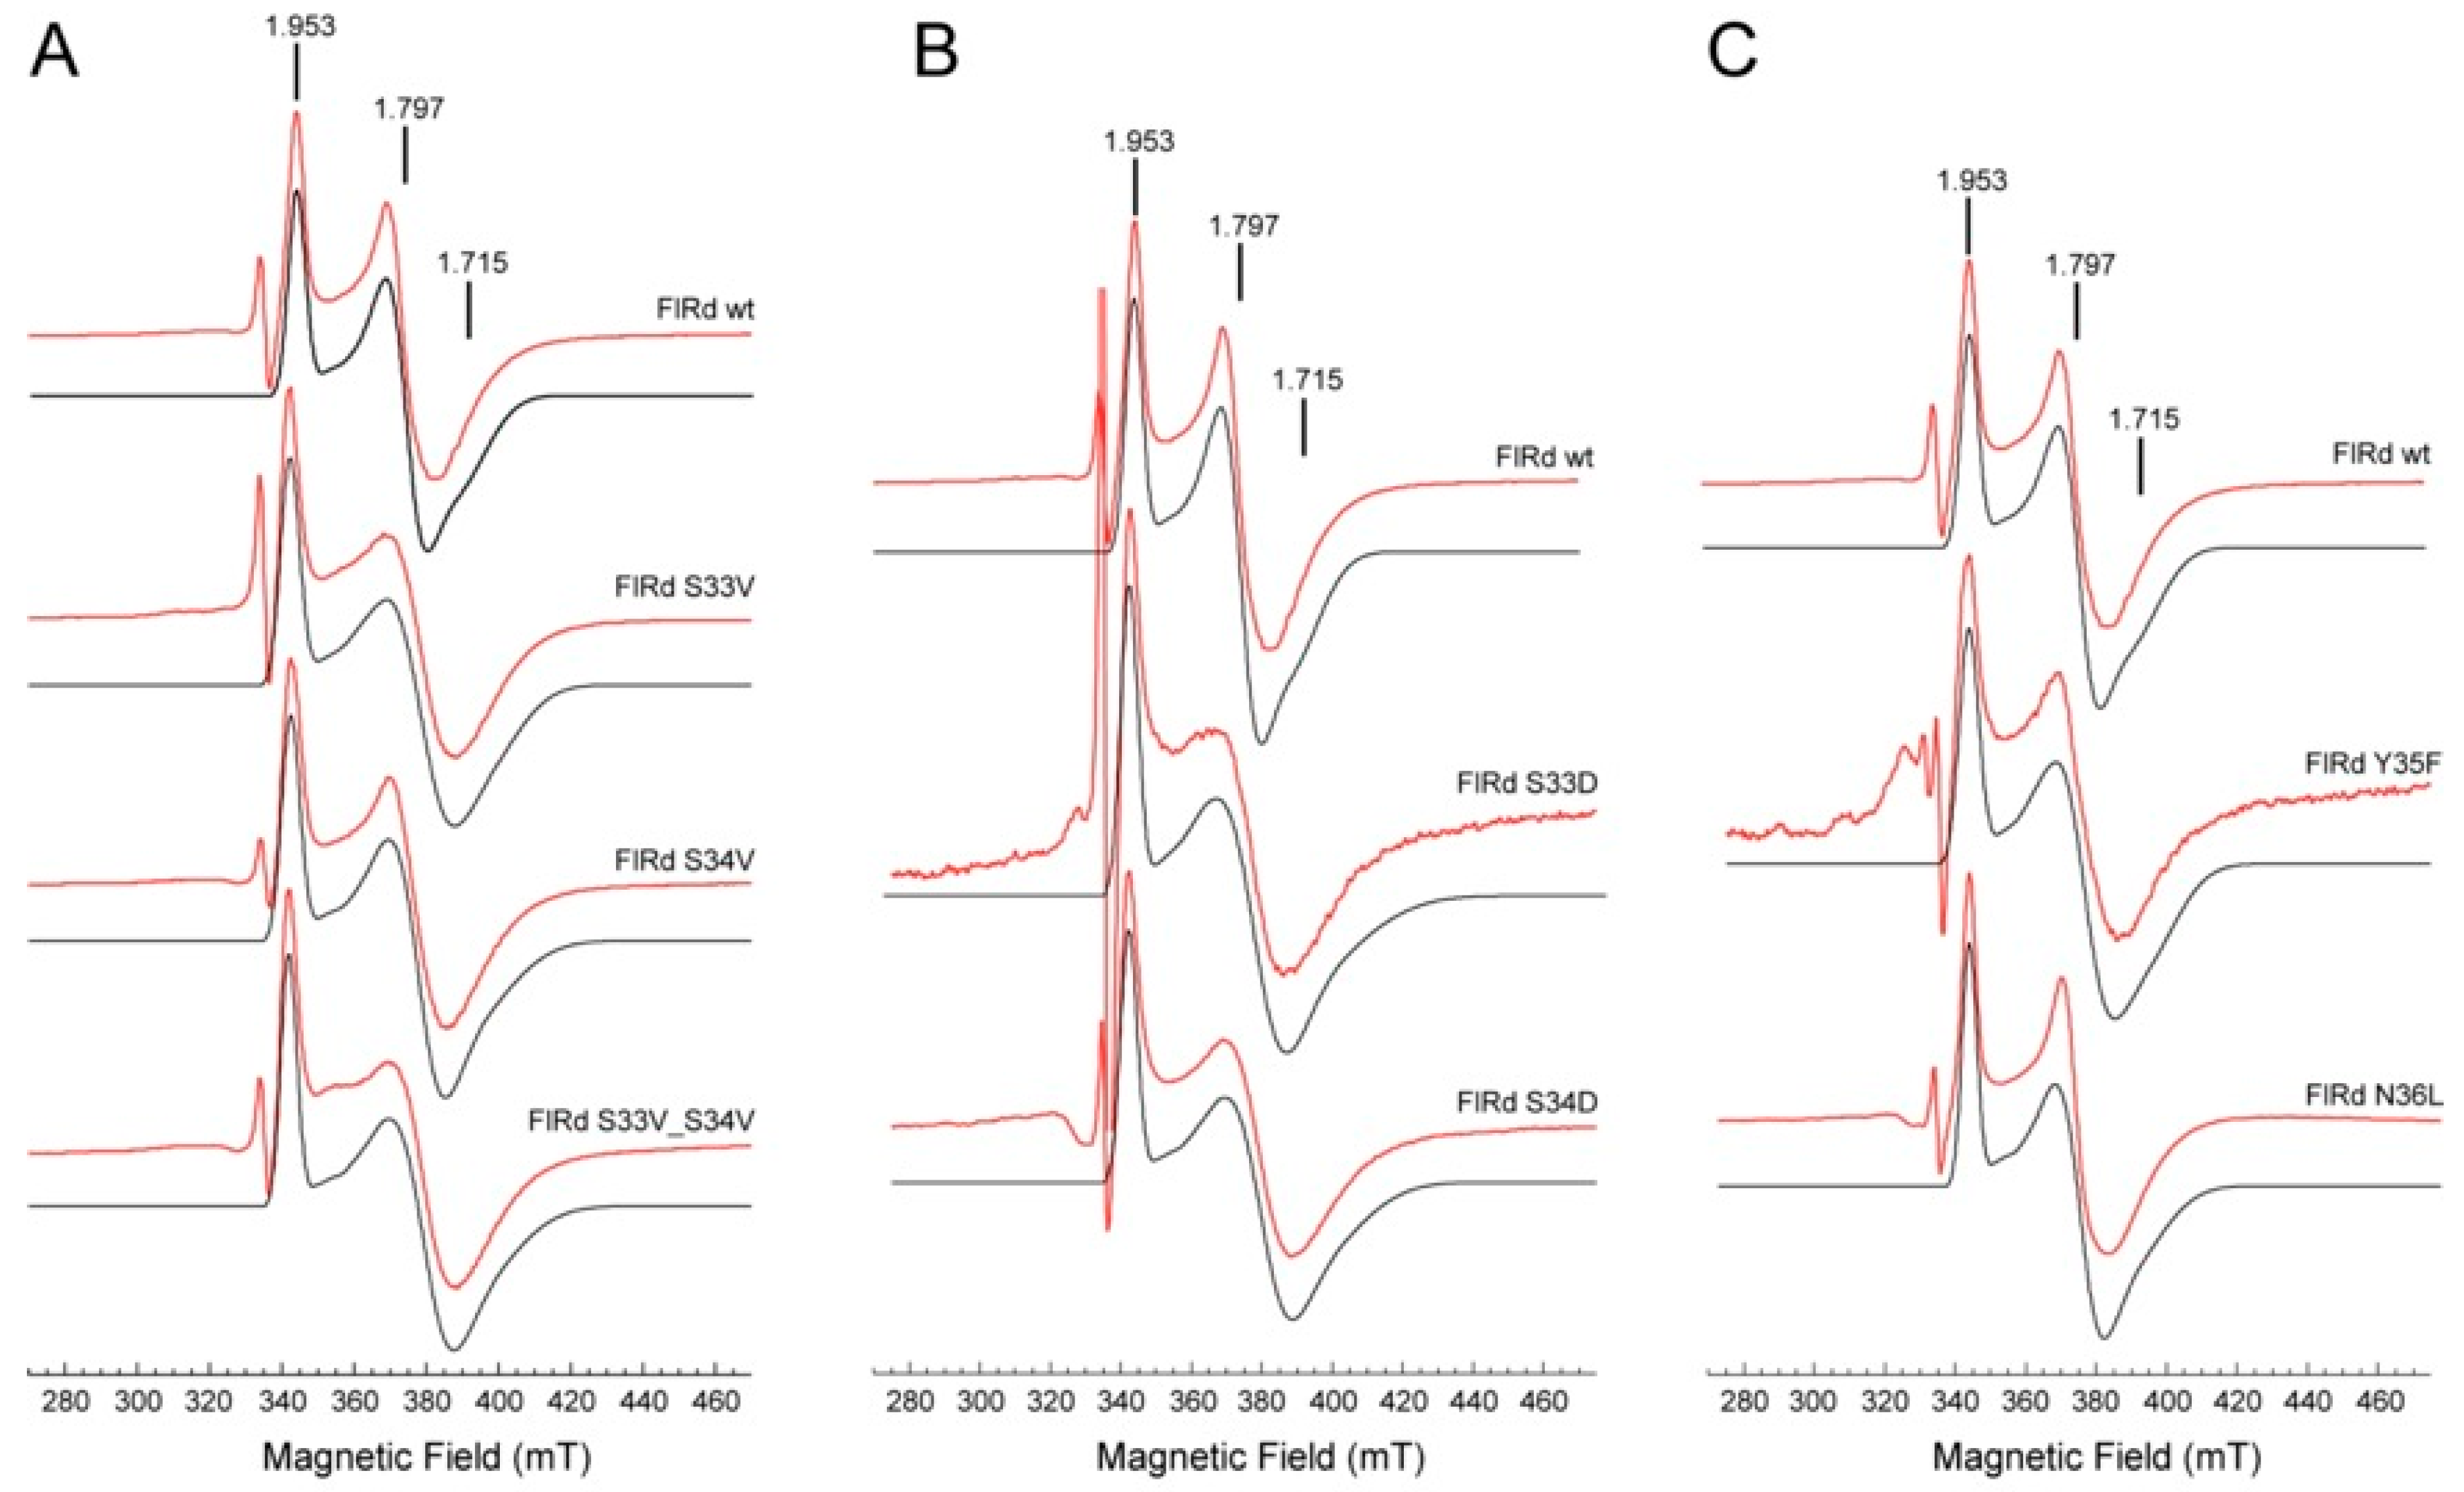
2.3. Spectroscopic Characterization

The UV-visible spectra (Supplementary Materials, Figure S1) of FlRd wt and of mutants were identical, presenting the expected features characteristic of the contributions of the FMN and rubredoxin moieties in the oxidized state, with maxima at 380 nm and 470 nm and a shoulder at 580 nm. Since the diiron sites were not detected by UV-visible spectroscopy due to their low molar absorptivity, they were characterized by EPR spectroscopy.
In the as-purified (oxidized) state, the EPR spectra acquired for all the proteins exhibited identical signals at g = 4.3 and 9.2, attributable respectively to the middle (|±3/2>) and lower (|±1/2>) doublets of a high-spin (S = 5/2) ferric center, with a rhombicity (E/D) close to 0.3, characteristic of the ferric rubredoxin sites (Supplementary Materials, Figure S2). These results indicate that the rubredoxin sites in all mutants were unaltered in relation to the wt enzyme. Since no other EPR signals were detected either at lower or higher temperatures (the ferric ions were antiferromagnetically coupled, yielding a total zero spin for the ground state), it was necessary to partially reduce the enzymes to observe the diiron center, what was achieved by addition of substoichiometric amounts of menadiol under anaerobic conditions (reduction potential of −80 mV [30], adequate to partially reduce the diiron site, which for the wt protein has reduction potentials of −20 and −90 mV for the two consecutive redox transitions [31]). Under these conditions, all proteins revealed a quasi-axial signal typical of the antiferromagnetically coupled diiron site in its mixed valence form (Fe(III)-Fe(II)), with S = ½. In the EPR spectra of the partially reduced samples, a low-intensity isotropic signal at g = 2.0 was also observed, attributable to the semiquinone form of the FMN. The g-values for the diiron sites obtained by spectral simulation showed only slight variations (Table 1, Figure 3). Consequently, it may be concluded that their electronic properties and therefore their structures remained essentially unaltered upon the mutations. Since in all variants menadiol was able to reduce the diiron sites to their mixed valence forms, it may also be qualitatively concluded that the reduction potentials of the sites must be similar.
Having ascertained that, overall, the wt and mutant proteins had similar properties, i.e., the mutations did not lead to detectable alterations in the protein and cofactors structures, we proceeded with the enzymatic studies and performed a comprehensive comparison of the reactivity of all proteins towards the reduction of the main substrate, NO, but also towards O2.

2.4. Kinetics

The O2 and NO reductase activities of FlRd wt and mutants were determined amperometrically, with modified Clark-type electrodes. The assays were performed in the presence of NADH:flavorubredoxin oxidoreductase to allow electron transfer between the electron donor, NADH and the FlRd, as described previously [11,23]. The reaction rates calculated for each protein are presented in Figure 4 as percentages of those obtained for the wt enzyme. Since the incorporation of iron and FMN in the mutants and wt protein were not identical, the data were also normalized taking these variations into account. In this case, the reaction rates were normalized according to the iron or FMN content of each protein sample, respectively, considering the expected incorporation (three irons atoms per protein monomer and 1 FMN per protein monomer). Averaged rates considering the protein concentration and iron and FMN content are displayed in Table 2 and in the Supplementary Materials, Figure S3.
The NO reduction rates showed a significant decrease, between 46% and 99%, in all the mutant proteins when compared to the wild type, and the largest differences were observed for the S33V, S34V, S33V_S34V and N36L variants (Figure 4, panel A).
In the case of oxygen, a smaller change in activity was observed between the wild type and the mutant proteins (Figure 4, panel B). Although similar within the experimental error, the S33D and S34D mutants nevertheless had a slightly higher reduction rate when compared to the wild type enzyme (118% and 109%, respectively). When considering the different extents of cofactor incorporation, only S34V, Y35F and N36L mutants presented lower reaction rates, beyond the experimental error (Supplementary Materials, Figure S3, panel B).
It is clear from these data that the E. coli FDP -GSSYN- motif is highly relevant for NO reduction, as the larger differences in relation to the wild type protein were observed when NO was used as substrate. In this case, in the more affected mutants, their ability to reduce the substrate was almost completely abolished. Even in those where the effect was smaller, it was still larger than the one observed when O2 was used as substrate. The S34V and N36L mutants were the most affected for both substrates. This different behavior towards NO and O2 was even more significant if we take into account that the absolute value for NO reduction by the wild type protein was ca. 10 times higher than the one observed for O2 reduction (Table 2).

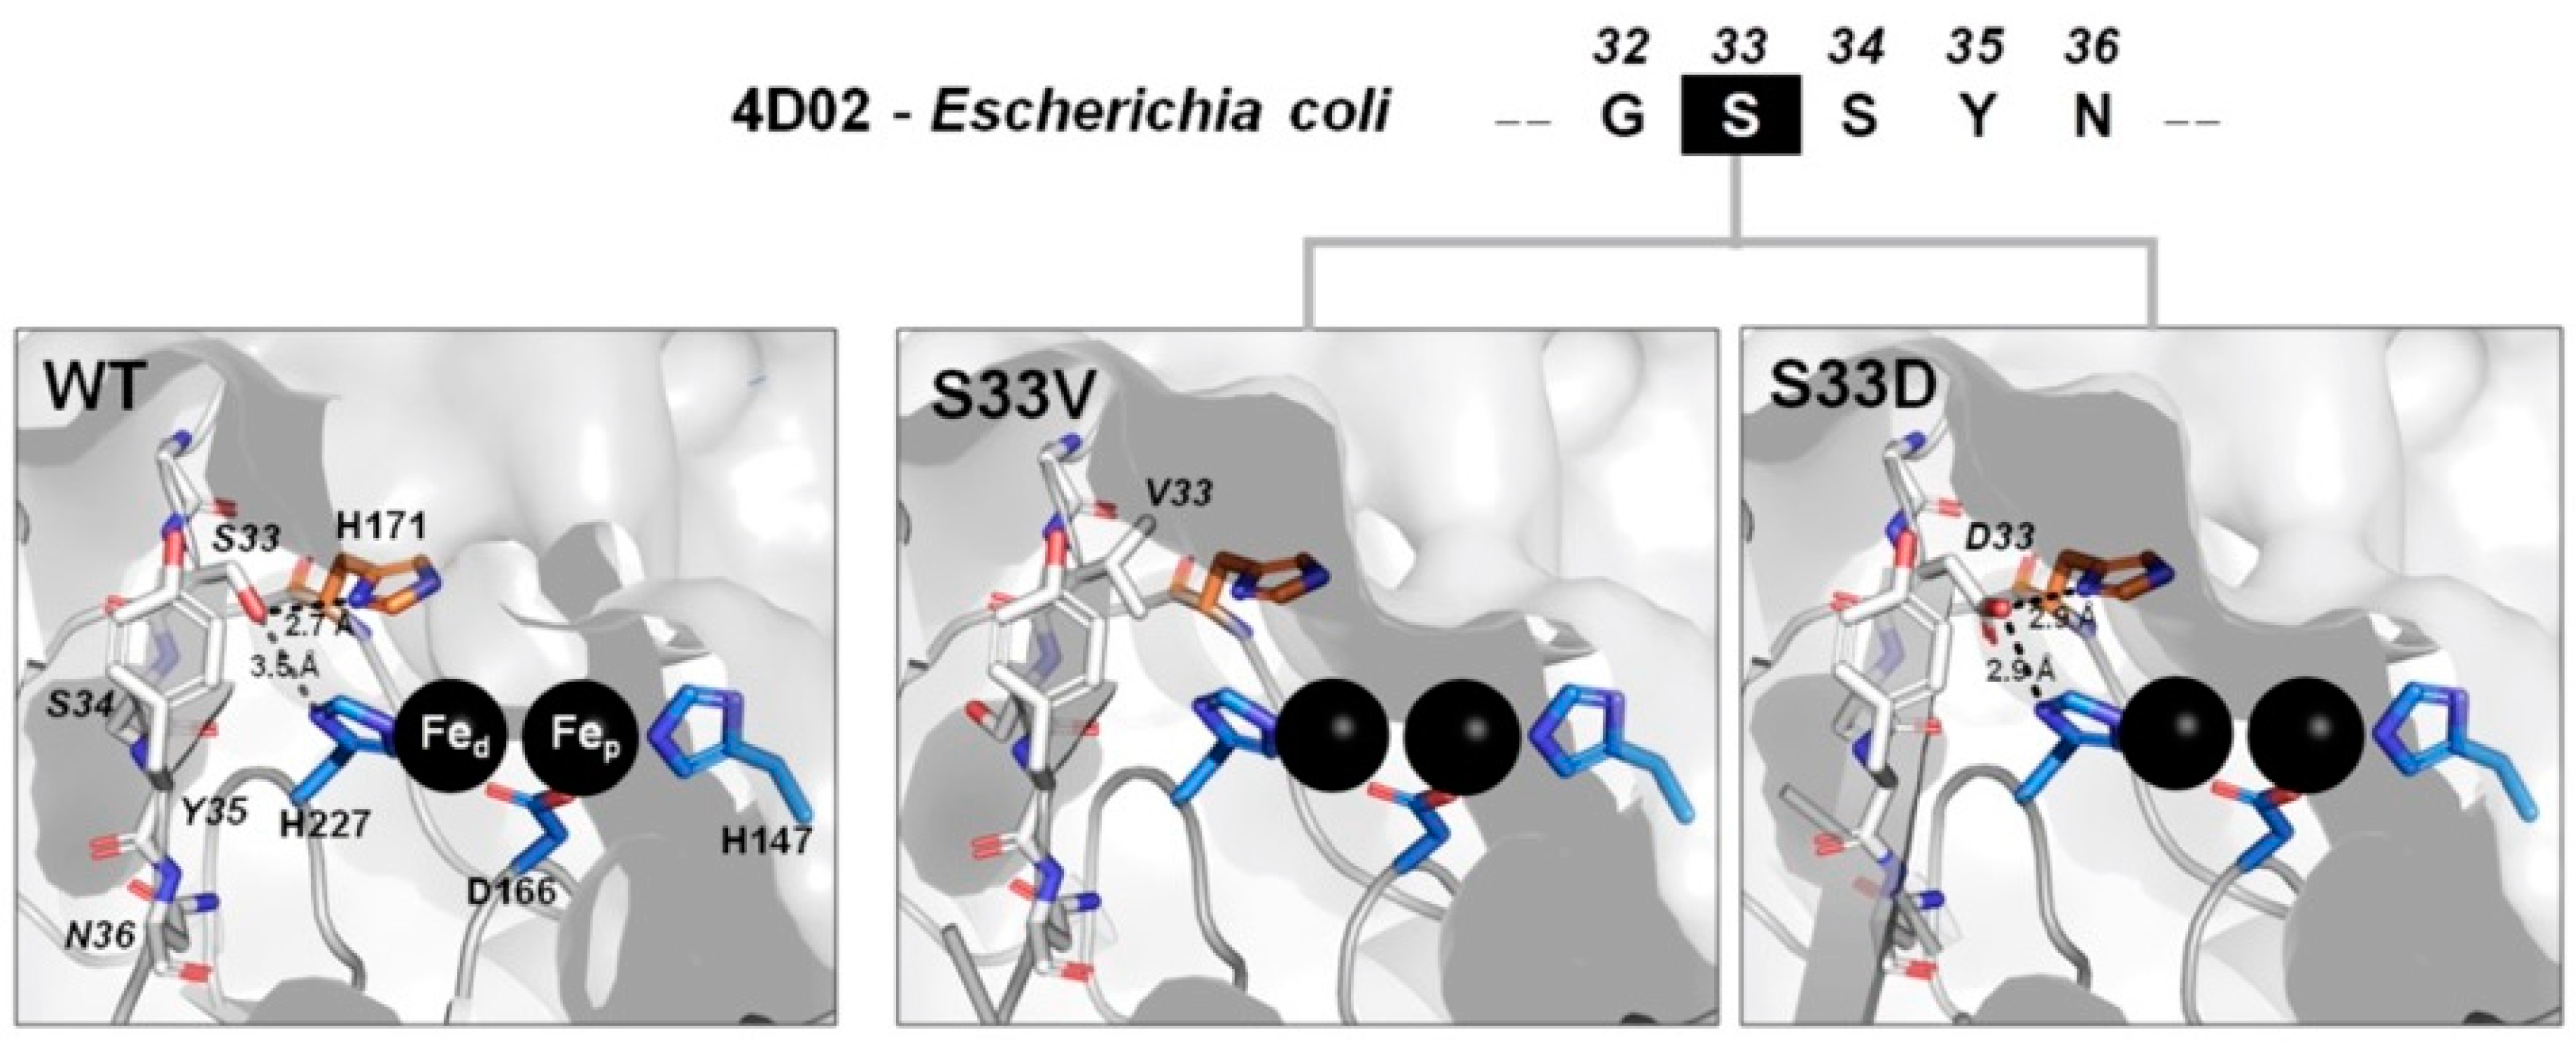
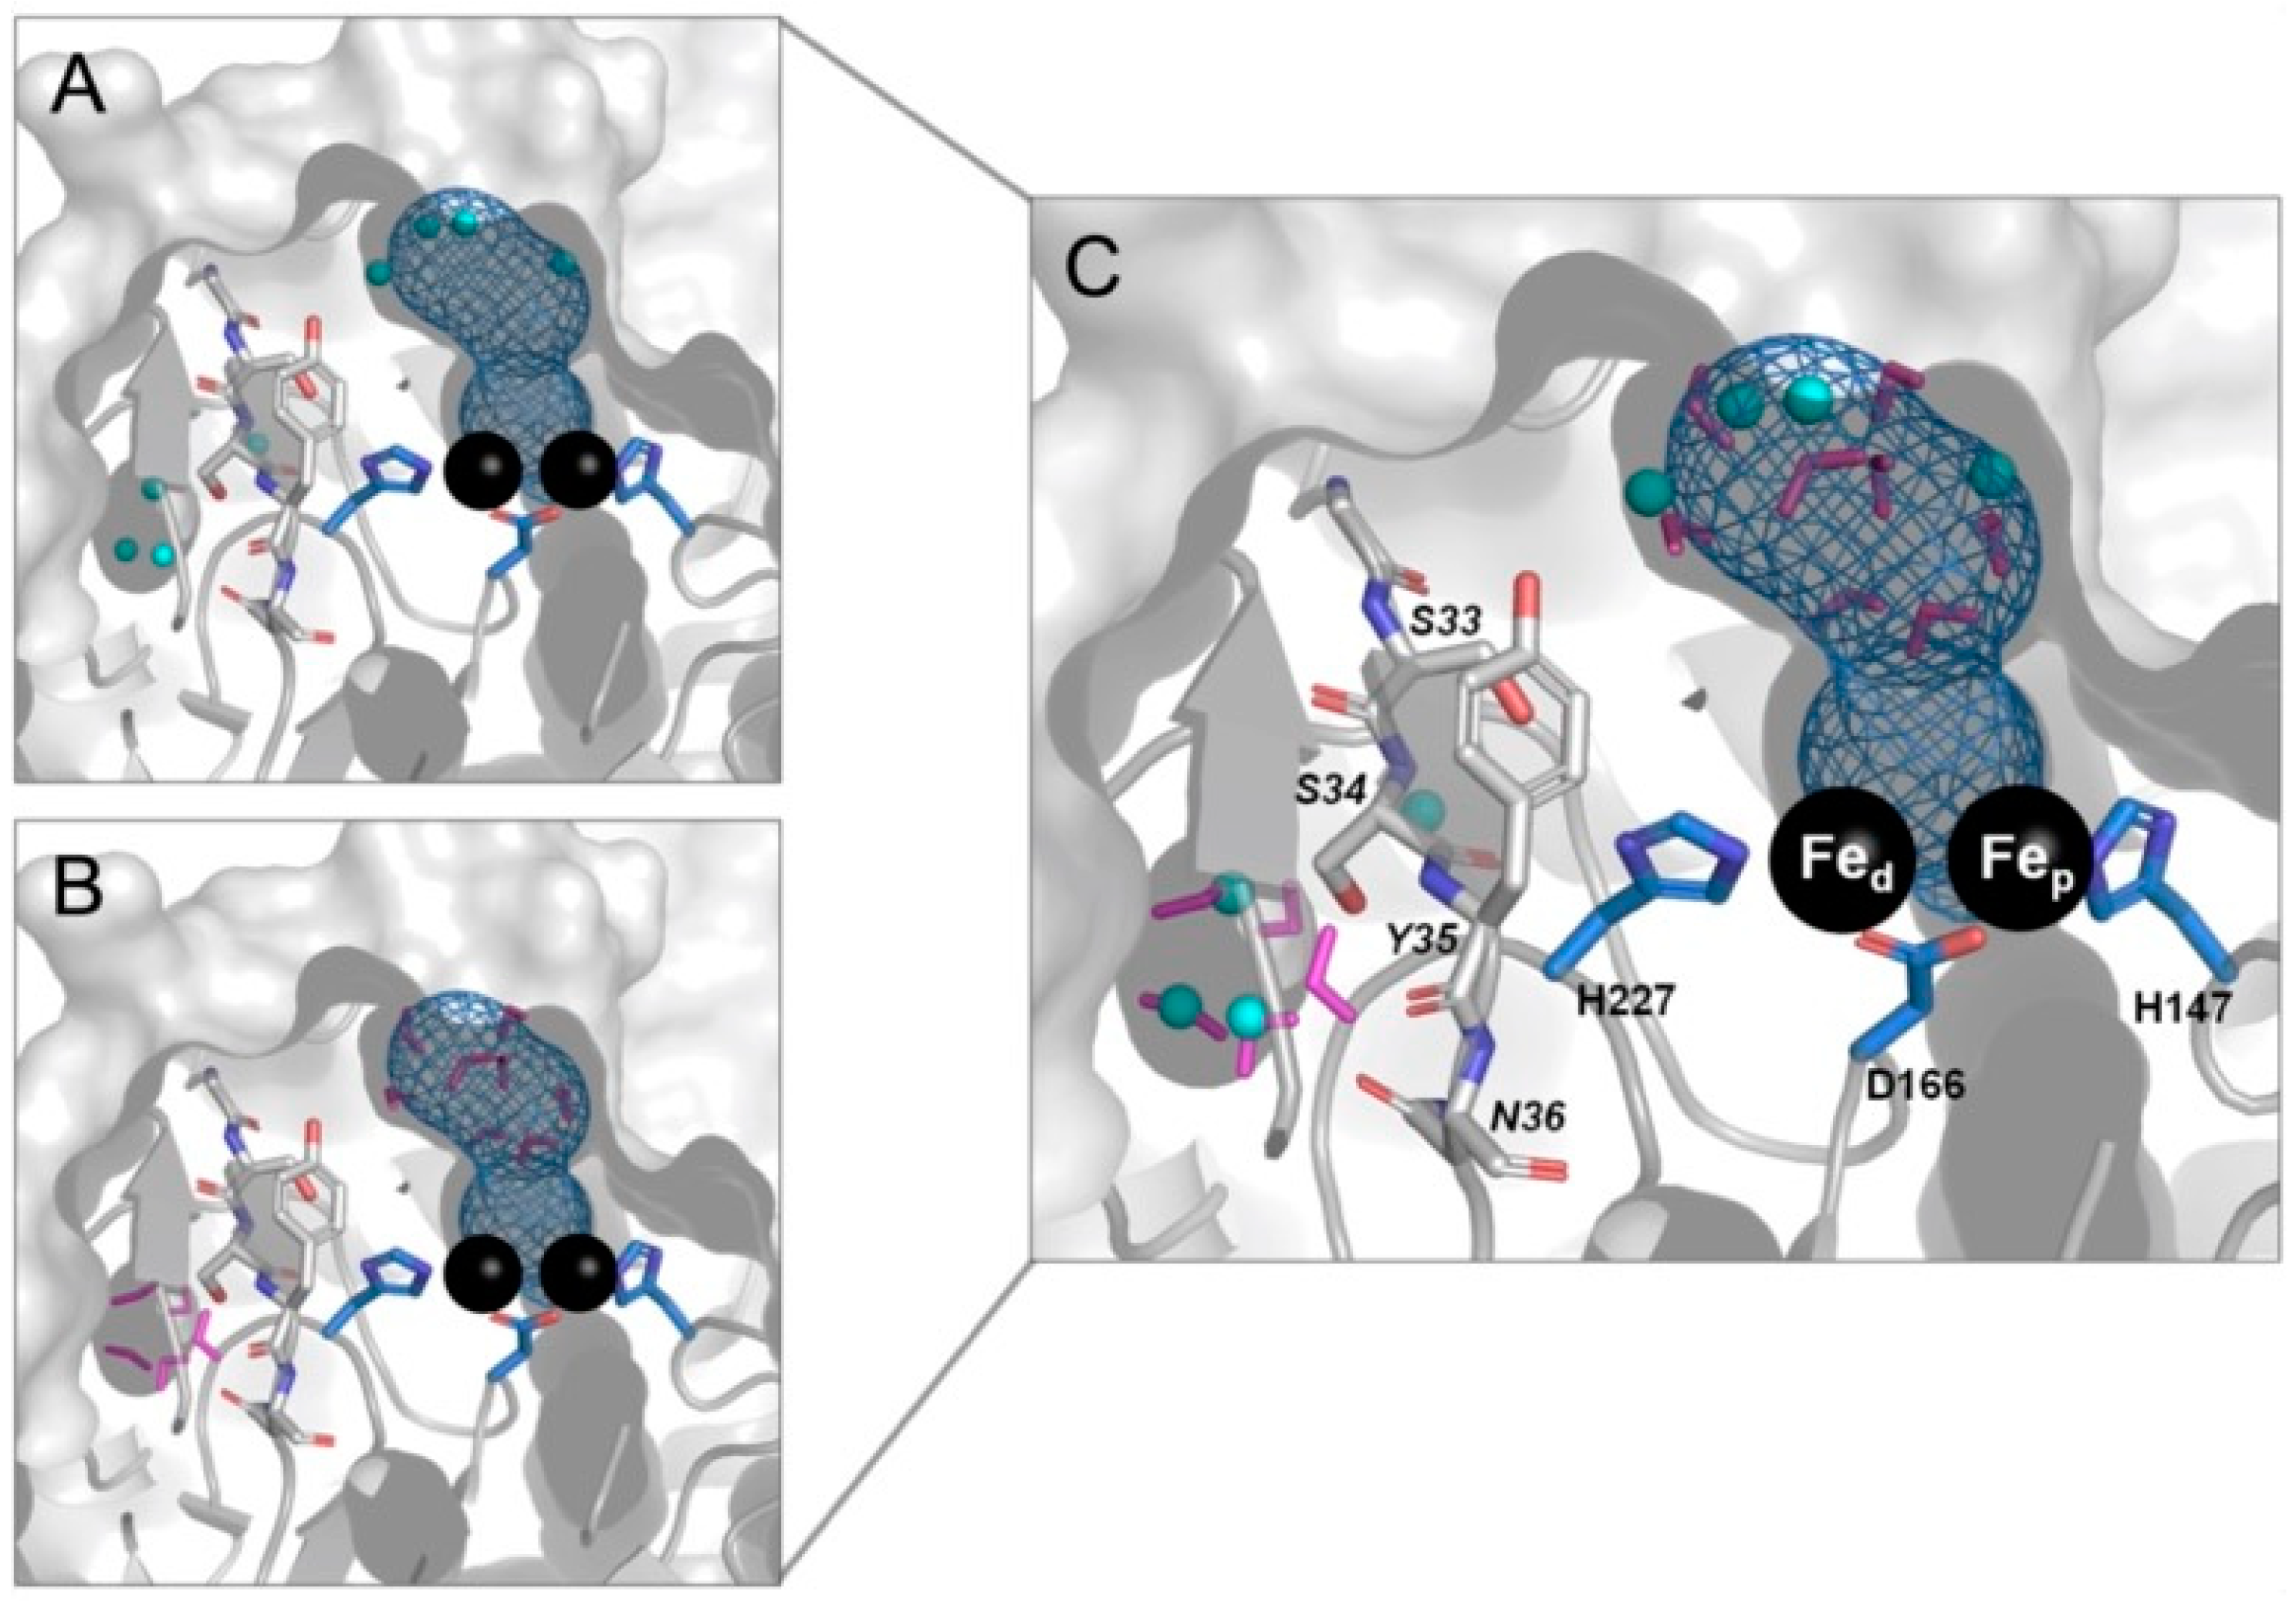
2.5. Molecular Modeling

While the overall biochemical and spectroscopic properties of the mutants resembled those of the wt protein, indicating that the redox and catalytic centers were not significantly affected, the NO reduction activity was severely hampered in the mutants. In a first attempt to rationalize the impact of the mutations on the enzyme, namely in its enzymatic activities, we built homology-based 3D models of all mutants, using the structure of the wt protein (PDB code: 4D02) as a template.
As mentioned above, analysis of the wt FDP structure (Figure 1B and Figure 5) showed that the residue Ser33 is at hydrogen-bonding distance from His171 and is also very close to His227 (3.5 Å), which is a ligand of the diiron center. Taking into account that proteins are dynamic, it is very likely that Ser33 might also interact directly with His227. This may affect the metal center properties during catalysis and/or the local dynamics in this region. Mutation of this residue to a hydrophobic one, such as valine (mutant S33V), disrupts the hydrogen bonds with the surrounding histidines (Figure 5).
Also, the residue His171, which is part of the small channel, is located at the entrance of the catalytic site pocket (Figure 2); although the function of this channel is not fully established, it has been proposed [20] to act as an exit channel for the products of catalysis (depending on the substrate, the two possible products are the polar molecules N2O or H2O). In addition, this channel may act as a proton conduction path in which His171 may play a role, which, in turn, may have an impact on the catalysis, considering that both reduction reactions (of NO or O2) require protons (see Equations (1) and (2)). Unlike the S33V mutation, the S33D one maintains the hydrophilic character of the residue in position 33 and, according to our model, the aspartate can form simultaneous hydrogen bonds with the two histidines 171 and 227 (Figure 5).
This may indicate that the metal center and/or the proton transfer are not significantly affected by this mutation, which corroborates the fact that there is a considerably less pronounced decrease in activity for nitric oxide reduction and an absence of impact in oxygen reduction activity when compared with the S33V mutant. A perturbation in the small channel dynamics and proton transfer performance might also be expected by the removal of the OH group in the mutation of Tyr35 to phenylalanine, as this residue is located at the entrance of the channel (Figure 2).
The two other residues that were mutated in this study, Ser34 and Asn36, are located in an inner hydrophilic cavity near the active site (Figure 2). Since in the wt protein structure this cavity is filled with water molecules, we used a computational approach to assess the effect of each of those two mutations on hydration. To this end, we used the software Dowser++ [32] to predict the location of water molecules in the homology models. As a control, we also predicted the location of water molecules in the wt protein and compared the results with the water molecules that were visible in the crystal structure (Figure 2 and Figure 6). The results showed that the predictions were in good agreement with what was observed in the experimental structure, although the method predicted the existence of extra water molecules both in the inner cavity and in the small channel (Figure 6). These extra water molecules may have been too mobile to be visible in the static crystallographic structure.
The comparison of the hydration for the wild type and the mutant proteins (Figure 7 and Figure 8) showed that some of the mutations were indeed predicted to have an impact on it. Residues Ser34 and Asn36 were directed towards a hydrophilic cavity, which was predicted to have five water molecules. The S34V mutation reduced the number of water molecules in that cavity from five to three water molecules, as expected due to replacement of a hydrophilic (serine) for a hydrophobic (valine) amino acid (Figure 7). On the other hand, the S34D mutation, which increased the hydrophilic character of the mutated residue, was predicted to increase the hydration in this region from five to six water molecules (Figure 7). The N36L mutation, which also corresponded to a hydrophilic/hydrophobic change, also had an effect on the hydration of the cavity, decreasing the number of water molecules in its interior from five to three (Figure 7).
The double mutant S33V_S34V combined the effects of the individual mutations S33V and S34V and, thus, was predicted to affect both the interactions with His171 and His127 and the hydration of the small cavity. Interestingly, there was a correlation between the effect of the mutations on the hydration of the small cavity and the effect on the enzyme activities. The mutants that reduced the number of water molecules in the inner cavity (S34V, N36L and S33V_S34V) had very low reaction rates, particularly when catalyzing the NO reduction. On the other hand, the S34D mutation, which increased hydration, had a considerably less pronounced effect on the enzyme activity. These results indicate that the effect of these mutations on the enzyme activity may be related to a loss of hydration in their surroundings. One hypothesis is that by decreasing the hydration of the inner cavity, these mutations affect the dynamics close to the active site, which in turn can affect catalysis. This is in line with simulation studies showing that hydration of internal cavities affects enzyme flexibility [33,34].
Tyrosine 35 was at the entrance of the small channel that was predicted to be filled with water molecules in the native enzyme (Figure 2 and Figure 8). Its mutation to phenylalanine (Y35F) did not have a strong impact on the hydration in this location, although it abolished a hydrogen bond with a water molecule, and the removal of the hydroxyl group created space that was filled by a new water molecule above the phenyl group (Figure 7). One possible explanation for the pronounced decrease in activity of this mutant is that the loss of the hydrogen bond with the water molecule at the entrance of the channel could affect product release and/or proton transfer to the catalytic site.
Overall, the models indicate that the mutations studied can have three types of effects. The S33V mutation disrupts the interaction of S33 with the two surrounding histidine residues, which in turn can affect the active site, proton transfer and/or product release. The mutations S34V and N36L, which correspond to the replacement of hydrophilic residues by hydrophobic ones, decrease the hydration of the inner cavity, with possible consequences on the local enzyme dynamics. The Y35F mutation results in the loss of a hydrogen bond with a water molecule in the small channel, which can affect the release of products and/or proton translocation. In addition, the double mutant S33V_S34V can be expected to combine both a lower hydration, due to the S34V mutation, and a lower interaction with H171 and H227, because of the S33V replacement.
A final important remark concerns what happens in the class B FDPs that have a threonine instead of Ser 33. Our modeling (Supplementary Materials, Figure S4) indicated that this is indeed a conservative substitution, as a threonine in this position may still interact with the two histidines, as observed in the structure of the class A FDP from Desulfovibrio gigas (Figure 1C).

3. Materials and Methods

3.1. Protein Expression and Purification

E. coli FDP wild type and site-directed mutants were cloned into pET24(a) plasmids using codons optimized for E. coli. All the plasmids were obtained from Genscript (USA).
For the expression of FDP and its site-directed mutants, 300 mL of LB medium containing 50 µg/mL kanamycin (Roth, Karlsruhe, Germany) was inoculated with a single colony of E. coli B21-Gold (DE3) cells (Agilent, USA) harboring each one of the plasmids. After being grown aerobically for 14 h at 37 °C and 150 rpm, 60 mL of these cultures was used to inoculate 2 L of M9 minimal medium, in 2 L Erlenmeyer flasks, containing 50 µg/mL kanamycin and supplemented with 0.1 mM of FeSO4 (VWR Chemicals, UK). These cultures were grown at 37 °C and 150 rpm up to an optical density at 600 nm of 0.4. At this point, 0.1 mM FeSO4 was added and the protein expression was induced by the addition of 100 μM of isopropyl β-d-1-thiogalactopyranoside (Fisher BioReagents, USA). After growing for 6 h at 30 °C, cells were harvested by centrifugation, resuspended in 20 mM Tris-HCl buffer, pH 7.5 (VWR Chemicals, UK), and disrupted by three cycles in a French press cell (Thermo Scientific, USA) at 16,000 psi in the presence of DNAse (Roche, Basel, Switzerland). The crude extracts were subjected to a low-speed centrifugation at 25,000× g for 30 min, followed by an ultracentrifugation at 138,000× g for 2 h at 4 °C. The soluble extracts were dialyzed overnight at 4 °C against 20 mM Tris-HCl 7.5 containing 18% glycerol (Fisher BioReagents, USA) (buffer A) and then loaded into a Q-sepharose Fast-Flow column (160 mL, GE Healthcare, USA) previously equilibrated with buffer A. All the proteins were eluted with a linear gradient from buffer A to 20 mM Tris-HCl, pH 7.5, containing 18% glycerol and 500 mM NaCl (Fisher Scientific, USA) (buffer B). The eluted fractions were analyzed by SDS-PAGE and UV-visible spectroscopy. Fractions with the desired proteins were pooled and concentrated.
The expression and purification procedures of NADH:flavorubredoxin oxidoreductase (NROR) used in the enzymatic assays were performed as previously described [31].

3.2. Protein, Metal and Flavin Quantification

Purified protein samples were quantified and their flavin and iron content determined as previously described [35].

3.3. Spectroscopic Methods

UV-visible spectra were obtained with a PerkinElmer Lambda 35 spectrophotometer (PerkinElmer, Waltham, MA, USA). Electron paramagnetic resonance (EPR) spectroscopy was performed using a Bruker EMX spectrometer (Bruker BioSpin GmbH, Germany) equipped with an Oxford Instruments ESR-900 (Oxford Cryosystems, UK) continuous flow helium cryostat and a high-sensitivity perpendicular-mode rectangular cavity. Protein samples were prepared aerobically to final concentrations of 200 μM. Partially reduced samples were prepared anaerobically by incubation with 1 molar equivalent of menadiol.

3.4. Protein Quaternary Structure Determination

The quaternary structure of the proteins was determined by size exclusion chromatography as previously described [35]. Protein samples were loaded separately into a 25 mL Superdex S-200 10/300 GL column (GE Healthcare, USA), previously equilibrated with 20 mM Tris–HCl, pH 7.5, containing 18% glycerol and 150 mM NaCl. A mixture mixture (GE Healthcare, USA) containing ferritin (Mm 440 kDa), aldolase (Mm 158 kDa), conalbumin (Mm 75 kDa), carbonic anhydrase (Mm 29 kDa) and cytochrome c (Mm 12.4 kDa) was used as a standard and dextran blue (Mm 2000 kDa) was used as a void volume marker.

3.5. Amperometric Measurements of O2 and NO Reductase Activities

The O2 and NO reductase activities of the proteins were measured amperometrically with Clark-type electrodes selective for O2 (Oxygraph-2K, Oroboros Instruments, Innsbruck, Austria) or NO (ISO-NOP, World Precision Instruments, Sarasota, FL, USA), as previously described [35]. The assays were performed in 50 mM Tris–HCl, pH 7.5, containing 18% glycerol. The O2 reductase activity was evaluated at 25 °C in air equilibrated buffer (~250 µM of O2), in the presence of 5 mM NADH (AppliChem GmbH, Germany) and 0.5 µM of NROR. The reaction was initiated by addition of 1µM of FDP or its variants. Assays were performed in the presence of 640 nM of catalase from bovine liver (Sigma Aldrich, St. Louis, USA), to eliminate hydrogen peroxide produced by NROR. The NO reductase activity was determined under anaerobic conditions in 50 mM Tris–HCl, pH 7.5, containing 18% glycerol and in the presence of an O2 scavenging system (10 mM glucose, (Roth, Karlsruhe, Germany), 375 nM glucose oxidase (Sigma Aldrich, St. Louis, MI, USA) and 750 nM catalase). Sequential additions of NO (up to 12 µM) were followed by addition of 5 mM NADH and 0.7 µM of NROR. The reaction was initiated by the addition of 20 nM or 200 nM of FDP or its variants, respectively. In both cases, the rates presented were calculated by dividing the velocity measured immediately after the enzyme’s addition (M.s−1) by the enzyme’s concentration in the assay.
However, the differences verified in cofactor incorporation (both iron and FMN) had to be considered, as these have an essential role in the enzyme’s activity. Therefore, the reaction rates were normalized according to the iron or FMN content of each protein sample, respectively, considering the expected incorporation (three iron atoms per protein monomer and 1 FMN per protein monomer) (Figure S3). Averaged rates, taking into account protein concentration and iron and FMN content, are displayed in Table 2.

3.6. Thermal Stability

CD spectra of FlRd wt and mutants were measured using a JASCO J-850 CD spectrometer (JASCO, Japan) connected to a Peltier temperature controller. Each solution containing the protein in 20 mM Tris HCl, pH 7.5, buffer was adjusted to a concentration of 3.7 μM.
CD measurements were carried out in a cuvette with a 0.1 cm−1 path length. The scanning speed was 100 nm/min with a bandwidth of 1.0 nm and a response time of 0.5 s. The spectra were obtained from 200 to 260 nm and the experiments were repeated two times.
Thermal denaturation studies were carried out by heating each sample from 20 °C to 100 °C with 5 °C intervals, and the ellipticities were measured using the same parameter settings described above. At each temperature, the sample was equilibrated for 2 min prior to the CD measurements.
The maximum molar ellipticity values at 225 nm were normalized and fitted to the Boltzmann sigmoidal curve using Origin 2019 software [36]:
Y = y m i n + y m a x + y m i n 1 + e ( T m x / d x )
where Tm is the melting temperature, dx is the slope of the curve, Y is the molar ellipticity value, x is the temperature and Tm is the melting temperature [36].

3.7. Homology-Based Modeling and Prediction of Water Molecules

The homology-based models of the mutants S33V, S33T, S33D, S34V, S34D, S33V_S34V, Y35F and N36L were generated with the software Modeller [37], version 9.23, using the structure of the wild type enzyme (PDB code: 4D02) as template. The protocol utilized only optimizes the atoms belonging to the mutated residues and the residues that are located within a 4 Å radius from these residues, maintaining the remaining atoms as fixed to the coordinates found in the template structure. The optimization parameters were set to the software default values. The final model corresponded to the one with the lowest value for the DOPE function out of 20 generated structures.
The locations of water molecules were predicted with the program Dowser++ [32] using the models of the mutants generated by Modeller as input structures. The parameters were kept at their default values.

4. Conclusions

In summary, we showed that in E. coli flavorubredoxin the motif -GSSYN- plays an essential role in catalysis; specifically, for its natural substrate, NO. While the properties of protein and its cofactors in equilibrium were not affected by the mutations, the catalytic activities for NO reduction were severely affected. In the case of Ser33 and Tyr35, the effects observed appeared to result from an impairment of product release and/or proton uptake, while for Ser34 and Asn36, the effect was apparently related to a decrease in the hydration of an internal cavity that could have affected the local flexibility, which in turn may have had an impact on the enzyme kinetics.
The different alterations in the NO and O2 reductions most probably stemmed from diverse effects in the respective rate-limiting steps. The catalytic mechanism for O2 reduction by FDPs is still unknown. In contrast, extensive studies have been performed for the NO reduction mechanism, specifically for the O2-selective FDP from Thermotoga maritima using UV-visible, EPR and Mössbauer spectroscopies, as well as with DFT calculations [38,39,40]. It should nevertheless be stressed that it is not known if these studies can be extrapolated for NO-selective enzymes, since the structural determinants for the substrate selectivity remain unknown. The mechanism (Figure 9) proposed by Kurtz and co-workers suggests that, upon reaction of the fully reduced enzyme with less than one equivalent of NO, a diiron-mononitrosyl species is formed [40,41].
The binding of a second NO molecule leads to the formation of a diiron-dinitrosyl intermediate, which ultimately leads to the formation of the N-N bond and release of N2O, with concomitant uptake of one proton and formation of the second hydroxo bridge between the iron ions [38]. The fully reduced active species is regenerated through the reduction of the ferric ions by the FMN and release of a water molecule upon uptake of a second proton. In this mechanism, proton uptake is a key event with two steps—formation and release of N2O and regeneration of the active diferrous form. Therefore, we might speculate that an impairment of these steps would result in a significant decrease of the enzyme’s activity, as observed in our assays. In the case of the oxygen reduction, which requires four protons, as the turnover rate is significantly lower than for NO, the effect can hardly be observed. In this case, other effects, such as the ones observed in the S34V and N36L mutants, might arise. Work is in progress to obtain crystals of the mutants, the structures of which may further elucidate the effects of each mutation.

Supplementary Materials

The following are available online at https://www.mdpi.com/article/10.3390/catal11080926/s1; Figure S1: UV-visible spectra of FDP wt and site-directed mutants; Figure S2: EPR spectra of ferric rubredoxin sites of FDP wt and site-directed mutants; Figure S3: NO and O2 reduction activities of FDP wt and site-directed mutants taking into consideration the cofactor incorporation; Figure S4: Water molecules observed in X-ray structure; Figure S5: Homology-based models of the S33T variant mutant.

Author Contributions

M.T. and C.V.R. designed the project, M.C.M., F.F., S.F.F., J.C.S. and B.A.S. performed the experimental work and C.M.S., M.C.M. and D.L. performed the calculations. All authors analyzed the data and contributed to the article writing. All authors have read and agreed to the published version of the manuscript.

Funding

This study was financially supported by the Portuguese Fundação para a Ciência e Tecnologia (FCT), grants PTDC/BIA-BQM/27959/2017 and PTDC/BIA-BQM/0562/2020, and Project MOSTMICRO-ITQB with references UIDB/04612/2020 and UIDP/04612/2020. This project has also received funding from the European Union’s Horizon 2020 research and innovation program under grant agreement 810856. MCM is the recipient of FCT grant SFRH/BD/143651/2019. BAS is the recipient of FCT grant DFA/BD/8066/2020.

Conflicts of Interest

The authors declare no conflict of interest.

References

  1. Ignarro, L.; Freeman, B. (Eds.) Nitric Oxide, 3rd ed.; Academic Press: London, UK, 2017; ISBN 9780128042731. [Google Scholar]
  2. Bogdan, C. Nitric oxide and the immune response. Nat. Immunol. 2001, 2, 907–916. [Google Scholar] [CrossRef] [PubMed]
  3. Wink, D.A.; Hines, H.B.; Cheng, R.Y.S.; Switzer, C.H.; Flores-Santana, W.; Vitek, M.P.; Ridnour, L.A.; Colton, C.A. Nitric oxide and redox mechanisms in the immune response. J. Leukoc. Biol. 2011, 89, 873–891. [Google Scholar] [CrossRef] [PubMed] [Green Version]
  4. Lu, Z.; Imlay, J.A. When anaerobes encounter oxygen: Mechanisms of oxygen toxicity, tolerance and defence. Nat. Rev. Microbiol. 2021. [Google Scholar] [CrossRef] [PubMed]
  5. Morvan, C.; Folgosa, F.; Kint, N.; Teixeira, M.; Martin-Verstraete, I. Responses of Clostridia to oxygen: From detoxification to adaptive strategies. Environ. Microbiol. 2021. [Google Scholar] [CrossRef]
  6. Romão, C.V.; Vicente, J.B.; Borges, P.T.; Frazão, C.; Teixeira, M. The dual function of flavodiiron proteins: Oxygen and/or nitric oxide reductases. J. Biol. Inorg. Chem. 2016, 21, 39–52. [Google Scholar] [CrossRef]
  7. Martins, M.C.; Romão, C.V.; Folgosa, F.; Borges, P.T.; Frazão, C.; Teixeira, M. How superoxide reductases and flavodiiron proteins combat oxidative stress in anaerobes. Free Radic. Biol. Med. 2019, 140, 36–60. [Google Scholar] [CrossRef]
  8. Chen, L.; Liu, M.Y.; LeGall, J.; Fareleira, P.; Santos, H.; Xavier, A.V. Rubredoxin Oxidase, a New Flavo-Hemo-Protein, Is the Site of Oxygen Reduction to Water by the “Strict Anaerobe” Desulfovibrio gigas. Biochem. Biophys. Res. Commun. 1993, 193, 100–105. [Google Scholar] [CrossRef]
  9. Gardner, A.M.; Helmick, R.A.; Gardner, P.R. Flavorubredoxin, an inducible catalyst for nitric oxide reduction and detoxification in Escherichia coli. J. Biol. Chem. 2002, 277, 8172–8177. [Google Scholar] [CrossRef] [Green Version]
  10. Gardner, A.M.; Gardner, P.R. Flavohemoglobin Detoxifies Nitric Oxide in Aerobic, but Not Anaerobic, Escherichia coli. J. Biol. Chem. 2002, 277, 8166–8171. [Google Scholar] [CrossRef] [Green Version]
  11. Gomes, C.M.; Giuffrè, A.; Forte, E.; Vicente, J.B.; Saraiva, L.M.; Brunori, M.; Teixeira, M. A Novel Type of Nitric-oxide Reductase. J. Biol. Chem. 2002, 277, 25273–25276. [Google Scholar] [CrossRef] [Green Version]
  12. Rodrigues, R.; Vicente, J.B.; Félix, R.; Oliveira, S.; Teixeira, M.; Rodrigues-Pousada, C. Desulfovibrio gigas flavodiiron protein affords protection against nitrosative stress in vivo. J. Bacteriol. 2006, 8, 2745–2751. [Google Scholar] [CrossRef] [Green Version]
  13. Silaghi-Dumitrescu, R.; Coulter, E.D.; Das, A.; Ljungdahl, L.G.; Jameson, G.N.L.; Huynh, B.H.; Kurtz, D.M. A flavodiiron protein and high molecular weight rubredoxin from Moorella thermoacetica with nitric oxide reductase activity. Biochemistry 2003, 42, 2806–2815. [Google Scholar] [CrossRef]
  14. Justino, M.C.; Vicente, J.B.; Teixeira, M.; Saraiva, L.M. New Genes Implicated in the Protection of Anaerobically Grown Escherichia coli against Nitric Oxide. J. Biol. Chem. 2005, 280, 2636–2643. [Google Scholar] [CrossRef] [Green Version]
  15. Mehta, H.H.; Liu, Y.; Zhang, M.Q.; Spiro, S. Genome-wide analysis of the response to nitric oxide in uropathogenic Escherichia coli CFT073. Microb. Genomics 2015, 1, e000031. [Google Scholar] [CrossRef] [Green Version]
  16. Hutchings, M.I.; Mandhana, N.; Spiro, S. The NorR Protein of Escherichia coli Activates Expression of the Flavorubredoxin Gene norV in Response to Reactive Nitrogen Species. J. Bacteriol. 2002, 184, 4640–4643. [Google Scholar] [CrossRef] [Green Version]
  17. Mukhopadhyay, P.; Zheng, M.; Bedzyk, L.A.; LaRossa, R.A.; Storz, G. Prominent roles of the NorR and Fur regulators in the Escherichia coli transcriptional response to reactive nitrogen species. Proc. Natl. Acad. Sci. USA 2004, 101, 745–750. [Google Scholar] [CrossRef] [Green Version]
  18. Frazão, C.; Silva, G.; Gomes, C.M.; Matias, P.; Coelho, R.; Sieker, L.; Macedo, S.; Liu, M.Y.; Oliveira, S.; Teixeira, M.; et al. Structure of a dioxygen reduction enzyme from Desulfovibrio gigas. Nat. Struct. Biol. 2000, 7, 1041–1045. [Google Scholar] [CrossRef]
  19. Silaghi-Dumitrescu, R.; Kurtz Donald, M.; Ljungdahl, L.G.; Lanzilotta, W.N. X-ray Crystal Structures of Moorella thermoacetica FprA. Novel Diiron Site Structure and Mechanistic Insights into a Scavenging Nitric Oxide Reductase. Biochemistry 2005, 44, 6492–6501. [Google Scholar] [CrossRef]
  20. Romão, C.V.; Vicente, J.B.; Borges, P.T.; Victor, B.L.; Lamosa, P.; Silva, E.; Pereira, L.; Bandeiras, T.M.; Soares, C.M.; Carrondo, M.A.; et al. Structure of Escherichia coli Flavodiiron Nitric Oxide Reductase. J. Mol. Biol. 2016, 428, 4686–4707. [Google Scholar] [CrossRef]
  21. Di Matteo, A.; Scandurra, F.M.; Testa, F.; Forte, E.; Sarti, P.; Brunori, M.; Giuffrè, A. The O2-scavenging Flavodiiron Protein in the Human Parasite Giardia intestinalis. J. Biol. Chem. 2008, 283, 4061–4068. [Google Scholar] [CrossRef] [Green Version]
  22. Folgosa, F.; Martins, M.C.; Teixeira, M. Diversity and complexity of flavodiiron NO/O2 reductases. FEMS Microbiol. Lett. 2018, 365, fnx267. [Google Scholar] [CrossRef] [PubMed] [Green Version]
  23. Gomes, C.M.; Vicente, J.B.; Wasserfallen, A.; Teixeira, M. Spectroscopic studies and characterization of a novel electron-transfer chain from Escherichia coli involving a flavorubredoxin and its flavoprotein reductase partner. Biochemistry 2000, 39, 16230–16237. [Google Scholar] [CrossRef]
  24. Wasserfallen, A.; Ragettli, S.; Jouanneau, Y.; Leisinger, T. A family of flavoproteins in the domains Archaea and Bacteria. Eur. J. Biochem. 1998, 254, 325–332. [Google Scholar] [CrossRef] [PubMed]
  25. Vicente, J.B.; Carrondo, M.A.; Teixeira, M.; Frazão, C. Flavodiiron Proteins: Nitric Oxide and/or Oxygen Reductases. In Handbook of Metalloproteins; Major Reference Works; John Wiley & Sons, Ltd.: Chichester, UK, 2007; ISBN 9780470028636. [Google Scholar]
  26. Solomon, E.I.; Brunold, T.C.; Davis, M.I.; Kemsley, J.N.; Lee, S.K.; Lehnert, N.; Neese, F.; Skulan, A.J.; Yang, Y.S.; Zhou, J. Geometric and electronic structure/function correlations in non-heme iron enzymes. Chem. Rev. 2000, 100, 235–350. [Google Scholar] [CrossRef] [PubMed]
  27. Gomes, C.M.; Teixeira, M. The Family of A-type Flavoproteins: New Members and Definition of Unique Sequence Fingerprints. In Flavins and Flavoproteins; Ghisla, S., Kroneck, P.M.H., Macheroux, P., Sund, H., Eds.; Weber: Berlin, Germany, 1999; pp. 219–222. ISBN 3000051287. [Google Scholar]
  28. Pravda, L.; Sehnal, D.; Toušek, D.; Navrátilová, V.; Bazgier, V.; Berka, K.; Svobodová Vařeková, R.; Koča, J.; Otyepka, M. MOLEonline: A web-based tool for analyzing channels, tunnels and pores (2018 update). Nucleic Acids Res. 2018, 46, W368–W373. [Google Scholar] [CrossRef] [PubMed] [Green Version]
  29. Petasis, D.T.; Hendrich, M.P. Quantitative Interpretation of Multifrequency Multimode EPR Spectra of Metal Containing Proteins, Enzymes, and Biomimetic Complexes. Methods Enzymol. 2015, 563, 171–208. [Google Scholar] [PubMed] [Green Version]
  30. Marritt, S.J.; Lowe, T.G.; Bye, J.; McMillan, D.G.G.; Shi, L.; Fredrickson, J.; Zachara, J.; Richardson, D.J.; Cheesman, M.R.; Jeuken, L.J.C.; et al. A functional description of CymA, an electron-transfer hub supporting anaerobic respiratory flexibility in Shewanella. Biochem. J. 2012, 444, 465–474. [Google Scholar] [CrossRef] [Green Version]
  31. Vicente, J.B.; Teixeira, M. Redox and Spectroscopic Properties of the Escherichia coli Nitric Oxide-detoxifying System Involving Flavorubredoxin and Its NADH-oxidizing Redox Partner. J. Biol. Chem. 2005, 280, 34599–34608. [Google Scholar] [CrossRef] [Green Version]
  32. Morozenko, A.; Stuchebrukhov, A.A. Dowser++, a new method of hydrating protein structures. Proteins Struct. Funct. Bioinform. 2016, 84, 1347–1357. [Google Scholar] [CrossRef] [Green Version]
  33. Rahaman, O.; Kalimeri, M.; Melchionna, S.; Hénin, J.; Sterpone, F. Role of Internal Water on Protein Thermal Stability: The Case of Homologous G Domains. J. Phys. Chem. B 2015, 119, 8939–8949. [Google Scholar] [CrossRef] [Green Version]
  34. Chakraborty, D.; Taly, A.; Sterpone, F. Stay Wet, Stay Stable? How Internal Water Helps the Stability of Thermophilic Proteins. J. Phys. Chem. B 2015, 119, 12760–12770. [Google Scholar] [CrossRef] [Green Version]
  35. Folgosa, F.; Martins, M.C.; Teixeira, M. The multidomain flavodiiron protein from Clostridium difficile 630 is an NADH:oxygen oxidoreductase. Sci. Rep. 2018, 8, 10164. [Google Scholar] [CrossRef]
  36. Lee, S.; Kim, J.; Han, S.; Park, C.-J. Recognition and Unfolding of c-MYC and Telomeric G-Quadruplex DNAs by the RecQ C-Terminal Domain of Human Bloom Syndrome Helicase. ACS Omega 2020, 5, 14513–14522. [Google Scholar] [CrossRef]
  37. Sali, A.; Blundell, T.L. Comparative protein modelling by satisfaction of spatial restraints. J. Mol. Biol. 1993, 234, 779–815. [Google Scholar] [CrossRef]
  38. Weitz, A.C.; Giri, N.; Frederick, R.E.; Kurtz, D.M.; Bominaar, E.L.; Hendrich, M.P. Spectroscopy and DFT Calculations of Flavo–Diiron Nitric Oxide Reductase Identify Bridging Structures of NO-Coordinated Diiron Intermediates. ACS Catal. 2018, 8, 11704–11715. [Google Scholar] [CrossRef]
  39. Weitz, A.C.; Giri, N.; Caranto, J.D.; Kurtz, D.M.; Bominaar, E.L.; Hendrich, M.P. Spectroscopy and DFT Calculations of a Flavo-diiron Enzyme Implicate New Diiron Site Structures. J. Am. Chem. Soc. 2017, 139, 12009–12019. [Google Scholar] [CrossRef]
  40. Hayashi, T.; Caranto, J.D.; Matsumura, H.; Kurtz, D.M.; Moënne-Loccoz, P. Vibrational Analysis of Mononitrosyl Complexes in Hemerythrin and Flavodiiron Proteins: Relevance to Detoxifying NO Reductase. J. Am. Chem. Soc. 2012, 134, 6878–6884. [Google Scholar] [CrossRef] [Green Version]
  41. Hayashi, T.; Caranto, J.D.; Wampler, D.A.; Kurtz, D.M.; Moënne-Loccoz, P. Insights into the Nitric Oxide Reductase Mechanism of Flavodiiron Proteins from a Flavin-Free Enzyme. Biochemistry 2010, 49, 7040–7049. [Google Scholar] [CrossRef] [Green Version]
Figure 1. The motif -G[S,T,I][S,T]Y[A,S]N- in FDPs. (A) -G[S,T,I][S,T]Y[A,S]N- motif of the FDPs of which the structures have been determined; the respective PDB code is presented. (B) The different monomers of the E. coli FDP structure are presented in different colors (gray, red and blue) and the catalytic center and the -GSSYN- motif region (in gray) have been amplified for better clarity. The coordinating phosphate is displayed using sticks with the phosphorus in orange and the oxygen in red. The two channels identified in the E. coli FDP structure (blue mesh—small channel, red mesh—long channel) were determined using MOLE [28] and the FMN is represented as red sticks. (C) Representation of D. gigas FDP (1E5D) catalytic center. (D) Representation of Thermotoga maritima FDP (1VME) catalytic center. (AC) The iron atoms of the catalytic center are represented as black spheres (FeD—distal; FeP—proximal); the ligands of the catalytic center are represented in blue; the -G[S,T,I][S,T]YN- motif is represented in gray; His171 from E. coli FDP, which is located in the lower part of the small channel, is represented in green, as well as the corresponding residues in D. gigas FDP (Asn170) and T. maritima FDP (Tyr170). The distances of the different residues in the motif from other residues are presented.
Catalysts 11 00926 g001
Figure 2. The motif -GSSYN- in E. coli FDP. The protein structure is presented as cartoon together with its external surface. The small channel is presented as blue mesh and part of the large channel in red mesh, determined using MOLE [28]. The color code of the amino acid residues and the iron atoms are the same as in Figure 1. A hydrophilic cavity close to the motif -GSSYN- is also presented. The water molecules in this cavity and at the entrance of the small channel are depicted in cyan.
Catalysts 11 00926 g002
Figure 3. EPR spectra of diiron centers of FDP wt and site-directed mutants. EPR spectra of the E. coli FDP and its mutants (red lines) incubated with substoichiometric amounts of menadiol recorded at 7 K, with a microwave frequency of 9.39 GHz, a modulation amplitude of 1.0 mT and a microwave power of 2 mW. (A) S33V, S34V and S33V_S34V mutants compared with the wt protein. (B) S33D and S34D mutants compared with the wt protein. (C) Y35F and N36L mutants compared with the wt protein. The black lines below the experimental spectra are the simulated spectra with the g-values presented in Table 1. The protein concentration was 200 µM in 50 mM Tris-HCl, pH 7.5, 18% glycerol.
Catalysts 11 00926 g003
Figure 4. NO and O2 reduction activities of FDP wt and site-directed mutants. (A) NO reductase activities as percentages relative to the wt protein. (B) O2 reductase activities as percentages in relation to the wt. The activities are presented as averages calculated based on at least three assays for each protein. The error bars represent the standard deviations.
Catalysts 11 00926 g004
Figure 5. Homology-based model of the S33V and S33D mutants. The interaction of residue 33 with the surrounding residues is shown for the structure of the WT enzyme. The figure was built with PyMOL using (from left to right) the X-ray structure for the WT protein (PDB code: 4D02) and the structures corresponding to the best models generated for the mutants S33V and S33D. The protein’s secondary structure elements are shown using a gray cartoon representation and the molecular surface is also represented in gray. For simplicity, only the residues His227, Asp166 and His147, which were part of the coordinating sphere of the metal center, are displayed, using sticks with the carbons colored in blue and the iron atoms as black spheres, labeled as proximal Fe (Fep) and distal Fe (Fed). The distances between residue 33 and histidines 171 and 227 are represented by dashed lines and labeled with the corresponding values.
Catalysts 11 00926 g005
Figure 6. Water molecules observed in the crystallographic and predicted structures. The water molecules present in the crystal structure of the wt enzyme (PDB code: 4D02), within a 5 Å radius from residues 34, 35 and 36, are highlighted as cyan spheres. The small channel is represented as blue mesh, determined using MOLE [28]. The figure was built with PyMOL and the protein’s secondary structure elements are shown using a gray cartoon representation; the molecular surface is also represented in gray. For simplicity, only some residues coordinating the metal center, His227, Asp166 and His147, are displayed, using sticks with the carbons colored in blue and the iron atoms as black spheres, labeled as proximal Fe (Fep) and distal Fe (Fed). Residues 33, 34, 35 and 36 are highlighted using sticks and labels. The water molecules predicted by Dowser++ [32] are depicted as pink sticks (panel B). Panel C shows a structural superposition of the water molecules that were observed in the crystal structure (panel A, cyan spheres) with those predicted (panel B, pink sticks).
Catalysts 11 00926 g006
Figure 7. Homology-based models of the S34V, S34D and N36L FDP mutants. The figure was built with PyMOL using the X-ray structure for the wt protein (PDB code: 4D02) and the structures corresponding to the best models generated for the mutants; the small channel is represented as blue mesh determined using MOLE [28]. The protein’s secondary structure elements are shown using a gray cartoon representation and the molecular surface is also represented in gray. For simplicity, only some residues coordinating the metal center, His227, Asp166 and His147, are displayed, using sticks with the carbons colored in blue and the iron atoms represented as black spheres, labeled as proximal Fe (Fep) and distal Fe (Fed). The water molecules predicted by Dowser++ [32] are depicted as pink sticks.
Catalysts 11 00926 g007
Figure 8. Homology-based model of the Y35F mutant. The figure was built with PyMOL using the X-ray structure for the wt enzyme (PDB code: 4D02) and the structure corresponding to the best model generated for the mutant; the small channel is represented as blue mesh determined using MOLE [28]. The protein’s secondary structure elements are shown using a gray cartoon representation and the molecular surface is also represented in gray. Only some residues coordinating the metal center, His227, Asp166 and His147, are displayed, using sticks with the carbons colored in blue and the iron atoms represented as black spheres, labeled as proximal Fe (Fep) and distal Fe (Fed). The water molecules predicted by Dowser++ [32] are depicted as pink sticks.
Catalysts 11 00926 g008
Figure 9. Proposed mechanism for NO reduction by FDPs showing the proposed diiron center structures during the FDP catalytic cycle and based on the results presented by Kurtz and co-workers [38,39]. The catalytic cycle initiates with the diiron core in the diferrous reduced state (FDPRed), which is converted into the diiron-mononitrosyl species (FDPMonoNO) upon reaction with the first NO molecule. The reaction with the second NO molecule gives rise to the diiron-dinitrosyl species (FDPDiNO). Product formation is concomitant with the entrance of a proton leading to the formation a second hydroxo bridge between the two iron atoms, forming the oxidized diferric final species (FDPOx). The FDPRed species is restored through a two-electron reduction and the uptake of a second proton, with the release of a water molecule.
Catalysts 11 00926 g009
Table 1. Ratios of iron/FMN/protein; melting temperatures (Tm, °C), determined by circular dichroism; and g-values for the Electron Paramagnetic Resonance (EPR) signals of the diiron center in the mixed valence state, obtained by theoretically simulating the spectra using SPINCOUNT [29], for wt FlRd and mutants.
ProteinIron/ProteinFlavin/ProteinTm (°C)g1g2g3
WT2.3 ± 0.30.6 ± 0.153.3 ± 1.51.9531.7971.715
S33V2.3 ± 0.30.5 ± 0.153.2 ± 0.81.9611.7801.685
S33D2.3 ± 0.40.8 ± 0.150.1 ± 2.41.9601.7871.686
S34V2.0 ± 0.30.4 ± 0.142.7 ± 1.21.9611.7791.692
S34D2.1 ± 0.20.7 ± 0.157.9 ± 2.81.9651.7741.678
S33V_S34V1.7 ± 0.20.5 ± 0.151.7 ± 0.81.9631.7731.686
Y35F1.8 ± 0.20.5 ± 0.0440.4 ± 1.91.9571.7901.696
N36L2.7 ± 0.10.7 ± 0.0354.0 ± 1.41.9531.7951.715
Table 2. Turnover values for NO and O2 reductase activities (s−1) for FDP wt and the site-directed mutants. The values represented are averages of at least three assays. The values are averaged rates considering the protein concentration and iron and FMN contents for each protein.
ProteinNO Reductase Activity (s−1)O2 Reductase Activity (s−1)
WT15.3 ± 52.2 ± 0.7
S33V2.0 ± 0.72.1 ± 0.7
S33D6.5 ± 12.3 ± 0.4
S34V0.3 ± 0.11.1 ± 0.5
S34D7.6 ± 12.2 ± 0.4
S33V_S34V0.2 ± 0.12.0 ± 0.7
Y35F5.1 ± 21.2 ± 0.4
N36L0.14 ± 0.020.63 ± 0.1
Publisher’s Note: MDPI stays neutral with regard to jurisdictional claims in published maps and institutional affiliations.

