Article

Energy Transport of Photocatalytic Carbon Dioxide Reduction in Optical Fiber Honeycomb Reactor Coupled with Trough Concentrated Solar Power

Key Laboratory of Power Station Energy Transfer Conversion and System of Ministry of Education, School of Energy Power and Mechanical Engineering, North China Electric Power University, Beijing 102206, China
*
Author to whom correspondence should be addressed.
Catalysts 2021, 11(7), 829; https://doi.org/10.3390/catal11070829
Submission received: 10 June 2021 / Revised: 1 July 2021 / Accepted: 2 July 2021 / Published: 8 July 2021
(This article belongs to the Special Issue Photocatalytic Reduction of CO2)

Abstract

:
Thanks to the high photon efficiency and reaction density, the optical fiber monolith reactor (OFMR) for InTaO4-based CO2 photoreduction is regarded as a promising photoreactor. In this work, the OFMR coupling with parabolic trough concentrator (PTC) is proposed to enlarge the daylighting area by several times without increasing the cost of photocatalysts. Based on the Monte Carlo ray-tracing (MCRT) approach and the finite volume method (FVM), a computational model of the reaction module considering the light, heat, and mass transfer is developed to optimize the fiber honeycomb reactor coupled with the PTC. As a result, the volume-averaged concentration of production reaches 1.85 × 10⁻⁴ mol·m−3, which is much higher than the traditional OFMR with the production concentration of 9.61 × 10⁻⁶ mol·m−3 under the same condition. The optimized structure of the monolith for better photocatalytic performance is obtained. It shows that the diameters of gas channels ranging from 1.5 to 2 mm are beneficial to the reaction efficiency. Finally, the results suggested that the even number of the gas channel should be avoided due to the pseudo-steady zone in the middle of the monolith. The reaction element with the high serial number along the flow direction has the reduced reaction density and endangers the organic optical fibers especially when the serial number exceeds 5.

1. Introduction

With the development of the society and economy, the energy shortage and global warming have become two crucial issues for the human beings. However, it can be resolved by converting the greenhouse gases (CO2) into organic fuel with the photocatalysis technology. Due to its high photocatalytic performance, stability and relative low cost, tantalate has been regarded as one of the most potential photocatalysts [1,2]. Owing to the process of the material technology, the InTaO4 based photocatalysis under visible spectrum has been improved and seems promising for the applications in the immobilized photoreactors. At first, InTaO4 has a band gap of 2.6 eV, which illustrates its outstanding visible-light-driven property [3]. Secondly, the immobilization process of InTaO4 on the ceramic substrate by the sol–gel and calcination process is realizable [4]. Furthermore, the InTaO4 based photocatalysts show significant potential for photoactivity enhancement by available processes such as the doping process [5]. On the other hand, the photoreactor structure also influences the photocatalytic performance significantly, because it dominates the light transmitting efficiency, molecular diffusion rate, and reaction capacity [6]. Therefore, the design and optimization of photoreactors have attracted a lot of attention [7].
Various photoreactors under artificial light sources were proposed in previous studies, such as the slurry reactors [8,9], fluidized-bed reactors [10,11,12], fixed-bed reactors [13,14,15], optical fiber illuminating reactors [16] and optical fiber monolith reactors (OFMR) [17,18], among which the OFMR structure firstly reported by Lin and Valsaraj et al. [19] stands out because the inserted fiber illuminating structure increases quantum efficiency [20]. What is more, the catalyst coated on the surface of optical fibers and monoliths increases the reaction capacity, and the direct reaction channels lower the pressure drop. While the OFMR shows high performance under the artificial light sources, it is designed to collect the parallel irradiation and could not directly utilize the natural light sources because of its relatively small net aperture area. Coupling the concentrated solar systems, especially the trough concentrators, with the photoreactors is an available approach to enlarge the total irradiation input with less material cost, which has been applied to other kinds of photoreactors both in experiments and simulations [21]. As early as 1993, Minero et al. built a large-scale photoreactor assisted by the parabolic trough concentrators (PTC) for the pentachlorophenol degradation, achieving a better photocatalytic performance than that on a laboratorial scale [22]. In the experimental platform of Wei et al., the trough surface uniform concentrators (SUC) were equipped with the fluidized-bed photoreactors for hydrogen production, enlarging the solar power collection area by up to 15 times [23,24]. Baniasadi et al. discussed the single tube photoreactors irradiated by the compound parabolic concentrators (CPC) on an industrial scale [25]. Valades-Pelayo et al. analyzed the optical performance of the multi-tube photoreactors coupled with the CPC, using the Monte Carlo ray-tracing (MCRT) method [26], and the optimized absorber tube radius and photocatalyst film thickness were provided. Otálvaro-Marín et al. studied the influence of the diameters of the commercial TiO2 particles and reactors on the photocatalytic performance of the fluidized-bed photoreactors with the CPC by numerical methods [27]. Nguyen et al. employed an optical fiber photoreactors under the concentrated natural sunlight produced by the dual-axis-tracking Fresnel concentrators for the photoreduction of CO2 [28]. It seems promising for large-scale utilization of the photocatalysis under natural light by combining the OFMR with a relatively high reaction density [29] and the trough concentrators as a mature solar concentrating technique [30].
However, there are still several obstacles to the incorporation, depicted as follows.
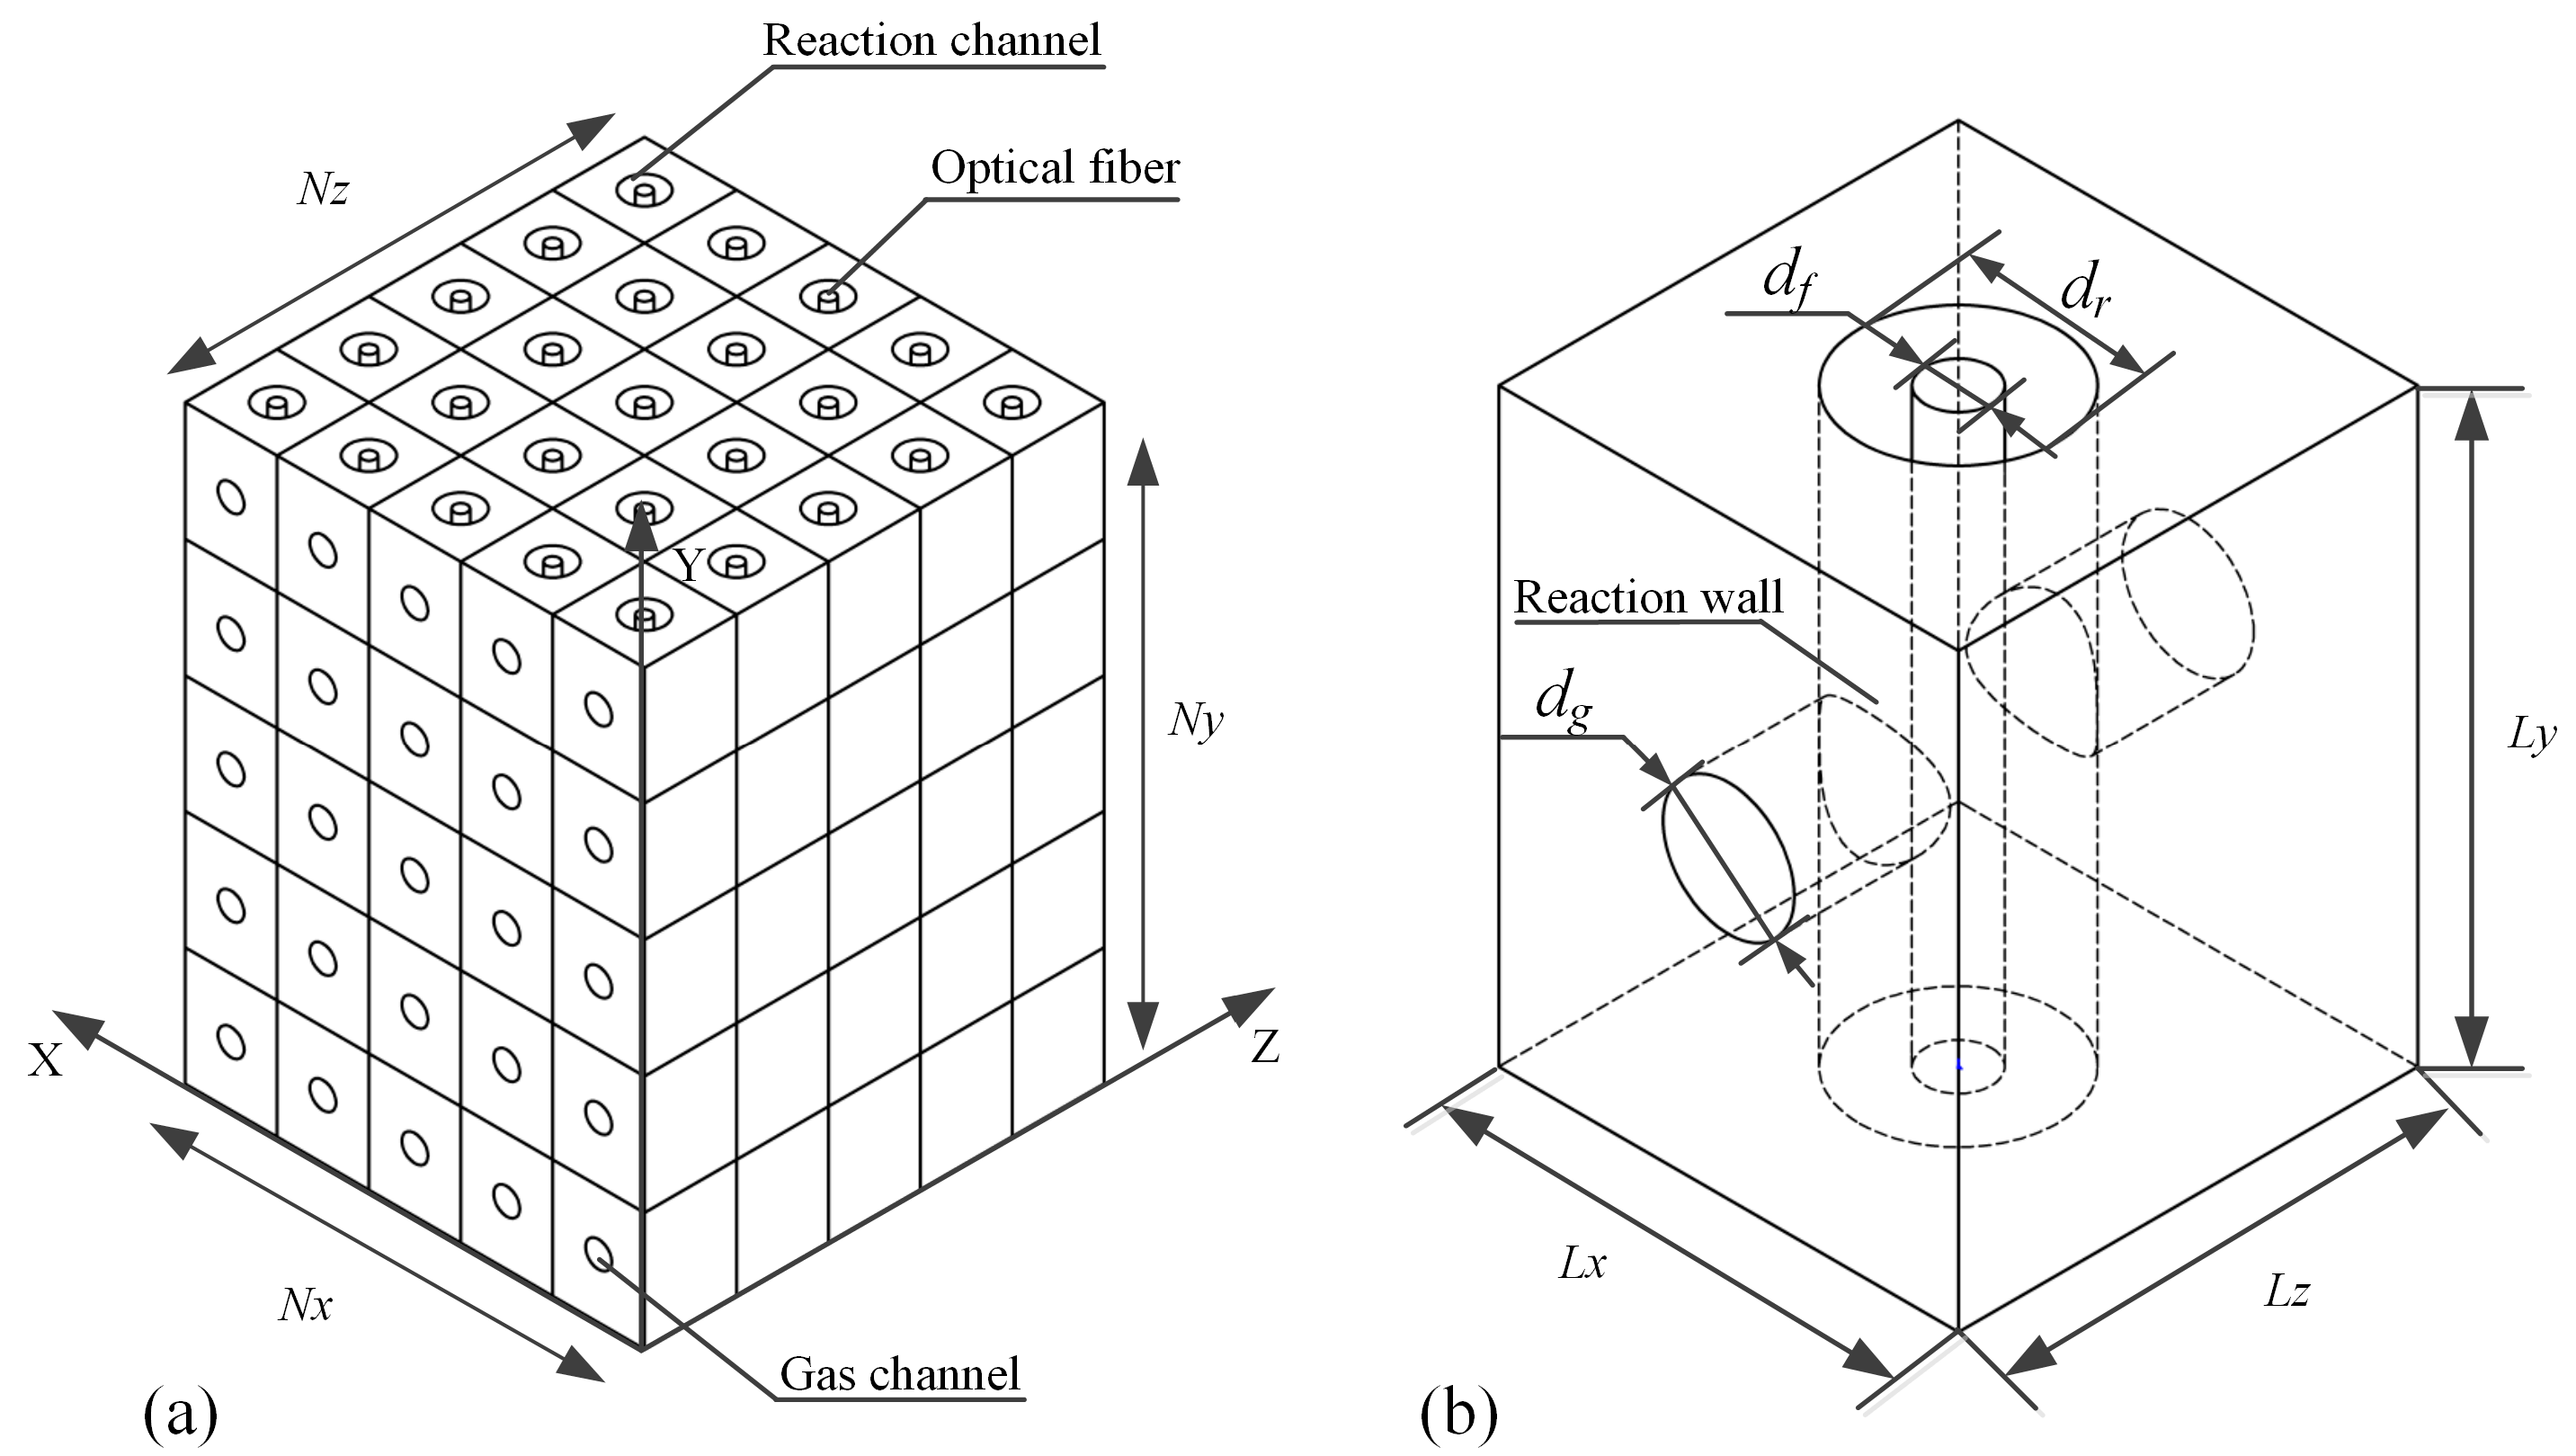
  • In a typical continuous photoreactor coupled with the trough concentrator, the reactant flow direction is perpendicular to the irradiation incoming direction, shown in Figure 1a. On the contrary, both directions of the flow and incident rays are parallel to the reaction channels as well as the internal fibers for the OFMR, shown in Figure 1b. By directly inserting a monolith into a transparent tube-like concentrated solar photoreactors vertically, the pressure drop along the flow direction may increase and the mass transfer efficiency can be reduced. As a result, the requirement of concentrated irradiative flux distribution for OFMR is different from that of other types of photoreactors. In an OFMR, the orientations of the optical fibers are uniform so that the parallel incident rays are more suitable for this structure while the CPC and SUC are designed to provide a uniform irradiative flux distribution around the surface of the tubular vessels [31].
  • The material properties of optical fiber limit the availability of the dish concentrators, although the first barrier would disappear with this kind of concentrator in use. The overheat of optical fibers with a dish concentrator is an inevitable problem because of the contradiction between the high concentrating ratio (illustrated in Figure 1c) of the concentrator and the low melt point of the organic fibers [32], shown in Figure 1d.
  • It is difficult for a dish-concentrator-illuminated system to expand the reaction capacity due to the shadow effect of the monolith. Meanwhile, the concentrated flux of high concentrating ratio requires long reacting channels to consume but the rising of the gravity center would increase installation cost in high altitude for large-size monoliths.
Therefore, the basic structure of the monolith should be modified to satisfy the coupling requirement of the OFMR with the trough concentrated system.
The modified photoreactor structure is proposed based on the geometrical and physical characters of the commercial ceramic monoliths and the PTC systems. The gas channels are added along the gas flow direction crossing the reaction channels, aiming to reduce the pressure loss and improve the mass transfer efficiency. According to our previous studies [34], the reaction efficiency is correlated to the flow velocity in the reaction channels, so the efficiency loss is inevitable due to the side flow structure. In this work, the feasibility of this new structure is evaluated by the numerical method [35], in which the commercial software Fluent and user-defined functions (UDF) are introduced to solve the multi-physics model, and the reaction model modified by the temperature effects is adopted. In addition, the model presented is verified by the experimental data from the previous studies. The variable fields and the reaction efficiency with different design parameters are obtained and analyzed for the reactor structure optimization. It could contribute to the large-scale utilization of photoreduction of CO2 for this new photoreactor with the combination of the solar concentrated systems.

2. Models

The basic structure of the PTC coupled with the OFMR is similar to that of a typical PTC system for thermal power generation, in which the tubular receiver is replaced by honeycomb monoliths with fibers inserted as shown in Figure 2. The whole photocatalysis model consists of several modules, including light transmission, mass transfer, and photoreaction. The profile chart in Figure 3 illustrates the light transmission process. The rays colored in red that hit the parabolic trough concentrator are reflected and concentrated onto the end surfaces of the fibers. Then, they transmit inside the fibers (colored in pink) and emit from the sidewall of the fibers to illuminate the internal surface of the monolith coated with the photocatalyst evenly. The detailed structure and the basic element of the monolith are shown in Figure 4. The geometrical parameters of the gas channels and the elements are listed in Table 1, which are computed from the porosity of the commercial ceramic monolith. The height of the whole monolith rather than that of a basic element is set as a constant. The whole monolith could be regarded as the basic elements in series and parallel, as shown in Figure 4a, where Nx, Ny, and Nz are introduced to represent the number of the pile in different directions. Due to the non-uniform irradiance along x-direction on the monolith, the reaction element for the simulation is one layer of basic element along z-direction (Nz = 1) rather than one reaction channel with its gas channel and internal fiber.
The photocatalysis takes place on the internal walls, the reaction walls. The mass transfer generated by the creeping flow and species diffusion lowers the production concentration, which enables the reversible photocatalysis to proceed in a positive direction. Different from the traditional OFMR structure, the gas channels along the main flow of the glass vessel penetrate the ceramic monolith, which increases the mass transfer efficiency and reduces the pressure drop without catalyst coated. The reactant mixture of the CO2 and water vapor flows into the monoliths inlet, and then, the mixture of reactants and products vents out from the outlet after the reaction. The blocking effects of the optical fibers lead the airflow to the vertical directions so that the reaction surface can be fully utilized to increase the reaction capacity.
In addition, only half of the monolith is simulated to evaluate the effect of the structure because of the symmetric characteristics of the model. Some assumptions are made for simplification and expressed as follows:
(1)
The light transmission in the gas channels is neglected, and photocatalysis only occurs on the reaction walls.
(2)
The flow field inside the monolith will be calculated, while the effect of the convective heat transfer on the outer surface is taken into account by empirical equations.
(3)
The light attenuation in the gas phase is neglected.
(4)
The flow is laminar, incompressible with no backward flow because the Re is approximately from 40 to 70.
(5)
The species inside the monolith are homogeneous and incompressible Newtonian fluid.
(6)
The photocatalyst coating with the same thickness on the reaction surface consists of 2.6wt% NiO/InTaO4 (imp). The photocatalytic kinetic model was established according the OFMR experiments with NiO/InTaO4 as catalysts from Liou et al. [36] When the photoreaction took place at the room temperature with Mercury lamps as the light source, methanol was measured as the major product. In the cases that the Xenon lamp was utilized as the light source, and the reaction temperature exceeded 70 °C, acetaldehyde was found to be the major product, and high selectivity was claimed. The UV–VIS spectrum of the Xenon lamps is similar to the sunlight, and the reaction temperature is relatively high when coupled with a solar concentrator. With this kind of photocatalyst, the apparent reaction takes the following form:
CO 2 + H 2 O photon catalyst 1 2 CH 3 CHO   +   5 4 O 2
The conversion and mass transfer of the intermediate product is neglected, while the conversion from the reactants to the products is of interest.

2.1. Optical Model

Focusing on increasing the average local concentration ratio (LCR) and flatting the irradiative distribution around the surface of the receiver, the design philosophy of the parabolic concentrating system with a tubular receiver is widely applied to the photo-thermal power generation and the photocatalytic wastewater treatment. When the optical fiber is introduced in this work, the orientations of the concentrated rays that land on the end surfaces of the fibers can affect the transmissivity. According to our previous study, for PMMA optical fibers of 10 m, the attenuation rate is 66% with the maximum incident angle of 15°, while the maximum incident angle of 24.4° enlarges the attenuation rate to 73% [37]. As a result, the incident angle at the end of fibers should be controlled less than 15° to avoid an excess energy loss. Restricted by the manufacturing process and cost of the ceramic honeycomb monolith, the reaction channels are usually parallel. Based on the aforementioned issues, the design strategy of reacting channels is different from that of previous studies. The circumferential irradiation should be more concentrated within an angular range rather than uniform along the circumferential direction, and the proportion of the rays that are vertical to the incident ends of the fibers should be enlarged. The side illumination of an arbitrary fiber derives from the optical process that consists of two parts, and the derivative irradiative flux located at the monolith wall with covered catalyst plays an important role in the photocatalytic reaction rate.
The incident rays are reflected by the parabolic trough concentrator and reach the end surfaces of the optical fibers and the monolith, which can be simulated using MCRT method. The rays in red in Figure 4 illustrate the configuration of the first part of the optical process with a parabolic trough concentrator, a glass envelope, and a honeycomb as the main equipment. The key geometric parameters such as aperture length W and focal length F are listed in Table 2, and the orange part in Figure 5 shows the basic calculation flow. The rays launching from the sundisk carry a certain amount of energy, which is dominated by both the brightness distribution of the sundisk called sunshape and the launching position. For the sunshape, it can be obtained from the investigation of Buie et al. [38].
Φ ( γ ) = cos ( 0.326 γ ) cos ( 0.308 γ )     ( 0 γ δ )
where δ is the solar intercept angle.
As rays reach the surface of the trough reflector, the reflection equations are used to calculate the tracks of the corresponding reflection rays. The influence of the envelope is simplified as the transmissivity, τg, so as to reflectivity of the reflector, rm. Via tracing rays of large quantity, the statistical results of the flux distribution on the end surface of the fibers can be obtained. Besides the distribution characteristics of the photon, the vector information of the rays landing on the ends of fibers is also important in analyzing the optical efficiency. The transmittance of the interface between the reaction gas and end wall of optical fibers is considered based on Fresnel equations.
As shown in Figure 6, the incident angles at the end of fibers and polarization components of the incident rays affect the transmission coefficient. Light waves are the transverse waves, of which the vibrating electric vector corresponding to each wave, called the polarization direction, is perpendicular to the direction of light propagation. Natural incident light consists of the electric vectors in all directions, which can be orthogonally decomposed into two different linear polarizations with an equal amount of power, the polarization of a wave’s electric field normal to the fiber’s end plane, called s polarization, and the polarization of electric field in the plane called p polarization. For the s polarization, the power transmission coefficient when the incident rays are not vertical to the interface can be expressed as follows [39].
τ s = 4 n f cos θ i 1 n f 2 sin 2 θ i ( cos θ i + n f 2 sin 2 θ i ) 2
For the p polarization, it can be expressed as
τ p = 4 n f 3 cos θ i 1 n f 2 sin 2 θ i ( n f 2 cos θ i + n f 2 sin 2 θ i ) 2
where θi is the incident angle on the end wall of fibers, and nf is the refractive index of PMMA fibers. The average power transmission coefficient takes the following form,
τ f = 1 2 τ s + 1 2 τ p
In addition, unlike the traditional trough reflectors and flat receivers coupled concentrating systems, the rays that fall onto the monolith receivers are not totally blocked. Some of the rays transmit through the fibers and gas zones and finally reach the reflecting mirrors. This portion of rays is not completely traced, while an area-weighted estimation is introduced for simplification instead. The energy of rays that transmit through the receiver zones can be expressed as,
I r = η m × 0 + η f I t + η g D N I τ g ( 1 2 L m x x r 1 2 L m x )
where η m , η f and η g are the area ratios of the monolith zone, the fiber zone, and the gas zone, respectively, on the top surface of the monolith receiver; It represents the energy of rays that go through the fiber from the top end and finally reach the reflector; Lmx represents the length of the whole monolith along x-axis; DNI represents the direct normal irradiation on the reflector, and τg represents the transmissivity of the glass envelope.
Then the light intensity distribution of optical fibers is characterized to calculate the internal illumination of fibers, with the rays colored pink in Figure 4 (circled in pink in Figure 5) and the parameter, It. The incident rays transmitting through fibers attenuate along the y axis exponentially with the following form,
I a x i a l ( y ) = I i n p u t [ ( 1 f θ ) + f θ exp ( α L f ) ]
where Iinput is the irradiative flux on the incident end of fibers; fθ is the percentage of the incident light with the incident angle less than 90 degrees [40]; α refers to the refraction loss coefficient, and Lf is the depth of the evaluated cross section from the entrance plane. Therefore, It in Equation (5) could be obtained as follows,
I t = D N I τ g [ ( 1 f θ ) + f θ exp ( α L ) ]
Based on the simplification that the irradiative absorption of the fiber is ignored, the rays transmit in the side illuminating fiber, which could be described by the modified exponential decay equation,
I s f = d f 4 [ d I a x i a l ( y ) d y ] = 1 4 α d f f θ exp ( α y ) I i n p u t
where df is the diameter of fibers.
Taking the end effect, which increases the side illuminating intensity near the end of the fiber, into consideration, the above equation is corrected by the experimental data from Lin et al. [19],
I i s i d e ( y ) = 1 4 d f f θ α exp ( α y ) I i n p u t ( x ) + 1 4 d f f θ β exp [ β ( L y ) ] I o u t p u t
where β is the attenuation coefficient of the light flux reflected by the inner surface of the end. Iinput(x) represents the transmitted irradiative flux at the entrance of the fibers, which has been calculated using the aforementioned ray-tracing method. Ioutput represents the output flux intensity of the fiber’s end which is back to the concentrator, expressed as the similar form to Equation (6),
I o u t p u t = I i n p u t [ ( 1 f θ ) + f θ exp ( α L ) ]
The peak value of the transmitted concentrated flux on the entrance is approximately ten times of DNI, so the rays which directly reach the surface confront to the sky cannot be neglected. Therefore, the side illuminating flux of fibers follows the expression by adding the content of effect of flux intensity on the exit end,
I s i d e ( y ) = I i s i d e ( y ) + I o s i d e ( y )
where
I o s i d e ( y ) = α g D N I { 1 4 d f f θ α exp [ α ( L y ) ] + 1 4 d f f θ β exp [ β y ] [ ( 1 f θ ) + f θ exp ( α L ) ] }
The flux deriving from the rays that finally reach the front surface of the monolith is also considered as a boundary condition. In addition, the solar spectrum was discretized and substituted into the ray-tracing codes.

2.2. Species Transport Model

The fluid in the monolith is of single phase and multicomponent, so the classical governing equations are introduced as follows in the Cartesian coordinate system:
u i x i = 0
u i u j x i = 1 ρ p x j + ν 2 u j x i 2
( u i T ) x i = x i ( λ ρ c p T x i ) + S T ρ c p
where λ is the thermal conductivity; cp is the specific heat capacity at the constant pressure; ρ and ν represents the density and viscosity, ST is the source term of the gas energy equation.
The mass diffusion of the species is modeled as a dilute mixture because of the relative low concentrations of water vapor and organic resultant at room pressure. In the concentrated photocatalytic system, the temperature distribution is non-uniform because the boundaries of the monolith are heated by the concentrated irradiation, and then the heat is transmitted to the reactant mixture both by conduction and convection. Therefore, the mass diffusion flux component derived from thermal diffusion should be considered. The diffusion flux of the chemical species in a laminar flow can be described based on Fick’s law as:
J i = ρ D s , i Y i D T , i T T
where Ds,i, Yi and DT,i are the mass diffusion coefficient, mass fraction and thermal diffusion coefficient for the species i in the solvent, respectively.
The semi-empirical formula presented by Gilliland [41], which is a modification of the Chapman–Enskog formula, is usually used to calculate the diffusivity coefficient:
D s , i = 435.7 T 3 / 2 p ( V s 1 / 3 + V i 1 / 3 ) 1 M s + 1 M i
where T is the absolute temperature; p is the total pressure; Mi is the molecular mass of a component; Ms is the molecular mass of the solvent, and Vi is the molar volume of a liquid component.
The heat transfer process near the reaction surface can influence the mass diffusion property significantly due to the temperature difference between the reactant flow and the heated monolith honeycomb. The thermal diffusion coefficient takes the empirical formula as follows [42]:
D T , i = 2.59 × 10 7 T 0.659 ( M i 0.511 X i i = 1 N t M i 0.511 X i Y i ) i = 1 N t M i 0.511 X i i = 1 N t M i 0.489 X i
where Xi is the mole fraction of a species.

2.3. Reaction Kinetics Model

The catalyst simulated is synthesized and fixed using the sol-gel process according to Liou et al. [36]. The Langmuir–Hinshelwood mechanism developed by Tahir and Amin et al. [43] is adopted to describe the photocatalytic reaction rate which is generally governed by the adsorption rate and desorption rate.
r ( y ) = k I s i d e n K H 2 O K CO 2 ( P H 2 O P CO 2 ) 1 + K H 2 O P H 2 O + K CO 2 P CO 2 + K O 2 P O 2 + K CH 3 CHO P CH 3 CHO
where Iside is the local light input intensity on the reaction wall; n represents the power law coefficient depending on the value of Iside. Although the incident radiation is concentrated, the radiation on the reaction walls is relatively low (less than 70 W·m−2) because of the relatively low percentage of the refracted rays. Therefore, n is set to 1 according to the study of Choi et al. [39]; k is the kinetic rate constant which is a function of the temperature; Ki is the ratio of adsorption to desorption equilibrium constants affected by the local reaction temperature; Pi refers to the partial pressure of each reactant.
The temperature correction for the reaction rate equation is necessary because of the relatively high and non-uniform reaction temperature deriving from the concentrating system. The temperature governing expression should be added to the temperature-dependent variables, k and K. However, the correction of K is hard to be quantified and distinguish from that of k because of the nonlinear form in Equation (19). The following assumptions are presented to simplify the analysis of temperature effects:
(1)
The reaction only takes place in a thin film near the reaction wall.
(2)
Based on the experimental data, carbon dioxide is regarded as the solvent, while water vapor, acetaldehyde vapor, and oxygen are treated as the solute. Therefore, in the whole fluid zone including the reaction zone, K CO 2 P CO 2 > > K H 2 O P H 2 O + K O 2 P O 2 + 1 [44].
(3)
Although the resultant CH3CHO will be accumulated in the film as the reaction process goes on, the relatively low production rate and the species transfer by fluid flow and diffusion ensure the low concentration of product near the reaction wall, resulting in that K CO 2 P CO 2 > > K CH 3 OH P C H 3 OH . In addition, the deviation of the concentration of CO2 is not significant because the amount of CO2 is in large excess compared to the other reactant.
As a result, in the temperature effect analysis, Equation (1) could be modified as follows [44]:
r ( y ) = k I s i d e K H 2 O P H 2 O
It suggests that this kind of photocatalytic reaction could be regarded as the pseudo first order reaction. The temperature fixed reaction rate constant using the Arrhenius expression for a pseudo first order reaction is
k = k 0 K 0 exp ( E t / R T ) = k t 0 exp ( E t / R T )
where kt0 represents the total reaction kinetic constant at a certain temperature as the pre-exponential factor which could be obtained from the experiments; Et refers to the activation energy for the reaction, and R is the universal gas constant with the value of 8.314 Pa·m3·mol−1·K−1.
The modified reaction rate with temperature effects considered is expressed as follows:
r ( y ) = k t 0 exp ( E t / R T ) I s i d e P H 2 O
Osaki et al. [45] proved the rationality of the simplification that the photocatalytic carbon dioxide reduction is regarded as the pseudo first-order reaction.
The fit curves of the natural logarithm of reaction rate as a function of the reciprocal of the temperature are straight lines with the slopes of Et of the photocatalytic reactions. The activation energy is mainly determined by the material properties and the thermal treatment temperature, with the values of 17.5 kJ·mol−1·K−1 for a Pt-TiO2/water system, 23.3 kJ·mol−1·K−1 for Pt-TiO2/water/MeOH system [46], and 88.9 kJ·mol−1·K−1 for Ni/TiO2 [47]. For the NiO/InTaO4/vapor system, the activation energy is at the value of 10.5329 kJ·mol−1·K−1. This activation energy is the apparent activation energy with the temperature-caused deviation of K included.

2.4. Boundary Conditions

The boundary conditions on the surfaces of the top and bottom walls irradiated by the concentrated rays are both set as the mixed boundary, where heat transfer exists between the surface and ambient fluid and also between the surface and sky by radiation. The heat transfer by radiation is obtained using Boltzmann law. The commercial ceramic honeycomb is a mixture whose main components are silicon dioxide and aluminum dioxide without precise mixing ratios. The solar energy absorption, αm, and the thermal emissivity, εm, are estimated to be 0.8 and 0.9, respectively. The convection heat transfer on both of the top and bottom surfaces of the monolith is described as [48]
N u x z = 0.664 R e L m z 1 / 2 P r 1 / 3
where Re is the Reynolds number, Pr is the Prandtl number, and Lmz represents the length of monolith along with the gas flow.
The convection process at the surface which confronts the flow is expressed by the following empirical equation [48]:
N u x y = 0.228 R e L m x 0.731 P r 1 / 3
On the other hand, the irradiative flux calculated by the ray-tracing method is treated as the flux boundary compiled using UDF codes, and the flux on the top surface is regarded as uniform. In addition, the flux distribution on the bottom surface follows the scalar irradiative flux distribution, corrected by characteristic parameters of reflection on the mirror, transmission through the glass envelope, and absorption on the monolith. The inner wall of the monolith coated by the catalyst is set as the solid–liquid coupled interface, on which the photocatalytic reaction takes place. The side irradiative energy from fibers that is not converted to the chemical energy in the organic product is treated as the volumetric heat source on the reaction wall at 0.05 mm, taking the following form,
S T d R m = α m I s i d e ( y ) Δ r G m r ( y )
where αm is the absorptive coefficient of the monolith; dRm is the thickness of the heat source, and Δ r G m represents the molar Gibbs free energy change of this reaction, described as follows,
Δ r G m = Δ r H m T Δ r S m
where Δ r H m represents the standard molar reaction enthalpy of this reaction.
Δ r H m = j = 1 N t υ j Δ f H m ( Y j )
where Δ f H m ( Y j ) and υ j are the standard molar state enthalpy and stoichiometric number of reacting species Yj, respectively.
The photoreaction is regarded as the isothermal process so that Δ r S m takes the following form:
Δ r S m = R ln ( j = 1 N i ( P j ) υ j )

2.5. Verification

The model of the traditional OMFR at the constant temperature has been verified in our previous work [49], where the product concentration in a reaction element was calculated to estimate the reaction rate of the whole structure. Then, the PTC system is introduced as the light source for the proposed model, with the irradiative flux distribution simulated using the ray-tracing method. The optical model for the light transmission process in a PTC system with a flat receiver under non-ideal conditions has been verified in our other work [38] by comparing the simulation results with the semi-analytic results from Jeter et al. In addition, the effect of temperature on the reaction performance should also be verified. The comparison between the numerical and experimental data from Reference [36] in Figure 7 shows that the kinetic constants and production rate increase linearly with the temperature. A good agreement between them could be observed with the standard deviation of 4.50 × 10⁻¹⁴ m−2·s·mol·kg−1 and 1.91 × 10⁻⁸ mol·m−3 for the kinetic constant and the outlet acetaldehyde concentration, respectively. Therefore, the aforementioned verification proves the reliability of the model for evaluating the photocatalytic performance of OMFR coupled with a PTC system.

3. Results and Discussion

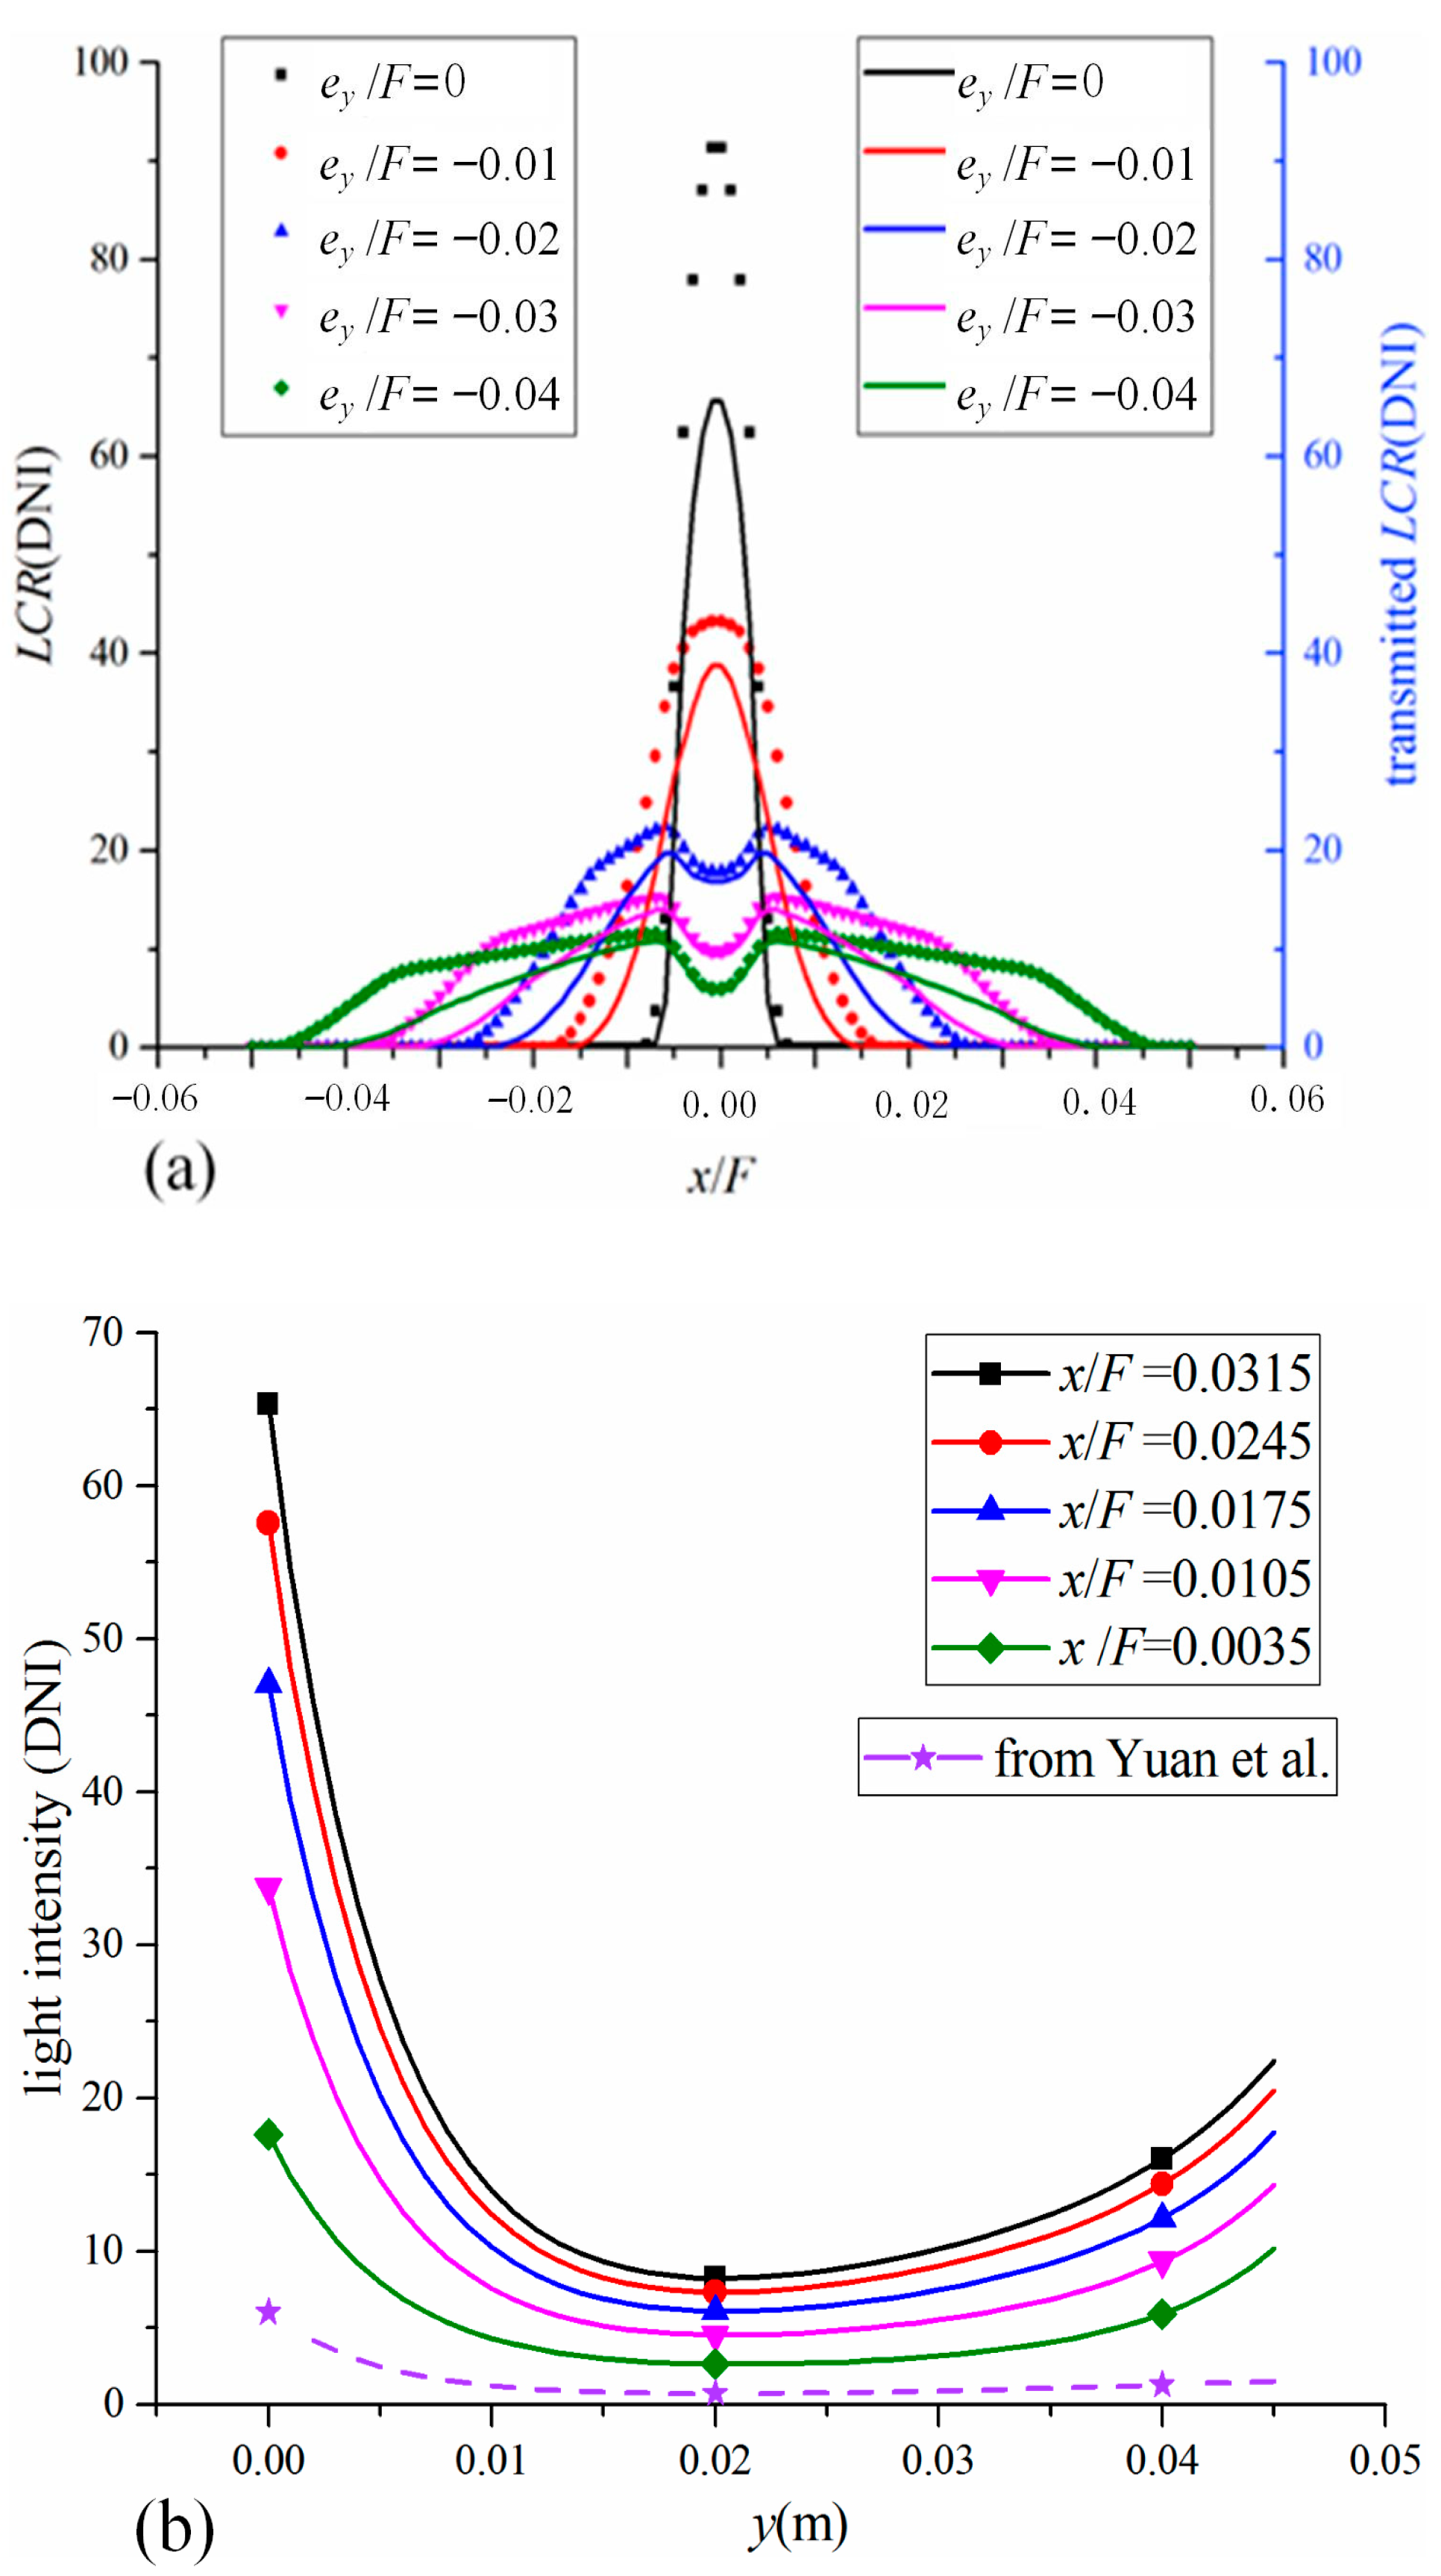
3.1. Irradiative Flux Distribution

The scalar irradiative flux distribution on the lower surface of the flat receivers and vector irradiative flux distribution, in other words, the transmitted light intensity on the end of fibers, are expected to be non-uniform along the x-axis, as shown in Figure 8a. It can be seen that when the position deviates along the y-axis, ey is higher than −0.002 times of the focal length of the reflector, the two types of irradiative flux distributions reach the peak value at the center of the receiver, and sharply reduce to zero along the x-axis. With decreasing the ey, the two types of flux distributions show a trend of long-tail character [33] and gradually become flat. The sharp central peak of light intensity disappears and translates to a concave due to the shadow effect of the receiver. Considering the overheating of the fibers and the catalyst utilization efficiency, the flat flux distribution is more suitable for the concentrated solar photocatalytic system. Compared to the scalar irradiative flux, the transmitted light intensity shows a significant attenuation due to the reflection on the end surface of fibers, with the total energy input reduced by 32.17% when ey equals −0.004 times of the focal length. The attenuation could be neglected on the center of the receiver, and it increases along with the plus and minor direction of the x-axis because the included angle between the incident ray and the normal of fibers’ end surface increases with increasing the rim angle of the reflection position on the reflector. Therefore, it may not work well with the increase of daylighting area to increase the rim angle of a PTC. Meanwhile, the half width and the alignment error along y-direction of the monolith are suggested to be −0.02 and 0.0035 times of the focal length, respectively, which have been applied to the following simulations.
As shown in Figure 8b, the light intensity direction on the reaction channel along y-direction has a similar trend as that in a traditional OFMR, with the light intensity increasing from the middle to both ends of each channel because the penetrated light is attenuated along with the fiber with the end effect added to the flux near the output end. The side illumination intensity at the same y coordinate in the different channels has a linear relation with the incident irradiative intensity on the end wall of the fibers, which increases along the x-direction. Furthermore, the rays that hit the fibers’ end directly from solar irradiation strengthen the end effects, with the ratio of the flux on the output end to the input end ranging from 34.34% to 57.24%, compared to 25.74% in a non-concentrated system [36]. The high concentration ratio near the center of the whole reactor reduces the significance of the end effect because of the constant incident irradiative flux.

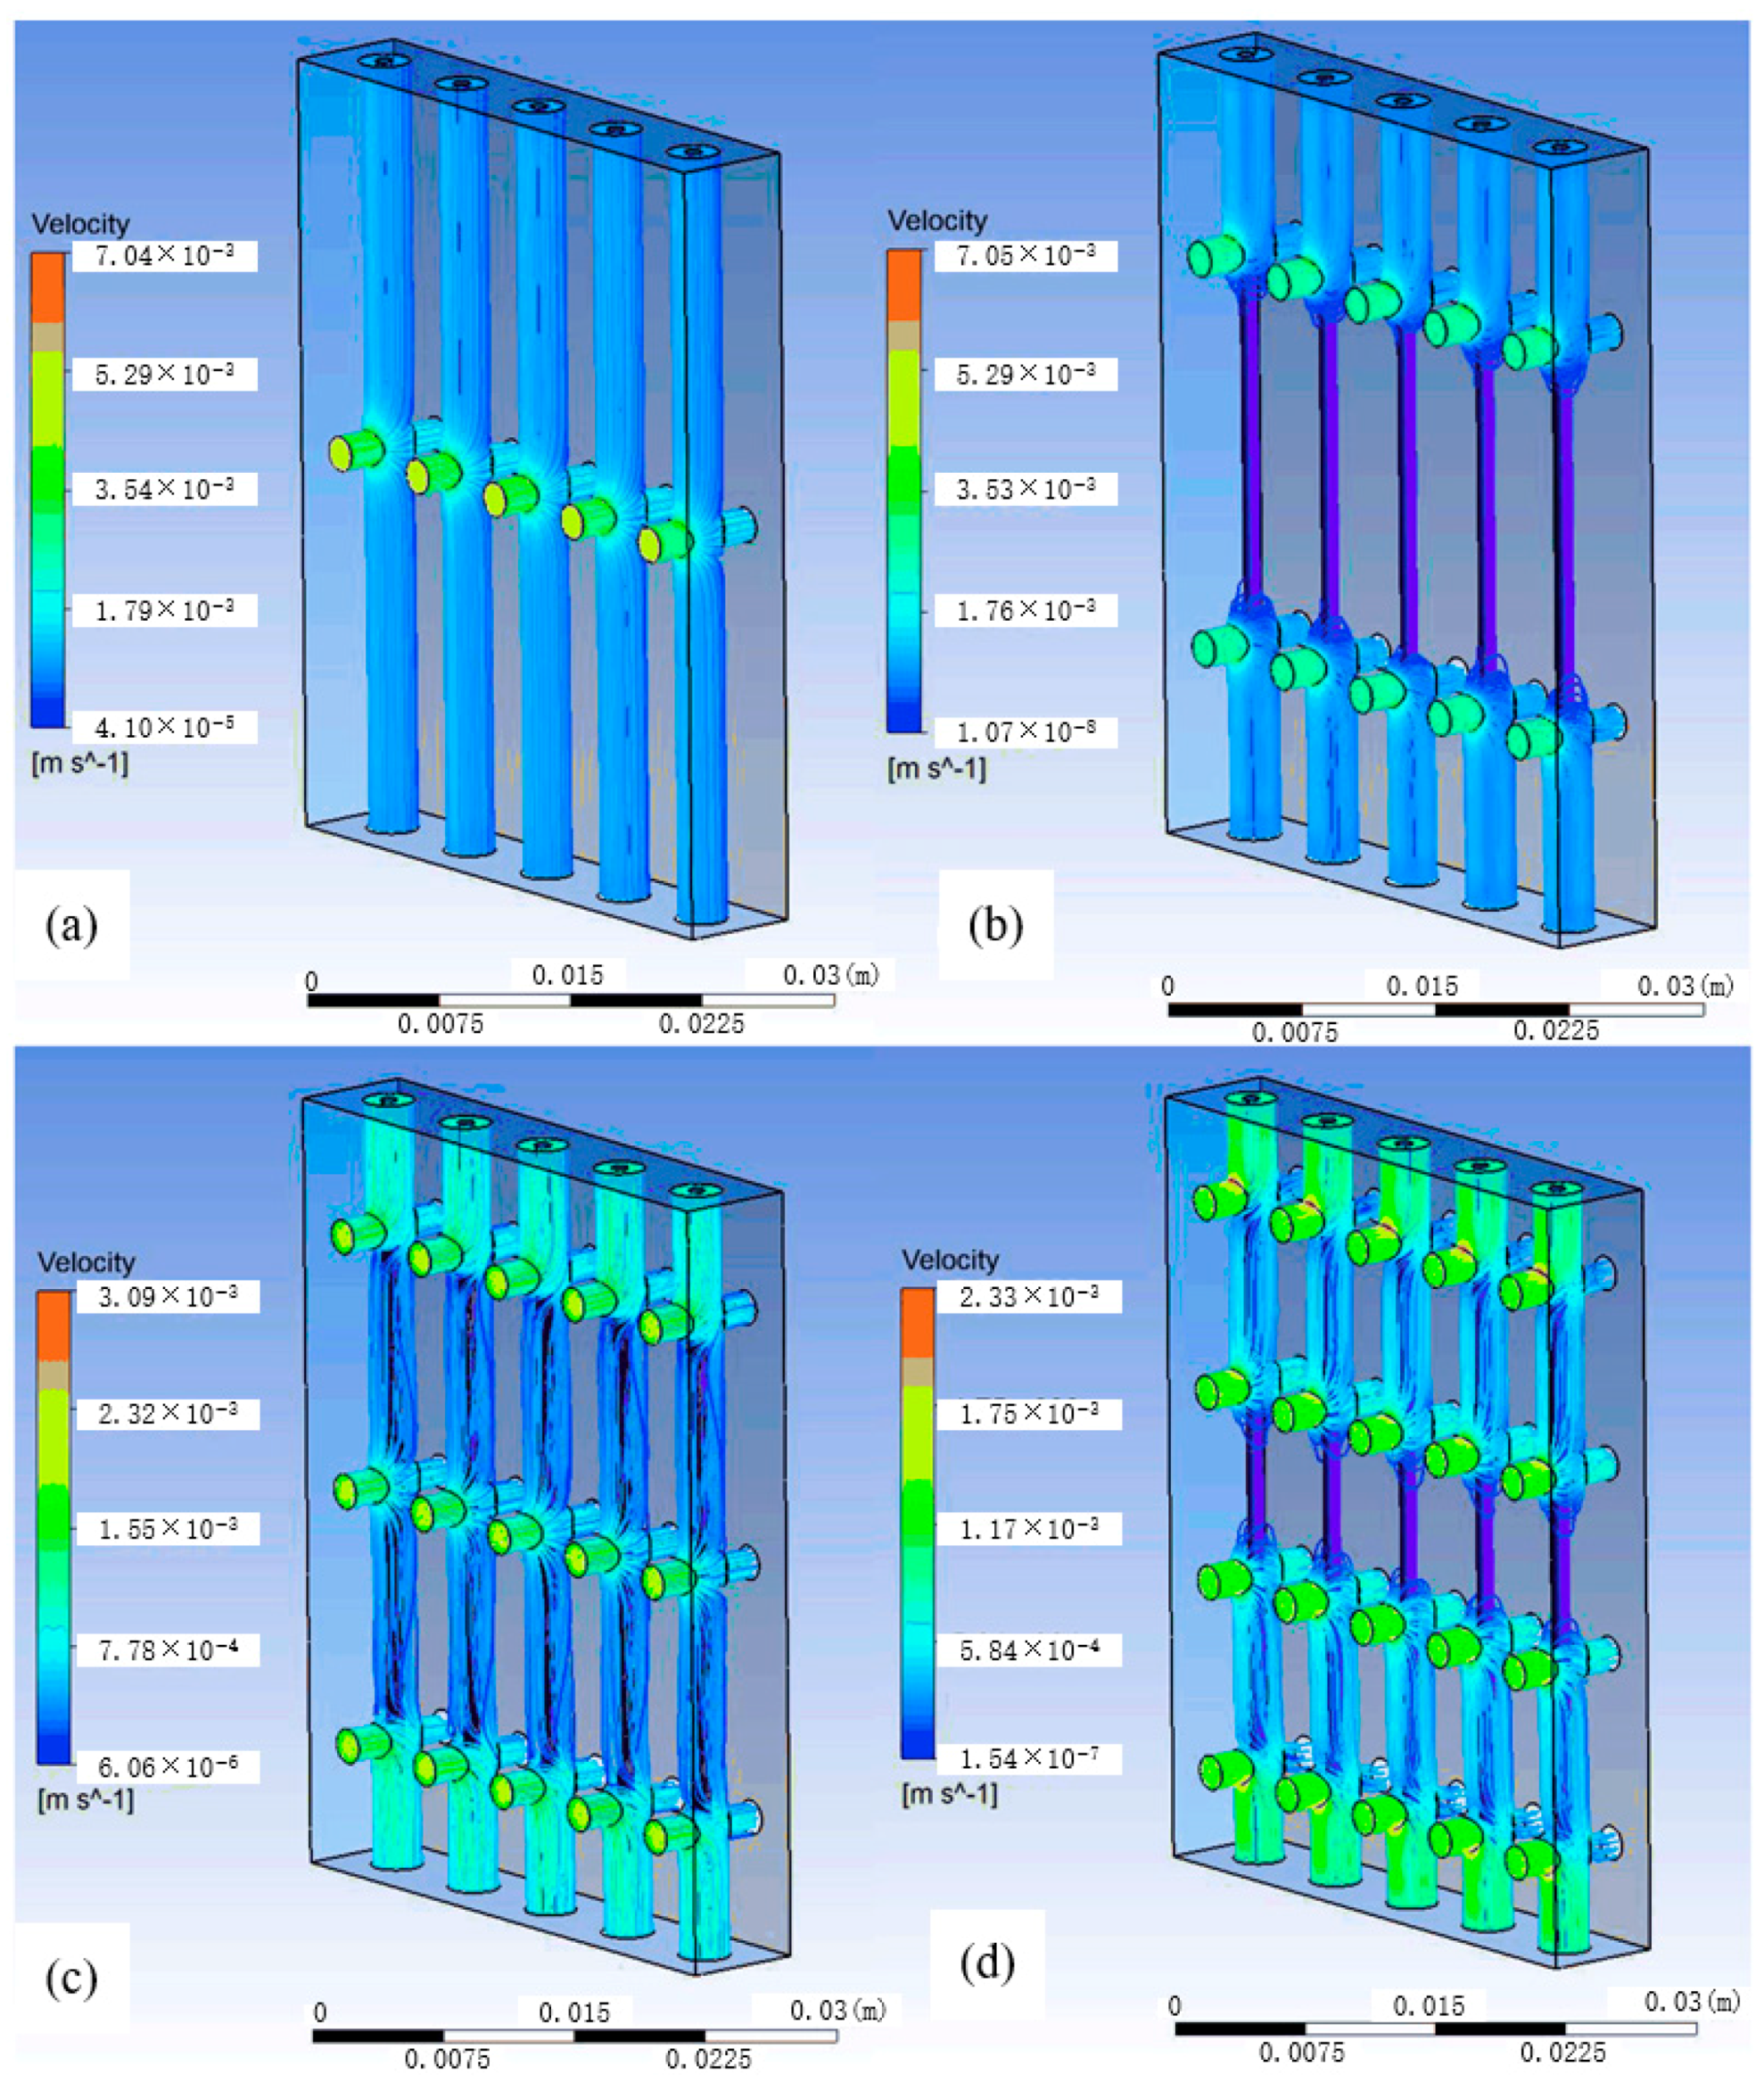
3.2. Variable Fields

The typical case is used to characterize the variable fields in the photoreactor, with the alignment error along y-direction set to −0.002 times of the focal length, the diameter of the gas channels set to 2 mm, and the serial number of the reaction element of 4. The inlet flow rate and the temperature of the reactants are set to 1.50 × 10⁻⁷ kg·s−1 and 298.15 K, respectively. It should be noted that the thermal and optical properties of the optical fibers and the monolith are set as temperature-independent to simplify the calculation. The velocity field at the cross-section x = 3.5 mm in Figure 9a shows that the block effect of the fibers forces the fluid to travel along the reaction channel, increasing the mass transfer efficiency of production near the photocatalyst coating. The confronting of reactant flow induced by the gas channels penetrated on the middle of the reaction channels weaken the velocity component along the reaction channels. In addition, the average velocity of the gas flow attenuates in the z-direction by approximately 0.0369 m·s−1 per meter, resulting in lower local flow velocity in the tandem reaction channels. The temperature fields at the cross-section z = 3.5 mm, z = 10.5 mm, z = 17.5 mm, and z = 24.5 mm are shown in Figure 10. The maximum temperature of 412.57 K could be observed on the monolith derived from the concentrated irradiative flux, while the minimum temperature of 386.49 K is on the fibers because of the low absorptivity and high transmissivity. The fibers are mainly heated by the ambient gas mixture with the temperature increasing along z-direction, so the overall temperature of the monolith and fibers increases along z-direction by approximately 0.1 K·mm−1. As shown in Figure 9b, the production concentrations at the same y coordinate in different channels are different because the input gas flow of one channel is the output flow of the previous one, and the higher production concentration lowers the local reaction rate. The highest concentration of the production appears near the upward outlet of every channel due to the end effects, with the approximate value of 4.58 × 10⁻⁴ mol·m−3 in the present case, though the reaction wall near the downward outlet receives higher irradiation. Additionally, the volume-averaged concentration of production is 1.85 × 10⁻⁴ mol·m−3, which is much higher than the maximum concentration of a reaction element with the value of 9.61 × 10⁻⁶ mol·m−3 in a traditional OFMR because of the much larger daylighting area. What is more, the variable field in the present photoreactor is much complicated than that in a traditional OFMR. Therefore, the reactor structure should be further improved based on the photocatalytic performance.

3.3. Effect of Receiver Structure

Several characteristic parameters are used to evaluate the photocatalytic performance of the present concentrated solar photocatalytic system. The volume average production rate, Φv, is introduced to analyze the reaction density of the photocatalytic organic synthesis:
Φ v = i V o t , i C o t , i V r
where Vot,i and Cot,i are the volumetric flow rate and the concentration at the outlets numbered by i.
The production specific rate per input light power, ηpc, is introduced to assess the utilization efficiency of photocatalyst, described as follows:
η p c = i V o t , i C o t , i m p c S r S d D N I V i n
where mpc is the area average mass of catalyst loading of the reaction channels based on the Choi’s experiment; Sr is the area of reaction wall; Vot,i refers to the volumetric flow rate of inlet i. The physical meaning of this variable is the molar production rate of a unit mass of photocatalyst under unit irradiative flux with unit reactant input.
In addition, the maximum temperature of fibers, Tfbmax, is also an essential evaluation parameter to judge whether the temperature of fibers exceeds the melting point of PMMA to ensure the safety of the system.

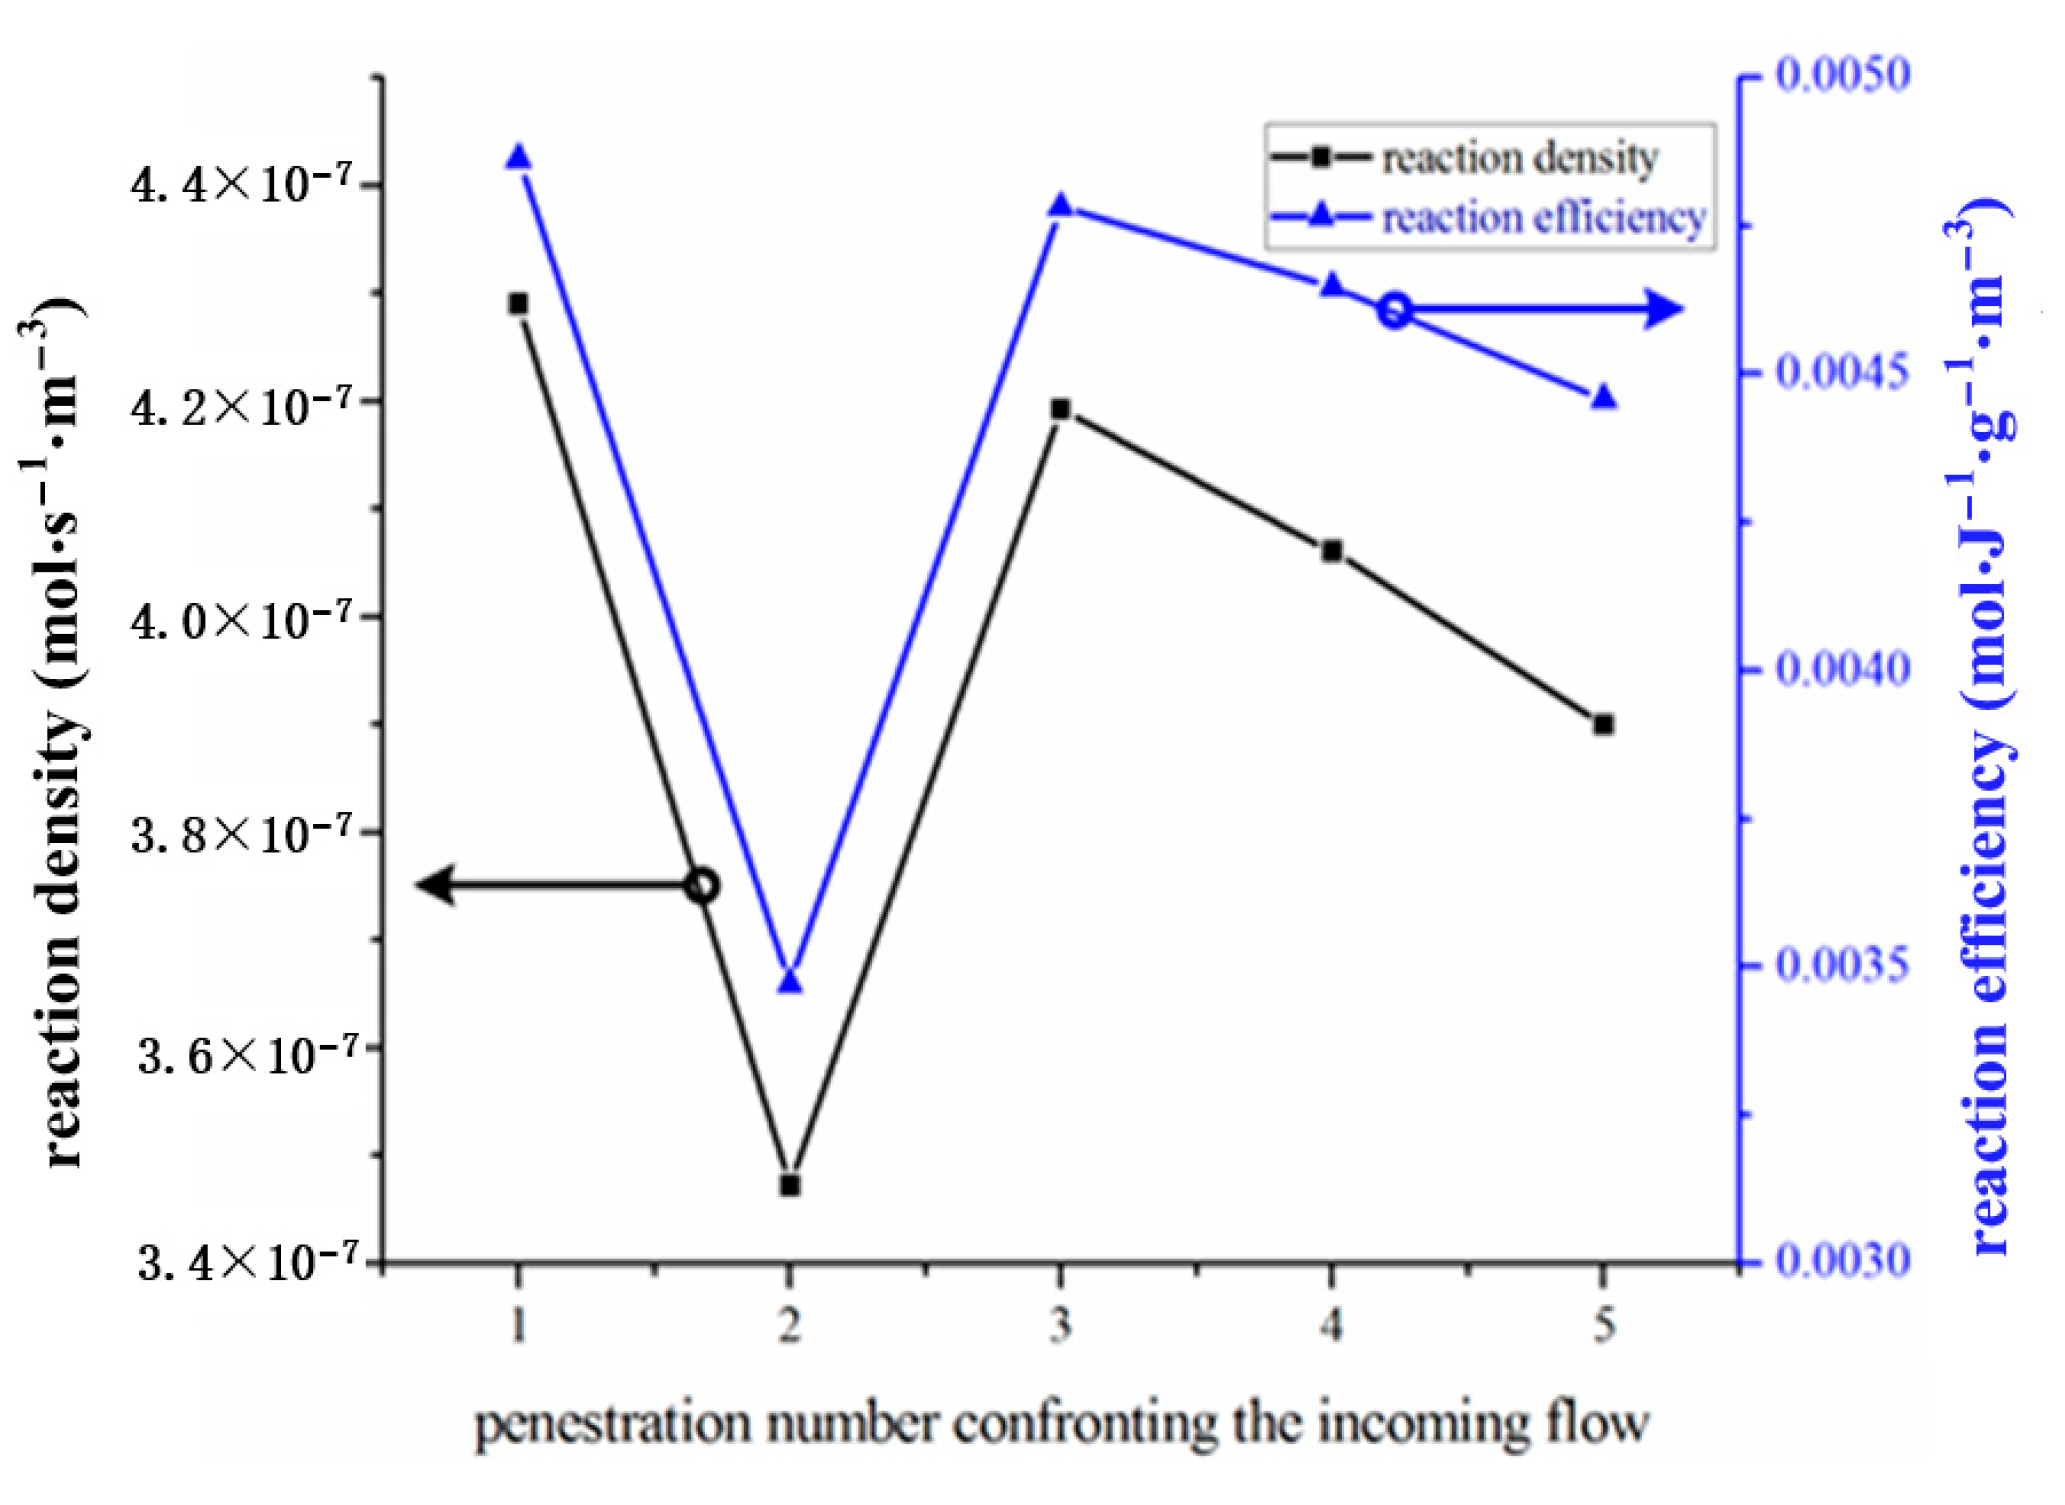
3.3.1. Diameter and Penetration Number of Gas Channels

Under the conditions that Nx is set to 5, Nz is 1, and Ny is 5, and the area-weighted average velocity of the side outlet is ensured to be 0.5 mm·s−1 which is the estimated outlet velocity in the experiment of Liou et al. [36]; the variations of photocatalytic performance with the gas channel diameter are shown in Figure 11. It can be seen that with the increase of diameter, both the reaction density and reaction efficiency first increase because the larger gas channels increase the mass transfer rate of reactants and production by higher diffusion area and then decrease because when the fibers are much slimmer than the gas channels, the volume fraction of the inlet flow blocked by the fibers gets low, and the reaction area reduction becomes dominant. The reaction density reaches the peak value of 3.97 × 10⁻⁶ mol·m−3·s−1 when dg is approximately 2 mm, while the maximum reaction efficiency of 0.00634 mol·J−1·g−1·m3 occurs as dg equals 1.5 mm. It should be noted that with the same outlet velocity, the reaction density and reaction efficiency of the traditional OFMR are 1.65 × 10⁻⁶ mol·m−3·s−1 and 0.0379 mol·J−1·g−1·m3, respectively. The proposed photoreactor takes advantage of a larger daylighting area, leading to a higher reaction density. While the reaction efficiency is lower than that of traditional OFMR because of the optical loss in the light transmission process and the lower velocity near the reaction wall caused by the side-flow structure, which deteriorates the mass transfer performance.
The variations of reaction density and reaction efficiency with the penetration number of gas channels are shown in Figure 12, with the inlet mass flow rate and temperature set to 1.50 × 10⁻⁷ kg·s−1 and 300 K, Nz set to 1, and dg set to 1 mm. It could be obtained that both evaluation variables decrease as the penetration number of gas channels increases firstly due to the reduced reaction area. When the penetration number is 2, there is a clear decline of both reaction density and reaction efficiency by approximately 20%. It could be seen in Figure 13 that the symmetrical flow field in the monolith with even penetration channels lowers the mass transfer efficiency of the middle part of reaction channels where the product diffusion becomes dominant, resulting in that the production aggregates near the wall and the forward reaction process is prevented. According to Figure 8, the local irradiative intensity on the surface near the end in the reacting channels is relatively high due to end effects of the optical fibers. The additional gas channels are set to improve the mass transfer efficiency near the end of the reacting channels to accelerate the product removal process. However, the symmetric flow field of the of reacting channels in Figure 13b,d makes the flow in the middle of the reacting channels stagnant, on which the utilization efficiency of the photocatalysts is restrained. When the penetration number reaches 4 shown in Figure 13d, the pseudo-steady zone in the middle part of the reaction channels is reduced, with the reaction density and efficiency reduced by 2.5% and 2.7%, respectively. However, the density of the gas channel could not be determined with only the reaction density taken into consideration because, in the present model, the percentage of the incoming gas flow that enters the monolith through the gas channels and the pressure loss of the monolith depend on the position and density of gas channels, especially when the incoming flow velocity is relatively high.

3.3.2. Connection in Series

In the perspective of the proposed photoreactor, several layers of the reaction elements should be in series to enlarge the reaction capacity. However, the temperature and production concentration of the mixture in the monolith will increase along the main flow direction, which could lower the reaction rate and endanger the PMMA fibers. Figure 14 shows the variations of reaction density and maximum temperature of fibers with the serial number of the reaction elements with the inlet mass flow rate and temperature set 1.5 × 10⁻⁷ kg·s−1 and 300 K, respectively, and dg = 2 mm, and Ny = 4. The maximum temperature of fibers increases with the serial number first clearly and then slightly, with the highest value of 416.92 K at the serial number of 6. Compared to the melting point of PMMA ranging from 410 to 420 K, the photoreactor with more than 5 layers of reaction elements could endanger the inserted fibers. It should be noted that the critical temperature proposed is much higher than the maximum temperature in actual engineering because the higher flow rate and lower incident irradiance could reduce the input energy. On the other hand, it could be observed that as the serial number increases, the reaction density first fluctuates and then decreases by 0.28 × 10⁻⁷ mol·m−3·s−1 per layer linearly when the serial number exceeds 3. Because even though the local reaction kinetic constant increases with the temperature, the reaction density loss deriving from the flow velocity attenuation near the reaction wall and the higher production concentration of the inlet gas mixture of the rear reaction elements are also strengthened and finally overcome the reaction gain from the increase of temperature.
Moreover, the external heat term coming from sunlight impinging directly on the apparatus, without being routed into the fibers but landing on the internal surface of the monolith was not taken into consideration in this paper, so that the presented threshold values of the serial number could be overestimated. This portion of radiative energy could be estimated by the radiation component perpendicular to the reacting surface incident from the end of the reacting channels. Meanwhile, the relatively low reflective fraction of the catalyst surface makes this portion of energy concentrated on the surface near the end of the reacting channel, on which the maximum temperature occurs without considering this thermal source term. Quantitative analysis of the aforementioned thermal source is still required to obtain a more accurate allowable value of the serial number.

4. Conclusions

An OFMR coupled with the PTC structure is proposed to expand daylighting area without increasing the cost of photocatalyst, where the gas channels are penetrated along the flow direction to increase the mass transfer efficiency and reduce the pressure drop. For the optical components, the optical loss at the entrance end of the fibers limits the direct increase of the rim angle of the PTC. Sacrificing the reaction efficiency, the volume-averaged concentration of production could reach 1.85 × 10⁻⁴ mol·m−3, compared to 9.61 × 10⁻⁶ mol·m−3 in a traditional OFMR under similar conditions. To increase the reaction efficiency, the diameter of gas channels ranging from 1.5 to 2 mm is recommended. What is more, the even number of the gas channel should be avoided due to the pseudo-steady zone in the middle of the monolith. The negative effects will be weakened as the gas channel density increases. When the serial number is over 3, the reaction elements of the high serial number along the flow direction could reduce the reaction density, while they endanger the organic optical fibers when the serial number exceeds 5. However, the external heat term coming from sunlight impinging directly on the apparatus, without being routed into the fibers but landing on the internal surface of the monolith, was not taken into consideration in this paper, so that the presented threshold values of the serial number could be overestimated.
The OFMR and PTC coupled photoreactor shows its feasibility in promoting reaction density to meet the need in practical engineering.

Author Contributions

Conceptualization, L.C.; Funding acquisition, L.Y.; Methodology, L.C.; Project administration, Y.Y.; Resources, X.D.; Writing—original draft, K.T.; Writing—review & editing, L.C. and L.Y. All authors have read and agreed to the published version of the manuscript.

Funding

This research was funded by the National Natural Science Foundation of China (Grant No. 52076076, 51821004, 52006070).

Acknowledgments

The financial support from the National Natural Science Foundation of China (Grant No. 52076076, 51821004, 52006070) is gratefully acknowledged.

Conflicts of Interest

The authors declare no conflict of interest.

Nomenclature

Cmolar concentration, mol∙m−3
cpheat capacity at constant pressure, J∙g−1∙K−1
DNIdirect normalized irradiance, W∙m−2
Ds,imass diffusion coefficient, m2∙s−1
DT,ithermal diffusion coefficient, m2∙s−1
ddiameter, mm
dgdiameter of gas channel, mm
drdiameter of reaction channel, mm
eyalignment error along y direction, m
Ffocal length, m
fθpercentage of direct rays, dimensionless
Hmmolar enthalpy, J∙mol−1
Iirradiative flux, W∙m−2
Itirradiance trough fiber, W∙m−2
Iinput, Iouputinput and output irradiance on fibers’ ends, W∙m−2
Kratio of adsorption to desorption, dimensionless
kkinetic rate constant, m−2·s·mol·kg−1
kt0kinetic rate constant, m−2·s4·mol·kg−2
Llength, m
LCRlocal concentration ratio, dimensionless
Lfdepth of the evaluated cross section, m
Lx, Ly, Lzedge length, m
Lmx, Lmzlength of monolith along x and z direction, m
Mmolecular mass, g∙mol−1
Msmolecular mass of solvent, g∙mol−1
mpcarea-average mass of photocatalyst, g∙m−2
Nx, Ny, Nznumber of pile, dimensionless
nfrefractive index of fiber, dimensionless
Ppressure, Pa
rmreflectivity of mirror, dimensionless
Sddaylighting area, m2
Srarea of reaction wall, m2
STsource term of energy equation, W∙m−3
Ttemperature, K
Tfbmaxmaximum temperature of fibers, K
uivelocity, m
Vvolume, m3
Vininlet volumetric flow rate, m3∙s−1
Vimolar volume, L∙mol−1
Waperture length, m
Ximole fraction, dimensionless
x, y, zCartesian coordinates, m
Yimass fraction, dimensionless
Greek symbols
αfraction loss coefficient, cm−1
βbackward attenuation coefficient, cm−1
γangular displacement, mrad
δsolar intercept angle, mrad
εemissivity, dimensionless
θiincident angle, degree
θrimrim angle, degree
λheat transfer coefficient, W∙m−1∙K−1
νviscosity, Pa∙m
ηarea ratio, dimensionless
ηpcreaction efficiency, mol∙J−1∙g−1∙m3
ρdensity, kg∙m−3
τtransmissivity, dimensionless
υstoichiometric number, dimensionless
Φvreaction density, mol∙m−3∙s−1
Subscripts
axialalong axial direction
gglass
ffiber
ininlet
mmonolith
otoutlet
pp polarization
ss polarization
sidetoward side wall

References

  1. de Richter, R.; Ming, T.; Davies, P.; Liu, W.; Caillol, S. Removal of non-CO2 greenhouse gases by large-scale atmospheric solar photocatalysis. Prog. Energy Combust. Sci. 2017, 60, 68–96. [Google Scholar] [CrossRef]
  2. Chang, H.; Kong, K.; Choi, Y.; Choi, Y.; Baeg, J.; Moon, S. First-principles studies of doped InTaO4 for photocatalytic applications. C. R. Chim. 2006, 9, 841–845. [Google Scholar] [CrossRef]
  3. Cruz-Puerto, J.; Ramirez-Carrillo, C.; Puga-Lechuga, J.; Mora, P.; Tavizon, G. Crystal structure and optical absorption properties of Er and Yb doped InTaO4 and InTaO4-yNy as photocatalyst under visible light. Catalysts 2020, 739, 136998. [Google Scholar] [CrossRef]
  4. Yoshida, T.; Toyoyama, H.; Umezu, I.; Sugimura, A. Synthesis of Ni-doped InTaO4 nanocrystallites by reactive pulsed laser ablation for application to visible-light-operating photocatalysts. Appl. Surf. Sci. 2009, 255, 9634–9637. [Google Scholar] [CrossRef]
  5. Wang, Y.; Wang, Q.; Zhan, X.; Wang, F.; Safdar, M.; He, J. Visible light driven type II heterostructures and their enhanced photocatalysis properties: A review. Nanoscale 2013, 5, 8326–8339. [Google Scholar] [CrossRef] [PubMed]
  6. Enesca, A. The Influence of Photocatalytic Reactors Design and Operating Parameters on the Wastewater Organic Pollutants Removal-A Mini-Review. Catalysts 2021, 11, 556. [Google Scholar] [CrossRef]
  7. González, A.; Stankiewicz, A.; Nigar, H. Catalyst heating characteristics in the traveling-wave mircrowave reactor. Catalysts 2021, 11, 369. [Google Scholar] [CrossRef]
  8. Dharwadkar, S.; Yu, L.; Achari, G. Photocatalytic degradation of sulfolane using a LED-based photocatalytic treatment system. Catalysts 2021, 11, 624. [Google Scholar] [CrossRef]
  9. Duan, H.; Xuan, Y. Enhanced optical absorption of the plasmonic nanoshell suspension based on the solar photocatalytic hydrogen production system. Appl. Energy 2014, 114, 22–29. [Google Scholar] [CrossRef]
  10. Bello, M.M.; Abdul Raman, A.A.; Purushothaman, M. Applications of fluidized bed reactors in wastewater treatment-A review of the major design and operational parameters. J. Clean. Prod. 2017, 141, 1492–1514. [Google Scholar] [CrossRef]
  11. Reilly, K.; Fang, B.; Taghipour, F.; Wilkinson, D.P. Photocatalytic water splitting in a fluidized bed system: Computational modeling and experimental studies. Appl. Energy 2018, 222, 423–436. [Google Scholar] [CrossRef]
  12. Reilly, K.; Wilkinson, D.P.; Taghipour, F. Enhanced photocatalytic hydrogen production in a UV-irradiated fluidized bed reactor. J. Catal. 2017, 353, 63–73. [Google Scholar] [CrossRef]
  13. Sengele, A.; Robert, D.; Keller, N.; Keller, V. Modified-TiO2 Photocatalyst Supported on β-SiC Foams for the Elimination of Gaseous Diethyl Sulfide as an Analog for Chemical Warfare Agent: Towards the Development of a Photoreactor Prototype. Catalysts 2021, 11, 403. [Google Scholar] [CrossRef]
  14. Delavari, S.; Amin, N.A.S. Photocatalytic conversion of CO2 and CH4 over immobilized titania nanoparticles coated on mesh: Optimization and kinetic study. Appl. Energy 2016, 162, 1171–1185. [Google Scholar] [CrossRef]
  15. Vella, G.; Imoberdorf, G.E.; Sclafani, A.; Cassano, A.E.; Alfano, O.M.; Rizzuti, L. Modeling of a TiO2-coated quartz wool packed bed photocatalytic reactor. Appl. Catal. B Environ. 2010, 96, 399–407. [Google Scholar] [CrossRef]
  16. Nguyen, T.; Wu, J. Photoreduction of CO2 in an optical-fiber photoreactor: Effects of metals addition and catalyst carrier. Appl. Catal. A Gen. 2008, 335, 112–120. [Google Scholar] [CrossRef]
  17. Ola, O.; Maroto-Valer, M.; Liu, D.; Mackintosh, S.; Lee, C.; Wu, J. Performance comparison of CO2 conversion in slurry and monolith photoreactors using Pd and Rh-TiO2 catalyst under ultraviolet irradiation. Appl. Catal. B Environ. 2012, 126, 172–179. [Google Scholar] [CrossRef]
  18. Chen, H.; Chu, F.; Yang, L.; Ola, O.; Du, X.; Yang, Y. Enhanced photocatalytic reduction of carbon dioxide in optical fiber monolith reactor with transparent glass balls. Appl. Energy 2018, 230, 1403–1413. [Google Scholar] [CrossRef]
  19. Lin, H.; Valsaraj, K.T. Development of an optical fiber monolith reactor for photocatalytic wastewater treatment. J. Appl. Electrochem. 2005, 35, 699–708. [Google Scholar] [CrossRef]
  20. Shehzad, N.; Tahir, M.; Johari, K.; Murugesan, T.; Hussain, M. A critical review on TiO2 based photocatalytic CO2 reduction system: Strategies to improve efficiency. J. CO2 Util. 2018, 26, 98–122. [Google Scholar] [CrossRef]
  21. Francis, A.; Priya, S.; Kumar, H.; Sudhakar, K.; Tahir, M. A review on recent developments in solar photoreactors for carbon dioxide conversion to fuels. J. CO2 Util. 2021, 47, 11515. [Google Scholar] [CrossRef]
  22. Minero, C. Kinetic analysis of photoinduced reactions at the water semiconductor interface. Catal. Today 1999, 54, 205–216. [Google Scholar] [CrossRef]
  23. Wei, Q.; Yang, Y.; Hou, J.; Liu, H.; Cao, F.; Zhao, L. Direct solar photocatalytic hydrogen generation with CPC photoreactors: System development. Sol. Energy 2017, 153, 215–223. [Google Scholar] [CrossRef]
  24. Wei, Q.; Yang, Y.; Liu, H.; Hou, J.; Liu, M.; Cao, F.; Zhao, L. Experimental study on direct solar photocatalytic water splitting for hydrogen production using surface uniform concentrators. Int. J. Hydrog. Energy 2018, 43, 13745–13753. [Google Scholar] [CrossRef]
  25. Baniasadi, E.; Dincer, I.; Naterer, G.F. Radiative heat transfer and catalyst performance in a large-scale continuous flow photoreactor for hydrogen production. Chem. Eng. Sci. 2012, 84, 638–645. [Google Scholar] [CrossRef]
  26. Lasa, H.D.; Rosales, B.S.; Moreira, J.; Valades-Pelayo, P. Efficiency Factors in Photocatalytic Reactors: Quantum Yield and Photochemical Thermodynamic Efficiency Factor. Chem. Eng. Technol. 2016, 39, 51–65. [Google Scholar] [CrossRef]
  27. Otálvaro-Marín, H.L.; Mueses, M.A.; Crittenden, J.C.; Machuca-Martinez, F. Solar photoreactor design by the photon path length and optimization of the radiant field in a TiO2-based CPC reactor. Chem. Eng. J. 2017, 315, 283–295. [Google Scholar] [CrossRef]
  28. Nguyen, T.; Wu, J. Photoreduction of CO2 to fuels under sunlight using optical-fiber reactor. Sol. Energy Mat. Sol. C 2008, 92, 864–872. [Google Scholar] [CrossRef]
  29. Ola, O.; Maroto-Valer, M.M. Review of material design and reactor engineering on TiO2 photocatalysis for CO2 reduction. J. Photochem. Photobiol. C Photochem. Rev. 2015, 24, 16–42. [Google Scholar] [CrossRef] [Green Version]
  30. Zhang, N.; Hou, H.; Yu, G.; Hu, E.; Du, L.; Zhao, J. Simulated performance analysis of a solar aided power generation plant in fuel saving operation mode. Energy 2019, 166, 918–928. [Google Scholar] [CrossRef]
  31. Tian, M.; Su, Y.; Zheng, H.; Pei, G.; Li, G.; Riffat, S. A review on the recent research progress in the compound parabolic concentrator (CPC) for solar energy applications. Renew. Sustain. Energy Rev. 2018, 82, 1272–1296. [Google Scholar] [CrossRef] [Green Version]
  32. Sedki, L.; Maaroufi, M. Design of parabolic solar daylighting systems based on fiber optic wires: A new heat filtering device. Energy Buildings 2017, 152, 434–441. [Google Scholar] [CrossRef]
  33. Yang, Z.; Li, L.; Wang, J.; Wang, W.; Song, J. Realization of high flux daylighting via optical fibers using large Fresnel lens. Sol. Energy 2019, 183, 204–211. [Google Scholar] [CrossRef]
  34. Yuan, K.; Yang, L.; Du, X.; Yang, Y. Numerical analysis of photocatalytic CO2 reduction in optical fiber monolith reactor with optimized structures. Energy. Convers. Manag. 2014, 87, 258–266. [Google Scholar] [CrossRef]
  35. Janczarek, M.; Kowalska, E. Computer simulations of photocatalytic reactors. Catalysts 2021, 11, 198. [Google Scholar] [CrossRef]
  36. Liou, P.; Chen, S.; Wu, J.; Liu, D.; Mackintosh, S.; Maroto-Valer, M.; Linforth, R. Photocatalytic CO2 reduction using an internally illuminated monolith photoreactor. Energy Environ. Sci. 2011, 4, 1487–1494. [Google Scholar] [CrossRef]
  37. Song, J.; Zhu, Y.; Tong, K.; Yang, Y.; Reyes-Belmonte, M.A. A note on the optic characteristics of daylighting system via PMMA fibers. Sol. Energy 2016, 136, 32–34. [Google Scholar] [CrossRef]
  38. Buie, D.; Monger, A.G.; Dey, C.J. Sunshape distributions for terrestrial solar simulations. Sol. Energy 2003, 74, 113–122. [Google Scholar] [CrossRef]
  39. Hecht, E. Optics, 4th ed.; Addison Wesley: Upper Saddle River, NJ, USA, 2002. [Google Scholar]
  40. Choi, W.; Ko, J.Y.; Park, H.; Chung, J.S. Investigation on TiO2-coated optical fibers for gas-phase photocatalytic oxidation of acetone. Appl. Catal. B Environ. 2001, 31, 209–220. [Google Scholar] [CrossRef]
  41. Rathore, M.M.; Kapuno, R. Engineering Heat Transfer; Jones & Bartlett Publishers: Boston, MA, USA, 2011. [Google Scholar]
  42. Kuo, K.K. Principles of Combustion; John Wiley and Sons: New York, NY, USA, 1986. [Google Scholar]
  43. Tahir, M.; Amin, N.S. Photocatalytic CO2 reduction and kinetic study over In/TiO2 nanoparticles supported microchannel monolith photoreactor. Appl. Catal. A Gen. 2013, 467, 483–496. [Google Scholar] [CrossRef]
  44. Wang, T.; Yang, L.; Du, X.; Yang, Y. Numerical investigation on CO2 photocatalytic reduction in optical fiber monolith reactor. Energy Convers. Manag. 2013, 65, 299–307. [Google Scholar] [CrossRef]
  45. Osaki, T. Effect of reduction temperature on the CO2-reforming of methane over TiO2-supported Ni catalyst. J. Chem. Soc. Faraday Trans. 1997, 93, 643–647. [Google Scholar] [CrossRef]
  46. Velázquez, J.J.; Fernández-González, R.; Díaz, L.; Pulido Melián, E.; Rodríguez, V.D.; Núñez, P. Effect of reaction temperature and sacrificial agent on the photocatalytic H2 -production of Pt-TiO2. J. Alloys Compd. 2017, 721, 405–410. [Google Scholar] [CrossRef]
  47. Sánchez, B.; Coronado, J.M.; Candal, R.; Portela, R.; Tejedor, I.; Anderson, M.A. Preparation of TiO2 coatings on PET monoliths for the photocatalytic elimination of trichloroethylene in the gas phase. Appl. Catal. B Environ. 2006, 66, 295–301. [Google Scholar] [CrossRef] [Green Version]
  48. Incropera, F.P. Fundamentals of Heat and Mass Transfer; John Wiley and Sons: New York, NY, USA, 1990. [Google Scholar]
  49. Song, J.; Zhou, Z.; Tong, K. An algorithm for the flux distribution over the flat absorber of a parabolic trough concentrator. Sol. Energy 2016, 125, 32–42. [Google Scholar] [CrossRef]
Figure 1. Schematics of (a) the continuous reactor coupled with a reflector and (b) the OFMR, (c) the map of concentrated irradiative flux, and (d) the melted optical fibers in the point concentrating system (reprinted from Ref [33]).
Catalysts 11 00829 g001
Figure 2. Schematics of OFMR coupled with PTC system.
Catalysts 11 00829 g002
Figure 3. Diagram of transmission process of rays.
Catalysts 11 00829 g003
Figure 4. Schematics of the (a) monolith area partition and (b) a basic element.
Catalysts 11 00829 g004
Figure 5. Block diagram of the computational model.
Catalysts 11 00829 g005
Figure 6. Schematics of optical loss on the end considering polarization.
Catalysts 11 00829 g006
Figure 7. Verification of the kinetic model with temperature effects.
Catalysts 11 00829 g007
Figure 8. The variations of (a) concentrated irradiative flux on monolith with x coordinate normalized by the focal length of different alignment errors and (b) irradiative flux on the reaction wall with y coordinate of different reaction channels.
Catalysts 11 00829 g008
Figure 9. (a) The flow field and (b) CH3CHO concentration distribution on the cross-section x = 3.5 mm.
Catalysts 11 00829 g009
Figure 10. The temperature fields of cross sections at (a) z = 3.5 mm, (b) z = 10.5 mm, (c) z = 17.5 mm, and (d) z = 24.5 mm.
Catalysts 11 00829 g010
Figure 11. The variation of reaction density and efficiency with a diameter of gas channels.
Catalysts 11 00829 g011
Figure 12. The variation of reaction density and efficiency with penetration number of gas channels.
Catalysts 11 00829 g012
Figure 13. The flow field in a reaction element with (a) Ny = 1, (b) Ny = 2, (c) Ny = 3, and (d) Ny = 4.
Catalysts 11 00829 g013
Figure 14. Variations of the reaction density and maximum fiber temperature with the serial number of reaction elements.
Catalysts 11 00829 g014
Table 1. Parameters of the present photoreactor.
TypeVariablesValuesUnit
Reaction channel diameterdr3Mm
Side length of basic elementsLx7mm
Ly7mm
Light absorption of monolithαm0.8dimensionless
Emissivity of monolithεm0.9dimensionless
Transmissivity of glass envelopeτg0.95dimensionless
Fiber diameterdf0.5mm
Fraction loss coefficientα0.386cm−1
Backward attenuation coefficientβ1.95cm−1
percentage of the direct raysfθ0.762dimensionless
Inlet concentrationCi,CO243.75mol·m−3
Ci,H2O-mol·m−3
Kinetic rate constantkt05.0678 × 10−10m−2·s4·mol·kg−2
Arrhenius activation energyEt10.5329kJ·mol−1·K−1
Table 2. Parameters of the PTC system.
TypeVariablesValuesUnit
Focal lengthF1m
WidthW0.8284m
Rim angleθrim45degree
Solar intercept angleδ4.65mrad
Transmissivity of glass envelopeτg0.95dimensionless
Reflectivity of mirrorrm0.93dimensionless
Direct normalized irradianceDNI1000W·m2
Publisher’s Note: MDPI stays neutral with regard to jurisdictional claims in published maps and institutional affiliations.

