Article

A Simple and Straightforward Method for Activity Measurement of Carbonic Anhydrases

1
Institute of Environmental Biotechnology, Department for Agrobiotechnology, University of Natural Resources and Life Sciences Vienna, Konrad Lorenz Str. 20, 3430 Tulln, Austria
2
ACIB-Austrian Centre of Industrial Biotechnology, Krenngasse 37, 8010 Graz, Austria
3
Archaea Physiology & Biotechnology Group, Department of Functional and Evolutionary Ecology, University of Vienna, Althanstraße 14, 1090 Vienna, Austria
*
Author to whom correspondence should be addressed.
Catalysts 2021, 11(7), 819; https://doi.org/10.3390/catal11070819
Submission received: 9 June 2021 / Revised: 28 June 2021 / Accepted: 2 July 2021 / Published: 6 July 2021
(This article belongs to the Special Issue Enzyme Bioreactor Design)

Abstract

:
Carbonic anhydrase (CA) is an enzyme of high interest due to its high implications relative to the medical and environmental sectors. In the current paper, an enzyme assay for the determination of CA activity is proposed and it is characterized by its simplicity and high practicability. It permits the straightforward comparison of CAs performance in physiological conditions. The methodology and the theoretical background of the evaluation method are explained in detail. Moreover, the presumed advantages over alternative assays are discussed. The assay has proven to be particularly useful for the screening of CA activity with respect to their application in CO2, capturing processes for further utilization or storage.

Graphical Abstract

1. Introduction

Carbonic anhydrases (CAs; EC 4.2.1.1) are a group of metalloenzymes that catalyze the inter-conversion of carbon dioxide and water into the bicarbonate ion and a proton. First isolated in 1933, CAs have been found to be abundant in algae, bacteria, archaea, plants and animal tissues [1,2]. Six different and evolutionarily unrelated classes have been identified, namely α, β, γ, δ, ζ and η [3]. Despite their structural differences, all CAs utilize the same catalytic mechanism involving a central metal (mostly zinc) atom [4].
Due to their importance in the medical sector, CAs are thoroughly studied enzymes. CAs play a crucial role in numerous physiological processes, such as respiration, pH and CO2 homeostasis, secretion, gluconeogenesis, or ureagenesis. In addition to the established role of CA inhibitors such as diuretics and antiglaucoma drugs, it has been made apparent that such inhibitors could have potential as novel anticancer and anti-infective drugs [5]. More recently, CAs have become the focus of environmental research. Climate change mitigation scenarios desire technologies that can be immediately implemented. These include carbon capture, utilization and storage [6]. In this context, CAs have raised high interest as enzymatic accelerators while proposing significant enhancement of the CO2 capturing process in the aqueous phase [7,8].
A wide range of methods have been developed for the measurement of CA activity [9]. However, two of them are most widely applied. These are the Wilbur-Anderson assay and a colorimetric method, which is the so-called p-nitrophenol assay [10]. The Wilbur-Anderson assay makes use of the pH decrease caused by the reaction. One unit is defined as a pH drop from 8.3 to 6.3 per minute at 0 °C within a 20 mmol·L−1 Tris-HCl buffer solution saturated with CO2 [11]. However, the assay suffers certain drawbacks. It is conducted at non-physiological temperature conditions (0–3 °C) in order to increase CO2 solubility to provide sufficient substrate concentration. It is obvious that a comparison at or near zero temperature does not necessarily reproduce the activity at ‘natural’ conditions. Moreover, the unit is empirical and provides little information on enzyme kinetics. The p-nitrophenol assay utilizes another feature of CAs: In addition to its natural reaction, i.e., CO2 hydration, CAs also exhibit certain carboxylic esterase activity. The release of nitrophenol, which is a chromophore with two characteristic adsorption peaks, through the hydrolysis of p-nitrophenol acetate is followed by spectrophotometric measurement [12]. This easily performable test is a valuable tool allowing the rapid comparison of CA activities. Nonetheless, the employment of an alternative substrate renders correct predictions of the actual CO2 conversion capacity tricky.
More precise methods are available that provide highly accurate results. Frequently stopped-flow devices in combination with absorbance or fluorescence spectroscopy have been used to study the kinetics of CAs. Moreover, radioactive labelling with 13C or 18O and sophisticated analytical tools such as mass spectrometry or NMR have been employed [13]. There is no doubt that the application of such high end methods is well justified to address specific scientific questions, e.g., the measurement of undisturbed enzyme activity and its physiological effects in animal or plant tissues. However, the analytical effort and/or the required instrumentation increases significantly. On the other hand, the simple tests also have their merits, in particular, with the focus relative to technical applications such as the mentioned carbon sequestration processes.
Here, we report on a simple procedure and evaluation method that allows rapid estimation of enzyme activity. Background and method development are explained in detail and data interpretation in terms of kinetic constants are discussed.

2. Results

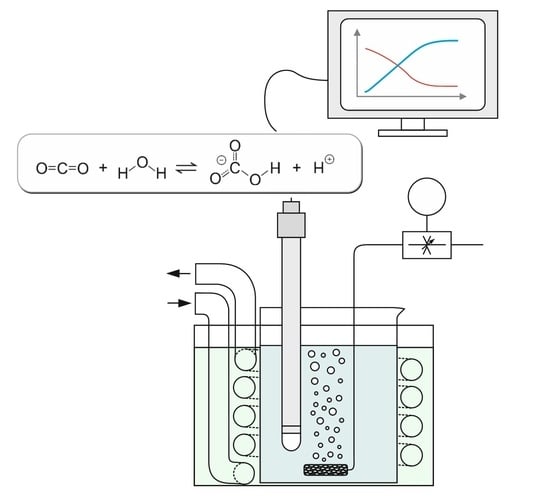
The presented assay is a modification of the Wilbur-Anderson protocol and the only analytical instrument employed is a pH meter with data recording. In order to allow adequate monitoring at higher temperatures by considering the associated enhanced enzyme activities, the time span necessary for a certain pH drop needs to be extended. For this purpose, the buffer concentration of the solution was raised from 20 to 100 mM. The buffer partially adsorbs the protons produced by the enzymatic conversion. In return, more CO2 is also required for the overall reaction. Regarding the limited solubility of CO2, it has to be continuously delivered by means of gas sparging instead of providing a specific amount at the beginning of the test.
The development and evaluation of the method are based on the considerations and assumptions presented in the following. In some equations, amounts (in mol) are addressed whereas concentrations (in mol·L−1) are required for other equations describing equilibrium constants or kinetic reactions. However, taking a hypothetical reaction volume of 1 L allows the one-to-one interconversion of the two units.

2.1. Dependency of Bicarbonate Concentration on pH

The first step was to calculate the relation between measured pH and bicarbonate derived from conversion of CO2. The apparent pKa of carbonic acid, 6.35 at 25 °C, indicates a relatively weak acid being only slightly dissociated. However, it is well known that during the aqueous phase carbonic acid is in equilibrium with dissolved or aquatic CO2 (CO2(a)). Both species can hardly be distinguished and the above-named value is actually comprised of two equilibria: interconversion of CO2(a)/H2CO3 and the true pKa. In fact, carbonic acid is a relatively strong acid. The exact pKa value cannot be determined but it lies between 3.4 and 3.9 at room temperature 20 °C < T < 25 °C and at zero ionic strength [14]. The pH range observed in the investigated test system, i.e., ≥6.4 is at least 2.5 units higher. Based on the given definition of the pKa, Equation (1) can be developed.
[H2CO3] / [HCO3] = 10(pH – pKa) ≤ 0.00316
Equation (1) shows that even at pH 6.4 less than 3.2‰, carbonic acid is present in the protonated form. It can therefore be simplified that the amount of CO2 dissolved during the aquatic phase that undergoes further conversion corresponds to the HCO3 ions present in the solution and an equivalent number of released protons. These protons either interact with the TRIS buffer system and/or causes a change of pH.
x = a + b
X is the total protons released that is equivalent to bicarbonate ions [HCO3].
a denotes the H+ consumed by the buffer components.
b denotes the H+ resulting in a change of pH.
Equation (3) describes the dissociation equilibrium of the TRIS buffer at the initial conditions.
Ka = [TRIS]i × [H+] / [TRISH+]i
Ka denotes the acid constant of TRIS.
Index ‘i’ indicates initial the concentration values at the beginning of the test.
At a given time, the new equilibrium concentrations are described as follows.
[TRIS] = [TRIS]I − a
[TRISH+] = [TRISH+]i + a
Considering that the proton concentration at the beginning is very low, 10−8.2, and is almost immediately outweighed by the protons released from H2CO3 dissociation, it can be simplified that the absolute proton concentration is equal to b. This simplification is a standard approach also used in pH calculations of weak acids or puffer systems described in the following.
B >> [H+]i → [H+] ≈ b
Substituting Equations (4) and (5) into Equation (6) yields the following.
Ka = ([TRIS]i − a) × b / ([TRISH+]i + a)
Solving the set of Equations (2) and (7) for [HCO3] as a function of [H+] provides the following.
[HCO3] = (-[TRISH+]i × Ka + (Ka + [TRIS]i) × [H+] + [H+]2) / (Ka + [H+])
With pKa = 8.1 (at 25 °C [15,16]) and a total buffer molarity of 0.1, the initial concentrations of the two buffer species at the start of pH (8.2) are the following: [TRIS]i = 0.056 and [TRISH+]i = 0.044. Inserting these values yields Equation (9), which allows the calculation of the bicarbonate concentration dependent on the measured pH as described as follows.
[HCO3] = (−3.495 × 10⁻¹⁰ + 0.056 × [H+] + [H+]2) / (7.943 × 10⁻⁹ + [H+])
Using pH data, the gained bicarbonate concentration can be plotted versus time.
In order to prove that the resulting simplifications does not produce any significant errors, a more comprehensive calculation was performed. This included two more equations covering the ion dissociation of water and the initial proton concentration, described as follows.
x = a + b – r
[H+] = b + [H+]i – r
The value, r, denotes the re-association of H+ and OH- to maintain the ion-product of water (=10−14).
Recalculated data almost completely matched the data obtained before. It was therefore concluded that the simpler Equation (9) is sufficiently accurate for the proposed method.

2.2. Correlation between Bicarbonate and Enzyme Reactivity

The second step is the correlation of the bicarbonate concentration to the activity of the CA considering the CO2 transfer to the aquatic phase. In contrast to the buffer reaction above, the steps discussed in what follows are rate limiting. Consequently, the timely change of concentrations and not the concentrations at equilibrium needs to be addressed. Firstly, the time course of CO2 in the liquid phase was regarded. The course of gas transfer to liquid is described by the well-known differential Equation (12). Therein, the transfer rate correlates to the difference between the saturation concentration of CO2 in the liquid phase (Csat, which depends on the Henry constant) and the actual concentration at a given time multiplied by the mass transfer rate from gas to liquid k1 [17]. The latter is specific for a given set-up, which implying parameters such as gas flow rate, bubble size or mixing conditions, etc., while the saturation concentration can be calculated from the Henry coefficient or may otherwise be obtained from respective tables.
∂CO2(a)’ / ∂t = k1 × (Csat − [CO2(a)])
Solving this differential equation with a dissolved CO2 concentration of zero at time zero results in Equation (13).
[CO2(a)]’ = Csat × (1 − e−k1 × t)
Csat denotes the saturation concentration of CO2(a).
This function describes the increasing form of an exponential decay and is generally valid for gas transfer reactions, e.g., for oxygenation. However, in the current case it is necessary to include the further reaction of dissolved CO2 into bicarbonate and a proton. Following the law of mass action, both the forward and the backward reactions have to be taken into account. Therefore, Equation (12) needs to be extended by the following term.
∂CO2(a)’’ / ∂t = −k2 × [CO2(a)] + k−2 [H+] × [HCO3]
k2 is the rate constant of CO2 conversion and k−2 is the rate constant of the back-reaction in the reverse direction. Combination of Equations (13) and (14) provides the timely change of CO2 in the liquid phase. However, using Equation (9) to solve the complete differential equation is mathematically complex. Again, a simplification was employed: In the beginning, the back-reaction is very small due to the low concentrations of bicarbonate multiplied by the low concentration of protons. Therefore, the second part of the term can be neglected, which resulting in the following equation.
∂[CO2(a)] / ∂t = k1 × (Csat − [CO2(a)]) − k2 × [CO2(a)]
Rearrangement results in the following equation.
∂[CO2(a)] / ∂t = (k1 + k2) × (Csat × k1 / (k1 + k2) − CO2(a))
Integration of Equation (16) results in the same type of exponential function as Equation (12), however, with modified parameters.
[CO2(a)] = k1 / (k1 + k2) × Csat × (1 − e −(k1 + k2) × t)
Equation (17) describes the course of CO2 concentration as long as the back reaction of bicarbonate is small. With this equation in mind, the use of a CO2 sensitive electrode is another interesting option for following enzyme activity as it has been investigated by Botrè and Botrè [18]. However, this alternative was not tested here. In the current case, further development of the relationship between CO2(a) and HCO3 concentration was worked out. In Equation (12), this context has already been addressed. Evidently, any CO2 converted occurs in the form of bicarbonate. Again, disregarding the backreaction due to the distance to the equilibrium concentrations, Equation (18) and, subsequently, Equation (19) can be developed.
∂[HCO3] / ∂t = [CO2(a)] × k2
∂[HCO3] / ∂t = k1 × k2 / (k1 + k2) × Csat × (1 − e −(k1 + k2) × t)
In solving the differential equation with the initial condition, the concentration of zero at time zero yields Equation (20).
[HCO3] = k1 × k2 / (k1 + k2)2 × Csat × e −(k1 + k2) × t + k1 × k2/(k1 + k2) × Csat × t − k1 × k2/(k1 + k2)2

2.3. Elaboration of the Rate Constant of Enzymatic Turnover

It might be possible to utilize a curve-fitting program and to investigate the individual constants. Nevertheless, an easier solution was sought here. The exponential term in the beginning of Equation (19) is another e-function. With a negative exponent, it gradually progresses towards zero and the HCO3 concentration becomes a straight line. The slope (m) of the graph is described as follows.
m = k1 × k2 / (k1 + k2) × Csat
The value of m can be directly taken from the plot of the bicarbonate concentration. Using the blank experiment, k1 can be elaborated from the rearranged Equation (21) employing literature data for Csat. and k2. Csat is 0.0343 mol.L−1 at 25 ° C and 1 atm pressure (calculated from the Henry coefficient provided by [19]). Regarding the second parameter, it must be noted that the actual situation is more complex and that k2 is not a constant value. The reason is that there are two chemical reactions involved in the CO2/HCO3 equilibrium: CO2 + H2O ⇔ HCO3 + H+ and CO2 + OH ⇔ HCO3. According to Schulz et al. [20] the rate constant at 25 °C can be calculated by combining the two individual reaction constants: k2 = k2,1 + k2,2 × [OH] with k2,1 = 3.71 × 10⁻²·s−1 and k2,2 = 2.24 × 10³ L·mol−1 s−1. Despite these explanations, we presume that the assumption of a fixed k2 is acceptable for the for the current purpose and keeping in mind all the other simplifications already made. In the given pH measurement range (~8–6.5), a k2 value for the uncatalyzed reaction of 3.8 × 10⁻² is considered a reasonable approximation. According to these provisions, the estimated value for k1 is 0.051 s−1 for the specific set-up.
Modeling was employed to crosscheck the general validity of the described methodical approach. Firstly, model parameters were adjusted to fit the data for the blank experiment. Literature values or approximated values as listed in Table 1 (see Section 3. Materials and Methods) were applied. In a subsequent step, the CO2 transfer rate, k1, was adjusted to best possibly fit the observed data. Figure 1 shows an overlay of the predicated course and actually measured pH values (a) as well as the predicted and calculated HCO3 concentration (b) for two experiments with or without the addition of CA, respectively. Despite certain deviations, in particular, for the blank experiment, the model reproduces the data observed for the CA catalyzed reaction and the hydration of CO2 dominates quite well. It should be noted that the final applied Csat value was higher than initially considered. The locally higher dynamic pressure at the surface of the sparging device is a probable explanation for that.
An example of model predictions depicting an entire view of all involved chemical species is provided in Figure 2. Again, the practically linear increase in HCO3 concentration is demonstrated.
Knowing the slope of the graph and the elaboration of k1 and Csat from the blank experiment allows the theoretical calculation of the catalyzed rate constant k2 in each test. However, it has to be considered that the provision of the exact values for the individual constants is complex. The difficulties related to k2 were already mentioned. Moreover, Csat is not only related to temperature and pressure but has also significant dependency on salinity or, more accurately, on the concentration and nature of the individual ions present in aquatic phase [21]. Even the pKa of the Tris buffer is only valid in highly diluted solutions and has to be slightly corrected for ionic strength [22]. Finally, the last simplification made above which disregards the back reaction has some limitations. The back reaction sets in before the bicarbonate concentration reaches its highest inclination and, consequently, the maximum slope is slightly underestimated.
To summarize, there are certain imprecisions regarding the accuracy of the underlying parameters, as discussed previously. Nevertheless, the developed theory allows the reasonable estimation of the k2 of the catalyzed reaction, which permits good judgement of the practical potential of a certain enzyme.

2.4. Calibration with a Standard Enzyme and Overall Assessment

For practical purposes, it was more straightforward and convenient to calibrate the test system with a standard enzyme of known activity. For this purpose, different concentrations of CA from bovine erythrocytes were subjected to the test. The corresponding calculations using pH data and Equation (9) HCO3 concentrations are provided in Figure 3a. Figure 3b demonstrates data evaluation through the determination of the slope of the graph. Even if it might be hard to precisely define the linear range, the inclination within any reasonable time frame of reasonable linearity can be taken as calibration values. The final elaborated calibration curve presenting the applied enzyme amounts (primary x-axis) or the corresponding Wilbur-Andersen units (secondary x-axis) versus the slope of HCO3 is presented in Figure 4.
A comparison of the standard enzyme and three further CAs is presented in Figure 5. Despite an obvious correlation between the two assays, the figure also illustrates that the general assessment of the potential of different enzymes does not provide the same picture. This underlines our hesitations regarding the validity of data obtained by the WA assay conducted at 0–4 °C due to the difference in temperature sensitivity of CAs.
A certain disadvantage of the proposed method is that the pH is not constant throughout the test. Although the buffer provides a certain stabilization effect, pH still drops in the course of the enzyme reaction. Accordingly, enzyme activity is not a distinct value at fixed conditions but an average value over a certain pH range. However, it has to be emphasized that this disadvantage is shared with the other commonly applied test, which is the Wilbur-Anderson assay. It is, of course, possible to combine the presented method with a titration approach to maintain the pH at a fixed set-point. A corresponding attempt has been already suggested by Magid and Turbeck [23]. However, this would imply an exchange of simplicity for higher accuracy and this would give up the biggest asset of the proposed test system. Despite certain shortcomings and keeping in mind the downsides of other CA assays, we particularly acknowledge the high practicability of the test. In our lab, we found the proposed assay extremely helpful for the purpose of a quick routine method to straightforwardly crosscheck or compare the CO2 conversion efficiency of different CAs.
Table 1. Types of reaction, rate laws and constants used for modeling the timely behavior of chemical species.
NameRate LawReactionRate Constants 1
CO2 transfer gas to liquidGas–liquid transfer according to Equation (11)CO2(g) → CO2(a)k1 = 5.1 × 10⁻²
(s−1) 2
Csat = 3.43 × 10⁻²
(mol L−1)
H2O dissociationMass action reversibleH2O Catalysts 11 00819 i001 H+ + OH-kH2O_d = 2.53 × 10⁻⁵
(s−1) *
kH20_a = 1.4 × 10¹¹
(L·mol−1 s−1) 3
CO2 hydrationMass action reversibleCO2 + H2O Catalysts 11 00819 i001 H+ + HCO3k2_d = 3.8 × 10⁻²
(s−1) 4
k2_a = 8.51 × 10⁴
(L·mol−1 s−1) *
TRIS buffer dissociationMass action reversibleTRISH+ Catalysts 11 00819 i001 TRIS + H+kTris_d = 7.94 × 101
(s−1) *
kTris_a = 1.0 × 10¹⁰
(L·mol−1 s−1) 5
1 For reversible mass action, the dissociation (index _d) and association rates (index _a) are provided. 2 Estimated value for the given setup from Equation (21) and the blank experiment. 3 [24]. 4 Approximated value for the uncatalyzed reaction (see text). 5 Estimated from data upon dissociation of amines provided in [25]. * Calculated from the constant of the counter reaction and the dissociation constant at 25 °C.

3. Materials and Methods

3.1. Setup

Titration was performed in a 100 mL glass beaker enclosed by a temperature-controlled vessel to maintain 25 °C. Recording of the pH course was conducted with an automatic titration device (Titrino 702, pH electrode: LL-Viscotrode and Software TiNet 2.5 (2003), Metrohm, Herisau, Switzerland). All solutions were maintained at 25 °C prior to use. Gas sparging was conducted with bottled CO2 (purity 99.5%, Messer, Gumpoldskirchen, Austria). In order to assure that enzymatic conversion is the rate-limiting step, CO2 has to be delivered much faster than its consumption due to CA activity. Therefore, a stainless-steel aerator made of sintered metal (cylindric porous frit product no. 84026, outer diameter 5.8 mm, length 22 mm, Reichelt Chemie Technik, Heidelberg, Germany,) was employed in order to achieve fine bubble distribution. In addition, a high flow rate (200 mL min−1) fixed by a mass flow controller (EL-Flow Select, Bronckhorst, Ruurlo, The Netherlands) was applied. Figure 6 illustrates the setup.
Tris buffer (0.1 mol·L−1) was made from Tris-base (Tris(hydroxymethyl)aminomethane, ultrapure grade ≥ 99.9%, Sigma-Aldrich, Vienna, Austria) adjusted to pH 8.2 at 25 °C with 6 mol·L−1 H2SO4 [14]. The measurement procedure was as follows. A 40 mL buffer was poured into the vessel. After a quick check of the appropriate temperature and pH, 0.1 mL enzyme solution was added and, at same time, gasification as well as pH recording begun. Due to the intensive mixing through the rising bubbles, no additional stirring was necessary. The experiment ended when a final stable pH below 6.5 was achieved.

3.2. Tested Enzymes

The utilized standard enzyme was CA from bovine erythrocytes (product no. C2624, Sigma-Aldrich, Vienna, Austria). The specific activity given by the provider was ≥3500 Wilbur-Anderson units.mg protein−1; however, our own measurements only showed an activity of 2090 (+/−115) Wilbur-Anderson units per mg. The following concentrations were applied: Enzyme stock of 0.1, 0.08, 0.06, 0.04 and 0.02 mg/mL (in 0.1 M Tris buffer) resulting in a final concentration in the test of 0.25, 0.2, 0.15, 0.1 and 0.05 mg L−1, respectively.
Three more microbial CAs derived from Persephonella marina EX-H1, Methanobacterium thermoautotrophicum and Acetobacterium woodii DSM 1030 were used for the evaluation of the method. CAs were obtained through the heterologous expression of the respective genes in E. coli. Detailed information on their preparation as well as the potential for CO2 capturing will be provided in an upcoming publication.

3.3. Mathematical and Modeling Tools

Calculations were made or confirmed using the free online computing engine WolframAlpha available under https://www.wolframalpha.com/ (accessed on 11 January 2021). In order to verify the validity of the approach and to crosscheck the impact of simplifications, modeling of the timely behavior of the individual chemical species was made utilizing the program COPASI (version 4.29, Build 228), which is a free software application for the simulation and analysis of biochemical networks available under http://copasi.org/ (accessed on 10 February 2021). The simple model contained 4 reactions describing the rate of change of the involved chemical species. The types of reaction, rate laws and used constants are listed in Table 1. The software computes the timely development of the concentrations through iterative calculations for a given time interval.

4. Conclusions

In an era of growing concern relative to the record CO2 levels in the atmosphere, the development of CO2 capturing technologies is of high interest. On the path to full scale application, enzymatic enhancement is one of the options to improve efficiency of this approach. The CA activity assay proposed in the current paper resembles a simple method for judging enzyme activity requiring minimal analytical equipment. The continuous recording allows an accurate determination of conversion rates based on a larger set of data points compared to the Wilbur-Anderson assay. In contrast to this alternative routine method, activity is measured at an appropriate temperature and the gained values can be interpreted as thermodynamic constants. This allows easy and rapid comparison of CA activity. There are certainly assays of higher accuracy which, however, go hand in hand with elevated analytical effort. The introduced method is considered particularly useful for the screening of different CAs in environmental applications.

Author Contributions

Conceptualization, G.B. and S.K.-M.R.R.; methodology, F.S., J.R. and D.R.; data calculation and modeling, W.F., writing—original draft preparation, W.F. All authors have read and agreed to the published version of the manuscript.

Funding

The presented method was developed in the course of two research projects conducted at the institute. We kindly thank the Austrian Research promotion Agency (FFG) for funding of CarbonATE (FFG project no. 869728) and PTLiquid (FFG project no. 865091).

Data Availability Statement

The data presented in this study are available on request from the corresponding author. Detailed information on preparation and testing of the recombinant CAs listed in Section 3.2 will be provided in an upcoming paper.

Conflicts of Interest

The authors declare no conflict of interest and the funders had no role in the design of the study; in the collection, analyses or interpretation of data; in the writing of the manuscript or in the decision to publish the results.

References

  1. Smith, K.S.; Ferry, J.G. Prokaryotic carbonic anhydrases. FEMS Microbiol. Rev. 2000, 24, 335–366. [Google Scholar] [CrossRef]
  2. Tripp, B.C.; Smith, K.; Ferry, J.G. Carbonic anhydrase: New insights for an ancient enzyme. J. Biol. Chem. 2001, 276, 48615–48618. [Google Scholar] [CrossRef] [Green Version]
  3. Supuran, C.T. Structure and function of carbonic anhydrases. Biochem. J. 2016, 473, 2023–2032. [Google Scholar] [CrossRef] [PubMed]
  4. Angeli, A.; Carta, F.; Supuran, C. Carbonic Anhydrases: Versatile and Useful Biocatalysts in Chemistry and Biochemistry. Catalysts 2020, 10, 1008. [Google Scholar] [CrossRef]
  5. Supuran, C.T. Carbonic anhydrases: Novel therapeutic applications for inhibitors and activators. Nat. Rev. Drug Discov. 2008, 7, 168–181. [Google Scholar] [CrossRef] [PubMed]
  6. Orr, F.M.J. Carbon Capture, Utilization, and Storage: An Update. SPE J. 2018, 23, 2444–2455. [Google Scholar] [CrossRef]
  7. Boone, C.D.; Gill, S.; Habibzadegan, A.; McKenna, R. Carbonic Anhydrase: An Efficient Enzyme with Possible Global Implications. Int. J. Chem. Eng. 2013, 2013, 1–6. [Google Scholar] [CrossRef] [Green Version]
  8. Sharma, T.; Sharma, S.; Kamyab, H.; Kumar, A. Energizing the CO2 utilization by chemo-enzymatic approaches and potentiality of carbonic anhydrases: A review. J. Clean. Prod. 2020, 247, 119138. [Google Scholar] [CrossRef]
  9. Forster, R.E. Methods for the Measurement of Carbonic Anhydrase Activity. In The Carbonic Anhydrases; Springer: Berlin/Heidelberg, Germany, 1991; pp. 79–98. [Google Scholar]
  10. Effendi, S.S.W.; Ng, I.-S. The prospective and potential of carbonic anhydrase for carbon dioxide sequestration: A critical review. Process. Biochem. 2019, 87, 55–65. [Google Scholar] [CrossRef]
  11. Wilbur, K.M.; Anderson, N.G. Electrometric and Colorimetric Determination of Carbonic Anhydrase. J. Biol. Chem. 1948, 176, 147–154. [Google Scholar] [CrossRef]
  12. Verpoorte, J.A.; Mehta, S.; Edsall, J.T. Esterase Activities of Human Carbonic Anhydrases B and C. J. Biol. Chem. 1967, 242, 4221–4229. [Google Scholar] [CrossRef]
  13. Zhao, P.; Geyer, R.; Boron, W.F. A Novel Stopped-Flow Assay for Quantitating Carbonic-Anhydrase Activity and Assessing Red-Blood-Cell Hemolysis. Front. Physiol. 2017, 8, 169. [Google Scholar] [CrossRef] [PubMed] [Green Version]
  14. Pines, D.; Ditkovich, J.; Mukra, T.; Miller, Y.; Kiefer, P.M.; Daschakraborty, S.; Hynes, J.T.; Pines, E. How Acidic Is Carbonic Acid? J. Phys. Chem. B 2016, 120, 2440–2451. [Google Scholar] [CrossRef] [PubMed] [Green Version]
  15. Goldberg, R.N.; Kishore, N.; Lennen, R.M. Thermodynamic Quantities for the Ionization Reactions of Buffers. J. Phys. Chem. Ref. Data 2002, 31, 231–370. [Google Scholar] [CrossRef] [Green Version]
  16. Sigma-Aldrich, Tris(hydroxymethyl)aminomethane; Tris, Sigma Technical Bulletin No. 106B. Available online: https://www.sigmaaldrich.com/deepweb/assets/sigmaaldrich/product/documents/301/225/106bbul.pdf (accessed on 26 May 2021).
  17. Holmén, K.; Liss, P. Models for air-water gas transfer: An experimental investigation. Tellus B Chem. Phys. Meteorol. 1984, 36, 92–100. [Google Scholar] [CrossRef] [Green Version]
  18. Botrè, C.; Botrè, F. Determination of carbonic anhydrase activity by a pCO2 sensor. Anal. Biochem. 1990, 185, 254–264. [Google Scholar] [CrossRef]
  19. NIST. Chemistry WebBook, NIST Standard Reference Database Number 69; Linstrom, P.J., Mallard, W.G., Eds.; National Institute of Standards and Technology: Gaithersburg, MD, USA, 2018. [Google Scholar] [CrossRef]
  20. Schulz, K.; Riebesell, U.; Rost, B.; Thoms, S.; Zeebe, R. Determination of the rate constants for the carbon dioxide to bicarbonate inter-conversion in pH-buffered seawater systems. Mar. Chem. 2006, 100, 53–65. [Google Scholar] [CrossRef] [Green Version]
  21. Weiss, R. Carbon dioxide in water and seawater: The solubility of a non-ideal gas. Mar. Chem. 1974, 2, 203–215. [Google Scholar] [CrossRef]
  22. Clancy, M.J. The formulation of buffers and media for enzyme histochemistry. J. Mol. Histol. 1987, 19, 27–34. [Google Scholar] [CrossRef]
  23. Magid, E.; Turbeck, B. The rates of the spontaneous hydration of CO2 and the reciprocal reaction in neutral aqueous solutions between 0° and 38°. Biochim. Biophys. Acta (BBA) Gen. Subj. 1968, 165, 515–524. [Google Scholar] [CrossRef]
  24. Stillinger, F.H. Proton Transfer Reactions and Kinetics in Water. In Theoretical Chemistry; Elsevier: Amsterdam, The Netherlands, 1978; Volume 3, pp. 177–234. [Google Scholar]
  25. Eigen, M. Proton Transfer, Acid-Base Catalysis, and Enzymatic Hydrolysis. Part I: Elementary Processes. Angew. Chem. Int. Ed. 1964, 3, 1–19. [Google Scholar] [CrossRef]
Figure 1. Overlay of measured and predicted values for the blank experiment and the standard enzyme (0.25 mg L−1): (a) pH measured (solid line) versus model (x); (b) HCO3 concentration calculated from Equation (9) (solid line) versus model (x).
Catalysts 11 00819 g001
Figure 2. Example of model predictions. Course of the individual chemical species illustrating the linear increase in HCO3 over a certain time period.
Catalysts 11 00819 g002
Figure 3. (a) Calculated course of HCO3 concentration from pH data utilizing Equation (9) at different enzyme concentrations (0 to 0.25 mg L−1) and (b) data evaluation through the calculation of the incline by the corresponding linear trendlines.
Catalysts 11 00819 g003
Figure 4. Calibration curve using bovine CA: enzyme concentration/units versus inclination of the HCO3 graph. Wilbur-Anderson units were calculated from the measured activity of the standard enzyme.
Catalysts 11 00819 g004
Figure 5. Comparison of results obtained by the WA assay and the current method using the standard enzyme (CA from bovine erythrocytes) and three additional recombinant CAs.
Catalysts 11 00819 g005
Figure 6. Experimental setup.
Catalysts 11 00819 g006
Publisher’s Note: MDPI stays neutral with regard to jurisdictional claims in published maps and institutional affiliations.

