Article

The Effect of Hydrogen Production Rate of the via Different Preparation of Co-Based Catalyst with Sodium Borohydride

1
Graduate Institute of Precision Manufacturing, National Chin-Yi University of Technology, Taichung City 41170, Taiwan
2
Department of Refrigeration, Air Conditioning and Energy Engineering, National Chin-Yi University of Technology, Taichung City 41170, Taiwan
*
Author to whom correspondence should be addressed.
Catalysts 2021, 11(5), 528; https://doi.org/10.3390/catal11050528
Submission received: 17 March 2021 / Revised: 12 April 2021 / Accepted: 19 April 2021 / Published: 21 April 2021
(This article belongs to the Special Issue Catalytic Reforming for Syngas and H2 Productions)

Abstract

:
This study processed the water vapor entrained in the NaBH4 hydrogen production reaction inside the primary hydrogen production tank through the secondary hydrogen production tank, in order to increase total hydrogen production. γ-Al2O3 was used as the carrier for the hydrolytic hydrogen production reaction in the primary hydrogen production tank. The reaction was chelated with metal catalyst Co2+ at different concentrations to produce the catalyst. Next, the adopted catalyst concentration and different catalyst bed temperatures were tested. The secondary hydrogen production tank was tested using NaBH4 powder and multiple NaBH4+ Co2+ mixed powders at different ratios. The powder was refined by ball milling with different steel ball ratios to enlarge the contact area between the water vapor and powder. The ball milling results from carriers at different concentrations, different catalyst bed temperatures, NaBH4+ Co2+ mixed powders in different ratios and different steel ball ratios were discussed as the hydrogen production rate and hydrogen production in relation to the hydrolytic hydrogen production reaction. The experimental results show that the hydrolytic hydrogen production reaction is good when 45 wt% Co2+/γ-Al2O3 catalyst is placed in the primary hydrogen production tank at a catalyst bed temperature of 55 °C. When the NaBH4+ Co2+ mixed powder in a ratio of 7:3 and steel balls in a ratio of 1:4 were placed in the secondary hydrogen production tank for 2 h of ball milling, the hydrogen production increased favorably. The hydrogen storage can be increased effectively without wasting the water vapor entrained in the hydrolytic hydrogen production reaction, and the water vapor effect on back-end storage can be reduced.

1. Introduction

The demand for energy has increased and the dependence on fossil energy is high, however, as fossil fuels decrease, green energy has gradually become the trend. Hydrogen is a potential clean energy that can replace fossil fuels [1,2]. As hydrogen-oxygen fuel cells have risen rapidly in recent years, many scholars have concentrated on hydrogen storage. There are six main classes of hydrogen storage techniques including compression hydrogen storage, liquefaction hydrogen storage, metal hydrogen storage, chemical hydrogen storage, recombination hydrogen storage, and carbon nanotubes [3]. In comparison to other hydrogen storage techniques, the chemical hydrogen storage technique is characterized by high volume energy density and high weight energy density. The hydrogen production rate can be adjusted using high conversion efficiency catalysts [4]. Sarkar et al. [5] found that the chemical hydrogen storage had better hydrogen production than liquefaction hydrogen storage and compression hydrogen storage. In chemical hydrogen storage, the NaBH4 is highly attractive because its hydrogen content is as high as 10.8 wt%, and is characterized by inflammability, stabilization in alkaline solution, controllable hydrolytic reaction, renewability, and environmental friendliness [6]. Table 1 shows the hydrogen mass and density in the catalyst hydrolytic hydrogen production reaction. It can be seen that the NaBH4 is less than LiBH4, but its byproduct is relatively simple [7]. With the appropriate catalyst, NaBH4 is converted into hydrogen and NaBO2. The equation is expressed as follows [8]:
NaBH 4 + 2 H 2 O catalyst 4 H 2 + NaBO 2 + 217   kJ / mol
The hydrolytic hydrogen production reaction is divided into aqueous solution hydrolysis and vapor hydrolysis. Figure 1 [9] shows the proportional relationship between the operating temperature range and aqueous solution hydrolysis and vapor hydrolysis byproduct when NaBH4 is in the hydrolytic hydrogen production reaction.
The NaBH4 hydrolytic hydrogen production reaction rate is correlated with the prepared aqueous NaBH4 solution and various metal catalysts used. Balba et al. [10] found that the NaBH4 concentration and temperature, hydrochloric acid, and acetic acid would change the hydrolytic hydrogen production reaction rate, where the hydrogen production rate increased with the acid concentration. Saka et al. [11] found that the phosphoric acid and KBH4 concentration and temperature influenced the hydrolytic hydrogen production reaction. The addition of 0.25 M or 1 M phosphoric acid could increase the hydrolytic hydrogen production reaction rate, with the total conversion 100% if the volume ratio to KBH4 was 1:1. Wang et al. [12] found that when the NaOH concentration in the blended NaBH4 and NaOH solution was changed, the hydrogen production rate was influenced, with 0.25 M NaOH having the best hydrogen production rate.
Metal chlorides such as Fe, Co, Ni, Ru, Rh, and Pd are usually used in metal catalysts. The aqueous solution of some metal chlorides reduces the hydrolytic hydrogen production reaction rate [13]. Ke et al. [14] found that when the CoeB catalyst was modified by Mo, the hydrolytic hydrogen production reaction rate was 4200 mL/min, and indicated that the NaBH4 content adsorbed on the catalyst surface influenced the hydrolytic hydrogen production reaction rate. Vinokuov et al. [15] used hallo site nanotubes as the carrier, carrying metal catalyst Co2+ as the catalyst for hydrolytic hydrogen production reaction, where the best Co2+ concentration was 16 wt%, and the maximum hydrogen production rate was 3 L/min g cat. Ye et al. [16] found that the Co2+ catalyst was carried by α-Al2O3, due to the special structure, and the Co/β-α-Al2O3 containing 9% catalyst by weight at ambient temperature of 303 K could obtain the HG rate of 220 mL/min-1 g-1 catalyst and about 100% hydrogen production rate.
Furthermore, the aforesaid aqueous solution hydrolysis for NaBH4 hydrolytic hydrogen production reaction, using water vapor and NaBH4 for hydrogen production reaction is another method. Kong et al. [17] found that using liquid water for hydrogen production could obtain quantitative hydrogen production, but the hydrogen production rate was beyond their control. They used water vapor and limited the air input to react with hydride to control the hydrogen production rate. Marrero-Alfonso et al. [18] used vapor for the hydrolytic reaction, where the hydrogen production rate could reach 80% of the theoretical value without a catalyst. If acetic acid was applied, the time could be shortened, and the hydrogen production rate was 95%. R Aiello et al. [19] found that in the vapor hydrolysis hydrogen production process, the temperature and flow velocity could influence the reaction process, but the main influencing factor was the vapor temperature.
In terms of observations on byproducts, Beaird et al. [20] found that Equation (2) was formed through gradual dehydration; if the temperature rose from 249 °C to 280 °C, solidification formed, expressed as Equation (3).
3 NaB OH 4 83   ° C   to   155   ° C Na 3 B 3 O 5 OH 2 + 5 H 2 O
Na 3 B 3 O 5 OH 2 249   ° C   to   280   ° C Na 3 B 3 O 6 + H 2 O  
Marrero-Alfonso et al. [21] found when the primary product NaBO2 of vapor hydrolysis was dried at 350 °C, anhydrous metaborate of NaBO2·2H2O was formed, and the anhydrous metaborate of NaBO2·4H2O was formed at 400 °C.
To increase the hydrogen production in systems, this paper refers to the process designs and production methods proposed in previous studies. The two hydrogen production tanks in this paper will carry different catalysts. Baytar et al. [22] used the Co–Cu–B/Al2O3 synthesized by Co–Cu–B and chemical impregnation as the catalyst for NaBH4 hydrolytic hydrogen production. The experimental results showed that the hydrogen production rate was 2519 mL/min g when Co–Cu–B was used as the catalyst while the hydrogen production rate of Co–Cu–B/Al2O3 as the catalyst was 8962 mL/min g, therefore, Co–Cu–B/Al2O3 as the catalyst had better efficiency. Kyunghwan et al. [23] used γ-Al2O3 as the carrier, immersed in CoCl2 solution carrying the Co catalyst, and baked at 350 °C for 3 h and reduced to make the catalyst Co/Al2O3, which reacted with the NaBH4 solution fed in at 3 mL/min, and the hydrogen production efficiency was about 1071 mL/min. Kao et al. [24] used mechanical lapping equipment to grind NaBH4 powder and the Co catalyst for 30 min, the powder particles were 5 μm, and dispersed uniformly. They indicated that the mixed powder was filled into the catalyst bed, and when the catalyst bed temperature increased, the hydrogen production rate was better. Wang et al. [25] mixed Co–B alloy and NaBH4 powder using mechanical lapping to enlarge the contact surface area in the hydrolytic hydrogen production reaction. The surface area was 202.4 m 2/g, and the HGR for hydrolysis was 8.26 L/min g. Wang et al. [26] performed ball milling of NaBH4 and ZnCl2 at 250 rpm in a ball/powder ratio of 20:1 for 0.5~10 h, and performed hydrolytic hydrogen production, where the best hydrogen production was 1933 mL/g when the ball milling time was 2 h. According to the references, the Co2+/Al2O3 catalyst is used in the primary hydrogen production tank, and the NaBH4 + Co catalyst is used in the secondary hydrogen production tank.

2. Results

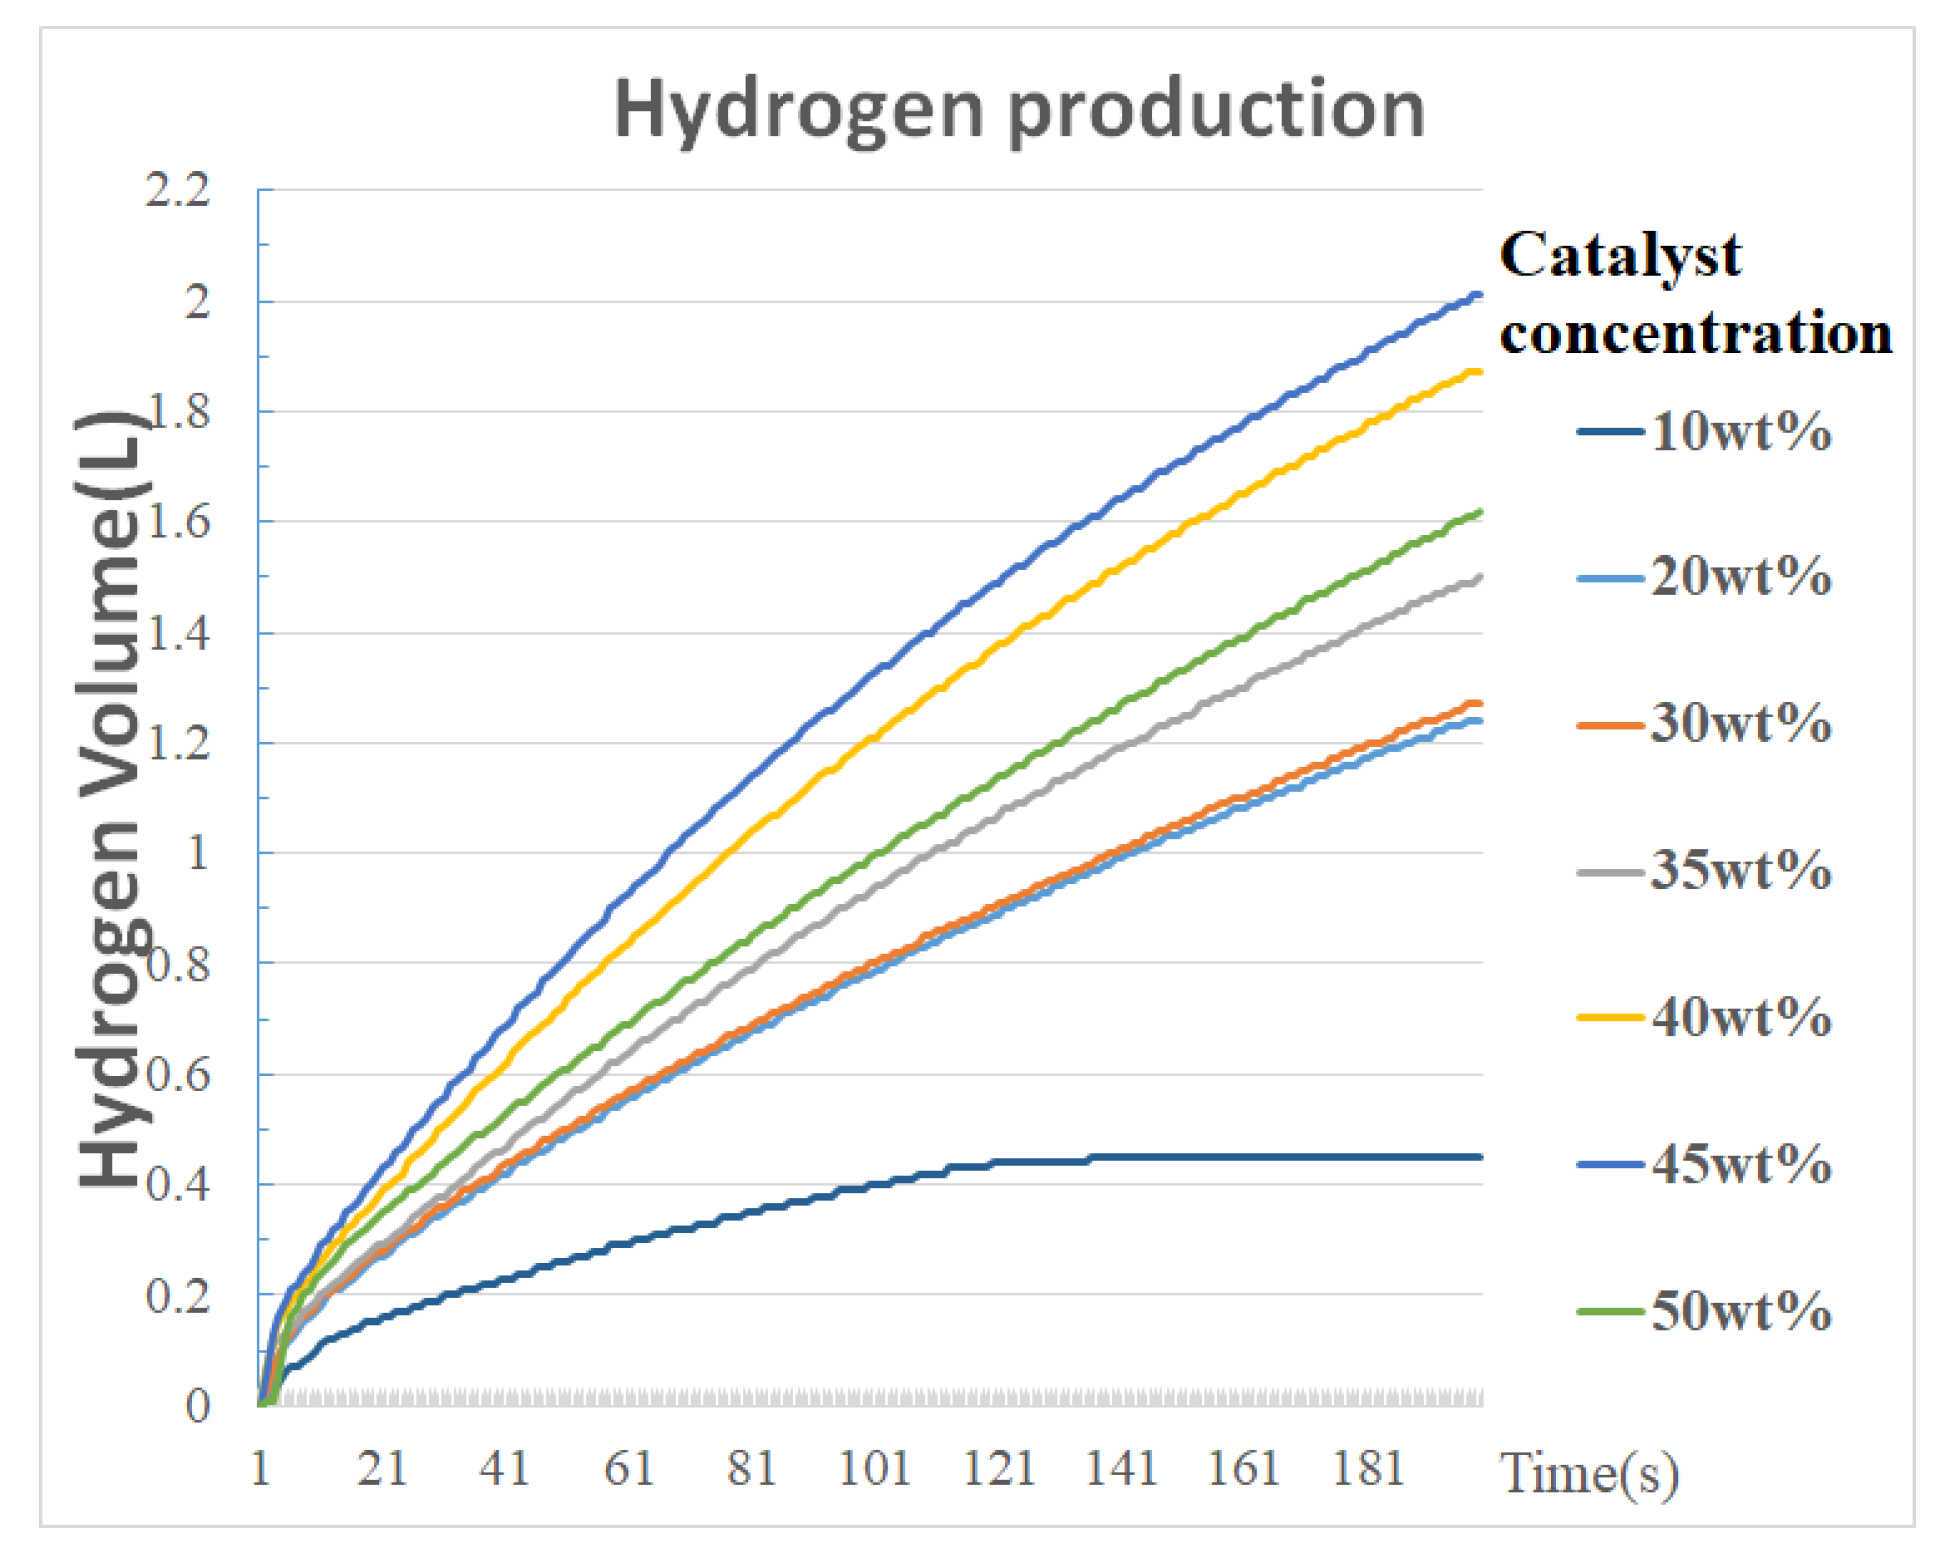
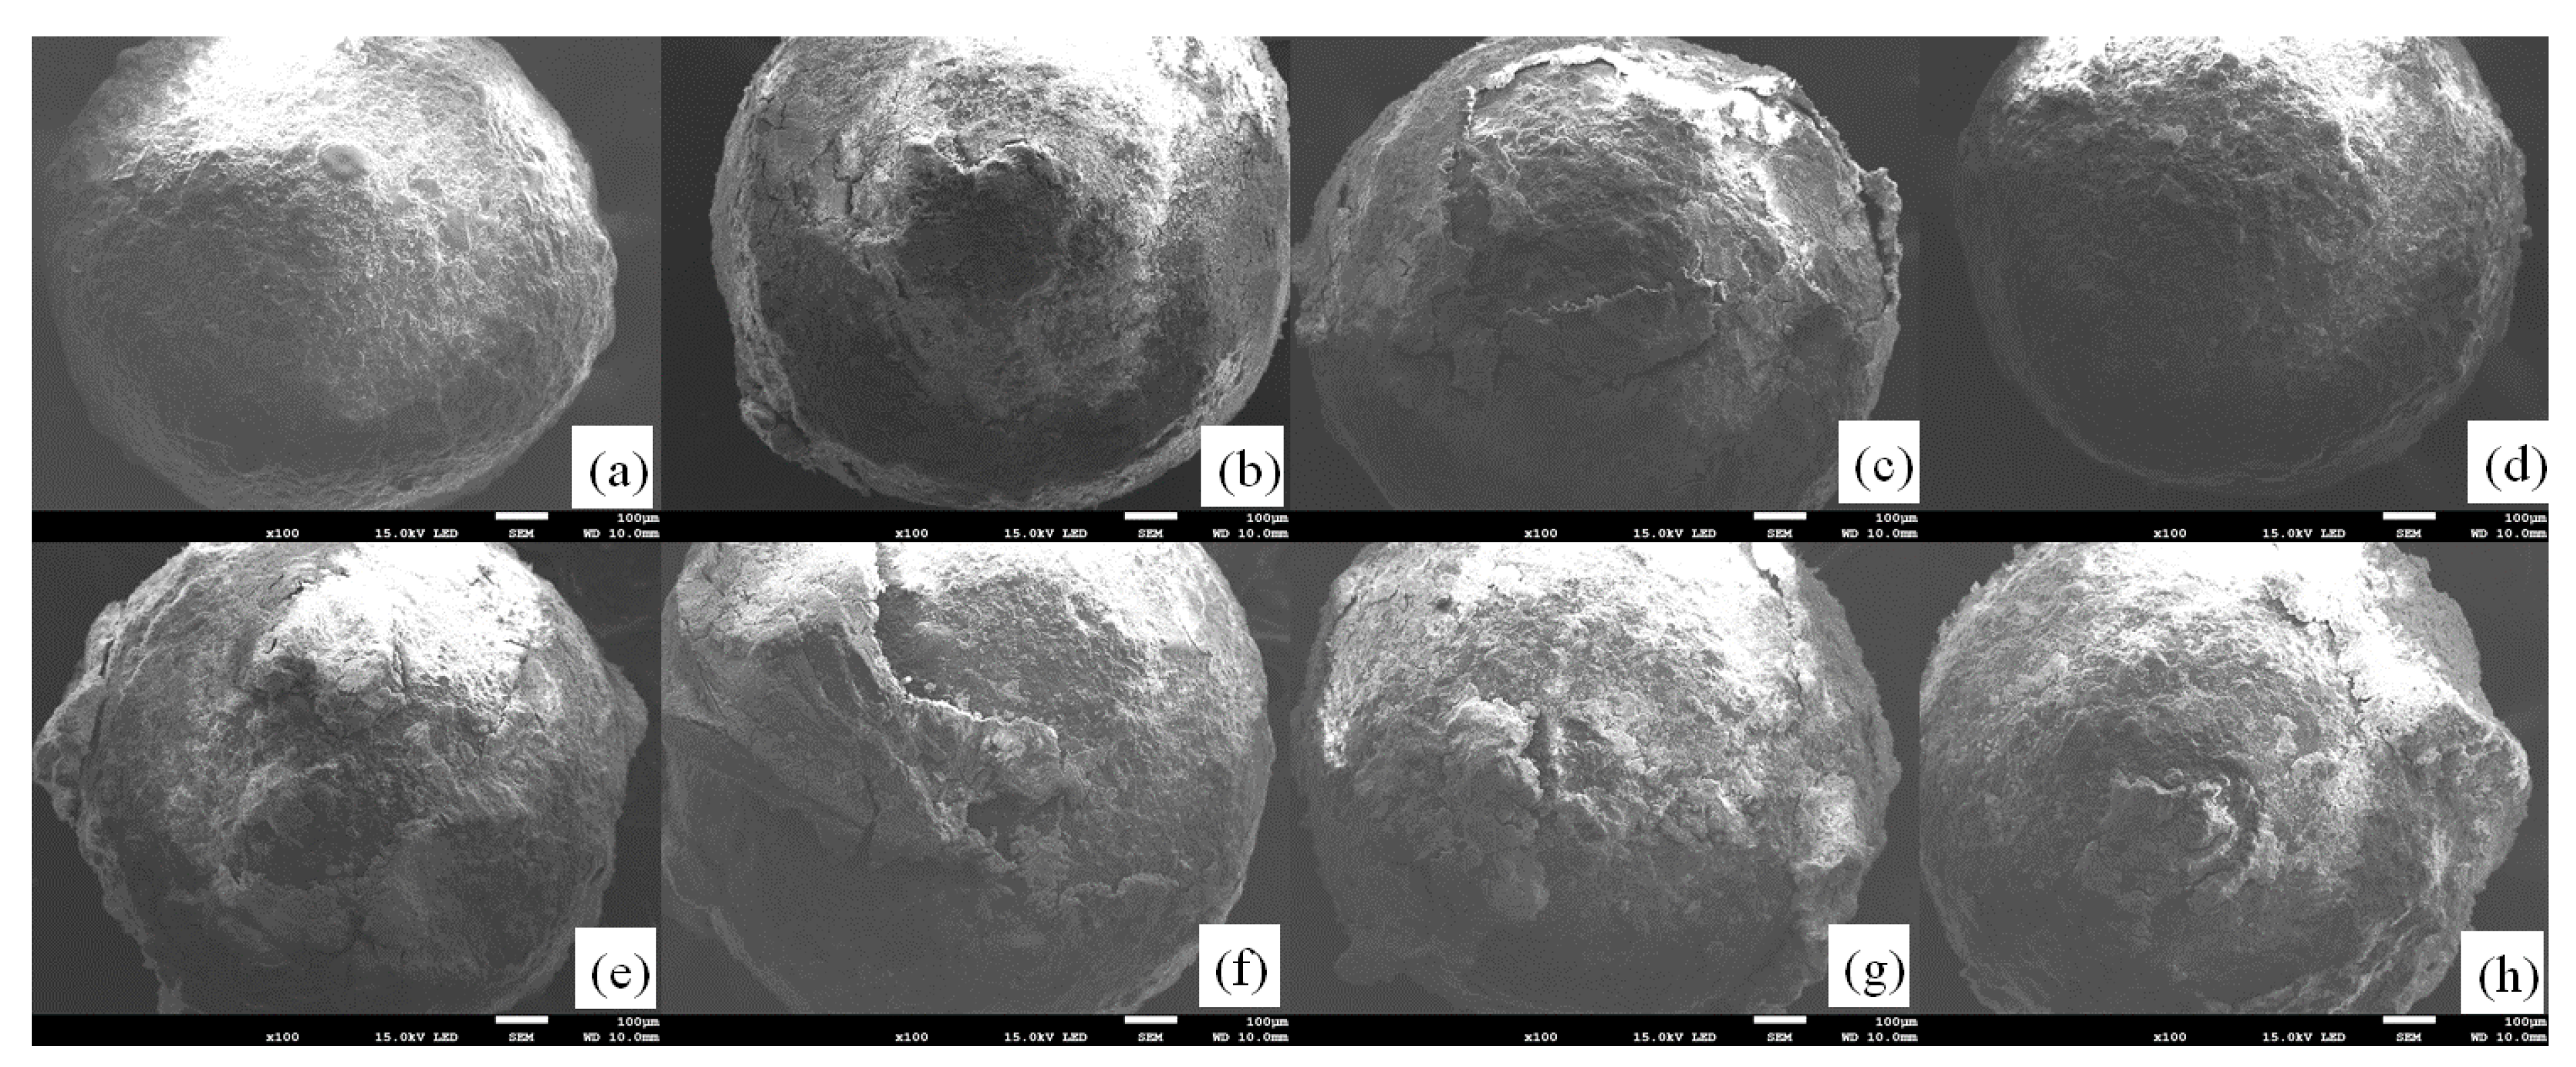
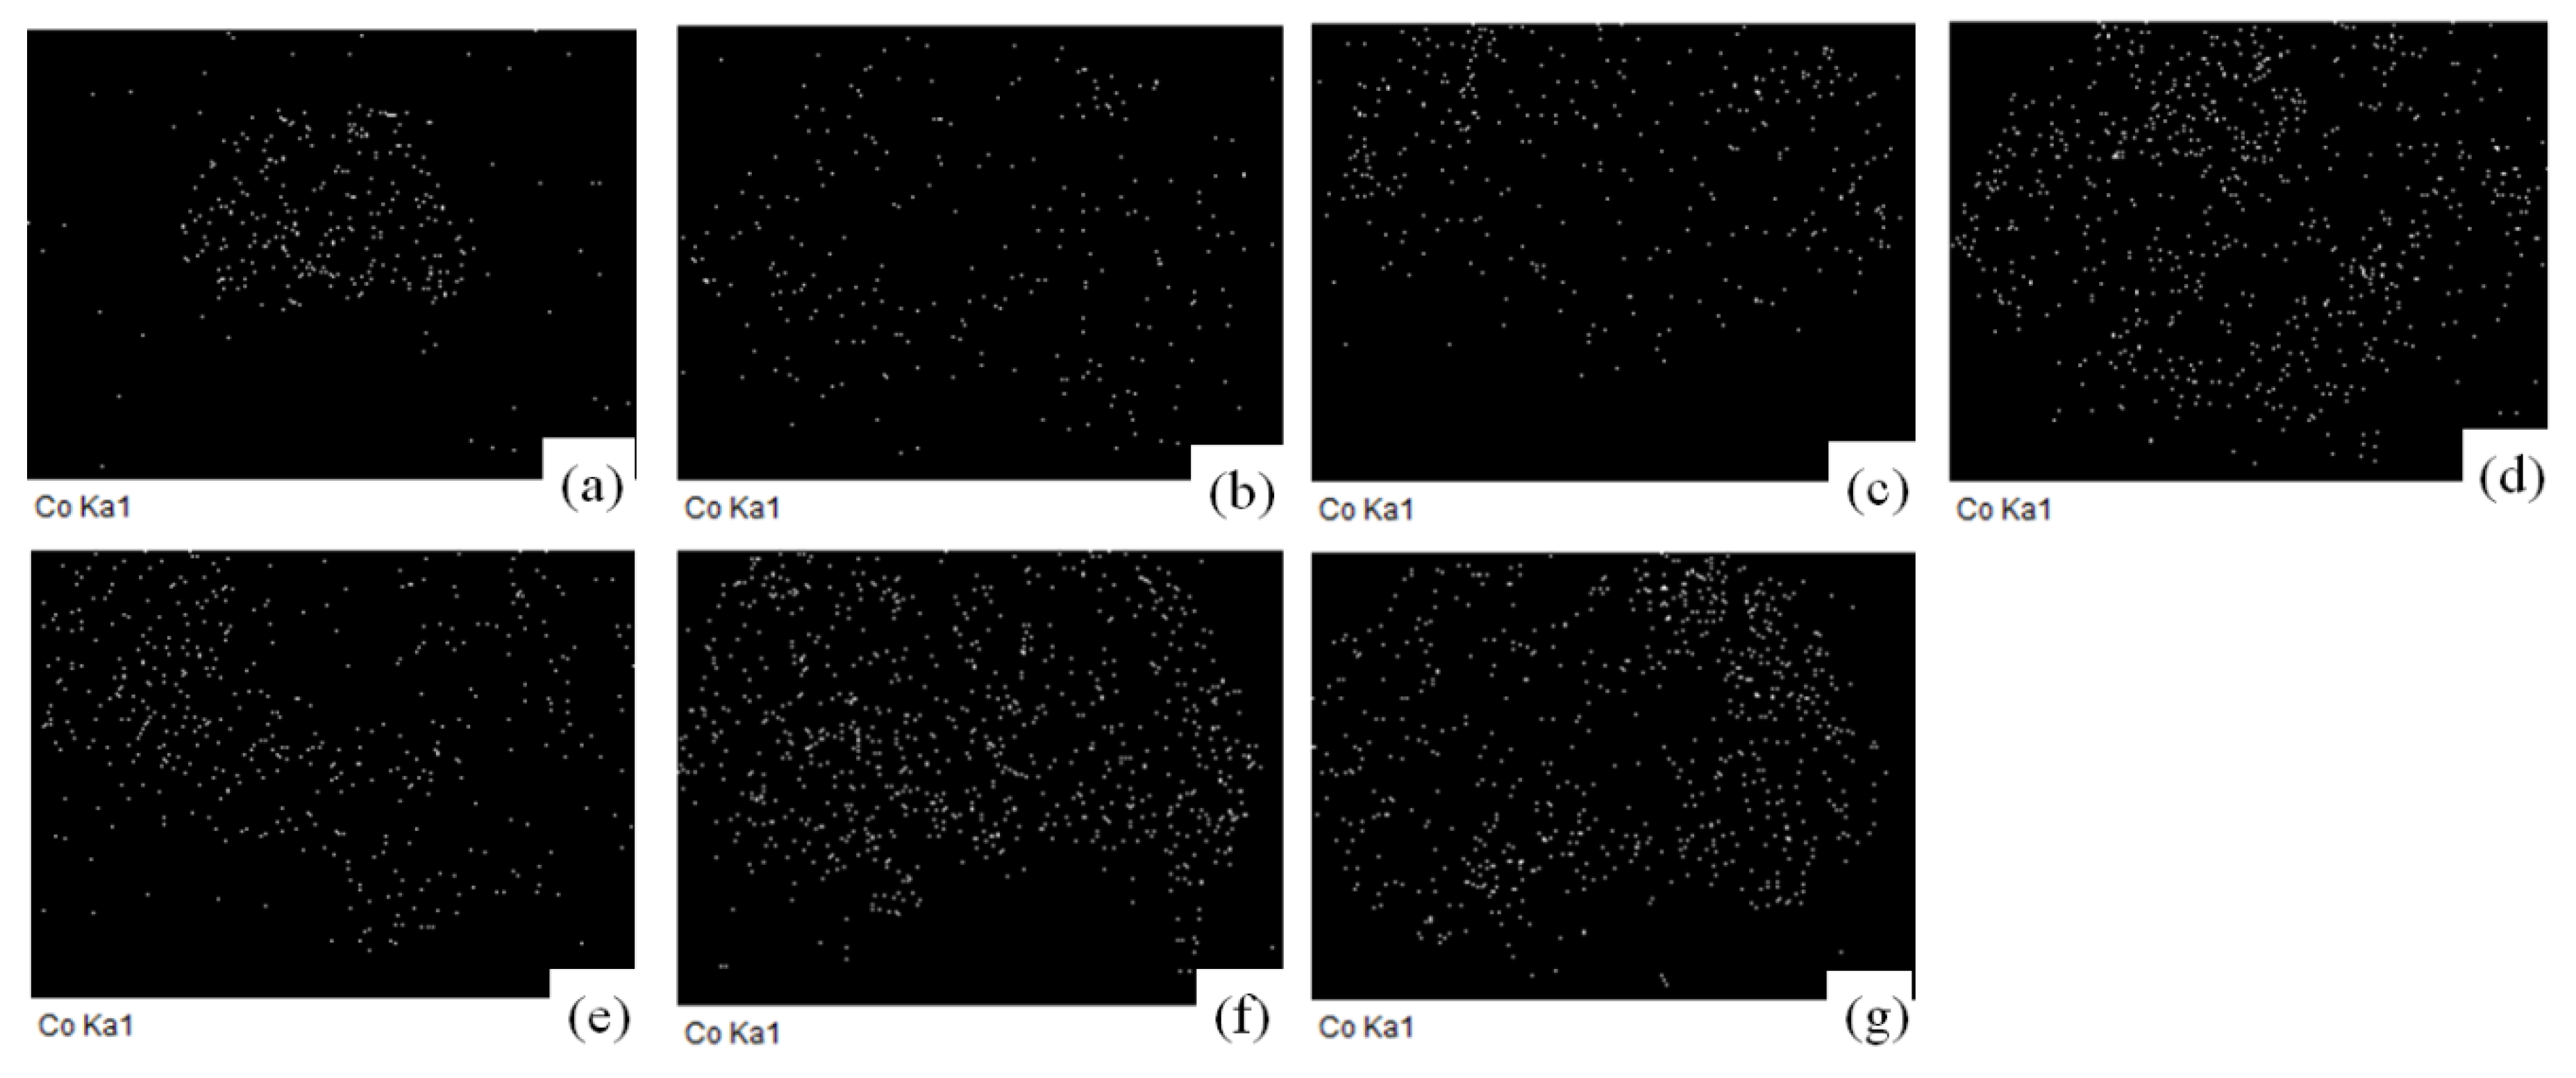
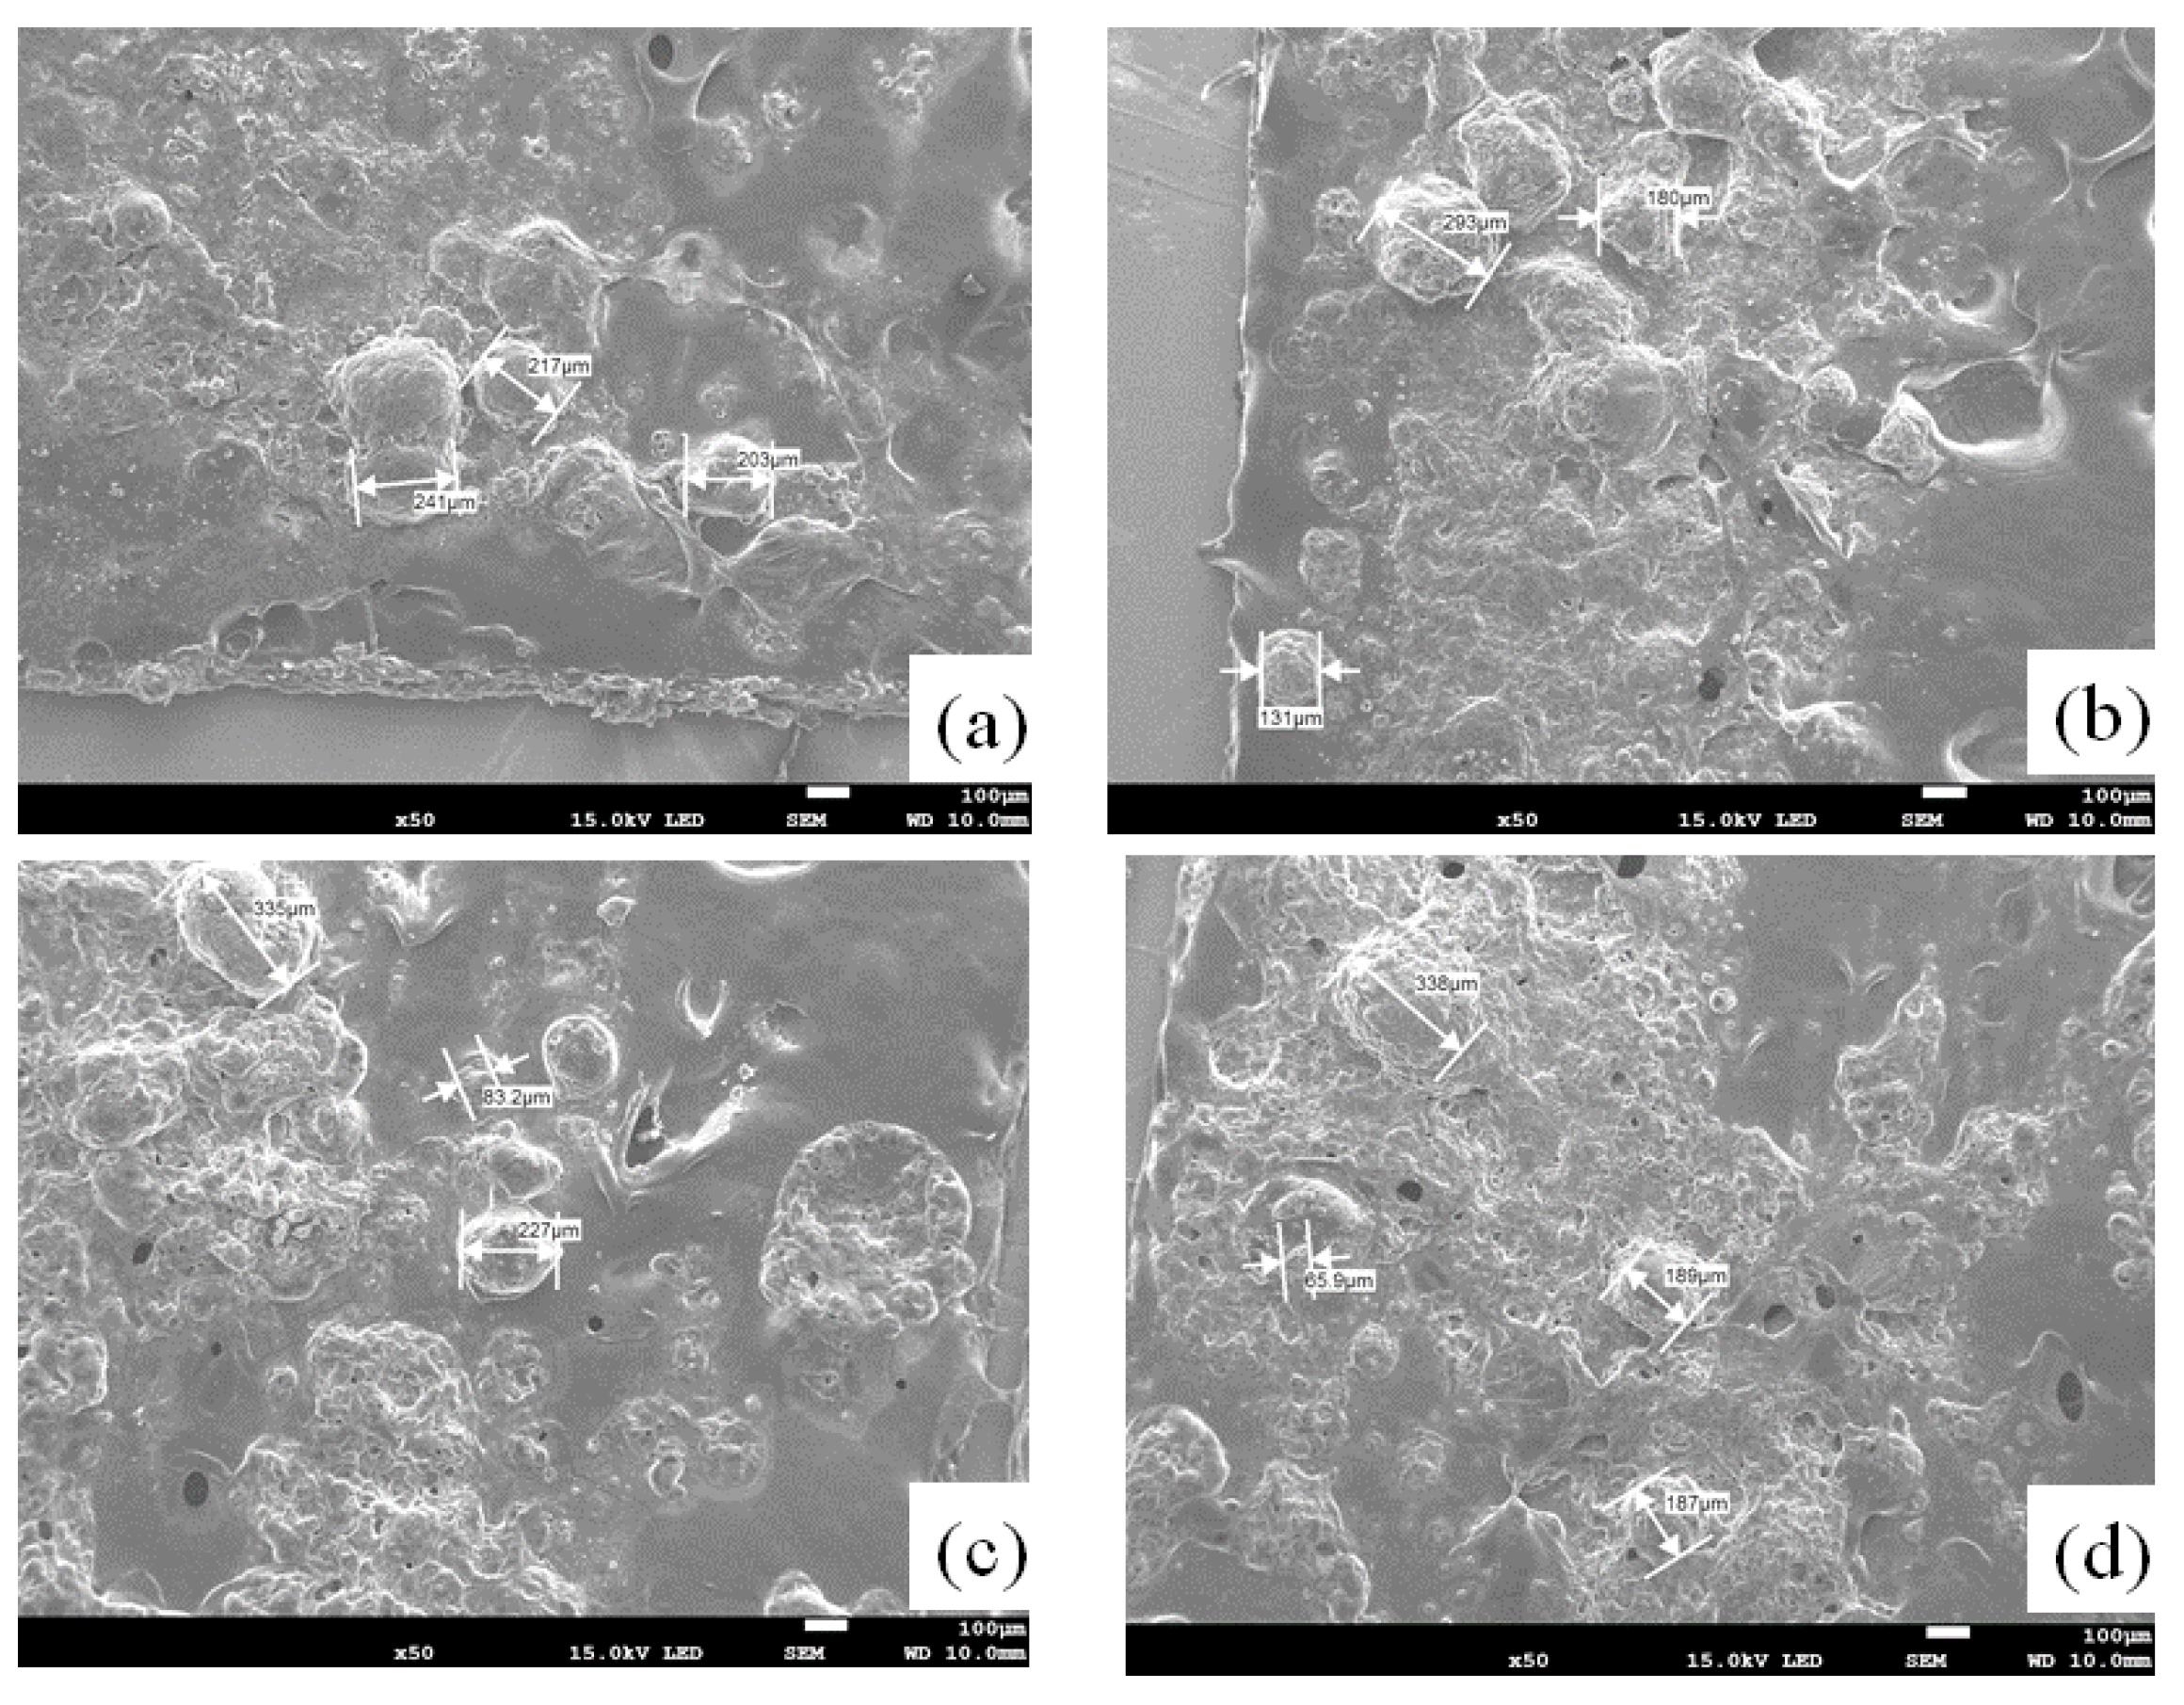
2.1. Comparison of Co2+/Al2O3 Catalyst Chelate Concentrations at Normal Temperature of 25 °C

The hydrogen productions of 10 wt% to 50 wt% catalysts were compared. The catalyst was placed in the primary hydrogen production tank, and 1.5 g 10 wt% NaBH4 + 1 wt% NaOH aqueous solution was injected into the primary hydrogen production tank. The hydrogen production rates from the catalyst bed at a normal temperature of 25 °C were compared. According to the experiment, the 45 wt% catalyst had the best hydrogen production rate, as shown in Figure 2. The hydrogen production of the 45 wt% catalyst was 2.01 L (Liter), and Figure 2 shows that the 45 wt% catalyst had a better chelation degree.

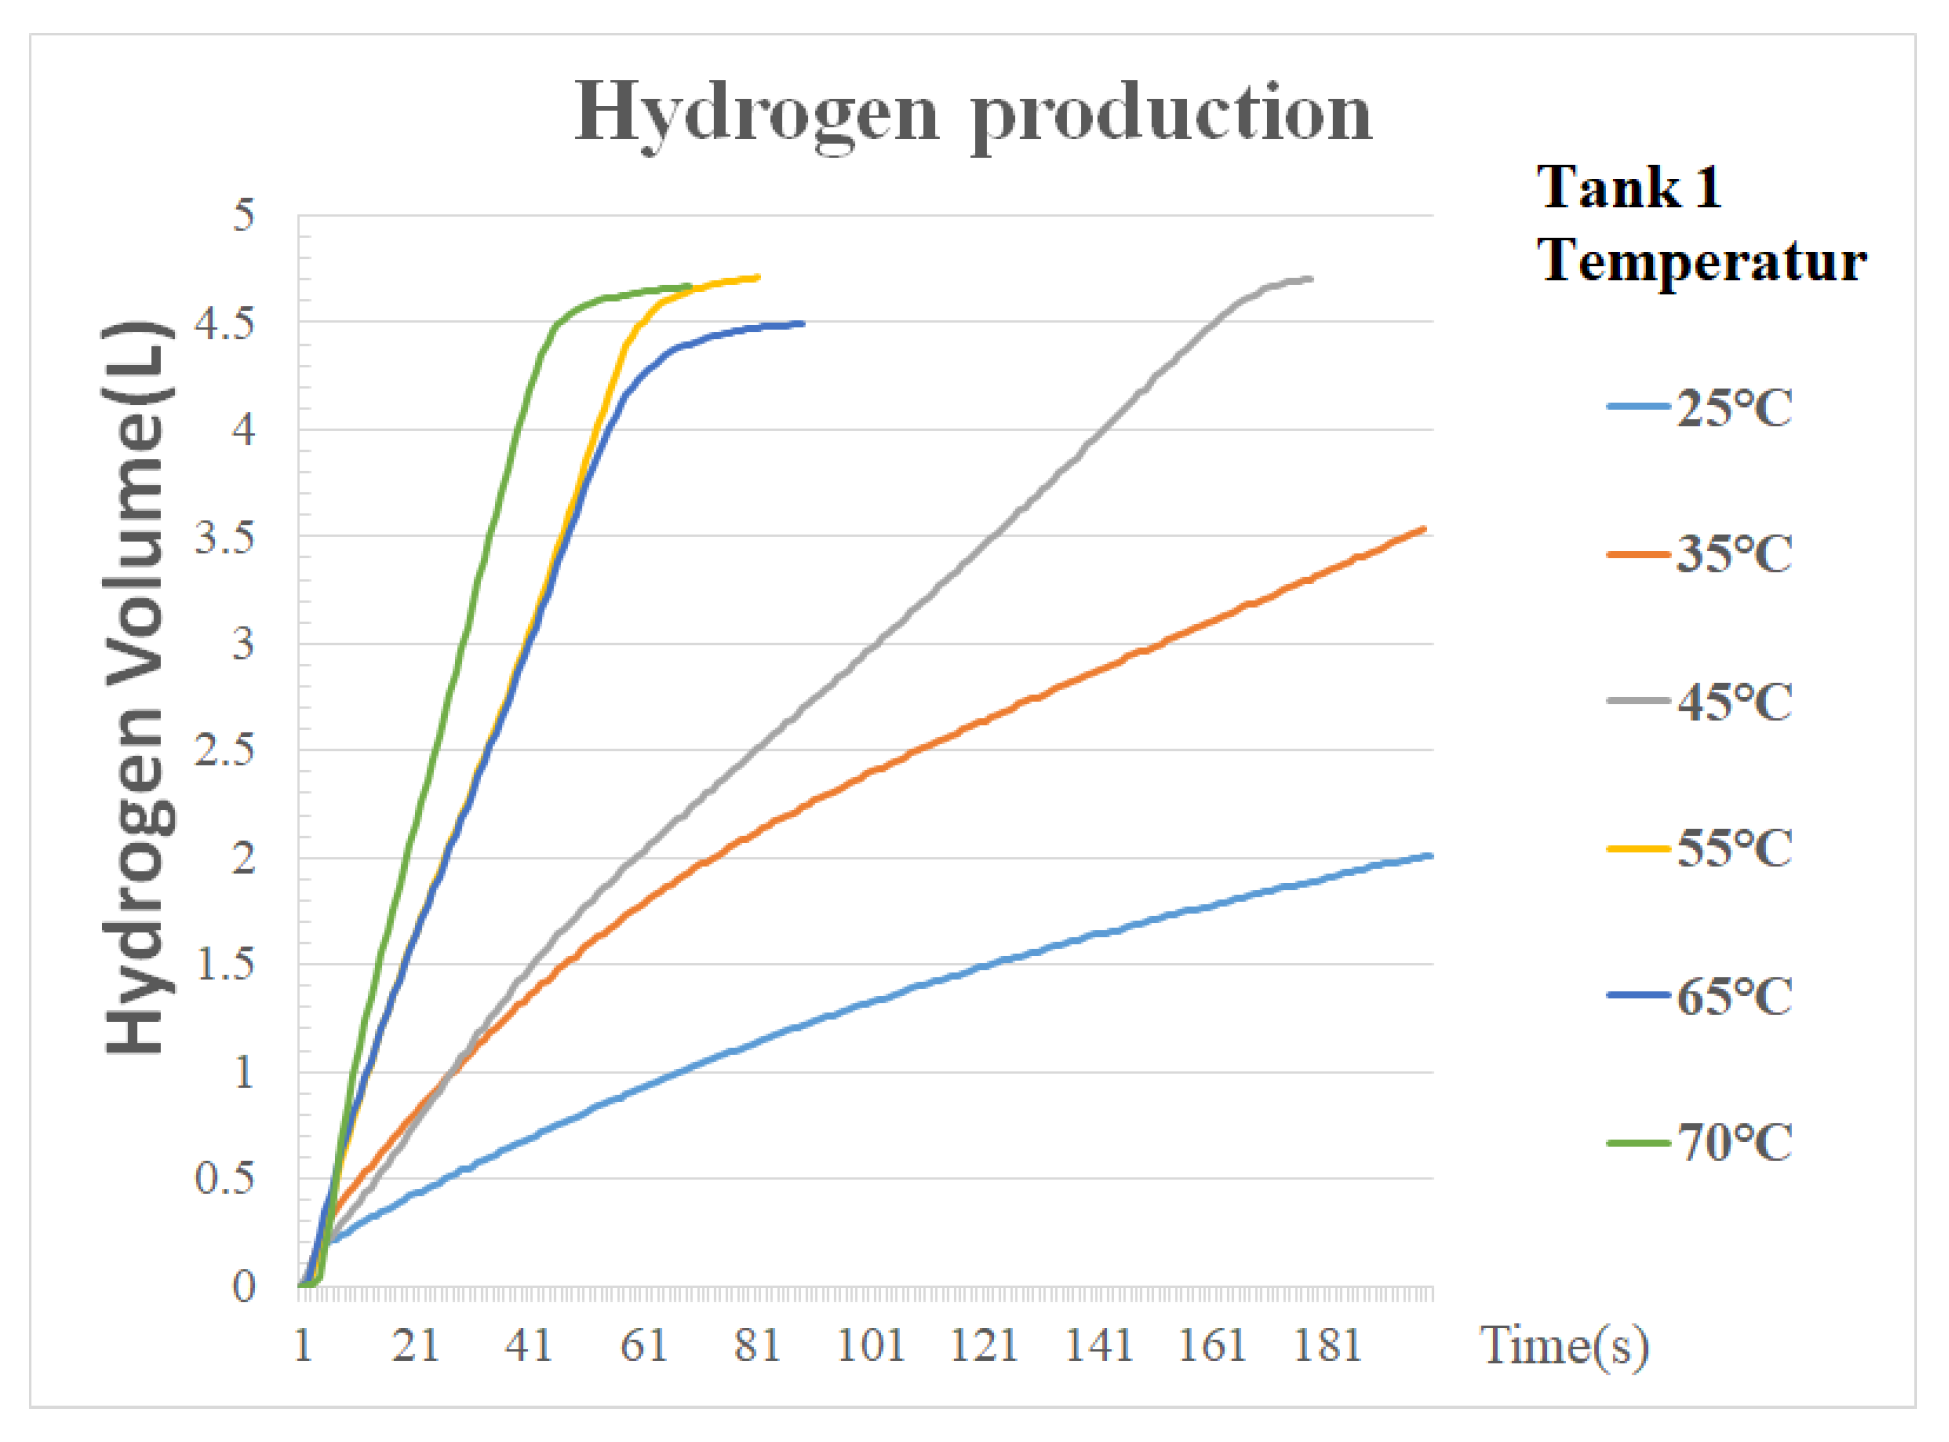
2.2. Comparison of Hydrogen Production Rates of 45 wt% Co2+/Al2O3 Catalyst at Different Temperatures

The 45 wt% Co2+/Al2O3 catalyst was selected for the catalyst bed temperature of the primary hydrogen production tank for testing. The temperature range was 25 °C to 70 °C for the hydrolytic hydrogen production test, and 1.5 g 10 wt%. NaBH4 + 1 wt% NaOH aqueous solution was injected into the primary hydrogen production tank. The experimental results showed that the optimum hydrogen production was 4.71 L when the catalyst bed temperature of primary hydrogen production tank was 55 °C, as shown in Figure 3.

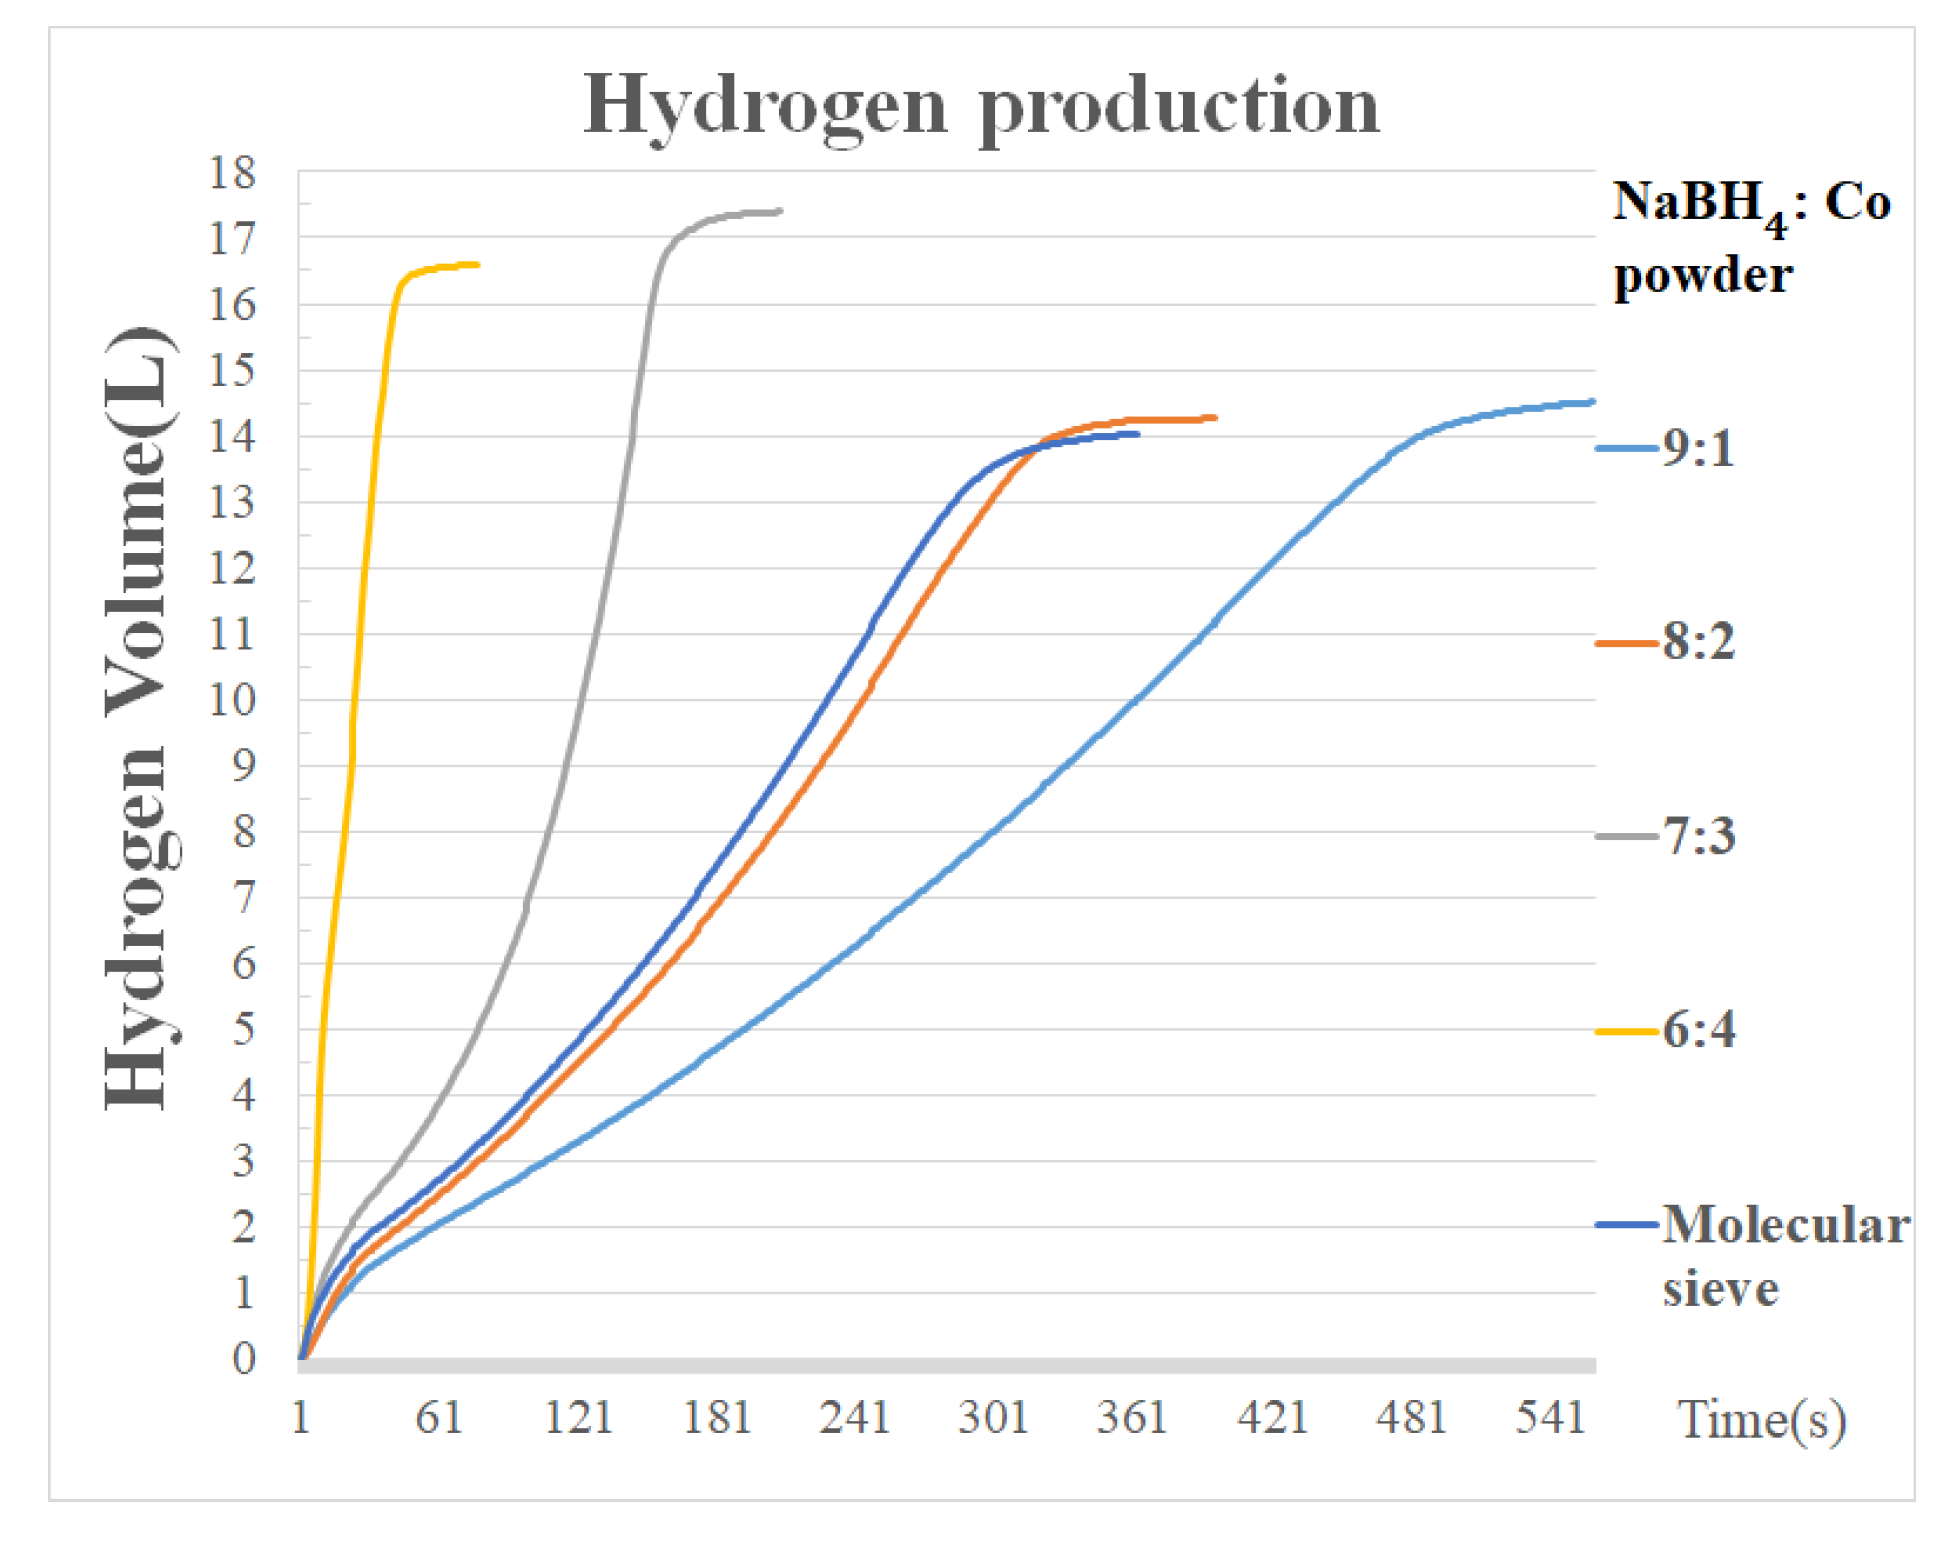
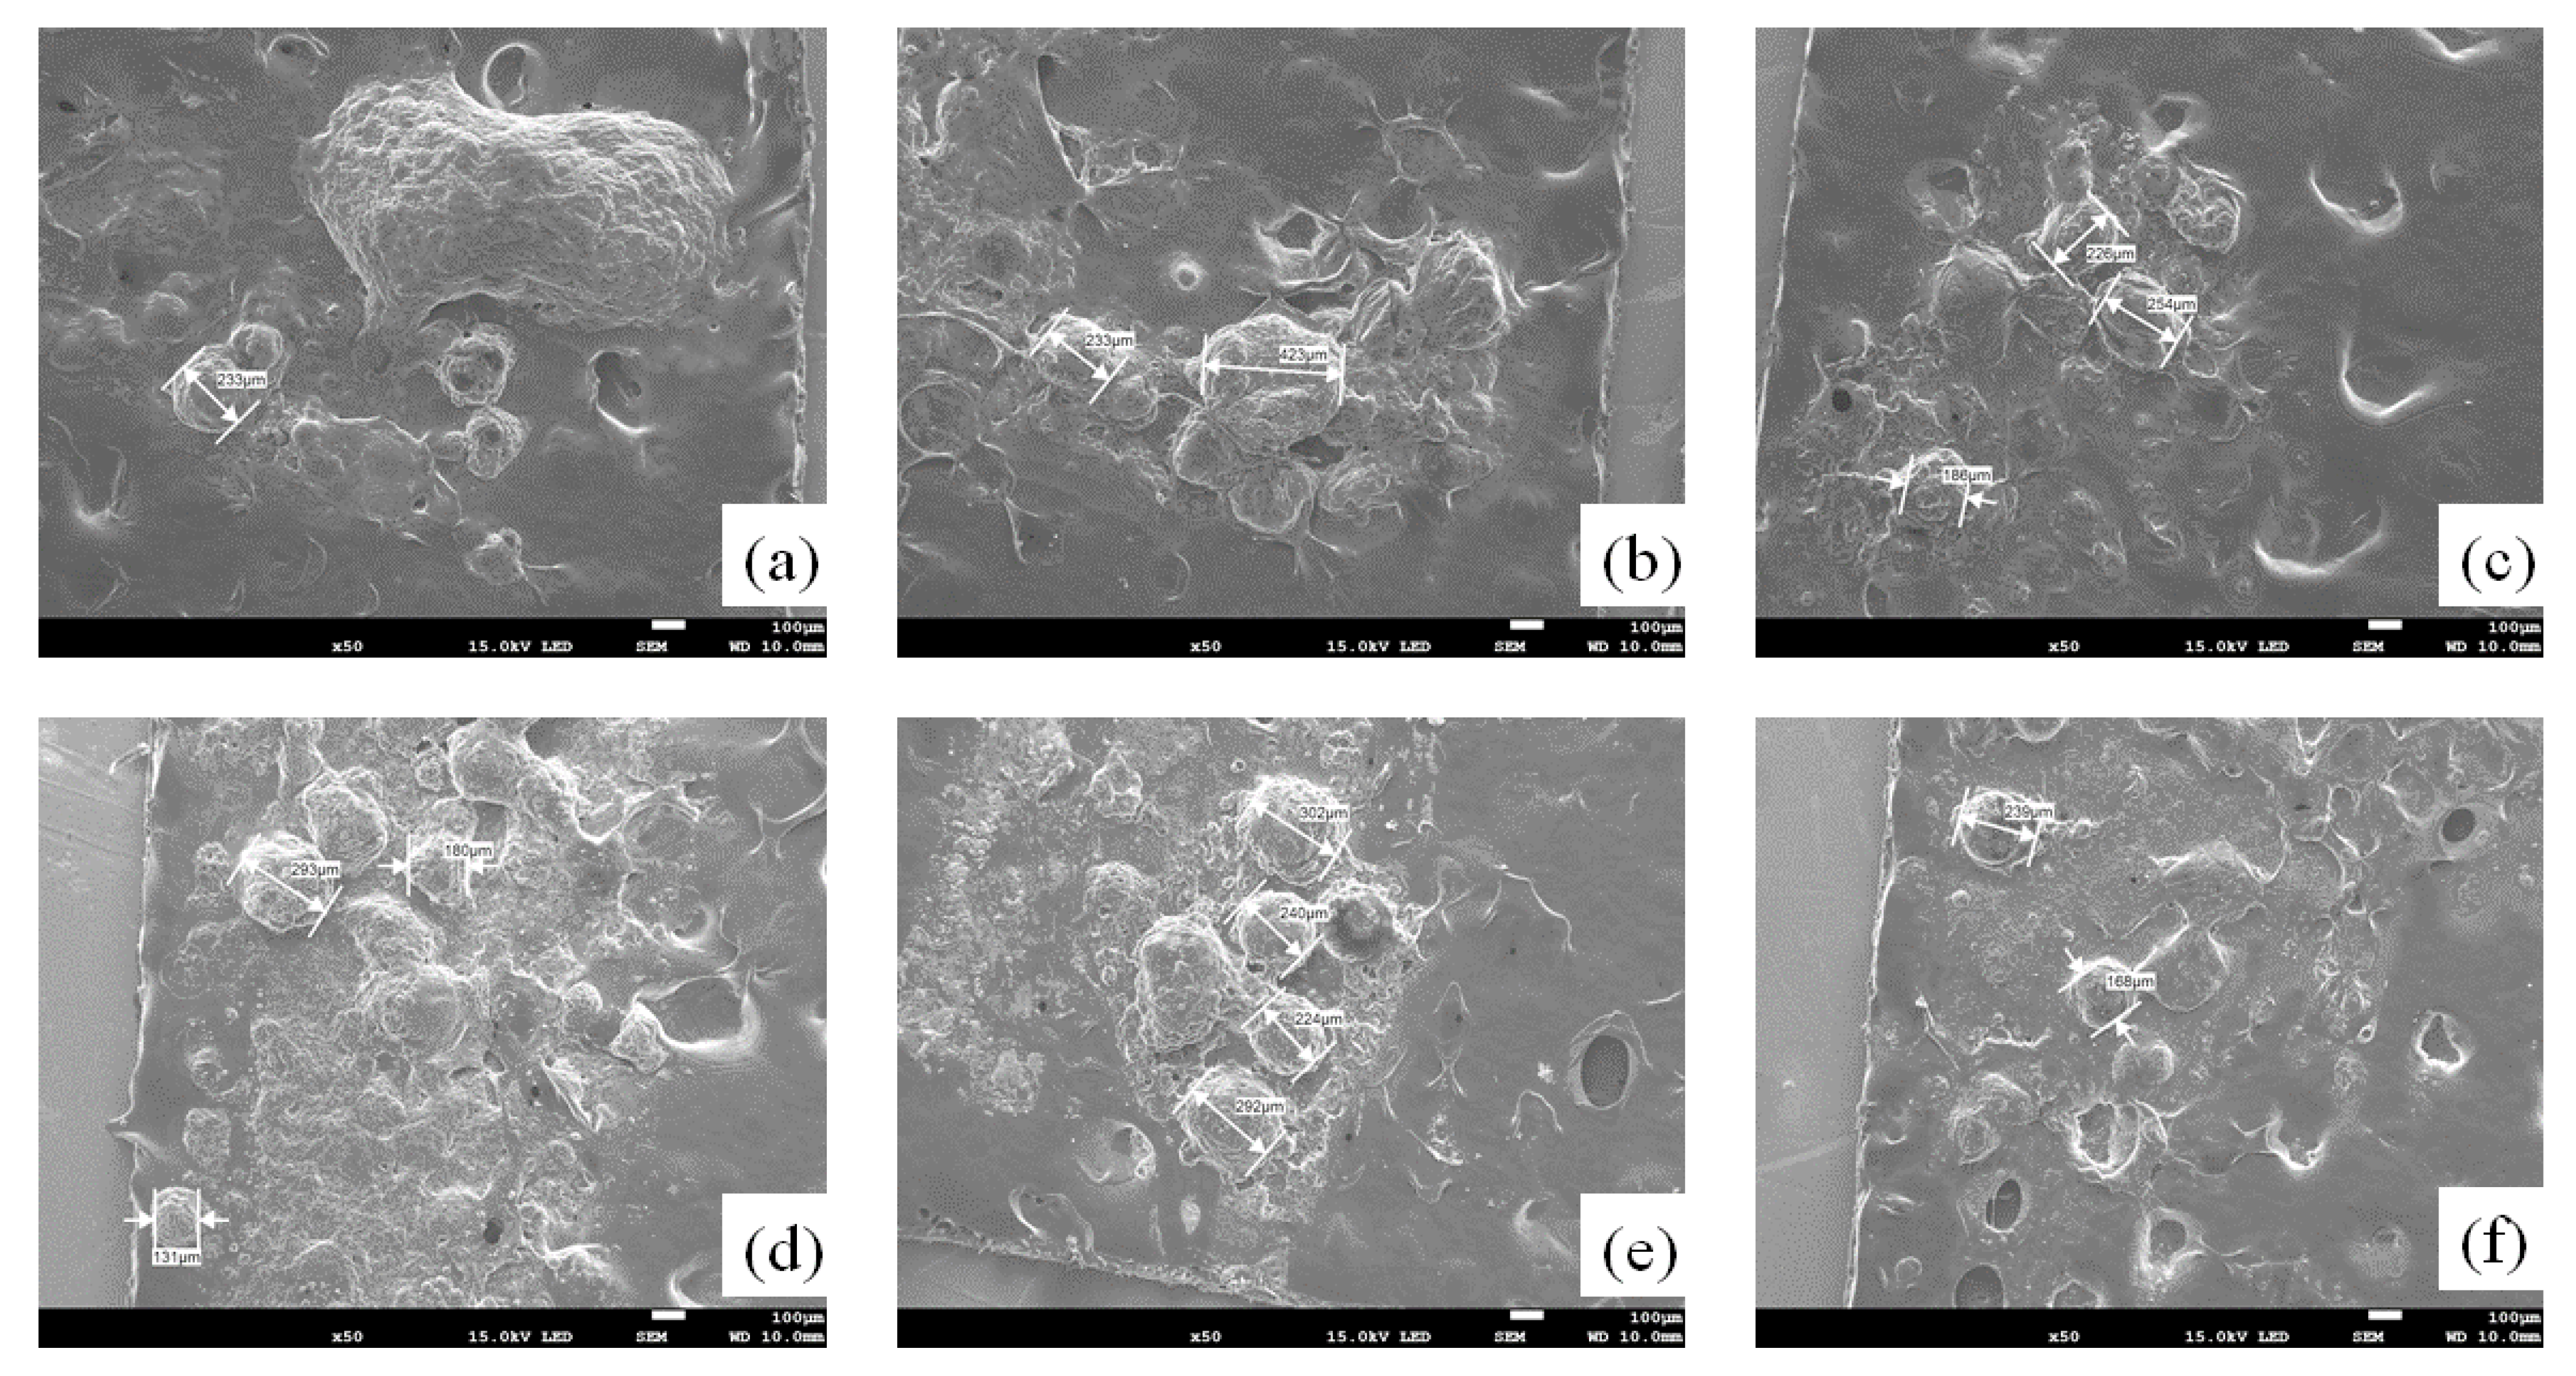
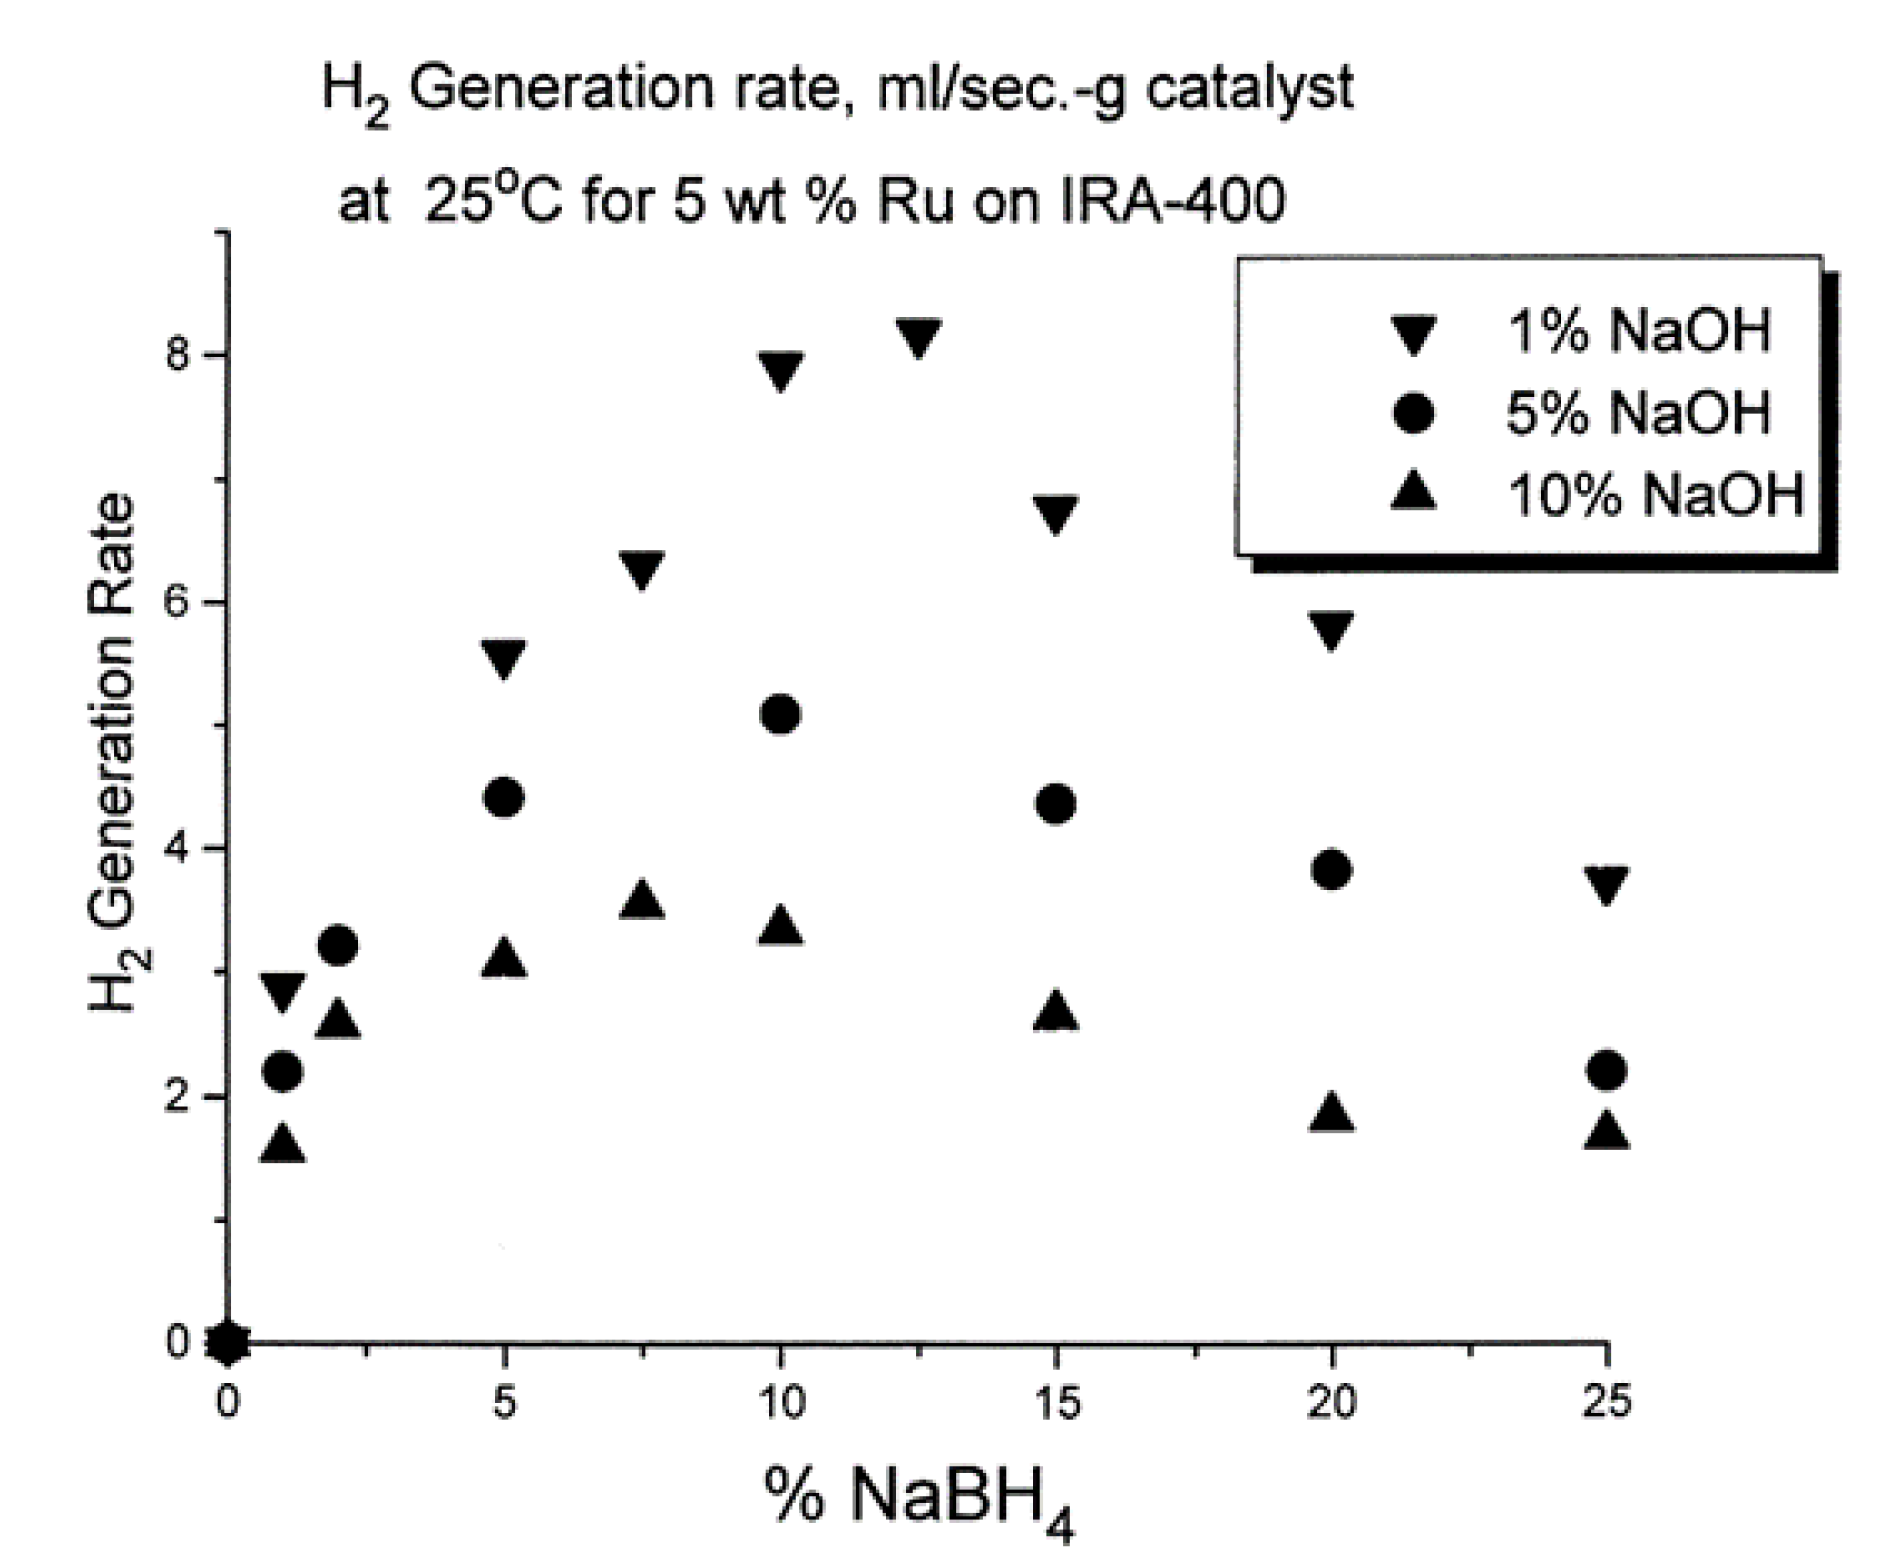
2.3. Comparison of Ball Milling Hydrogen Production Rates of NaBH4+Co in Different Ratios

The secondary hydrogen production tank carries the NaBH4+ Co2+ catalyst. Ball milling was performed with steel ball size ratio of 1:4 and catalyst ratio of 9:1 to 6:4 for 2 h. The 45 wt% catalyst was placed in the primary hydrogen production tank. The primary catalyst bed temperature was 55 °C, and the secondary catalyst bed temperature was 80 °C, and 5.56 g 10 wt% NaBH4 + 1 wt% NaOH aqueous solution was injected into the primary hydrogen production tank for the hydrogen production test. According to the experimental results, the hydrogen production of the NaBH4 + Co2+ catalyst in the ratio of 7:3 was 17.4 L, better than the NaBH4 + Co2+ catalyst in the other ratios, as shown in Figure 4. The hydrogen production of the secondary hydrogen production tank with the molecular sieve was 14.03 L.

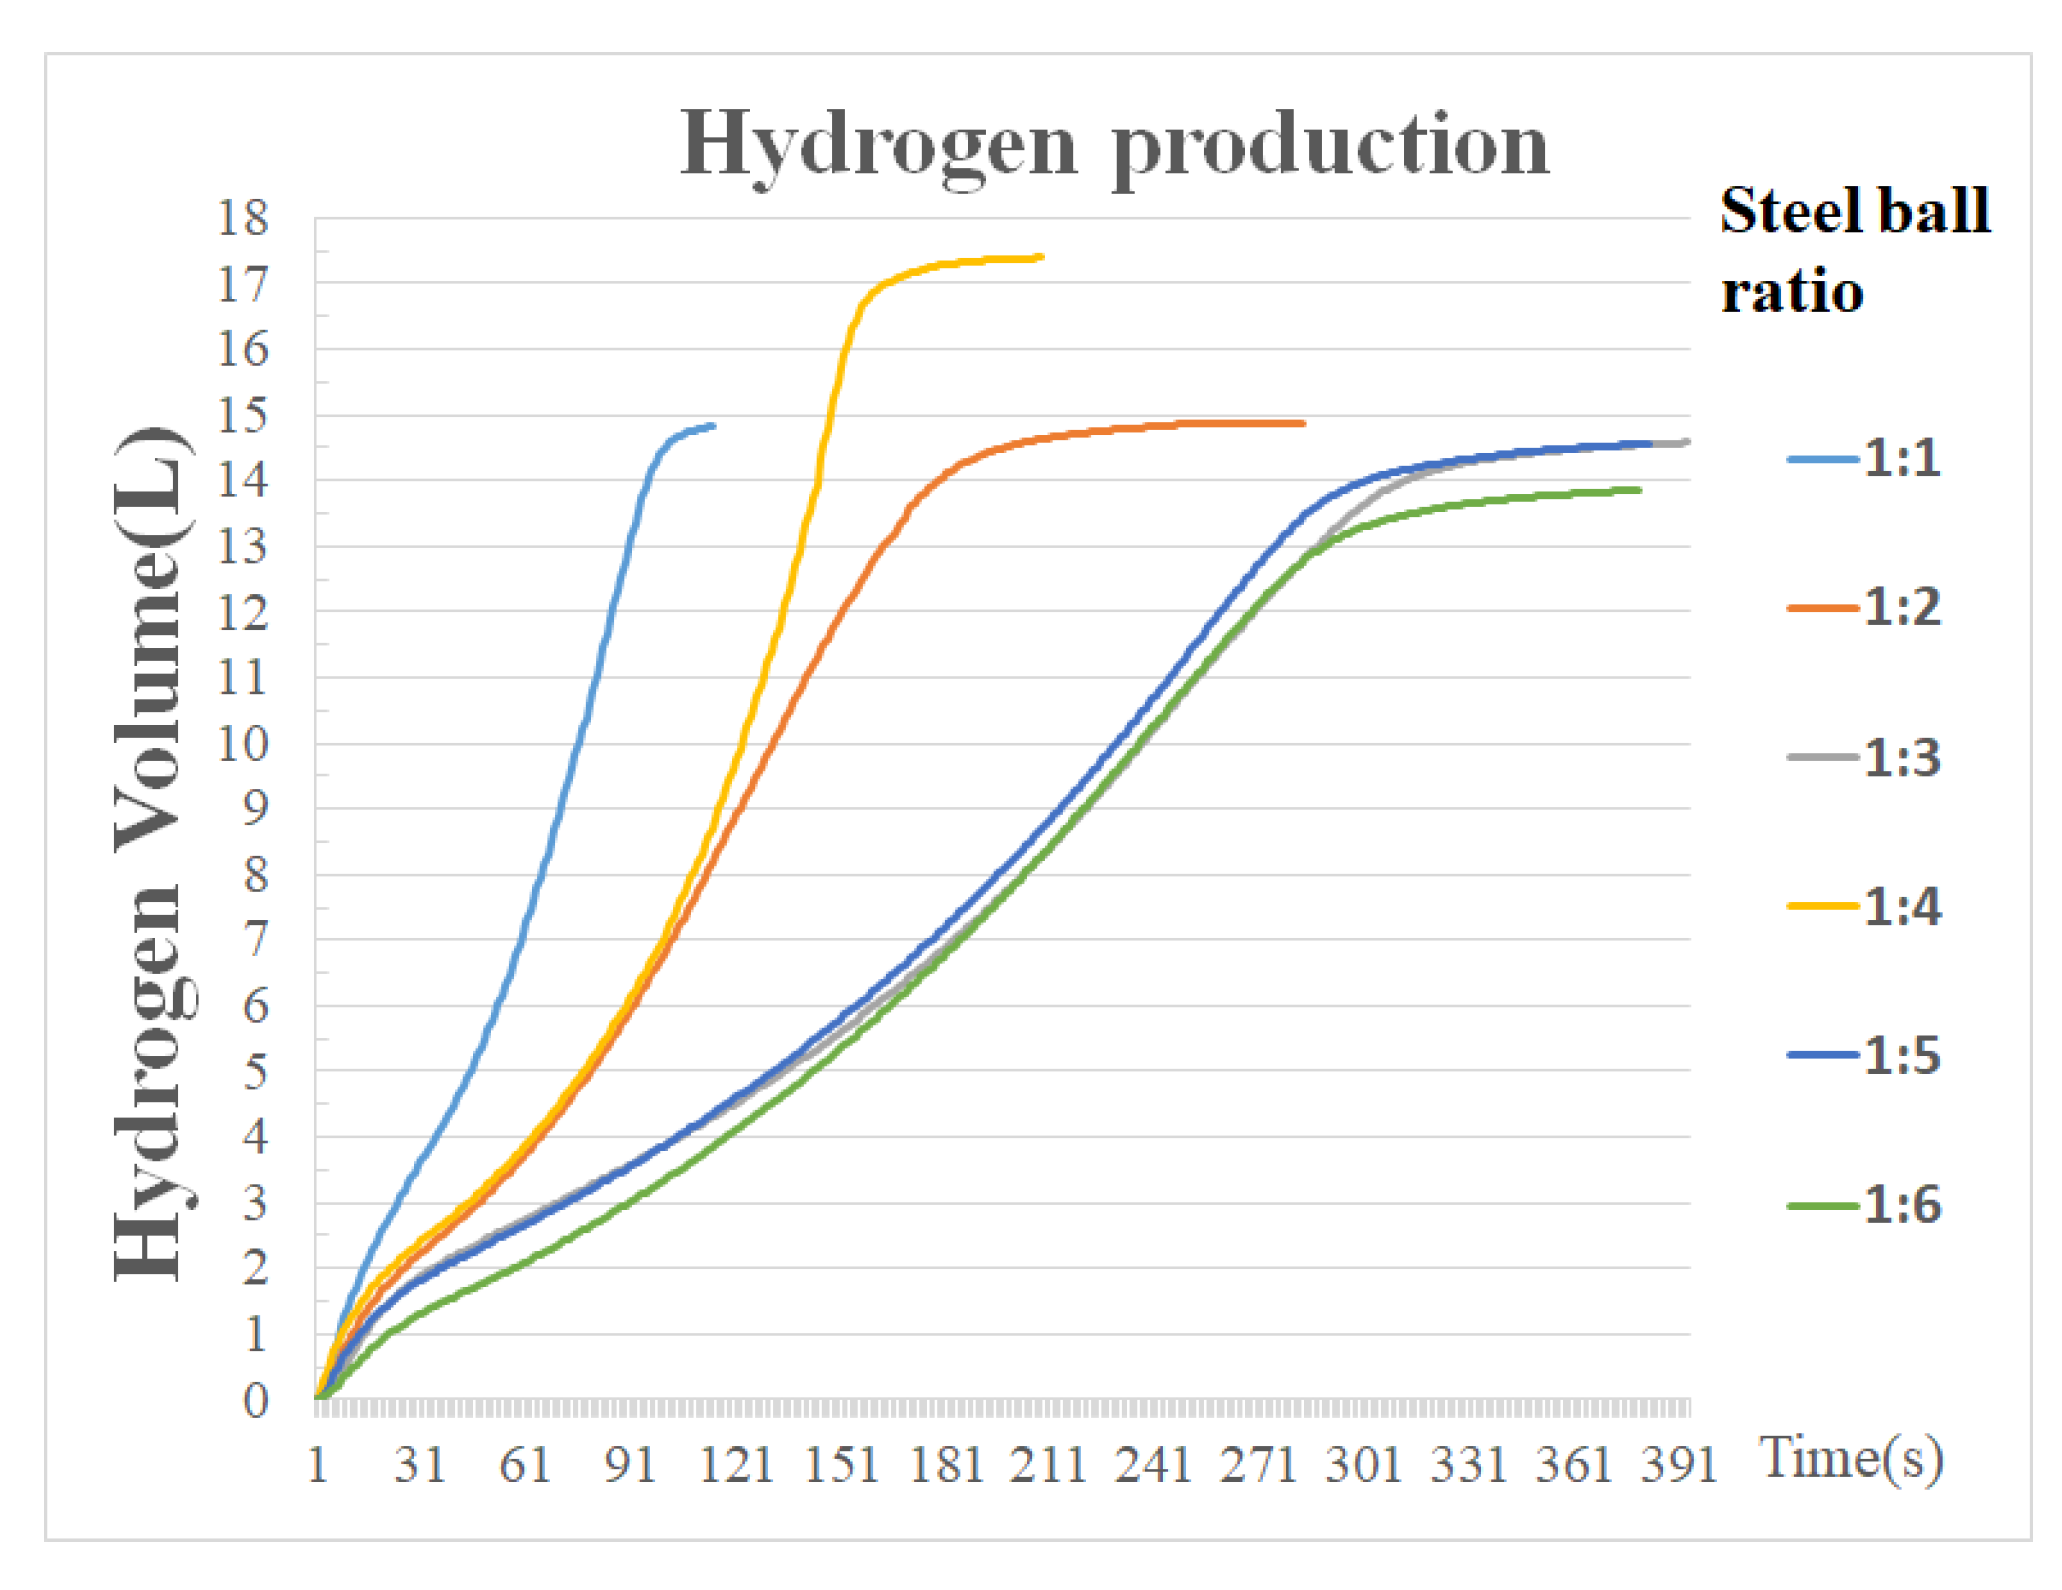
2.4. Comparison of Hydrogen Production Rates of Ball Milling Steel Ball in Different Ratios

Different steel ball size ratios can influence the powder milling result. The steel ball size ratio changed from 1:1 to 1:6 to mill NaBH4 + Co2+ catalyst powder in the ratio of 7:3 for 2 h. The hydrogen production was tested under identical conditions for the primary hydrogen production tank and secondary hydrogen production tank in Section 2.3. According to the experiment, the hydrogen production of the milling steel ball size ratio of 1:4 for 2 h was better than the other steel ball size ratios, as shown in Figure 5.

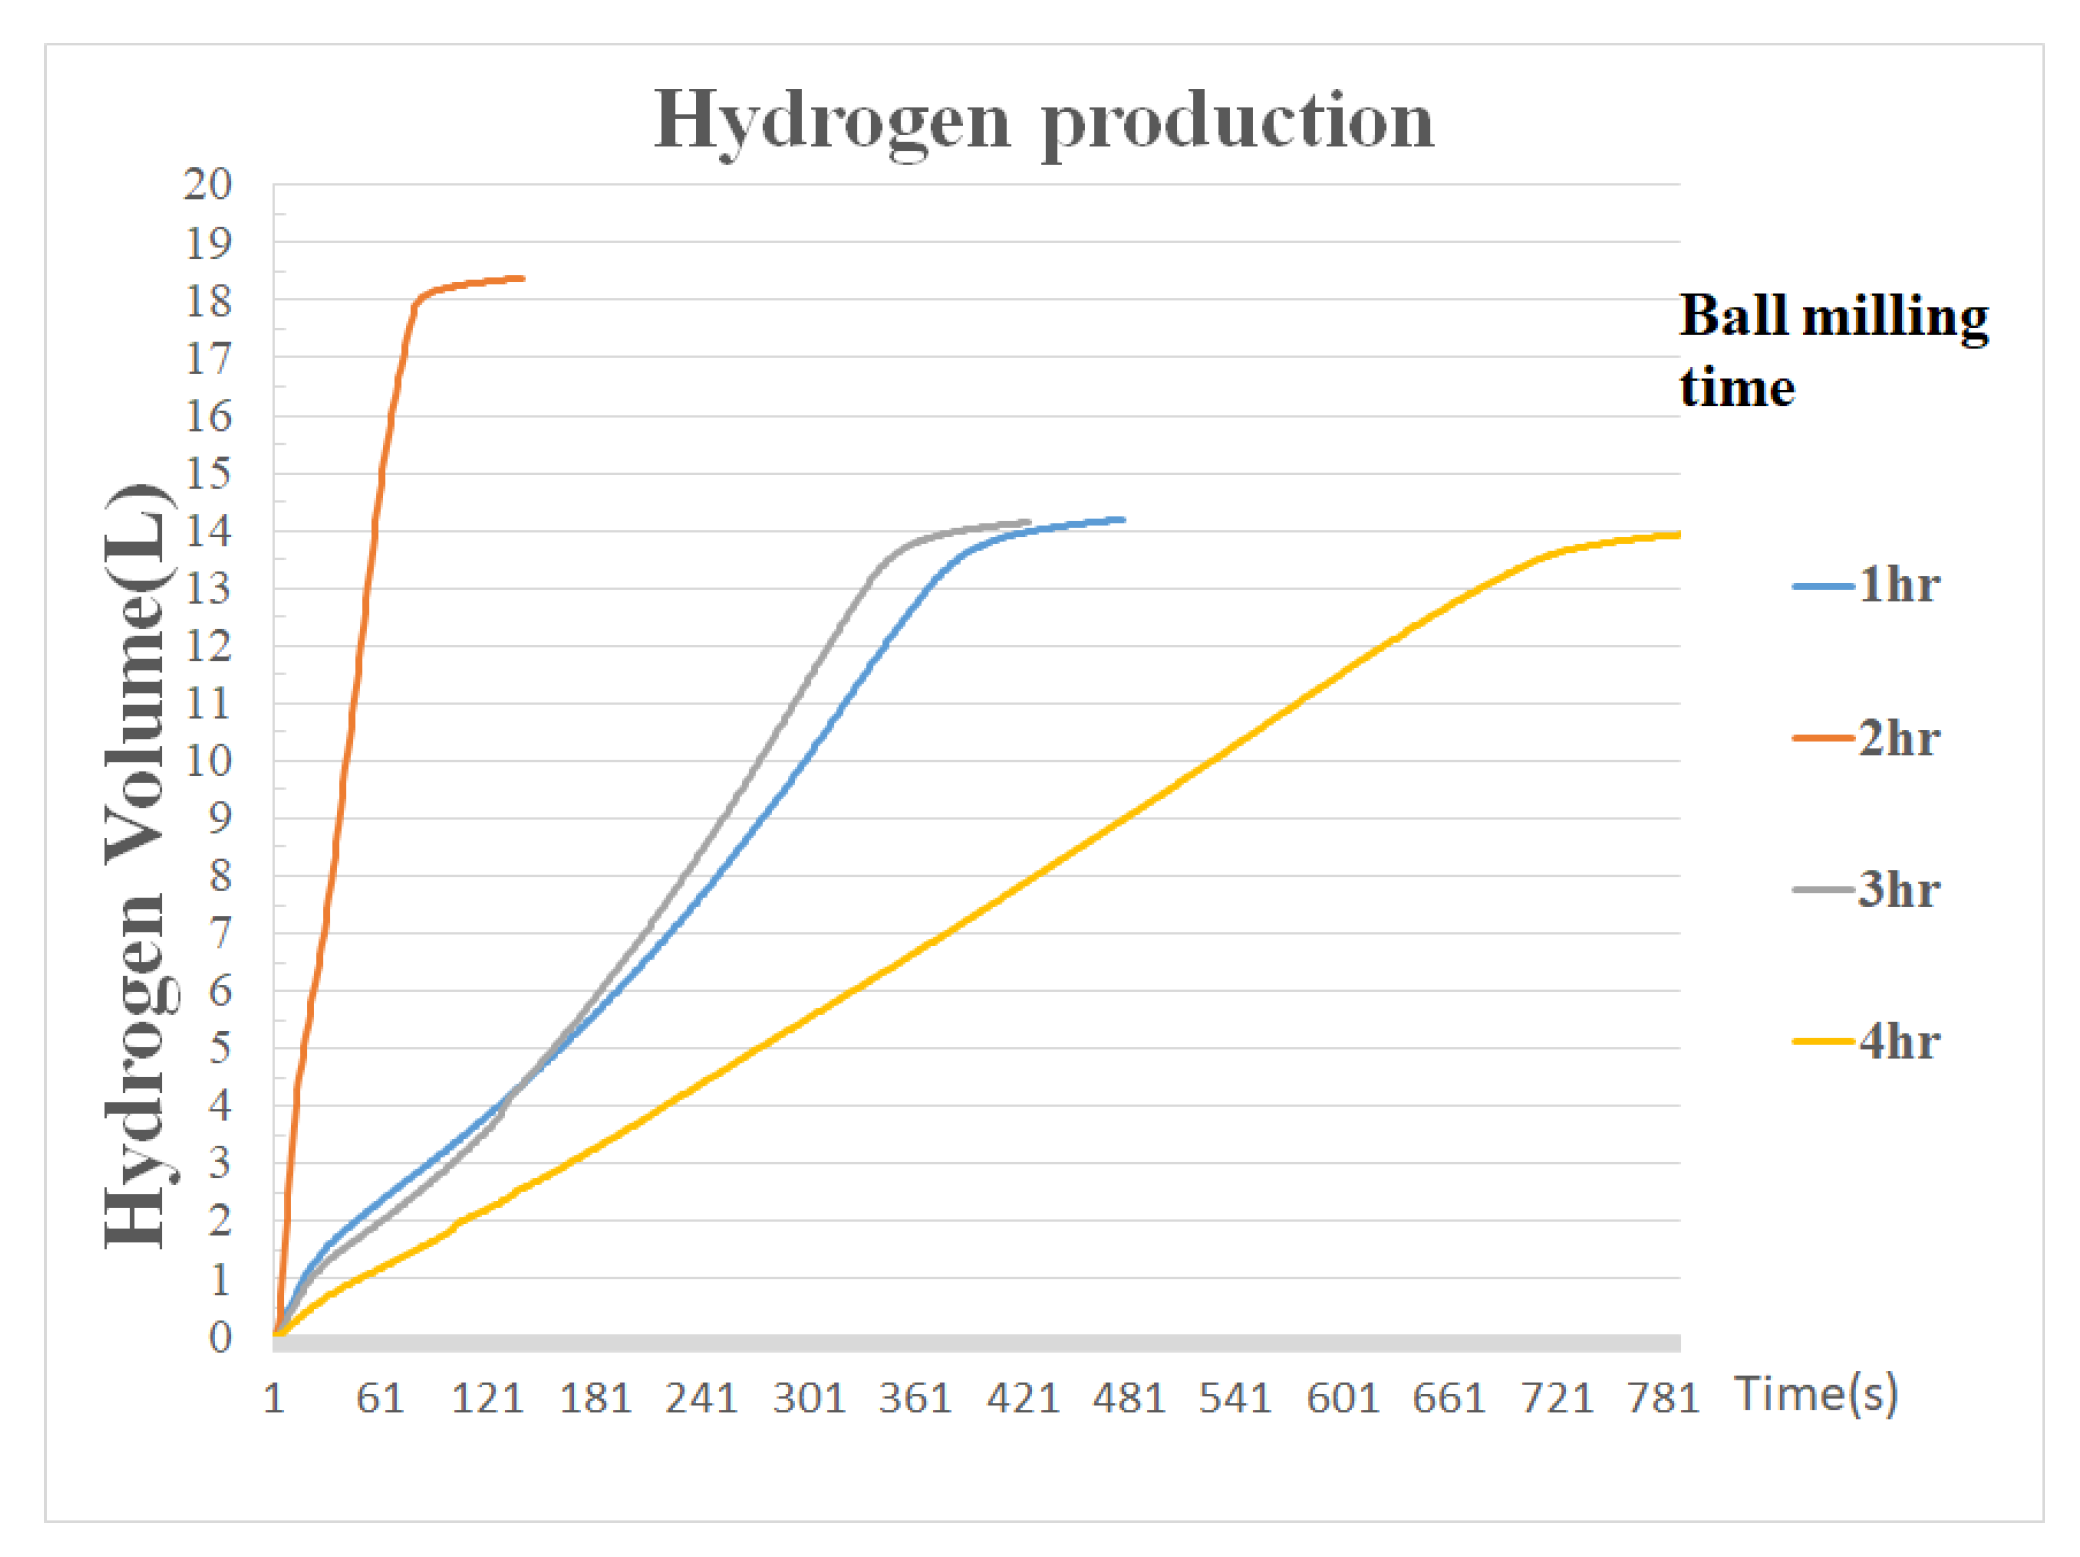
2.5. Comparison of Hydrogen Production Rates of Different Ball Milling Times

The length of ball milling time influences the powder particle size, so the ball milling time was set as 1 h to 4 h for ball milling in this paper, and the hydrogen production was tested under the experimental conditions in Section 2.4. The experimental results showed that the hydrogen production of 2 h ball milling was 18.38 L, better than the hydrogen production of the other milling times, as shown in Figure 6.

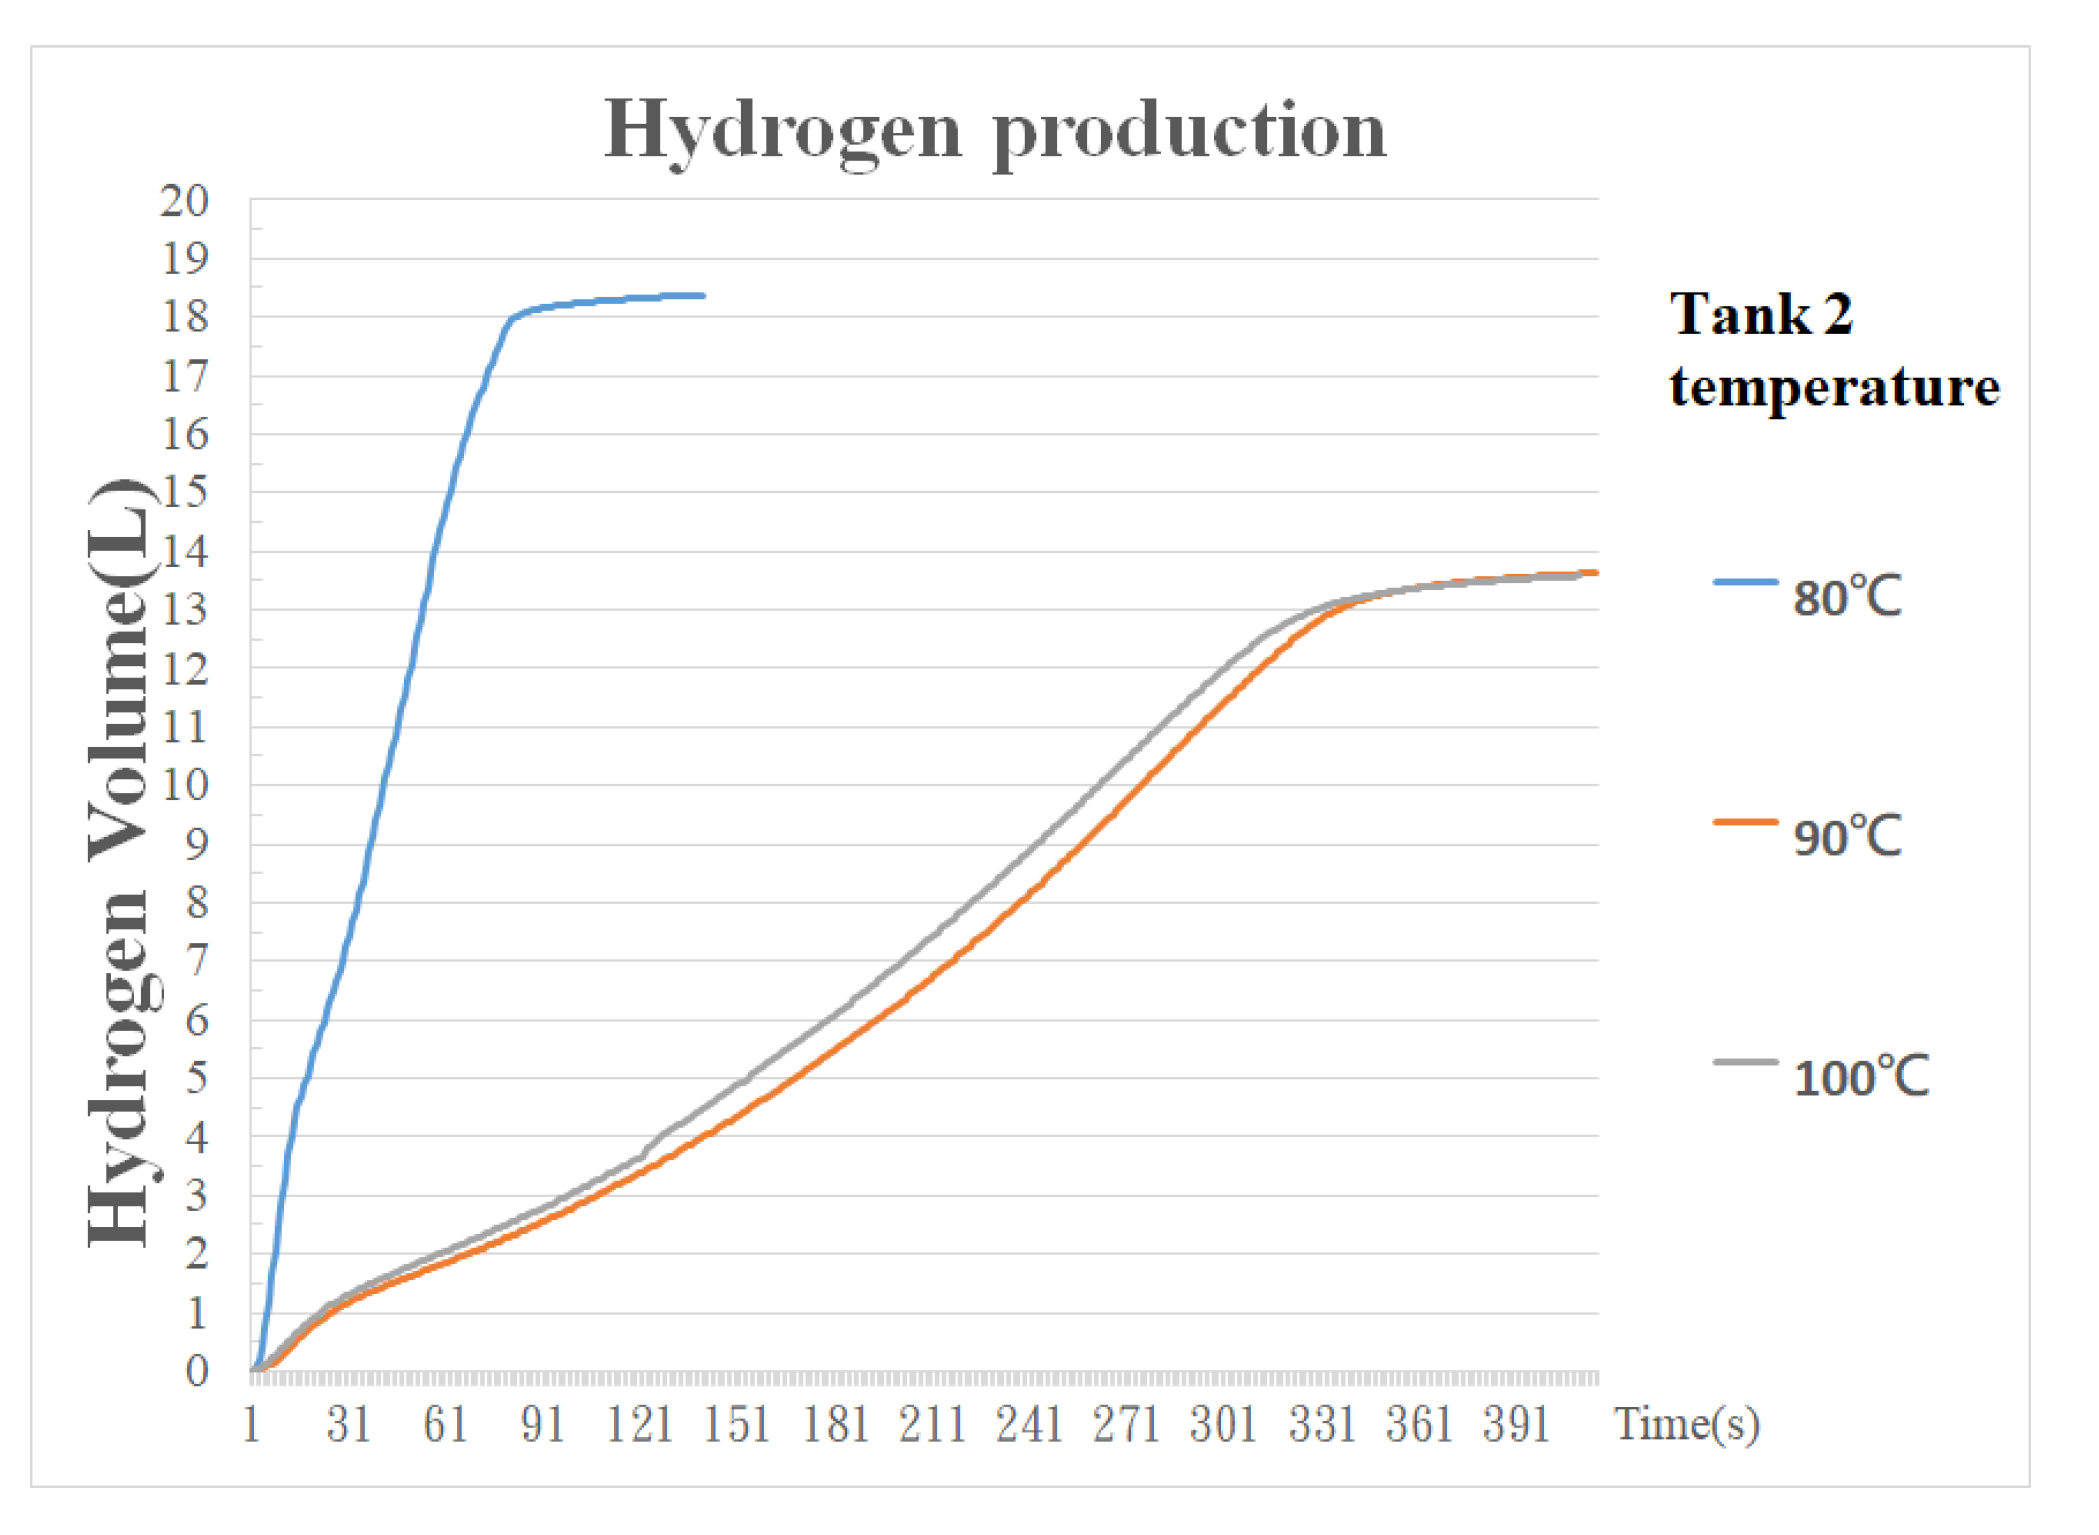
2.6. Comparison of Hydrogen Production Rates at Different Temperatures of Catalyst Bed of Secondary Hydrogen Production Tank

The catalyst bed temperature of the secondary hydrogen production tank maintains the water vapor entrained in the hydrolytic hydrogen production reaction of primary hydrogen production tank. The catalyst bed temperature of the secondary hydrogen production tank was set as 80 °C to 100 °C for the hydrogen production test, and the other conditions were identical with the experimental conditions in Section 2.5. According to the experimental results, the hydrogen production of the secondary hydrogen production tank catalyst bed at 80 °C was better than the other temperatures, as shown in Figure 7.

3. Discussion

The Co2+/Al2O3 catalyst and NaBH4 + Co2+ catalyst were loaded into two hydrogen production tanks, respectively, and the NaBH4 hydrolytic hydrogen production reaction process was performed under different conditions. The experimental aqueous solution concentration condition was fixed at 10 wt%. NaBH4 + 1 wt% NaOH was injected into the hydrogen production tank to react with the catalyst to generate hydrogen. According to the hydrogen production efficiency experimental results, in the primary hydrogen production tank, the Co2+/Al2O3 catalyst at 45 wt% concentration was used. The primary hydrogen production tank catalyst bed was heated to 55 °C with the secondary hydrogen production tank process. NaBH4 + Co2+ catalyst ball milling in the ratio of 7:3 was performed using the steel ball size ratio of 1:4 for 2 h. The secondary hydrogen production tank catalyst bed was heated to 80 °C. The maximum hydrogen production of the overall experimental system was 18.38 L. In comparison to the 14.03 L hydrogen production without catalyst inside the secondary hydrogen production tank, the hydrogen production was increased by 4.35 L. It was found in the experimental process that the byproduct NaBO2 in NaBH4 hydrolytic hydrogen production reaction could be dried and solidified by heating the secondary hydrogen production tank. The NH3 can be dissolved in a pure water filter flask, and a molecular sieve filter flask can be used for prevention, so it can be removed to reduce partial space and cost.

4. Materials and Methods

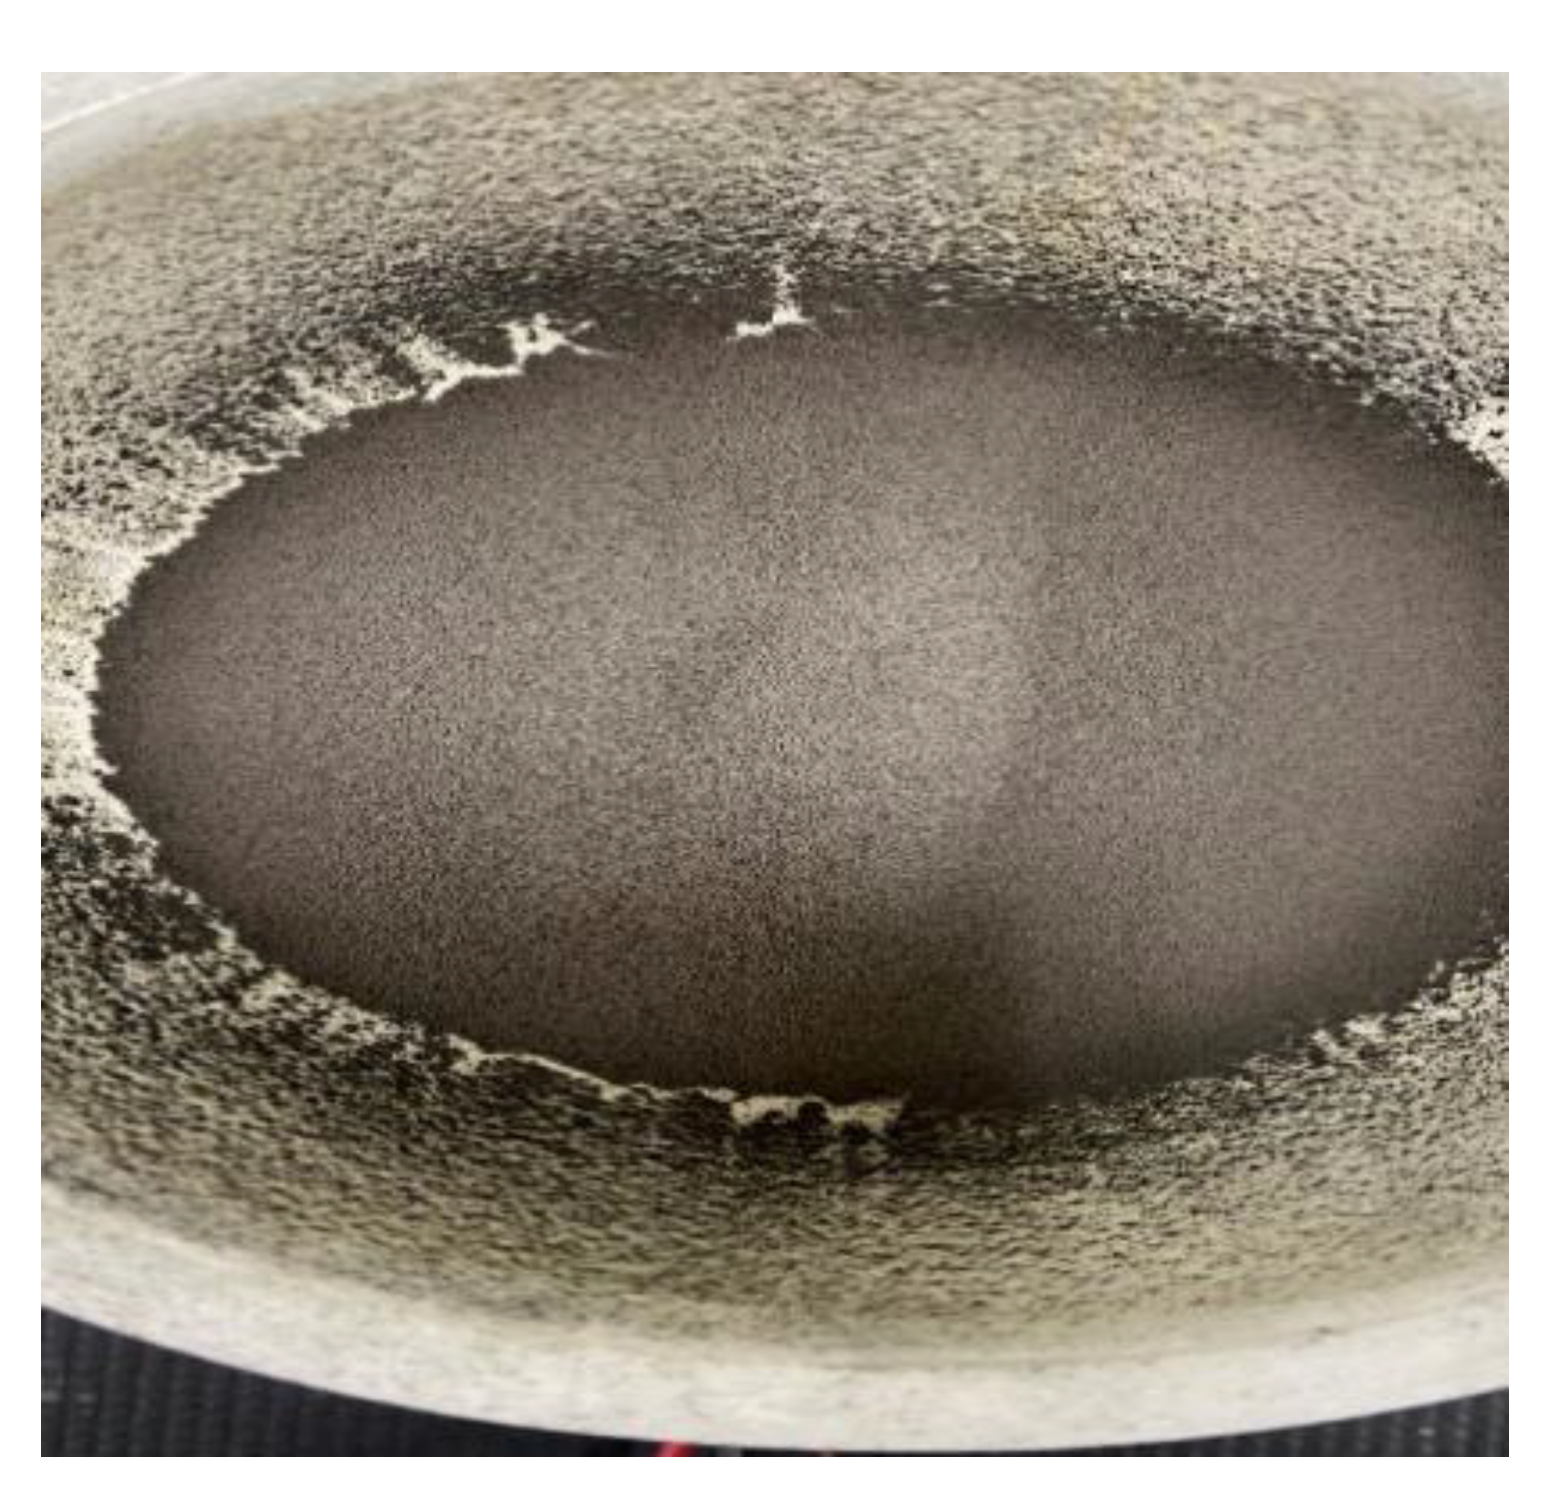
4.1. Co2+/Al2O3 Catalyst Process

This study prepared 10~50 wt% samples of the Co2+/Al2O3 catalyst. The γ-Al2O3 was cleaned with ionized water in advance, and baked in a vacuum drying oven at 120 °C for 4 h to remove moisture content. The dried γ-Al2O3 was soaked in 10~50 wt% CoCl2 solution for 12 h, so that the Co2+ in the solution fully adhered to γ-Al2O3. Afterward, the CoCl2 solution was filtered out, and the soaked γ-Al2O3 was baked in the vacuum drying oven at 120 °C for 6 h. The catalyst Co2+/Al2O3 was prepared, as shown in Figure 8.
The bearing of metal Co2+ of the prepared Co2+/Al2O3 catalyst was observed through SEM. Figure 9 shows the preliminary sting and situation, while Figure 10 used the mapping material analysis system to analyze the distribution of cobalt. From this, it can be judged that the sting and effect of 45 wt% were better than the others.
Take 10 pellets out from each sample and measure the weight. The average value of 3~5 groups were measured before observation. Table 2 shows that the value display at 45 wt% was the best.

4.2. NaBH4 + Co2+ Catalyst Process

The NaBH4, Co2+, and steel balls at different ratios were used for ball milling. The ball milling steel ball sizes were 4.75 mm and 3 mm. The NaBH4–Co2+ ratio was 9:1 to 6:4, and the steel ball size ratio of 1:4 was used for 2-h ball milling. The steel ball size ratio was changed from 1:1 to 1:6 for 2-h ball milling. Finally, the ball milling time was changed from 1 h to 4 h for testing. The prepared catalyst is shown in Figure 11. Demirci et al. [27] observed the mixed Co2+ and NaBH4, and it was found that the Co–B formed a thin film on the surface. This thin film crystallized into a black solid. It was proven that the milling color in Figure 11 is a normal phenomenon.
The ball milling NaBH4 + Co2+ catalyst in the changed steel ball size ratio was observed through SEM, as shown in Figure 12. The ball milling powder particles from the steel ball size ratio of 1:4 were better than the other ratios. The minimum powder particle size was 131 μm.
The NaBH4+ Co2+ catalyst powder of different ball milling times was investigated by SEM. The ball milling particles became finer as the ball milling time increased, but the water vapor in the environment was adsorbed more rapidly, and was likely to induce agglomeration. The SEM image of 2 h of ball milling is shown in Figure 13. The powder particles were relatively even.

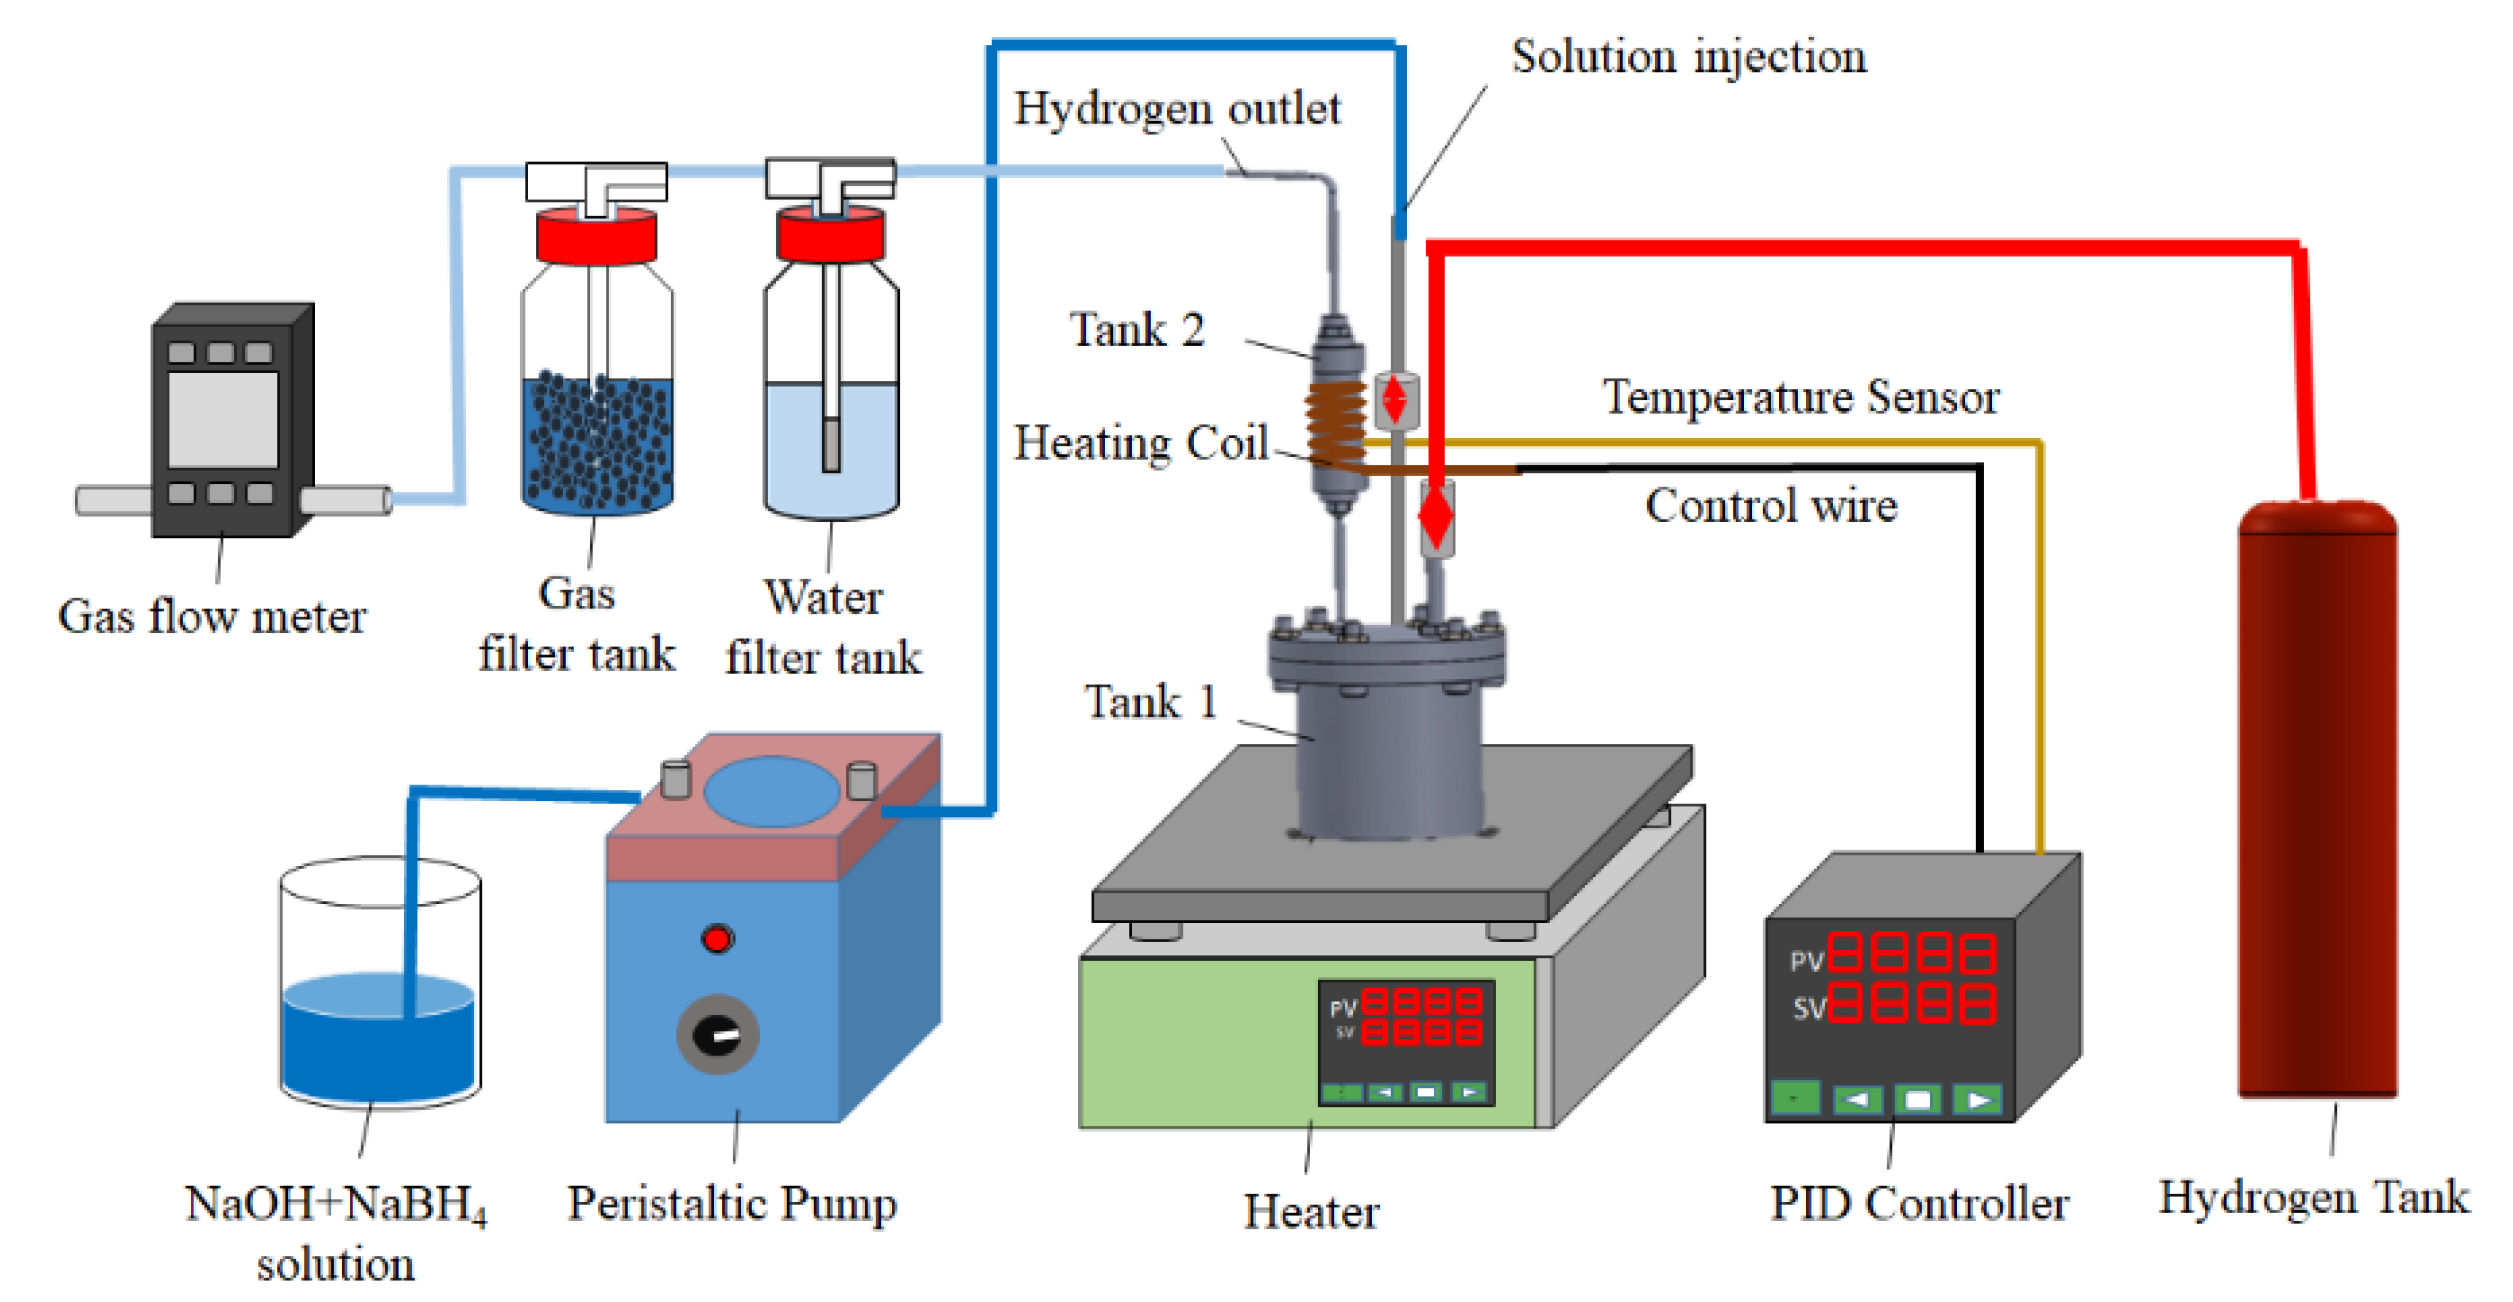
4.3. Experimental Setup

4.3.1. Hydrogen Production System

The experimental setup is shown in Figure 14. The Co2+/Al2O3 catalyst was placed in the primary hydrogen production tank. The secondary hydrogen production tank was filled with the NaBH4 + Co2+ catalyst. The NaBH4 + NaOH solution was injected into the primary hydrogen production tank through the injection opening to produce hydrogen. The water vapor entrained in hydrogen reacted with NaBH4 + Co2+ catalyst in the secondary hydrogen production tank, and the hydrogen volume was increased. It was then filtered using a pure water filter flask and a molecular sieve filter flask. Finally, the total hydrogen yield was read and recorded using a hydrogen flow meter. When the hydrogen flow meter reading was zero, the recording was stopped, and the experiment was finished.

4.3.2. Primary Hydrogen Production Tank

The primary hydrogen production tank was the main hydrogen production chamber body. The catalyst bed was heated by the lower heater, and the Co2+/Al2O3 catalyst was placed in it. The NaBH4 solution was injected for hydrogen production reaction. Kim et al. [28] found that the NaBH4 and NaOH concentration and solution flow rate influenced the hydrogen production reaction. They used a pump to control the solution flow velocity, and the blended solution concentration of 20 wt% NaBH4 + 1 wt% NaOH resulted in about 6 L/min of hydrogen production at the optimum flow velocity of 17.5 mL/min. Amendola et al. [29] found the NaBH4 and NaOH blended solution concentration in the hydrogen production reaction. Figure 15 shows that the 10 wt% NaBH4 + 1 wt% NaOH solution had a better hydrogen production rate. Afterward, the hydrogen in the hydrogen production reaction process entrained water vapor into the secondary hydrogen production tank, entering the back-end hydrogen production process. In J. L. Lai et al. [30], they used a sodium borohydride solution of 10 wt% NaBH4 + 1 wt% NaOH and a Co2+/Al2O3 catalyst with a chelating concentration of 30 wt% to produce hydrogen at a catalyst bed temperature of 70 °C. Although it had the highest hydrogen production rate at 5300 mL/min g cat. The hydrogen production efficiency was only 82.92%. However, in the hydrogen production efficiency test results, it is known that the Co2+/Al2O3 catalyst with a chelating concentration of 20 wt% can be produced at a catalyst bed temperature of 65 °C. The hydrogen efficiency was as high as 99.13%. The experimental results confirmed that different Co2+/Al2O3 catalyst solution concentrations and catalyst bed temperatures all affected hydrogen production.

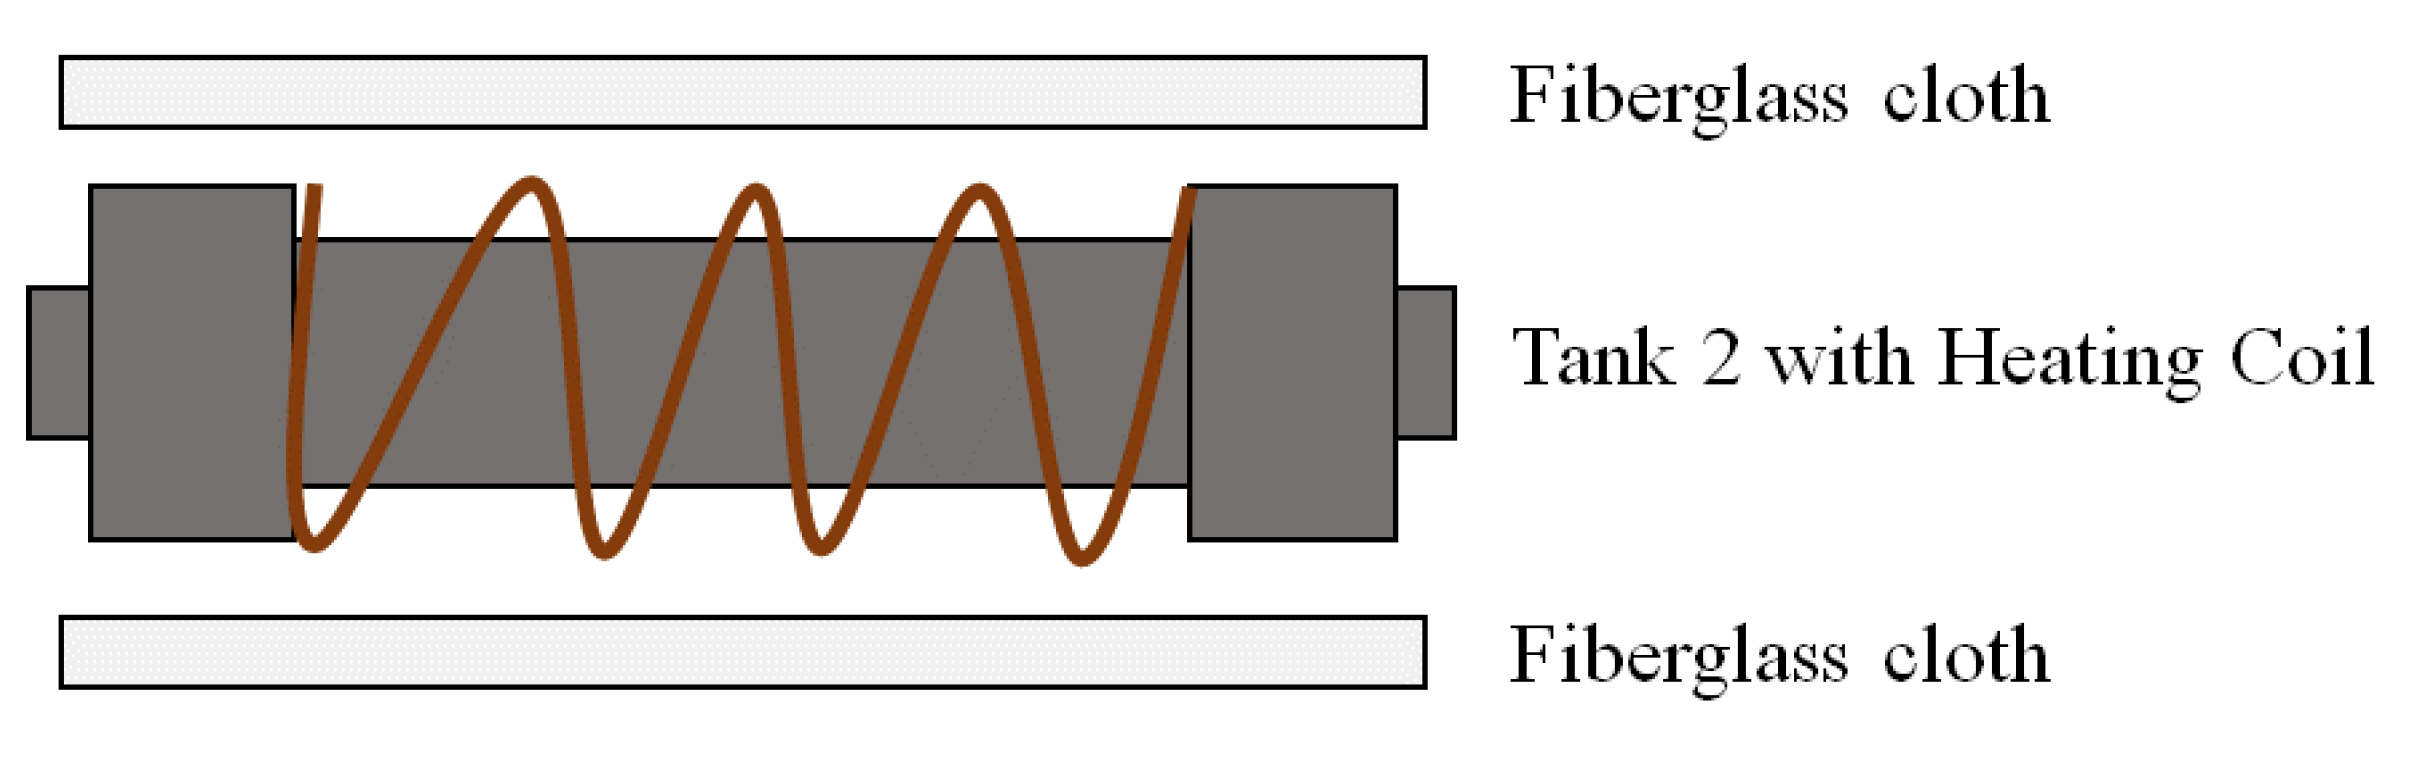
4.3.3. Secondary Hydrogen Production Tank

The NaBH4 + Co2+ catalyst was loaded into the secondary hydrogen production tank. A heating coil and PID controller were provided outside to maintain the catalyst bed temperature. The tank was covered with fiberglass for warmth retention. The heat dissipation was mitigated, as shown in Figure 16. The purpose of heating is to maintain the water vapor entrained after hydrolytic hydrogen production reaction in the primary hydrogen production tank. Akkus et al. [31] indicated that hydrogen generation could be increased by performing the NaBH4 hydrolytic hydrogen production reaction in a high temperature catalyst bed and the reaction of byproducts was reduced to generate purified hydrogen.

4.3.4. Pure Water Filter Flask

Aside from hydrogen, the NaBH4 hydrolytic hydrogen production reaction generates NaBO2 and a small amount of NH3. These alkaline byproducts are soluble in water, making the aqueous solution strongly alkaline. If the hydrogen carrying alkaline water enters the fuel cell system through reaction, the entrained material condenses as the temperature drops. Therefore, the hydrogen mass and the efficiency and fuel cell life are influenced. Therefore, a pure water filter flask was provided at the front end to filter the water soluble material in advance for prevention.

4.3.5. Molecular Sieve Filter Flask

Molecular sieves can purify dry air, hydrogen, oxygen, and nitrogen. The molecular sieve filter flask was arranged at the back end of a pure water filter flask to purify hydrogen, but also prevent the water vapor in the pure water filter flask from evaporating. The water vapor is absorbed to obtain more purified hydrogen.

Author Contributions

Conceptualization, J.-L.L. and Y.-D.K.; Data curation, J.-L.L., Y.-D.K. and P.-J.Z.; Formal analysis, J.-L.L. and P.-J.Z.; Funding acquisition, Y.-D.K.; Investigation, J.-L.L., W.-J.L. and P.-J.Z.; Methodology, J.-L.L., Y.-D.K. and P.-J.Z.; Project administration, Y.-D.K.; Resources, Y.-D.K.; Supervision, W.-J.L. and Y.-D.K.; Writing—original draft, J.-L.L.; Writing—review & editing, W.-J.L. and Y.-D.K. All authors have read and agreed to the published version of the manuscript.

Funding

This research was funded by the Ministry of Science and Technology, Taiwan (MOST 109-2221-E-167-006).

Data Availability Statement

Data sharing not applicable.

Acknowledgments

The authors acknowledge the financial support from the Ministry of Science and Technology, Taiwan.

Conflicts of Interest

The authors declare no conflicts of interest.

References

  1. Lund, H. Renewable energy strategies for sustainable development. Energy 2007, 32, 912–919. [Google Scholar] [CrossRef] [Green Version]
  2. Nikolaidis, P.; Poullikkas, A. A comparative overview of hydrogen production processes. Renew. Sustain. Energy Rev. 2017, 67, 597–611. [Google Scholar] [CrossRef]
  3. Mench, M.M. Fuel Cell Engines; John Wiley & Sons Inc.: Hoboken, NJ, USA, 2008. [Google Scholar]
  4. Sorensen, B. Hydrogen and Fuel Cells: Emerging Technologies and Applications; Elsevier Academic Press: Cambridge, MA, USA, 2005. [Google Scholar]
  5. Sarkar, A.; Banerjee, R. Net energy analysis of hydrogen storage options. Int. J. Hydrogen Energy 2005, 30, 867–877. [Google Scholar] [CrossRef]
  6. Kim, T. NaBH4 (sodium borohydride) hydrogen generator with a volume-exchange fuel tank for small unmanned aerial vehicles powered by a PEM (proton exchange membrane) fuel cell. Energy 2014, 69, 721–727. [Google Scholar] [CrossRef]
  7. Klanchar, M.; Hughes, T.G.; Gruber, P. Attaining Doe Hydrogen Storage Goals with Chemical Hydrides, Senior Research Associate; Applied Research Laboratory, The Pennsylvania State University: State College, PA, USA, 2003. [Google Scholar]
  8. Schlesinger, H.I.; Brown, H.C.; Brown, A.B.; Finholt, J.R.; Gilbreath, H.R.; Hockstra, E.K.; Hydo, E.K. Sodium Borohydride, Its Hydrolysis and its Use as a Reducing Agent and in the Generation of Hydrogen. J. Am. Chem. Soc. 1953, 75215. [Google Scholar]
  9. Andrieux, J.; Laversenne, L.; Krol, O.; Chiriac, R.; Bouajila, Z.; Tenu, R.; Counioux, J.J.; Goutaudier, C. Revision of the NaBO2–H2O phase diagram for optimized yield in the H2 generation through NaBH4 hydrolysis. Int. J. Hydrogen Energy 2012, 37, 5798–5810. [Google Scholar] [CrossRef]
  10. Balbay, A.; Saka, C. The effect of the concentration of hydrochloric acid and acetic acid aqueous solution for fast hydrogen production from methanol solution of NaBH4. Int. J. Hydrogen Energy 2018, 43, 14265–14272. [Google Scholar] [CrossRef]
  11. Saka, C.; Balbay, A. Fast and effective hydrogen production from ethanolysis and hydrolysis reactions of potassium borohy-dride using phosphoric acid. Int. J. Hydrogen Energy 2018, 43, 19976–19983. [Google Scholar] [CrossRef]
  12. Wang, J.; Ke, D.; Li, Y.; Zhang, H.; Wang, C.; Zhao, X.; Yuan, Y.; Han, S. Efficient hydrolysis of alkaline sodium borohydride catalyzed by cobalt nanoparticles supported on three–dimensional graphene oxide. Mater. Res. Bull. 2017, 95, 204–210. [Google Scholar] [CrossRef]
  13. Li, Z.; Li, H.; Wang, L.; Liu, T. Hydrogen generation from catalytic hydrolysis of sodium borohydride solution using supported amorphous alloy catalysts (Ni-Co-P/g-Al2O3). Int. J. Hydrogen Energy 2014, 39, 14935–14941. [Google Scholar] [CrossRef]
  14. Ke, D.; Tao, Y.; Li, Y.; Zhao, X.; Zhang, L.; Wang, J.; Han, S. Kinetics study on hydrolytic dehydrogenation of alkaline sodium borohydride catalyzed by Mo-modified Co–B nanoparticles. Int. J. Hydrogen Energy 2015, 40, 7308–7317. [Google Scholar] [CrossRef]
  15. Vinokurov, V.; Stavitskaya, A.; Glotov, A.; Ostudin, A.; Sosna, M.; Gushchin, P.; Darrat, Y.; Lvov, Y. Hallo site nanotube-based cobalt mesocatalysts for hydrogen production from sodium borohydride. J. Solid State Chem. 2018, 268, 182–189. [Google Scholar] [CrossRef]
  16. Ye, W.; Zhang, H.; Xu, D.; Ma, L.; Yi, B. Hydrogen generation utilizing alkaline sodium borohydride solution and supported cobalt catalyst. J. Power Sources 2007, 164, 544–548. [Google Scholar] [CrossRef]
  17. Kong, V.; Kirk, D.; Foulkes, F.; Hinatsu, J. Development of hydrogen storage for fuel cell generators II: Utilization of calcium hydride and lithium hydride. Int. J. Hydrogen Energy 2003, 28, 205–214. [Google Scholar] [CrossRef]
  18. Marrero-Alfonso, E.Y.; Gray, J.R.; Davis, T.A.; Matthews, M.A. Hydrolysis of sodium borohydride with steam. Int. J. Hydrogen Energy 2007, 32, 4717–4722. [Google Scholar] [CrossRef]
  19. Aiello, R. Production of hydrogen from chemical hydrides via hydrolysis with steam. Int. J. Hydrogen Energy 1999, 24, 1123–1130. [Google Scholar] [CrossRef]
  20. Beaird, A.M.; Li, P.; Marsh, H.S.; Al-Saidi, W.A.; Johnson, J.K.; Matthews, M.A.; Williams, C.T. Thermal Dehydration and Vibrational Spectra of Hydrated Sodium Metaborates. Ind. Eng. Chem. Res. 2011, 50, 7746–7752. [Google Scholar] [CrossRef]
  21. Marrero-Alfonso, E.Y.; Gray, J.R.; Davis, T.A.; Matthews, M.A. Minimizing water utilization in hydrolysis of sodium borohydride: The role of sodium metaborate hydrates. Int. J. Hydrogen Energy 2007, 32, 4723–4730. [Google Scholar] [CrossRef]
  22. Baytar, O.; Izgi, M.S.; Horoz, S.; Sahin, O.; Nar, S. Al2O3 Supported Co-Cu-B (Co-Cu-B/Al2O3) catalyst for hydrogen generation by hydrolysis of aqueous sodium borohydride (NaBH4) solutions. Dig. J. Nanomater. Biostruct. 2019, 14, 673–681. [Google Scholar]
  23. Kim, K.; Kim, T.; Lee, K.; Kwon, S. Fuel cell system with sodium borohydride as hydrogen source for unmanned aerial vehicles. J. Power Sources 2011, 196, 9069–9075. [Google Scholar] [CrossRef]
  24. Kao, H.-Y.; Lin, C.-C.; Hung, C.-J.; Hu, C.-C. Kinetics of hydrogen generation on NaBH 4 powders using cobalt catalysts. J. Taiwan Inst. Chem. Eng. 2018, 87, 123–130. [Google Scholar] [CrossRef]
  25. Wang, X.; Liao, J.; Li, H.; Wang, H.; Wang, R. Preparation of pompon-like Co-B Nano alloy by a room-temperature solid-state-reaction as a catalyst for hydrolysis of borohydride solution. Int. J. Hydrogen Energy 2017, 42, 6646–6656. [Google Scholar] [CrossRef]
  26. Wang, M.; Ouyang, L.; Liu, J.; Wang, H.; Zhu, M. Hydrogen generation from sodium borohydride hydrolysis accelerated by zinc chloride without catalyst: A kinetic study. J. Alloys Compd. 2017, 717, 48–54. [Google Scholar] [CrossRef]
  27. Demirci, U.B.; Miele, P. Cobalt in NaBH4 hydrolysis. Phys. Chem. Chem. Phys. 2010, 12, 14651–14665. [Google Scholar] [CrossRef]
  28. Kim, S.J.; Lee, J.; Kong, K.Y.; Jung, C.R.; Min, I.-G.; Lee, S.-Y.; Kim, H.-J.; Nam, S.W.; Lim, T.-H. Hydrogen generation system using sodium borohydride for operation of a 400W-scale polymer electrolyte fuel cell stack. J. Power Sources 2007, 170, 412–418. [Google Scholar] [CrossRef]
  29. Amendola, S.C. A safe, portable, hydrogen gas generator using aqueous borohydride solution and Ru catalyst. Int. J. Hydrogen Energy 2000, 25, 969–975. [Google Scholar] [CrossRef]
  30. Lai, J.-L.; Luo, W.-J.; Kuan, Y.-D. Preparation of Catalyst for Hydrogen Production Reaction of Sodium Borohydride and Its Effectiveness. Sens. Mater. 2020, 32, 3659. [Google Scholar] [CrossRef]
  31. Akkuş, M.S.; Murathan, H.B.; Özgür, D.Ö.; Özkan, G.; Özkan, G. New insights on the mechanism of vapor phase hydrolysis of sodium borohydride in a fed-batch reactor. Int. J. Hydrogen Energy 2018, 43, 10734–10740. [Google Scholar] [CrossRef]
Figure 1. Proportional relation between the operating temperature range and byproduct of NaBH4 hydrolysis [9].
Catalysts 11 00528 g001
Figure 2. Comparison of the hydrogen production rates of the Co2+/Al2O3 catalyst chelate concentrations at a normal temperature of 25 °C.
Catalysts 11 00528 g002
Figure 3. Comparison of the hydrogen production rates of the 45 wt% Co2+/Al2O3 catalyst at different temperatures of catalyst bed of the primary hydrogen production tank.
Catalysts 11 00528 g003
Figure 4. Comparison of the ball milling hydrogen production rates of NaBH4 + Co2+ in different ratios.
Catalysts 11 00528 g004
Figure 5. Comparison of hydrogen production rates of ball milling steel ball in different ratios.
Catalysts 11 00528 g005
Figure 6. Comparison of hydrogen production rates of different ball milling times.
Catalysts 11 00528 g006
Figure 7. Comparison of hydrogen production rates at different catalyst bed temperatures for the secondary hydrogen production tank.
Catalysts 11 00528 g007
Figure 8. Complete diagram of the prepared Co2+/Al2O3 catalyst.
Catalysts 11 00528 g008
Figure 9. SEM images of the Co2+/Al2O3 catalyst at various concentrations. (a) Original γ-Al2O3; (b) 10 wt% Co2+/Al2O3; (c) 20 wt% Co2+/Al2O3; (d) 30 wt% Co2+/Al2O3; (e) 35 wt% Co2+/Al2O3; (f) 40 wt% Co2+/Al2O3; (g) 45 wt% Co2+/Al2O3; (h) 50 wt% Co2+/Al2O3.
Catalysts 11 00528 g009
Figure 10. Mapping cobalt distribution map. (a) 10 wt% Co2+/Al2O3; (b) 20 wt% Co2+/Al2O3; (c) 30 wt% Co2+/Al2O3; (d) 35 wt% Co2+/Al2O3; (e) 40 wt% Co2+/Al2O3; (f) 45 wt% Co2+/Al2O3; (g) 50 wt% Co2+/Al2O3.
Catalysts 11 00528 g010
Figure 11. Schematic diagram of the NaBH4 + Co2+ catalyst after ball milling.
Catalysts 11 00528 g011
Figure 12. SEM images of different steel ball size ratios. (a) Ball milled powder with steel balls ratio 1:1; (b) ball milled powder with steel balls ratio 1:2; (c) ball milled powder with steel balls ratio 1:3; (d) ball milled powder with steel balls ratio 1:4; (e) ball milled powder with steel balls ratio 1:5; (f) ball milled powder with steel balls ratio 1:6.
Catalysts 11 00528 g012
Figure 13. SEM images of different ball milling times. (a) Ball milled the powder for 1 h with a steel balls ratio of 1:4; (b) ball milled the powder for 2 h with a steel balls ratio of 1:4; (c) ball milled the powder for 3 h with a steel balls ratio of 1:4; (d) ball milled the powder for 4 h with a steel balls ratio of 1:4.
Catalysts 11 00528 g013
Figure 14. Schematic diagram of the experimental setup.
Catalysts 11 00528 g014
Figure 15. Effect of NaOH on NaBH4 hydrogen desorption rate.
Catalysts 11 00528 g015
Figure 16. Secondary hydrogen production tank set-up diagram.
Catalysts 11 00528 g016
Table 1. Candidate hydride reactions and hydrogen storage properties [7].
Hydride and ReactionFraction HH2 Specific Mass
(kg H2/kg)
H2 Density
(kg H2/L)
L i H + H 2 O L i O H + H 2 0.1260.2520.122
N a H + H 2 O N a O H + H 2 0.0420.0830.106
C a H 2 + 2 H 2 O C a O H 2 + 2 H 2 0.0480.0950.121
M g H 2 M g + H 2 0.0760.0760.110
L i A l H 4 + H 2 O L i O H + A l + 2.5 H 2 0.1050.1320.121
T i H 2 T i + H 2 0.0400.0400.152
L i B H 4 + H 2 O L i O H + H B O 2 + 4 H 2 0.1840.3670.235
N a B H 4 + 2 H 2 O N a B O 2 + 4 H 2 0.1050.2110.226
Millennium Cell 35% Solution N a B H 4 + 4 H 2 O N a B O 2 + 4 H 2 + 2 H 2 O 0.0770.077
Table 2. Each concentration of Co2+/Al2O3 takes the weight of 10 particles.
No. 1No. 2No. 3No. 4No. 5Average
original0.020.0190.0210.0220.0190.0202
10 wt%0.0220.0220.0220.0220.0250.0226
20 wt%0.0230.020.0210.0220.0220.0216
30 wt%0.0210.0240.0230.0240.0230.023
35 wt%0.0210.0210.0230.0210.0230.0218
40 wt%0.0210.0210.0220.0230.0250.0224
45 wt%0.0250.0250.0220.0240.0240.024
50 wt%0.0230.0210.0220.0220.0240.0224
(Unit: grams).
Publisher’s Note: MDPI stays neutral with regard to jurisdictional claims in published maps and institutional affiliations.

