Article

Hydrogen Production via Pd-TiO2 Photocatalytic Water Splitting under Near-UV and Visible Light: Analysis of the Reaction Mechanism

Chemical Reactor Engineering Centre (CREC), Faculty of Engineering, Western University, London, ON N6A 5B9, Canada
*
Author to whom correspondence should be addressed.
Catalysts 2021, 11(3), 405; https://doi.org/10.3390/catal11030405
Submission received: 16 February 2021 / Revised: 13 March 2021 / Accepted: 18 March 2021 / Published: 23 March 2021
(This article belongs to the Special Issue Commemorative Issue in Honor of Professor Hugo de Lasa)

Abstract

:
Photocatalytic hydrogen production via water splitting using a noble metal on a TiO2 is a technology that has developed rapidly over the past few years. Specifically, palladium doped TiO2 irradiated with near-UV or alternatively with visible light has shown promising results. With this end in mind, strategically designed experiments were developed in the Photo-CREC Water-II (PCW-II) Reactor using a 0.25 wt.% Pd-TiO2 under near-UV and visible light, and ethanol as an organic scavenger. Acetaldehyde, carbon monoxide, carbon dioxide, methane, ethane, ethylene, and hydrogen peroxide together with hydrogen were the main chemical species observed. A Langmuir adsorption isotherm was also established for hydrogen peroxide. On this basis, it is shown that pH variations, hydrogen peroxide formation/adsorption, and the production of various redox chemical species provide an excellent carbon element balance, as well as OH and H radicals balances. Under near-UV irradiation, 113 cm3 STP of H2 is produced after 6 h, reaching an 99.8% elemental carbon balance and 99.2% OH and H and radical balance. It is also proven that a similar reaction network can be considered adequate for the photoreduced Pd-TiO2 photocatalyst yielding 29 cm3 STP of H2 with 95.4% carbon and the 97.5% OH–H radical balance closures. It is shown on this basis that a proposed “series-parallel” reaction network describes the water splitting reaction using the mesoporous Pd-TiO2 and ethanol as organic scavenger.

Graphical Abstract

1. Introduction

The global community has been working towards the production of alternative energy sources while providing sustainable lifestyles for its population [1]. Given this, hydrogen is being considered as a possible energy carrier [2]. Hydrogen can be produced from different sources such as crude oil, gas, wood, and alcohols [3]. However, among these raw materials, only hydrogen generated from water can be considered as a true environmentally friendly energy carrier. When hydrogen is produced from water and following combustion, it releases zero CO2 [4,5].
However, not only water is needed to produce hydrogen. A light source is also vital [4]. Photons may split the water molecule with the help of a semiconductor generating electron–hole pairs [6]. Photoexcited electron–hole pairs can be separated efficiently, using organic scavenger agents that reduce the electron–hole pair recombination, acting as electron donors [7,8,9,10,11].
To date, titanium dioxide (TiO2) has been the most common photocatalyst used to produce hydrogen, due to its stability, resistance to corrosion, cleanliness (no pollutants), availability in nature, and low cost [12,13]. However, TiO2 is limited by its wide band gap. As an alternative, TiO2-based photocatalysts can be synthesized and modified by adding noble metals to narrow the band gap for better sunlight utilization. For example, a TiO2 semiconductor material can be synthesized and modified using palladium doping [14]. By utilizing this noble metal, one can increase the efficiency of the hydrogen formation, creating additional photocatalyst sites where hydrogen and intermediates are formed [15,16].
Our research group has investigated the reaction performance of platinum on TiO2 under near-UV light [17]. By-products such as CO2, ethane, acetaldehyde, and hydrogen peroxide were identified as the result of reduction-oxidation reactions. Given the significant Pt cost, a less expensive Pd doped mesoporous TiO2 photocatalyst is currently being developed, with ethanol being used as a sacrificial agent [18]. Experiments are developed in the Photo-CREC Water-II Reactor (PCW-II Reactor). On this basis, a reaction network as reported here, for both near-UV and visible light irradiation sources, is postulated. Validation of this reaction network is accomplished employing (a) elemental carbon balances for reactants and products species and (b) H and OH balances including hydrogen produced, hydrogen peroxide formed and adsorbed, oxidized, and reduced carbon containing species, and pH.

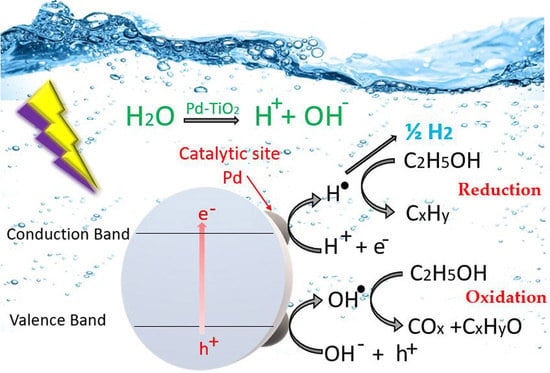
2. Proposed Reaction Mechanism

Regarding the photocatalytic reaction, it can be hypothesized that different by-products are formed because of photo-redox reactions, as observed in Figure 1. Palladium creates holes that react with the organic scavenger ethanol, forming by-products. In the gas phase, in addition to hydrogen, the detected by-products include methane, ethane, ethylene, acetaldehyde, CO, and CO2. In the liquid phase, ethanol and hydrogen peroxide were also identified.
Rusinque et al. [14,15] reported hydrogen production runs (165 experiments) using different photocatalysts concentrations (0.15, 0.30, 0.50, and 1.00 g L−1) as well as Pd loadings (0.25, 0.50, 1.00, 2.50 and 5.00 wt.% Pd) on TiO2. Mechanistic considerations reported in the present manuscript are established for a 0.15 g L−1 photocatalyst concentration, with 0.25 wt.% Pd-TiO2 loading, which was found to be the optimum Pd loading for hydrogen production. Regarding the 0.25 wt.% Pd-TiO2, it was observed to display a reduced band gap of 2.51 eV, which leads to hydrogen being produced under visible light as well. The absorbed radiation was evaluated via macroscopic irradiation energy balances [18].
As a result of the hydrogen formation reactions using 0.25 wt.% Pd-TiO2, the ethanol OH· radical in the organic scavenger is consumed, and the following can be postulated:
(a)
Hydrogen production proceeds via a ‘‘series–parallel’’ redox reaction network.
(b)
Water splits, forming intermediate OH and H radicals, with H reacting further and yielding molecular hydrogen, as shown in Equations (1) and (2).
(c)
Ethanol, as an OH· organic scavenger, is consumed via different reaction pathways to form various oxidation by-products, such as acetaldehyde, CO, and CO2, as described with Equations (3)–(7).
(d)
Ethanol and ethanol by-products are reduced via the H· radicals present, yielding methane, ethane, and ethylene, as reported with Equations (8)–(10).

2.1. Step 1: Hydrogen Production Pathway

Mechanism for hydrogen production
hv   Pd / Ti O 2   h + +   e
Catalysts 11 00405 i001
Mechanism for by-products.

2.2. Step 2: Ethanol Derived By-Products Formation

2.2.1. Oxidation Reactions

(a)
Acetaldehyde
C 2 H 5 OH + OH   Pd / TiO 2 C 2 H 5 O + H 2 O
C 2 H 5 O + OH   Pd / TiO 2   C 2 H 4 O + H 2 O
The addition of Equations (3) and (4) yields the following overall equation:
C 2 H 5 OH + 2 OH Pd / TiO 2   C 2 H 4 O + 2 H 2 O
(b)
Carbon Dioxide
2 C 2 H 5 OH + 6 OH Pd / TiO 2   4 CO 2 + 9 H 2
(c)
Carbon Monoxide
C 2 H 5 OH + 8 OH Pd / TiO 2   2 CO + 7 H 2 O

2.2.2. Reduction Reactions

(d)
Methane
C 2 H 5 OH + 4 H Pd / TiO 2   2 CH 4 + H 2 O
(e)
Ethane
C 2 H 5 OH + H Pd / TiO 2   C 2 H 6 + OH
(f)
Ethylene
C 2 H 5 OH Pd / TiO 2   C 2 H 4 + H 2 O
Additionally, hydrogen peroxide is produced due to the recombination of some of the OH radicals present:
OH + OH Pd / TiO 2 H 2 O 2
In summary, highly valuable products from the redox reactions are generated when using the scavenger ethanol. However, hydrogen and other hydrocarbon products are formed with a very small ethanol consumption.

2.3. Step 3: Ethanol Photoregeneration

During the 165 runs developed, a consistently small overall ethanol consumption was observed. This can be explained given that palladium is one of the strongest C-C coupling catalysts and can also form C2H5OH via CO photoreduction during the water splitting reaction as follows [19]:
  • CO molecules are strongly adsorbed onto a Pd-TiO2 surface until a second CO is available for C-C coupling.
  • Due to the reduced band gap of the photocatalyst (2.51 eV), electrons jump from the valence band to the conduction band and are trapped by the palladium.
  • The photogenerated electrons are used to activate and reduce the CO, which lead to ethanol formation via hydrogenation.
Thus, the following reaction mechanism towards ethanol photoregeneration can be postulated as [20]:
(a)
C-C coupling involves electron transfer, with this leading to the formation of the *C2O2-intermediate.
(b)
Once the *C2O2-intermediate is generated, hydrogenation, electron transfer takes place, with the *C2O2H yielding to ethanol.
2   CO   e   C 2 OO       H + + e     C 2 O 2 H   H + + e         C 2 O + H 2 O H + + e       C 2 OH   H + + e   C 2 HOH     C 2 HOH   H + + e   C 2 H 2 OH H + + e   C 2 H 3 OH   H + + e   C 2 H 4 OH   H + + e   C 2 H 5 OH
Thus, various reaction steps in Equation (12), may lead altogether to ethanol synthesis as:
2 CO + 8 H Pd / TiO 2   C 2 H 5 OH + H 2 O
In summary, ethanol consumption and ethanol formation steps may coexist during hydrogen formation. It is the goal of the present study to clarify the relative importance of the above-described reaction steps, as shown in Equations (1)–(13).

3. Results and Discussion

3.1. Photocatalytic Hydrogen Production under Near-UV Light and Visible Light

The palladium-doped TiO2 photocatalyst of the present study was specially developed to enhance hydrogen production while compared to a previously studied undoped mesoporous TiO2 [14]. Figure 2 reports a cumulative hydrogen of 5055 μmoles, equivalent to a volume of 113 cm3 STP (standard temperature and pressure) after six hours of near-UV irradiation, when using a 0.25 wt.% Pd on TiO2. This photocatalyst (designated as Pd-TiO2-nUV) yields at reaction conditions of 0.15 g L−1, 2.0 v/v% of ethanol, and initial pH = 4 ± 0.05. The 5055 μmoles of H2 produced using a 0.25 wt.% Pd-TiO2-UV, after 6 h of reaction, are very favorable compared to the 1927.8 μmoles obtained when using undoped TiO2 and the 696.7 moles of H2 acquired with using the commercial DP-25 TiO2 This hydrogen volume is equivalent to almost 300% the hydrogen volume obtained with the undoped mesoporous TiO2 [14].
Figure 2 shows that the Pd-TiO2-nUV photocatalyst displays a stable linear trend, with a consistent zero-order kinetics, with photocatalytic activity remaining unchanged during the 6 h of near-UV irradiation. This photocatalytic activity for hydrogen formation takes place via an “in series-parallel” reaction mechanism, proposed via Equations (1)–(13). Furthermore, the resulting quantum yield expressed as the moles of H over the moles of photons absorbed is 13.7%, as reported recently [14].
The same Pd-TiO2 photocatalyst designated as Pd-TiO2-VIS was evaluated further in the PCW-II reactor as follows: (a) photoreduction phase: near-UV light radiation was used during the first run hour, (b) visible light phase: visible light irradiation was employed during the remaining 5 h of the 6-h run. The developed Pd-TiO2-VIS photocatalytic runs were conducted under the following conditions: 0.15 g/L of catalyst concentration, 2.0 v/v% of ethanol, and initial pH = 4 ± 0.05.
Regarding the Pd-TiO2-VIS photocatalyst, Figure 3 shows that during the first near-UV light photoreduction hour, the Pd-TiO2 photocatalyst yielded 979 μmoles of hydrogen. This was followed by an extra 314 μmoles of hydrogen produced during the 1–6 h period, under visible light. This yielded 1292 μmoles of hydrogen in total, with this being equivalent to a 29 cm3 STP. One should note that the 314 μmoles of extra hydrogen formed between hour 1 to hour 6 compares very favorably with the 46 μmoles of hydrogen produced exclusively with 5 h of visible light, using an undoped TiO2 photocatalyst and the 141.2 μmoles of H2 acquired with the commercial DP-25 TiO2. Thus, this re-presents, altogether, a 76% hydrogen production increase, using the Pd-TiO2-VIS in the PCW-II Reactor.
One can note that the Pd-TiO2-VIS photocatalyst displays, as shown in Figure 3, and after the first hour of near-UV irradiation, a linear cumulative hydrogen formation. This is consistent with a zero-order kinetics and unchanged photocatalytic activity. Thus, the Pd-TiO2 photocatalyst shows a positive performance for hydrogen production, likely diminishing electron–hole pair recombination, and consequently contributing to higher hydrogen yields under both near-UV and visible light irradiation.

3.2. By-Products Formation

Regarding the carbon containing products formed, the improved TiO2 photocatalyst with Pd led to (a) photoreduction of H radicals to produce methane and ethane, and (b) photooxidation of OH radicals to form CO, CO2, and acetaldehyde. Thus, both the reduced and oxidized generated carbon containing species, as described in Figure 4 and Figure 5, can be used to support the mechanism given by Equations (3)–(10).
Carbon balances can be used to validate the mechanistic steps leading to carbon containing species formation from photocatalytic hydrogen formation. Carbon balances must include both ethanol and formed products (methane, ethane, ethylene, carbon dioxide, carbon monoxide, and acetaldehyde). Figure 6 reports a 99.8% typical element carbon balance closure for experiments developed using 0.25 wt.% Pd-TiO2-nUV.
Figure 6 considers (a) 4.10 × 10⁶ μmoles of carbon in ethanol, at the beginning of the run, and (b) 4.09 × 10⁶ μmoles of carbon, accounting for the remaining moles of ethanol and all by-products formed after 6 h of near-UV irradiation. Note that the by-products represent only 0.06% of the total carbon present, at the end of the irradiation period, accounting for 2400 μmoles. Thus, one can establish that the photocatalytic experiments take place under close to constant ethanol scavenger concentration. This minor overall ethanol consumption is attributed to ethanol photoregeneration, as shown in Equations (12) and (13). Appendix A provides additional details about the elemental carbon balances.
Figure 7 further reports a similar elemental carbon balance calculation, including all carbon containing species, using the 0.25 wt.% Pd-TiO2-VIS photocatalyst. From the 3.92 × 10⁶ μmoles of carbon contained in ethanol, 3.74 × 10⁶ μmoles of carbon were detected in products after 6 h. This provided a 95.4% carbon balance closure and 2688 μmoles of carbon containing in products or 0.07% of the total carbon. This shows once again that under the conditions studied, ethanol, while being important in acting as an OH scavenger, remains at “quasi-constant” concentration during the entire run.

3.3. H and OH Radical Group Balance

While considering the various reaction steps described via Equations (1)–(13), it is important to clarify the role of the OH and H radicals. In this regard, the concentration of the OH and H radicals measured during a run can be stated to be the consequence of a net balance between their formation and consumption, with this leading to various oxidation and reduction products.
More specifically, the formation of OH radicals is the result of OH- ion and h+ site interactions, as described in Equation (1). H radicals are generated, as the outcome of a H+ ion accepting an electron, as shown with Equation (2). Thus, if the mechanism proposed here is sound, there must be a balance of OH and H formed. To thoroughly test this assumption, the following can be considered:
  • The H radicals formed can be calculated via the accounting of the experimentally obtained hydrogen, as postulated in Equation (2), and via the hydrogen consumption required by the synthesis of various reduced products (methane, ethane), as given by Equations (8) and (9).
  • The OH can be quantified by considering the OH radicals consumed, according to their stochiometric requirements from several oxidation reactions, as given by Equations (3)–(6) and (11). Thus, the OH consumption should account for acetaldehyde, carbon monoxide, carbon dioxide, and hydrogen peroxide species.
On this basis, Table 1 reports the calculated total moles of H and OH formed, during the water splitting photocatalytic reaction, under both near-UV and visible light, accounting exclusively for Equations (2)–(10).
Table 1 reports, in this regard, a significant imbalance between the moles of H and the moles of OH radicals consumed, with only 21.3% of the moles of OH radicals contributing to the formation of by-products under near-UV light. On the other hand, under visible light, 89.4% of the total moles of OH radicals led to carbon containing oxidation by-products. Thus, under both near-UV and visible light, the proposed redox mechanism, as postulated via Equations (2)–(10), for the total moles of H and OH, is deficient in the moles of OH radicals consumed. Thus, further adjustments of the moles of OH radicals reacted are required, as considered in Section 3.3.1 and Section 3.3.2 of this manuscript.

3.3.1. Further Establishing of the Total OH Formed during Photocatalytic Hydrogen Production

Regarding hydrogen peroxide species under near UV, they are considered as the net result of the rate of OH dimerization, as shown in Equation (11), and the rate of H2O2 decomposition as explained later via Equation (14). To account for the H2O2 formation during the photocatalytic hydrogen production, liquid samples were periodically analyzed using a colorimetric method. As reported in Figure 8, during 6 h of near-UV irradiation, the hydrogen peroxide concentration consistently increased, with a maximum of 188.4 μmoles of H2O2 being obtained.
On the other hand, Figure 8 also shows that OH dimerization plays an important role, as described via Equation (11), under visible light irradiation. In this case, the reaction pathway involves H2O2, which is formed during the first hour of near-UV irradiation, with modest additional H2O2 formation during the five following hours of visible light.
Table 2 reports the cumulative OH consumption that leads to H2O2 formation. Hydrogen peroxide is detected in the liquid phase using both Pd-TiO2-nUV and Pd-TiO2-VIS. It can be observed that the OH consumption due to H2O2 generation only modifies the cumulative moles of OH by 1.8% and 3.4% of the total amount, respectively.
Furthermore, Pd-TiO2 may also adsorb chemical species including hydrogen peroxide [21]. This adsorption may affect the cumulative amount of OH moles consumed. Thus, to evaluate this effect, adsorption measurements lasting 60 min under dark conditions were effected [22].
Figure 9a describes the obtained Langmuir chemisorption isotherm (Qe = Qe,max KCe/1 + KCe), showing the H2O2 adsorption equilibrium concentration. Through Langmuir equation linearization (Figure 9b), the H2O2 adsorption parameters were calculated, for 0.25 wt.% Pd-TiO2, as shown in Table 3.
Table 2 reports both the adsorption constant, K, and the maximum adsorption capacity, Qe,max, for a hydrogen peroxide adsorption isotherm. The obtained Qe,max differ from the one reported by Sahel [23], who found a Qe,max = 7.48 mg−1 L value for a undoped TiO2 photocatalyst. This value is lower than the 11.1 mg−1 gcat maximum adsorption capacity reported in our study. The higher Qe,max of the present study, can be justified given the higher surface area of the palladium photocatalyst (131 m2 g−1), with pore sizes in the 16–20 nm range. The surface area is almost three times larger than the one reported by Sahel, where the TiO2 surface area was only 50 m2 g−1 [23].
Thus, it can be established that there is an extra 45% of hydrogen peroxide formed and adsorbed on the photocatalyst. On this basis, the μmoles of OH consumed during the runs can be revised, as shown in Table 4.
Table 4 data also show that the addition of the adsorbed H2O2 species accounts for 0.82% for Pd-TiO2-nUV and 1.52% for Pd-TiO2-VIS, in the context of H and OH mole balance only. Thus, there is still a significant deficiency of calculated OH radicals consumed and H radicals produced that must be accounted for.

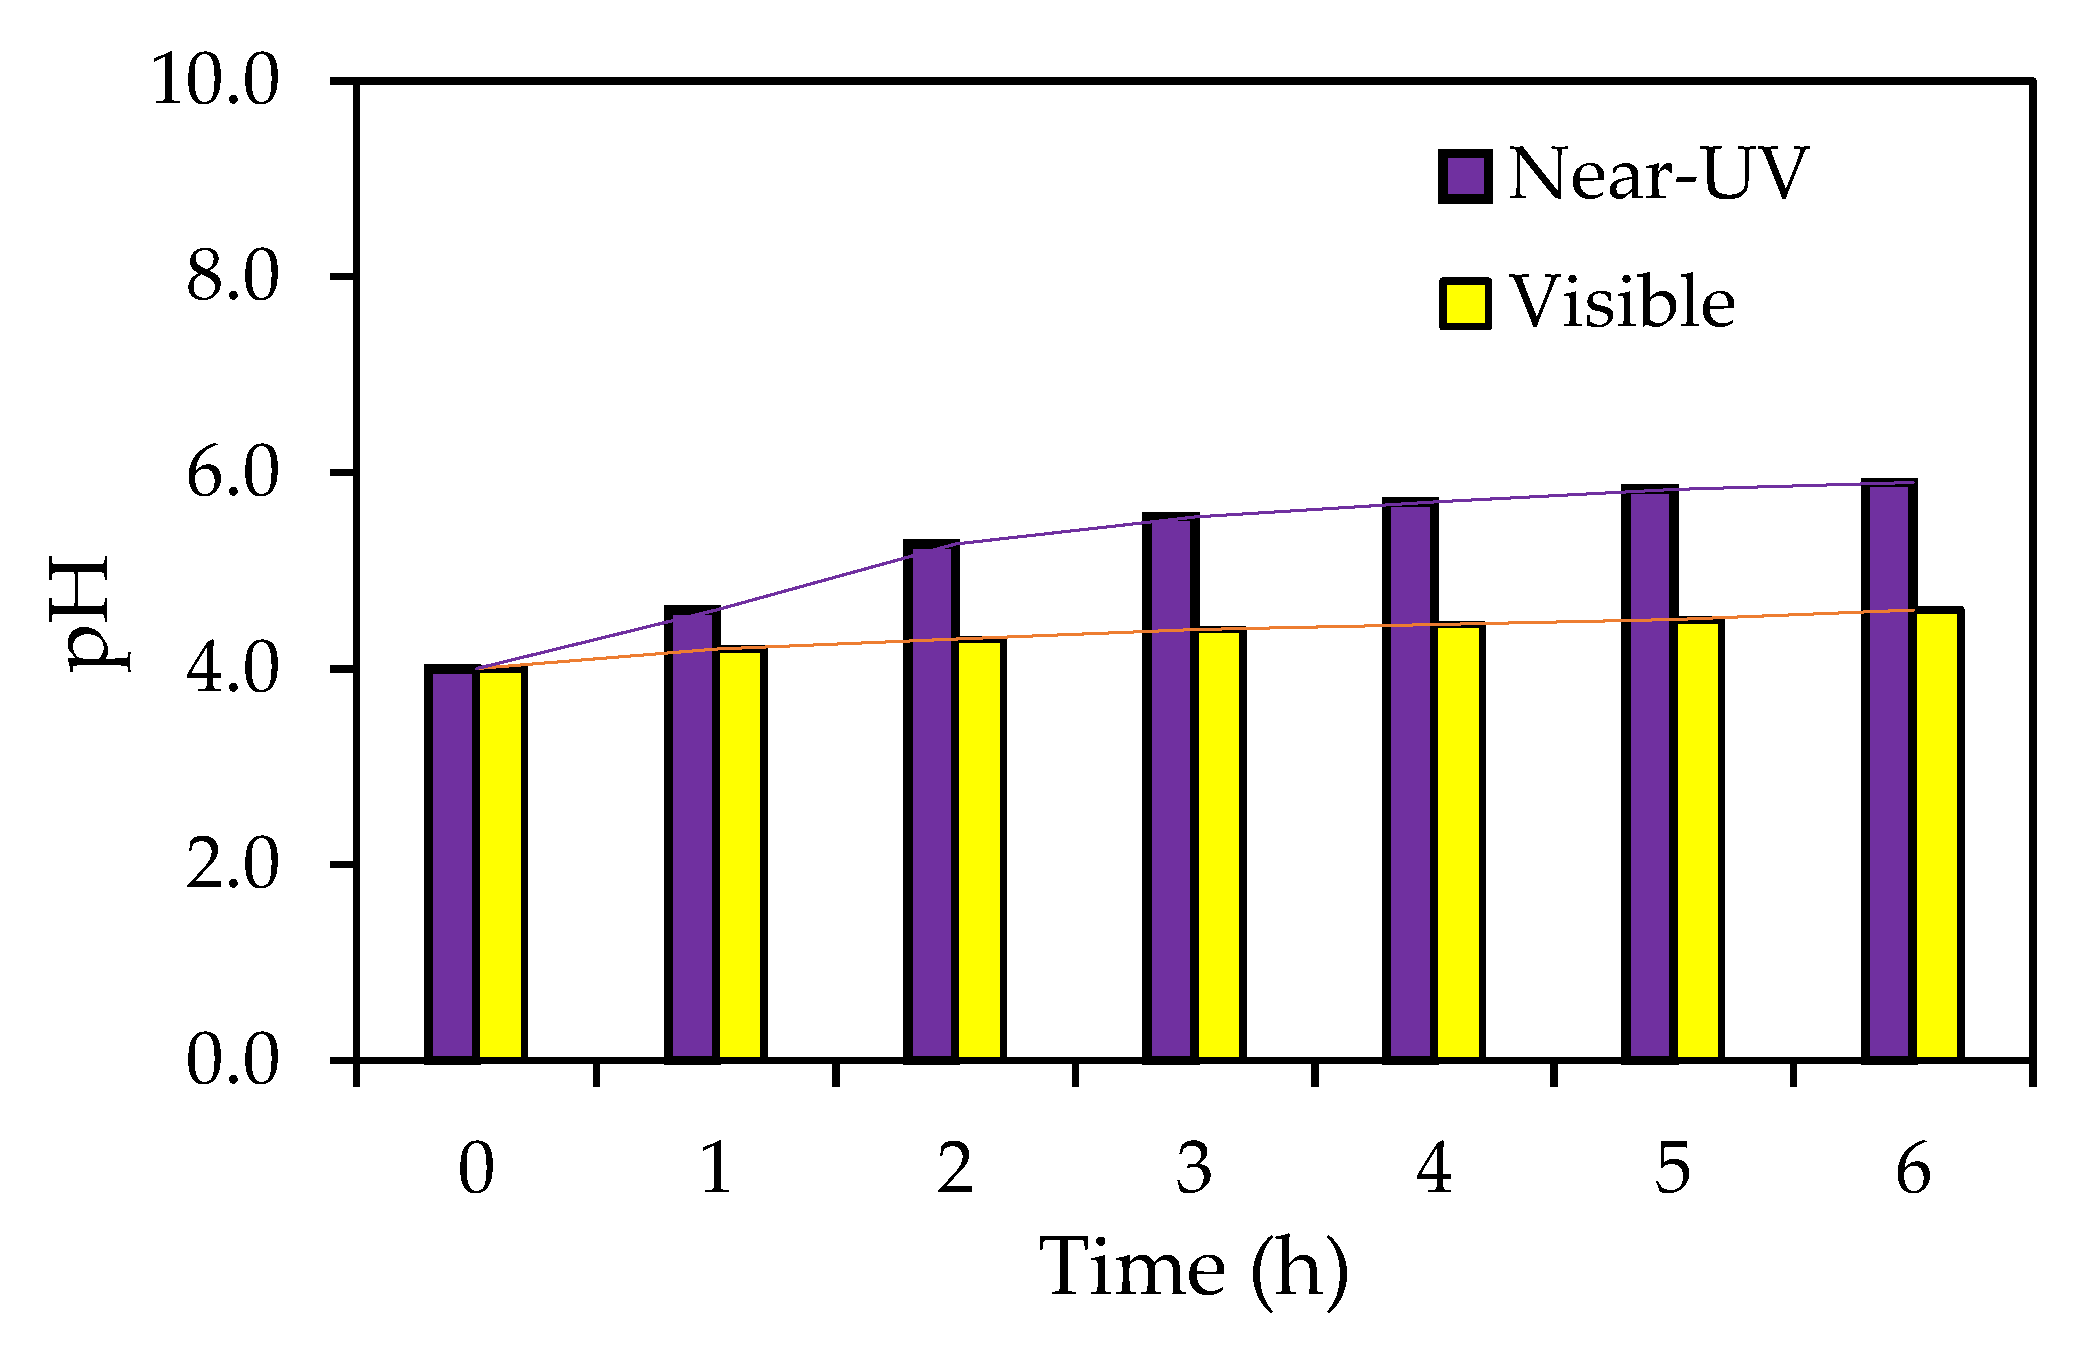
3.3.2. pH Influence on the Photocatalytic Reaction

In the water splitting reaction for hydrogen production, an important factor that should be considered is the pH of the solution. This is the case given its influence on the process efficiency [24]. The redox reactions take place via hydrogen formation due to the combination of excited electrons and H+ protons adsorbed on the photocatalyst. It was proven in this respect that hydrogen production is favored in acidic conditions, due to availability of dissolved H+ ions [25].
During the photocatalytic water splitting reaction using the Pd-TiO2, there is a significant change of pH with irradiation time, as shown in Figure 10. At the beginning of each experiment, the pH of the water–ethanol solution was set at 4.0 ± 0.005 [26]. Upon completion of the photocatalytic reaction, the pH increased to 5.89 ± 0.005 under near-UV light and to 4.60 ± 0.005 under visible light. Thus, in the case of the Pd-TiO2-nUV, it was noticed that a pH of 6 and the TiO2 isoelectric point were reached [27].
The reported pH variation might be attributed to an electron exchange between the photocatalyst and the split water molecules. An electron can be donated by the photocatalyst surface, in order for the active sites on the Pd0 to yield HO and OH ion free radicals [28]. Furthermore, it can be hypothesized that a fraction of the pH change can occur due to H2O2 decomposition. One can consider that for both the Pd-TiO2-nUV and Pd-TiO2-VIS, the near-UV irradiation leads to the following chain of reactions:
Pd 2 + + 2 H 2 O 2 n U V Pd 0 + 2 H + + 2 HO 2
HO 2 H + + HO 2
2 HO 2   2 HO + O 2
One should note that in this postulated pathway, the photocatalyst accepts electrons, with the Pd2+ ion sites yielding a HO2 radical, as described in Equation (14). This HO2 radical gives OH ions via Equations (15) and (16) [28].
Thus, the total moles of OH radicals consumed can be revised further, accounting for the change in pH. Table 5 and Figure 11a and Figure 12a show that the accounting of the cumulative moles of OH consumed via a pH change provides a 97–99% balance of the moles of H formed and the moles OH consumed while using Pd-TiO2-nUV and Pd-TiO2-VIS.
Figure 11b and Figure 12b also show that these consistent balance of H and OH μmoles were also observed at various other irradiation times, providing significant strength and validation to the photocatalytic reaction involving both Pd-TiO2-UV and Pd-TiO2-VIS. Appendix B provides additional details of the H and OH mole balance calculations.
Thus, and given the reported results and the various described considerations, the following mechanistic steps can be considered for water splitting:
(a)
H2 is a main product from the photocatalytic water splitting reaction using ethanol as an organic scavenger and a 0.25 wt.% Pd-TiO2-nUV or alternatively, a 0.25 wt.% Pd-TiO2-VIS.
(b)
Formed photoreduction species (methane, ethane) and photooxidation species (CO2, acetaldehyde) are all important carbon containing by-products.
(c)
Hydrogen peroxide, present in the liquid phase, is formed and adsorbed on the photocatalyst during water splitting.
(d)
OH species in the water solution progressively increase with irradiation time, with this leading to a pH increase.

4. Experimental Methodology

4.1. Photocatalyst Synthesis

The photocatalyst was synthesized by using the evaporation induced self-assembly (EISA) Method. The semiconductor was prepared using a polymeric template (pluronic F-127 (PEO106PPO70PEO106), a titanium-based compound (titanium IV isopropoxide), a noble metal (PdCl2) precursor, ethanol USP (C2H5OH), hydrochloric acid (HCl, 37% purity), and anhydrous citric acid. All the reagents were purchased from Sigma Aldrich Co (Oakville, ON, Canada).
Following the sol–gel methodology, micelles and a mesoporous structure were formed. First, 400 mL of ethanol, 33 g of hydrochloric acid and 20 g of Pluronic F-127 were mixed together. Then, 6.30 g of citric acid were added in 20 mL of water, for posterior addition to the initial suspension. Then, 28.5 g of titanium (IV) isopropoxide was dissolved in ethanol and added dropwise to the mixture. Finally, palladium (II) chloride was incorporated. The sol–gel suspension was stirred for 24 h. The removal of the template occurred during the calcination step, at 500 °C, to subsequently create a mesoporous structure with a homogenous dispersion of the palladium nanoparticles [14]. More detailed information about the synthesis of the photocatalyst was presented in Rusinque et al. [15].

4.2. Photocatalyst Characterization

The photocatalyst was characterized using physico-chemical techniques such as nitrogen physisorption (BET), hydrogen chemisorption, X-Ray diffraction (XRD), temperature programmed reduction (TPR), and UV-vis spectroscopy.
The TiO2 doped with 0.25 wt.% palladium displayed a surface area of 131 m2 g−1, with pore sizes in the 16–20 nm range. When characterizing the photocatalyst with hydrogen pulse chemisorption, the fraction of dispersed Pd on the photocatalyst was 75%. The average size of the crystallites, which was determined using the Scherrer equation and the XRD peak broadening, was calculated to be 9 nm. The Pd reduction temperature was found to be above temperatures of 350 °C, which was an indication of strong Pd-TiO2 interactions. When using the 0.25 wt.% Pd-TiO2 photocatalyst, and following the Tauc plot methodology, the semiconductor yielded a 2.51 eV band gap, a smaller band gap than the 3.2 eV obtained from undoped TiO2. A more detailed characterization of the photocatalyst was presented in Rusinque et al. [14].

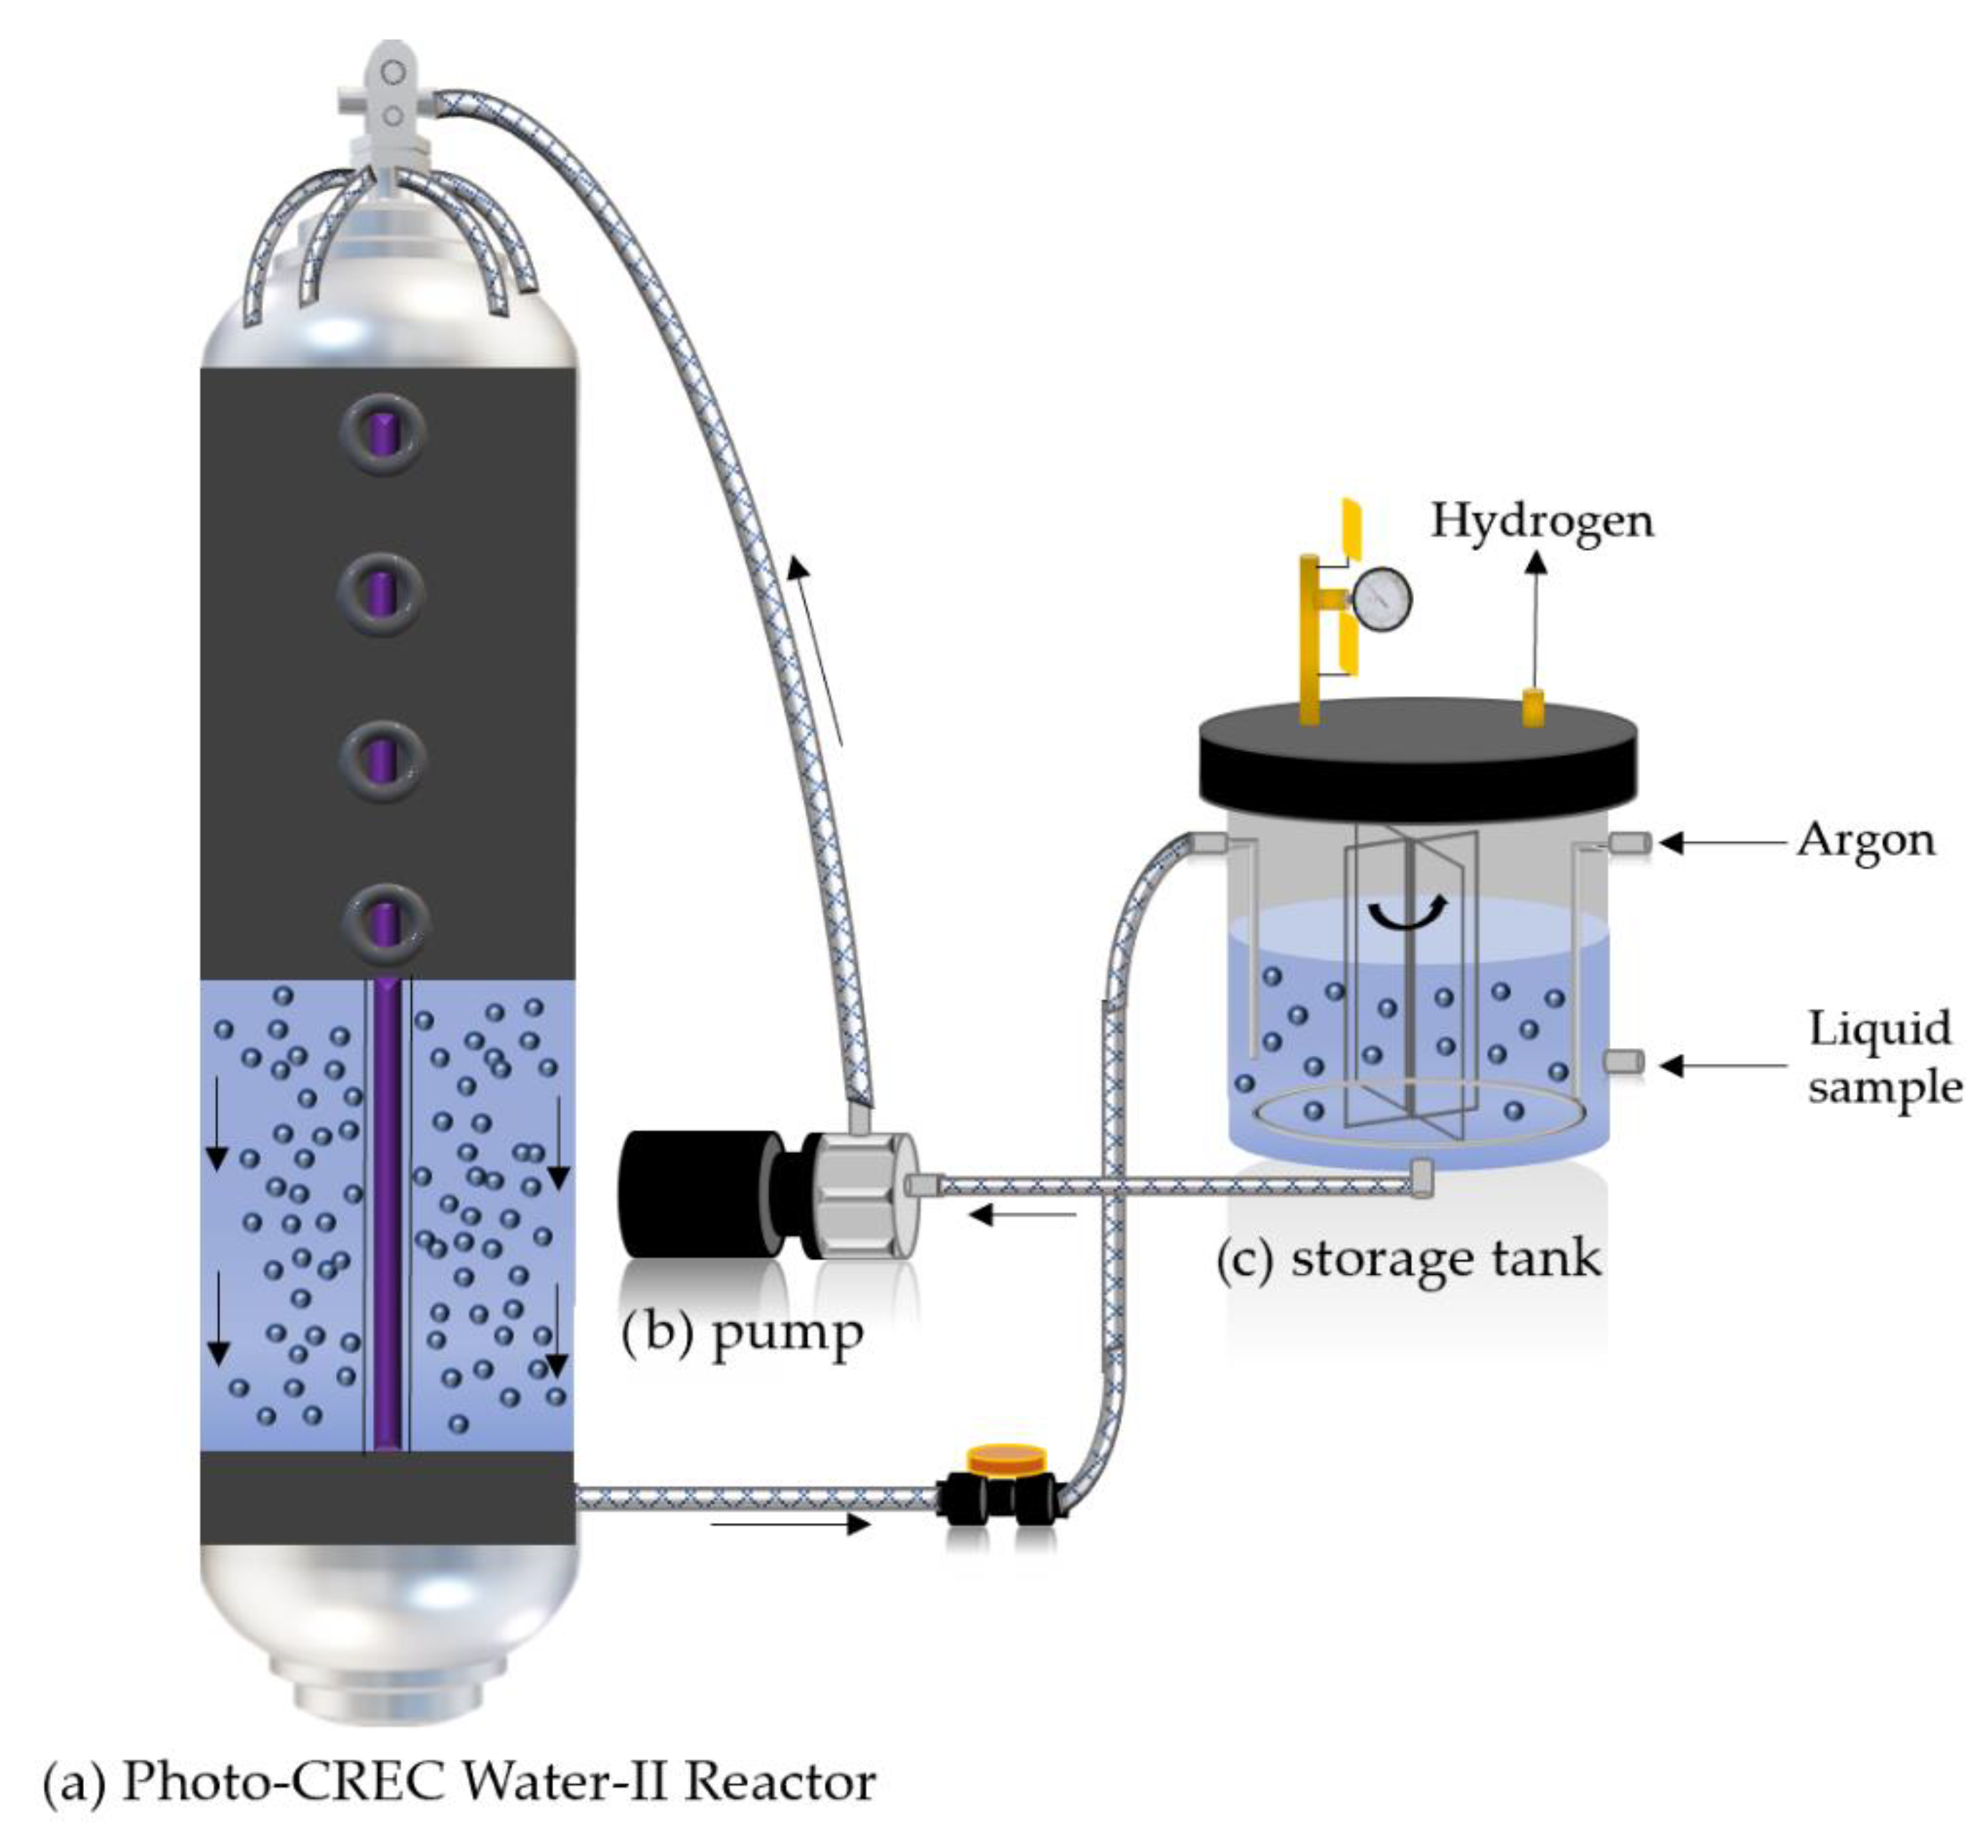
4.3. Photo-CREC Water-II Reactor

The Photo-CREC Water-II Reactor is a novel unit engineered to uniformly irradiate the surface area of a photocatalyst. This is a slurry batch piece of equipment that ensures that no internal and/or external diffusion transport phenomena takes place.
The PCW-II unit is equipped with a storage tank where the photocatalyst, water, and organic scavenger are loaded and are kept under agitation. This tank has two ports for liquid and gas phase sampling. Figure 13 describes the main components of PCW-II Reactor.
This reactor was designed and built with materials to provide the following: (a) uniform catalyst distribution, (b) a high surface/volume reactor ratio, (c) negligible catalyst fouling, (d) a high near-UV and visible light transmittance of 97%, (e) a well-mixed suspension, and (f) chemical and pH resistance.

4.4. Photocatalytic Experiments

The photocatalyst was evaluated using the Photo-CREC Water-II reactor with a BLB near-UV lamp or alternatively with a fluorescent visible light lamp. The hydrogen storage/mixing tank was loaded with 6000 mL of water and 0.15 g L−1 of 0.25 wt.% Pd-TiO2 photocatalyst. Ethanol was used as sacrificial agent, and the pH was adjusted at the beginning of the reaction to 4 ± 0.05 using H2SO4 [2 M].
Prior to the initiation of the experiment, 0.15 g/L of the 0.25 wt.% Pd-TiO2 photocatalyst was added to the solution with the following steps being considered: (a) 0.9 g in total of 0.25 wt.% Pd-TiO2 was mixed with 100 mL of water and subjected to sonication for a 10 min period, to ensure good particle distribution and avoid possible agglomeration; (b) once a thorough dispersion of the 0.25 wt.% Pd-TiO2 particles was achieved, the photocatalyst–water solution was added to the 6 L of water contained in the Photo-CREC Water-II Reactor, (c) Following this, the pump and lamp were turned on for 30 min prior to the reaction, allowing lamp stabilization and better photocatalyst dispersion in the liquid solution. (d) Finally, for 10 min, argon was used as an inert gas for oxygen removal, from the gas phase in the hydrogen storage tank.
Gas and liquid samples were taken every hour, for 6 h of continuous irradiation. For the experiments under visible light, an initial photoreduction step with near-UV light was considered. Before the reaction began, the photocatalyst was photoirradiated for one hour, with near-UV light, to achieve the further reduction of the catalyst. This approach was reported by Rusinque et al. [15].

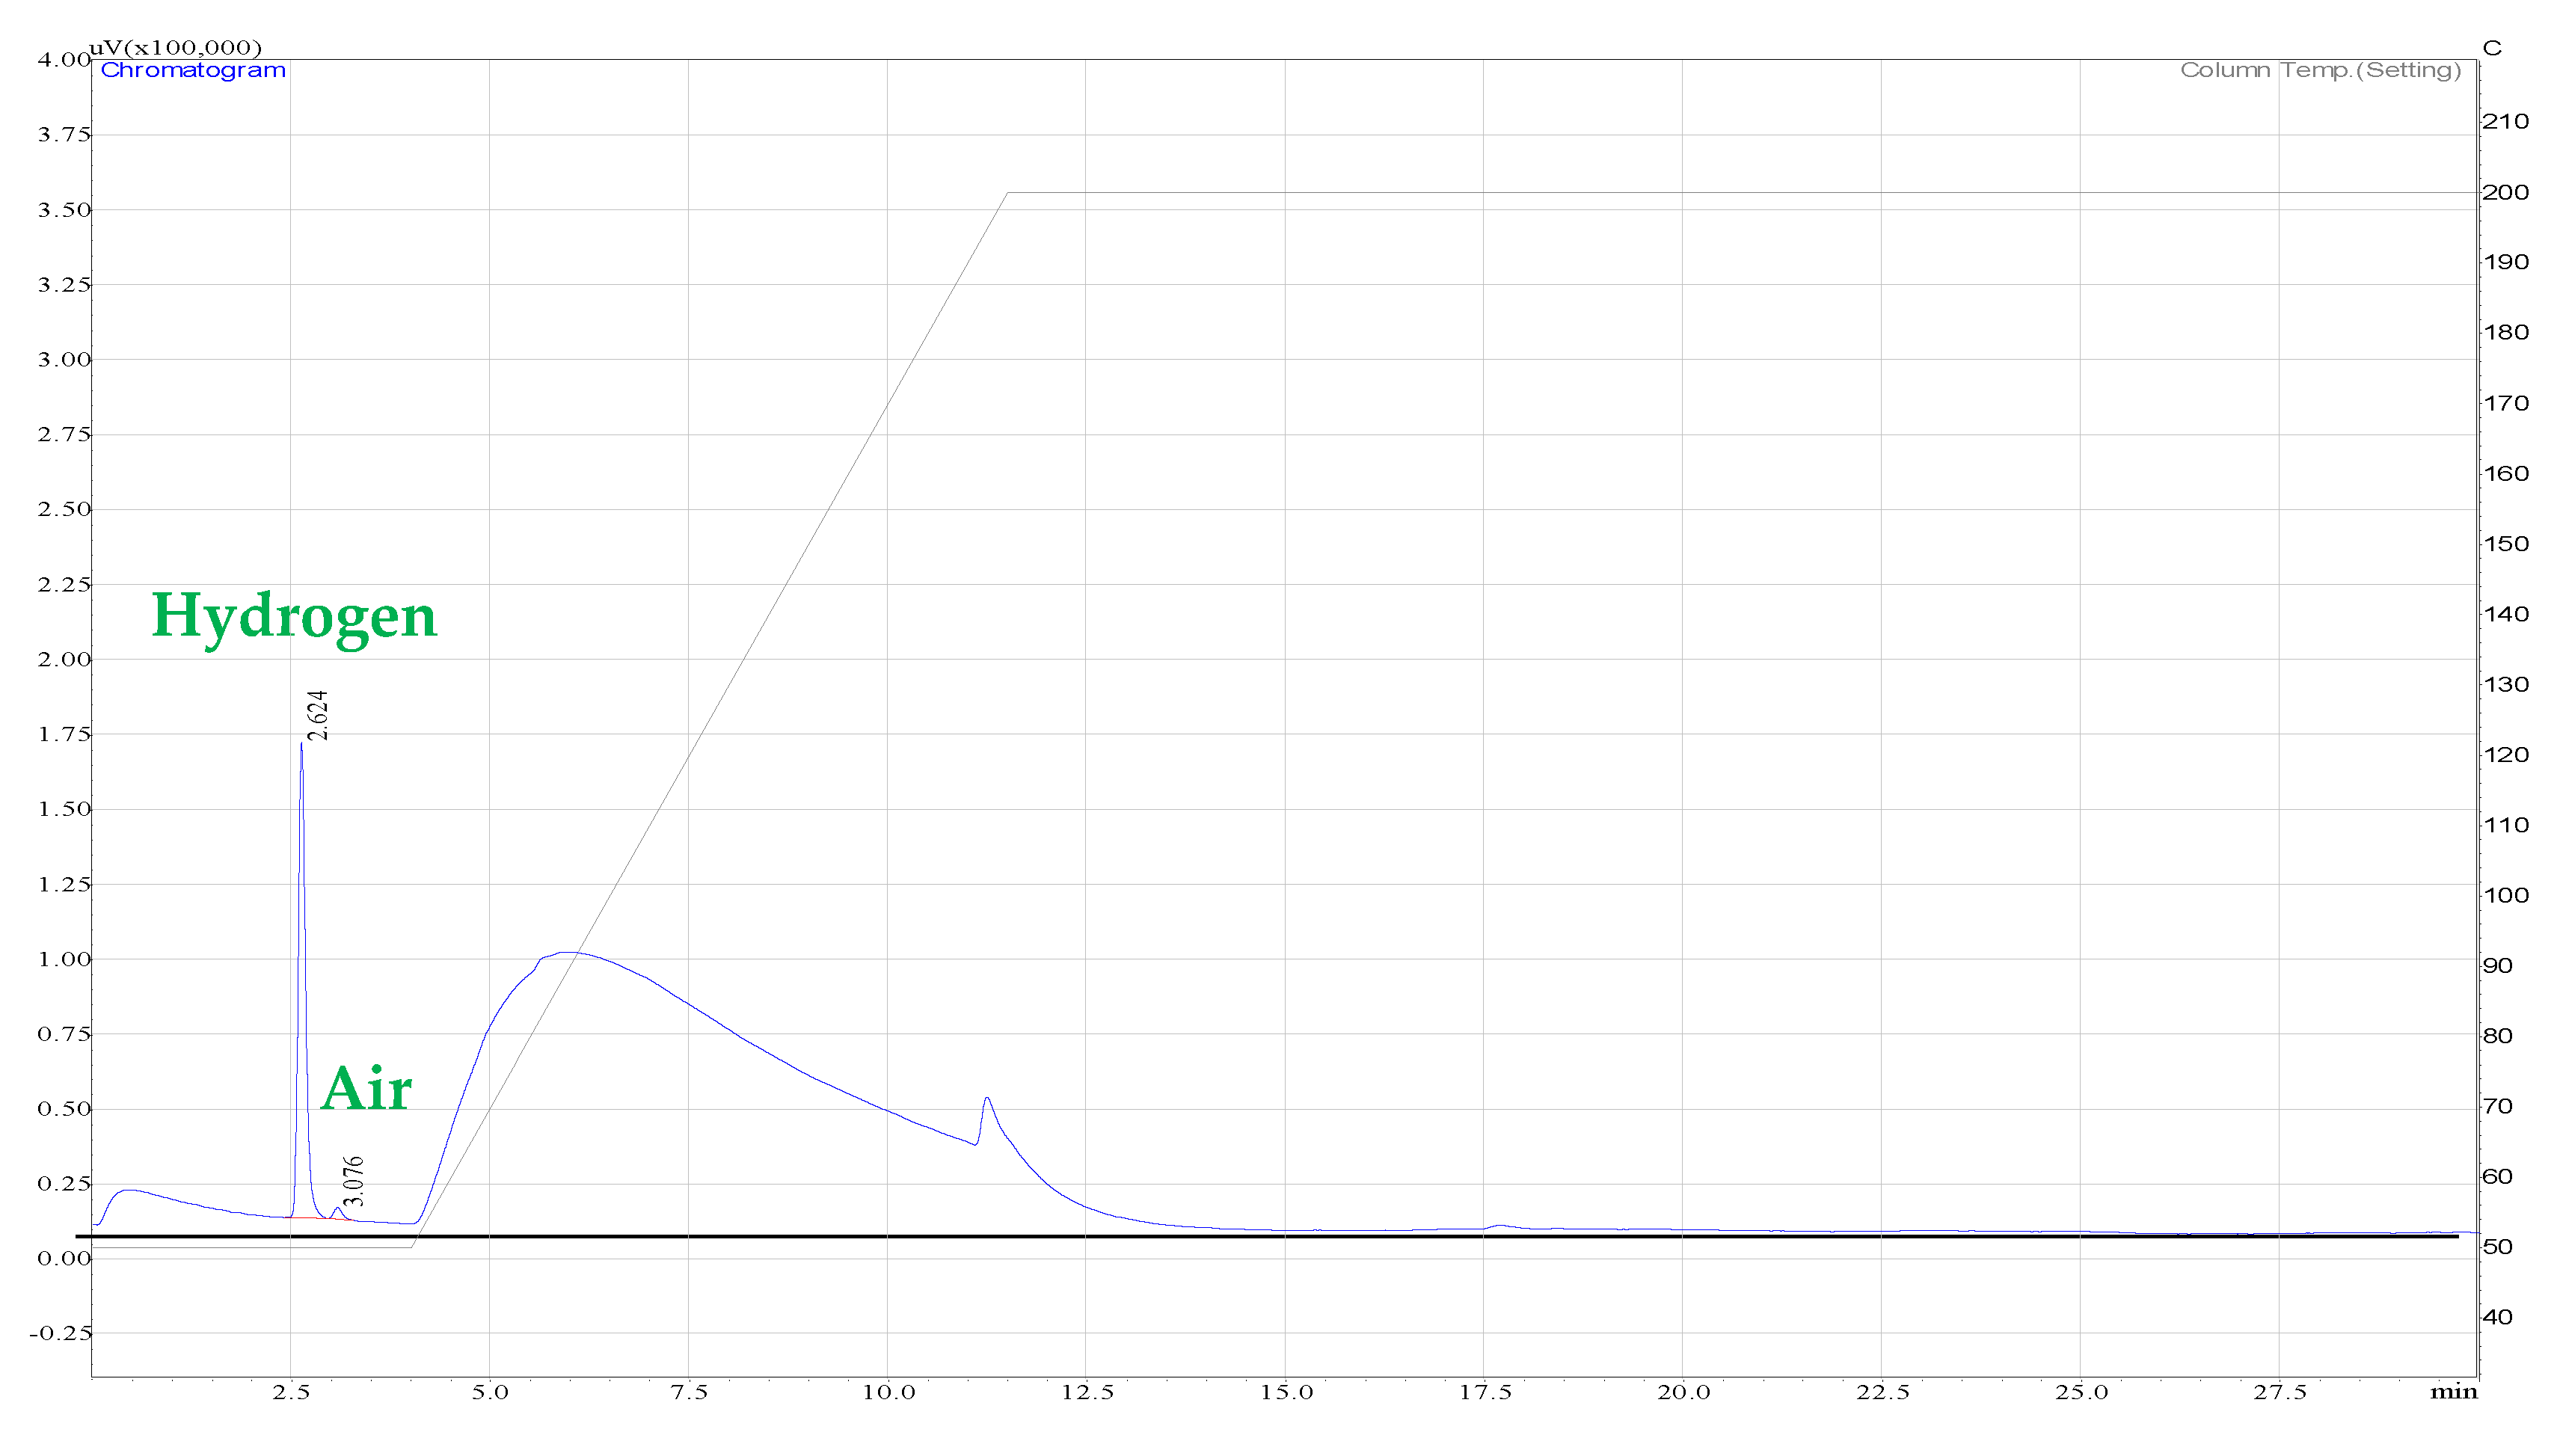
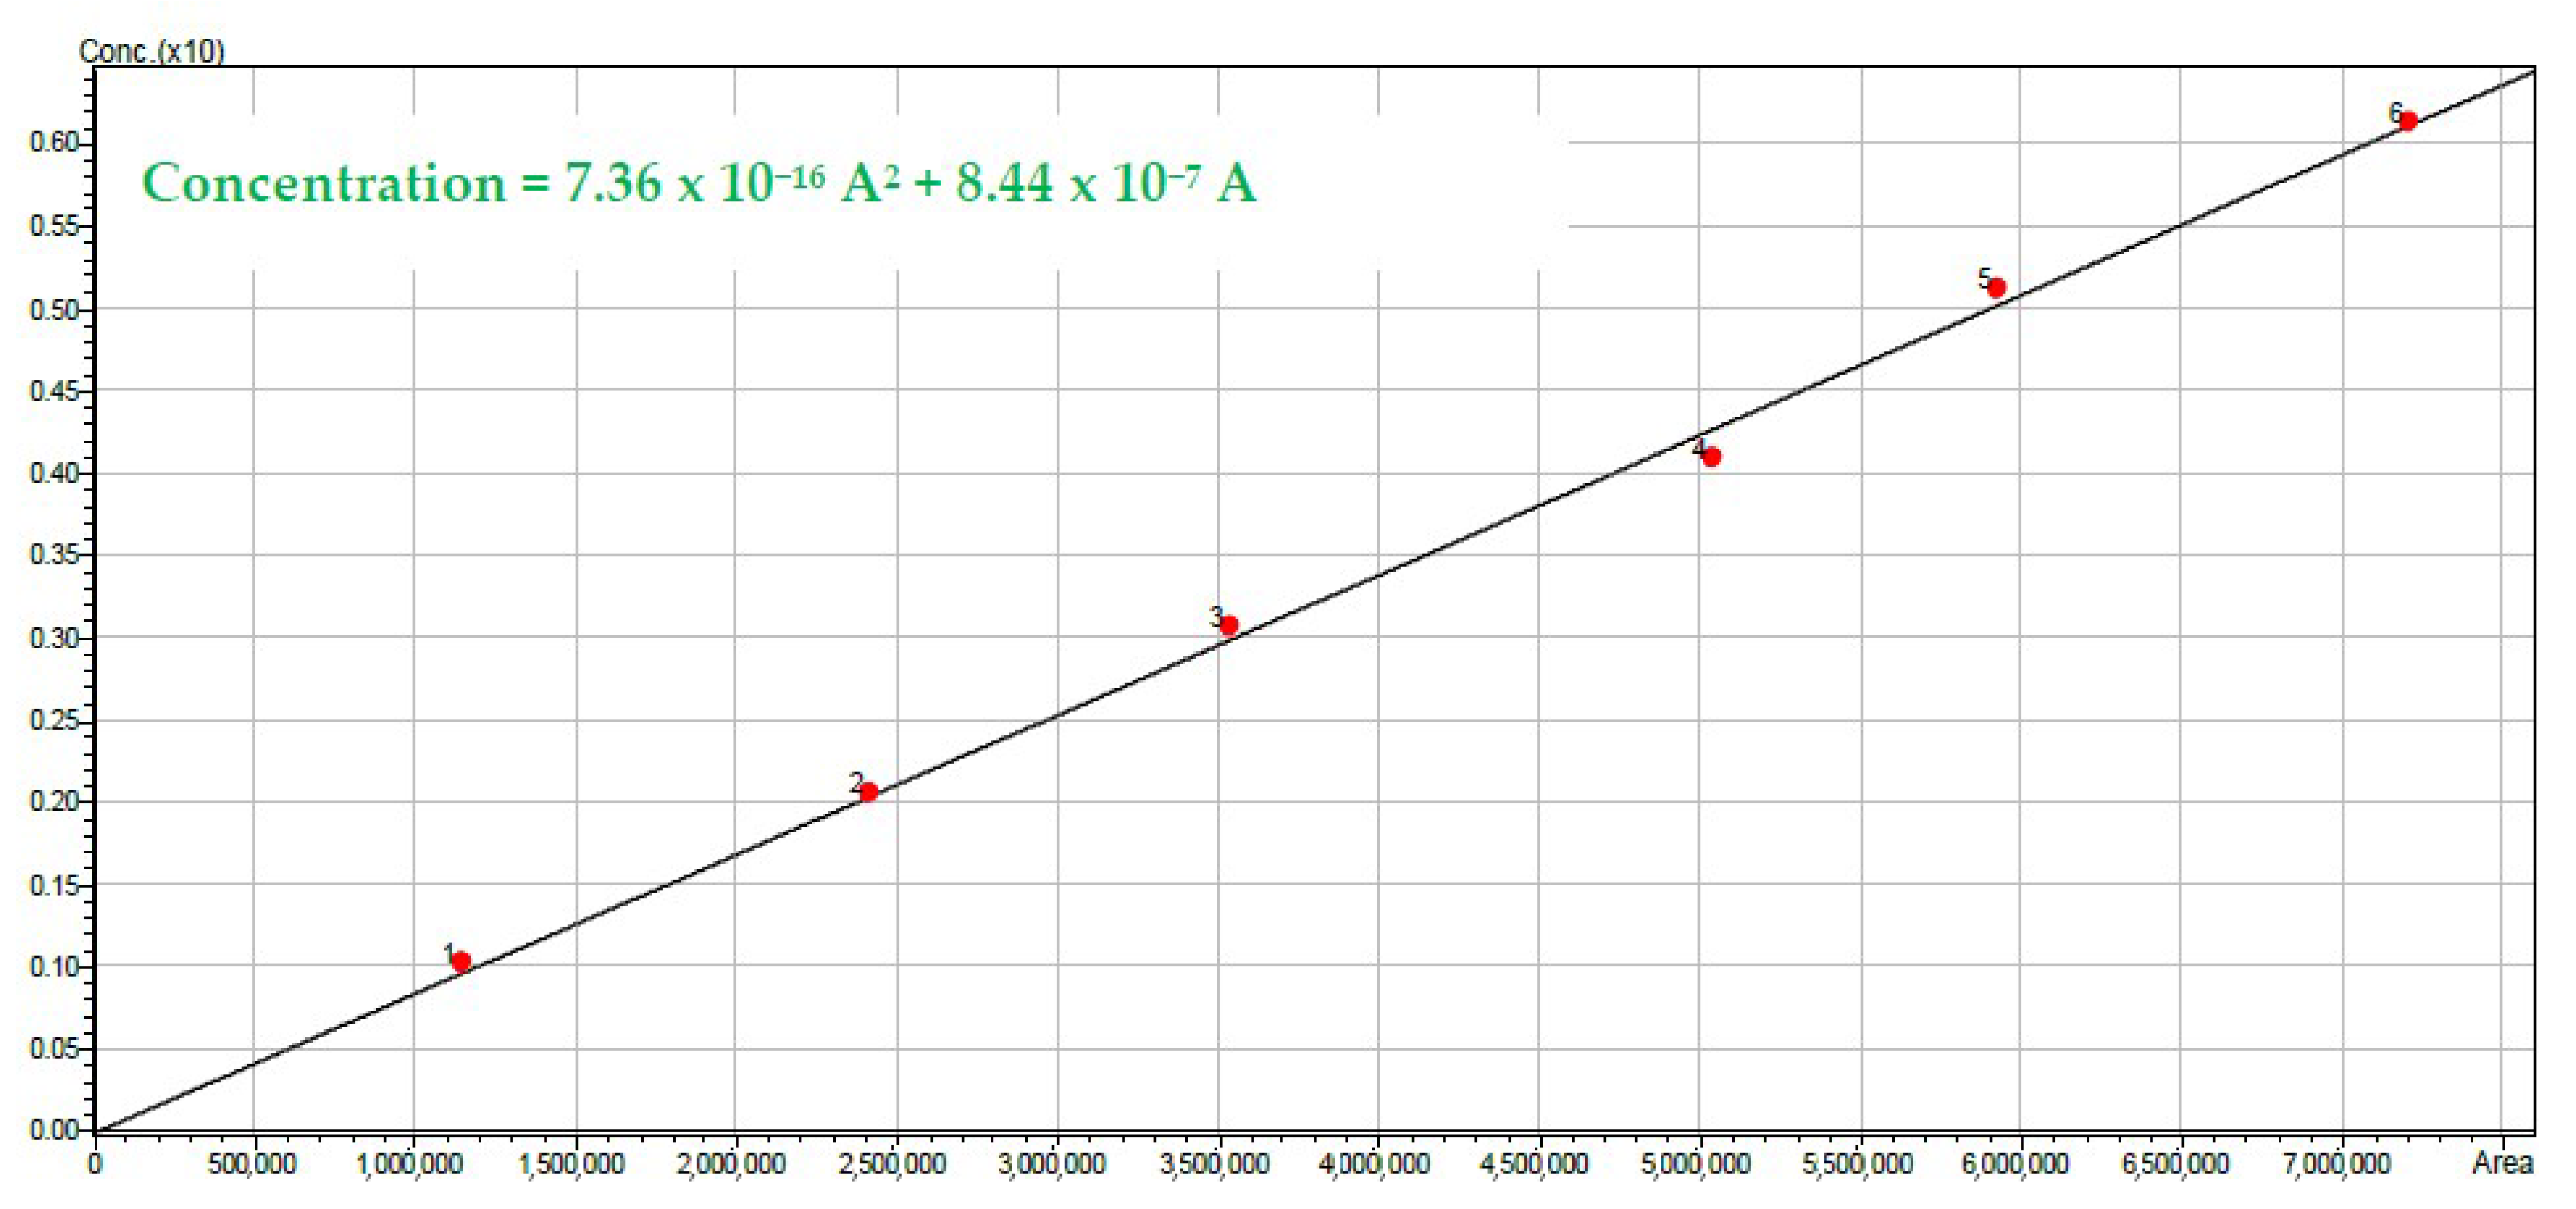
4.5. Analytical Techniques

The gas phase was analyzed with a Shimadzu GC2010 Gas Chromatograph Inc (Mandel, Guelph, ON, Canada) using argon (Praxair 99.999%) as a carrier gas. This unit was equipped with a HayeSepD 100/120 mesh packed column (9.1 m × 2 mm × 2 μm nominal SS) (Sigma Aldrich, Oakville, ON, Canada) used for the separation of hydrogen from air. Additional details and information regarding the GC analysis of the Pd-TiO2 photocatalyst are provided in Appendix C.
For the liquid phase, the Shimadzu HPLC Model UFLC (ultra-fast liquid chromatography) System was utilized using 0.1% H3PO4 as a mobile phase. This unit contains a Supelcogel C-610H 30 cm × 7.8 mm ID column. This quantitative analysis was performed by employing the RID (Refractive Index Detector) 10A due to the polar nature of ethanol. This HPLC separated ethanol from water for further quantification.
A colorimetric method was employed for the quantification of H2O2 at low concentrations (0–10 mg L−1 approximately). In the colorimetric method, iodide and N-dimethyl-p-phenylenediamine (DPD) were used to detect H2O2 during the photocatalytic reaction. The collected sample was mixed with ammonium molybdate that decomposes H2O2 in solution and with KI that oxidizes iodide to iodine [29]. Iodine posteriorly oxidizes the DPD compound, generating a pink color. The DPD compound was then measured using a spectrophotometer Spectronic 200+, Thermo Spectronic (Thermo Fischer, Mississauga, ON, Canada), which provides a 340 to 950 nm wavelength range and a nominal spectral bandwidth of 20 nm.
The hydrogen peroxide concentration was estimated using a linear calibration for 530 nm, considering the absorption spectra of the sample. All the reagents used for hydrogen peroxide detection were purchased from Hach® (London, ON, Canada). A commercial H2O2 technical-grade solution (30% w/w of H2O2) was supplied by BioShop Canada (Burlington, ON, Canada).

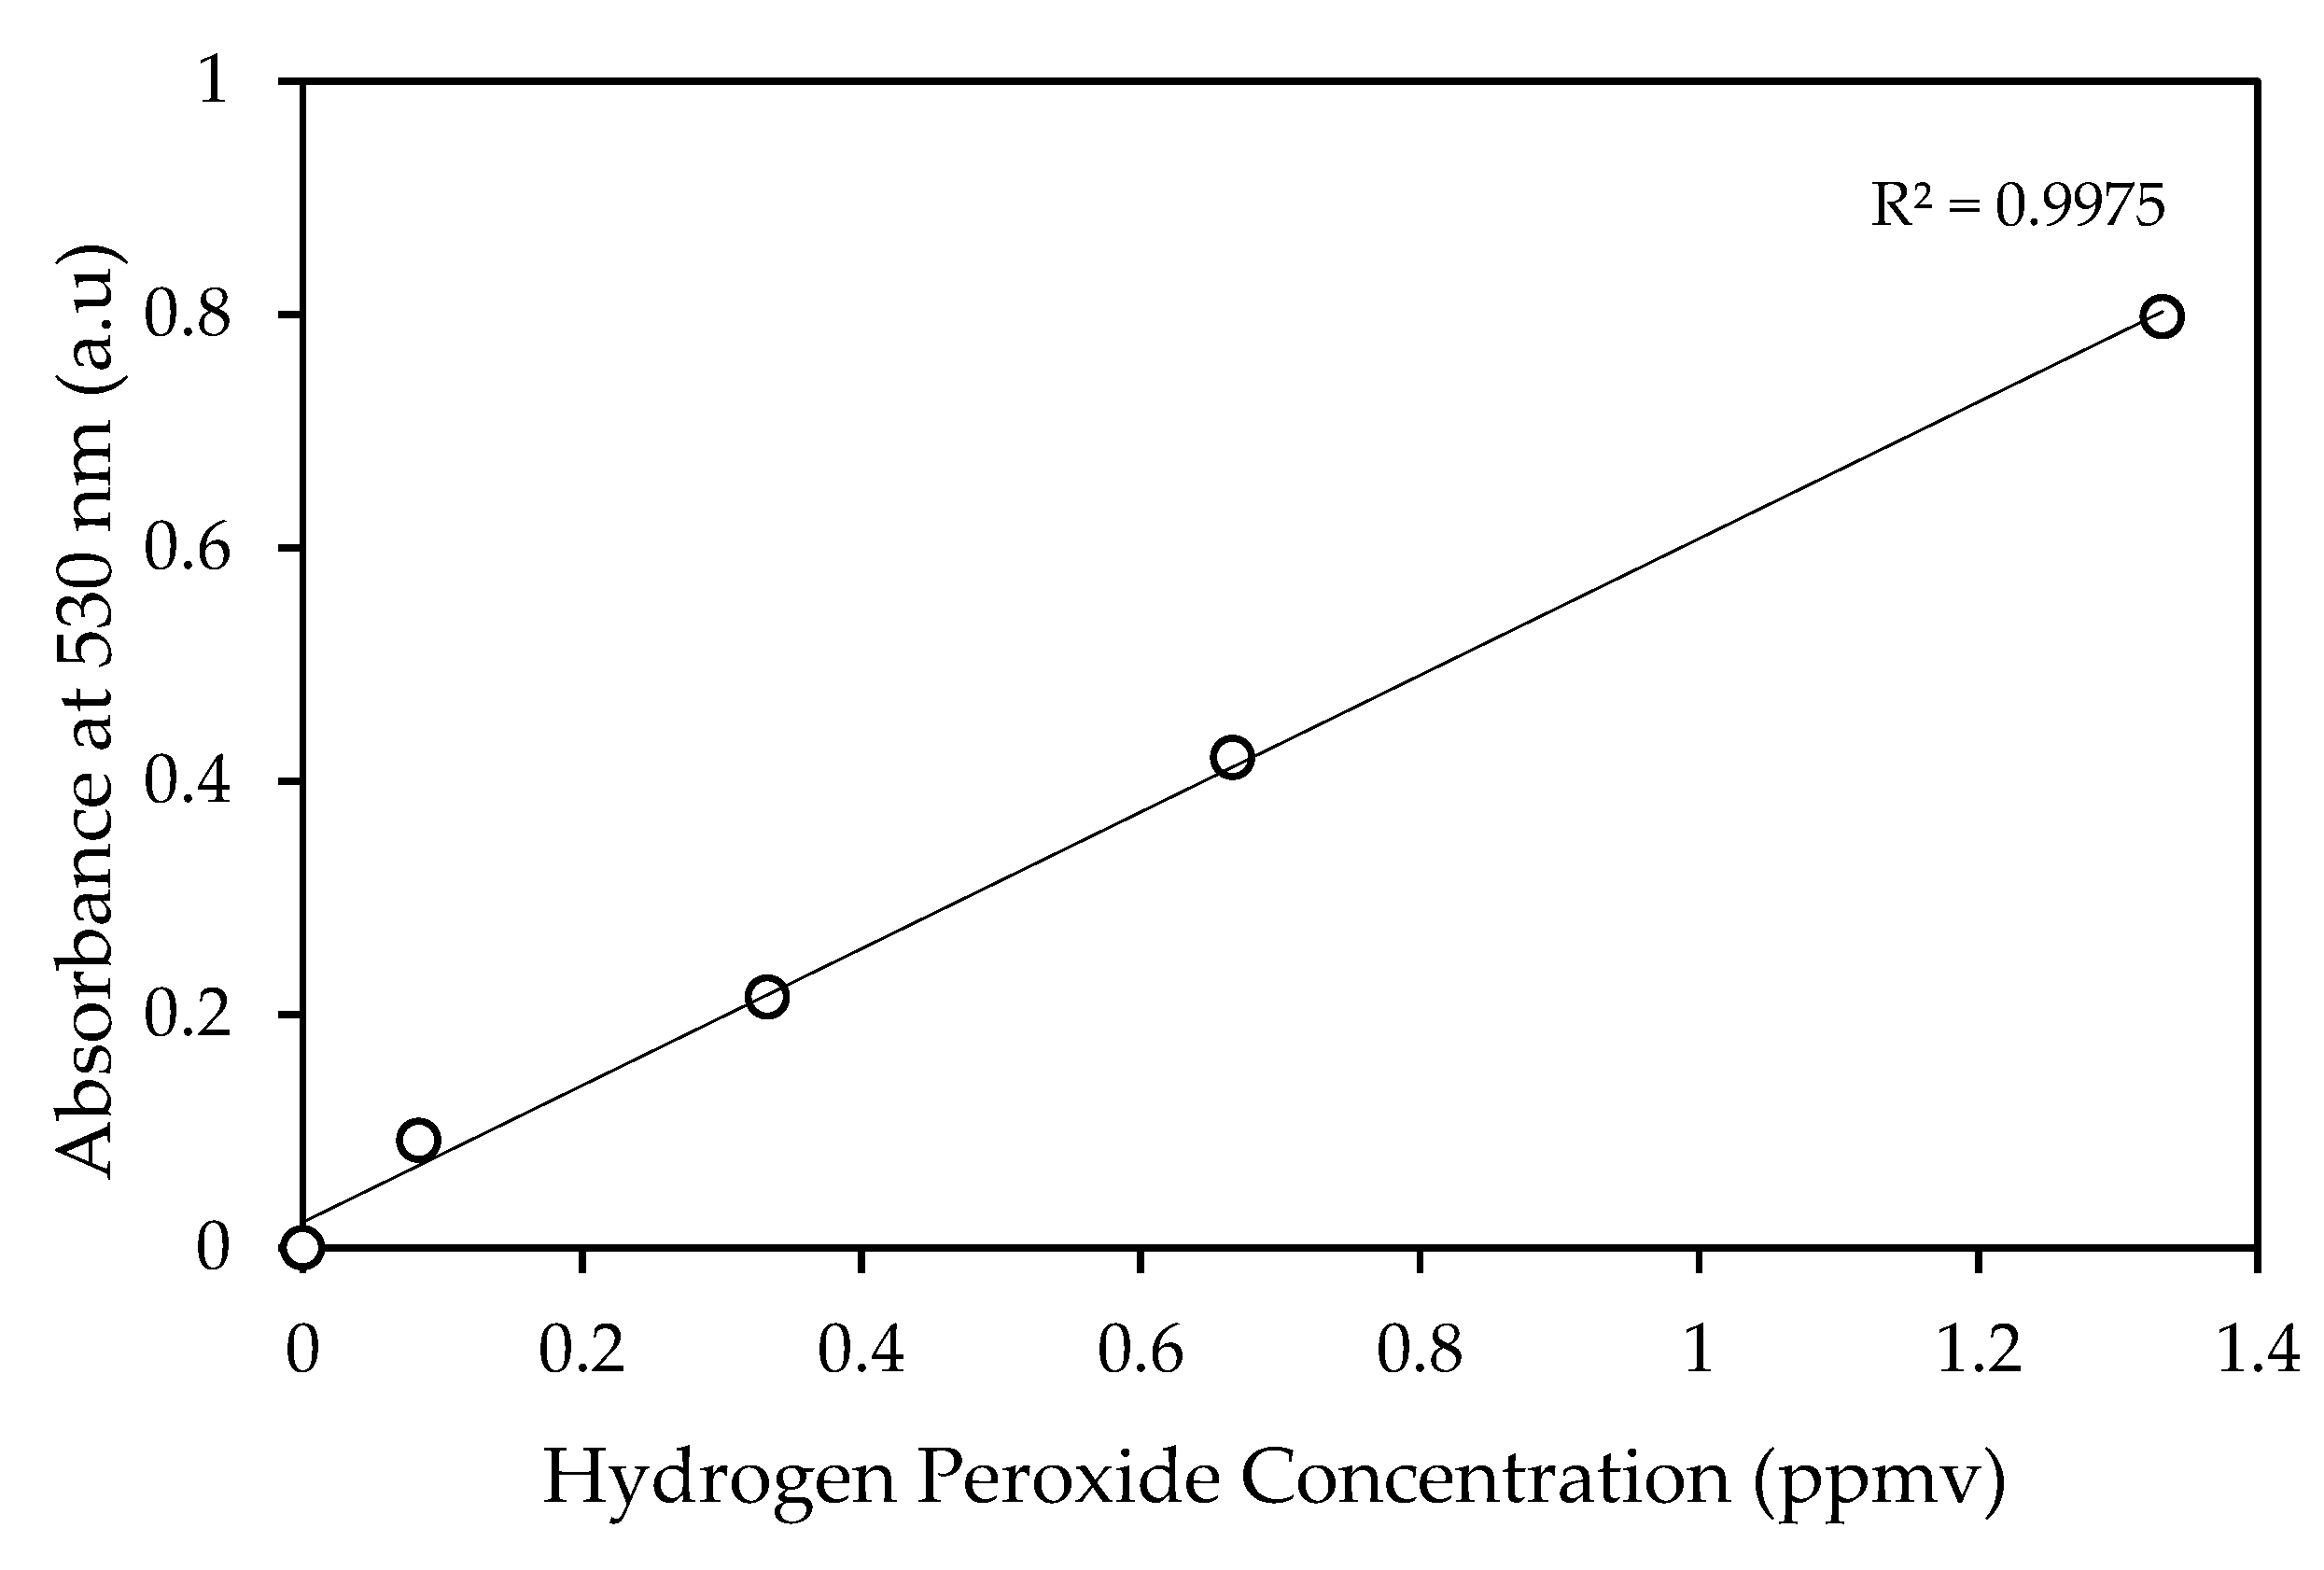
4.5.1. Determination of H2O2 Concentrations

To determine the amount of H2O2, 0.15 mL of KI solution (20%) and 0.15 mL of Mo(VI) solution (ammonium molybdate in sulfuric acid) were placed in a 10-mL sample. The volumetric flask was capped and shaken for proper mixing. After 6 min of reaction time, one pillow of DPD (bag of N, N-dimethyl-p-phenylenediamine), with a total of 25-mL of chlorine powder, was added to the prepared sample cell. A pink color developed, indicating the presence of H2O2. Subsequently, the sample was transferred to a quartz cuvette, and the absorbance was measured by a spectrophotometer (Spectronic 200+, Thermo Spectronic). The absorbance was obtained at 530 nm, in terms of total chlorine concentration ([Cl2]), and according to a calibration curve shown in Figure 14. This methodology allowed the quantification of H2O2 in the sample. Deionized water was used as blank.
The colorimetric and permanganometry methods were compared to determine the best approach for hydrogen peroxide identification, specifically for the present study. The permanganometric titration showed a standard deviation between 9–16%, whereas the colorimetric method displayed a standard deviation in the 1–3% range, for 0.1 to 1.3 mg L−1 H2O2 concentrations. Thus, it was proven that the colorimetric methodology provides more reliable results when measuring hydrogen peroxide concentrations.
Additional tests were performed to determine the accuracy of both methods (colorimetric and permanganometric), in the presence of an alcohol. In this case, ethanol was used, given that it is employed as a scavenger in the photocatalytic reaction. It was observed that the permanganometric method yielded a 43% standard deviation, while only a ±1% standard deviation was observed using the colorimetry method in the presence of ethanol. The lower reliability of the permanganometric titration was assigned to the ethanol scavenger interference. Thus, it was proven that the colorimetric methodology provides, in the present study, more reliable results when measuring hydrogen peroxide concentrations.

4.5.2. Effect of the pH on the Photocatalytic Reaction

The pH was measured with a digital pH meter Thermo Scientific Orion Star, with an accuracy of ±0.05. The pH was monitored in the slurry every hour, to determine its effect during the photocatalytic reaction.

4.6. Adsorption of Hydrogen Peroxide and Ethanol

The adsorption of hydrogen peroxide was carried out in the Photo-CREC Water-II Reactor at 25 ± 1 °C. Working conditions for the reactor were equivalent to the ones in the photocatalysis tests. First, the reactor was loaded with 6 L of water at certain reagent concentrations (0 to 1.3 ppm-H2O2). Following this, 0.15 g/L of the TiO2 catalyst was added to the solution. The liquid slurry was recirculated for one hour to reach adsorption equilibrium. During this period, a liquid sample was taken every 10 min, and the H2O2 concentration in the liquid at equilibrium (Ce) was measured, using the colorimetric method described in Section 4.5.1 [22]. Based on the experimental data, the maximum adsorption capacity was given by the following relation:
Q e = Q e , m a x KC e ( 1 + KC e )
where Qe is the H2O2 equilibrium adsorbent-phase concentration; Ce is the H2O2 equilibrium concentration in the liquid (mg L−1); Qe,max is the H2O2 maximum adsorption capacity (mg g−1); and K is the adsorption constant [30].

5. Conclusions

Photocatalysis is a promising method for hydrogen production. This method involves the use of a semiconductor material that generates electron–hole pairs. Photoexcited electron–hole pairs are separated using sacrificial agents such as ethanol, which allow the formation of hydrogen and reduce electron–hole pair recombination. The mesoporous TiO2 doped with a palladium semiconductor is a valuable photocatalyst for hydrogen production, while using ethanol as an organic scavenger. The synthesized 0.25 wt.% Pd-TiO2 photocatalyst proved to be suitable for hydrogen production, in the Photo-CREC Water Reactor-II, under both near-UV and visible light, reaching a hydrogen volume of 113 and 29 cm3 STP, respectively, after 6 h of irradiation. The 0.25 wt.% Pd-TiO2 photocatalyst displayed an in ‘‘series–parallel’’ reaction network, via water splitting, with hydrogen, methane, ethane, ethylene, acetaldehyde, carbon monoxide, and carbon dioxide products being formed. The accounting of all carbon containing species allowed one to establish a good carbon closure, with a slightly reduced ethanol concentration. OH and H radicals were consumed/reduced to form carbon containing by-products. OH radicals formed additional species such as H2O2, which was adsorbed by the photocatalyst, as well as dissociated, leading to pH changes throughout the reaction. The moles of OH and H radicals were evaluated, involving various redox species. This allowed one to confirm for both Pd-TiO2-nUV and Pd-TiO2-VIS, that the photocatalytic water splitting reaction proceeded via the equimolar formation of OH and H radicals.

Author Contributions

Conceptualization, investigation, review, editing, and supervision: H.d.L.; proposed methodology for adsorption constants evaluation, review, editing, and technical co-supervision: S.E.; conceptualization, investigation, methodology for hydrogen peroxide detection, pH analysis, reaction mechanism, components balance, formal analysis, and writing: B.R. All authors have read and agreed to the published version of the manuscript.

Funding

This research was funded by the Natural Sciences and Engineering Research Council of Canada (NSERC) and the University of Western Ontario, through grants awarded to Hugo de Lasa.

Acknowledgments

We would like to thank Florencia de Lasa who assisted with the editing of this paper.

Conflicts of Interest

The authors declare no conflict of interest.

Nomenclature

CeConcentration in the liquid of adsorbate at equilibrium
COCarbon monoxide
CO2Carbon dioxide
CH4Methane
C2H6Ethane
C2H4Ethylene
C2H4OAcetaldehyde
DpPore diameter (cm)
eElectron
h+Hole
F-127Poly (ethylene oxide)/poly (propylene oxide)/poly (ethylene oxide)
H•Hydrogen radical
H2OWater
H2O2Hydrogen Peroxide
KAdsorption constant
OHHydroxide ions
OHHydroxide radicals
PdPalladium
PdCl2Palladium II chloride
PEOPoly (ethylene oxide)
PPOPoly (propylene oxide)
QeEquilibrium adsorbent-phase concentration
Qe,maxMaximum adsorption capacity
tTime (h)
TiO2 Titanium dioxide
Acronyms
BLBBlack Light Blue Lamp
BETBrunauer–Emmett–Teller Surface Area Method
CBConduction Band
DP25Degussa P25 (TiO2)
DPDN, N-dimethyl-p-phenylenediamine
EISAEvaporation-Induced-Self-Assembly
FIDFlame Ionization Detector
GCGas Chromatography
HPLCHigh Performance Liquid Chromatography
MIEBMacroscopic Irradiation Energy Balance
PCW-IIPhoto-CREC Water-II Reactor
PCPhotocatalyst Concentration
Pd-TiO2-nUVPalladium doped Mesoporous TiO2 under Near-UV light
Pd-TiO2-VISPalladium doped Mesoporous TiO2 after 1 h under Near UV light and 5 h under Visible Light
pHPotential of Hydrogen
STPStandard Temperature and Pressure (273 K and 1 atm)
TPRTemperature Programmed Reduction
TCDThermal Conductivity Detector
UVUltraviolet
VBValence Band
VISVisible light
XPSX-ray Photoelectron Spectroscopy
XRDX-ray Diffraction

Appendix A. Carbon Containing Species Balance

This appendix reports a typical calculation of the moles carbon balance for the 0.25 wt.% Pd-TiO2 catalyst under near-UV light. Note that the Photo-CREC Water Reactor-II, at the beginning of the reaction, was loaded with 6 L of slurry suspension. In addition, the Photo-CREC Water Reactor-II is equipped with a sealed storage tank with a total volume of 5716 mL for collecting the gas phase products.
  • Moles of carbon at t = 0 h in the liquid phase:
n C = 0.34171   mole   L 1 ( 6.0   L ) ( 2   moles   of   Carbon 1   mole   of   Ethanol ) = 4.10   mole   of   Carbon
  • Moles of carbon at t = 6 h in the liquid phase:
n C = 0.34110   moles   L 1 ( 6.0   L ) ( 2   moles   of   Carbon 1   moles   of   Ethanol ) = 4.09   moles   of   Carbon
  • Ethanol in the gas phase:
n C = 0.1776   μ moles   mL 1 ( 5716   mL ) ( 2   moles   of   Carbon 1   moles   of   Ethanol ) = 2.03 × 10 3   moles   of   Carbon
  • Methane in the gas phase:
n C = 0.018   μ moles   mL 1 ( 5716   mL ) ( 1   mole   of   Carbon 1   mole   of   Methane ) = 1.01 × 10 5   moles   of   Carbon
  • Ethane in the gas phase:
n C = 0.0072   μ moles   mL 1 ( 5716   mL ) ( 2   moles   of   Carbon 1   mole   of   Ethane ) = 8.23 × 10 5   moles   of   Carbon
  • Ethylene in the gas phase:
n C = 0.0140   μ moles   mL 1 ( 5716   mL ) ( 2   moles   of   Carbon 1   mole   of   Etylenel ) = 1.60 × 10 4   moles   of   Carbon
  • Acetaldehyde in the gas phase:
n C = 0.0086   μ moles   mL 1 ( 5716   mL ) ( 2   moles   of   Carbon 1   mole   of   Acetaldehyde ) = 9.83 × 10 5   moles   of   Carbon
  • Carbon monoxide in the gas phase:
n C = 0.0005   μ mole   mL 1 ( 5716   mL ) ( 1   mole   of   Carbon 1   mole   of   Carbon   Monoxide ) = 2.57 × 10 6   moles   of   Carbon
  • Carbon dioxide in the gas phase:
n C = 0.0029   μ moles   mL 1 ( 5716   mL ) ( 1   mole   of   Carbon 1   mole   of   Carbon   Dioxide ) = 1.65 × 10 5   moles   of   Carbon
The addition of the moles of carbon after 6 h of irradiation can be established as:
n t = 6 h = mol   of   byproducts + mol   of   ethanol
n t = 6 h = 2.40   ×   10 3   moles   of   Carbon + 4.09   moles   of   Carbon = 4.096   moles   of   Carbon
Thus, comparing this amount to the 4.10 moles of carbon fed as ethanol at t = 0, the percentual difference in a mole carbon balance is 0.12% only. Furthermore, one can note that the combined moles of carbon containing products are 2.4 × 10⁻³. This shows that one can assume with confidence that the photocatalytic hydrogen production takes place with a small overall variation of ethanol concentration as observed in Table A1.
Table A1. Cumulative ethanol formed/consumed at different irradiation times.
Time (h)Concentration (M)
00.34171
10.33529
20.33714
30.34312
40.33742
50.33960
60.34110

Appendix B. H and OH Radicals Balance

Regarding the H and OH balances reported from experiments using 0.25 wt.% Pd-TiO2, after 6 h of irradiation, under near-UV light, in the Photo-CREC Water-II Reactor, the following can be considered:
H H 2 = H 2 ( g ) ( 2 H   moles 1   mole   of   H 2 )
At the end of the photocatalytic reaction, 5.055 × 10⁻³ moles of H2 are generated from water splitting:
H H 2 = 0.8844   μ mole   mL 1 5716   mL ( 2 H moles 1   mole   of   H 2 ) = 1.01   ×   10 2   moles   of   H 2
H CH 4 = 0.0018   μ moles   mL 1 5716   mL ( 4 H moles 1   mole   of   H 2 ) = 4.02   ×   10 5   moles   of   H 2
H C 2 H 6 = 0.0072   μ mole   mL 1 5716   mL ( 1 H   mole 1   mole   of   H 2 ) = 4.12   ×   10 5   moles   of   H 2
The total amount of H radicals is:
H Total = H H 2 + H CH 4 + H C 2 H 6
H Total = 1.019   ×   10 2   moles   of   H
Furthermore, the OH formed as per stochiometric requirements accounts for:
OH Total = OH intermediate + OH CO 2 Total + OH H 2 O 2 ( Formation ) + OH pH   Change
With the “intermediate” subscript related to the OH being consumed as:
OH intermediate = OH Acetaldehyde   gas
OH Acetaldehyde   gas = 0.0086   μ moles   mL 1 5716   mL ( 2   OH   moles 1   mole   acetaldehyde ) = 9.83   ×   10 5 moles   OH
Furthermore, and regarding the total OH consumed, one can mention that it is required for the formation of CO2, based on the following relation:
OH CO 2 = OH CO 2 ( gas ) + OH CO 2 ( dissolved )
The OH radicals in the gas and liquid phase are calculated as:
OH CO 2 ( gas ) = 0.00288   μ moles   mL 1 5716   mL ( 6   OH moles 1   mole   CO 2 ) = 9.88   ×   10 5 moles   OH
OH CO 2 ( dissolved ) = 3.29   ×   10 4 μ moles   ( 6   OH   moles 1   mole   CO 2 ) = 1.97   ×   10 3 moles   OH
The required total number of moles of OH radicals needed to form CO2 are:
OH CO 2   Total = 2.07   ×   10 3 moles   OH
For the H2O2 formation, during the photocatalytic reaction, one should consider the OH radicals consumed and the 45% of hydrogen peroxide adsorbed on the photocatalyst:
OH H 2 O 2 ( Formation ) = 94 , 217   μ moles   H 2 O 2 ( L ) ( 2   OH   moles 1   mole   H 2 O 2 ) 1.45 = 2.73   ×   10 4   OH   moles
Furthermore, considering the pH change as a function of the OH radicals:
OH pH   Change = 7.81   ×   10 3 OH   moles
Thus, the total number of moles of OH radicals are the result of the following addition:
OH Total = OH intermediate + OH CO 2 Total + OH H 2 O 2 ( Formation ) + OH pH   Change
OH Total = 9.83   ×   10 5 + 2.07   ×   10 3 + 2.73   ×   10 4 + 7.81   × 10 3 = 1.01   ×   10 2   moles   OH  
In summary, and if one compares the number of moles of H produced/consumed to the OH moles involved in various product formation reactions (H moles and OH moles balance), after 6 h of irradiation, one can see that the mole balance closure with the hypothesized reactions is very good with a percentual error of 0.84% only.

Appendix C. Detection of H2 and Carbon Containing Species by a Shimadzu CG 2010

The several gases produced, as a result of the photocatalytic water splitting with ethanol as a scavenger, were evaluated using a Shimadzu GC2010 Gas Chromatograph (Nakagyo-ku, Kyoto, Japan). Samples were taken every hour during a 6 h period. To accomplish this, argon (Praxair 99.999%) was used as a gas carrier. The GC was equipped with two detectors: a Flame Ionization Detector (Nakagyo-ku, Kyoto, Japan) (FID) coupled with a methanizer and a Thermal Conductivity Detector (TCD). As a result, the analytical equipment employed was able to detect hydrogen (H2), carbon monoxide (CO), methane (CH4), carbon dioxide (CO2), ethane (C2H6), ethylene (C2H4), acetaldehyde (C2H4O), and ethanol (C2H5OH).
The GC method used for the gas phase analysis is described as follows:
Column:
Temperature: 50 °C Equilibration time: 0.2 min
Column Oven Temperature Program
RateTemperature (°C)Hold Time (min)
-504
20.020018.5
FID
Temperature: 230 °C Sample Rate: 40 msec Make up gas: Hydrogen
TCD
Temperature: 210 °C Sample Rate: 40 msec Make up gas: Argon
Typical chromatograms obtained, for both hydrogen and carbon containing by-products, using the employed programmed oven temperature method, are reported in Figure A1 and Figure A2. One should note that the air detected via the TCD was attributed to the air contained in the needle, when injecting the gas sample into the GC. This air gas volume is negligible and was disregarded in the product analysis.
Figure A1. Hydrogen peak as detected by the TCD.
Catalysts 11 00405 g0a1
Figure A2. Carbon containing product species peaks as detected by the FID for: (a) carbon monoxide (CO), (b) methane (CH4), (c) carbon dioxide (CO2), (d) ethylene (C2H4), (e) ethane (C2H6), (f) acetaldehyde (C2H4O), and (g) ethanol (C2H5OH).
Catalysts 11 00405 g0a2
H2 peak measurements were quantified using the TCD calibration, as reported in Figure A3. Calibration was established by using a H2 certified standard gas mixture sample (10% H2 and 90% He Praxair), and different known hydrogen volumes (0.1, 0.2, 0.3, 0.4, 0.5, and 0.6 mL). Sample volumes in the syringe were at room temperature, and pressure conditions (25 °C and 1 atm).
Figure A3. Calibration curve using the Shimadzu GC 2010 for Hydrogen.
Catalysts 11 00405 g0a3

References

  1. Chang, T.; Chu, H.-P.; Chen, W.-Y. Energy consumption and economic growth in 12 Asian countries: Panel data analysis. Appl. Econ. Lett. 2013, 20, 282–287. [Google Scholar] [CrossRef]
  2. Abe, R.; Sayama, K.; Sugihara, H. Development of New Photocatalytic Water Splitting into H2 and O2 using Two Different Semiconductor Photocatalysts and a Shuttle Redox Mediator IO3-/I-. J. Phys. Chem. B 2005, 109, 16052–16061. [Google Scholar] [CrossRef] [PubMed]
  3. Jensen, S.H.; Larsen, P.H.; Mogensen, M.B. Hydrogen and synthetic fuel production from renewable energy sources. Int. J. Hydrogen Energy 2007, 32, 3253–3257. [Google Scholar] [CrossRef]
  4. Mazloomi, K.; Gomes, C. Hydrogen as an energy carrier: Prospects and challenges. Renew. Sustain. Energy Rev. 2012, 16, 3024–3033. [Google Scholar] [CrossRef]
  5. Ipsakis, D.; Voutetakis, S.; Seferlis, P.; Stergiopoulos, F.; Elmasides, C. Power management strategies for a stand-alone power system using renewable energy sources and hydrogen storage. Int. J. Hydrogen Energy 2009, 34, 7081–7095. [Google Scholar] [CrossRef]
  6. Liu, G.; Wang, L.; Yang, H.G.; Cheng, H.-M.; Lu, G.Q. (Max) Titania-based photocatalysts—Crystal growth, doping and heterostructuring. J. Mater. Chem. 2010, 20, 831–843. [Google Scholar] [CrossRef]
  7. Mills, A.; Le Hunte, S. An overview of semiconductor photocatalysis. J. Photochem. Photobiol. A Chem. 1997, 108, 1–35. [Google Scholar] [CrossRef]
  8. Abe, R.; Sayama, K.; Arakawa, H. Significant effect of iodide addition on water splitting into H2 and O2 over Pt-loaded TiO2 photocatalyst: Suppression of backward reaction. Chem. Phys. Lett. 2003, 371, 360–364. [Google Scholar] [CrossRef]
  9. Mills, A.; Porter, G. Photosensitised dissociation of water using dispersed suspensions of n-type semiconductors. J. Chem. Soc. Faraday Trans. 1 Phys. Chem. Condens. Phases 1982, 78, 3659–3669. [Google Scholar] [CrossRef]
  10. López, C.R.; Melián, E.P.; Méndez, J.O.; Santiago, D.E.; Rodríguez, J.D.; Díaz, O.G. Comparative study of alcohols as sacrificial agents in H2 production by heterogeneous photocatalysis using Pt/TiO2 catalysts. J. Photochem. Photobiol. A Chem. 2015, 312, 45–54. [Google Scholar] [CrossRef]
  11. Galińska, A.; Walendziewski, J. Photocatalytic Water Splitting over Pt-TiO2 in the Presence of Sacrificial Reagents. Energy Fuels 2005, 19, 1143–1147. [Google Scholar] [CrossRef]
  12. Acar, C.; Dincer, I.; Naterer, G.F. Review of photocatalytic water-splitting methods for sustainable hydrogen production. Int. J. Energy Res. 2016, 40, 1449–1473. [Google Scholar] [CrossRef]
  13. Cushing, S.K.; Li, J.; Meng, F.; Senty, T.R.; Suri, S.; Zhi, M.; Li, M.; Bristow, A.D.; Wu, N. Photocatalytic Activity Enhanced by Plasmonic Resonant Energy Transfer from Metal to Semiconductor. J. Am. Chem. Soc. 2012, 134, 15033–15041. [Google Scholar] [CrossRef] [PubMed]
  14. Rusinque, B.; Escobedo, S.; De Lasa, H. Photocatalytic Hydrogen Production Under Near-UV Using Pd-Doped Mesoporous TiO2 and Ethanol as Organic Scavenger. Catalysts 2019, 9, 33. [Google Scholar] [CrossRef] [Green Version]
  15. Rusinque, B.; Escobedo, S.; De Lasa, H. Photoreduction of a Pd-Doped Mesoporous TiO2 Photocatalyst for Hydrogen Production under Visible Light. Catalysts 2020, 10, 74. [Google Scholar] [CrossRef] [Green Version]
  16. Holloway, P.; McGuire, G. Handbook of Compound Semiconductor; Noyes Publications: Park Ridge, NJ, USA, 1995. [Google Scholar]
  17. Escobedo, S.; Serrano, B.; Calzada, A.; Moreira, J.; De Lasa, H. Hydrogen production using a platinum modified TiO2 photocatalyst and an organic scavenger. Kinetic modeling. Fuel 2016, 181, 438–449. [Google Scholar] [CrossRef]
  18. Rusinque, B. Hydrogen Production by Photocatalytic Water Splitting under Near-UV and Visible Light Using Doped Pt and Pd TiO2. Master’s Thesis, The University of Western Ontario, London, ON, Canada, September 2018. [Google Scholar]
  19. Bai, S.; Shao, Q.; Wang, P.; Dai, Q.; Wang, X.; Huang, X. Highly Active and Selective Hydrogenation of CO2 to Ethanol by Ordered Pd–Cu Nanoparticles. J. Am. Chem. Soc. 2017, 139, 6827–6830. [Google Scholar] [CrossRef]
  20. Song, Y.; Chen, W.; Wei, W.; Sun, Y. Advances in Clean Fuel Ethanol Production from Electro-, Photo- and Photoelectro-Catalytic CO2 Reduction. Catalysts 2020, 10, 1287. [Google Scholar] [CrossRef]
  21. Arrouvel, C.; Digne, M.; Breysse, M.; Toulhoat, H.; Raybaud, P. Effects of morphology on surface hydroxyl concentration: A DFT comparison of anatase-TiO2 and γ-alumina catalytic supports. J. Catal. 2004, 222, 152–166. [Google Scholar] [CrossRef]
  22. Moreira, J.; Serrano, B.; Ortiz, A.; De Lasa, H. A unified kinetic model for phenol photocatalytic degradation over TiO2 photocatalysts. Chem. Eng. Sci. 2012, 78, 186–203. [Google Scholar] [CrossRef]
  23. Sahel, K.; Elsellami, L.; MirAli, I.; Dappozze, F.; Bouhent, M.; Guillard, C. Hydrogen peroxide and photocatalysis. Appl. Catal. B Environ. 2016, 188, 106–112. [Google Scholar] [CrossRef]
  24. Enzweiler, H.; Yassue-Cordeiro, P.H.; Schwaab, M.; Barbosa-Coutinho, E.; Scaliante, M.H.N.O.; Fernandes, N.R.C. Catalyst concentration, ethanol content and initial pH effects on hydrogen production by photocatalytic water splitting. J. Photochem. Photobiol. A Chem. 2020, 388, 112051. [Google Scholar] [CrossRef]
  25. Salas, S.E.; de Lasa, S.H. Photocatalytic Water Splitting Using a Modified Pt-TiO2. Kinetic Modeling and Hydrogen Production Efficiency. Master’s Thesis, The University of Western Ontario, London, ON, Canada, August 2013. [Google Scholar]
  26. Kosmulski, M. The significance of the difference in the point of zero charge between rutile and anatase. Adv. Colloid Interface Sci. 2002, 99, 255–264. [Google Scholar] [CrossRef]
  27. Arlos, M.J.; Hatat-Fraile, M.M.; Liang, R.; Bragg, L.M.; Zhou, N.Y.; Andrews, S.A.; Servos, M.R. Photocatalytic decomposition of organic micropollutants using immobilized TiO2 having different isoelectric points. Water Res. 2016, 101, 351–361. [Google Scholar] [CrossRef] [PubMed]
  28. Kanungo, S.; Parida, K.; Sant, B. Studies on MnO2—III. The kinetics and the mechanism for the catalytic decomposition of H2O2 over different crystalline modifications of MnO2. Electrochim. Acta 1981, 26, 1157–1167. [Google Scholar] [CrossRef]
  29. Domínguez-Henao, L.; Turolla, A.; Monticelli, D.; Antonelli, M. Assessment of a colorimetric method for the measurement of low concentrations of peracetic acid and hydrogen peroxide in water. Talanta 2018, 183, 209–215. [Google Scholar] [CrossRef] [PubMed]
  30. Liu, L.; Luo, X.-B.; Ding, L.; Luo, S.-L. Application of nanotechnology in the removal of heavy metal from water. In Nanomaterials for the Removal of Pollutants and Resource Reutilization; Elsevier: Amsterdam, The Netherlands, 2018; pp. 83–147. [Google Scholar]
Figure 1. Hydrogen reactions steps using Pd-TiO2 as photocatalyst and ethanol as a scavenger.
Catalysts 11 00405 g001
Figure 2. Cumulative formed hydrogen obtained using Pd-TiO2-nUV. Conditions: photocatalyst concentration: 0.15 g/L, 2.0 v/v% ethanol.
Catalysts 11 00405 g002
Figure 3. Cumulative formed hydrogen obtained with a 0.25 wt.% Pd-TiO2-VIS photocatalyst, which was photoreduced during 1 h of Near-UV Light Exposure, and then 5 h of visible light exposure. Conditions: photocatalyst concentration: 0.15 g/L, scavenger concentration: 2.0 v/v% ethanol.
Catalysts 11 00405 g003
Figure 4. Cumulative amounts of carbon dioxide (CO2), methane (CH4), acetaldehyde (C2H4O), ethane (C2H6), and ethylene (C2H4) obtained using a 0.25 wt.% Pd-TiO2-nUV. Conditions: photocatalyst concentration of 0.15 g/L, 2.0 v/v% ethanol, near-UV light irradiation, and argon atmosphere.
Catalysts 11 00405 g004
Figure 5. Cumulative amounts of carbon dioxide (CO2), methane (CH4), acetaldehyde (C2H4O), ethane (C2H6), and ethylene (C2H4) Obtained using a 0.25 wt.% Pd-TiO2-VIS. Conditions: combined near-UV irradiation (1 h) and visible light irradiation (5 h), photocatalyst concentration of 0.15 g/L, 2.0 v/v% ethanol, and argon atmosphere.
Catalysts 11 00405 g005
Figure 6. Total carbon from all carbon containing species, at the beginning of the reaction and after 6 h of near-UV irradiation. Conditions: argon atmosphere, 0.25 wt.% Pd-TiO2-nUV photocatalyst concentration.
Catalysts 11 00405 g006
Figure 7. Total carbon in all carbon containing species at the beginning of the reaction and after combined near-UV irradiation (1 h) and visible light irradiation (5 h). Conditions: argon atmosphere, 0.25 wt.% Pd-TiO2-VIS photocatalyst concentration.
Catalysts 11 00405 g007
Figure 8. Cumulative H2O2 as a Function of Irradiation Time in the Presence of 0.25 wt.% Pd-TiO2-nUV and 0.25 wt.% Pd-TiO2-VIS (1 h photoreduction under Near UV followed by 5 h of visible light irradiation). Conditions: argon atmosphere.
Catalysts 11 00405 g008
Figure 9. (a) Hydrogen peroxide adsorption isotherm on a Pd-TiO2 photocatalyst and (b) linearized langmuir equilibrium isotherm for hydrogen peroxide on Pd-TiO2.
Catalysts 11 00405 g009
Figure 10. pH Changes with irradiation time using a 0.25 wt.% Pd-TiO2-nUV and a 0.25 wt.% Pd-TiO2-VIS.
Catalysts 11 00405 g010
Figure 11. (a) μmoles of OH and H radicals Formed after 6 h of photocatalytic hydrogen production under near-UV light, and (b) percentual H and H μmoles balances at different irradiation times under near-UV Light. The 95% confidence and prediction intervals are reported in red and blue, respectively.
Catalysts 11 00405 g011
Figure 12. (a) Moles of OH and H radicals formed after 6 h of photocatalytic hydrogen production under visible light, and (b) percentual OH and H balances at different irradiation times under visible light. The 95% confidence and prediction intervals are reported in red and blue, respectively.
Catalysts 11 00405 g012
Figure 13. Schematics of the Photo-CREC Water-II Reactor. (a) Photo-CREC Water-II Reactor, (b) centrifugal pump, and (c) sealed storage tank.
Catalysts 11 00405 g013
Figure 14. Calibration curve of H2O2 measurements by colorimetric method.
Catalysts 11 00405 g014
Table 1. Net μMoles of H formed and OH consumed following 6 h of irradiation using the Pd-TiO2-nUV and Pd-TiO2-VIS.
μmoles of H Formed
Equations (2), (8) and (9)
(a)
μmoles of OH Consumed
Equations (3)–(6)
(b)
Pd-TiO2-nUV.10,191.52169.6
Pd-TiO2-VIS2620.32342.4
Note: (a) The μmoles of OH radicals are calculated based on oxidized carbon products (CO2, acetaldehyde), (b) the μmoles of H radicals are calculated on the basis of H2 and reduced carbon species (methane, ethane).
Table 2. Cumulative H formed/consumed and OH consumed-1.
μmoles of H Formed
as Shown in Equations (2), (8) and (9)
Cumulative μmoles of OH Consumed
Forming H2O2 as Shown in Equation (11)
(Liquid Phase)
Cumulative μmoles of OH Consumed
as Shown in Equations (3)–(7) and (11)
Pd-TiO2-nUV.10,191.5188.42359
Pd-TiO2-VIS2620.389.12431
Table 3. Adsorption constants for hydrogen peroxide and ethanol.
Adsorption Constants
KQe,max
Hydrogen Peroxide0.93 mg−1 L11.1 mg−1 gcat
Table 4. Cumulative H formed/consumed and OH consumed-2.
Cumulative μmoles of H Formed
Calculated with Equations (2), (8) and (9)
Cumulative μmoles of OH Forming H2O2 (Adsorbed)Cumulative μmoles of OH Consumed
Using Equations (3)–(7) and (11), and OH Adsorbed
Pd-TiO2-nUV10,19184.42444
Pd-TiO2-VIS262040.12472
Table 5. Cumulative H formed/consumed and cumulative μmoles OH consumed.
Cumulative μmoles of H Formed via Equation (2), (8) and (9) Cumulative μmoles of OH Produced via pH ChangeCumulative μmoles of OH Consumed
Via Equations (3), (6), and (11) Based on H2O2 Adsorbed and pHChange
Percentual H OH Balance Closure
(%)
Pd-TiO2-UV10,1917662.510,106.399.2
Pd-TiO2-VIS262081.92553.597.5
Publisher’s Note: MDPI stays neutral with regard to jurisdictional claims in published maps and institutional affiliations.

