Article

Nanosheet-Like Ho2O3 and Sr-Ho2O3 Catalysts for Oxidative Coupling of Methane

1
Shanghai Key Laboratory of Molecular Catalysis and Innovative Materials, Department of Chemistry, Fudan University, Shanghai 200438, China
2
Shanghai Research Institute of Petrochemical Technology SINOPEC, Shanghai 201208, China
*
Authors to whom correspondence should be addressed.
Catalysts 2021, 11(3), 388; https://doi.org/10.3390/catal11030388
Submission received: 15 February 2021 / Revised: 15 March 2021 / Accepted: 16 March 2021 / Published: 18 March 2021
(This article belongs to the Special Issue State-of-the-Art of Catalytical Technology in China)

Abstract

:
In this work, Ho2O3 nanosheets were synthesized by a hydrothermal method. A series of Sr-modified Ho2O3 nanosheets (Sr-Ho2O3-NS) with a Sr/Ho molar ratio between 0.02 and 0.06 were prepared via an impregnation method. These catalysts were characterized by several techniques such as XRD, N2 adsorption, SEM, TEM, XPS, O2-TPD (temperature-programmed desorption), and CO2-TPD, and they were studied with respect to their performances in the oxidative coupling of methane (OCM). In contrast to Ho2O3 nanoparticles, Ho2O3 nanosheets display greater CH4 conversion and C2-C3 selectivity, which could be related to the preferentially exposed (222) facet on the surface of the latter catalyst. The incorporation of small amounts of Sr into Ho2O3 nanosheets leads to a higher ratio of (O + O2)/O2− as well as an enhanced amount of chemisorbed oxygen species and moderate basic sites, which in turn improves the OCM performance. The optimal catalytic behavior is achievable on the 0.04Sr-Ho2O3-NS catalyst with a Sr/Ho molar ratio of 0.04, which gives a 24.0% conversion of CH4 with 56.7% selectivity to C2-C3 at 650 °C. The C2-C3 yield is well correlated with the amount of moderate basic sites present on the catalysts.

Graphical Abstract

1. Introduction

The present energy crisis, owing to the dwindling petroleum resource and its nonrenewable feature, must be solved as soon as possible. Methane, as a major component of natural gas, coal-bed gas, and shale gas, is attracting increasing attention as a clean fossil energy and a raw material for producing chemicals. Methane conversion can proceed via nondirect and direct routes [1,2,3,4,5,6,7]. The oxidative coupling of methane (OCM) to ethylene and ethane (C2 hydrocarbons) is an indispensable way that has great prospect in the direct conversion of methane into value-added products [5,6,7]. Ethylene is one of the most important parts in petrochemical fields. Ethylene and its derivatives are associated closely with over 70% of petroleum chemicals. Since 1982 Keller et al. [8] first reported the OCM technology, it has attracted more and more attention in catalysis, chemical industry, and oil and gas fields because of its potential economic value and application prospect.
Up to now, several types of catalysts have been tried for OCM reaction [5,7]. It is widely accepted that Li/MgO and Mn-Na2WO4/SiO2 are the most promising catalysts for application, and they have been widely researched [9,10,11,12,13,14,15,16,17,18,19,20,21,22,23]. In general, higher reaction temperatures (above 800 °C) are required for both kinds of catalysts to achieve the optimal OCM performance. Wang et al. [24] reduced the reaction temperature from 800 to 720 °C by doping Ti into Mn-Na2WO4/SiO2, and they acquired 26% CH4 conversion with 76% C2-C3 selectivity. More studies are now shifted to a low-temperature OCM process. Nanoscale rare earth oxide-based catalysts with special morphologies (nanorods and nanosheets), such as CeO2, La2O3, Sm2O3, and Er2O3, were found to effectively catalyze the OCM process at lower temperatures (500–650 °C) [25,26,27,28,29,30]. However, the C2 selectivity and yield still need to improve.
Ho2O3 was demonstrated to have potential application for high-k dielectric material [31], photocatalysts [32,33], and energy-storage electrodes [34]. There are few reports dealing with the use of Ho2O3 as a catalyst in the OCM process [35]. In this work, we synthesized Ho2O3 and Sr-Ho2O3 nanosheets to develop a new type of efficient catalyst system for a low-temperature OCM reaction. The catalytic performances of these catalysts were related to their characterization results.

2. Results and Discussion

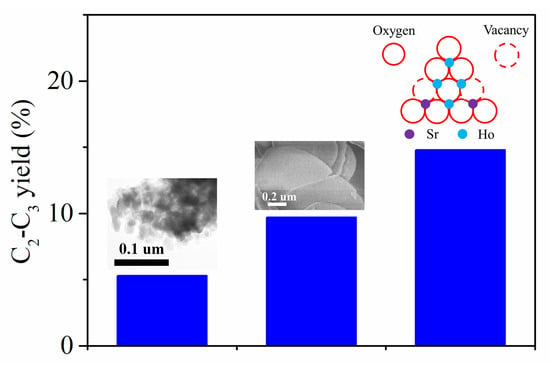
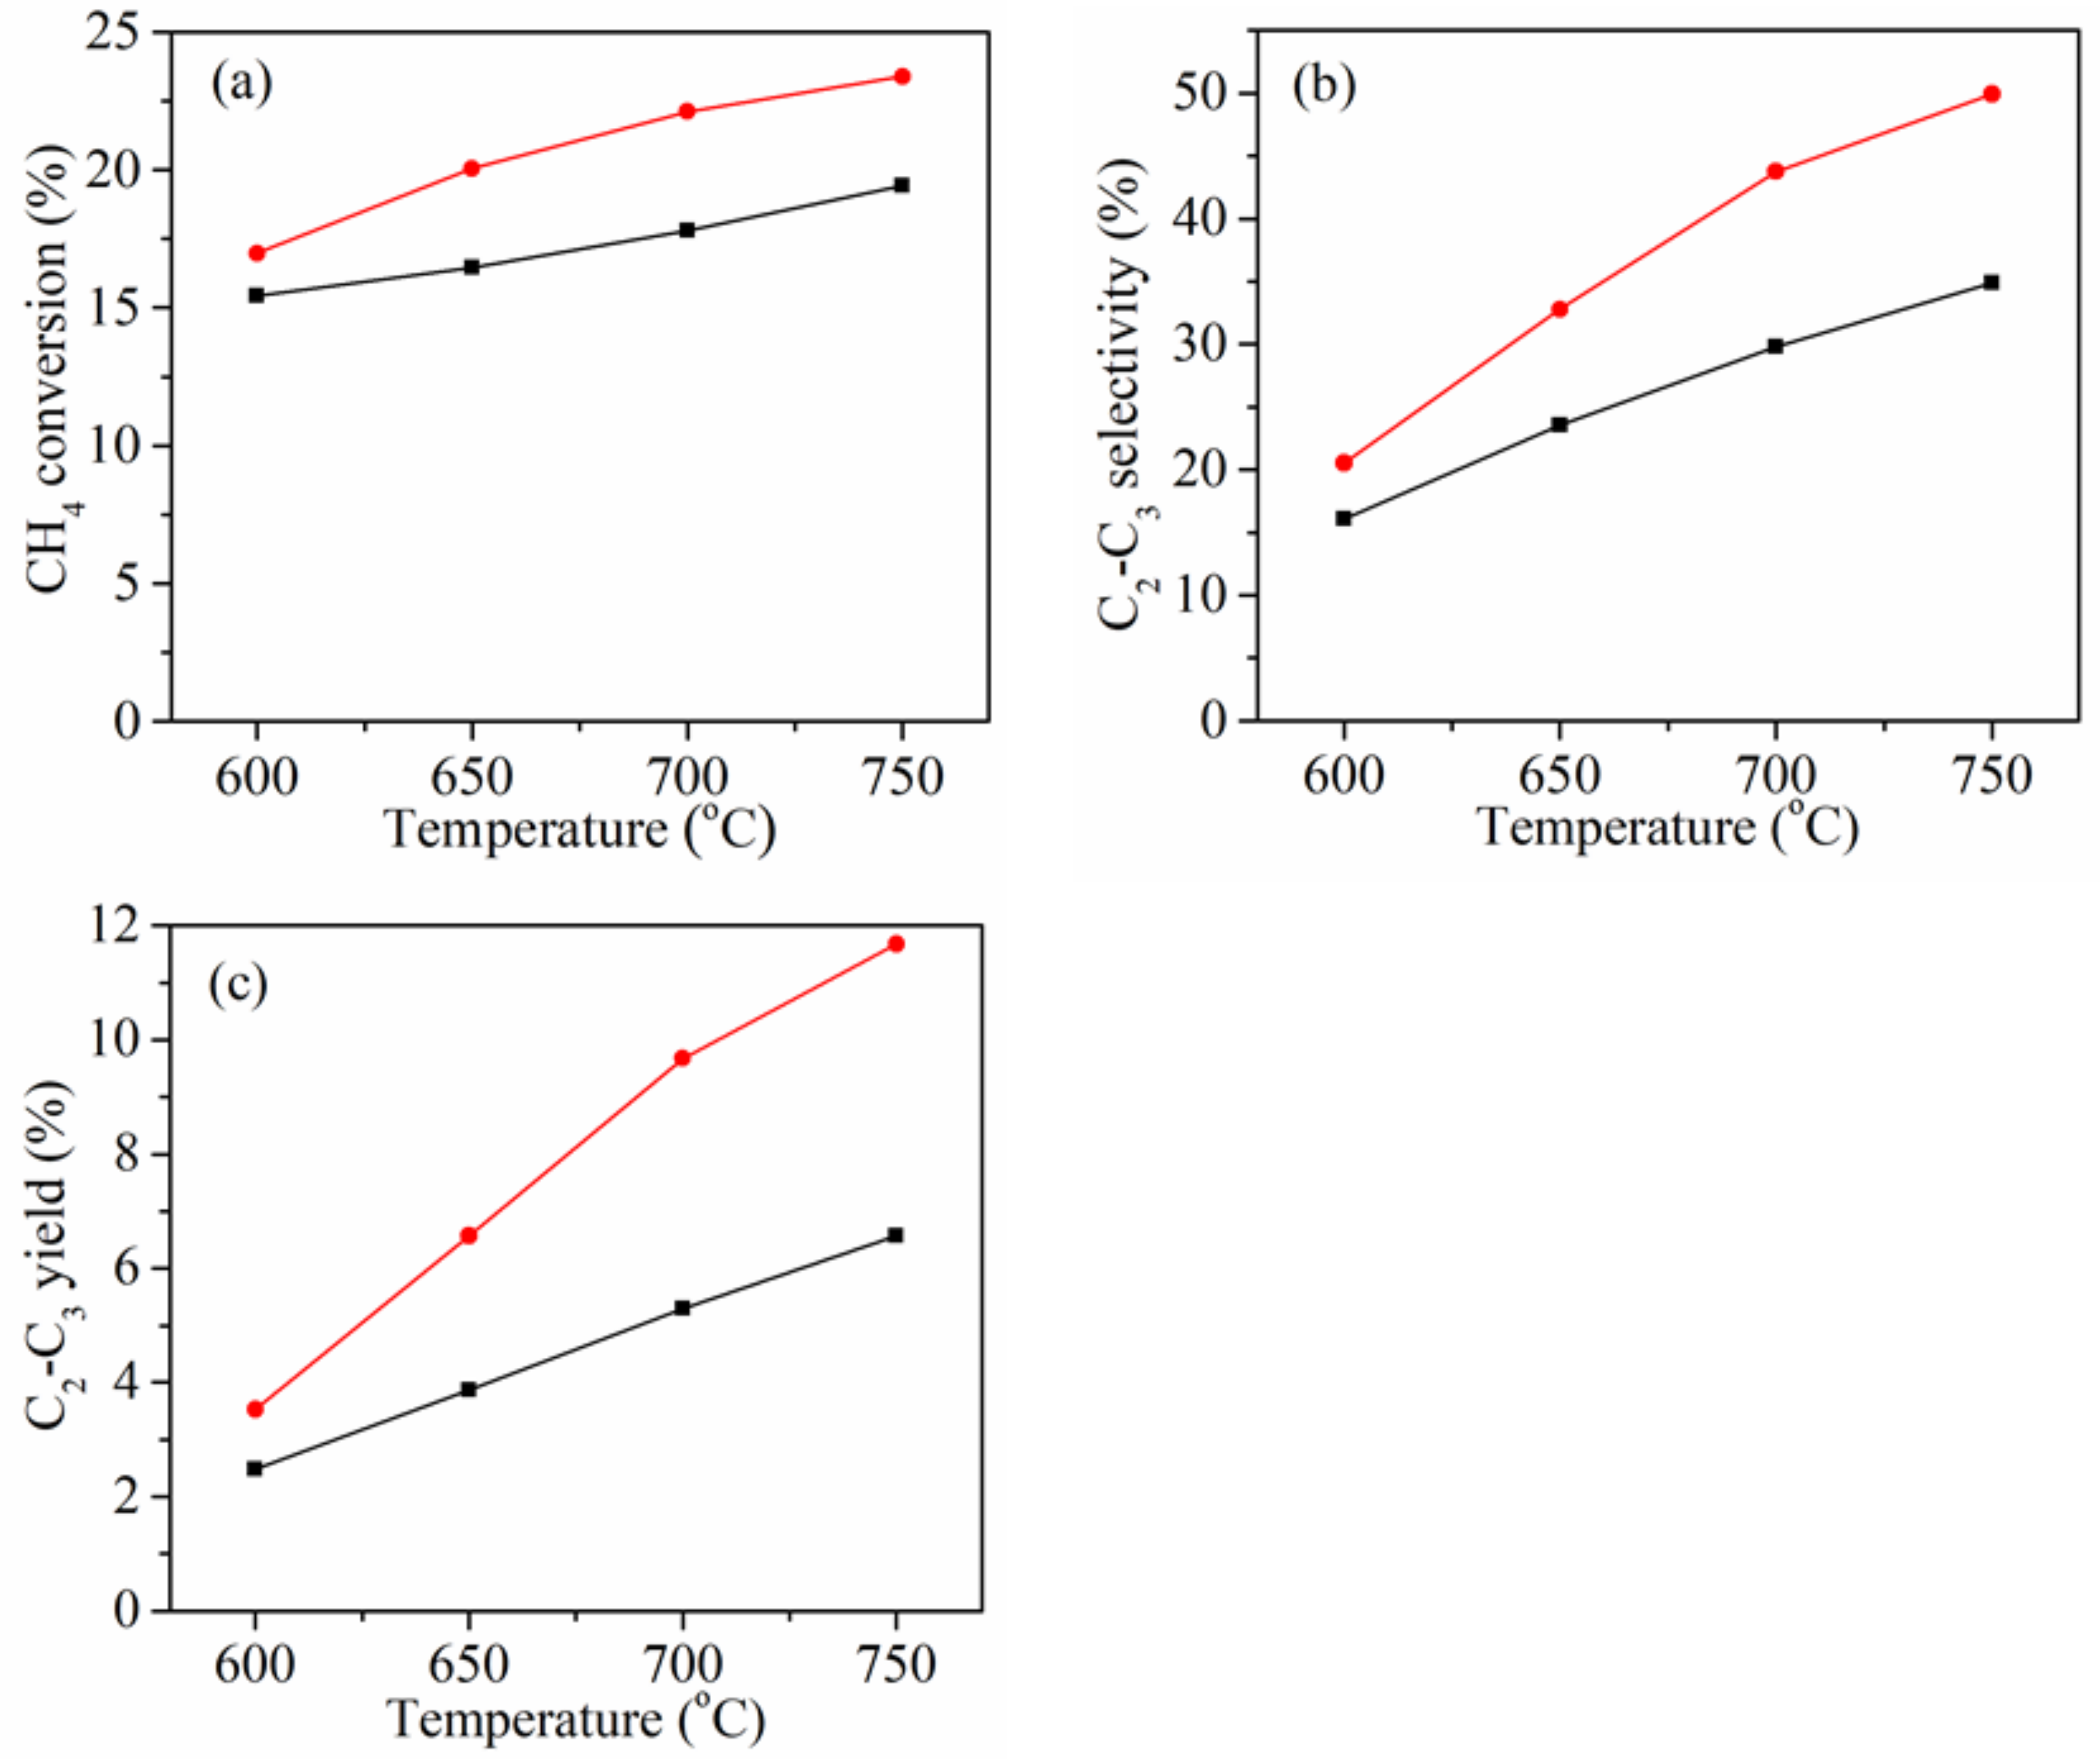
2.1. Catalytic Performances

We first compared catalytic behaviors of Ho2O3 nanosheets and nanoparticles for the OCM reaction to investigate the morphology effect of the Ho2O3 catalysts. As shown in Figure 1, with the reaction temperature raised from 600 to 750 °C, the CH4 conversion increases progressively, while the selectivity to C2-C3 (C2H4, C2H6, C3H6, and C3H8) rises more evidently. Because of this, the C2-C3 yield also improves with the temperature. It is evident that the OCM performance is better over Ho2O3-NS nanosheets than Ho2O3-NP nanoparticles. For instance, the CH4 conversion, C2-C3 selectivity, and yield over Ho2O3-NS at 700 °C are 22.1%, 43.8%, and 9.7%, respectively, and those over Ho2O3-NP are 17.8%, 29.7%, and 5.3%, respectively. The shape effects of La2O3, Sm2O3, and Er2O3 catalysts on the OCM reaction were also reported by Zhu et al. and in our recent work [25,26,27,28].
We then tested the catalytic performances of Sr-modified Ho2O3 nanosheets (Sr-Ho2O3-NS) to investigate the impact of Sr modification on Ho2O3-NS nanosheets in the OCM reaction. As the Sr/Ho molar ratio is increased from 0 to 0.06, the CH4 conversion, C2-C3 selectivity, and the yield first rise and then diminish (Figure 2). The 0.04Sr-Ho2O3-NS catalyst with a Sr/Ho ratio of 0.04 exhibits the best OCM performance. This catalyst yields a 24.0% CH4 conversion and 56.7% C2-C3 selectivity at 650 °C. Even at a low temperature of 600 °C, a 21.6% CH4 conversion and 46.9% C2-C3 selectivity can be achieved. Notably, the 0.04Sr-Ho2O3-NS catalyst performs better than Ho2O3-NS (20.0% CH4 conversion and 32.8% C2-C3 selectivity at 650 °C). The typical product distribution over the Ho2O3-NS and Sr-Ho2O3-NS catalysts at 650 °C is listed in Table 1. According to the literature [5,36,37], the proposed reaction mechanism of methane transformation to ethane and ethylene is shown in Scheme S1. The interaction of the adsorbed CH4 and O2 generates methyl radicals (CH3). The coupling of CH3 radicals generates C2H6, followed by the dehydrogenation to C2H4. Propane and propylene can be formed in the similar way, as illustrated in Scheme S1. The results shown in Figure 2 indicate that the introduction of appropriate amounts of Sr to Ho2O3-NS is beneficial for the OCM reaction. It is noteworthy that the 0.06Sr-Ho2O3-NS catalyst shows a bit lower CH4 conversion and C2-C3 selectivity than 0.04Sr-Ho2O3-NS at 750 °C and 700 °C, which could be attributed to the blockage of some active sites upon introducing excessive Sr. However, much worse OCM performance was observed for the former catalyst than the latter one at 650 °C and 600 °C, particularly at 600 °C. It was also reported that there were the optimal contents of Na and Li for Na-CaO and for the Li-promoted Bi-Mn oxide catalysts employed in the OCM reaction [38,39].
We selected the best 0.04Sr-Ho2O3-NS catalyst to investigate the lifetime for the OCM reaction, which was evaluated at 650 °C. It is clear from the results presented in Figure 3 that the 0.04Sr-Ho2O3-NS catalyst shows good stability during 60 h of the reaction, maintaining ca. 24% CH4 conversion with 57% C2-C3 selectivity.
We compared the catalytic performances of our catalyst 0.04Sr-Ho2O3-NS and three reference catalysts, i.e., 0.04Sr-La2O3 nanofibers, 0.04Sr-CeO2 nanowires, and 3% Li/MgO. As shown in Figure S1, both 0.04Sr-CeO2 and 3% Li/MgO are inactive at 600 and 650 °C. Our catalyst 0.04Sr-Ho2O3 displays a higher methane conversion and C2-C3 selectivity than the three reference catalysts at 600–750 °C.

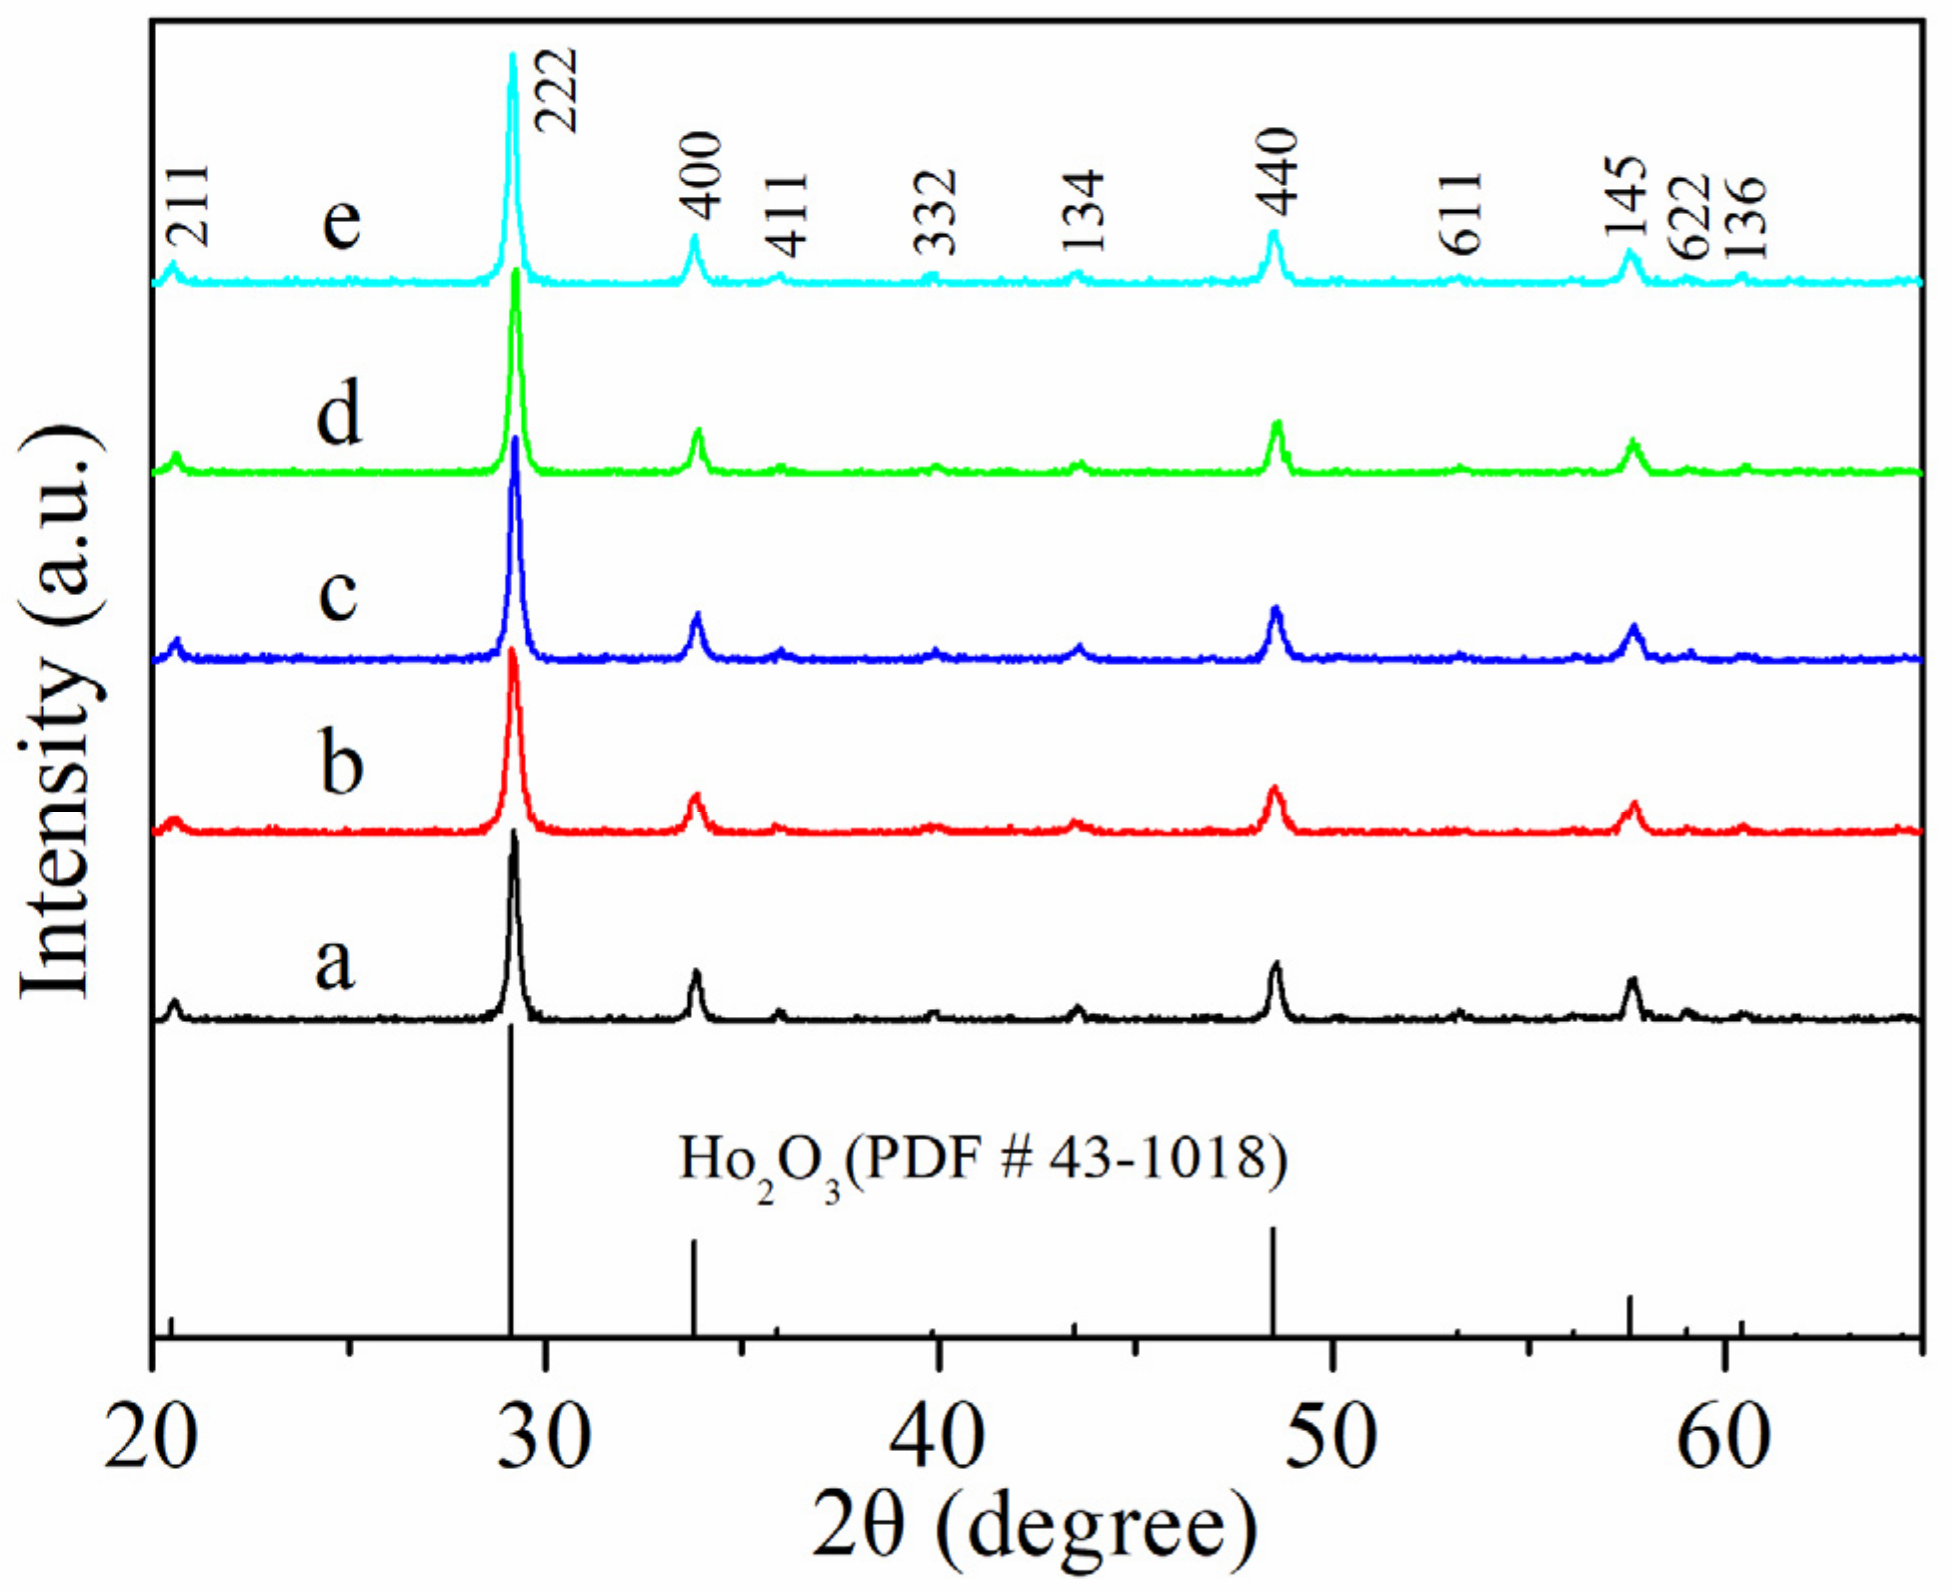
2.2. Structural and Textural Properties

Figure 4 presents the XRD patterns of the Ho2O3 nanoparticles and nanosheets, as well as the Sr-modified Ho2O3 nanosheets. These samples display similar characteristics of diffraction peaks that belong to the cubic Ho2O3 phase (PDF #43-1018). The diffraction peaks at about 21°, 29°, 34°, 36°, 40°, 44°, 49°, 53°, 56°, 58°, 59°, and 60° correspond to the (211), (222), (400), (411), (332), (134), (440), (611), (145), (622), (136), and (444) planes of the cubic phase of Ho2O3, respectively. The absence of any other crystal phases on the XRD profiles is a consequence of having lower contents of Sr and high dispersion of Sr in the catalysts. Table 2 shows that in comparison with Ho2O3-NS, the Sr-modified Ho2O3 nanosheets display greater lattice parameters (1.0571–1.0589 nm vs. 1.0561 nm). This observation implies that Sr is doped into the lattice of Ho2O3, considering that Sr2+ has larger ionic radius than Ho3+ (0.118 nm vs. 0.090 nm). The doping of Sr into the lattice of La2O3 via an impregnation method, followed by calcination at high temperatures, was also displayed in former studies [29,40].
The SEM images of Ho2O3-NS and 0.04Sr-Ho2O3-NS are shown in Figure 5. Clearly, both catalysts display a nanosheet morphology. The morphology of nanoparticles with an irregular shape can be found for Ho2O3-NP (Figure S2). The average width and thickness of Ho2O3-NS are 771 nm and 81.9 nm, respectively. Ho2O3-NP has a mean size of 17.5 nm. In addition, 0.04Sr-Ho2O3-NS has a similar size to Ho2O3-NS (Table 2), suggesting that the introduction of a small amount of Sr to Ho2O3-NS has a little impact on the catalyst size. As illustrated in Figure 6, the exposed facets of Ho2O3-NS and 0.04Sr-Ho2O3-NS can be clearly identified. The crystal lattice fringes marked on their surfaces are indexed to the (440) and (04 4 - ) reflections of cubic Ho2O3. The Fourier transform patterns (insets) achieved from selected areas of the corresponding crystals suggest that they are sitting against a plane perpendicular to the [222] zone axis, demonstrating that the (222) facets are exposed on the surfaces of Ho2O3-NS and 0.04Sr-Ho2O3-NS.
The Brunauer–Emmett–Teller (BET) specific surface areas of the Ho2O3-based catalysts are given in Table 2. All catalysts give low surface areas between 6.1 and 7.9 m2/g, which is preferred for the OCM reaction. In contrast to Ho2O3-NP, Ho2O3-NS has a lower surface area (6.1 vs. 7.9 m2/g). The incorporation of small amounts of Sr into Ho2O3-NS slightly increases the surface area.

2.3. XPS and IR

Figure S3 shows the XPS spectra of O1s on Ho2O3-NP, Ho2O3-NS, and Sr-Ho2O3-NS catalysts. The XPS spectra were deconvoluted into four peaks corresponding to four different oxygen species. The XPS data are listed in Table 2. Oxygen species located at ~529.3, ~530.7, ~531.8, and ~532.6 eV are O2− (lattice oxygen), O (peroxide ions), CO32− (carbonate), and O2 (superoxide ions), respectively [25,41,42,43,44]. It is generally accepted that the surface electrophilic oxygen species O and O2 are beneficial for C2 selectivity in the OCM reaction, while the lattice oxygen O2− is responsible for the deep oxidation of CH4 in forming CO and CO2 [25,26,29,43,45]. The Ho2O3-NS catalyst gives a (O + O2)/O2− ratio of 1.7, higher than Ho2O3-NP (1.4). The Sr-Ho2O3-NS catalysts have a higher ratio of (O + O2)/O2− than Ho2O3-NS, and 0.04Sr-Ho2O3-NS possesses the highest (O + O2)/O2− ratio (2.2). It is thus concluded that the Ho2O3-based catalysts with a higher (O + O2)/O2− ratio display higher C2 selectivity in the OCM reaction at 700 °C and 750 °C (Figure 1 and Figure 2). This observation is in accord with the results reported for the OCM reaction catalyzed by the La2O3-based catalysts [26,29,40,45].
Based on theoretical studies, Sayle and co-workers have disclosed that the energy required to generate oxygen vacancies over CeO2 for different crystal planes follows the order of (110) < (310) < (111) [46]. In other words, oxygen vacancies are easier to form on the (110) plane of CeO2. The interaction between O2 and oxygen vacancies generates the surface electrophilic oxygen species such as O and O2. Therefore, we think that the higher (O + O2)/O2− ratio observed over Ho2O3-NS than Ho2O3-NP could be associated with the predominantly exposed (222) planes over the former catalyst. It was found that the OCM process was a structure-sensitive reaction [25,30,44].
Figure 7 compares the FTIR spectra of 0.04Sr-Ho2O3-NS and 0.06Sr-Ho2O3-NS catalysts after the OCM reaction at 600 °C for 1 h. Two bands that appeared at 1637 and 3445 cm−1 are assigned to the bending and stretching vibrations of the O−H groups in H2O [47]. The bands appearing at 858 and 1442 cm−1 correspond to the bending and asymmetric stretching vibrations of C−O in CO32− [48,49], and they stemmed from the combination of catalysts with CO2 produced during the OCM reaction. Clearly, the spent 0.06Sr-Ho2O3-NS catalyst displays a stronger intensity of CO32− vibrations than the spent 0.04Sr-Ho2O3-NS, suggesting that the amount of carbonate is higher over the former catalyst than the latter one. Thus, the worse OCM performance observed for the former catalyst than the latter one at 650 °C and 600 °C (Figure 2) is due to the blockage of active sites by carbonate.

2.4. Temperature-Programmed Desorption (TPD) of O2 and CO2

To further understand the activation of oxygen over the catalysts, which plays an important role in the OCM process, the TPD of O2 was performed. Figure 8 shows that there are two desorption peaks of oxygen from the surfaces of catalysts. The low-temperature peaks located at 85–137 °C are assigned to the desorption of molecular oxygen species (i.e., loosely bounded surface oxygen), and the high-temperature peaks located at 263–426 °C are ascribed to the desorption of chemisorbed oxygen species, which could be O, O2, and O2− [40,44,50] that stemmed from the interaction of O2 with the Ho2O3-based catalysts. It is generally believed that the chemisorbed oxygen species benefit CH4 activation and C2 selectivity in the OCM process [25,44,50,51]. Table 3 shows that a greater number of chemisorbed oxygen species are achieved over Ho2O3-NS than Ho2O3-NP (15.9 vs. 12.8 μmol/g), which is responsible for the higher CH4 conversion and the C2-C3 yield observed for the former catalyst than the latter one. The incorporation of small amounts of Sr into Ho2O3-NS leads to an increase in the quantity of chemisorbed oxygen species (19.8–24.2 μmol/g), indicative of enhancing the oxygen activation. The largest quantity of chemisorbed oxygen species are achieved over 0.04Sr-Ho2O3-NS. Moreover, introducing Sr into Ho2O3-NS weakens the interaction between oxygen and the Sr-Ho2O3-NS catalysts, since the desorption peaks of chemisorbed oxygen species shift to low temperatures (from 344 °C to 263–309 °C). The doping of low-valence Sr into high-valence Ho2O3 can increase the quantity of oxygen vacancies [51,52,53], which promotes the activation toward oxygen, thus leading to an increased amount of chemisorbed oxygen species. As a result, the Sr-Ho2O3-NS catalysts exhibit better OCM performances than Ho2O3-NS. The optimal CH4 conversion and C2-C3 yield are obtained on the 0.04Sr-Ho2O3-NS catalyst with a Sr/Ho molar ratio of 0.04.
In addition to oxygen activation, the basicity of the catalysts is a key factor influencing the OCM reaction [54,55]. The surface basicity of the Ho2O3-NP, Ho2O3-NS, and Sr-Ho2O3-NS catalysts was measured by CO2-TPD, and the results are presented in Figure 9 and Table 3. Figure 9 shows that there are two desorption peaks of CO2 from the surfaces of the Ho2O3-NP, Ho2O3-NS, and 0.02Sr-Ho2O3-NS catalysts, while there are three CO2 desorption peaks for the 0.04Sr-Ho2O3-NS and 0.06Sr-Ho2O3-NS catalysts. It was reported that the surface basic sites were associated closely with the O, O2 and O2− oxygen species [10,51,54,56]. Based on the peak temperature of CO2 desorption, the peaks that are below 200 °C, between 200 and 600 °C, and higher than 600 °C correspond to basic sites with weak, moderate, and strong strength, respectively [29,40,51]. Table 3 shows that the surfaces of all catalysts are dominated by moderate basic sites. Ho2O3-NS has a greater number of weak and moderate basic sites than Ho2O3-NP. The modification of Ho2O3-NS with Sr brings about an increase in the number of weak and moderate basic sites, and the number of moderate basic sites is increased to the maximum on 0.04Sr-Ho2O3-NS. As evidenced in Figure 10, the C2-C3 yield obtained at 700 °C correlates well with the number of moderate basic sites present on the Ho2O3-based catalysts. This finding is in accordance with some previous reports that the surface basic sites with moderate strength are more favorable for the C2 product formation in the OCM process [25,26,44,55,57,58,59,60].

3. Materials and Methods

3.1. Catalyst Preparation

Ho2O3 nanosheets (labelled as Ho2O3-NS) were synthesized by a hydrothermal method reported by Lee and co-workers [61]. Typically, 3.79 g of HoCl3•6H2O was dissolved in 100 mL deionized water, and 1 mL of aqueous ammonia (25–28 wt%) was then added dropwise to the above solution under stirring. The obtained suspension was transferred into a Teflon-lined stainless autoclave, which was placed in an oven setting at 200 °C for 12 h. Ho2O3 nanoparticles (named as Ho2O3-NP) were prepared via a conventional precipitate method; 3.0 mL of aqueous ammonia (25–28 wt%) was added dropwise to 100 mL of 0.1 M HoCl3 solution under stirring. All the resulting precipitates were fully washed with deionized water, followed by drying at 80 °C in an oven for 12 h. Finally, the dried Ho(OH)3 samples were calcined at 750 °C in air for 4 h in a muffle to obtain Ho2O3 nanosheets and nanoparticles.
Sr-modified Ho2O3 nanosheets were synthesized by an incipient wetness impregnation method. In a typical procedure, different amounts of Sr(NO3)2 were dissolved in deionized water, and then a certain amount of dried Ho(OH)3 nanosheets were added. After drying under an infrared lamp, the sample was dried at 80 °C in an oven for 12 h, followed by calcination at 750 °C in air for 4 h in a muffle. The resulting catalysts were labelled as xSr-Ho2O3-NS, where x represents the Sr/Ho molar ratio (x = 0.02, 0.04, and 0.06, respectively).
For comparison, 0.04Sr-La2O3 nanofibers were prepared according to the literature [29]. Ce(OH)3 nanowires were prepared according to the literature [30]. The 0.04Sr-CeO2 nanowires were prepared in the same way as our Sr-modified Ho2O3 nanosheets. The 3% Li/MgO was prepared according to the literature [62]. The calcination temperature for three reference catalysts was 750 °C. The Sr/La or Sr/Ce molar ratio was 0.04. The content of Li in the catalyst was 3 wt.%.

3.2. Characterization of the Catalyst

X-ray diffraction (XRD) patterns were recorded on a D2 PHASER X-ray diffractometer using nickel-filtered Cu Kα radiation at 30 kV and 10 mA (Brucker, Madison, WI, USA). The BET surface areas of the samples were analyzed by N2 adsorption at −196 °C using a Micromeritics Tristar 3000 instrument (Micromeritics, Atlanta, GA, USA). X-ray photoelectron spectroscopy (XPS) measurements were performed on a Perkin–Elmer PHI 5000C spectrometer (Perkin-Elmer, Waltham, MA, USA). All binding energy values were calibrated using the C 1s peak at 284.6 eV. The surface basicity was measured by the temperature programmed desorption of CO2 (CO2-TPD) using a Micromeritics AutoChem II analyzer (Micromeritics, Atlanta, GA, USA); 0.2 g of sample was preheated at 750 °C for 1 h under He (30 mL/min), then cooled down to 80 °C. CO2 adsorption was conducted at this temperature, followed by purging with He (30 mL/min) for 2 h. The temperature was then raised from 80 to 950 °C at a ramping rate of 10 °C/min. O2 temperature programmed desorption (O2-TPD) was performed on the same instrument; 0.2 g of sample was preheated at 750 °C for 1 h under He (30 mL/min), then cooled down to 50 °C. O2 adsorption was conducted at this temperature, followed by purging with He (30 mL/min) for 2 h. The temperature was then raised from 50 to 800 °C at a ramping rate of 10 °C/min. The desorbed CO2 and O2 were detected with a thermal conductivity detector (TCD). Field-emission scanning electron microscopy (FESEM) images were taken using a Hitachi S-4800 instrument (Hitachi, Tokyo, Japan). Transmission electron microscopy (TEM) images were recorded on an FEI Tecnai G2 F20 S-TWIN instrument (FEI, Hillsboro, OR, USA). Fourier transform infrared (FTIR) spectra were recorded on a Nicolet Avatar 360 spectrometer (Nicolet, Madison, WI, USA). 30 mg of the spent catalyst and 300 mg of KBr were first mixed uniformly; 40 mg of the mixture was then pressed into a self-supporting disk.

3.3. Catalytic Tests

The oxidative coupling of methane reaction was performed with a fixed-bed flow reactor at atmospheric pressure, with a quartz tube internal diameter of 6 mm. Here, 0.2 g of the catalyst (40–60 mesh) was placed in the middle of the reactor, with the downstream of the catalyst fixed with quartz wool. The catalytic performance was evaluated using a mixture of methane and oxygen (CH4/O2 = 4/1 molar ratio) as feed gas, with a total flow rate of 60 mL/min, which results in a gas hourly space velocity (GHSV) of 18,000 mL/(g•h). Before the reaction, the catalyst was pretreated at 750 °C in Ar (30 mL/min) for 1 h. The reaction temperature (actually the catalyst bed temperature) was monitored by a thermocouple placed in the middle of the catalyst bed. The reaction products were analyzed by an on-line GC equipped with a TCD and a 2-m Shincarbon ST packed column (for separation of H2, O2, CO, CH4, and CO2) and by another on-line GC equipped with a FID and a 50-m PoraPLOT Q capillary column (for the separation of CH4, C2H4, C2H6, C3H6, and C3H8). Prior to the analysis using TCD, the products were passed through a cold trap at −3 °C to remove most of water generated during the reaction. The CH4 conversion and C2-C3 selectivity were calculated using the standard normalization method based on carbon atom balance. The typical GC chromatograms showing the reaction products are given in Figure S4.

4. Conclusions

In this work, we developed Ho2O3 and Sr-Ho2O3 nanosheet catalysts for low-temperature OCM reaction. The HR-TEM images revealed that Ho2O3 and Sr-Ho2O3 nanosheets predominantly expose (222) facets. The Ho2O3 nanosheets outperformed Ho2O3 nanoparticles, which could be associated with the preferentially exposed (222) facet on the surface of the former catalyst. The ratio of (O + O2)/O2−, the amount of chemisorbed oxygen species, and the moderate basic sites were enhanced upon the addition of small amounts of Sr to Ho2O3 nanosheets, as demonstrated by XPS, O2-TPD, and CO2-TPD, respectively. This, in turn, resulted in an improved catalytic performance. The optimal 0.04Sr-Ho2O3 nanosheets with a Sr/Ho molar ratio of 0.04 afforded a methane conversion of 24.0% with 56.7% C2-C3 selectivity at 650 °C. Moreover, this catalyst exhibited good stability in the OCM reaction for 60 h of time on stream. A good correlation between the C2-C3 yield and amount of moderate basic sites on the catalysts was established.

Supplementary Materials

The following are available online at https://www.mdpi.com/2073-4344/11/3/388/s1, Figure S1: Comparison of catalytic performances of our catalyst 0.04Sr-Ho2O3 and three reference catalysts at different temperatures: (a) CH4 conversion and (b) C2-C3 selectivity. (▼) 0.04Sr-Ho2O3-NS, (▲) 0.04Sr-La2O3, (●) 3%Li/MgO, (■) 0.04Sr-CeO2, Figure S2: TEM image of Ho2O3-NP, Figure S3: XPS spectra of O 1s on Ho2O3-NP (a), Ho2O3-NS (b), 0.02Sr-Ho2O3-NS (c), 0.04Sr-Ho2O3-NS (d) and 0.06Sr-Ho2O3-NS (e), Figure S4: The typical GC chromatograms detected by a FID (a) and a TCD (b), Scheme S1: Proposed reaction mechanism of methane transformation to ethane, ethylene, propane and propylene.

Author Contributions

C.M. and W.H. conceived and designed the experiments; Y.F. performed the experiments; Y.Y., W.H., and Z.G. analyzed the data; Y.F. wrote the paper; C.M. and W.H. revised the paper. All authors have read and agreed to the published version of the manuscript.

Funding

This work was funded by the National Key R&D Program of China (Grant No. 2017YFB0602200), the National Natural Science Foundation of China (Grant No. 91645201), the Science and Technology Commission of Shanghai Municipality (Grant No. 19DZ2270100), and the Shanghai Research Institute of Petrochemical Technology SINOPEC (Grant No. 33750000-19-ZC0607-0005).

Conflicts of Interest

The authors declare no conflict of interest.

References

  1. Lee, J.; Oyama, S. Oxidative coupling of methane to higher hydrocarbons. Catal. Rev. Sci. Eng. 1988, 30, 249–280. [Google Scholar] [CrossRef]
  2. Arndt, S.; Laugel, G.; Levchenko, S.; Horn, R.; Baerns, M.; Scheffler, M.; Schlögl, R.; Schomäcker, R. A critical assessment of Li/MgO-based catalysts for the oxidative coupling of methane. Catal. Rev. Sci. Eng. 2011, 53, 424–514. [Google Scholar] [CrossRef]
  3. Han, B.; Yang, Y.; Xu, Y.; Etim, U.J.; Qiao, K.; Xu, B.; Yan, Z. A review of the direct oxidation of methane to methanol. Chin. J. Catal. 2016, 37, 1206–1215. [Google Scholar] [CrossRef]
  4. Mesters, C. A selection of recent advances in C1 chemistry. Annu. Rev. Chem. Biomol. Eng. 2016, 7, 223–238. [Google Scholar] [CrossRef] [PubMed]
  5. Galadima, A.; Muraza, O. Revisiting the oxidative coupling of methane to ethylene in the golden period of shale gas: A review. J. Ind. Eng. Chem. 2016, 37, 1–13. [Google Scholar] [CrossRef]
  6. Pierre, S.; Pan, X.L.; Bao, X.H. Direct conversion of methane to value-added chemicals over heterogeneous catalysts: Challenges and prospects. Chem. Rev. 2017, 117, 8497–8520. [Google Scholar]
  7. Gambo, Y.; Jalil, A.A.; Triwahyono, S.; Abdulrasheed, A.A. Recent advances and future prospect in catalysts for oxidative coupling of methane to ethylene: A review. J. Ind. Eng. Chem. 2018, 59, 218–229. [Google Scholar] [CrossRef]
  8. Keller, G.E.; Bhasin, M.M. Synthesis of ethylene via oxidative coupling of methane: I. Determination of active catalysts. J. Catal. 1982, 73, 9–19. [Google Scholar] [CrossRef]
  9. Ito, T.; Lunsford, J.H. Synthesis of ethylene and ethane by partial oxidation of methane over lithium-doped magnesium-oxide. Nature 1985, 314, 721–722. [Google Scholar] [CrossRef]
  10. Driscoll, D.J.; Martir, W.; Wang, J.X.; Lunsford, J.H. Formation of gas-phase methyl radicals over MgO. J. Am. Chem. Soc. 1985, 107, 58–63. [Google Scholar] [CrossRef]
  11. Peil, K.P.; Goodwin, J.G.; Marcelin, G. Surface phenomena during the oxidative coupling of methane over Li/MgO. J. Catal. 1991, 131, 143–155. [Google Scholar] [CrossRef]
  12. Nagaoka, K.; Karasuda, T.; Aika, K. The effect of SnO2 addition to Li/MgO catalysts for the oxidative coupling of methane. J. Catal. 1999, 181, 160–164. [Google Scholar] [CrossRef]
  13. Amin, N.A.S.; Pheng, S.E. Influence of process variables and optimization of ethylene yield in oxidative coupling of methane over Li/MgO catalyst. Chem. Eng. J. 2006, 116, 187–195. [Google Scholar] [CrossRef]
  14. Tang, L.; Yamaguchi, D.; Wong, L.; Burke, N.; Chiang, K. The promoting effect of ceria on Li/MgO catalysts for the oxidative coupling of methane. Catal. Today 2011, 178, 172–180. [Google Scholar] [CrossRef]
  15. Arndt, S.; Simon, U.; Kiefer, K.; Otremba, T.; Siemensmeyer, K.; Wollgarten, M.; Berthold, A.; Schmidt, F.; Görke, O.; Schomäcker, R.; et al. Li/MgO catalysts doped with alio-valent ions. Part I: Structure, composition, and catalytic properties. ChemCatChem 2017, 9, 3583–3596. [Google Scholar] [CrossRef] [Green Version]
  16. Fang, X.; Li, S.; Lin, J.; Gu, J.; Yan, D. Preparation and characterization of catalyst for oxidative coupling of methane. J. Mol. Catal. 1992, 6, 254–262. [Google Scholar]
  17. Ji, S.; Xiao, T.; Li, S.; Chou, L.; Zhang, B.; Xu, C.; Hou, R.; York, A.P.E.; Green, M.L.H. Surface WO4 tetrahedron: The essence of the oxidative coupling of methane over M-W-Mn/SiO2 catalysts. J. Catal. 2003, 220, 47–56. [Google Scholar] [CrossRef]
  18. Wang, J.; Chou, L.; Zhang, B.; Song, H.; Zhao, J.; Yang, J.; Li, S. Comparative study on oxidation of methane to ethane and ethylene over Na2WO4-Mn/SiO2 catalysts prepared by different methods. J. Mol. Catal. A 2006, 245, 272–277. [Google Scholar] [CrossRef]
  19. Arndt, S.; Otremba, T.; Simon, U.; Yildiz, M.; Schubert, H.; Schomäcker, R. Mn–Na2WO4/SiO2 as catalyst for the oxidative coupling of methane. What is really known? Appl. Catal. A 2012, 425–426, 53–61. [Google Scholar] [CrossRef]
  20. Ghose, R.; Hwang, H.T.; Varma, A. Oxidative coupling of methane using catalysts synthesized by solution combustion method: Catalyst optimization and kinetic studies. Appl. Catal. A 2014, 472, 39–46. [Google Scholar] [CrossRef]
  21. Elkins, T.W.; Hagelin-Weaver, H.E. Characterization of Mn-Na2WO4/SiO2 and Mn-Na2WO4/MgO catalysts for the oxidative coupling of methane. Appl. Catal. A 2015, 497, 96–106. [Google Scholar] [CrossRef]
  22. Fleischer, V.; Steuer, R.; Parishan, S.; Schomäcker, R. Investigation of the surface reaction network of the oxidative coupling of methane over Na2WO4/Mn/SiO2 catalyst by temperature programmed and dynamic experiments. J. Catal. 2016, 341, 91–103. [Google Scholar] [CrossRef] [Green Version]
  23. Werny, M.J.; Wang, Y.; Girgsdies, F.; Schlögl, R.; Trunschke, A. Fluctuating storage of the active phase in a Mn-Na2WO4/SiO2 catalyst for the oxidative coupling of methane. Angew. Chem. Int. Ed. 2020, 59, 14921–14926. [Google Scholar] [CrossRef]
  24. Wang, P.; Zhao, G.; Wang, Y.; Lu, Y. MnTiO3-driven low-temperature oxidative coupling of methane over TiO2-doped Mn2O3-Na2WO4/SiO2 catalyst. Sci. Adv. 2017, 3, e1603180. [Google Scholar] [CrossRef] [Green Version]
  25. Huang, P.; Zhao, Y.; Zhang, J.; Zhu, Y.; Sun, Y. Exploiting shape effects of La2O3 nanocatalysts for oxidative coupling of methane reaction. Nanoscale 2013, 5, 10844–10848. [Google Scholar] [CrossRef]
  26. Jiang, T.; Song, J.; Huo, M.; Yang, N.; Liu, J.; Zhang, J.; Sun, Y.; Zhu, Y. La2O3 catalysts with diverse spatial dimensionality for oxidative coupling of methane to produce ethylene and ethane. RSC Adv. 2016, 6, 34872–34876. [Google Scholar] [CrossRef]
  27. Fu, B.; Jiang, T.; Zhu, Y. Structural effect of one-dimensional samarium oxide catalysts on oxidative coupling of methane. J. Nanosci. Nanotechnol. 2018, 18, 3398–3404. [Google Scholar] [CrossRef]
  28. Fan, Y.; Sun, M.; Miao, C.; Yue, Y.; Hua, W.; Gao, Z. Morphology effects of nanoscale Er2O3 and Sr-Er2O3 catalysts for oxidative coupling of methane. Catal. Lett. 2021, 1–10. [Google Scholar] [CrossRef]
  29. Song, J.; Sun, Y.; Ba, R.; Huang, S.; Zhao, Y.; Zhang, J.; Sun, Y.; Zhu, Y. Monodisperse Sr–La2O3 hybrid nanofibers for oxidative coupling of methane to synthesize C2 hydrocarbons. Nanoscale 2015, 7, 2260–2264. [Google Scholar] [CrossRef]
  30. Sun, Y.; Shen, Y.; Song, J.; Ba, R.; Huang, S.; Zhao, Y.; Zhang, J.; Sun, Y.; Zhu, Y. Facet-controlled CeO2 nanocrystals for oxidative coupling of methane. J. Nanosci. Nanotechnol. 2016, 16, 4692–4700. [Google Scholar] [CrossRef]
  31. Wiktorczyk, T. Preparation and optical properties of holmium oxide thin films. Thin Solid Films 2002, 405, 238–242. [Google Scholar] [CrossRef]
  32. Mortazavi-Derazkola, S.; Zinatloo-Ajabshir, S.; Salavati-Niasari, M. New facile preparation of Ho2O3 nanostructured material with improved photocatalytic performance. J. Mater. Sci. 2017, 28, 1914–1924. [Google Scholar] [CrossRef]
  33. Zinatloo-Ajabshir, S.; Mortazavi-Derazkola, S.; Salavati-Niasari, M. Simple sonochemical synthesis of Ho2O3-SiO2 nanocomposites as an effective photocatalyst for degradation and removal of organic contaminant. Ultrason. Sonochem. 2017, 39, 452–460. [Google Scholar] [CrossRef]
  34. Shiri, H.M.; Ehsani, A. A novel and facile route for the electrosynthesis of Ho2O3 nanoparticles and its nanocomposite with p-type conductive polymer: Characterization and electrochemical performance. Bull. Chem. Soc. Jpn. 2016, 89, 1201–1206. [Google Scholar] [CrossRef]
  35. Takenaka, S.; Kaburagi, T.; Yamanaka, I.; Otsuka, K. Oxidative coupling of methane over Li+-added Y2O3 catalyst prepared from Y(OH)3. Catal Today 2001, 71, 31–36. [Google Scholar] [CrossRef]
  36. Campbell, K.D.; Morales, E.; Lunsford, J.H. Gas-phase coupling of methyl radicals during the catalytic partial oxidation of methane. J. Am. Chem. Soc. 1987, 109, 7900–7901. [Google Scholar] [CrossRef]
  37. Al-Zahrani, S.; Song, Q.; Lobban, L.L. Effects of CO2 during oxidative coupling of methane over Li/MgO: Mechanisms and models. Ind. Eng. Chem. Res. 1994, 33, 251–258. [Google Scholar] [CrossRef]
  38. Vislovskii, V.P.; Baidikova, I.V.; Mamedov, E.A.; Rizayev, R.G. Promoting effect of alkali oxides on Bi-Mn catalysts activity in oxidative coupling of methane. React. Kinet. Catal. Lett. 1992, 47, 193–197. [Google Scholar] [CrossRef]
  39. Baronetti, G.T.; Padrό, C.; Scelza, O.A.; Castro, A.A. Structure and reactivity of alkali-doped calcium oxide catalysts for oxidative coupling of methane. Appl. Catal. A 1993, 101, 167–183. [Google Scholar] [CrossRef]
  40. Zhao, M.; Ke, S.; Wu, H.; Xia, W.; Wan, H. Flower-like Sr-La2O3 microspheres with hierarchically porous structures for oxidative coupling of methane. Ind. Eng. Chem. Res. 2019, 58, 22847–22856. [Google Scholar] [CrossRef]
  41. Kharas, K.C.C.; Lunsford, J.H. Catalytic partial oxidation of methane over barium metaplumbate BaPbO3: Possible involvement of peroxide ion. J. Am. Chem. Soc. 1989, 111, 2336–2337. [Google Scholar] [CrossRef]
  42. Peng, X.D.; Richards, D.A.; Stair, P.C. Surface composition and reactivity of lithium-doped magnesium oxide catalysts for oxidative coupling of methane. J. Catal. 1990, 121, 99–109. [Google Scholar] [CrossRef]
  43. Ding, W.; Chen, Y.; Fu, X. Oxidative coupling of methane over Ce4+-doped Ba3WO6 catalysts: Investigation on oxygen species responsible for catalytic performance. Catal. Lett. 1994, 23, 69–78. [Google Scholar] [CrossRef]
  44. Hou, Y.H.; Han, W.C.; Xia, W.S.; Wan, H.L. Structure sensitivity of La2O2CO3 catalysts in the oxidative coupling of methane. ACS Catal. 2015, 5, 1663–1674. [Google Scholar] [CrossRef]
  45. Bai, Y.; Xia, W.; Weng, W.; Lian, M.; Zhao, M.; Wan, H. Influence of phosphate on La-based catalysts for oxidative coupling of methane. Chem. J. Chin. Univ. Chin. 2018, 39, 247–254. [Google Scholar]
  46. Sayle, T.X.T.; Parker, S.C.; Sayle, D.C. Oxidising CO to CO2 using ceria nanoparticles. Phys. Chem. Chem. Phys. 2005, 7, 2936–2941. [Google Scholar] [CrossRef]
  47. Bernal, S.; Botana, F.J.; Garcia, R.; Rodiguez-Izquierdo, J.M. Behaviour of rare earth sesquioxides exposed to atmospheric carbon dioxide and water. React. Soliak. 1987, 4, 23–40. [Google Scholar] [CrossRef]
  48. Djerdj, I.; Garnweitner, G.; Su, D.S.; Niederberger, M. Morphology-controlled nonaqueous synthesis of anisotropic lanthanum hydroxide nanoparticles. J. Solid State Chem. 2007, 180, 2154–2165. [Google Scholar] [CrossRef] [Green Version]
  49. Farrukh, M.A.; Imran, F.; Ali, S.; Khaleeq-ur-Rahman, M.; Naqvi, I.I. Micelle assisted synthesis of La2O3 nanoparticles and their applications in photodegradation of bromophenol blue. Russ. J. Appl. Chem. 2015, 88, 1523–1527. [Google Scholar] [CrossRef]
  50. Spinicci, R.; Tofanari, A. Characterization of catalysts for methane-coupling by means of temperature programmed desorption. Catal. Today 1990, 6, 473–479. [Google Scholar] [CrossRef]
  51. Xu, J.; Zhang, Y.; Xu, X.; Fang, X.; Xi, R.; Liu, Y.; Zheng, R.; Wang, X. Constructing La2B2O7 (B = Ti, Zr, Ce) compounds with three typical crystalline phases for the oxidative coupling of methane: The effect of phase structures, superoxide anions, and alkalinity on the reactivity. ACS Catal. 2019, 9, 4030–4045. [Google Scholar] [CrossRef]
  52. McFarland, E.W.; Metiu, H. Catalysis by Doped Oxides. Chem. Rev. 2013, 113, 4391–4427. [Google Scholar] [CrossRef]
  53. Liang, Q.; Wu, X.; Weng, D.; Xu, H. Oxygen activation on Cu/Mn−Ce mixed oxides and the role in diesel soot oxidation. Catal. Today 2008, 139, 113–118. [Google Scholar] [CrossRef]
  54. Papa, F.; Luminita, P.; Osiceanu, P.; Birjega, R.; Akane, M.; Balint, I. Acid–base properties of the active sites responsible for C2+ and CO2 formation over MO–Sm2O3 (M = Zn, Mg, Ca and Sr) mixed oxides in OCM reaction. J. Mol. Catal. A 2011, 346, 46–54. [Google Scholar] [CrossRef]
  55. Elkins, T.W.; Roberts, S.J.; Hagelin-Weaver, H.E. Effects of alkali and alkaline-earth metal dopants on magnesium oxide supported rare-earth oxide catalysts in the oxidative coupling methane. Appl. Catal. A 2016, 528, 175–190. [Google Scholar] [CrossRef]
  56. Bernal, S.; Blanco, G.; El Amarti, A.; Cifredo, G.; Fitian, L.; Galtayries, A.; Martín, J.; Pintado, J.M. Surface basicity of ceria-supported lanthana. Influence of the calcination temperature. Surf. Interface Anal. 2006, 38, 229–233. [Google Scholar] [CrossRef]
  57. Peng, L.; Xu, J.; Fang, X.; Liu, W.; Xu, X.; Liu, L.; Li, Z.; Peng, H.; Zheng, R.; Wang, X. SnO2 based catalysts with low-temperature performance for oxidative coupling of methane: Insight into the promotional effects of alkali-metal oxides. Eur. J. Inorg. Chem. 2018, 2018, 1787–1799. [Google Scholar] [CrossRef]
  58. Xu, J.; Peng, L.; Fang, X.; Fu, Z.; Liu, W.; Xu, X.; Peng, H.; Zheng, R.; Wang, X. Developing reactive catalysts for low temperature oxidative coupling of methane: On the factors deciding the reaction performance of Ln2Ce2O7 with different rare earth A sites. Appl. Catal. A 2018, 552, 117–128. [Google Scholar] [CrossRef]
  59. Xu, J.; Zhang, Y.; Liu, Y.; Fang, X.; Xu, X.; Liu, W.; Zheng, R.; Wang, X. Optimizing the reaction performance of La2Ce2O7-based catalysts for oxidative coupling of methane (OCM) at lower temperature by lattice doping with Ca cations. Eur. J. Inorg. Chem. 2019, 183–194. [Google Scholar] [CrossRef]
  60. Wang, Z.; Zou, G.; Luo, X.; Liu, H.; Gao, R.; Chou, L.; Wang, X. Oxidative coupling of methane over BaCl2-TiO2-SnO2 catalyst. J. Nat. Gas Chem. 2012, 21, 49–55. [Google Scholar] [CrossRef]
  61. Lee, H.I.; Lee, S.W.; Rhee, C.K.; Sohn, Y. Paramagnetic Ho2O3 nanowires, nano-square sheets, and nanoplates. Ceram. Int. 2018, 44, 17919–17924. [Google Scholar] [CrossRef]
  62. Ito, T.; Wang, J.X.; Lin, C.H.; Lunsford, J.H. Oxidative dimerization of methane over a lithium-promoted magnesium oxide catalyst. J. Am. Chem. Soc. 1985, 107, 5062–5068. [Google Scholar] [CrossRef]
Figure 1. CH4 conversion (a), C2-C3 selectivity (b) and C2-C3 yield (c) as a function of reaction temperature for the Ho2O3 catalysts. (■) Ho2O3-NP (nanoparticles), (●) Ho2O3-NS (nanosheet).
Catalysts 11 00388 g001
Figure 2. Effect of Sr/Ho molar ratio on catalytic performances of Sr-modified Ho2O3 nanosheet (Sr-Ho2O3-NS) catalysts at different temperatures: (a) CH4 conversion, (b) C2-C3 selectivity, and (c) C2-C3 yield. (▼) 600 °C, (▲) 650 °C, (●) 700 °C, (■) 750 °C.
Catalysts 11 00388 g002
Figure 3. CH4 conversion (■) and C2-C3 selectivity (●) with time on stream over 0.04Sr-Ho2O3-NS at 650 °C.
Catalysts 11 00388 g003
Figure 4. XRD patterns of the catalysts. (a) Ho2O3-NP, (b) Ho2O3-NS, (c) 0.02Sr-Ho2O3-NS, (d) 0.04Sr-Ho2O3-NS, (e) 0.06Sr-Ho2O3-NS.
Catalysts 11 00388 g004
Figure 5. SEM images of Ho2O3-NS (a) and 0.04Sr-Ho2O3-NS (b).
Catalysts 11 00388 g005
Figure 6. High resolution (HR) TEM graphs of Ho2O3-NS (a) and 0.04Sr-Ho2O3-NS (b). Insets are the fast Fourier transfer (FFT) patterns of the HR-TEM images.
Catalysts 11 00388 g006
Figure 7. FTIR spectra of 0.04Sr-Ho2O3-NS (a) and 0.06Sr-Ho2O3-NS (b) catalysts after the oxidative coupling of methane (OCM) reaction at 600 °C for 1 h.
Catalysts 11 00388 g007
Figure 8. O2-TPD (temperature programmed desorption) profiles of the catalysts. (a) Ho2O3-NP, (b) Ho2O3-NS, (c) 0.02Sr-Ho2O3-NS, (d) 0.04Sr-Ho2O3-NS, (e) 0.06Sr-Ho2O3-NS.
Catalysts 11 00388 g008
Figure 9. CO2-TPD profiles of the catalysts. (a) Ho2O3-NP, (b) Ho2O3-NS, (c) 0.02Sr-Ho2O3-NS, (d) 0.04Sr-Ho2O3-NS, (e) 0.06Sr-Ho2O3-NS.
Catalysts 11 00388 g009
Figure 10. Relationship between the C2-C3 yield obtained at 700 °C and the amount of moderate basic sites present on the Ho2O3-based catalysts.
Catalysts 11 00388 g010
Table 1. Reaction data of the Ho2O3-NS and Sr-Ho2O3-NS catalysts at 650 °C.
CatalystConversionSelectivity (%)SelectivityYield of
of CH4 (%)C2H4C2H6C3H6C3H8CO2COof C2-C3 (%)C2-C3 (%)
Ho2O3-NS20.014.917.10.30.540.426.832.86.6
0.02Sr-Ho2O3-NS22.325.523.51.51.536.111.952.011.6
0.04Sr-Ho2O3-NS24.027.426.01.61.735.57.856.713.6
0.06Sr-Ho2O3-NS20.621.924.91.21.538.911.649.510.2
Table 2. Textural properties and XPS data of the Ho2O3-based catalysts.
CatalystSBETAveragea = b = cO 1s BE e, FWHM f (eV)(O + O2)/
O2−
(m2/g)size (nm)(nm) dO2−OCO32−O2
Ho2O3-NP7.917.5 ± 3.31.0560529.3/1.7530.8/1.7531.8/1.2532.7/1.21.4
Ho2O3-NS6.1771 ± 232 a
81.9 ± 21.0 b
1.0561529.3/1.6530.6/1.5531.6/1.1532.5/1.41.7
0.02Sr-Ho2O3-NS7.5c1.0571529.3/1.5530.8/1.7531.8/1.2532.6/1.41.9
0.04Sr-Ho2O3-NS7.7761 ± 184 a
82.5 ± 27.9 b
1.0580529.6/1.5530.9/1.6532.0/1.4532.8/1.32.2
0.06Sr-Ho2O3-NS7.2c1.0589529.2/1.8530.7/1.5531.6/1.2532.5/1.32.0
a Average width of nanosheets; b Average thickness of nanosheets; c Not measured; d Lattice parameter; e Binding energy; f Full width at half maximum.
Table 3. O2-TPD and CO2-TPD data of the Ho2O3-based catalysts.
CatalystPeak Temperature
(°C)
Amount of Desorbed O2
(μmol/g)
Amount of Basic Sites
(μmol/g)
IIIIIIWeakModerateTotal
Ho2O3-NP994262.312.83.216.319.5
Ho2O3-NS853442.215.97.030.137.1
0.02Sr-Ho2O3-NS1092639.219.816.761.878.5
0.04Sr-Ho2O3-NS13727511.324.216.269.986.1
0.06Sr-Ho2O3-NS1183099.920.714.663.077.6
Publisher’s Note: MDPI stays neutral with regard to jurisdictional claims in published maps and institutional affiliations.

