
Effects of Preparation Conditions on the Efficiency of Visible-Light-Driven Hydrogen Generation Based on Cd0.25Zn0.75S Photocatalysts

 ,
,
Abstract
:
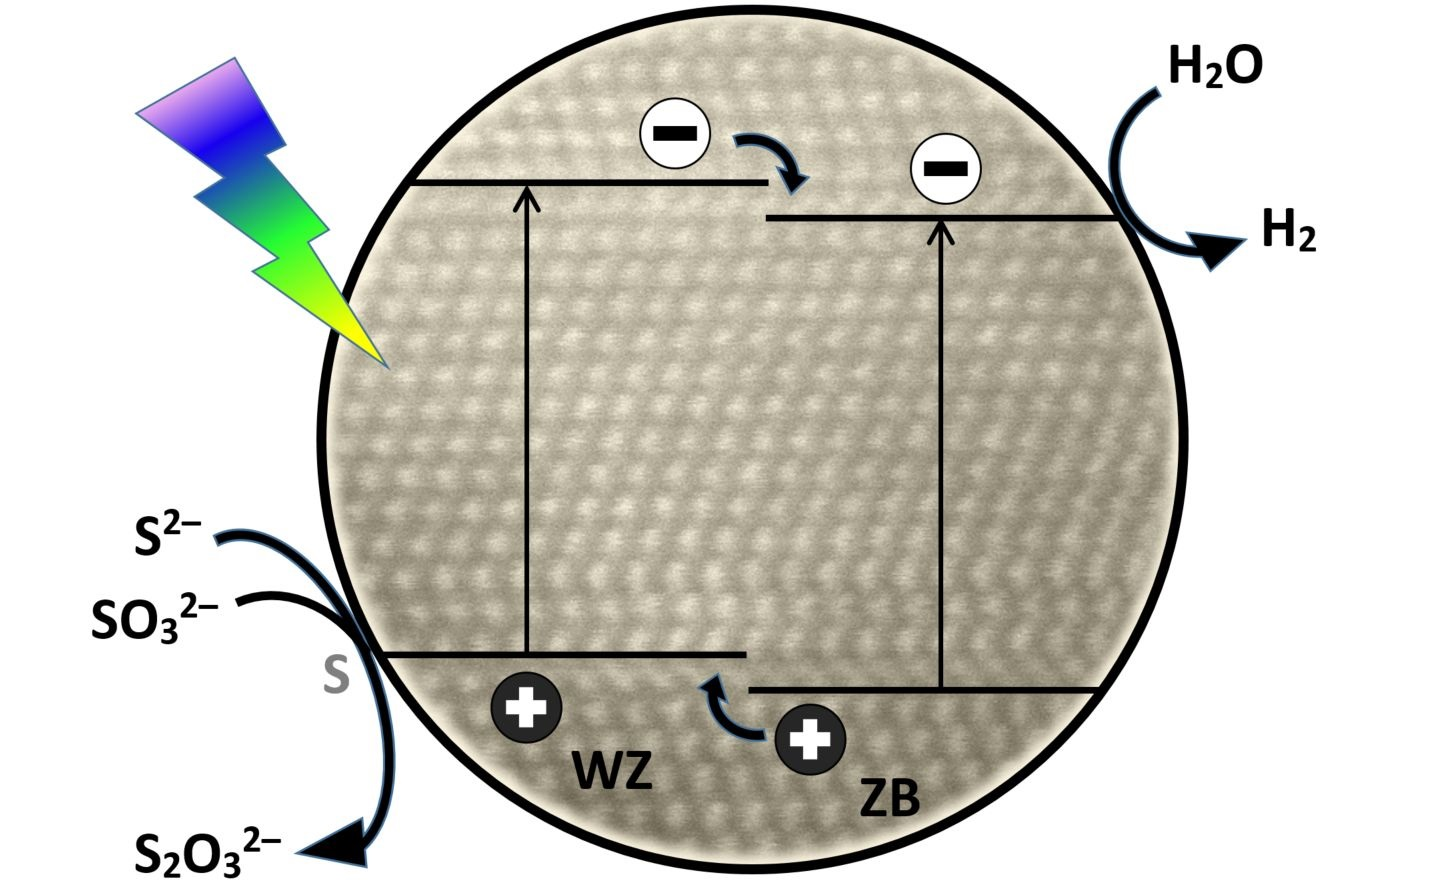
1. Introduction
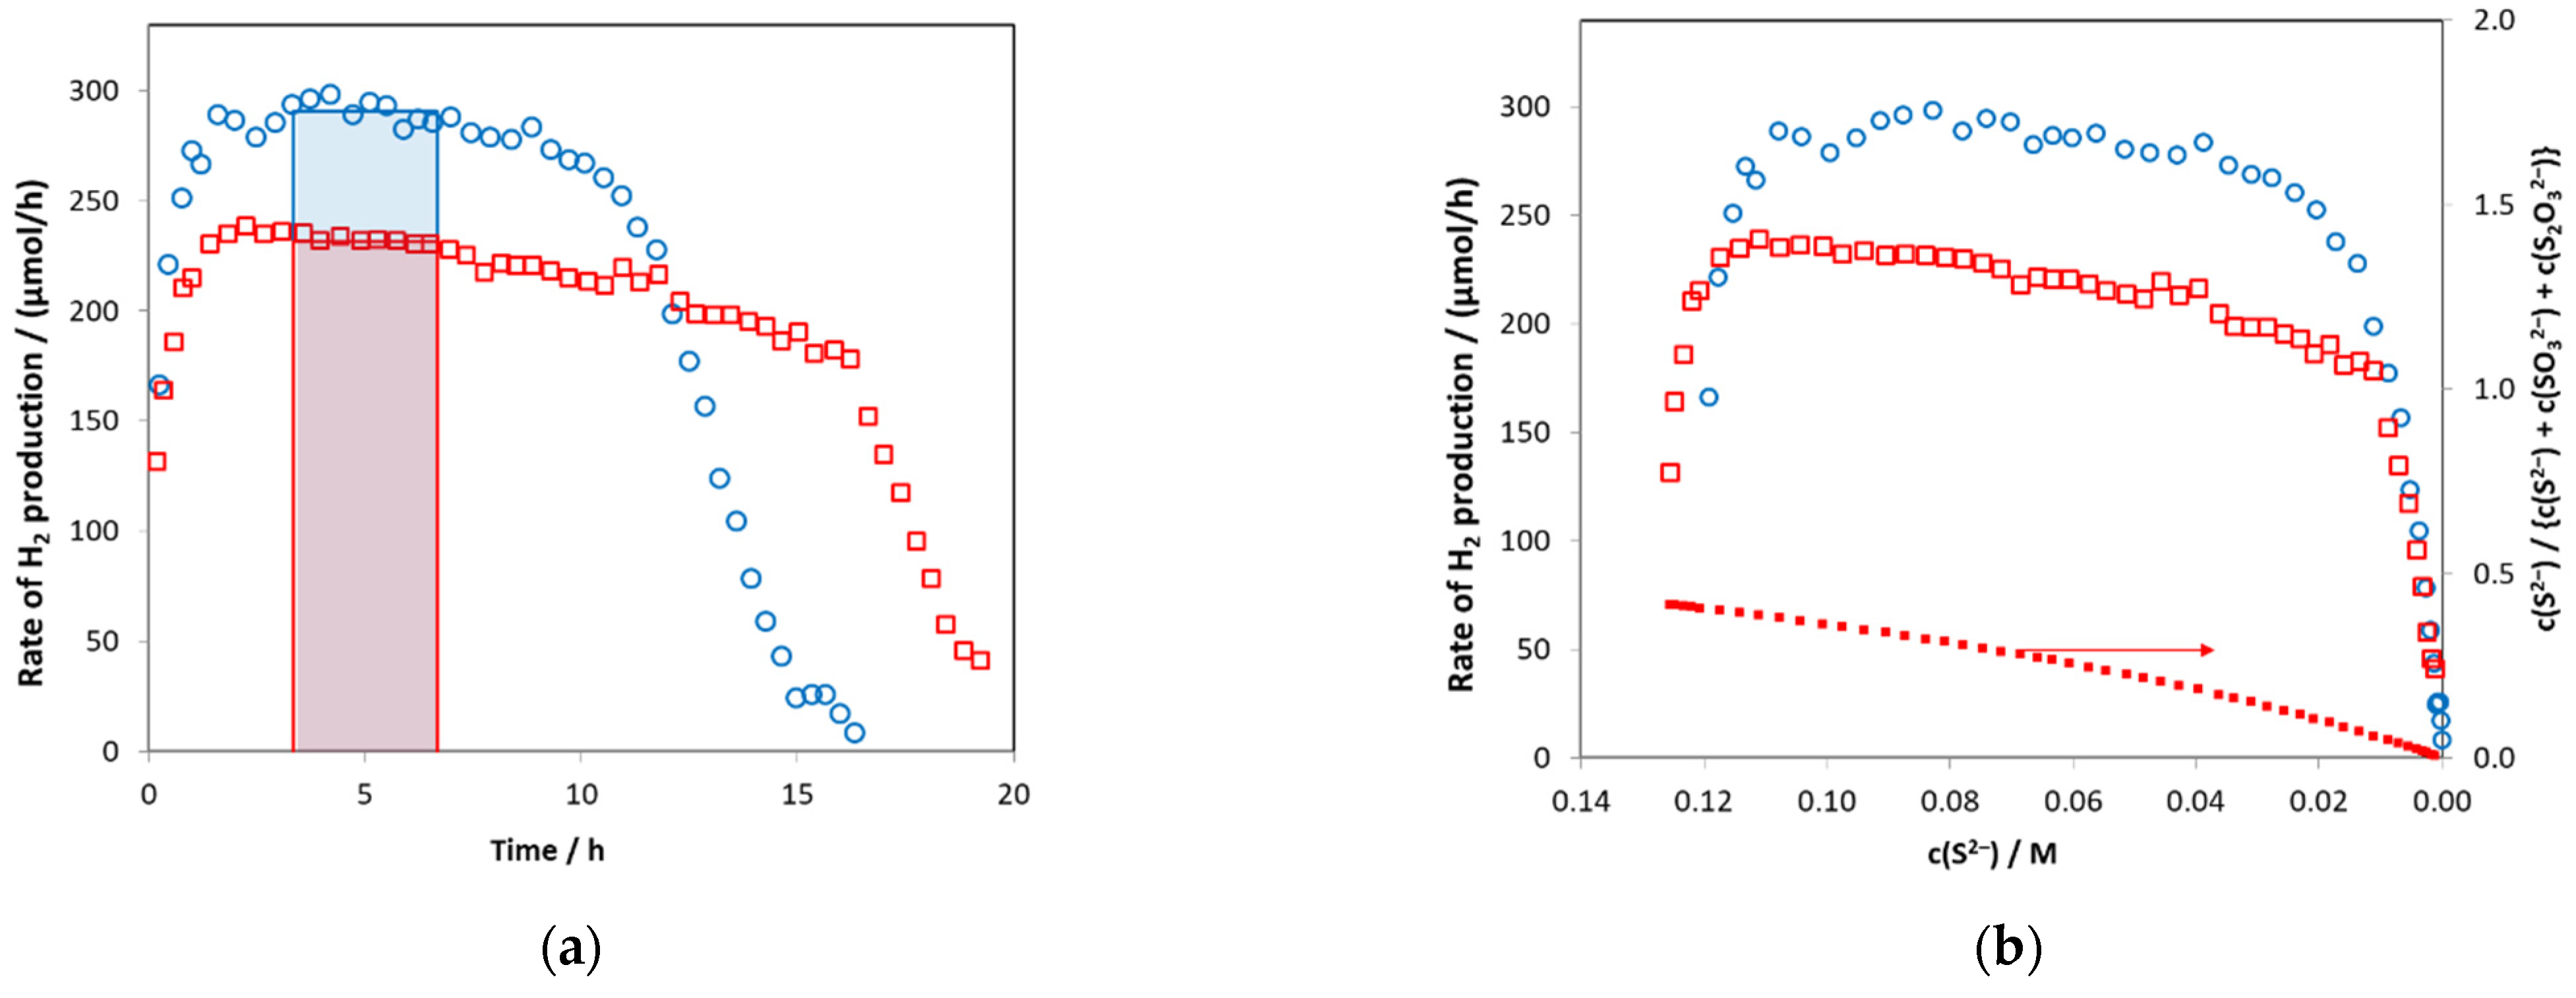
2. Results and Discussion
2.1. The Effect of the Mixing Order
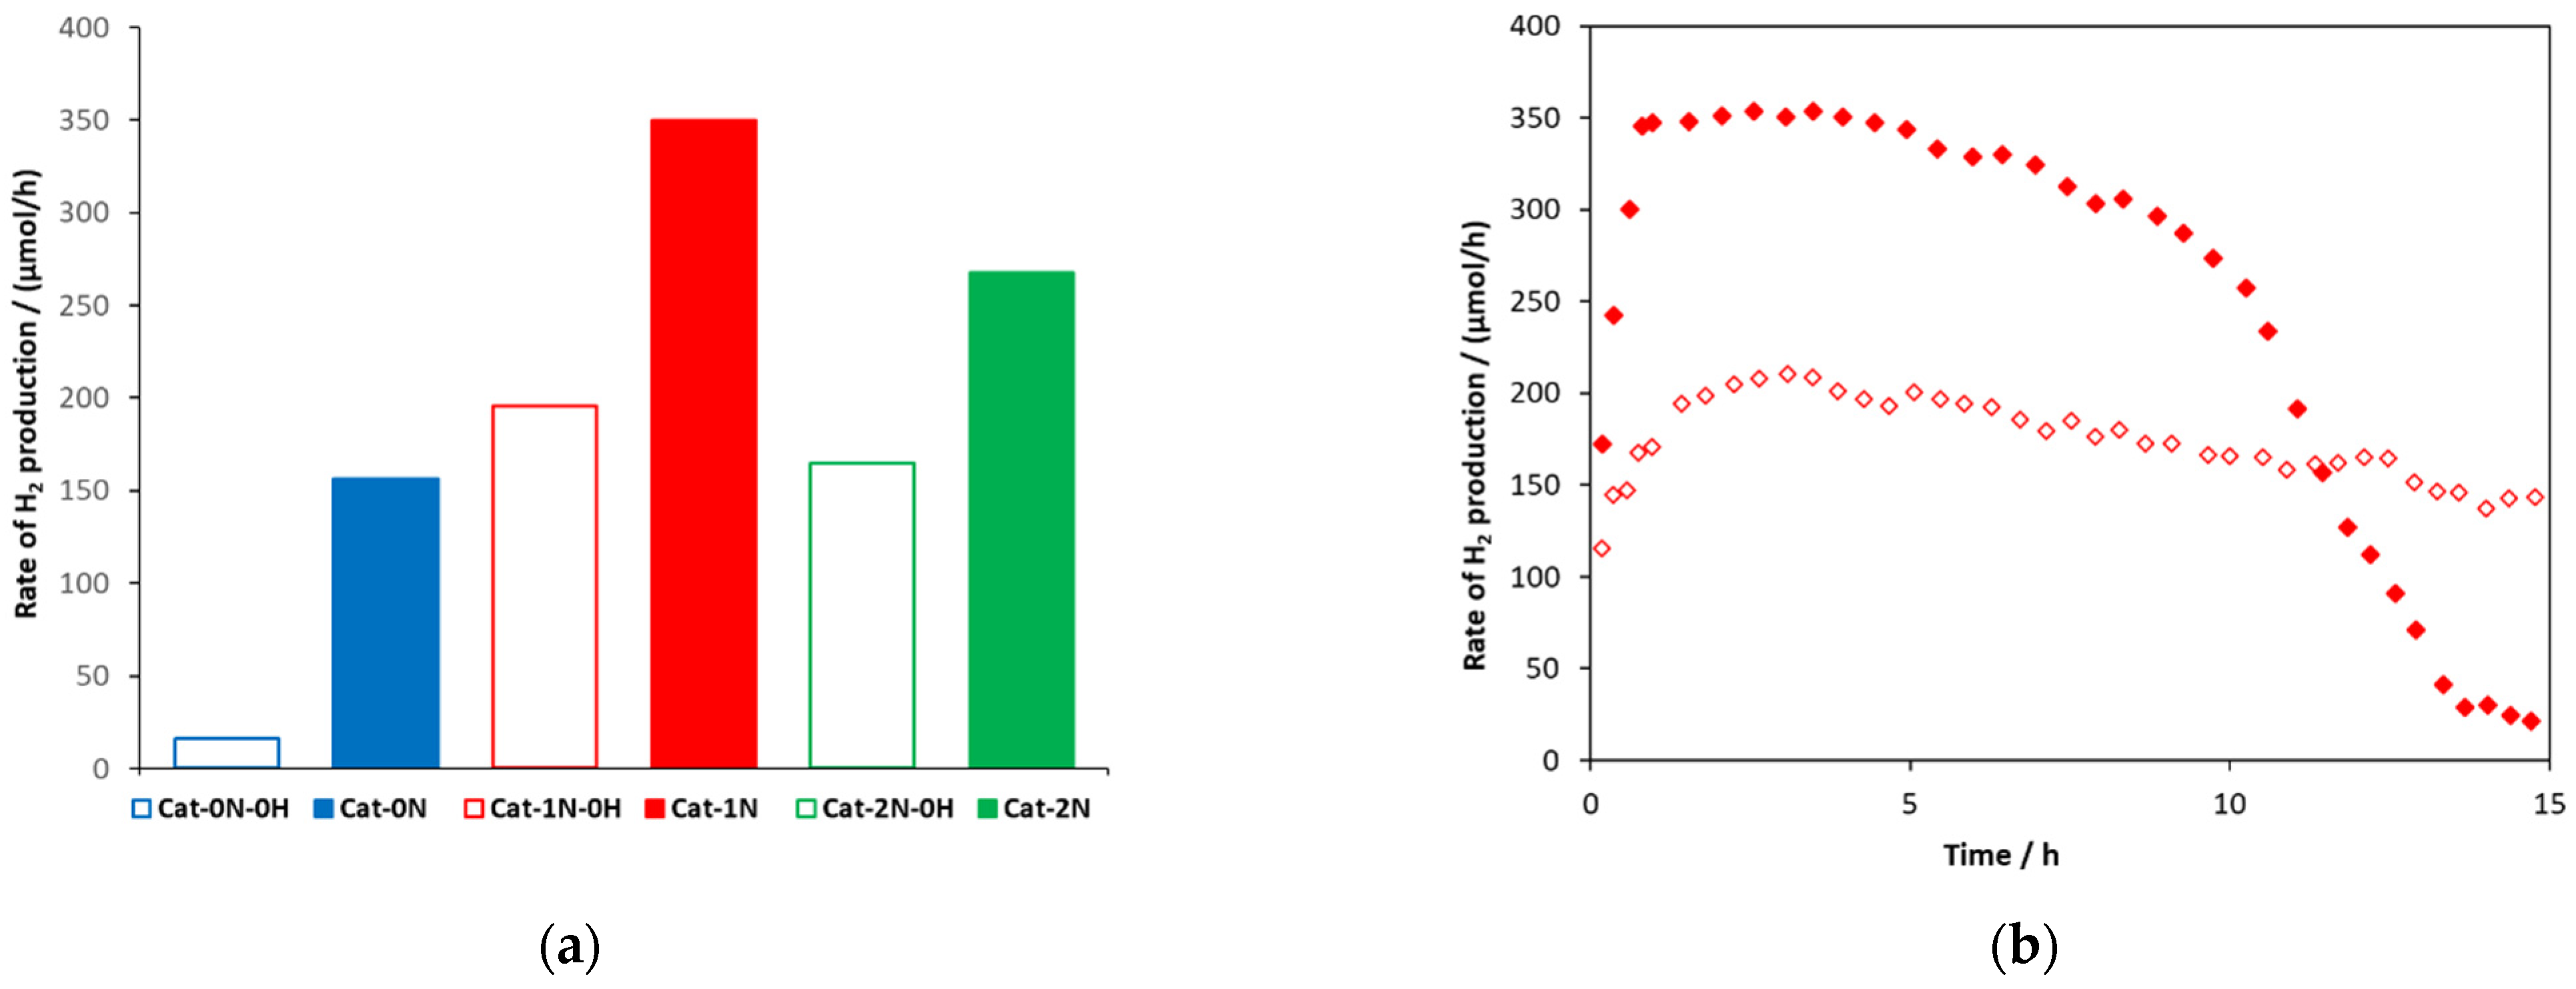
2.2. Photocatalytic Activity of Zn0.75Cd0.25S Catalysts
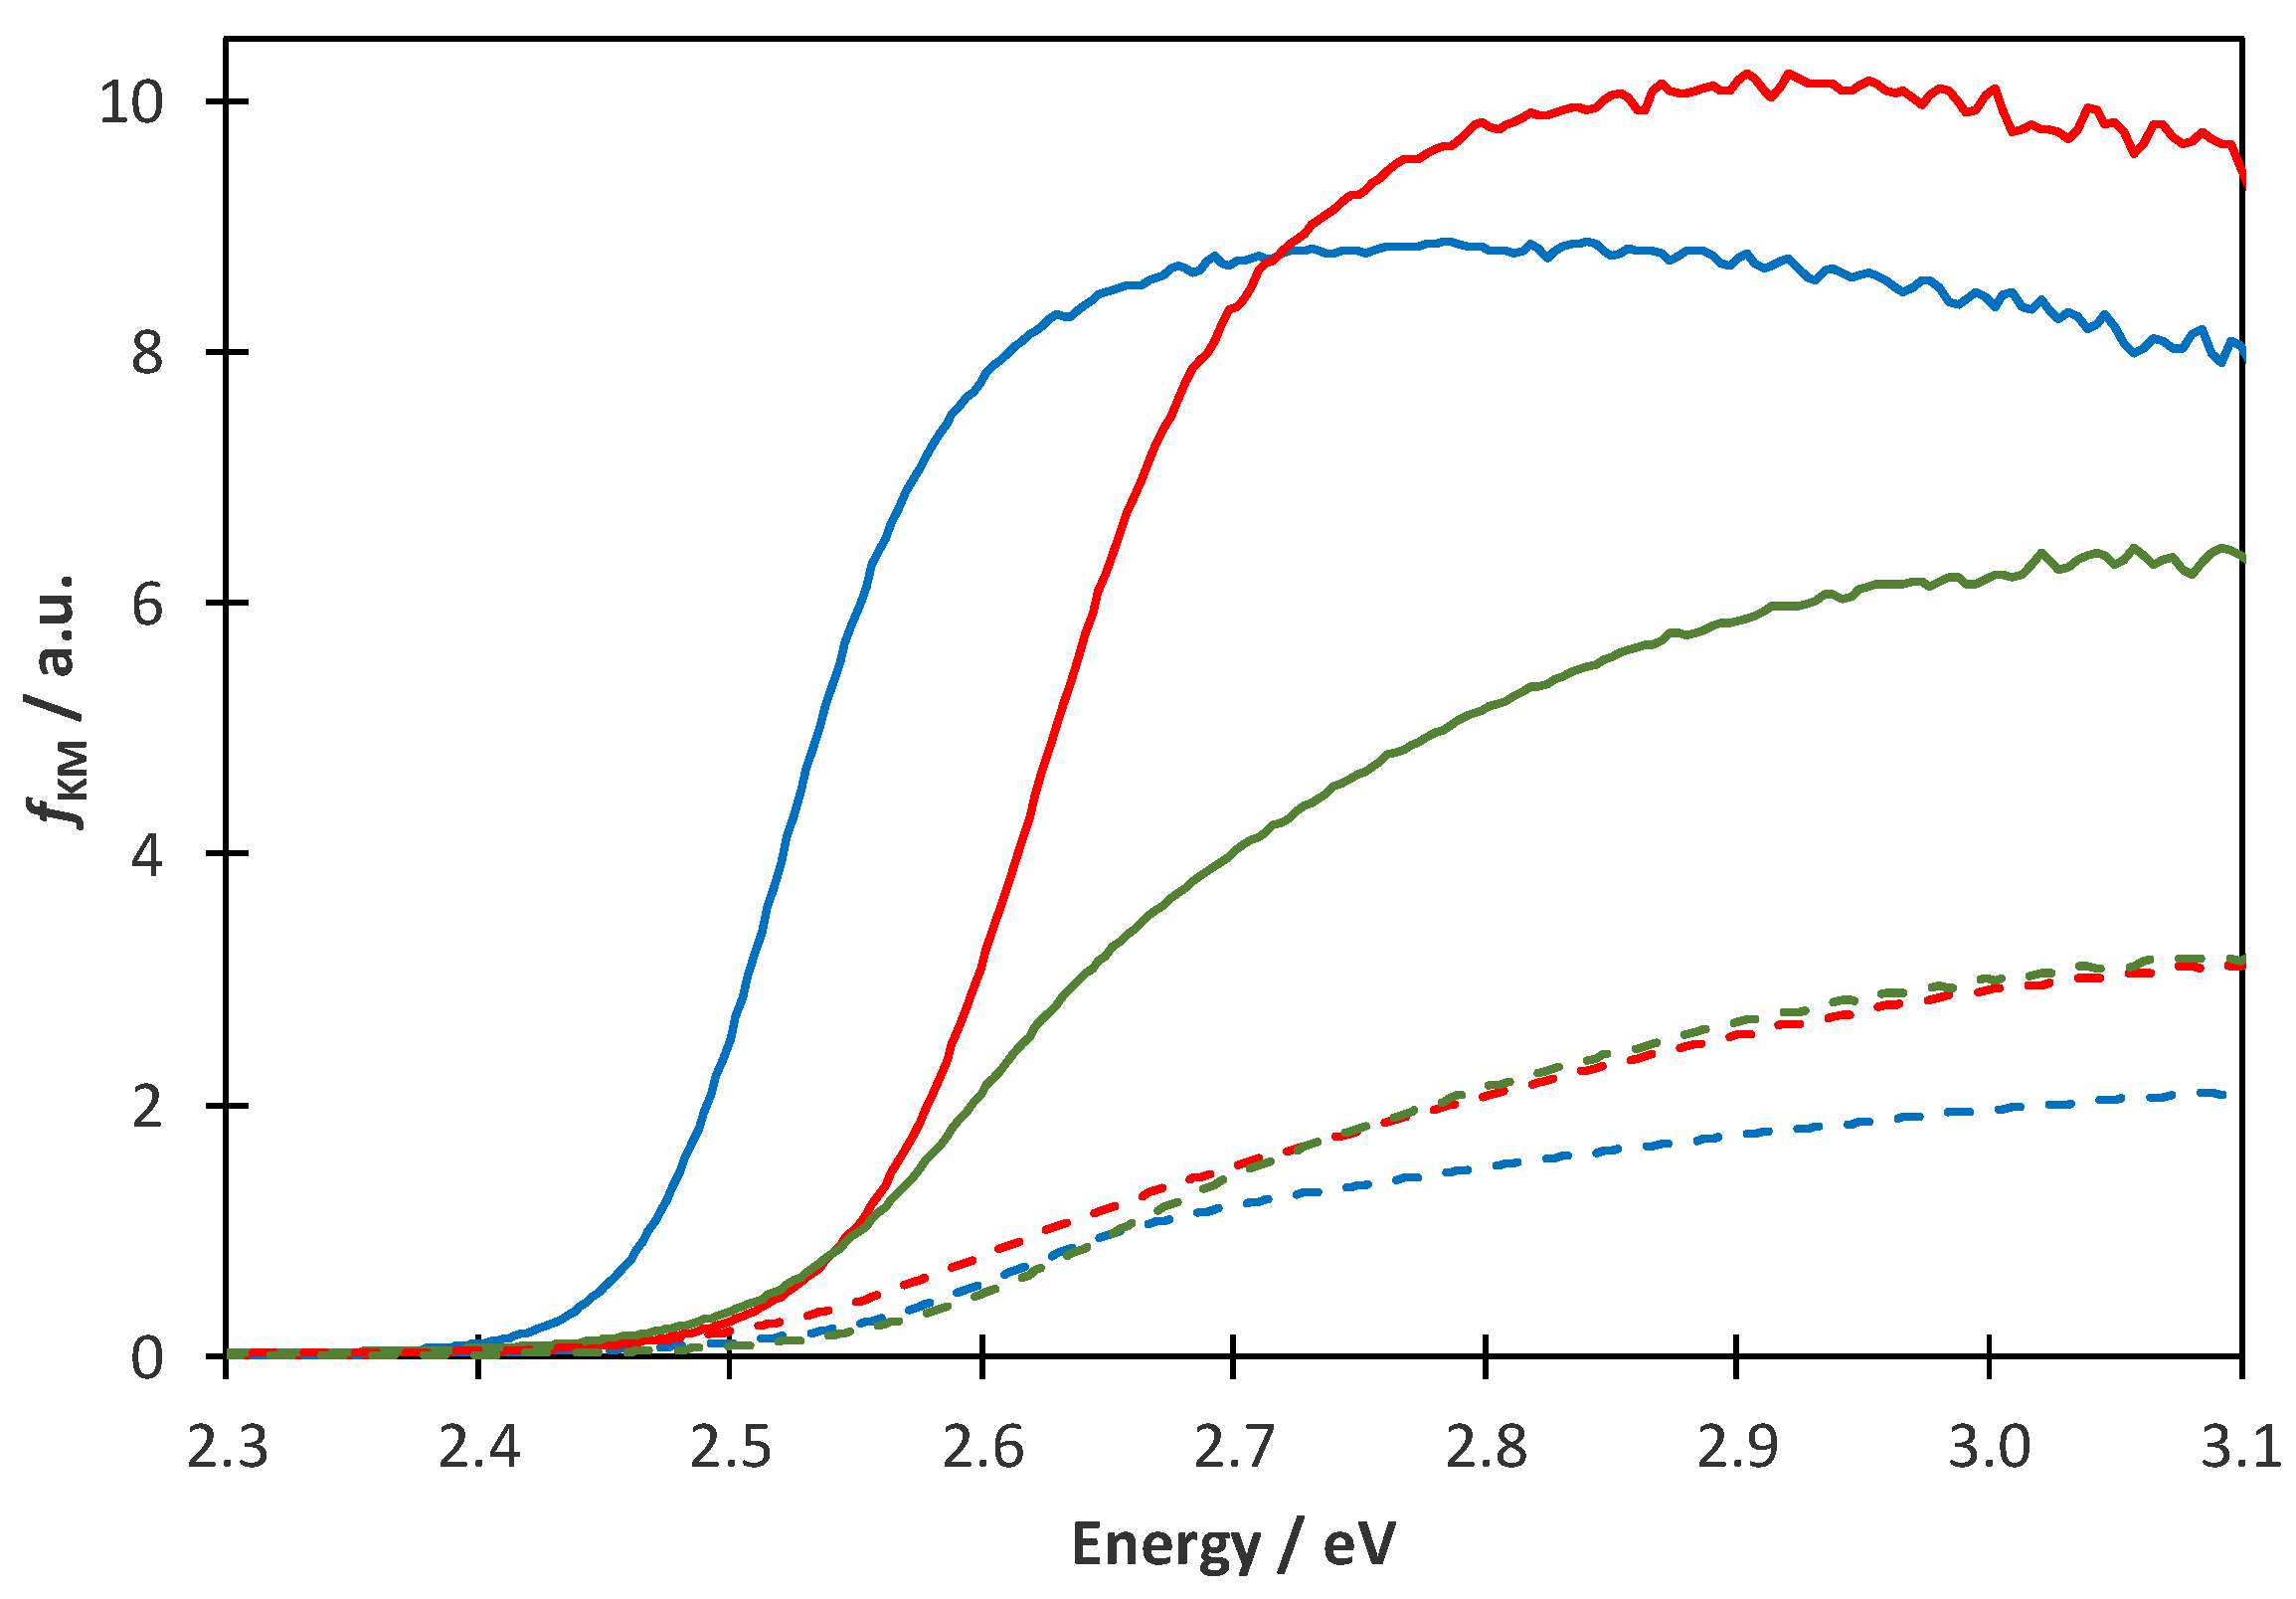
2.3. Diffuse Reflectance Spectra
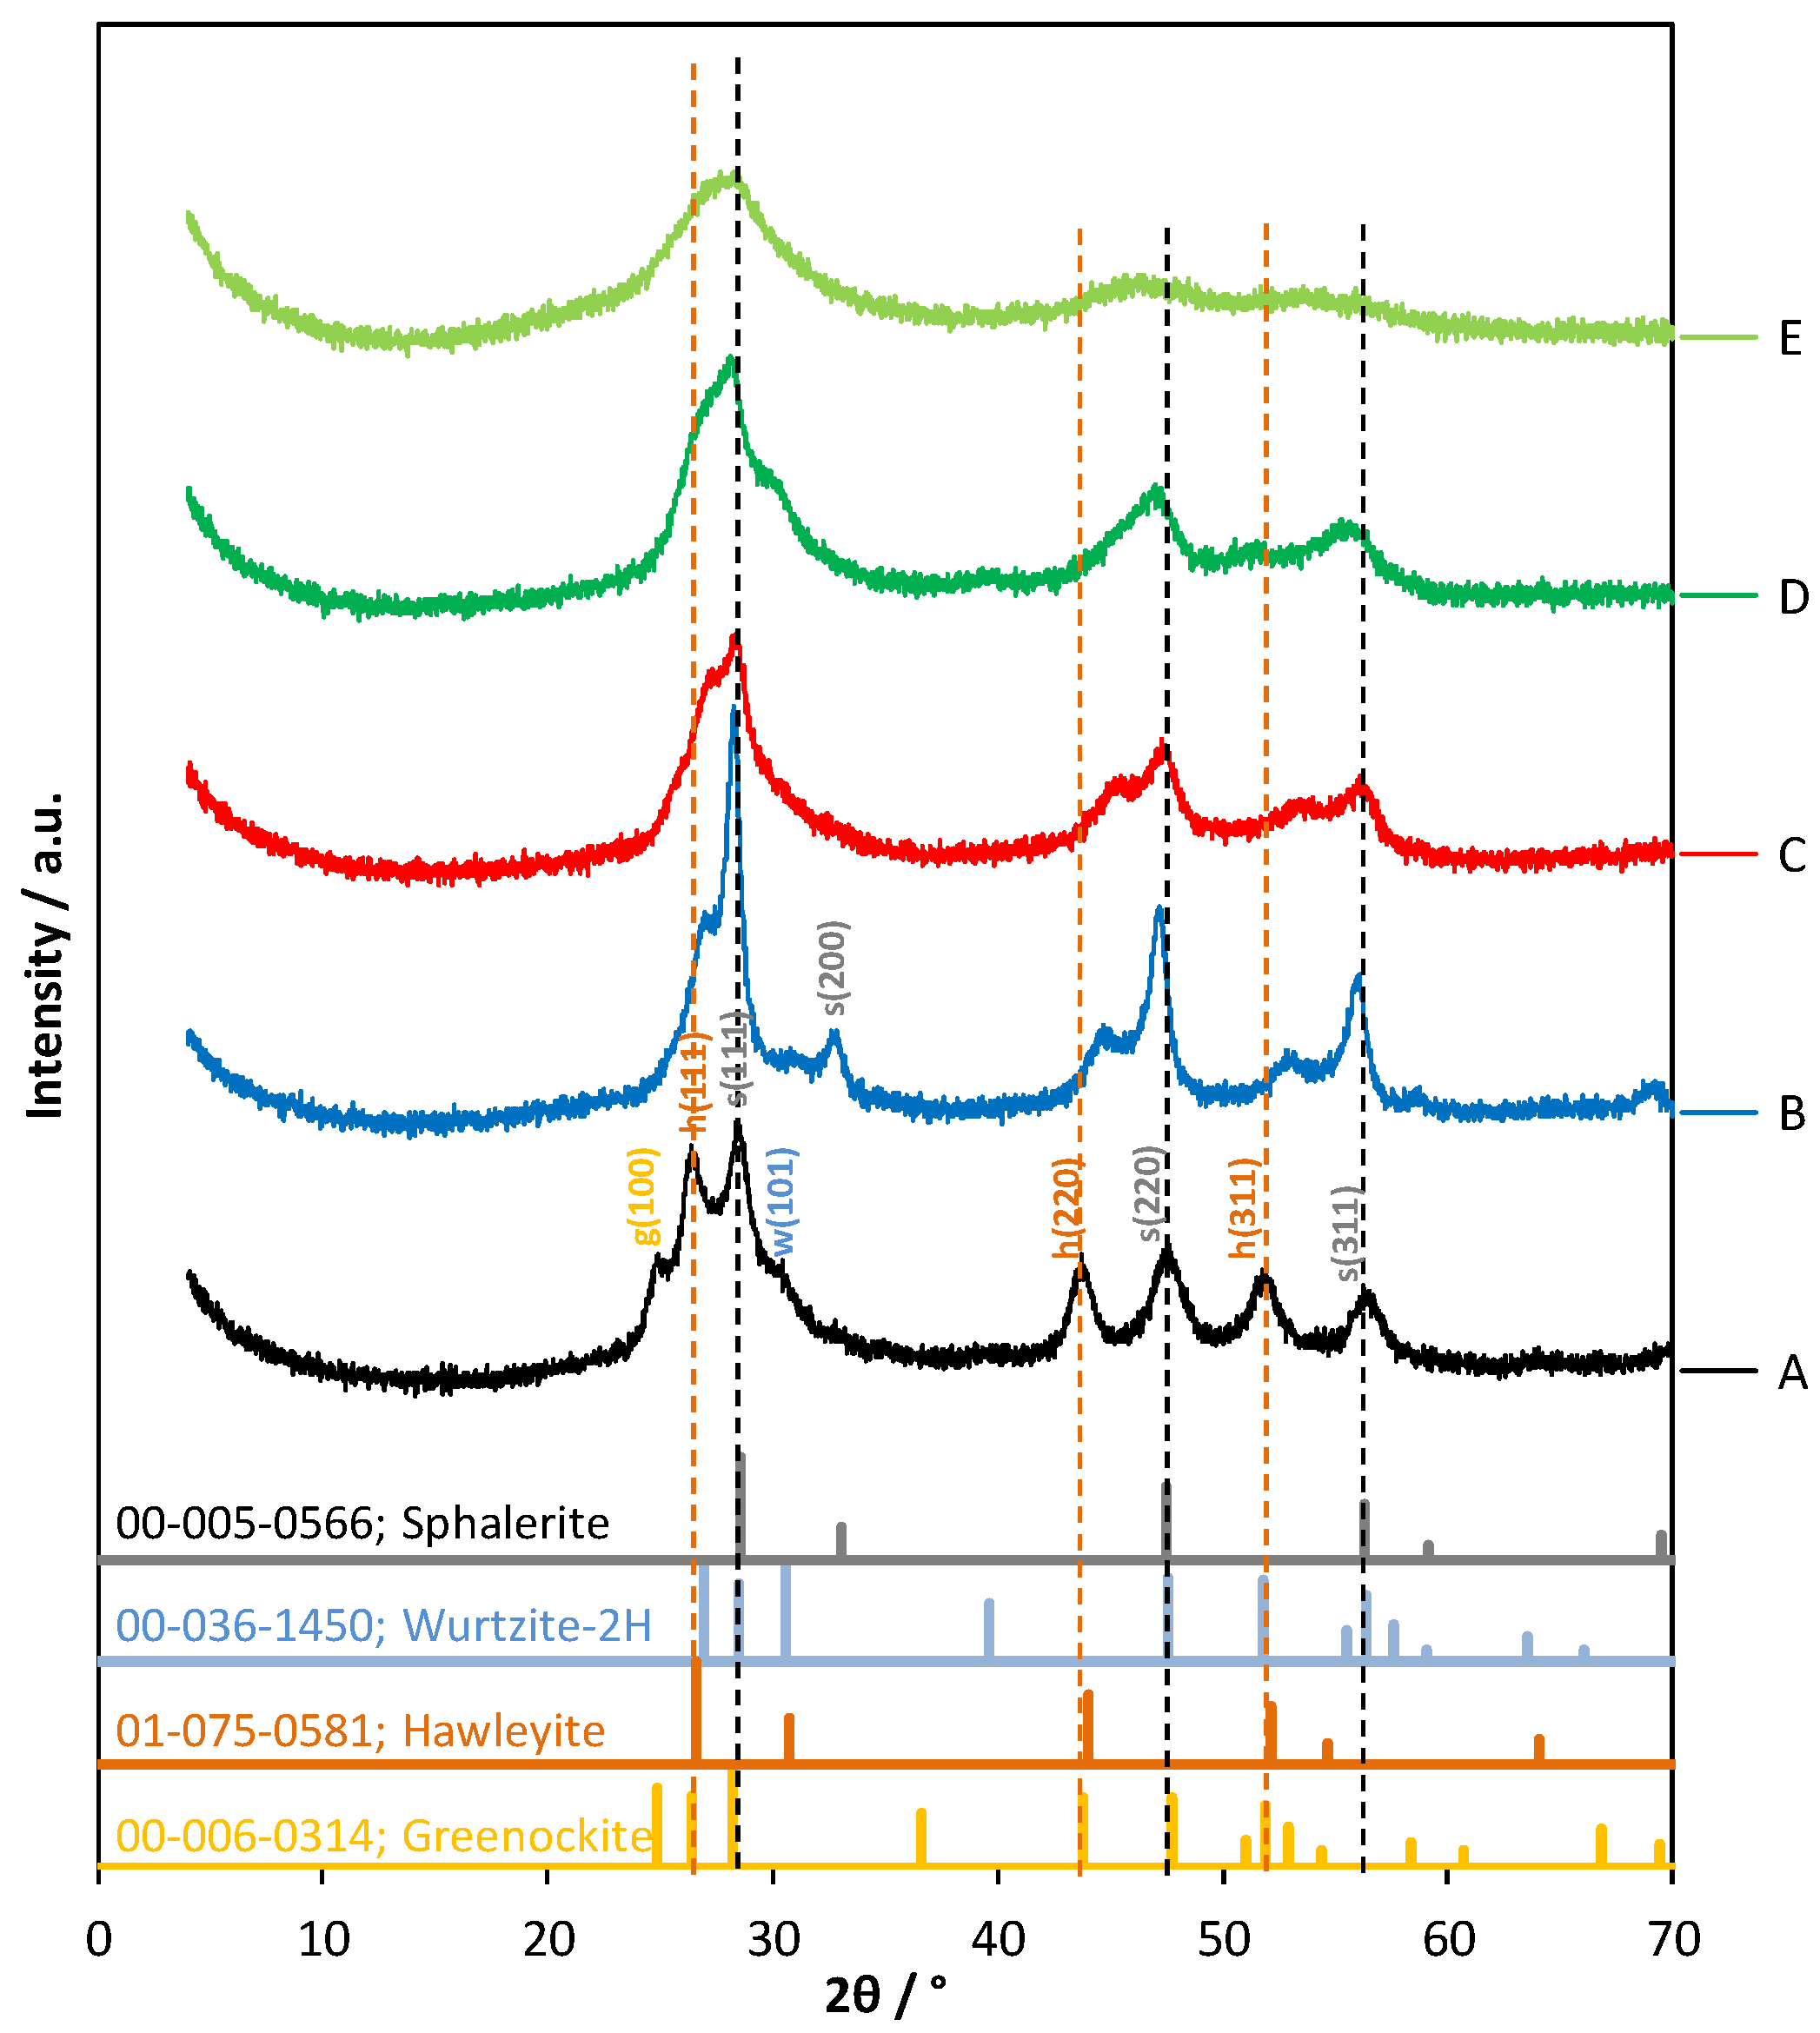
2.4. XRD Pattern
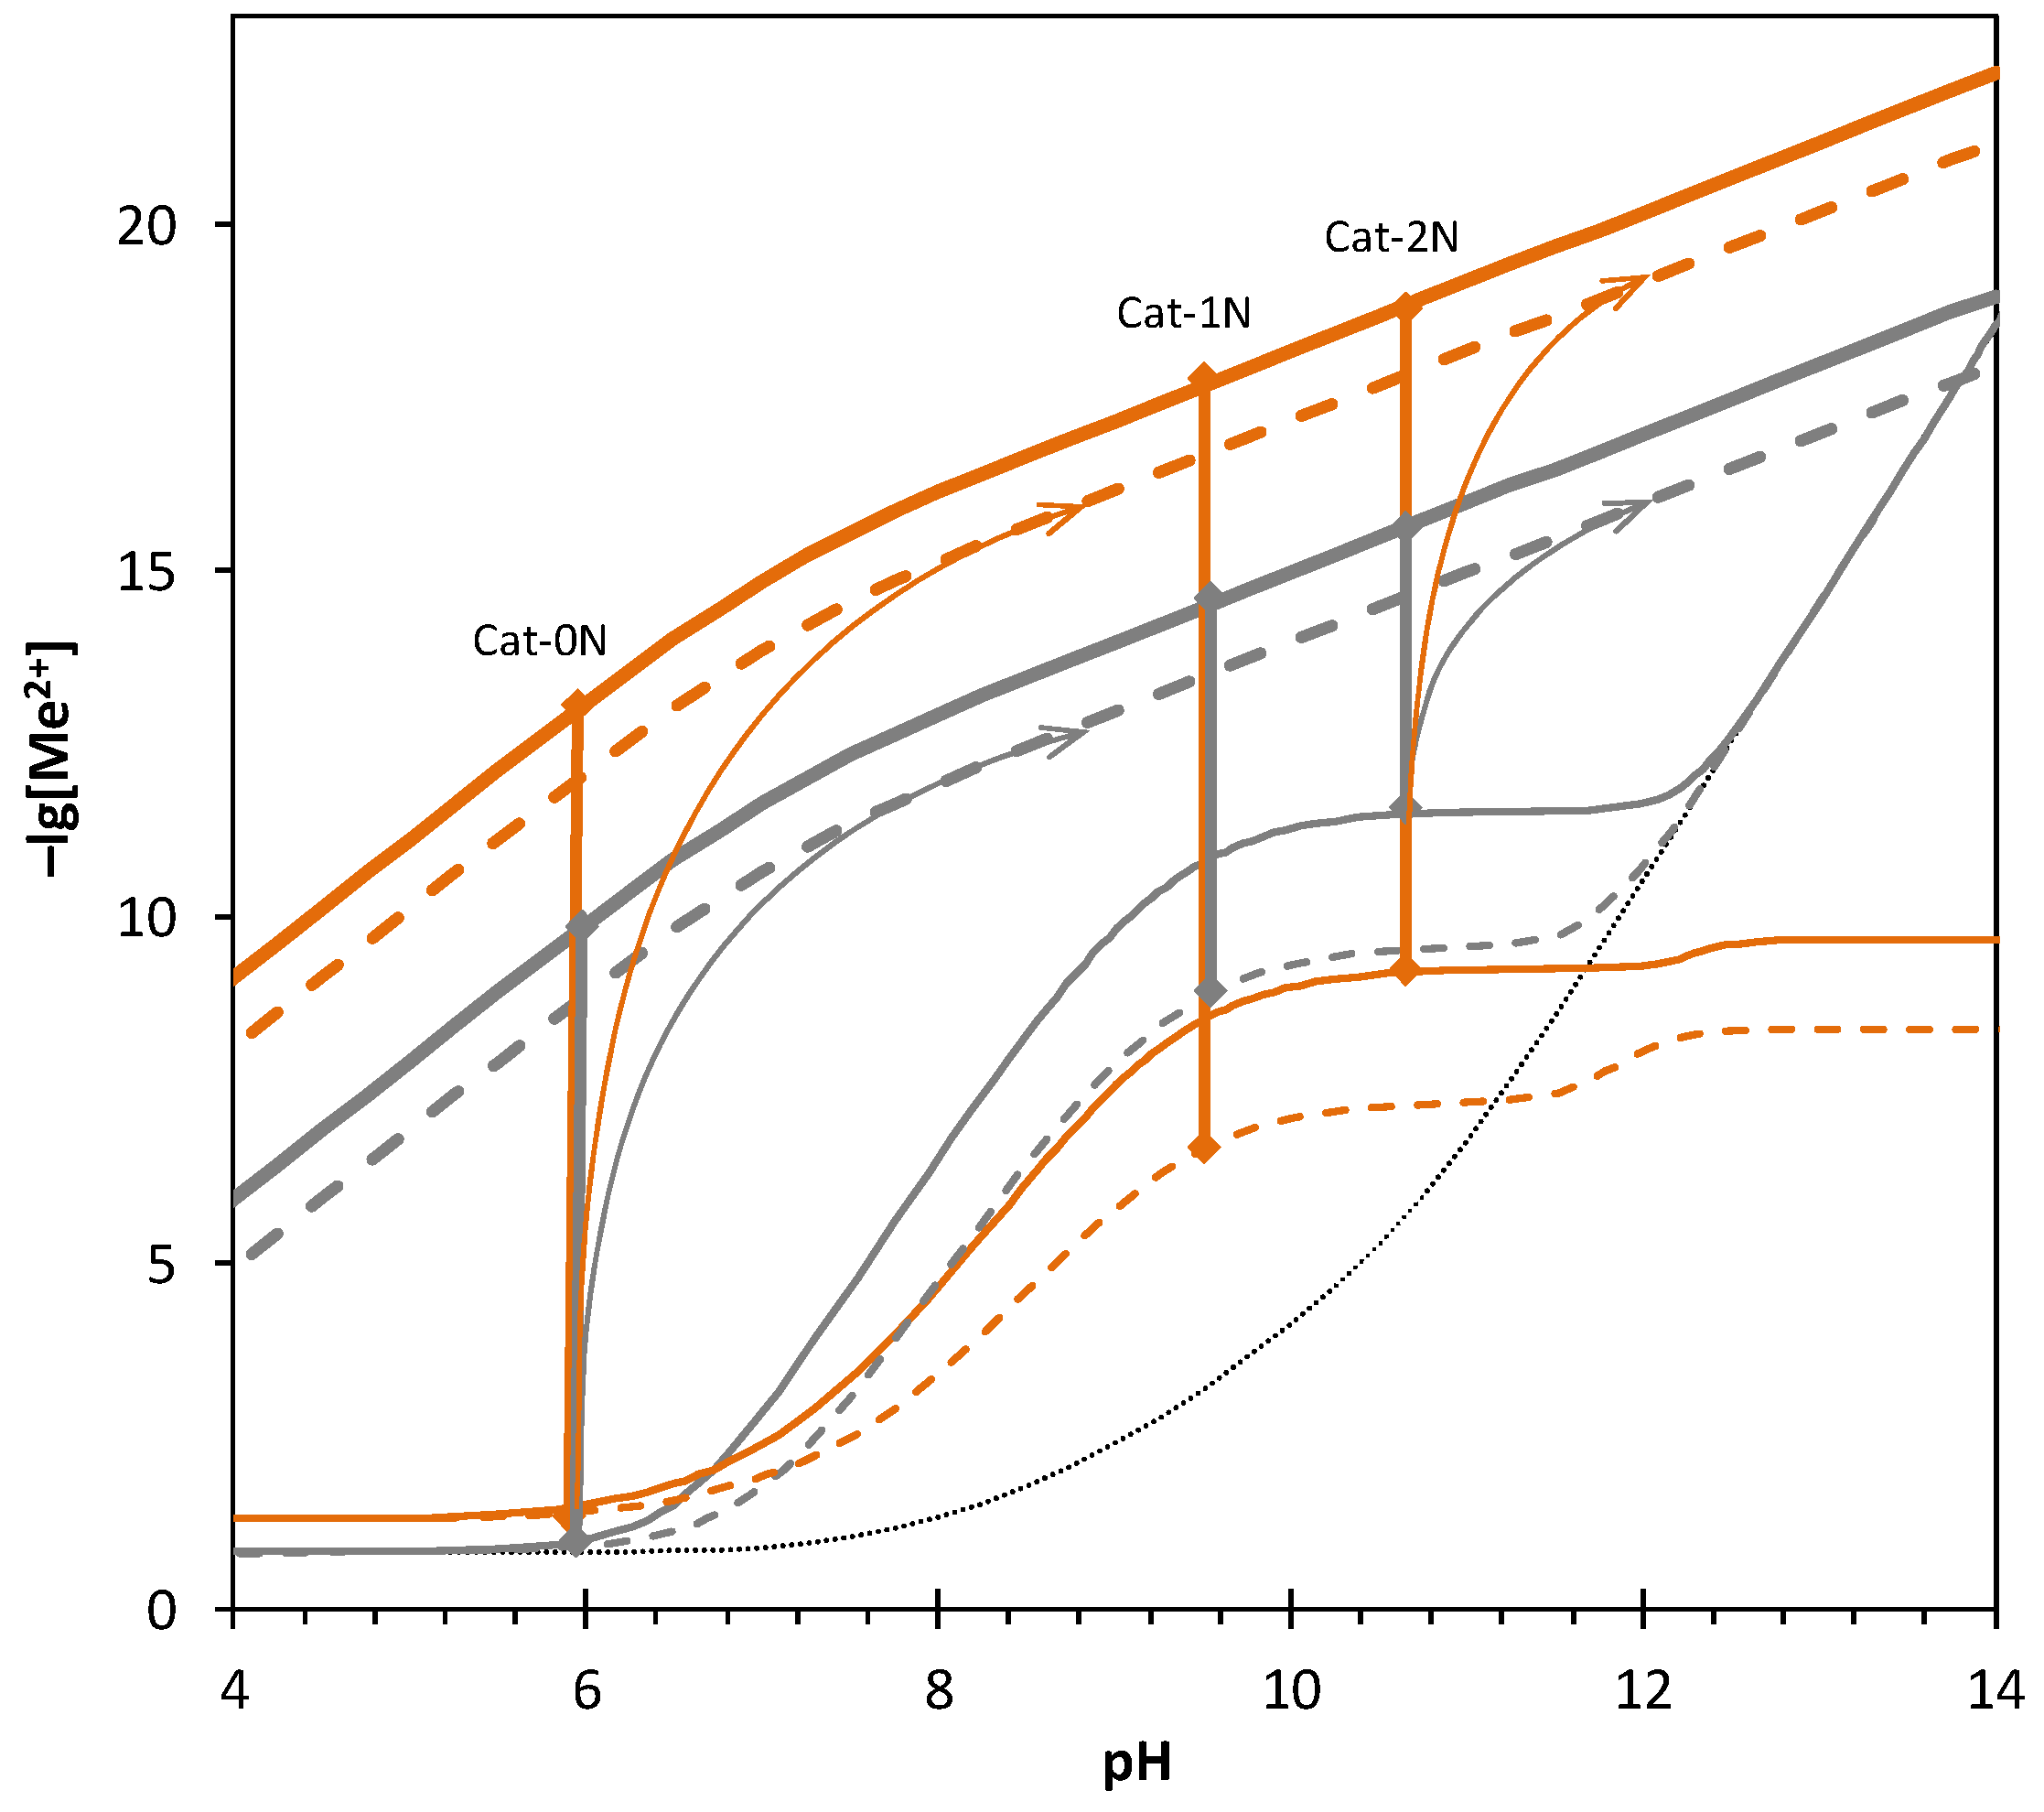
2.5. Equilibrium Calculations
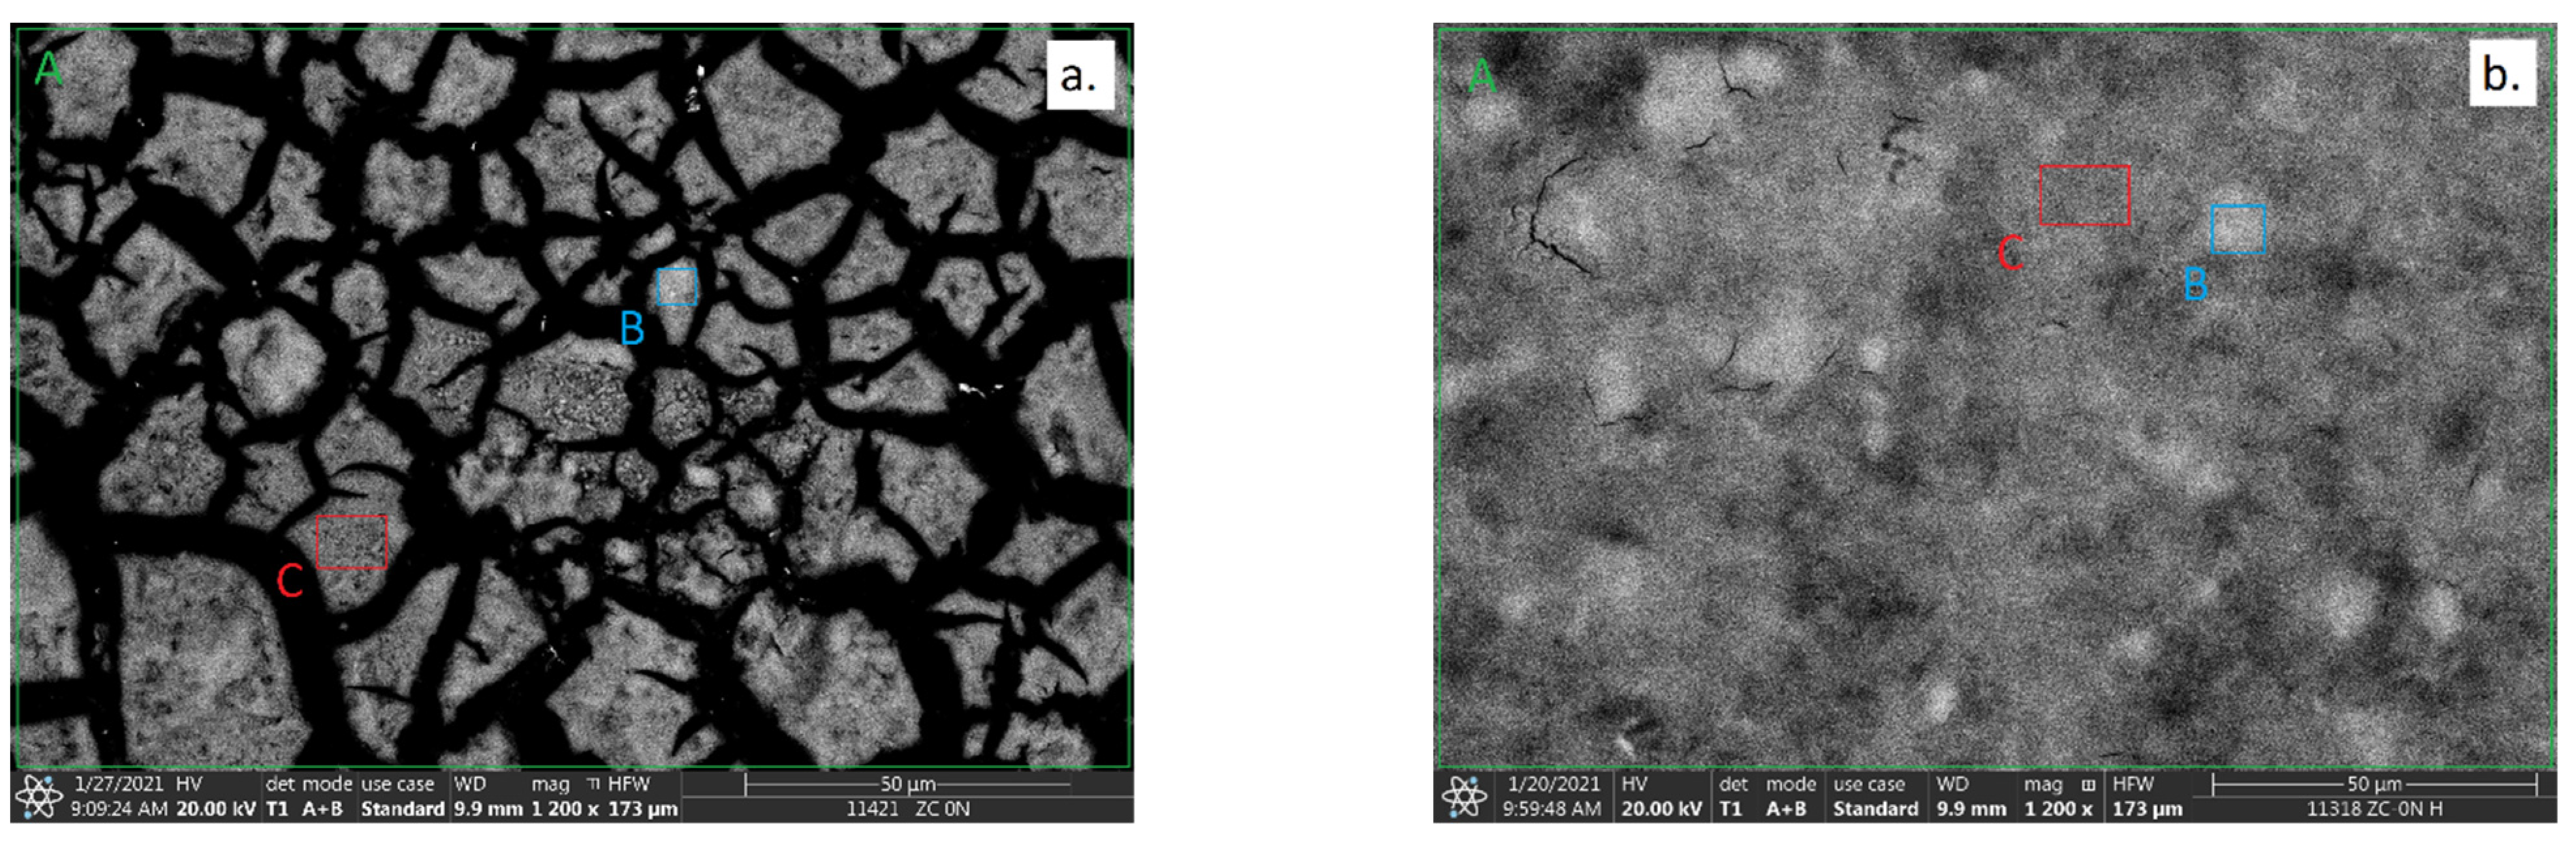
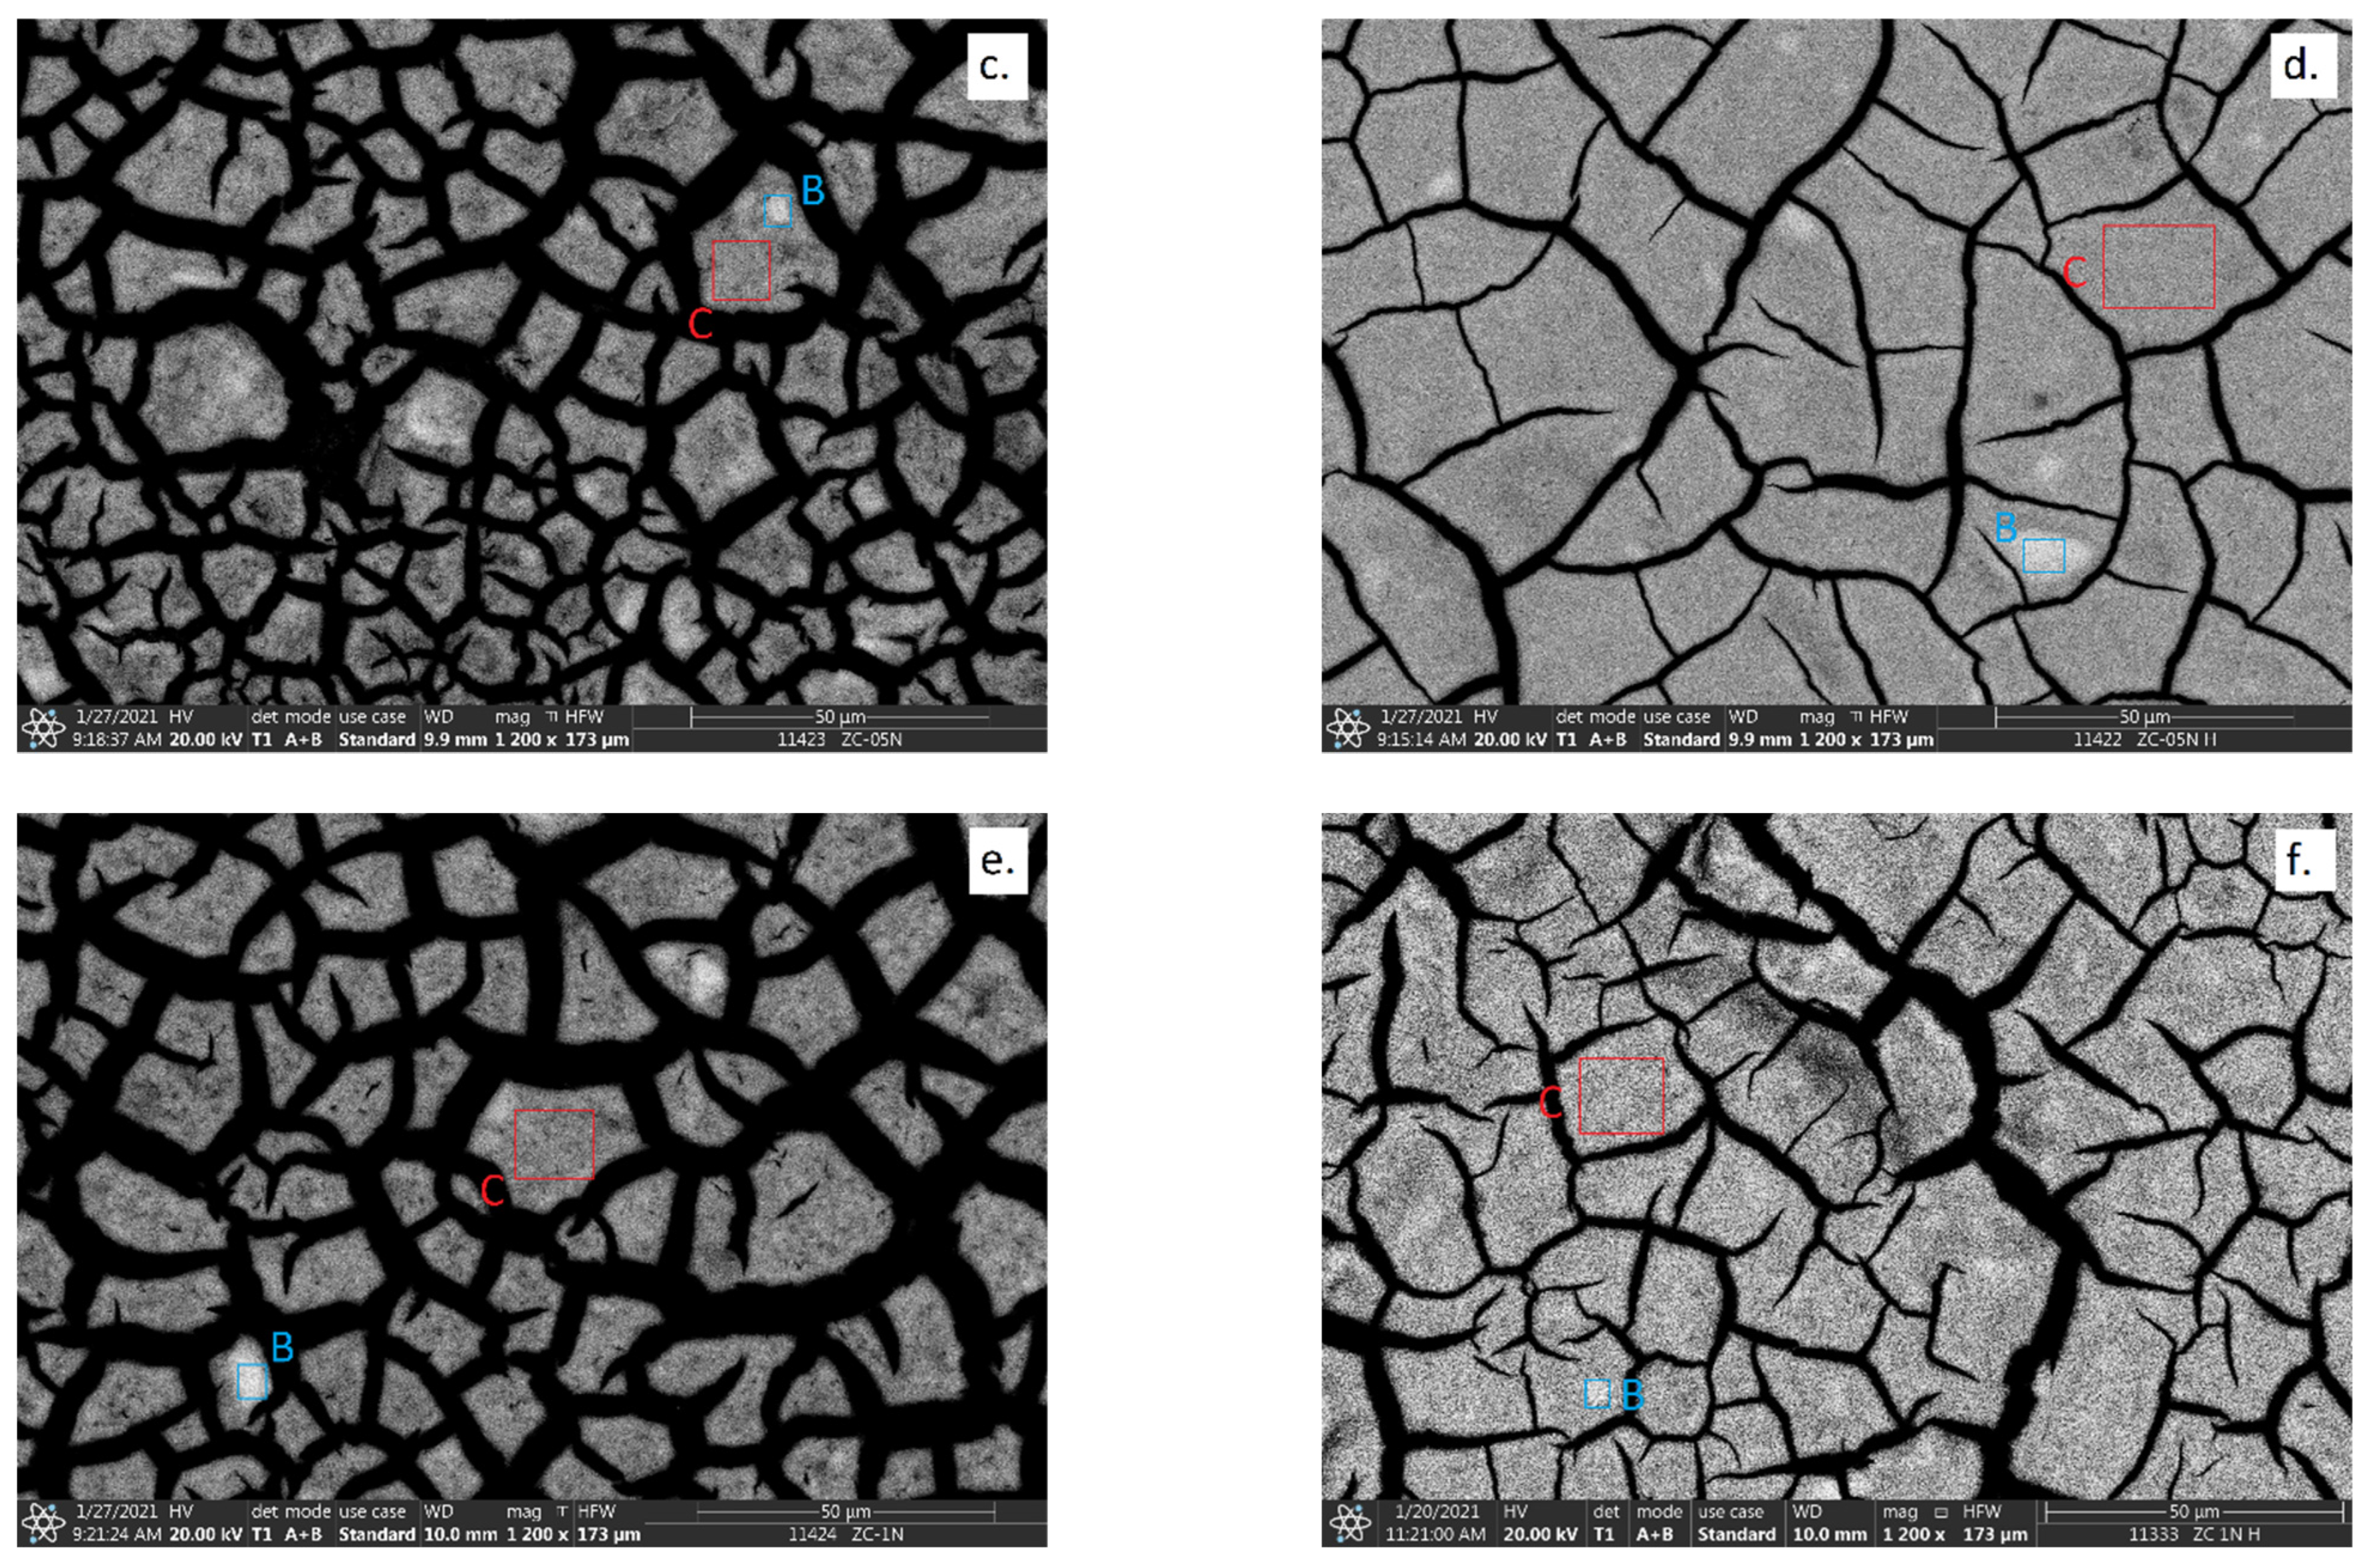
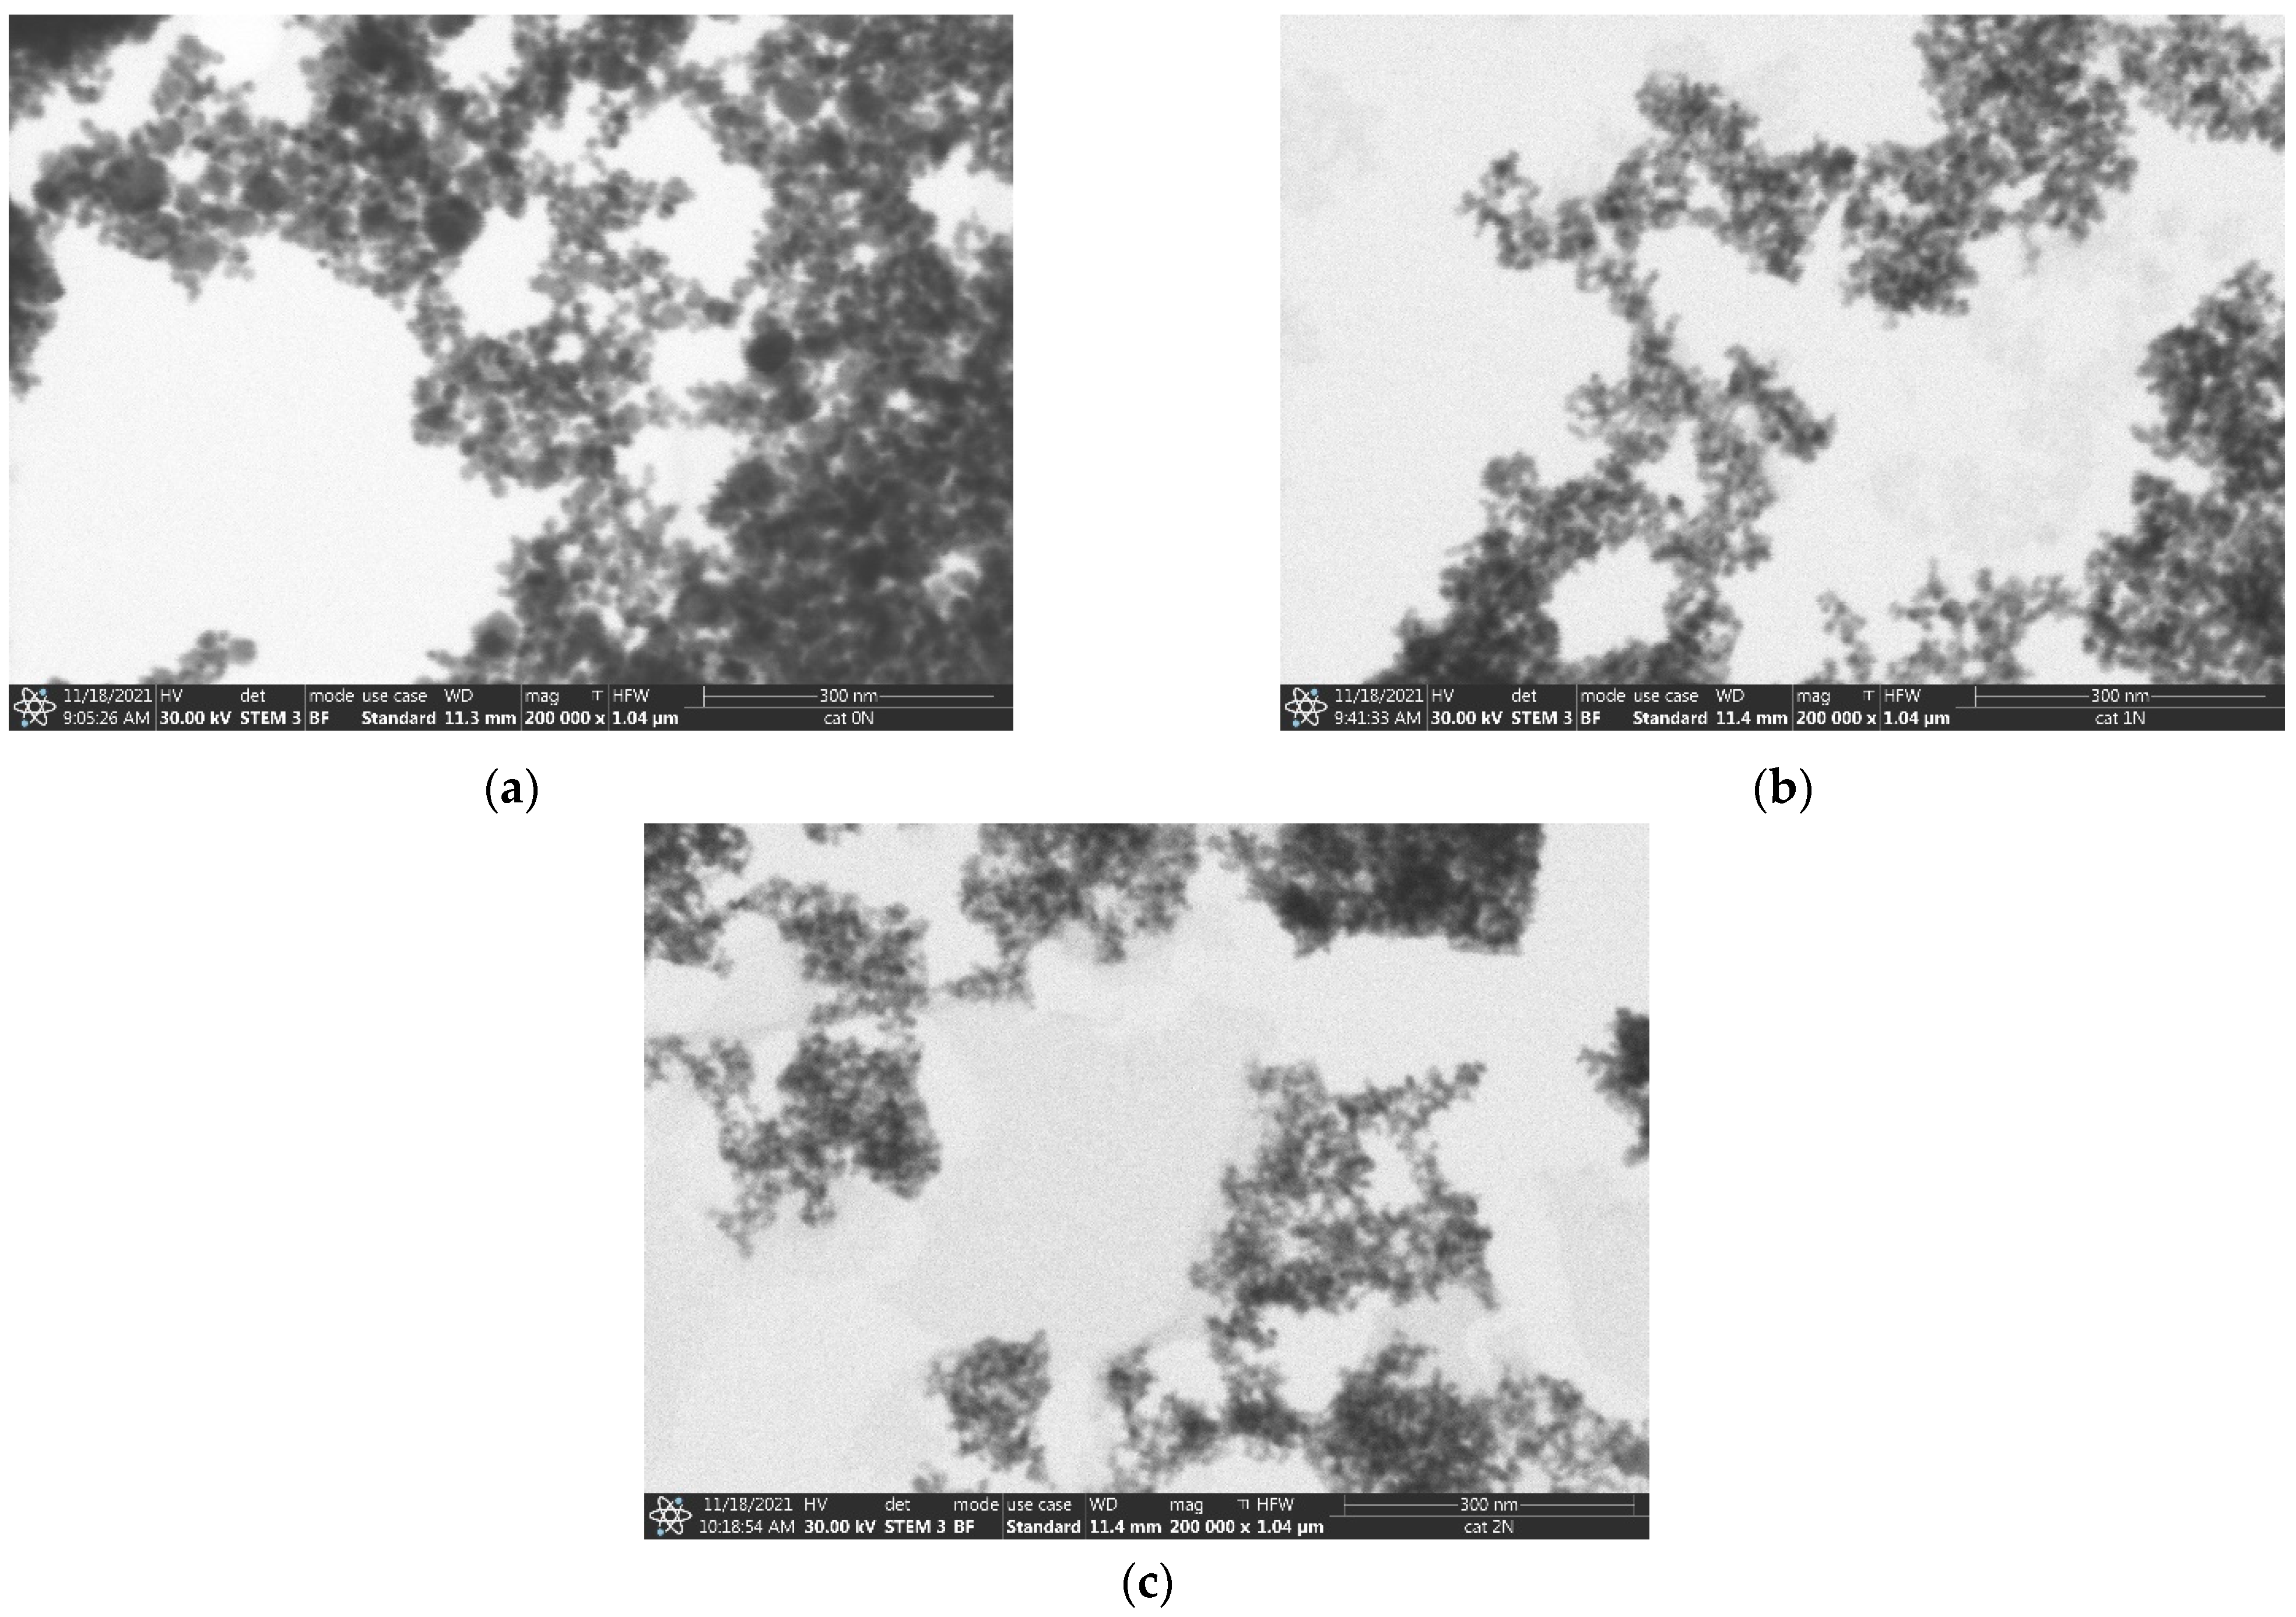
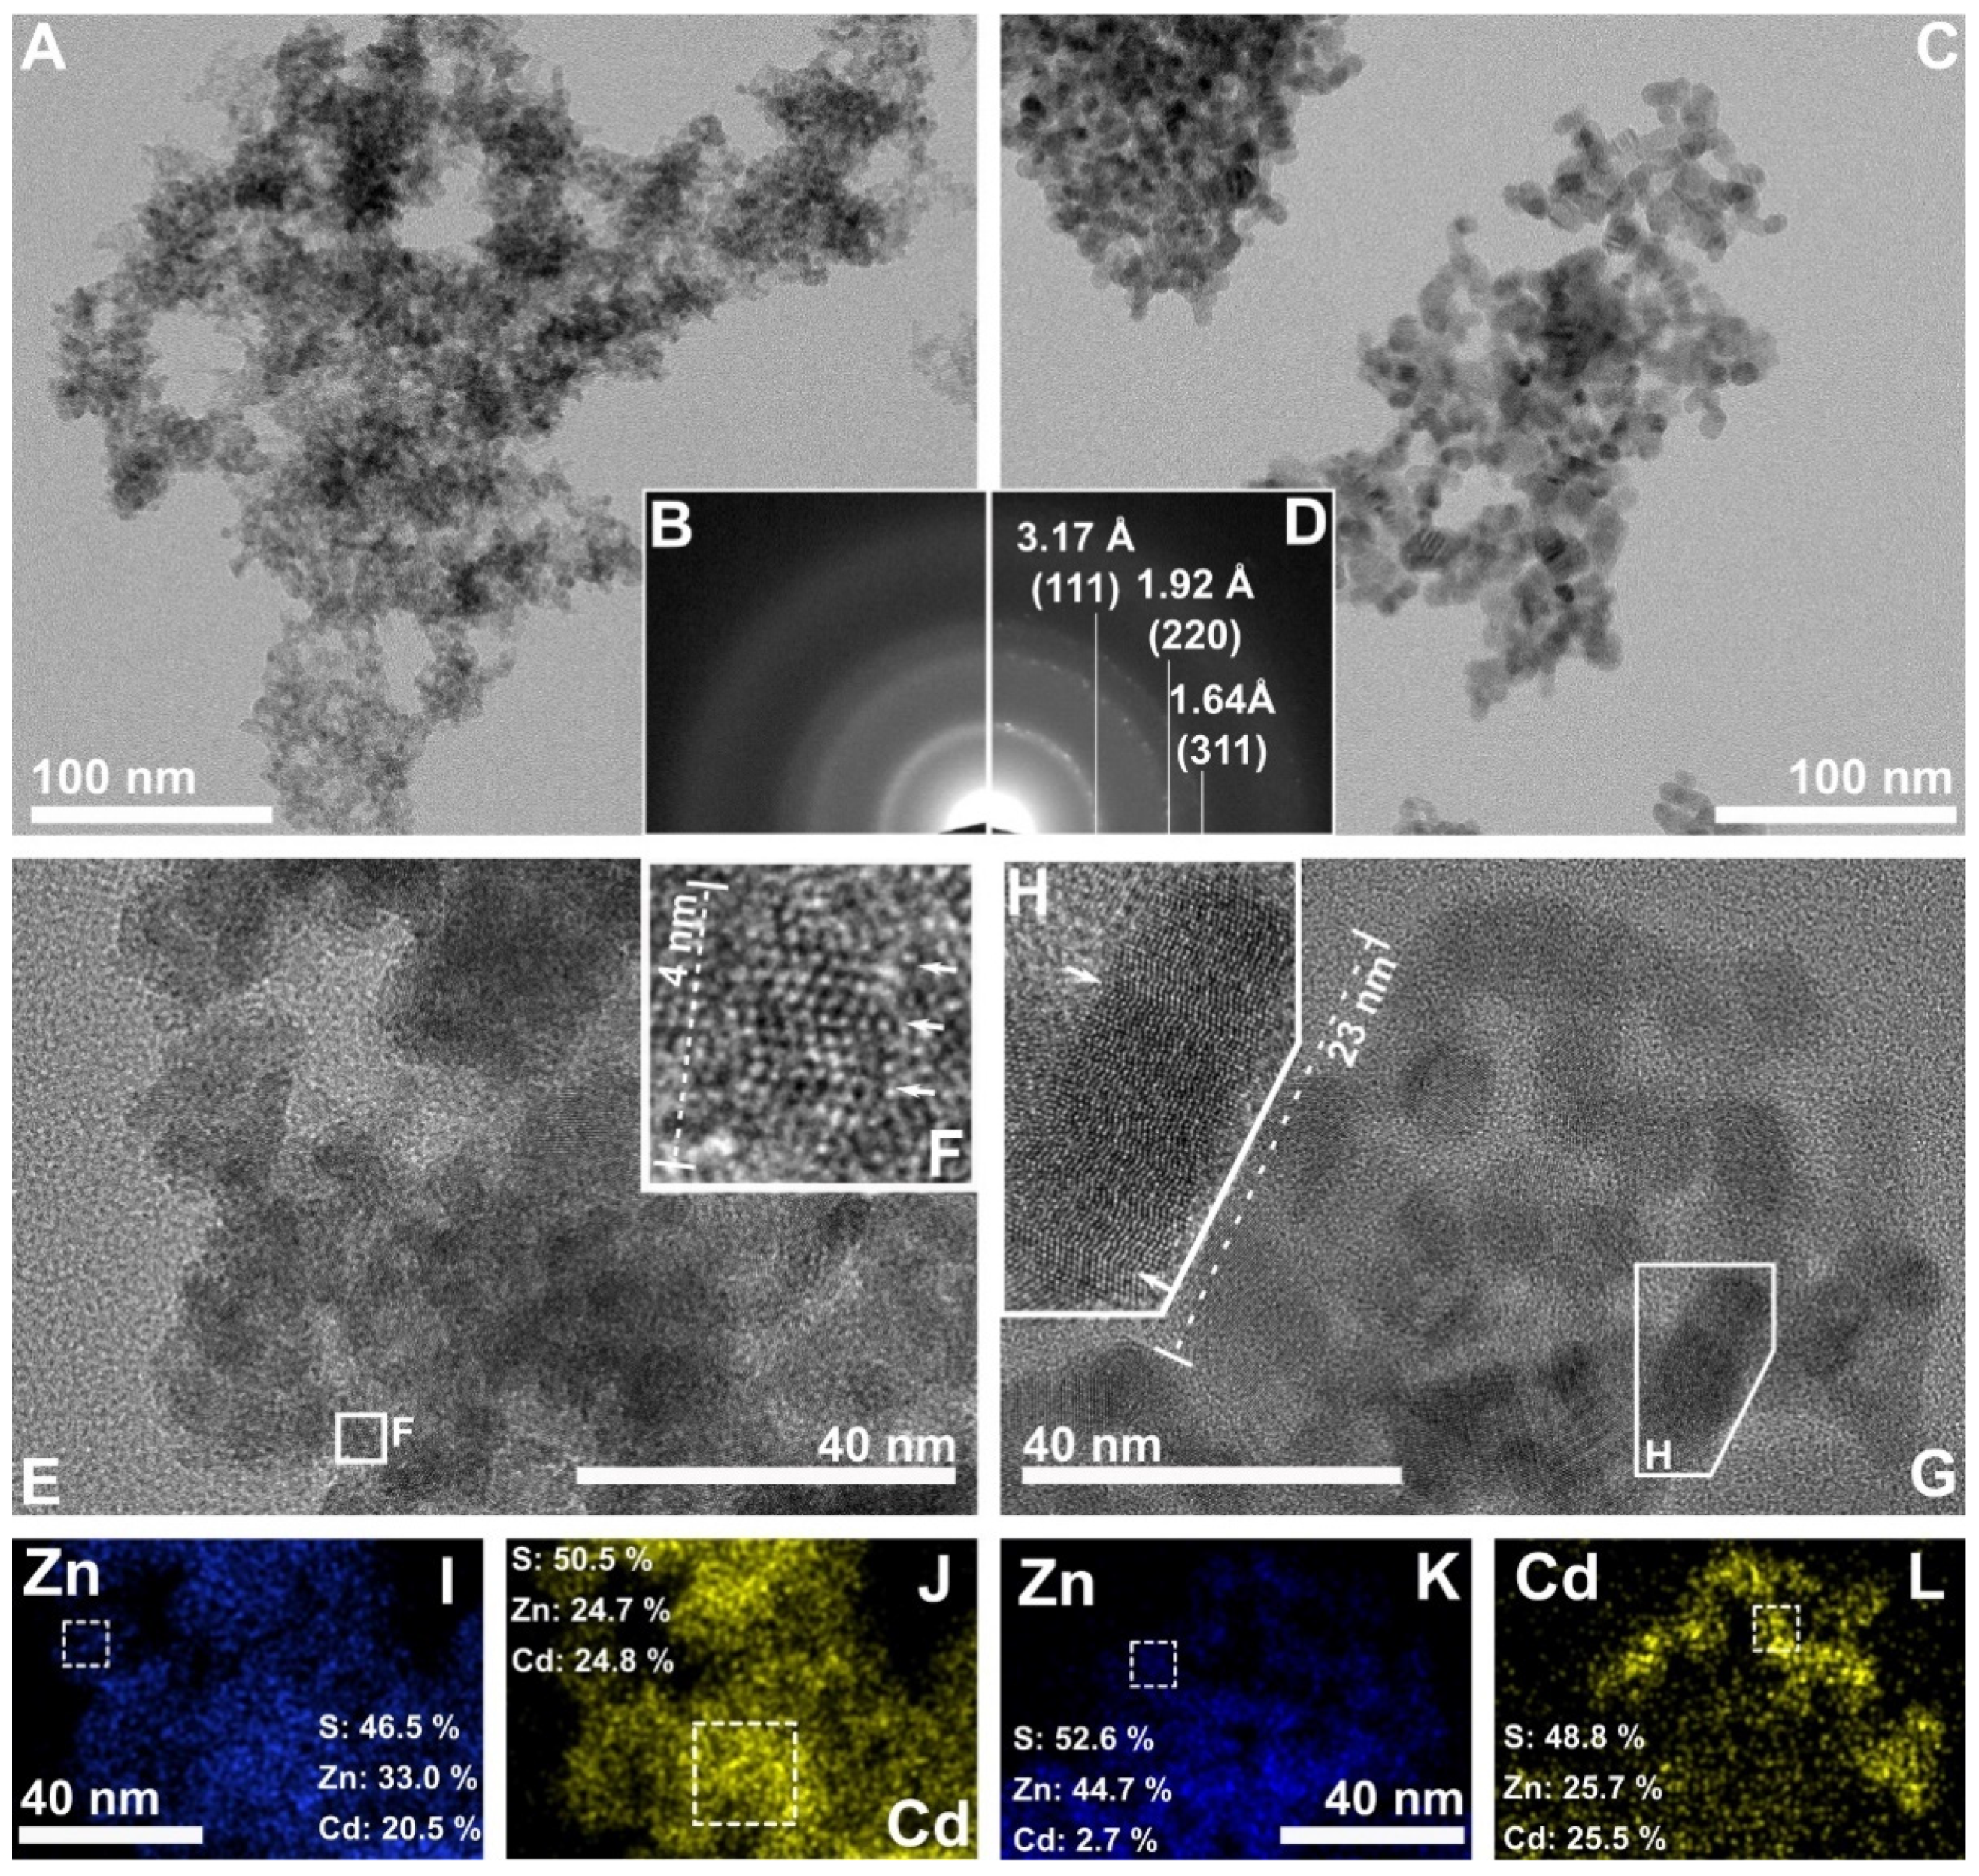
2.6. SEM, TEM, and EDS Measurements
2.7. The Effect of the pH of Preparation on the ZnS–CdS Photoactivity
2.8. Stability of ZnS-CdS Catalysts
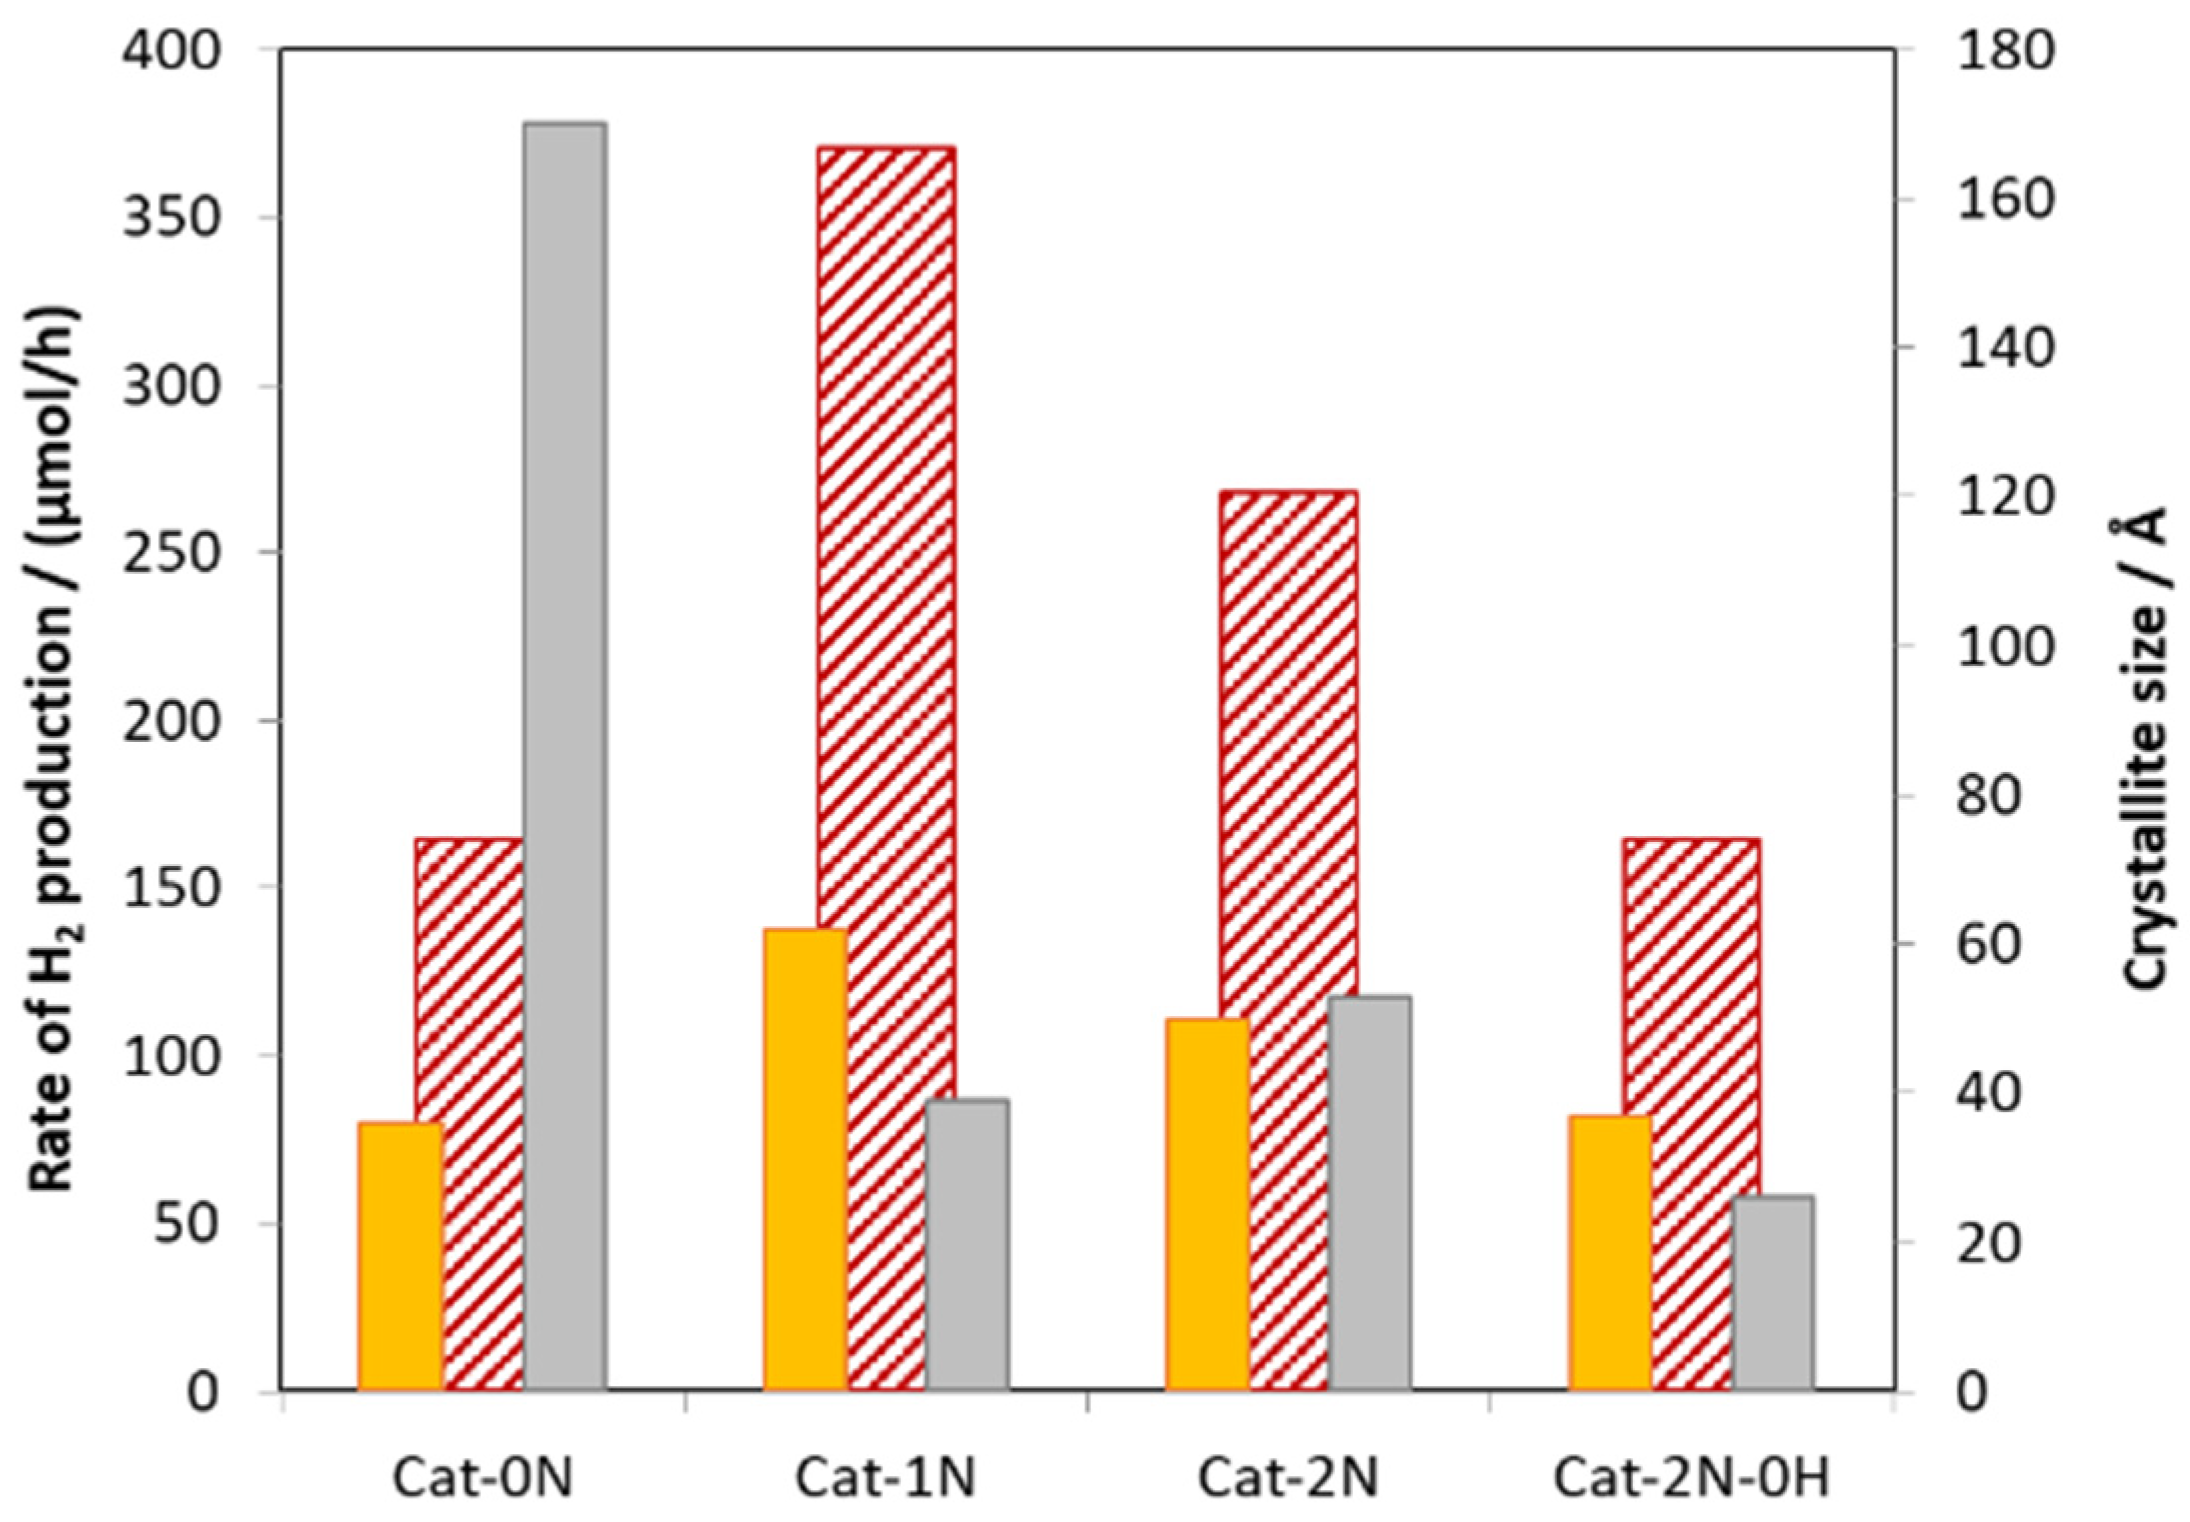
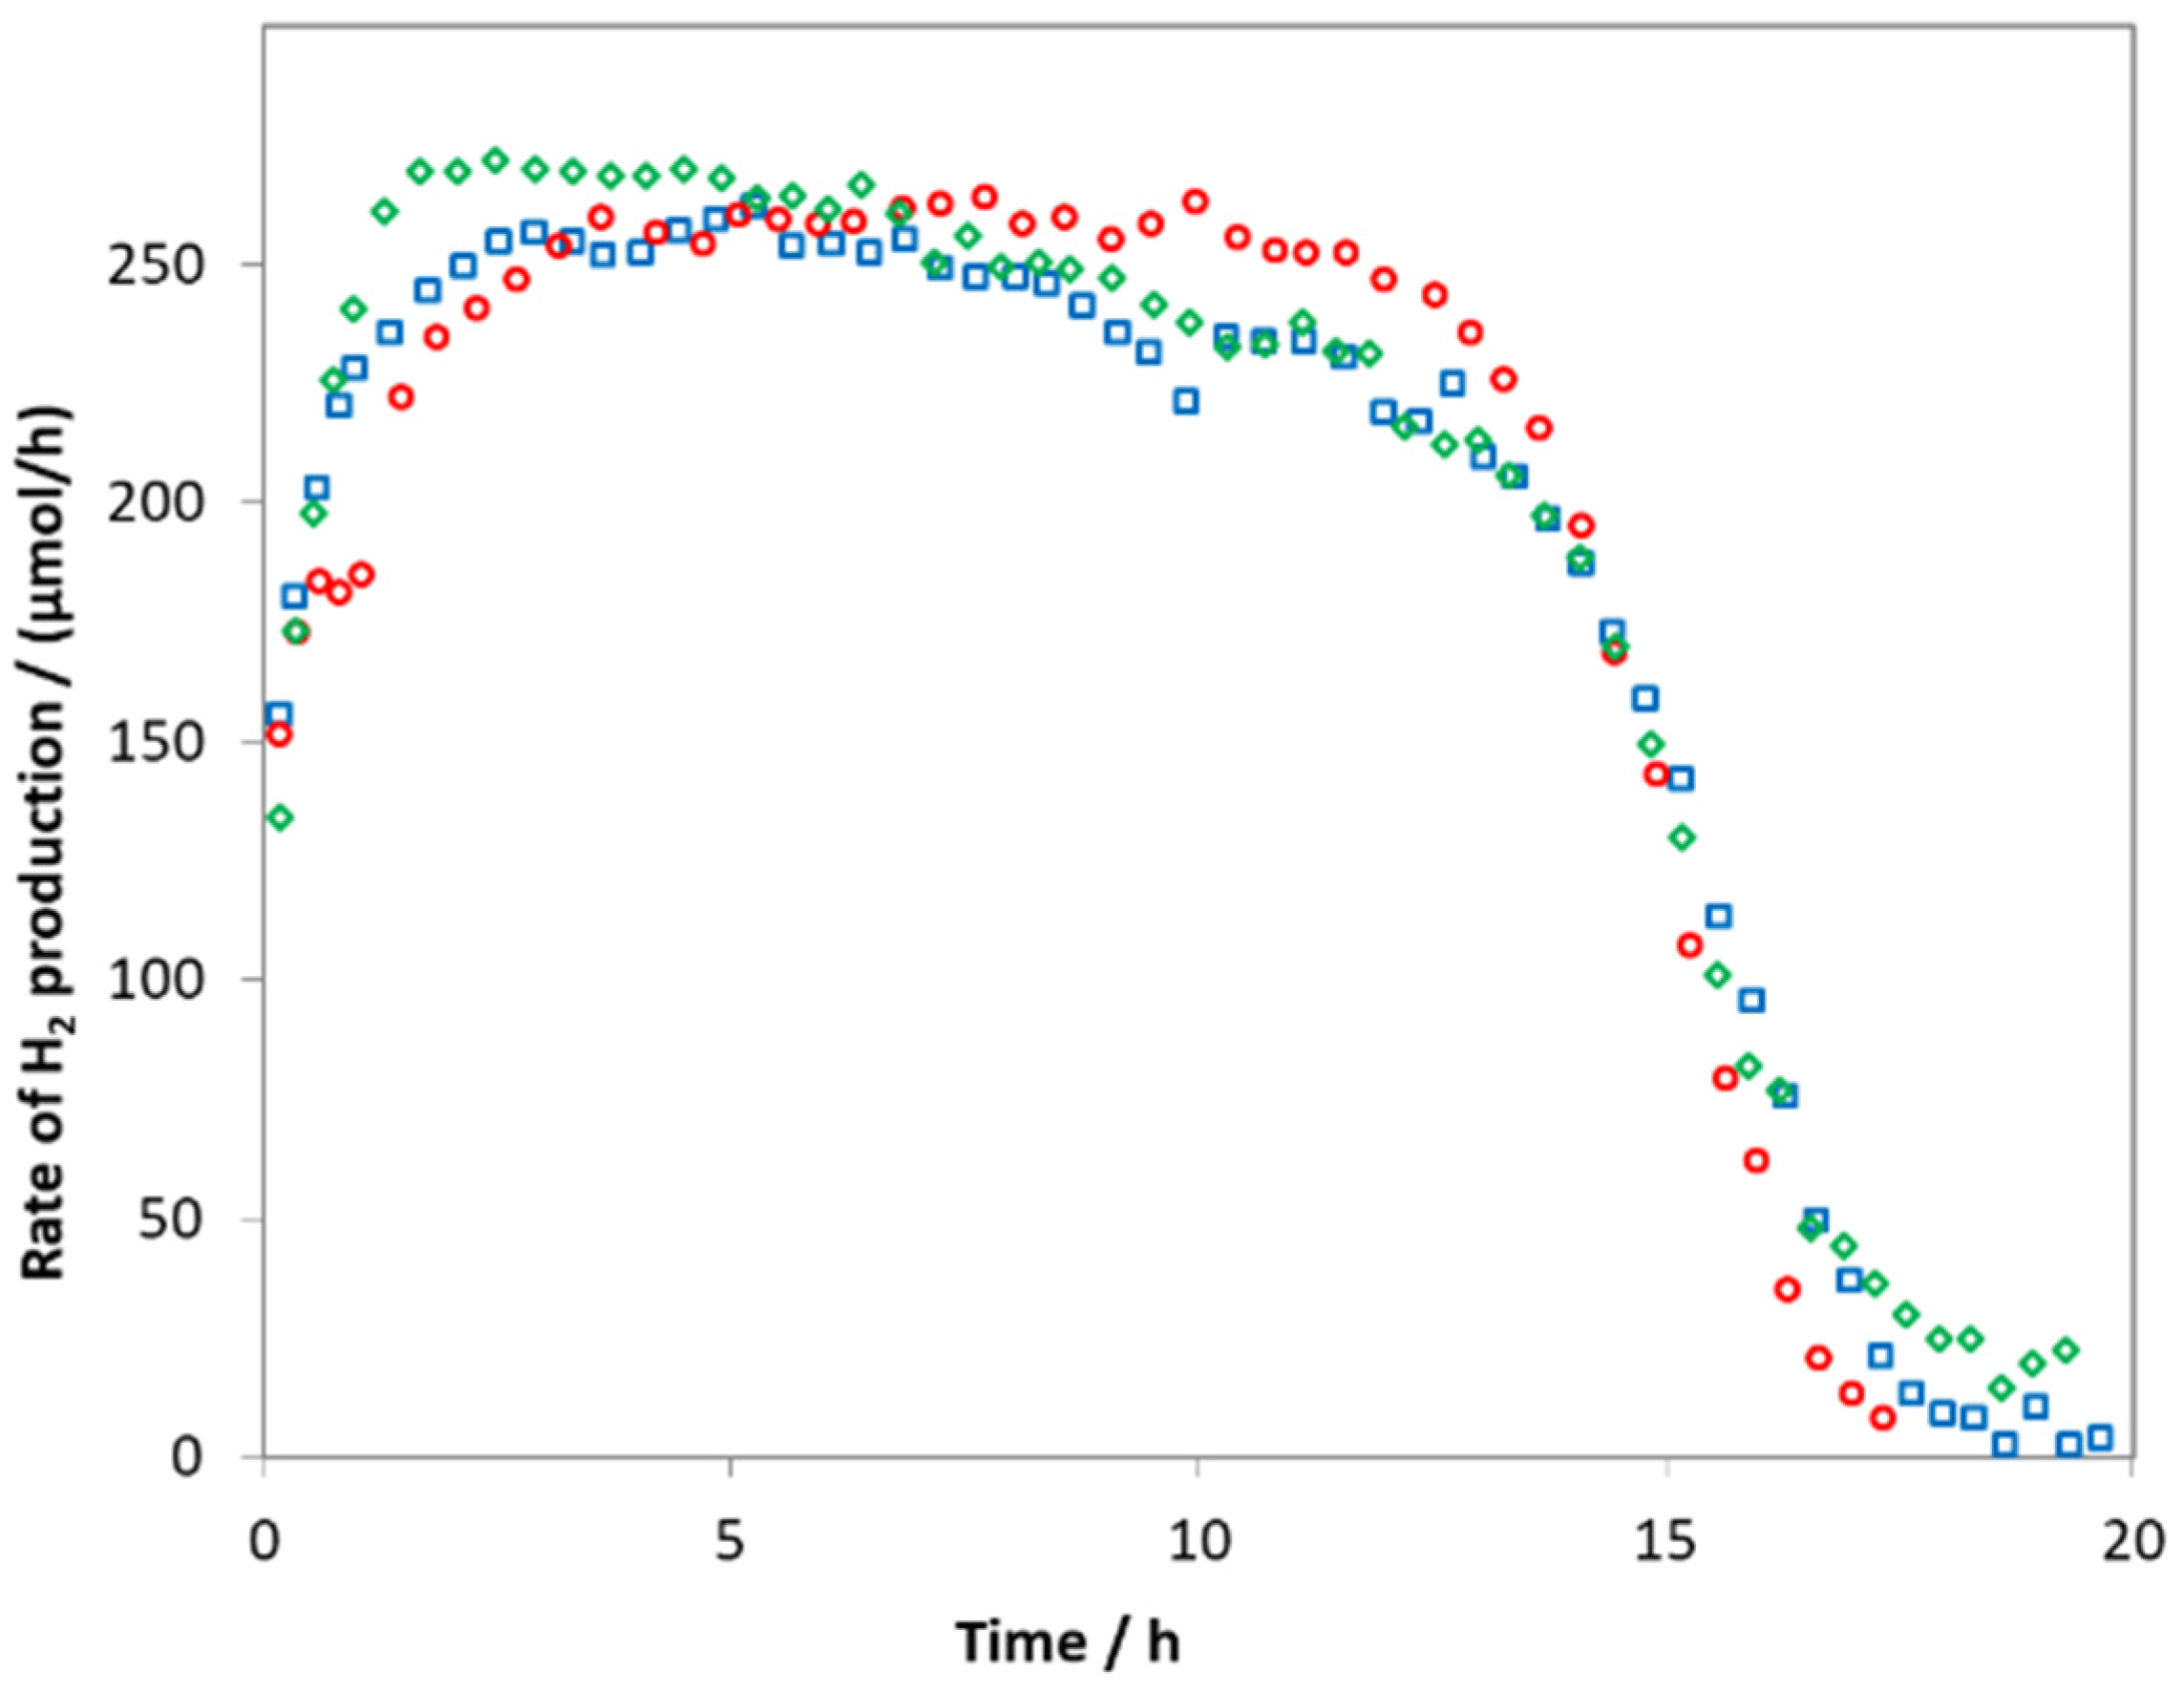
2.9. Quantum Yields
3. Materials and Methods
3.1. Materials
3.2. Photocatalyst Preparation
3.3. Characterization
3.4. Photochemical Experiments
4. Conclusions
Supplementary Materials
Author Contributions
Funding
Data Availability Statement
Acknowledgments
Conflicts of Interest
References
- Lewis, N.S. Toward Cost-Effective Solar Energy Use. Science 2007, 315, 798–801. [Google Scholar] [CrossRef] [Green Version]
- Fujishima, A.; Honda, K. Electrochemical Photolysis of Water at a Semiconductor Electrode. Nature 1972, 238, 37–38. [Google Scholar] [CrossRef]
- Baba, R.; Nakabayashi, S.; Fujishima, A.; Honda, K. Investigation of the mechanism of hydrogen evolution during photocatalytic water decomposition on metal-loaded semiconductor powders. J. Phys. Chem. 1985, 89, 1902–1905. [Google Scholar] [CrossRef]
- Zhang, Y.; Heo, Y.-J.; Lee, J.-W.; Lee, J.-H.; Bajgai, J.; Lee, K.-J.; Park, S.-J. Photocatalytic Hydrogen Evolution via Water Splitting: A Short Review. Catalysts 2018, 8, 655. [Google Scholar] [CrossRef] [Green Version]
- Tambwekar, S.V.; Subrahmanyam, M. Photocatalytic generation of hydrogen from hydrogen sulfide: An energy bargain. Int. J. Hydrogen Energy 1997, 22, 959–965. [Google Scholar] [CrossRef]
- Kudo, A.; Miseki, Y. Heterogeneous photocatalyst materials for water splitting. Chem. Soc. Rev. 2009, 38, 253–278. [Google Scholar] [CrossRef]
- Chen, X.; Shen, S.; Guo, L.; Mao, S.S. Semiconductor-based Photocatalytic Hydrogen Generation. Chem. Rev. 2010, 110, 6503–6570. [Google Scholar] [CrossRef]
- Parida, K.M.; Mahanta, S.K.; Martha, S.; Nashim, A. Fabrication of NiO/Ta2O5 composite photocatalyst for hydrogen production under visible light. Int. J. Energy Res. 2013, 37, 161–170. [Google Scholar] [CrossRef]
- Ramírez-Ortega, D.; Guerrero-Araque, D.; Acevedo-Peña, P.; Reguera, E.; Calderon, H.A.; Zanella, R. Enhancing the photocatalytic hydrogen production of the ZnO–TiO2 heterojunction by supporting nanoscale Au islands. Int. J. Hydrogen Energy 2021, 46, 34333. [Google Scholar] [CrossRef]
- Machín, A.; Cotto, M.; Duconge, J.; Arango, J.C.; Morant, C.; Pinilla, S.; Soto-Vázquez, L.; Resto, E.; Márquez, F. Hydrogen production via water splitting using different Au@ZnO catalysts under UV–vis irradiation. J. Photochem. Photobiol. A Chem. 2018, 353, 385–394. [Google Scholar] [CrossRef]
- Lu, G.; Li, S. Hydrogen production by H2S photodecomposition on ZnFe2O4 catalyst. Int. J. Hydrogen Energy 1992, 17, 767–770. [Google Scholar] [CrossRef]
- Zhang, K.; Guo, L. Metal sulphide semiconductors for photocatalytic hydrogen production. Catal. Sci. Technol. 2013, 3, 1672. [Google Scholar] [CrossRef]
- Raevskaya, A.E.; Stroyuk, A.L.; Kryukov, A.I.; Kuchmii, S.Y. Structural and optical characteristics of CdxZn1−xS nanoparticles stabilized in aqueous solutions of polymers. Theor. Exp. Chem. 2006, 42, 181–185. [Google Scholar] [CrossRef]
- Akinwunmi, O.O.; Egharevba, G.O.; Ajayi, E.O.B. Synthesis and Characterization of CdS, ZnS and CdZnS Nanoparticles Embedded in Polystyrene. J. Mod. Phys. 2014, 05, 257–266. [Google Scholar] [CrossRef] [Green Version]
- Preethi, V.; Kanmani, S. Photocatalytic hydrogen production using Fe2O3-based core shell nano particles with ZnS and CdS. Int. J. Hydrogen Energy 2014, 39, 1613–1622. [Google Scholar] [CrossRef]
- Zhang, W.; Zhong, Z.; Wang, Y.; Xu, R. Doped Solid Solution: (Zn0.95Cu0.05 )1−xCdx Nanocrystals with High Activity for H2 Evolution from Aqueous Solutions under Visible Light. J. Phys. Chem. C 2008, 112, 17635–17642. [Google Scholar] [CrossRef]
- Stroyuk, A.L.; Raevskaya, A.E.; Korzhak, A.V.; Kotenko, I.E.; Glebov, E.M.; Plyusnin, V.F.; Kuchmii, S.Y. Photocatalytic production of hydrogen in systems based on CdxZn1−xS/Ni0 nanostructures. Theor. Exp. Chem. 2009, 45, 12–22. [Google Scholar] [CrossRef]
- Li, N.; Zhou, B.; Guo, P.; Zhou, J.; Jing, D. Fabrication of noble-metal-free Cd0.5Zn0.5S/NiS hybrid photocatalyst for efficient solar hydrogen evolution. Int. J. Hydrogen Energy 2013, 38, 11268–11277. [Google Scholar] [CrossRef]
- Villa, K.; Domènech, X.; García-Pérez, U.M.; Peral, J. Optimization of the experimental conditions of hydrogen production by the Pt–(CdS/ZnS) system under visible light illumination. RSC Adv. 2016, 6, 36681–36688. [Google Scholar] [CrossRef]
- Wang, J.; Li, B.; Chen, J.; Li, N.; Zheng, J.; Zhao, J.; Zhu, Z. Enhanced photocatalytic H2-production activity of CdxZn1−xS nanocrystals by surface loading MS (M.=Ni, Co, Cu) species. Appl. Surf. Sci. 2012, 259, 118–123. [Google Scholar] [CrossRef]
- Chen, M.; Wu, P.; Zhu, Y.; Yang, S.; Lu, Y.; Lin, Z. Enhanced photocatalytic H2 production activity of CdZnS with stacking faults structure assisted by ethylenediamine and NiS. Int. J. Hydrogen Energy 2018, 43, 10938–10949. [Google Scholar] [CrossRef]
- Villoria, J.A.; Navarro Yerga, R.M.; Al-Zahrani, S.M.; Fierro, J.L.G. Photocatalytic Hydrogen Production on Cd1− xZnxS Solid Solutions under Visible Light: Influence of Thermal Treatment. Ind. Eng. Chem. Res. 2010, 49, 6854–6861. [Google Scholar] [CrossRef]
- Chen, Y.; Guo, L. Highly efficient visible-light-driven photocatalytic hydrogen production from water using Cd0.5Zn0.5S/TNTs (titanate nanotubes) nanocomposites without noble metals. J. Mater. Chem. 2012, 22, 7507. [Google Scholar] [CrossRef]
- Xiang, J.; Wang, H.; Wang, X.; Chen, X.; Wu, T.; Wan, H.; Liu, Y.; Wang, H. Colloidal CdxZn1−xS nanocrystals as efficient photocatalysts for H 2 production under visible-light irradiation. RSC Adv. 2019, 9, 4001–4007. [Google Scholar] [CrossRef] [Green Version]
- Koca, A.; Sahin, M. Photocatalytic hydrogen production by direct sun light from sulfide/sulfite solution. Int. J. Hydrogen Energy 2002, 27, 363–367. [Google Scholar] [CrossRef]
- Chan, C.-C.; Chang, C.-C.; Hsu, C.-H.; Weng, Y.-C.; Chen, K.-Y.; Lin, H.-H.; Huang, W.-C.; Cheng, S.-F. Efficient and stable photocatalytic hydrogen production from water splitting over ZnxCd1–xS solid solutions under visible light irradiation. Int. J. Hydrogen Energy 2014, 39, 1630–1639. [Google Scholar] [CrossRef]
- Kundu, J.; Mal, D.D.; Pradhan, D. Single-step solvothermal synthesis of highly uniform CdxZn1−xS nanospheres for improved visible light photocatalytic hydrogen generation. Inorg. Chem. Front. 2021, 8, 3055–3065. [Google Scholar] [CrossRef]
- Li, Q.; Meng, H.; Zhou, P.; Zheng, Y.; Wang, J.; Yu, J.; Gong, J. Zn1– xCdxS Solid Solutions with Controlled Bandgap and Enhanced Visible-Light Photocatalytic H 2 -Production Activity. ACS Catal. 2013, 3, 882–889. [Google Scholar] [CrossRef]
- Ali, A.H.; Jassem, S.A. Preparation and Study of CdS thin films at different concentration thiorea by chemical bath deposition (CBD) method. World Sci. News 2015, 23, 73–89. [Google Scholar]
- Zhang, Y.; Peng, Z.; Guan, S.; Fu, X. Novel β-NiS film modified CdS nanoflowers heterostructure nanocomposite: Extraordinarily highly efficient photocatalysts for hydrogen evolution. Appl. Catal. B Environ. 2018, 224, 1000–1008. [Google Scholar] [CrossRef]
- Liu, X.; Liang, X.; Wang, P.; Huang, B.; Qin, X.; Zhang, X.; Dai, Y. Highly efficient and noble metal-free NiS modified MnxCd1-xS solid solutions with enhanced photocatalytic activity for hydrogen evolution under visible light irradiation. Appl. Catal. B Environ. 2017, 203, 282–288. [Google Scholar] [CrossRef]
- Mintcheva, N.; Gicheva, G.; Panayotova, M.; Wunderlich, W.; Kuchmizhak, A.A.; Kulinich, S.A. Preparation and Photocatalytic Properties of CdS and ZnS Nanomaterials Derived from Metal Xanthate. Materials 2019, 12, 3313. [Google Scholar] [CrossRef] [Green Version]
- González-Panzo, I.J.; Martín-Várguez, P.E.; Oliva, A.I. Physicochemical Conditions for ZnS Films Deposited by Chemical Bath. J. Electrochem. Soc. 2014, 161, D181–D189. [Google Scholar] [CrossRef]
- Qin, Z.; Xue, F.; Chen, Y.; Shen, S.; Guo, L. Spatial charge separation of one-dimensional Ni2P-Cd0.9Zn0.1S/g-C3N4 heterostructure for high-quantum-yield photocatalytic hydrogen production. Appl. Catal. B Environ. 2017, 217, 551–559. [Google Scholar] [CrossRef]
- Liu, M.; Jing, D.; Zhou, Z.; Guo, L. Twin-induced one-dimensional homojunctions yield high quantum efficiency for solar hydrogen generation. Nat. Commun. 2013, 4, 2278. [Google Scholar] [CrossRef]
- Zhong, W.; Huang, Y.; Wang, X.; Fan, J.; Yu, H. Colloidal CdS and CdZnS nanocrystal photocatalysts with massive S2−-adsorption: One-step facile synthesis and highly efficient H2-evolution performance. Chem. Commun. 2020, 56, 9316–9319. [Google Scholar] [CrossRef]
- Fodor, L.; Solymosi, B.; Horváth, O. Investigation of Hydrogen Production from Alkaline Sulfide Solution with Nanosized CdS/ZnS-PdS Photocatalyst of Various Compositions. J. Nanosci. Nanotechnol. 2019, 19, 509–515. [Google Scholar] [CrossRef]
- Guo, X.; Chen, Y.; Qin, Z.; Wang, M.; Guo, L. One-step hydrothermal synthesis of ZnxCd1−xS/ZnO heterostructures for efficient photocatalytic hydrogen production. Int. J. Hydrogen Energy 2016, 41, 15208–15217. [Google Scholar] [CrossRef]
- He, K.; Guo, L. NiS modified CdS pyramids with stacking fault structures: Highly efficient and stable photocatalysts for hydrogen production from water. Int. J. Hydrogen Energy 2017, 42, 23995–24005. [Google Scholar] [CrossRef]
- Tauc, J.; Grigorovici, R.; Vancu, A. Optical Properties and Electronic Structure of Amorphous Germanium. Phys. Status Solidi 1966, 15, 627–637. [Google Scholar] [CrossRef]
- Mullin, J.W. Crystallisation; Butterworth Heinemann: Oxford, UK, 2001. [Google Scholar]
- Sillen, L.G. Stability Constants of Metal Ion Complexes, Part I: Inorganic Ligands, Special Publication (RSC) No. 17; Chemical Society: London, UK, 1964. [Google Scholar]
- Martell, A.E. Stability Constants of Metal Ion Complexes, Part II: Organic Ligands, Special Publication (RSC) No. 17; Chemical Society: London, UK, 1964. [Google Scholar]
- Högfeldt, E. Stability Constants of Metal-Ion Complexes, Part A: Inorganic Ligands, International Union of Pure and Applied Chemistry: IUPAC Chemical Data Series, No. 21; Pergamon Press: Oxford, UK, 1982. [Google Scholar]
- Migdisov, A.A.; Williams-Jones, A.E.; Lakshtanov, L.Z.; Alekhin, Y.V. Estimates of the second dissociation constant of H2S from the surface sulfidation of crystalline sulfur. Geochim. Cosmochim. Acta 2002, 66, 1713–1725. [Google Scholar] [CrossRef]
- Xing, C.; Zhang, Y.; Yan, W.; Guo, L. Band structure-controlled solid solution of Cd1-xZnxS photocatalyst for hydrogen production by water splitting. Int. J. Hydrogen Energy 2006, 31, 2018–2024. [Google Scholar] [CrossRef]
- Kozlova, E.A.; Markovskaya, D.V.; Cherepanova, S.V.; Saraev, A.A.; Gerasimov, E.Y.; Perevalov, T.V.; Kaichev, V.V.; Parmon, V.N. Novel photocatalysts based on Cd1−xZnxS/Zn(OH)2 for the hydrogen evolution from water solutions of ethanol. Int. J. Hydrogen Energy 2014, 39, 18758–18769. [Google Scholar] [CrossRef]
- Wang, X.; Shih, K.; Li, X.Y. Photocatalytic hydrogen generation from water under visible light using core/shell nano-catalysts. Water Sci. Technol. 2010, 61, 2303–2308. [Google Scholar] [CrossRef]
- Lyubina, T.P.; Kozlova, E.A. New photocatalysts based on cadmium and zinc sulfides for hydrogen evolution from aqueous Na2S-Na2SO3 solutions under irradiation with visible light. Kinet. Catal. 2012, 53, 188–196. [Google Scholar] [CrossRef]
- Li, X.; Xue, F.; Li, N.; Wei, X.; Liu, H.; Zhou, J.; Lyu, B.; Liu, M. One-Pot Hydrothermal Synthesis of MoS2/Zn0.5Cd0.5S Heterojunction for Enhanced Photocatalytic H2 Production. Front. Chem. 2020, 8, 779. [Google Scholar] [CrossRef]
- Bish, D.L.; Post, J.E. Modern Powder Diffraction; The Mineralogical Society of America: Washington, DC, USA, 1989. [Google Scholar]


| Band-Gap Energy/eV | ||
|---|---|---|
| Catalyst | Before HTT | After HTT |
| Cat-0N | 2.58 ± 0.03 | 2.50 ± 0.02 |
| Cat-1N | 2.65 ± 0.03 | 2.60 ± 0.02 |
| Cat-2N | 2.65 ± 0.03 | 2.57 ± 0.02 |
| n | NH4+ | HAc | [Cd(NH3)n]2+ | [Zn(NH3)n]2+ | [Zn(OH)n]2−n |
|---|---|---|---|---|---|
| 1 | 9.25 | 4.73 | 2.51 | 2.32 | 6.31 |
| 2 | - | - | 4.47 | 4.61 | 11.19 |
| 3 | - | - | 5.77 | 6.97 | 14.31 |
| 4 | - | - | 6.56 | 9.36 | 17.7 |
| Catalyst | Cat-0N | Cat-1N | Cat-2N |
|---|---|---|---|
| pH | 6.0 | 9.6 | 10.5 |
| lgSZnS | 8.9 | 5.5 | 3.9 |
| lgSCdS | 11.7 | 10.9 | 9.4 |
| Catalyst | Whole Average (A) | Lighter Spots (B) | Darker Area (C) |
|---|---|---|---|
| Cat-0N-0H | 3.09 | 2.0 | 4.3 |
| Cat-0N | 3.14 | 2.5 | 3.4 |
| Cat-1N-0H | 3.10 | 1.3 | 3.6 |
| Cat-1N | 2.95 | 1.4 | 3.1 |
| Cat-2N-0H | 3.09 | 0.9 | 3.4 |
| Cat-2N | 3.02 | 1.3 | 3.1 |
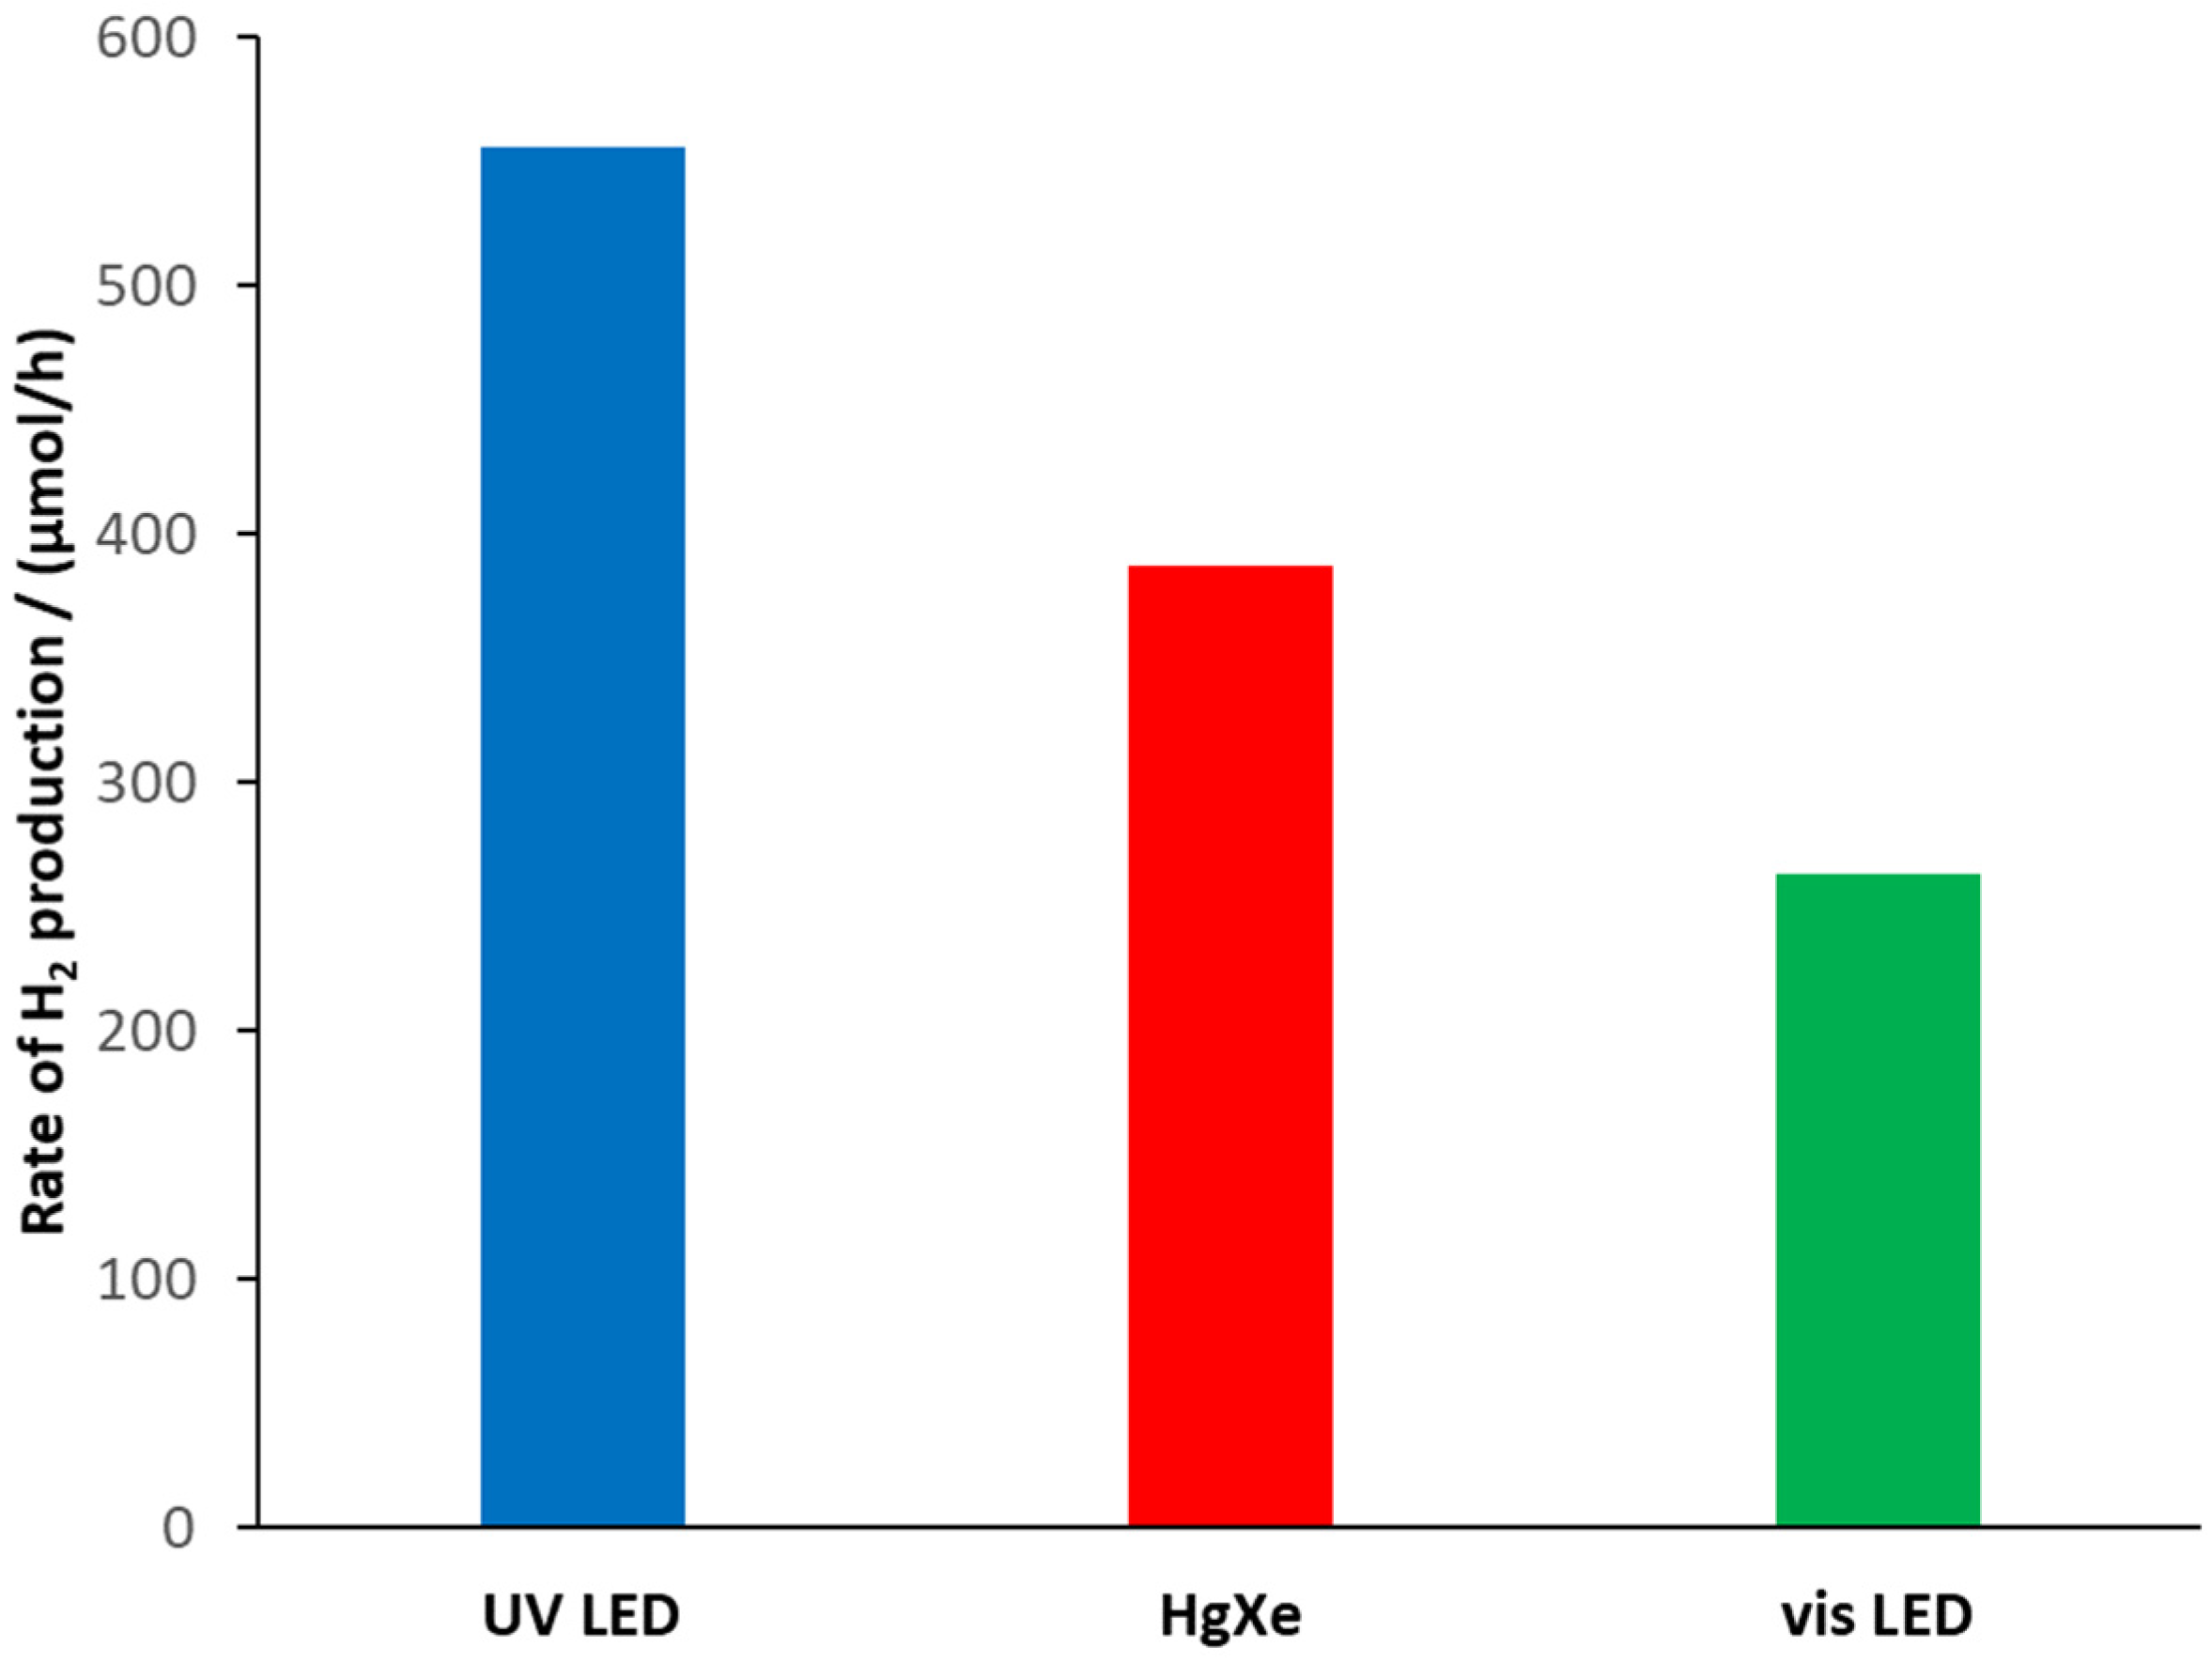
| Light Sources | |||
|---|---|---|---|
| UV-LED | Hg-Xe | Vis-LED | |
| nphotons/t (mmol/h) | 12.06 | 11.25 | 27.75 |
| RHP (mmol H2/h) | 0.551 | 0.384 | 0.261 |
| RHP (mmol H2/g/h) | 30.6 | 21.3 | 14.5 |
| IPCE | 9.14% | 6.82% | 1.88% |
| Ratio of abs. photons | 99.8% | 85.0% | 47.3% |
| QY | 9.16% | 8.02% | 3.98% |
Publisher’s Note: MDPI stays neutral with regard to jurisdictional claims in published maps and institutional affiliations. |
© 2021 by the authors. Licensee MDPI, Basel, Switzerland. This article is an open access article distributed under the terms and conditions of the Creative Commons Attribution (CC BY) license (https://creativecommons.org/licenses/by/4.0/).
Share and Cite
Mersel, M.-A.; Fodor, L.; Pekker, P.; Jakab, M.; Makó, É.; Horváth, O. Effects of Preparation Conditions on the Efficiency of Visible-Light-Driven Hydrogen Generation Based on Cd0.25Zn0.75S Photocatalysts. Catalysts 2021, 11, 1534. https://doi.org/10.3390/catal11121534
Mersel M-A, Fodor L, Pekker P, Jakab M, Makó É, Horváth O. Effects of Preparation Conditions on the Efficiency of Visible-Light-Driven Hydrogen Generation Based on Cd0.25Zn0.75S Photocatalysts. Catalysts. 2021; 11(12):1534. https://doi.org/10.3390/catal11121534
Chicago/Turabian StyleMersel, Maali-Amel, Lajos Fodor, Péter Pekker, Miklós Jakab, Éva Makó, and Ottó Horváth. 2021. "Effects of Preparation Conditions on the Efficiency of Visible-Light-Driven Hydrogen Generation Based on Cd0.25Zn0.75S Photocatalysts" Catalysts 11, no. 12: 1534. https://doi.org/10.3390/catal11121534