
Synthesis and Performance of Photocatalysts for Photocatalytic Hydrogen Production: Future Perspectives


Abstract
: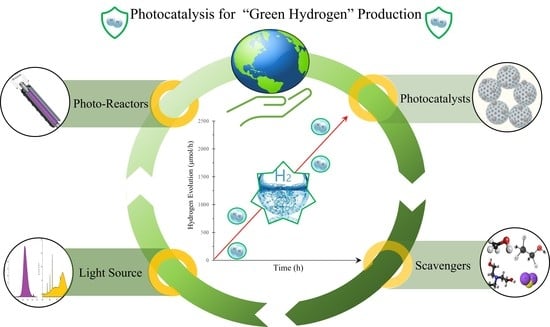
1. Introduction
2. Synthesis and Characterization of Heterojunction Composite Photocatalysts for Hydrogen Production
2.1. TiO2-Based Photocatalysts
2.2. Assorted Frames (No TiO2)-Based Photocatalysts
3. Photocatalytic Reactors for Hydrogen Production
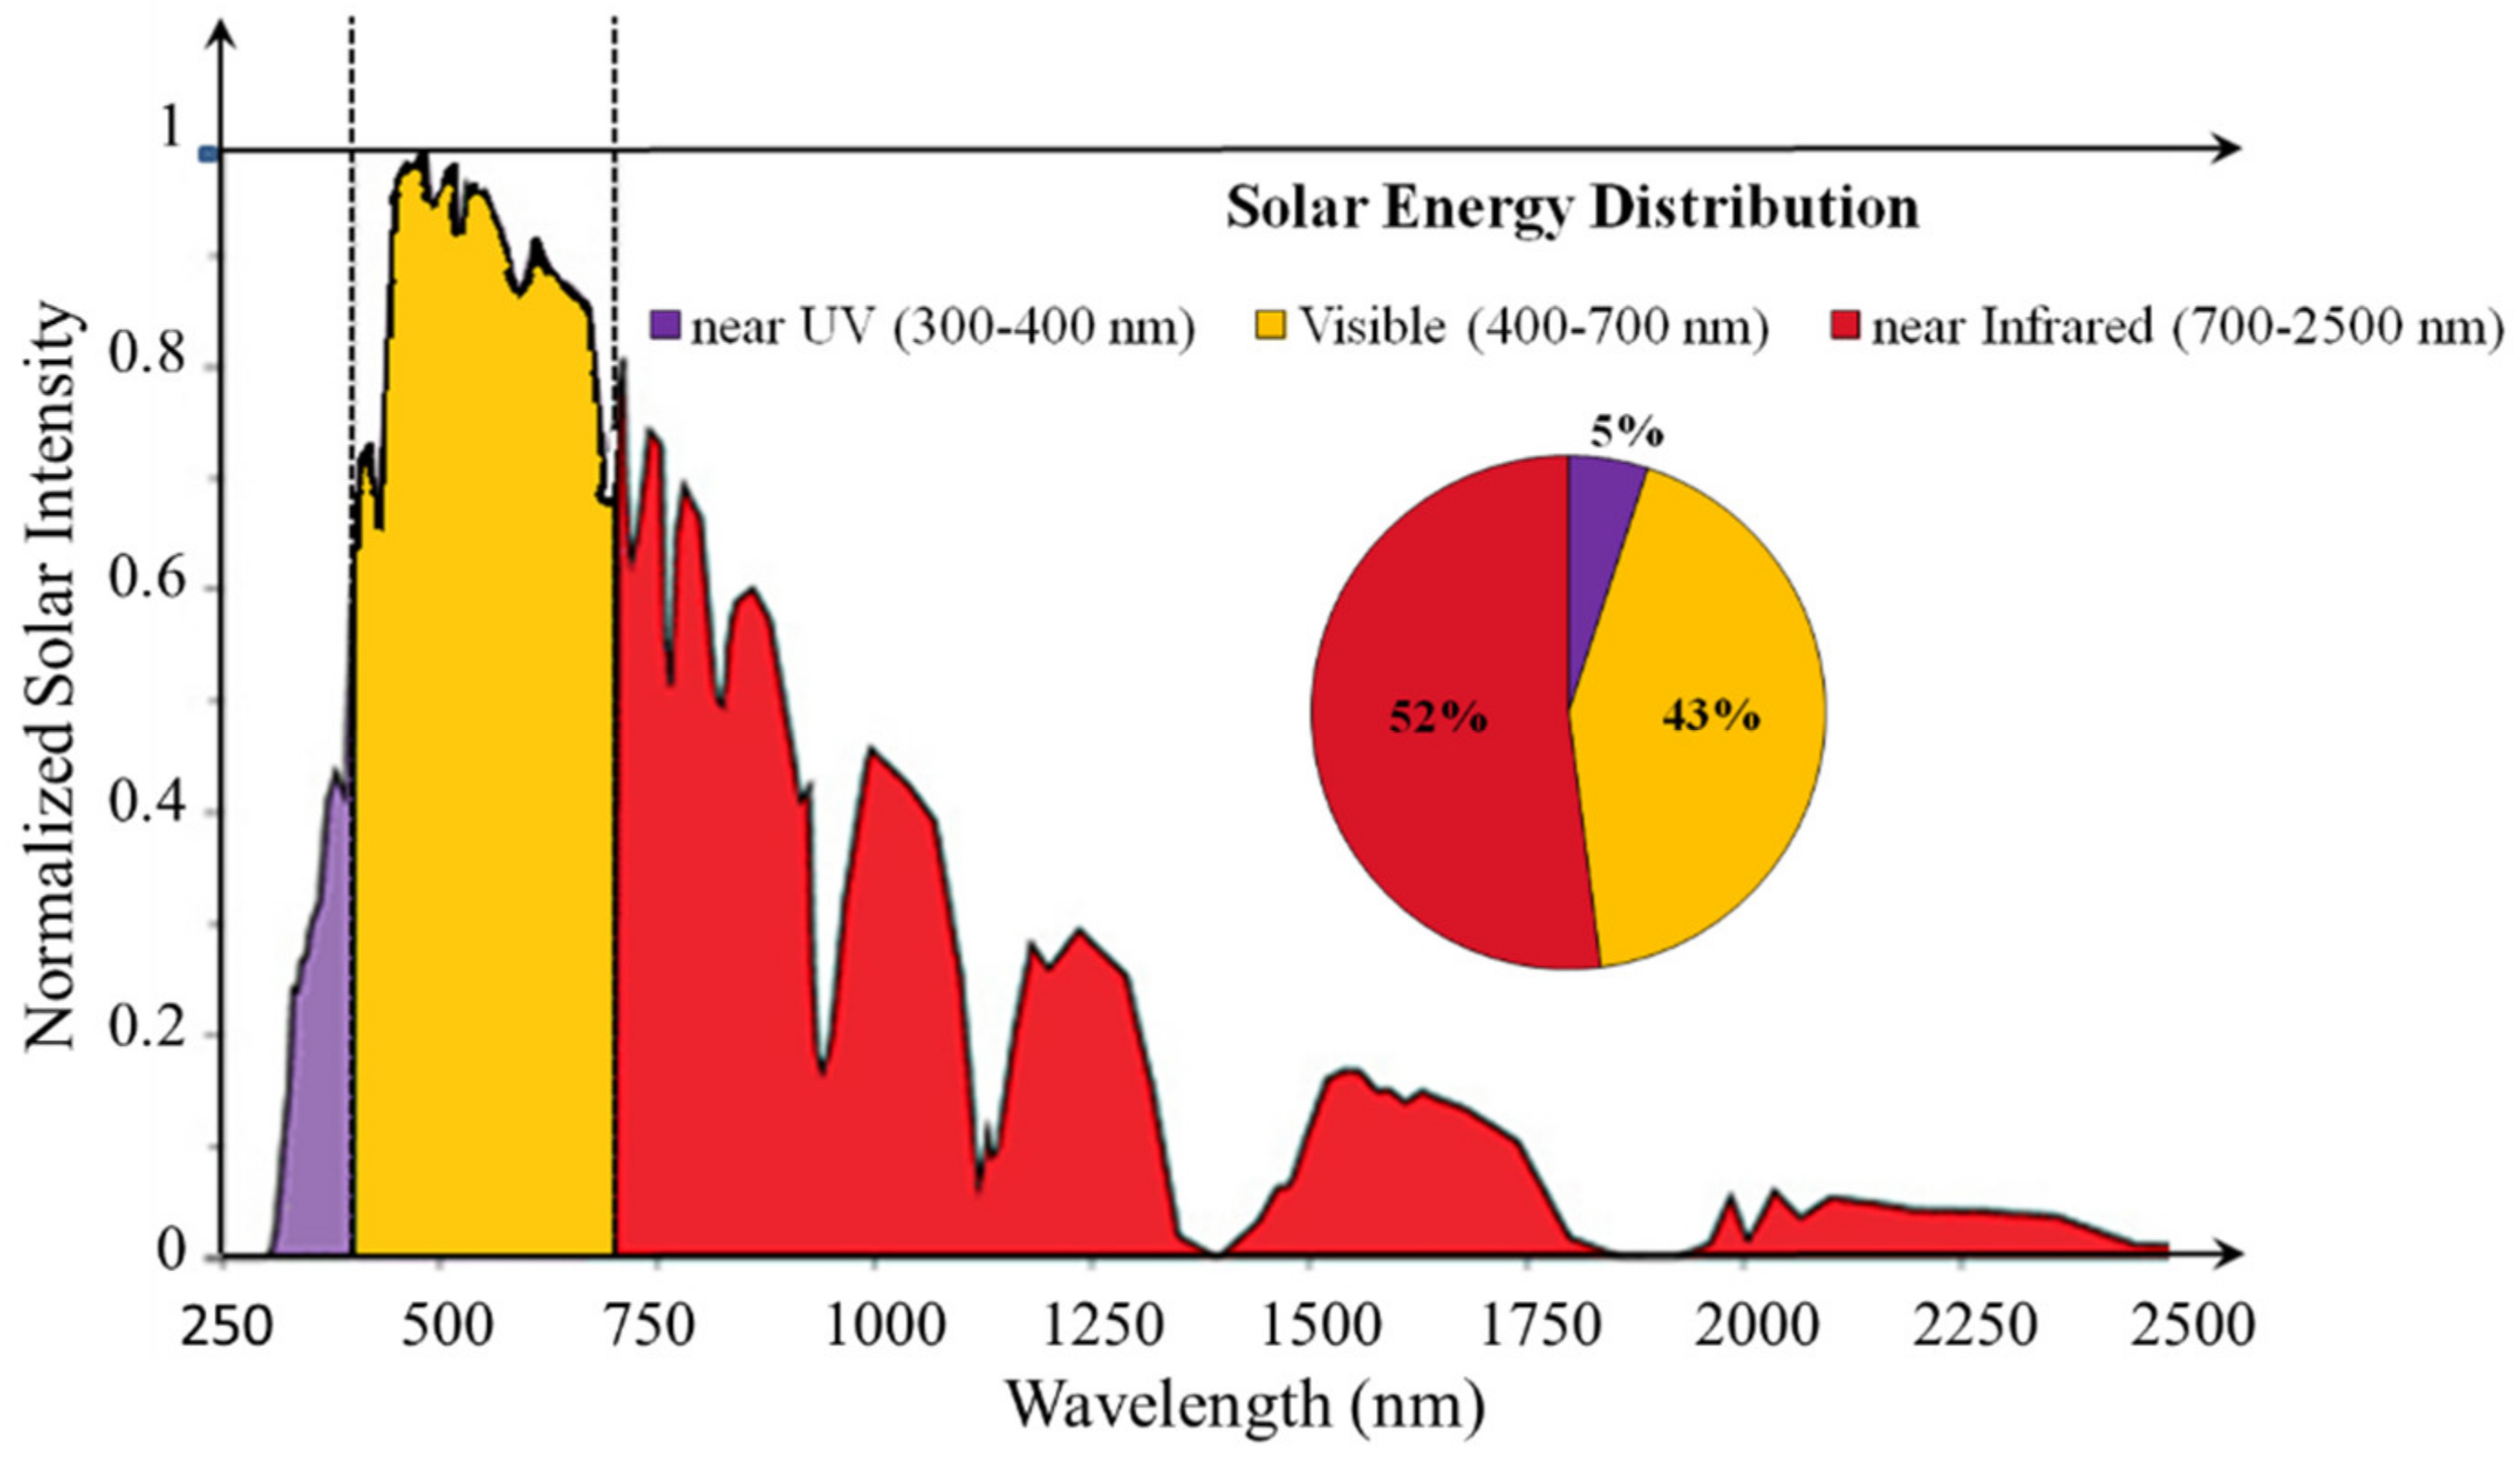
3.1. Type of Light Source
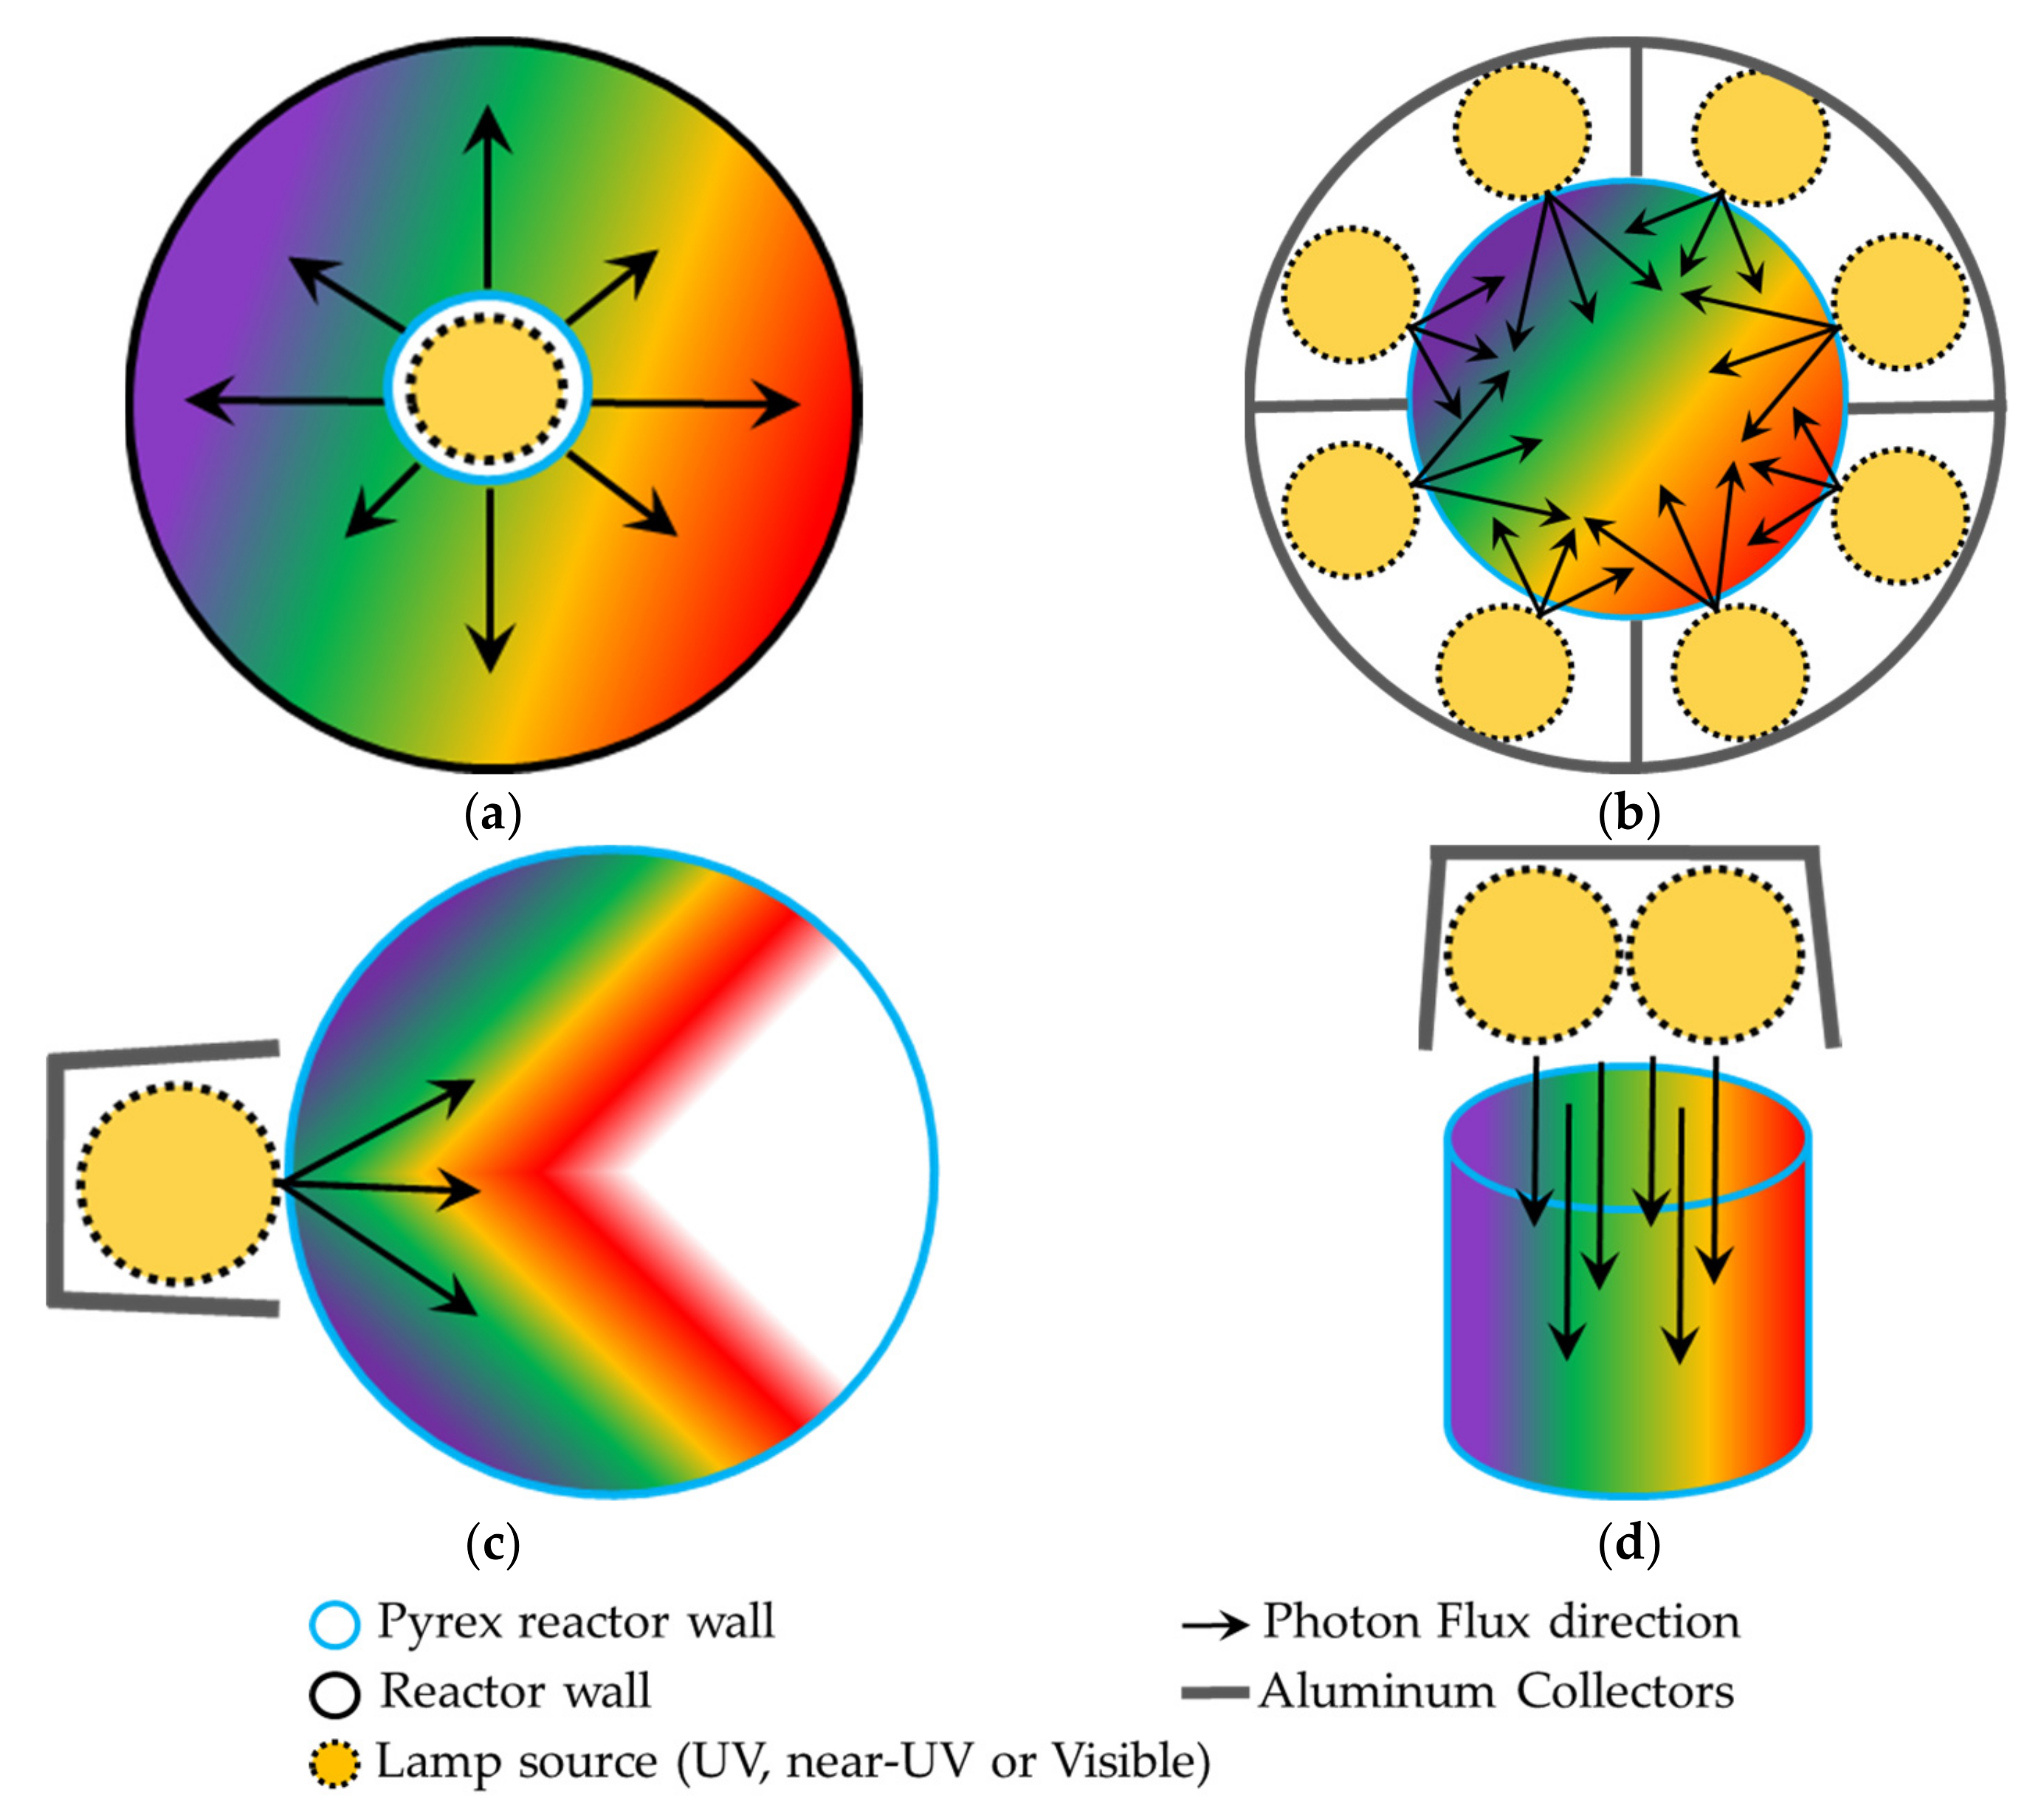
3.2. Location of Light Source

3.3. Experimental Photocatalytic Reactors for the Photocatalytc Production of Hydrogen
4. Reaction Engineering of Photocatalytic Hydrogen Production
4.1. “Series-Parallel” Reaction Networks
4.2. Adsorption Models
4.2.1. Langmuir Isotherm
4.2.2. Langmuir–Hinshelwood Kinetic Model
5. Energy Efficiency Studies in Photoreactors for Hydrogen Production
5.1. Quantum Yields (QYs or )
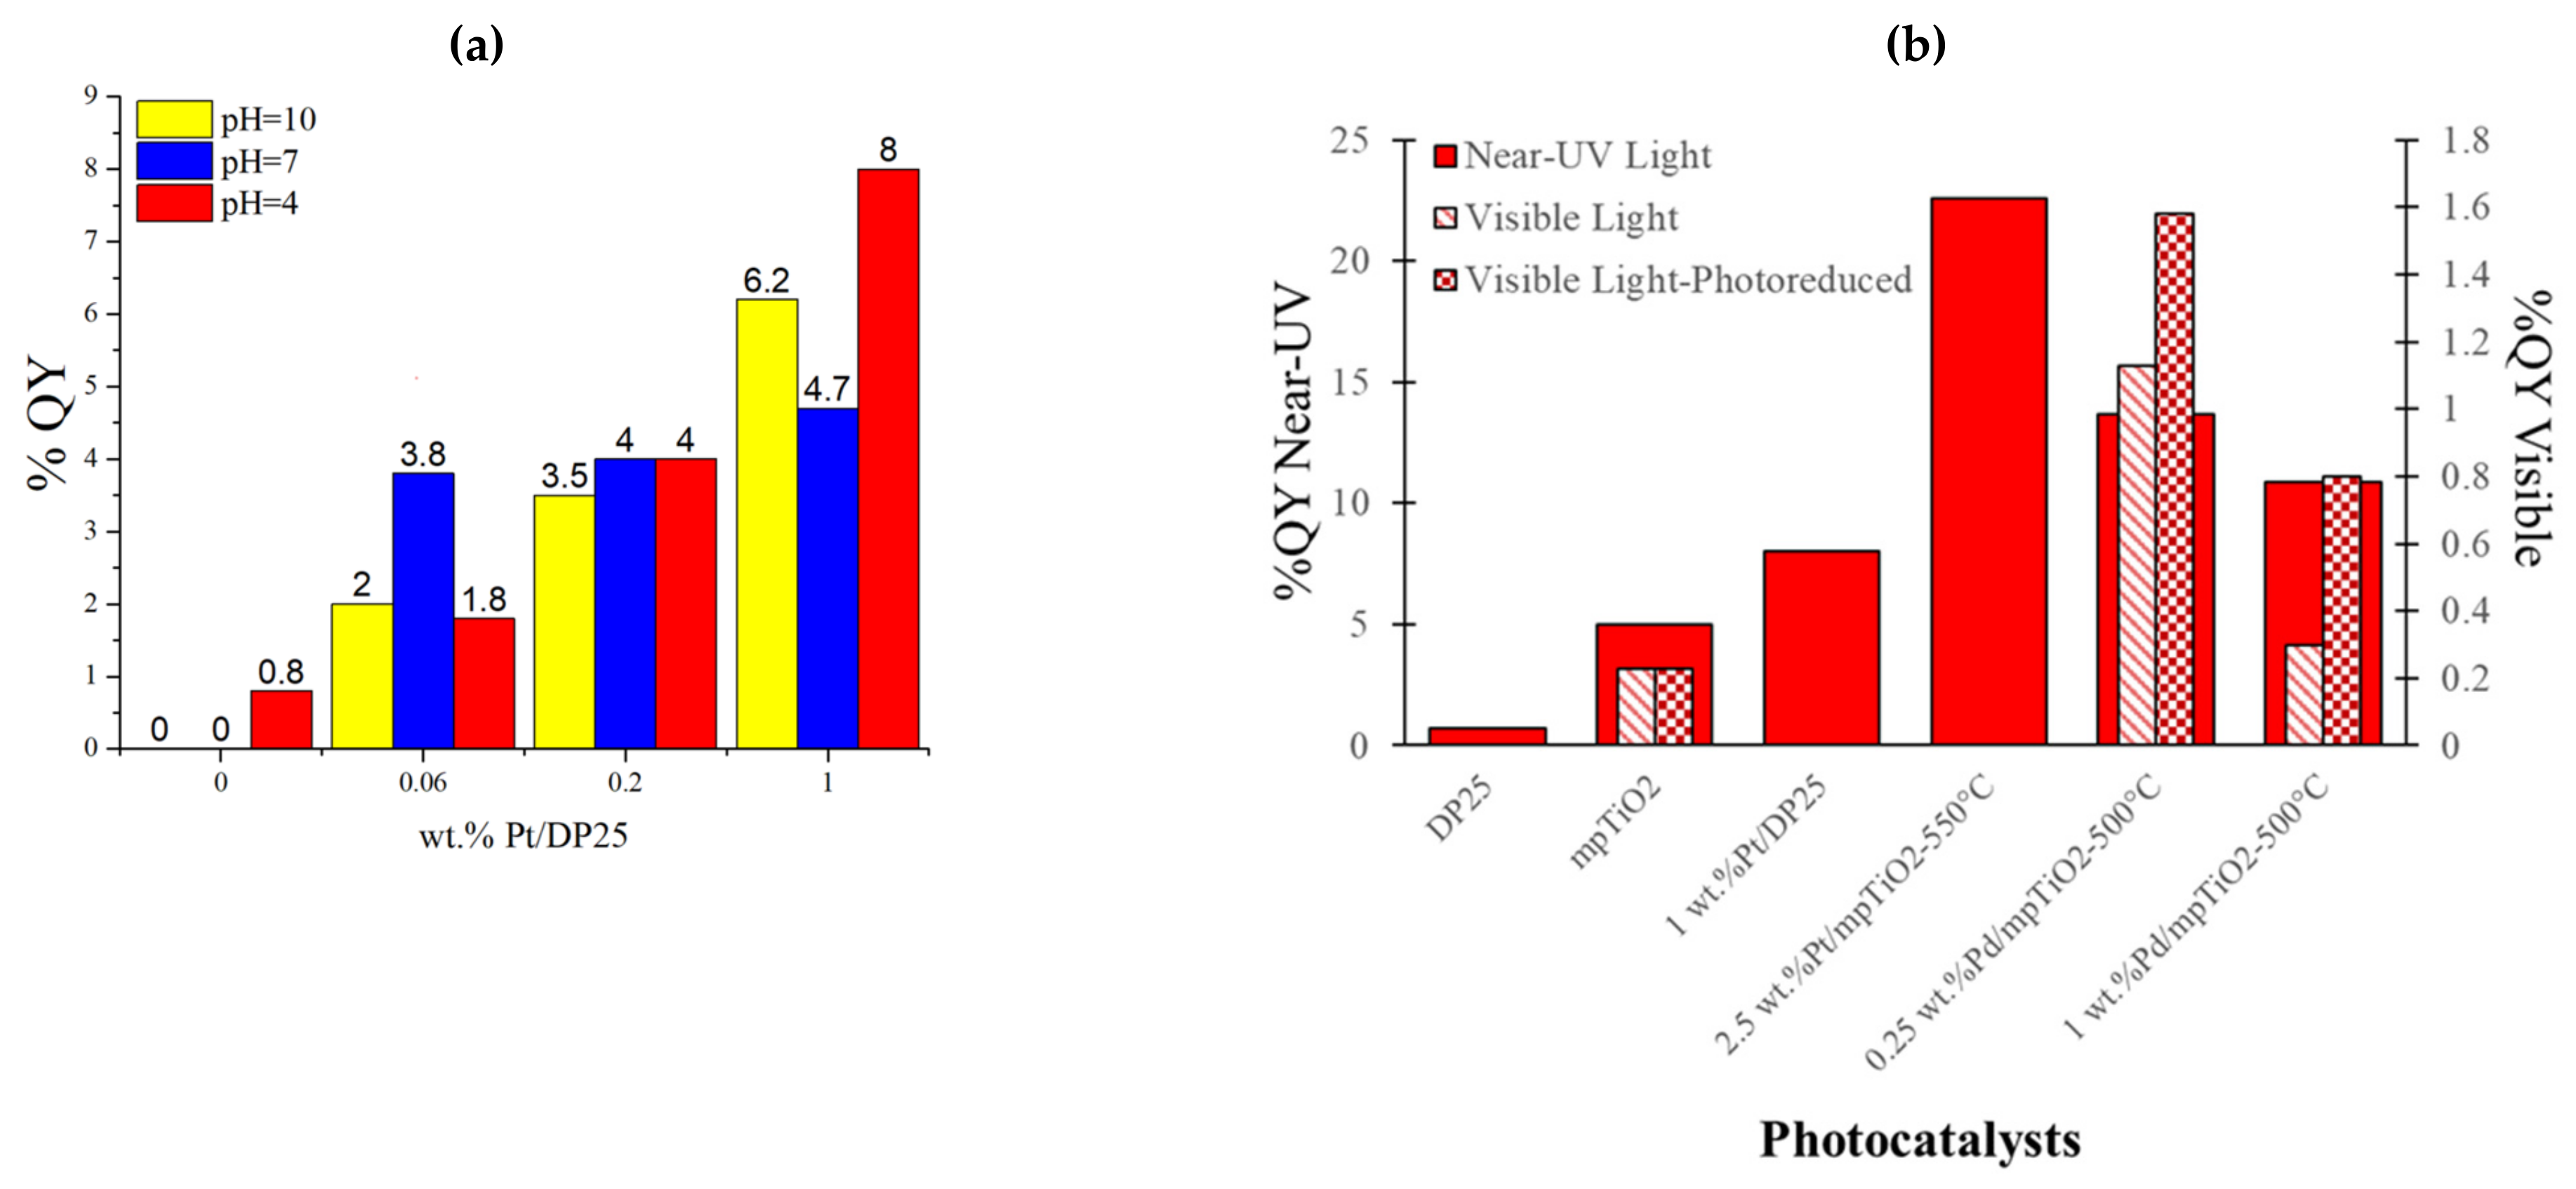
Effect of Platinum Loading and pH on the Quantum Yields for H2 Production
5.2. Photochemical Thermodynamic Efficiency Factors (PTEFs)
6. Future Opportunities for the Photocatalytic Conversion of Hydrogen
Artificial Intelligence in Photocatalysis
7. Conclusions
8. Directions for Future Works on “Green” H2 Production
Author Contributions
Funding
Acknowledgments
Conflicts of Interest
Nomenclature
| A | Uniformly irradiated mesh area holding an optimum loading of TiO2 (m2) |
| Ag | Silver |
| Ar | Argon |
| Au | Gold |
| c | Speed of light (3 × 10⁸ m/s) |
| C | Carbon |
| CH4 | Methane |
| CH3COOH | Acetic Acid |
| CO | Carbon Monoxide |
| CO2 | Carbon Dioxide |
| C2H4 | Ethylene |
| C2H4O | Acetaldehyde |
| C2H6 | Ethane |
| C3H8O3 | Glycerol |
| Cu | Copper |
| Co | Cobalt |
| Acetone concentration (kg/m3) | |
| Ci | Concentration of chemical species, “i”, in the liquid phase (mol/L) |
| Dp-BJH | Pore diameter (nm) |
| e− | Electron |
| Eav | Average photon energy (kJ/mol photon). |
| EBG | Energy band gap (eV) |
| eV | Electron volts |
| f [H+] | Influence of pH |
| h | Planck’s constant (6.63 × 10⁻³⁴ J/s)) |
| h+ | Hole |
| H+ | Hydrogen ions |
| H• | Hydrogen radicals |
| H2 | Hydrogen in gas phase |
| HCl | Hydrochloric Acid |
| H2O | Water |
| Apparent reaction kinetic constant of species, “i” (mol/gcat h) | |
| Overall apparent reaction kinetic constant | |
| Adsorption equilibrium constant (L/mol) | |
| L | Liters |
| Fraction of photon energy | |
| Na2S | Sodium sulfide |
| Na2SO3 | Sodium sulfite |
| Ni | Nickel |
| Ni(NO3)2 | Nickel Nitrate (II) |
| OH• | Hydroxyl radicals |
| Pa | Rate of absorbed photons (mol of photons/s). |
| Incident radiation | |
| Reflected radiation | |
| Transmitted radiation | |
| Pd | Palladium |
| Pt | Platinum |
| q (θ,z,λ) | Radiation measured (W/cm2 nm) |
| Qeq, ads | Existing equilibrium adsorption surface concentration (mol/gcat) |
| Qeq, max | Maximum equilibrium adsorption surface concentration (mol/gcat) |
| Qeq, max-1 | Langmuir maximum equilibrium adsorption surface concentrations (mol/gcat) |
| Qeq, max-2 | Freundlich maximum equilibrium adsorption surface concentrations (mol/gcat) |
| R+ | Reduced |
| SBET | Surface Area (m2/g) |
| t | Time (s, min, or h) |
| Ti | Titanium |
| TiCl4 | Titanium tetrachloride |
| TiO2 | Titanium dioxide |
| V | Total volume of the PCW-II reactors (L) |
| Vp-BJH | Pore volume (cm3/g) |
| wt.% | Weight percent (%) |
| Irradiated photocatalyst mass (gcat) | |
| Acronyms | |
| A | Anatase |
| AAD | Absolute Average Deviation |
| AI | Artificial Intelligence |
| ANN | Artificial Neural Network |
| BET | Brunauer–Emmett–Teller |
| BJH | Barrett–Joyner–Halenda |
| BTX | Benzene–Toluene–Xylene |
| CB | Conduction Band |
| CFD | Computational Fluid Dynamics |
| CREC | Chemical Reactor Engineer Centre |
| CVD | Chemical Vapor Deposition |
| DDTC | Diethyldithiocarbamate Trihydrate |
| DB | Debye-Scherrer |
| DP25 | Degussa P25 (Commercial TiO2) |
| EtOH | Ethanol |
| GA | Generic Algorithms |
| GO | Graphene Oxide |
| LED | Light-Emitting Diode |
| L-H | Langmuir–Hinshelwood |
| LVRPA | Local Volumetric Rate of Photon Absorption |
| MeOH | Methanol |
| MAE | Mean Absolut Error |
| MIEB | Macroscopic Irradiation Energy Balances |
| mp | Mesoporous |
| NLM | Nonlinear Regression Model |
| PAHs | Polycyclic Aromatic Hydrocarbons |
| PCW-II | Photo-CREC Water-II Reactor |
| PTEFs | Photocatalytic Thermodynamic Efficiency Factors |
| QYs | Quantum Yields |
| QYapp | Apparent Quantum Yield |
| QYoverall | Overall Quantum Yield |
| QYtheor | Theoretical QYs |
| R | Rutile |
| R2 | Coefficient of determination |
| R2adj | Adjusted coefficient of determination |
| RMS | Root Mean Squared Error |
| RSM | Response Surface Model |
| RVE | Representative Volume Element |
| SVM | Support Vector Machine |
| TEAO | Triethanolamine |
| UV | Ultraviolet |
| VB | Valence Band |
| Symbols | |
| θ | Angular position (°) |
| Dimensionless surface species concentration | |
| Rate of photoconversion of the model pollutant “i” (mol/t gcat) | |
| Enthalpy invested in the formation of the OH• radicals (J/mol) | |
| λ | Radiation wavelength (nm) |
| Fluid density (kg/m3) | |
| Stoichiometric coefficient | |
| r | Radial position (cm) |
| Fraction of photon energy used to form OH• radicals |
Appendix A

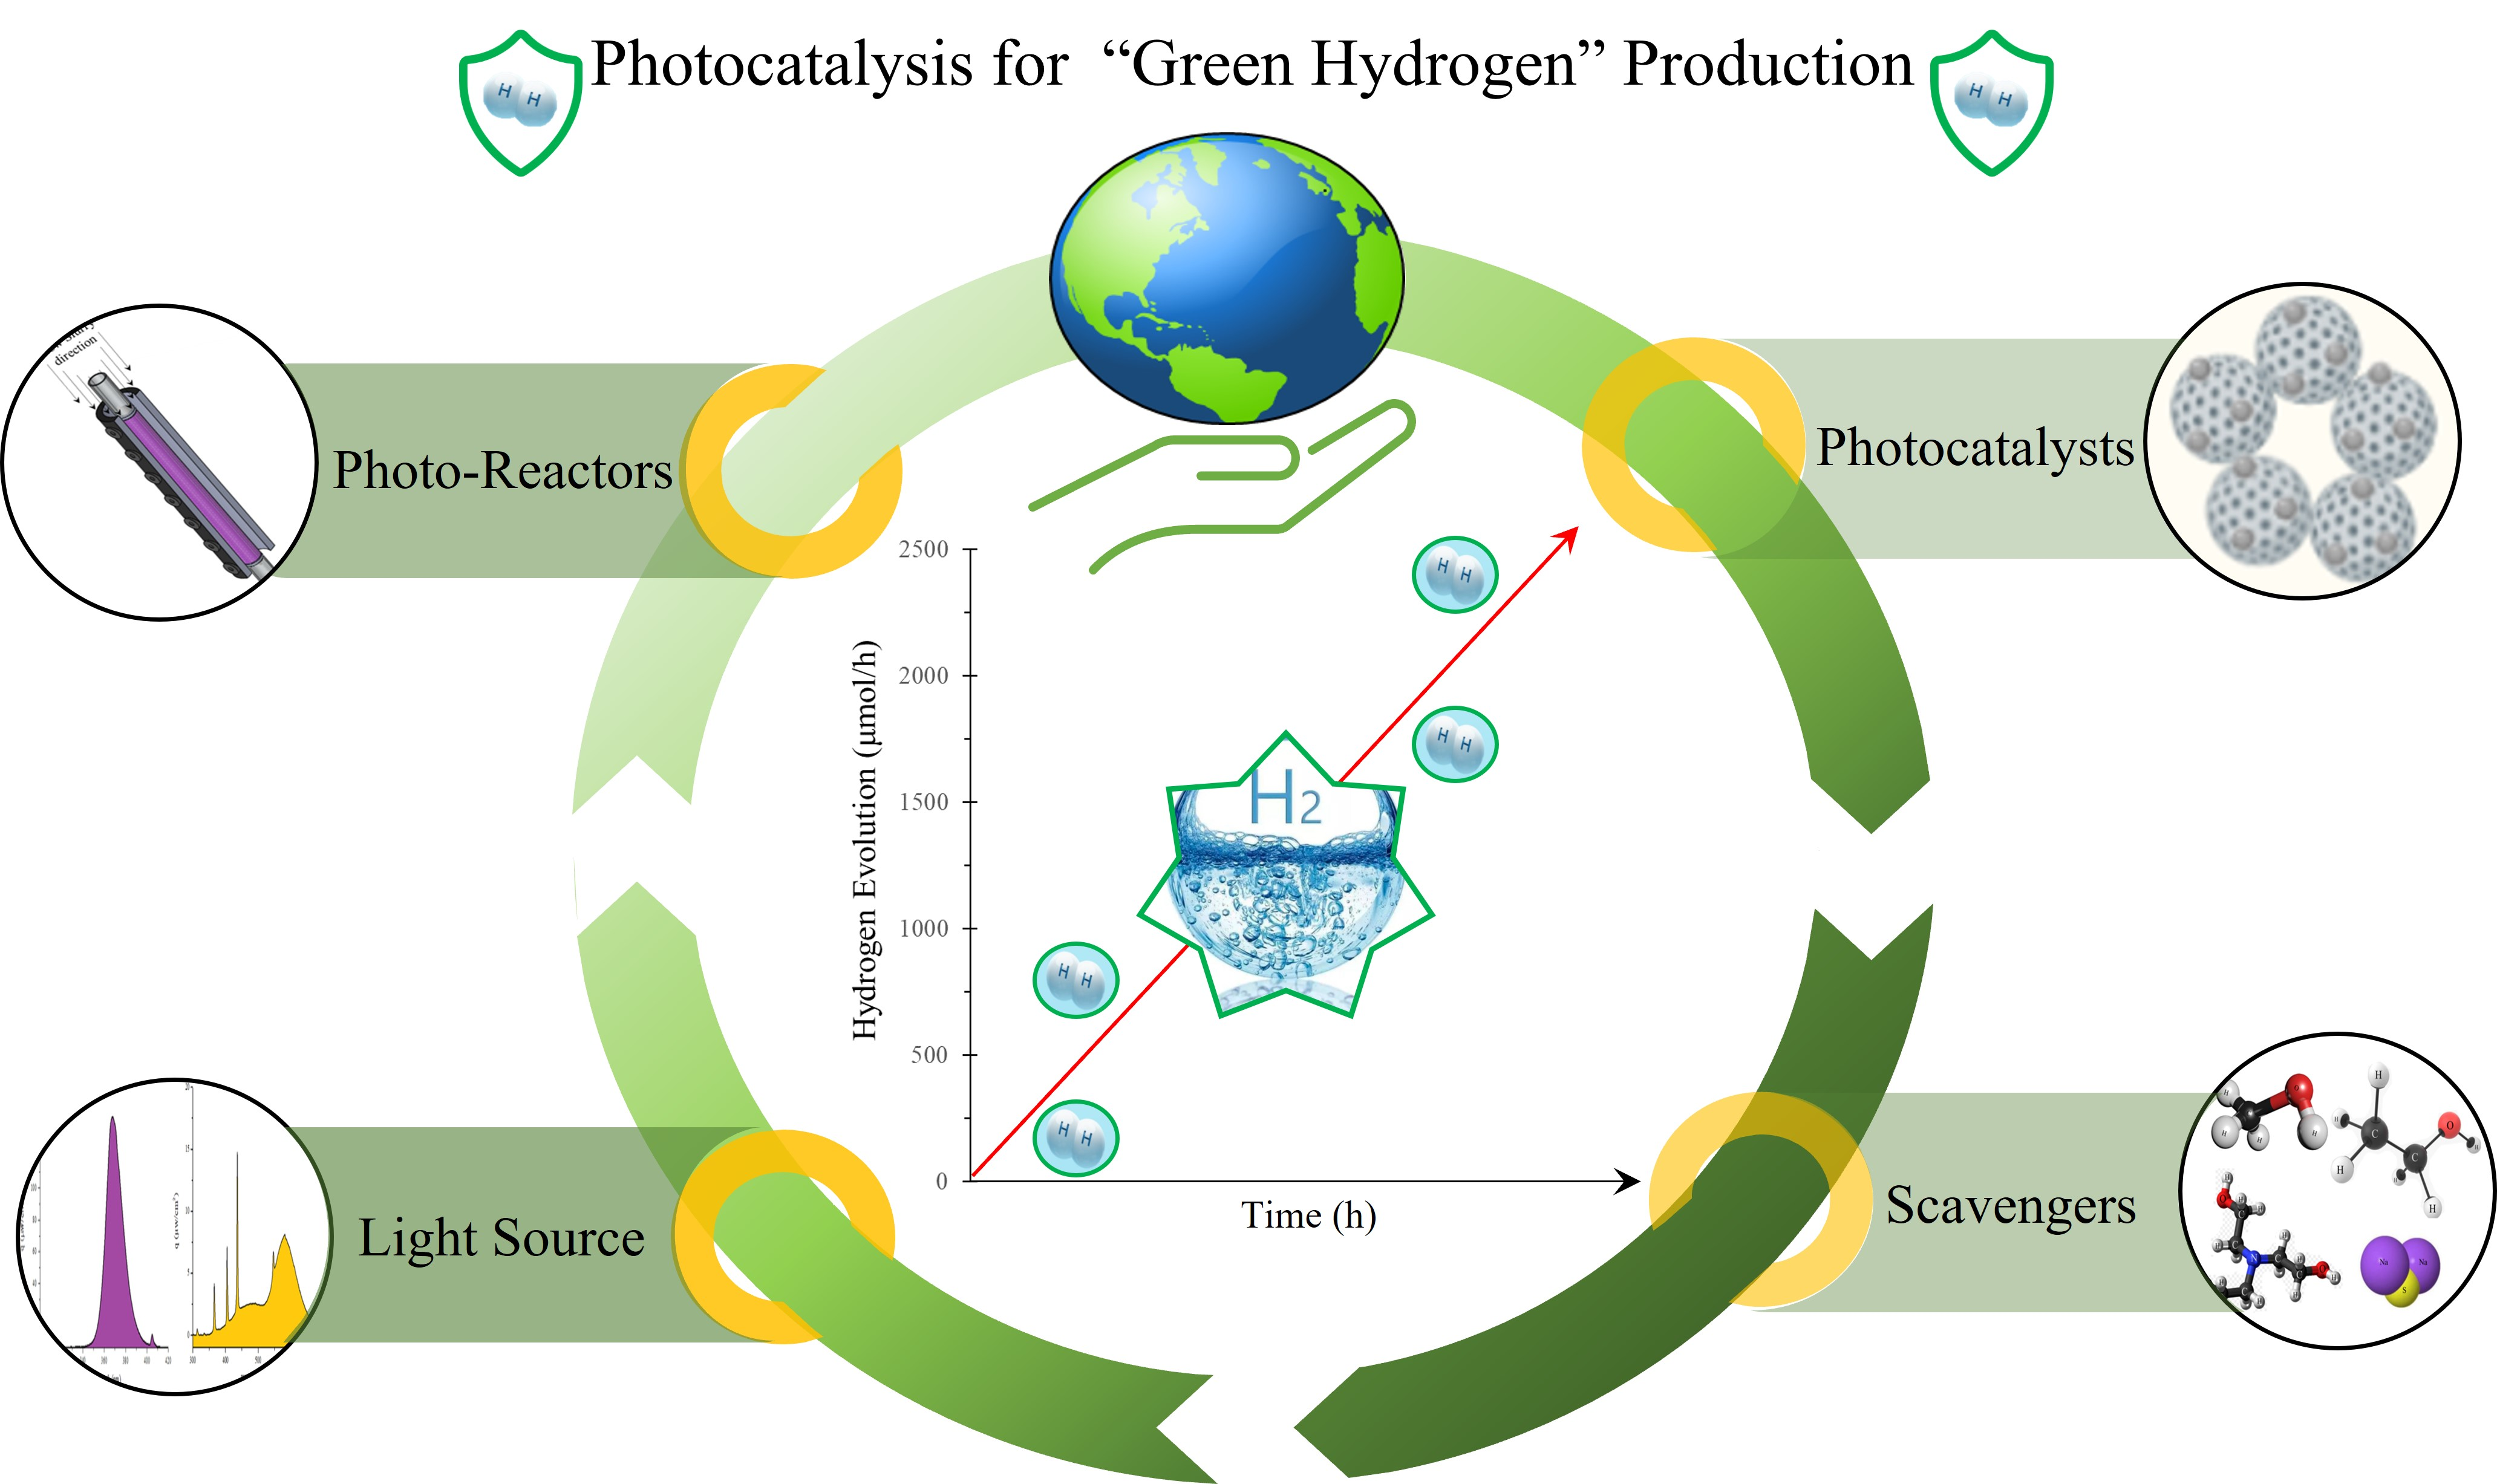
| No. | Ref. | Year | Photocatalyst | Dopant (wt.%) | Load (g L−1) | Crystalline Phase (%) | SBET (m2/g) | EBG (eV) | e−/h+ Scavenger | pH | Source of Light | λ (nm) | H2 Production (μmol h−1) | QYs% | PTEFs % |
|---|---|---|---|---|---|---|---|---|---|---|---|---|---|---|---|
| 1 | [39,65] | 2013 | TiO2 (DP25) | - | 0.15 | A: R 87: 13 | 54 | 3.20 | C2H3OH | 4± 0.05 | Near UV | 340–410 | 34 | 0.7 | 0.57 |
| 2 | Pt/TiO2 (DP25) | 1 | 2.73 | 256 | 7.9 | 6.05 | |||||||||
| 3 | [27] | 2017 | mpTiO2-550°C | - | A 100 | 168 | 3.10 | 229 | 9.3 | - | |||||
| 4 | Pt/mpTiO2-550 °C | 2.5 | 150 | 2.34 | 629 | 22.6 | 17.1 | ||||||||
| 5 | [39,66] | 2019 | mpTiO2-500 °C | - | 140 | 3.0 | 269 | 5 | 3.85 | ||||||
| 6 | Pd/mpTiO2-500 °C | 1 | 123 | 2.55 | 943 | 10.9 | 8.39 | ||||||||
| 7 | [39,88] | 2020 | 0.25 | 131 | 2.51 | Visible | 300–700 | 54 | 1.13 | 1.04 | |||||
| 8 | [90] | 2018 | Cu/TiO2 (DP25) | 1 | 2 | A: R 80: 20 | 45 | 3.1 | CH3OH | - | UV | - | 85 | 7 α | - |
| 9 | Ni/TiO2 (DP25) | 34 | 2.8 α | ||||||||||||
| 10 | [92] | 2017 | mpTiO2 | 3 | 6 | A 100 | 188 | - | - | Sunlight | - | 0 | 0 α | - | |
| 11 | Cu/TiO2 (DP25) | - | 67 | 4.1 α | |||||||||||
| 12 | Cu/mpTiO2 | 75 | 167 | 11.4 α | |||||||||||
| 13 | [94] | 2014 | CdS-ZnS/DP25 | - | 0.5 | A: R 70: 30 | 55 | 2.88 | Na2S Na2SO3 | 11.3 | Visible UV | 400–700 365 | 1035 | 2.2 α | - |
| 14 | [95] | 2019 | Pt/rGO/DP25 | 0.5/5/5 | 1 | A: R 75: 25 | 48 | - | CH3OH | 4 | Near-UV | 315–400 | 505 | 1.57 α | - |
| 15 | [97] | 2016 | NiO/TiO2 | 2 | 1.67 | A: R 70:3 0 | 54 | 2.4 | C3H8O3 | 6.6 | Near-UV | 340–460 | 2054 | - | - |
| 16 | [98] | 2013 | Co/DP25 | 1 | 2 | A: R 80: 20 | 50 | 2.9 | 6 | Visible | 300–700 | 1102 | - | - |
Appendix B
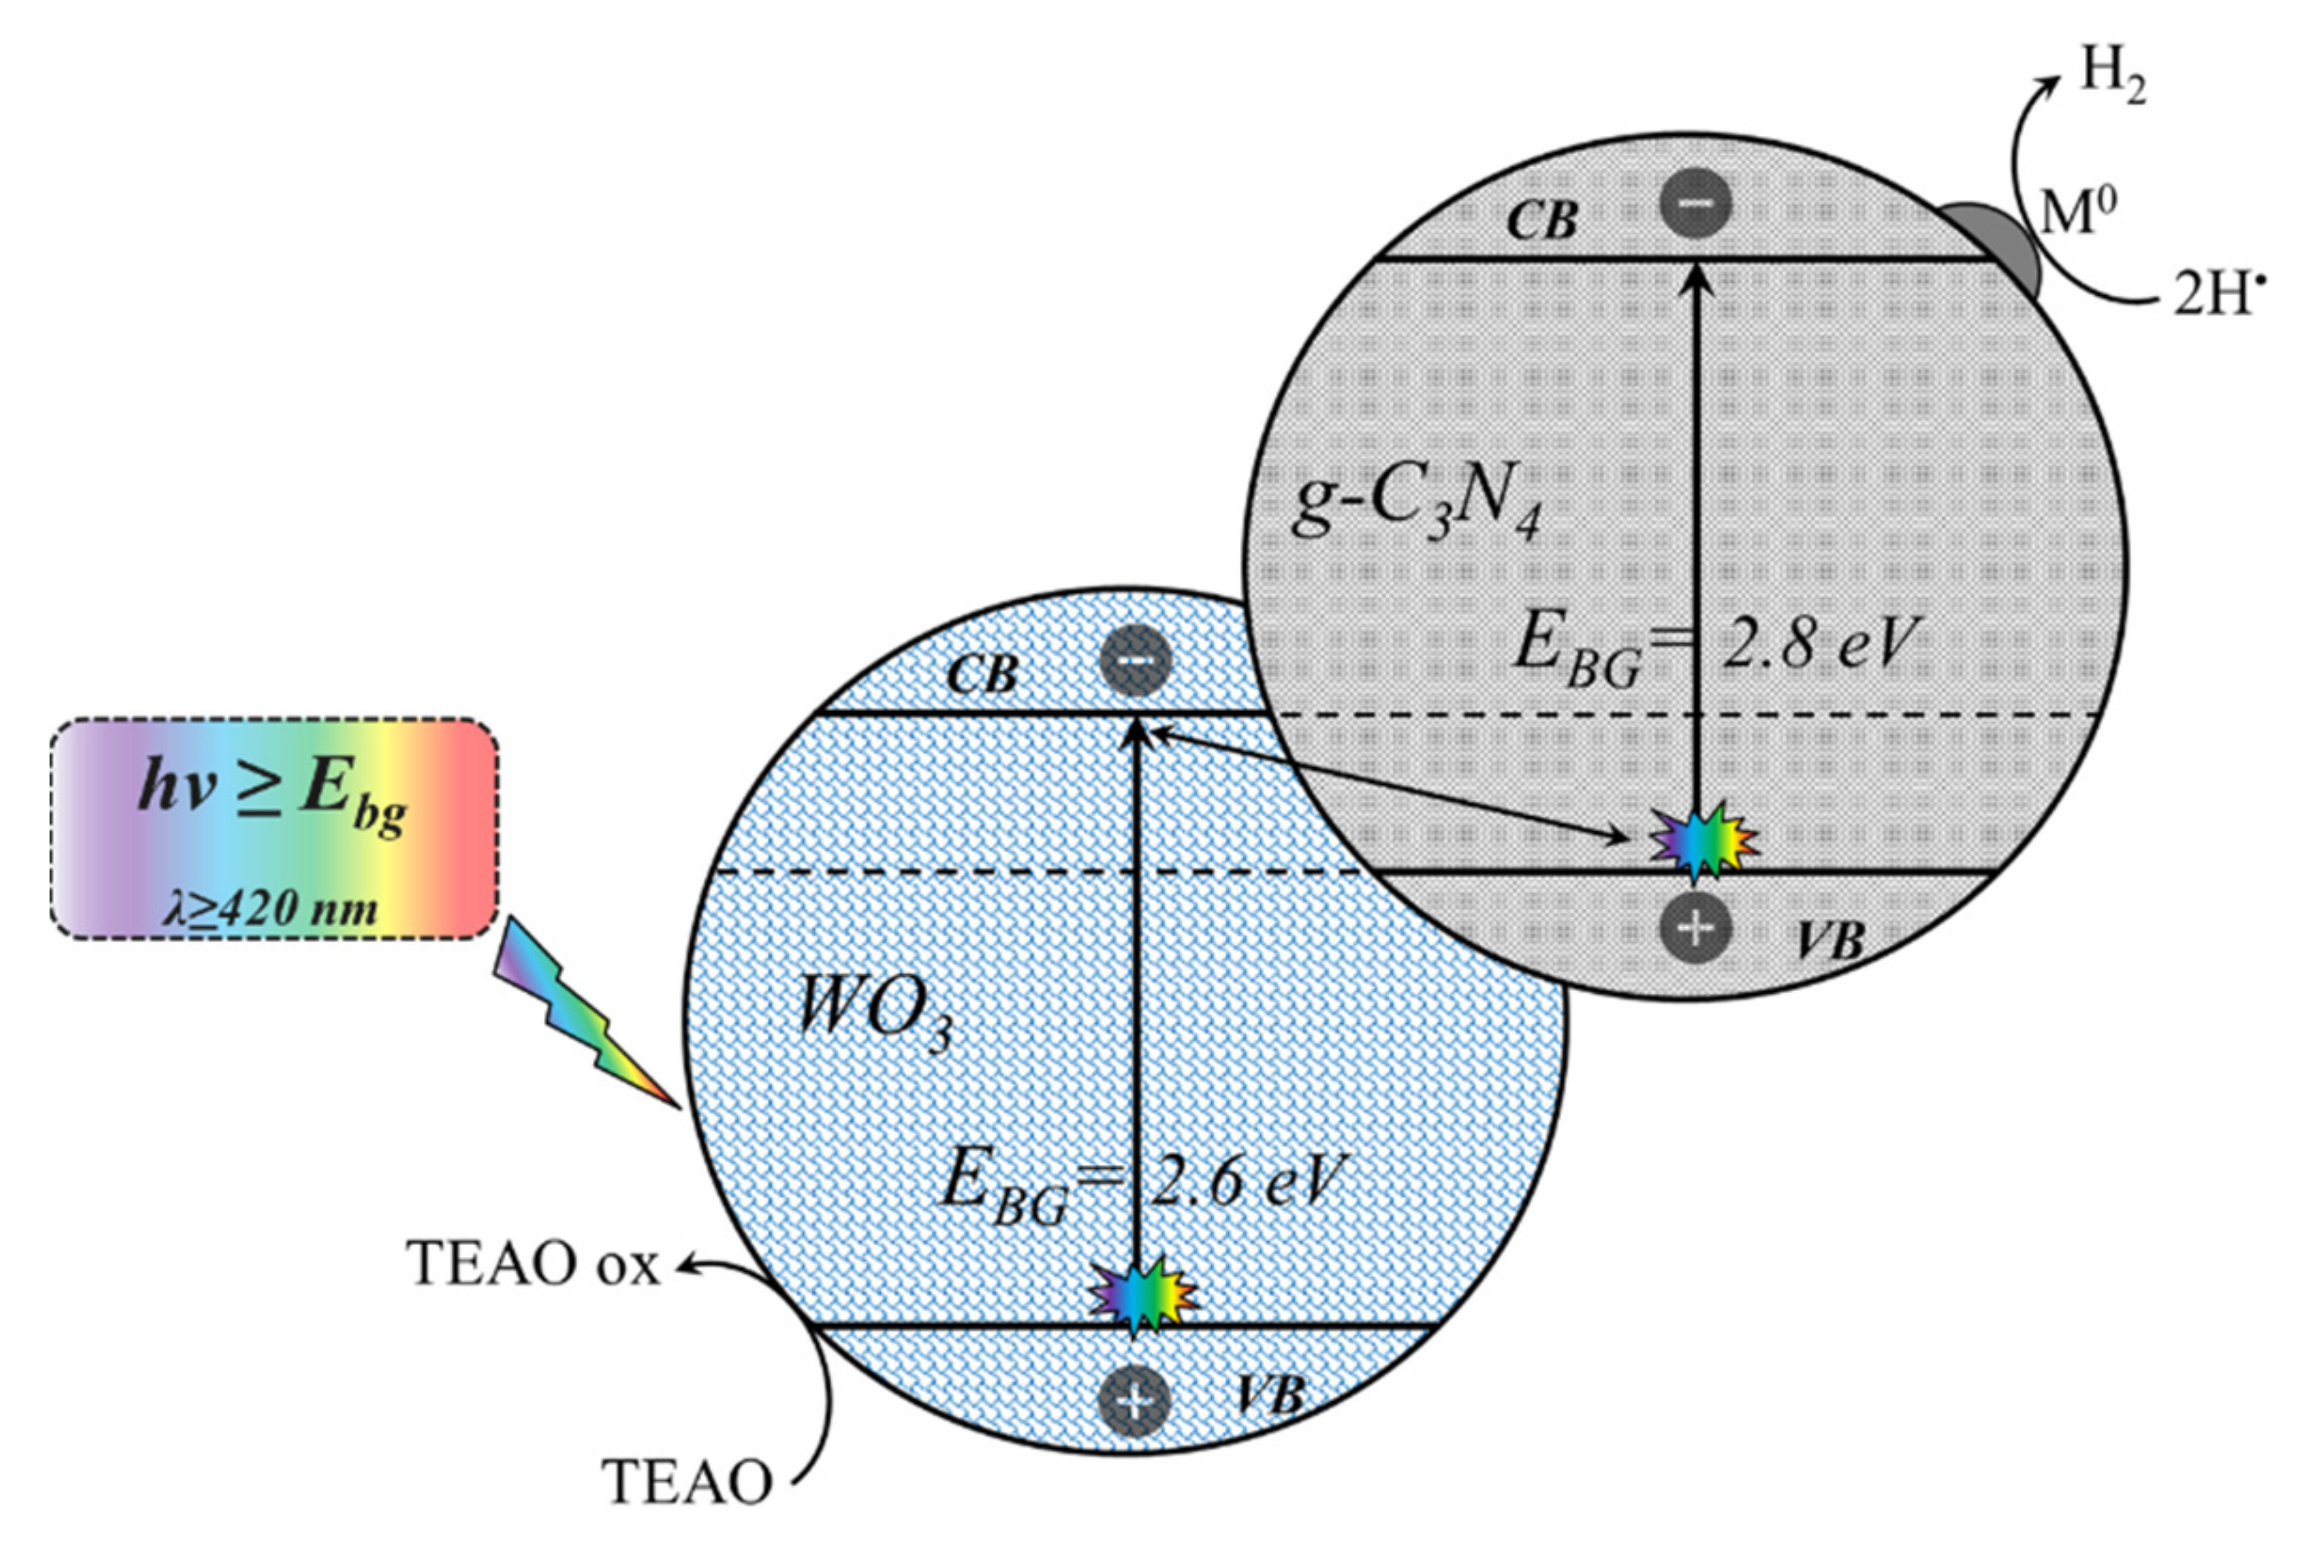
| No. | Ref. | Year | Photocatalyst | Dopant (wt.%) | Load (g L−1) | SBET (m2/g) | EBG (eV) | e−/h+ Scavenger | pH | Source of Light | λ (nm) | H2 Production (µmol h−1) | QYs% |
|---|---|---|---|---|---|---|---|---|---|---|---|---|---|
| 17 | [60] | 2017 | Zn0.5Cd0.5S | - | 0.2 | - | - | Na2S/ Na2SO3 | ~13 | Xe Lamp | 420≤ λ ≥420 | 47 | - |
| 18 | g-C3N4 | TEAO | ~11 | 5.6 | - | ||||||||
| 19 | [114] | 2019 | CdS | - | 0.5 | - | - | 12 | Xe arc Lamp | Simulated Solar light | 47 | - | |
| 20 | g-C3N4 | 41 | - | ||||||||||
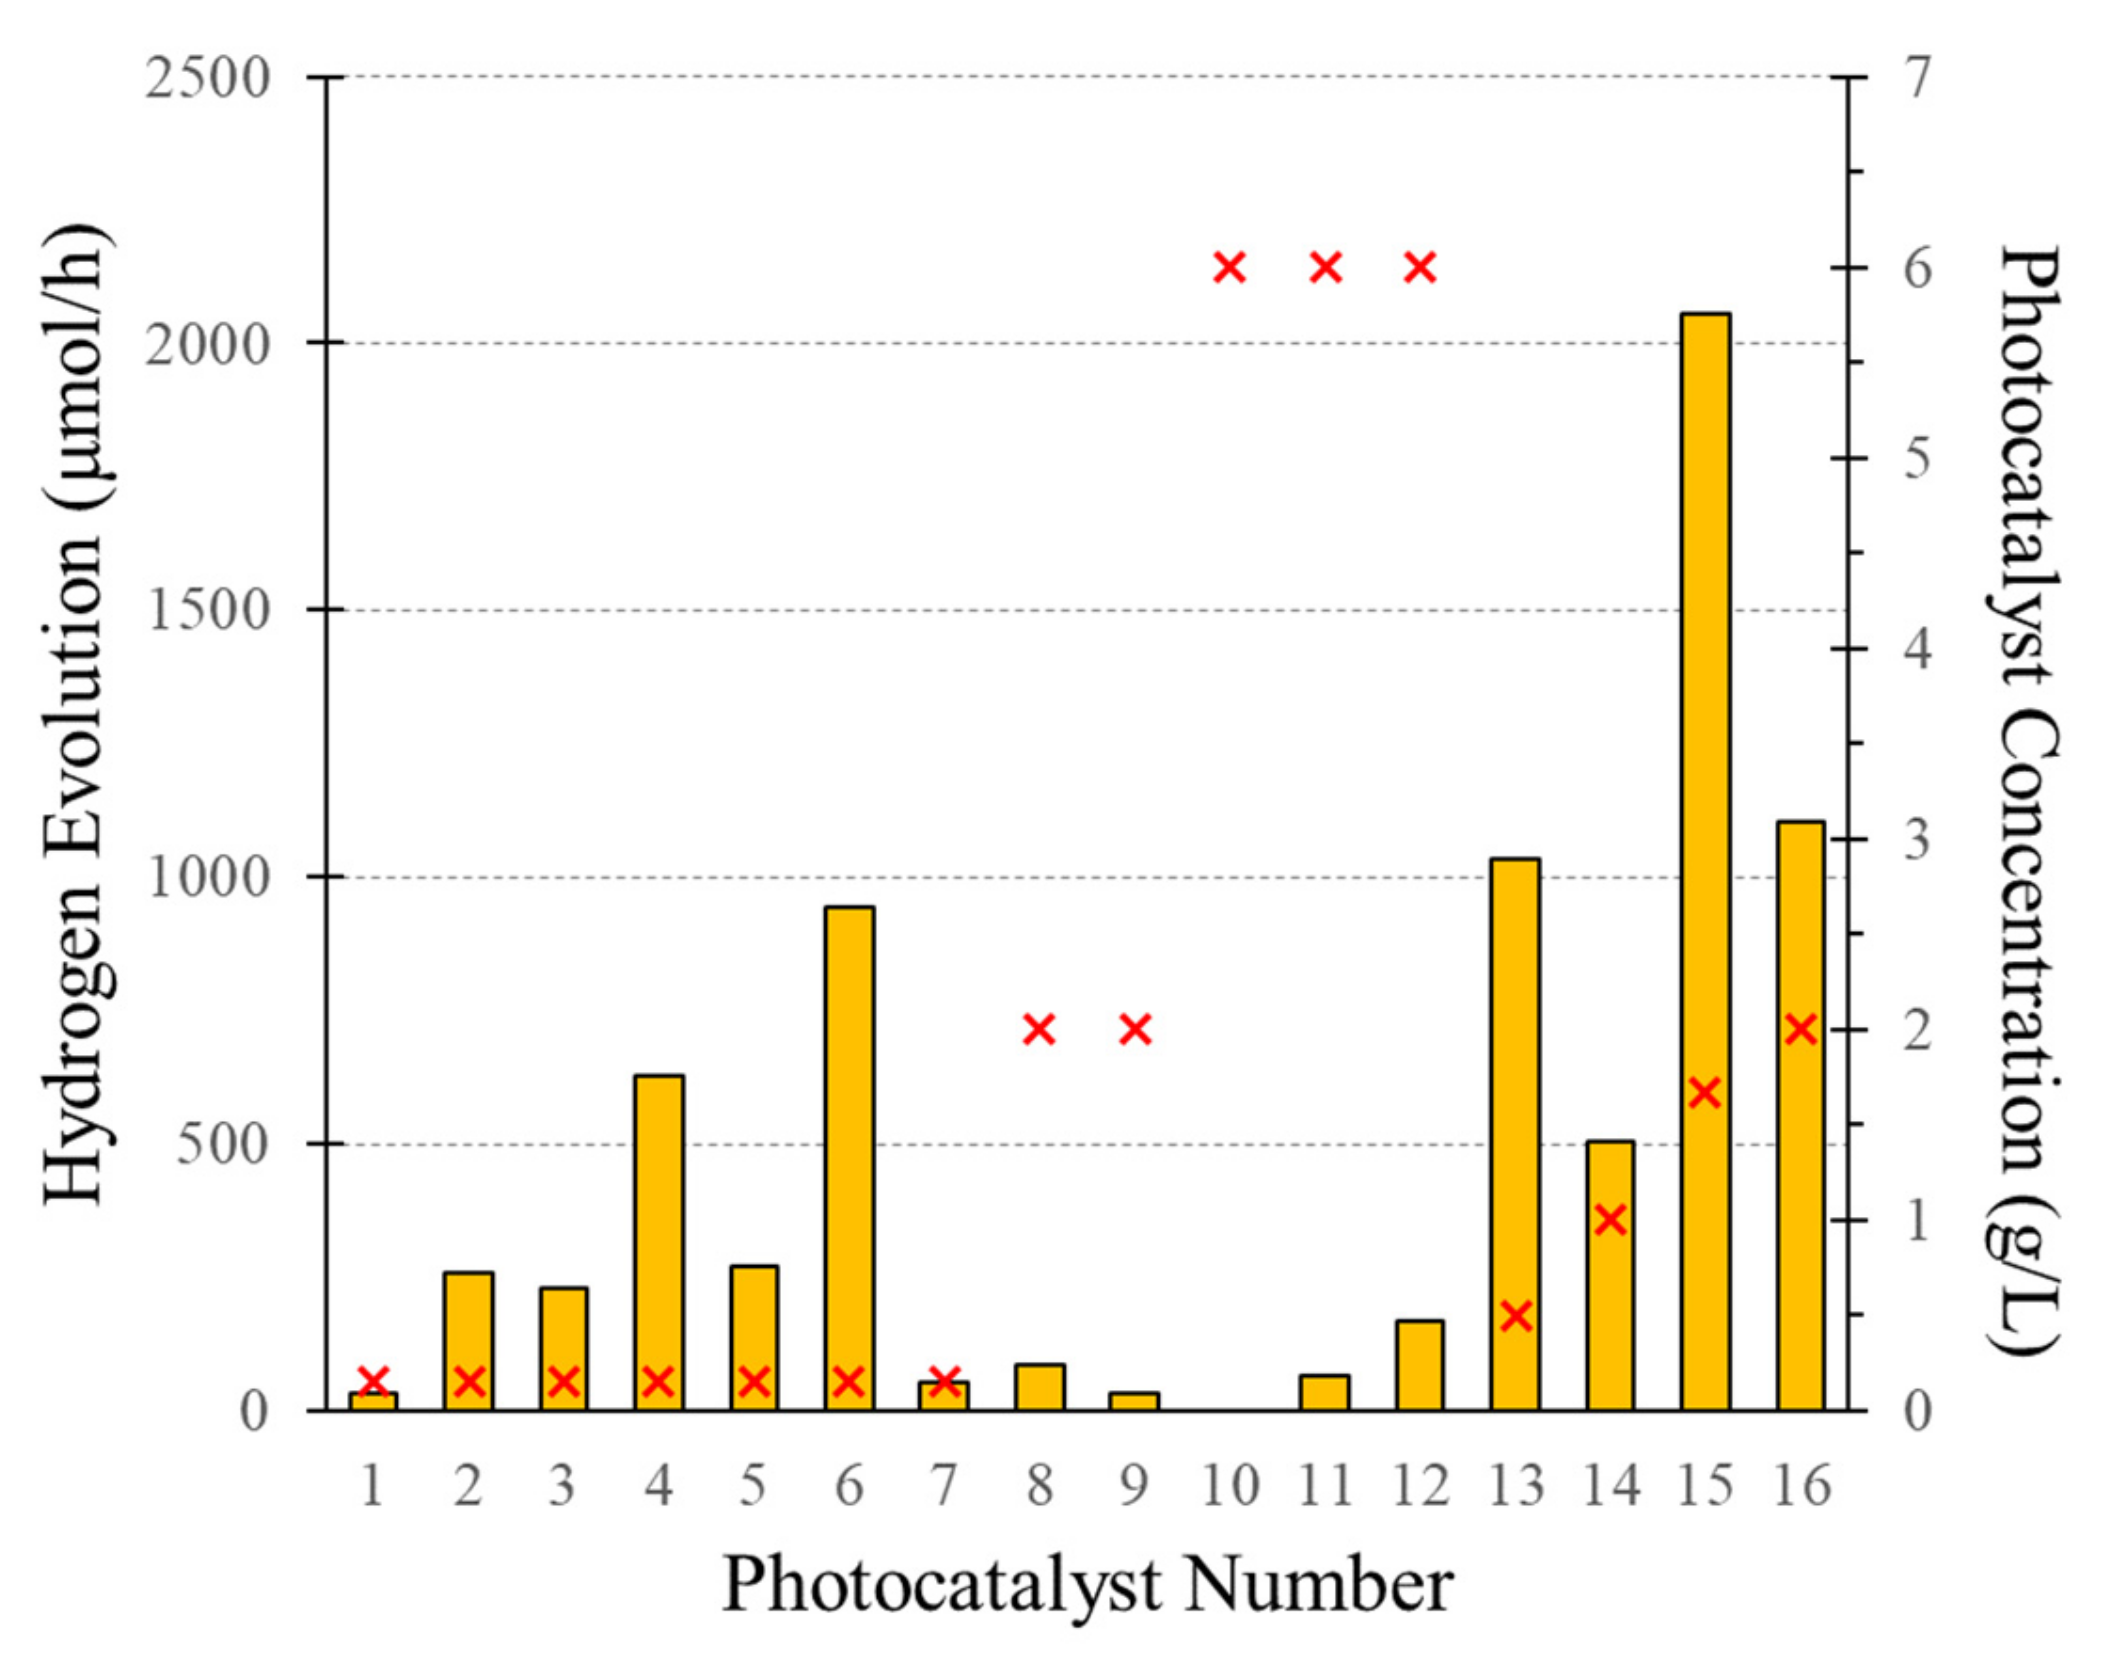
| 21 | [105] | 2014 | WO3/g-C3N4 | 10 | 1 | - | 2.81 | - | Xe Lamp | >420 | 110 | 0.9 α | |
| 22 | [106] | 2014 | Ag2S/g-C3N4 | 5 | 0.625 | 13.02 | 2.58 | CH3OH | - | Low power UV-LEDs | ≥420 | 10 | - |
| 23 | [103] | 2006 | NiO/NaTaO3: La | - | 2.56 | - | ~4.1 | - | - | High pressure Hg lamp | - | 16 | - |
| 24 | 0.2 | 2180 | - | ||||||||||
| 25 | [107] | 2012 | MoO3/CdS | ~9 | 0.5 | 25.82 | 2.65 | Na2SO3 /Na2S | - | Xe Lamp | >420 | 2100 | 28.86 α |
| 26 | [108] | 2014 | TiS2/CdS | 42 | 0.05 | 48.2 | - | Benzyl alcohol/ CH3COOH | - | >399 | 742 | - | |
| 27 | TaS2/CdS | 20.8 | 1758 | ||||||||||
| 28 | [109] | 2021 | CuNi@C=O/g-C3N4 | 8 | 0.2 | - | - | TEOA | - | 340–780 | 47.2 | 21.51 α | |
| 10.22 α | |||||||||||||
| 29 | [110] | 2011 | Fe/Al2O3- MCM-41 | 5 | 2 | 834 | 1.9 | CH3OH | - | High pressure Hg lamp | ≥400 | 146 | 6.1 α |
| 30 | [112] | 2012 | In2O3/Ta2O5 | 5 | 1.5 | - | ~2.75 | - | Xe Lamp | 320< λ <780 | 78 | - |
References
- Dincer, I.; Acar, C. Smart energy solutions with hydrogen options. Int. J. Hydrog. Energy 2018, 43, 8579–8599. [Google Scholar] [CrossRef]
- Acar, C.; Dincer, I. Energy and exergy analyses of a novel photoelectrochemical hydrogen production system. Int. J. Hydrog. Energy 2017, 42, 30550–30558. [Google Scholar] [CrossRef]
- Watts, N.; Adger, W.N.; Agnolucci, P.; Blackstock, J.; Byass, P.; Cai, W.; Chaytor, S.; Colbourn, T.; Collins, M.; Cooper, A.; et al. Health and climate change: Policy responses to protect public health. Lancet Comm. 2015, 386, 1861–1914. [Google Scholar] [CrossRef]
- Reza Gholipour, M.; Dinh, C.T.; Beland, F.; Do, T.O. Nanocomposite heterojunctions as sunlight-driven photocatalysts for hydrogen production from water splitting. Nanoscale 2015, 7, 8187–8208. [Google Scholar] [CrossRef]
- Haines, A.; Kovats, R.S.; Campbell-lendrum, D.; Corvalan, C. Climate change and human health: Impacts, vulnerability and public health. Public Health 2006, 120, 585–596. [Google Scholar] [CrossRef]
- Escobedo, S. Photocatalytic Water Splitting using a Modified Pt- TiO2. Kinetic Modeling and Hydrogen Production Efficiency. Ph.D. Thesis, The University of Western Ontario, London, ON, Canada, 2013. [Google Scholar]
- Kayfeci, M.; Kecebas, A.; Bayat, M. Hydrogen production. In Solar Hydrogen Production: Processes, Systems and Technologies; Academic Press: Cambridge, MA, USA, 2019; pp. 45–83. ISBN 9780128148532. [Google Scholar]
- Mazloomi, K.; Gomes, C. Hydrogen as an energy carrier: Prospects and challenges. Renew. Sustain. Energy Rev. 2012, 16, 3024–3033. [Google Scholar] [CrossRef]
- Guo, S.; Li, X.; Li, J.; Wei, B. Boosting photocatalytic hydrogen production from water by photothermally induced biphase systems. Nat. Commun. 2021, 12, 1343. [Google Scholar] [CrossRef]
- Nikolaidis, P.; Poullikkas, A. A comparative overview of hydrogen production processes. Renew. Sustain. Energy Rev. 2017, 67, 597–611. [Google Scholar] [CrossRef]
- Lee, D.H.; Hung, C.P. Toward a clean energy economy: With discussion on role of hydrogen sectors. Int. J. Hydrog. Energy 2012, 37, 15753–15765. [Google Scholar] [CrossRef]
- Rafal, Ł.; Holowacz, I.; Kucharska, K.; Glinka, M.; Rybarczyk, P.; Przyjazny, A.; Kaminski, M. Hydrogen production from biomass using dark fermentation. Renew. Sustain. Energy Rev. 2018, 91, 665–694. [Google Scholar] [CrossRef]
- The 4th Generation|Life Cycle Emissions of Hydrogen. Available online: https://4thgeneration.energy/life-cycles-emissions-of-hydrogen/ (accessed on 12 May 2021).
- Muradov, N.Z.; Veziroǧlu, T.N. “Green” path from fossil-based to hydrogen economy: An overview of carbon-neutral technologies. Int. J. Hydrog. Energy 2008, 33, 6804–6839. [Google Scholar] [CrossRef]
- Solar Panel Splits Water to Produce Hydrogen—IEEE Spectrum. Available online: https://spectrum.ieee.org/energywise/green-tech/fuel-cells/solar-panel-prototype-splits-water-to-produce-hydrogen (accessed on 12 May 2021).
- Producing Green Hydrogen through the Exposure of Nanomaterials to Sunlight|INRS. Available online: https://inrs.ca/en/news/producing-green-hydrogen-through-the-exposure-of-nanomaterials-to-sunlight (accessed on 12 May 2021).
- Torres-martínez, L.M.; Gómez, R.; Vázquez-cuchillo, O.; Juárez-ramírez, I. Enhanced photocatalytic water splitting hydrogen production on RuO2/La:NaTaO3 prepared by sol—Gel method. Catal. Commun. 2010, 12, 268–272. [Google Scholar] [CrossRef]
- Rawool, S.A.; Pai, M.R.; Banerjee, A.M.; Bapat, R.D.; Nayak, C.; Tripathi, A.K. Lab scale optimization of various factors for photocatalytic hydrogen generation over low cost Cu 0.02 Ti 0.98 O2-S photocatalyst under UV/Visible irradiation and sunlight. Int. J. Hydrog. Energy 2018, 43, 1271–1284. [Google Scholar] [CrossRef]
- Vamathevan, V.; Amal, R.; Beydoun, D.; Low, G.; McEvoy, S. Silver metallisation of titania particles: Effects on photoactivity for the oxidation of organics. Chem. Eng. J. 2004, 98, 127–139. [Google Scholar] [CrossRef]
- Dupont, V. Steam Reforming of Sunflower Oil for Hydrogen Gas Production. Helia 2007, 30, 103–132. [Google Scholar] [CrossRef]
- Fujishima, A.; Honda, K. Electrochemical Photolysis of Water at a Semiconductor Electrode. Nature 1972, 238, 37–38. [Google Scholar] [CrossRef] [PubMed]
- Licht, S. Multiple Band Gap Semiconductor/Electrolyte Solar Energy Conversion. J. Phys. Chem. B 2001, 105, 6281–6294. [Google Scholar] [CrossRef]
- Rusinque, B. Hydrogen Production by Photocatalytic Water Splitting Under Near-UV and Visible Light Using Doped Pt and Pd TiO2. Master’s Thesis, The University of Western Ontario, London, ON, Canada, 2018. [Google Scholar]
- Leung, D.Y.C.; Fu, X.; Wang, C.; Ni, M.; Leung, M.K.H.; Wang, X.; Xianzhi, F. Hydrogen Production over Titania-Based Photocatalysts. ChemSusChem 2010, 350002, 681–694. [Google Scholar] [CrossRef]
- Ray, A.K. A new photocatalytic reactor for destruction of toxic water pollutants by advanced oxidation process. Catal. Today 1998, 44, 357–368. [Google Scholar] [CrossRef]
- Akach, J.; Ochieng, A. Monte Carlo simulation of the light distribution in an annular slurry bubble column photocatalytic reactor. Chem. Eng. Res. Des. 2017, 129, 248–258. [Google Scholar] [CrossRef]
- Guayaquil-Sosa, J.F.; Serrano-Rosales, B.; Valadés-Pelayo, P.J.; de Lasa, H. Photocatalytic hydrogen production using mesoporous TiO2 doped with Pt. Appl. Catal. B Environ. 2017, 211, 337–348. [Google Scholar] [CrossRef]
- Sirivallop, A.; Escobedo, S.; Areerob, T.; de Lasa, H.; Chiarakorn, S. Photocatalytic Conversion of Organic Pollutants in Air: Quantum Yields Using a Silver/Nitrogen/TiO2 Mesoporous Semiconductor under Visible Light. Catalysts 2021, 11, 529. [Google Scholar] [CrossRef]
- Yang, J.; Yan, H.; Wang, X.; Wen, F.; Wang, Z.; Fan, D.; Shi, J. Roles of cocatalysts in Pt–PdS/CdS with exceptionally high quantum efficiency for photocatalytic hydrogen production. J. Catal. 2012, 290, 151–157. [Google Scholar] [CrossRef]
- Chen, H.; Matsumoto, A.; Nishimiya, N.; Tsutsumi, K. Preparation and characterization of TiO2 incorporated Y-zeolite. Colloids Surfaces A Physicochem. Eng. Asp. 1999, 157, 295–305. [Google Scholar] [CrossRef]
- Rusinque, B. Hydrogen Production Via Photocatalytic Water Splitting Under Near-UV and Visible Light Using Doped Pd TiO2. Ph.D. Thesis, The University of Western Ontario, London, ON, Canada, 2021. [Google Scholar]
- Dubey, N.; Rayalu, S.; Labhsetwar, N.; Devotta, S. Visible light active zeolite-based photocatalysts for hydrogen evolution from water. Int. J. Hydrog. Energy 2008, 33, 5958–5966. [Google Scholar] [CrossRef]
- Sreethawong, T.; Junbua, C.; Chavadej, S. Photocatalytic H2 production from water splitting under visible light irradiation using Eosin Y-sensitized mesoporous-assembled Pt/TiO2 nanocrystal photocatalyst. J. Power Sources 2009, 190, 513–524. [Google Scholar] [CrossRef]
- Kim, S.; Hwang, S.-J.; Choi, W. Visible light active platinum-ion-doped TiO2 photocatalyst. J. Phys. Chem. B 2005, 109, 24260–24267. [Google Scholar] [CrossRef] [PubMed]
- Lin, C.; Lee, C.; Chao, J.; Kuo, C.; Cheng, Y.; Huang, W.; Chang, H.; Huang, Y. Photocatalytic generation of H2 gas from neat ethanol over Pt/TiO2 nanotube catalysts. Catal. Lett. 2004, 98, 61–66. [Google Scholar] [CrossRef]
- Bahruji, H.; Bowker, M.; Davies, P.R.; Morgan, D.J.; Morton, C.A.; Egerton, T.A.; Kennedy, J.; Jones, W. Rutile TiO2—Pd Photocatalysts for Hydrogen Gas Production from Methanol Reforming. Top. Catal. 2015, 70–76. [Google Scholar] [CrossRef]
- Yu, J.; Hai, Y.; Jaroniec, M. Photocatalytic hydrogen production over CuO-modified titania. J. Colloid Interface Sci. 2011, 357, 223–228. [Google Scholar] [CrossRef]
- Choudhury, B.; Choudhury, A. Luminescence characteristics of cobalt doped TiO2 nanoparticles. J. Lumin. 2012, 132, 178–184. [Google Scholar] [CrossRef]
- Escobedo, S.; Rusinque, B.; de Lasa, H. Photochemical Thermodynamic Efficiency Factors (PTEFs) for Hydrogen Production Using Different TiO2 Photocatalysts. Ind. Eng. Chem. Res. 2019, 58, 22225. [Google Scholar] [CrossRef]
- Ning, X.; Lu, G. Photocorrosion inhibition of CdS-based catalysts for photocatalytic overall water splitting. Nanoscale 2020, 12, 1213–1223. [Google Scholar] [CrossRef] [PubMed]
- Ilie, M.; Cojocaru, B.; Parvulescu, V.I.; Garcia, H. Improving TiO2 activity in photo-production of hydrogen from sugar industry wastewaters. Int. J. Hydrog. Energy 2011, 36, 15509–15518. [Google Scholar] [CrossRef]
- Draz, M.A.; El-maghrabi, H.H.; Soliman, F.S.; Selim, H. Large scale hybrid magnetic ZnFe2O4/TiO2 nanocomposite with highly photocatalytic activity for water splitting. J. Nanoparticle Res. 2021, 23, 10. [Google Scholar] [CrossRef]
- Castañeda, C.; Tzompantzi, F.; Rodríguez-Rodríguez, A.; Sánchez-dominguez, M.; Gómez, R. Improved photocatalytic hydrogen production from methanol/water solution using CuO supported on fluorinated TiO2. J. Chem. Technol. Biotechnol. 2018, 93, 1113–1120. [Google Scholar] [CrossRef]
- Wysmulek, K.; Sar, J.; Osewski, P.; Orlinski, K.; Kolodziejak, K.; Trenczek-zajac, A.; Radecka, M.; Pawlak, D.A. A SrTiO3 -TiO2 eutectic composite as a stable photoanode material for photoelectrochemical hydrogen production. Appl. Catal. B Environ. 2017, 206, 538–546. [Google Scholar] [CrossRef]
- Fan, W.; Zhang, Q.; Wang, Y. Semiconductor-based nanocomposites for photocatalytic H2 production and CO2 conversion. Phys. Chem. Chem. Phys. 2013, 2632–2649. [Google Scholar] [CrossRef] [PubMed]
- Reisner, E.; Powell, D.J.; Cavazza, C.; Fontecilla-camps, J.C.; Armstrong, F.A. Visible Light-Driven H2 Production by Hydrogenases Attached to Dye-Sensitized TiO2 Nanoparticles. JACS 2009, 131, 18457–18466. [Google Scholar] [CrossRef] [PubMed]
- Willkomm, J.; Orchard, K.L.; Reynal, A.; Pastor, E.; Durrant, J.R.; Reisner, E. Chem Soc Rev Dye-sensitised semiconductors modified with molecular catalysts for light-driven H2 production. Chem. Soc. Rev. 2016, 45, 9–23. [Google Scholar] [CrossRef] [Green Version]
- Ranwaha, T.; Elegbeleye, I.; Maluta, N.; Maphanga, R. Optical and electronic properties of croconates dye molecules adsorbed on TiO2 brookite nanocluster for dye sensitized solar cells application. Mater. Express 2020, 10, 1917–1924. [Google Scholar] [CrossRef]
- Barrios, C.E.; Albiter, E.; Gracia y Jimenez, J.M.; Tiznado, H.; Romo-Herrera, J.; Zanella, R. Photocatalytic hydrogen production over titania modified by gold – Metal (palladium, nickel and cobalt) catalysts. Int. J. Hydrog. Energy 2016, 41, 23287–23300. [Google Scholar] [CrossRef]
- Caudillo-Flores, U.; Muñoz-Batista, M.J.; Cortés, J.A.; Fernández-García, M.; Kubacka, A. UV and visible light driven H2 photo-production using Nb-doped TiO2: Comparing Pt and Pd co-catalysts. Mol. Catal. 2017, 437, 1–10. [Google Scholar] [CrossRef]
- Navarro, R.M.; Arenales, J.; Vaquero, F.; González, I.D.; Fierro, J.L.G. The effect of Pt characteristics on the photoactivity of Pt/TiO2 for hydrogen production from ethanol. Catal. Today 2013, 210, 33–38. [Google Scholar] [CrossRef]
- Strataki, N.; Bekiari, V.; Kondarides, D.I.; Lianos, P. Hydrogen production by photocatalytic alcohol reforming employing highly efficient nanocrystalline titania films. Appl. Catal. B Environ. 2007, 77, 184–189. [Google Scholar] [CrossRef]
- Asal, S.; Saif, M.; Hafez, H.; Mozia, S.; Heciak, a.; Moszyński, D.; Abdel-Mottaleb, M.S.A. Photocatalytic generation of useful hydrocarbons and hydrogen from acetic acid in the presence of lanthanide modified TiO2. Int. J. Hydrog. Energy 2011, 36, 6529–6537. [Google Scholar] [CrossRef]
- Min, S.; Lu, G. Dye-cosensitized graphene/Pt photocatalyst for high efficient visible light hydrogen evolution. Int. J. Hydrog. Energy 2012, 37, 10564–10574. [Google Scholar] [CrossRef]
- Srta, N.O.; Adhikari, S.P.; Hood, Z.D.; Wang, H.; Peng, R.; Krall, A.; Li, H.; Chen, V.W.; More, K.L.; Wu, Z.; et al. Environmental Enhanced visible light photocatalytic water reduction from a g-C3N4/SrTa2O6 heterojunction. Appl. Catal. B Environ. 2017, 217, 448–458. [Google Scholar] [CrossRef]
- Lin, B.; An, H.; Yan, X.; Zhang, T.; Wei, J.; Yang, G. Environmental Fish-scale structured g-C3N4 nanosheet with unusual spatial electron transfer property for high-efficiency photocatalytic hydrogen evolution. Appl. Catal. B Environ. 2017, 210, 173–183. [Google Scholar] [CrossRef]
- Cai, X.; Zhang, J.; Fujitsuka, M.; Majima, T. Environmental layered composites as efficient visible-light-driven photocatalyst. Appl. Catal. B Environ. 2017, 202, 191–198. [Google Scholar] [CrossRef] [Green Version]
- Kudo, A.; Miseki, Y. Heterogeneous photocatalyst materials for water splitting. Chem. Soc. Rev. 2009, 38, 253–278. [Google Scholar] [CrossRef] [PubMed]
- Schneider, J.; Bahnemann, D.W. Undesired Role of Sacri fi cial Reagents in Photocatalysis. J. Phys. Chem. Lett. 2013, 4, 3479–3483. [Google Scholar] [CrossRef]
- Wang, M.; Shen, S.; Li, L.; Tang, Z.; Yang, J. Effects of sacrificial reagents on photocatalytic hydrogen evolution over different photocatalysts. J. Mater. Sci. 2017, 52, 5155–5164. [Google Scholar] [CrossRef]
- Alkaim, A.F.; Kandiel, T.A.; Dillert, R.; Bahnemann, D.W. Photocatalytic hydrogen production from biomass-derived compounds: A case study of citric acid. Environ. Technol. 2016, 37, 2687–2693. [Google Scholar] [CrossRef] [PubMed]
- Speltini, A.; Sturini, M.; Maraschi, F.; Dondi, D.; Fisogni, G.; Annovazzi, E.; Profumo, A.; Buttafava, A. ScienceDirect Evaluation of UV-A and solar light photocatalytic hydrogen gas evolution from olive mill wastewater. Int. J. Hydrog. Energy 2015, 40, 4303–4310. [Google Scholar] [CrossRef]
- Villa, K.; Domenec, X.; Malato, S.; Maldonado, M.I.; Peral, J. Heterogeneous photocatalytic hydrogen generation in a solar pilot plant. Int. J. Hydrog. Energy 2013, 8, 12718–12724. [Google Scholar] [CrossRef]
- Sakata, T.; Kawai, T. Heterogeneous photocatalytic production of hydrogen and methane from ethanol and water. Chem. Phys. Lett. 1981, 80, 341–344. [Google Scholar] [CrossRef]
- Escobedo, S.; Serrano, B.; de Lasa, H. Quantum yield with platinum modified TiO2 photocatalyst for hydrogen production. Appl. Catal. B Environ. 2013, 140, 523–536. [Google Scholar] [CrossRef]
- Rusinque, B.; Escobedo, S.; de Lasa, H. Photocatalytic Hydrogen Production Under Near-UV Using Pd-Doped Mesoporous TiO2 and Ethanol as Organic Scavenger. Catalysts 2019, 19, 33. [Google Scholar] [CrossRef] [Green Version]
- Salaices, M.; Serrano, B.; de Lasa, H. Photocatalytic Conversion of Organic Pollutants Extinction Coefficients and Quantum Efficiencies. Ind. Eng. Chem. Res. 2001, 40, 5455–5464. [Google Scholar] [CrossRef]
- Salaices, M.; Serrano, B.; de Lasa, H. Experimental evaluation of photon absorption in an aqueous TiO2 slurry reactor. Chem. Eng. J. 2002, 90, 219–229. [Google Scholar] [CrossRef]
- Moreira, J.; Serrano, B.; Ortiz, A.; de Lasa, H. Evaluation of Photon Absorption in an Aqueous TiO2 Slurry Reactor Using Monte Carlo Simulations and Macroscopic Balance. Ind. Eng. Chem. Res. 2010, 49, 10524–10534. [Google Scholar] [CrossRef]
- Serrano, B.; Ortíz, A.; Moreira, J.; de Lasa, H. Photocatalytic Thermodynamic Efficiency Factors. Practical Limits in Photocatalytic Reactors. Ind. Eng. Chem. Res. 2010, 49, 6824–6833. [Google Scholar] [CrossRef]
- De Lasa, H.; Serrano, B.; Salaices, M. Photocatalytic Reaction Engineering, 1st ed.; Springer: Berlin/Heidelberg, Germany, 2005; ISBN 978-0-387-27591-8. [Google Scholar]
- Serrano, B.; Ortíz, A.; Moreira, J.; de Lasa, H. Energy efficiency in photocatalytic reactors for the full span of reaction times. Ind. Eng. Chem. Res. 2009, 48, 9864–9876. [Google Scholar] [CrossRef]
- Hernandez, J.M.G.; Rosales, B.S.; de Lasa, H. The photochemical thermodynamic efficiency factor (PTEF) in photocatalytic reactors for air treatment. Chem. Eng. J. 2010, 165, 891–901. [Google Scholar] [CrossRef]
- Lugo-Vega, C.S.; Serrano-Rosales, B.; de Lasa, H. Energy efficiency limits in Photo-CREC-Air photocatalytic reactors. Chem. Eng. Sci. 2016, 156, 77–88. [Google Scholar] [CrossRef]
- Estahbanati, M.R.K.; Feilizadeh, M.; Iliuta, M.C. Photocatalytic valorization of glycerol to hydrogen: Optimization of operating parameters by artificial neural network. Appl. Catal. B Environ. 2017, 209, 483–492. [Google Scholar] [CrossRef]
- Farsi, A.; Dincer, I.; Naterer, G.F. Multi-objective optimization of an experimental integrated thermochemical cycle of hydrogen production with an artificial neural network. Int. J. Hydrog. Energy 2020, 45, 24355–24369. [Google Scholar] [CrossRef]
- Ren, T.; Wang, L.; Chang, C.; Li, X. Machine learning-assisted multiphysics coupling performance optimization in a photocatalytic hydrogen production system. Energy Convers. Manag. 2020, 216, 112935. [Google Scholar] [CrossRef]
- Nurul, M.; Podder, J.; Saadat, K.; Sagadevan, S. Band gap tuning of p-type al-doped TiO2 thin films for gas sensing applications. Thin Solid Film. 2020, 714, 138382. [Google Scholar] [CrossRef]
- Moctezuma, E.; Leyva, E.; Aguilar, C.A.; Luna, R.A.; Montalvo, C. Photocatalytic degradation of paracetamol: Intermediates and total reaction mechanism. J. Hazard. Mater. 2012, 243, 130–138. [Google Scholar] [CrossRef] [PubMed]
- Kiyama, M.; Akita, T.; Tsutsumi, Y.; Takada, T. Formation of Titanic Oxides of Anatase, Brookite, and Rutiles Types by Aerial Oxidation of Titanous Solutions. Chem. Lett. 1972, 1, 21–24. [Google Scholar] [CrossRef]
- Freyria, F.S.; Blangetti, N.; Esposito, S.; Nasi, R. Effects of the Brookite Phase on the Properties of Different Nanostructured TiO2 Phases Photocatalytically Active Towards the Degradation of N-Phenylurea. Chem. Open 2020, 9, 903–912. [Google Scholar] [CrossRef]
- Zu, M.; Zhou, X.; Zhang, S.; Qian, S.; Li, D. Sustainable engineering of TiO2 -based advanced oxidation technologies: From photocatalyst to application devices. J. Mater. Sci. Technol. 2021, 78, 202–222. [Google Scholar] [CrossRef]
- Li, R.; Hu, B.; Yu, T.; Shao, Z.; Wang, Y.; Song, S. New TiO2-Based Oxide for Catalyzing Alkaline Hydrogen Evolution Reaction with Noble Metal-Like Performance. Small Methods 2021, 5, 2100246. [Google Scholar] [CrossRef]
- Sescu, A.M.; Favier, L.; Lutic, D.; Soto-donoso, N.; Ciobanu, G.; Harja, M. TiO2 Doped with Noble Metals as an Efficient Solution for the Photodegradation of Hazardous Organic Water Pollutants at Ambient Conditions. Water 2021, 13, 19. [Google Scholar] [CrossRef]
- Bellamkonda, S.; Thangavel, N.; Yusuf, H.; Neppolian, B. Highly active and stable multi-walled carbon nanotubes-graphene-TiO2 nanohybrid: An e ffiicient non-noble metal photocatalyst for water splitting. Catal. Today 2019, 321–322, 120–127. [Google Scholar] [CrossRef]
- Mishra, A.; Mehta, A.; Kainth, S.; Basu, S. A comparative study on the effect of different precursors for synthesis and efficient photocatalytic activity of g-C3N4/TiO2/bentonite nanocomposites. J. Mater. Sci. 2018, 53, 13126–13142. [Google Scholar] [CrossRef]
- Kapilashrami, M.; Zhang, Y.; Liu, Y.; Hagfeldt, A.; Guo, J. Probing the Optical Property and Electronic Structure of TiO2 Nanomaterials for Renewable Energy Applications. Chem. Rev. 2014, 114, 9662–9707. [Google Scholar] [CrossRef]
- Rusinque, B.; Escobedo, S.; de Lasa, H. Photoreduction of a Pd-Doped Mesoporous TiO2 Photocatalyst for Hydrogen Production under Visible Light. Catalysts 2020, 74, 74. [Google Scholar] [CrossRef] [Green Version]
- Mehta, A.; Sharma, M.; Kumar, A.; Basu, S. Effect of Au content on the enhanced photocatalytic efficiency of mesoporous Au/TiO2 nanocomposites in UV and sunlight. Gold Bull. 2017, 50, 33–41. [Google Scholar] [CrossRef]
- Tio, S.; Montoya, A.T.; Gillan, E.G. Enhanced Photocatalytic Hydrogen Evolution from Transition-Metal Surface-Modi fi ed TiO2. ACS Omega 2018, 3, 2947–2955. [Google Scholar] [CrossRef] [Green Version]
- Bahruji, H.; Bowker, M.; Brookes, C.; Davies, P.R.; Wawata, I. The adsorption and reaction of alcohols on TiO2 and Pd/TiO2 catalysts. Appl. Catal. A Gen. 2013, 454, 66–73. [Google Scholar] [CrossRef]
- Rather, R.A.; Singh, S.; Pal, B. A Cu+1/Cu0-TiO2 mesoporous nanocomposite exhibits improved H2 production from H2O under direct solar irradiation. J. Catal. 2017, 346, 1–9. [Google Scholar] [CrossRef]
- Choi, H.J.; Kang, M. Hydrogen production from methanol/water decomposition in a liquid photosystem using the anatase structure of Cu loaded TiO2. Int. J. Hydrog. Energy 2007, 32, 3841–3848. [Google Scholar] [CrossRef]
- Ruban, P.; Sellappa, K. Development and performance of bench-scale reactor for the photocatalytic generation of hydrogen. Energy 2014, 73, 926–932. [Google Scholar] [CrossRef]
- Rivero, M.J.; Iglesias, O.; Ribao, P.; Ortiz, I. Kinetic performance of TiO2/Pt/reduced graphene oxide composites in the photocatalytic hydrogen production. Int. J. Hydrog. Energy 2018, 44, 101–109. [Google Scholar] [CrossRef]
- Liu, R.; Yoshida, H.; Fujita, S.; Arai, M. Environmental Photocatalytic hydrogen production from glycerol and water with NiOx/TiO2 catalysts. Appl. Catal. B Environ. 2014, 144, 41–45. [Google Scholar] [CrossRef]
- Fujita, S.; Kawamori, H.; Honda, D.; Yoshida, H.; Arai, M. Environmental Photocatalytic hydrogen production from aqueous glycerol solution using NiO/TiO2 catalysts: Effects of preparation and reaction conditions. Appl. Catal. B Environ. 2016, 181, 818–824. [Google Scholar] [CrossRef]
- Sadanandam, G.; Lalitha, K.; Durga, V. Cobalt doped TiO2: A stable and efficient photocatalyst for continuous hydrogen production from glycerol: Water mixtures under solar light irradiation. Int. J. Hydrog. Energy 2013, 38, 9655–9664. [Google Scholar] [CrossRef]
- Li, Y.; Jin, Z.; Zhang, L.; Fan, K. Controllable design of Zn-Ni-P on g-C3N4 for efficient photocatalytic hydrogen production. Chin. J. Catal. 2019, 40, 390–402. [Google Scholar] [CrossRef]
- Singla, S.; Sharma, S.; Basu, S.; Shetti, N.P.; Raghava, K. Graphene/graphitic carbon nitride-based ternary nanohybrids: Synthesis methods, properties, and applications for photocatalytic hydrogen production. FlatChem 2020, 24, 100200. [Google Scholar] [CrossRef]
- Xiong, J.; Li, X.; Huang, J.; Gao, X.; Chen, Z.; Liu, J.; Li, H.; Kang, B.; Yao, W.; Zhu, Y. CN/rGO@BPQDs high-low junctions with stretching spatial charge separation ability for photocatalytic degradation and H2O2 production. Appl. Catal. B Environ. 2020, 266, 118602. [Google Scholar] [CrossRef]
- Cheng, L.; Xiang, Q.; Liao, Y. CdS-Based Photocatalysts. Energy Environ. Sci. 2018, 11, 1362–1391. [Google Scholar] [CrossRef]
- Kudo, A. Development of photocatalyst materials for water splitting. Int. J. Hydrog. Energy 2006, 31, 197–202. [Google Scholar] [CrossRef]
- Jing, X.; Lu, N.; Huang, J.; Zhang, P.; Zhang, Z. One-step hydrothermal synthesis of S-defect-controlled ZnIn2S4 microflowers with improved kinetics process of charge-carriers for photocatalytic H2 evolution. J. Energy Chem. 2021, 58, 397–407. [Google Scholar] [CrossRef]
- Katsumata, H.; Tachi, Y.; Suzuki, T.; Kaneco, S. Z-scheme photocatalytic hydrogen production over WO3/g-C3N4 composite photocatalysts. RSC Adv. 2014, 21405–21409. [Google Scholar] [CrossRef]
- Jiang, D.; Chen, L.; Xie, J.; Chen, M. Ag2S/g-C3N4 composite photocatalysts for efficient Pt-free hydrogen production. The co-catalyst function of Ag/Ag2S formed by simultaneous photodeposition. Dalt. Trans. 2014, 43, 4878–4885. [Google Scholar] [CrossRef]
- Shen, Z.; Chen, G.; Yu, Y.; Wang, Q.; Zhou, C.; Hao, L.; Li, Y.; Heb, L.; Mu, R. Sonochemistry synthesis of nanocrystals embedded in a MoO3–CdS core–shell photocatalyst with enhanced hydrogen production and photodegradation. J. Mater. Sci. 2012, 19646–19651. [Google Scholar] [CrossRef]
- Gupta, U.; Rao, B.G.; Maitra, U.; Prasad, B.E.; Rao, C.N.R. Visible-Light-Induced Generation of H2 by Nanocomposites of Few-Layer. Chem. Asian J. 2014, 1311–1315. [Google Scholar] [CrossRef]
- Chen, S.; Liao, J.; Zhou, Z.; Yang, S.; Gao, Q.; Cai, X.; Peng, F.; Fang, Y.; Zhang, S. Boosting photocatalytic hydrogen evolution using a noble-metal-free co-catalyst: CuNi@C with oxygen-containing functional groups. Appl. Catal. B Environ. 2021, 291, 120139. [Google Scholar] [CrossRef]
- Pradhan, A.C.; Martha, S.; Mahanta, S.K.; Parida, K.M. Mesoporous nanocomposite Fe/Al2O3 -MCM-41: An efficient photocatalyst for hydrogen production under visible light. Int. J. Hydrog. Energy 2011, 36, 12753–12760. [Google Scholar] [CrossRef]
- Trens, P.; Russell, M.L.; Spjuth, L.; Hudson, M.J.; Liljenzin, J.; Normale, Ä.; Cedex, M. Preparation of Malonamide-MCM-41 Materials for the Heterogeneous Extraction of Radionuclides. Ind. Eng. Chem. Res. 2002, 5220–5225. [Google Scholar] [CrossRef]
- Leilei, X.U.; Lei, N.I.; Weidong, S.H.I.; Jianguo, G. Photocatalytic Activity for Hydrogen Evolution over Well-Dispersed Heterostructured In2O3/Ta2O 5 Composites. Chin. J. Catal. 2012, 33, 1101–1108. [Google Scholar] [CrossRef]
- Escobedo, S.; de Lasa, H. Photocatalysis for Air Treatment Processes: Current Technologies and Future Applications for the Removal of Organic Pollutants and Viruses. Catalysts 2020, 10, 966. [Google Scholar] [CrossRef]
- Kumaravel, V.; Imam, M.D.; Badreldin, A.; Chava, R.K.; Do, J.Y.; Kang, M.; Abdel-Wahab, A. Photocatalytic hydrogen production: Role of sacrificial reagents on the activity of oxide, carbon, and sulfide catalysts. Catalysts 2019, 9, 276. [Google Scholar] [CrossRef] [Green Version]
- Imoberdorf, G.E.; Cassano, A.E.; Irazoqui, H.A.; Alfano, O.M. Optimal design and modeling of annular photocatalytic wall reactors. Catal. Today 2007, 129, 118–126. [Google Scholar] [CrossRef]
- Lugo-Vega, C.S.; Moreira, J.; Serrano-Rosales, B.; de Lasa, H. Kinetics of the pollutant photocatalytic conversion in a Photo-CREC-Air Reactor. Chem. Eng. J. 2017, 317, 1069–1082. [Google Scholar] [CrossRef]
- Lugo-Vega, C.S.; Serrano-Rosales, B.; de Lasa, H. Immobilized particle coating for optimum photon and TiO2 utilization in scaled air treatment photo reactors. Appl. Catal. B Environ. 2016, 198, 211–223. [Google Scholar] [CrossRef]
- Imoberdorf, G.E.; Irazoqui, H.A.; Cassano, A.E.; Alfano, O.M. Photocatalytic Degradation of Tetrachloroethylene in Gas Phase on TiO2 Films: A Kinetic Study. Ind. Eng. Chem. Res. 2005, 44, 6075–6085. [Google Scholar] [CrossRef]
- Héquet, V.; Batault, F.; Raillard, C.; Thévenet, F.; Le Coq, L.; Dumont, É. Determination of the clean air delivery rate (CADR) of photocatalytic oxidation (PCO) purifiers for indoor air pollutants using a closed-loop reactor. Part II: Experimental results. Molecules 2017, 22, 408. [Google Scholar] [CrossRef] [Green Version]
- Xu, T.; Zheng, H.; Zhang, P. Performance of an innovative VUV-PCO purifier with nanoporous TiO2 film for simultaneous elimination of VOCs and by-product ozone in indoor air. Build. Environ. 2018, 142, 379–387. [Google Scholar] [CrossRef]
- Debono, O.; Thévenet, F.; Gravejat, P.; Héquet, V.; Raillard, C.; Le Coq, L.; Locoge, N. Gas phase photocatalytic oxidation of decane at ppb levels: Removal kinetics, reaction intermediates and carbon mass balance. J. Photochem. Photobiol. A Chem. 2013, 258, 17–29. [Google Scholar] [CrossRef]
- Sirivallop, A.; Areerob, T.; Chiarakorn, S. Enhanced Visible Light Photocatalytic Activity of N and Ag Doped and Co-Doped TiO2 Synthesized by Using an In-Sity Solvothermal Method for Gas Phase Ammonia Removal. Catalysts 2020, 10, 251. [Google Scholar] [CrossRef] [Green Version]
- Zhong, L.; Haghighat, F.; Lee, C.S.; Lakdawala, N. Performance of ultraviolet photocatalytic oxidation for indoor air applications: Systematic experimental evaluation. J. Hazard. Mater. 2013, 261, 130–138. [Google Scholar] [CrossRef] [PubMed]
- Dong, F.; Wang, Z.; Li, Y.; Ho, W.K.; Lee, S.C. Immobilization of polymeric g-C3N4 on structured ceramic foam for efficient visible light photocatalytic air purification with real indoor illumination. Environ. Sci. Technol. 2014, 48, 10345–10353. [Google Scholar] [CrossRef] [PubMed]
- Esterkin, C.R.; Negro, A.C.; Alfano, O.M.; Cassano, A.E. Air pollution remediation in a fixed bed photocatalytic reactor coated with TiO2. AIChE J. 2003, 51, 2298–2310. [Google Scholar] [CrossRef]
- Rusinque, B.; Escobedo, S.; de Lasa, H. Hydrogen Production via Pd-TiO2 Photocatalytic Water Splitting under Near-UV and Visible Light: Analysis of the Reaction Mechanism. Catalysts 2021, 11, 405. [Google Scholar] [CrossRef]
- Lugo-Vega, C.S. Evaluation of VOC Degradation in Photo- Catalytic Air Reactors: TiO2 Immobilization, Energy Efficiency and Kinetic Modeling. Ph.D. Thesis, The University of Western Ontario, London, ON, Canada, 2016. [Google Scholar]
- Dey, G.R.; Pushpa, K.K. Methane generated during photocatalytic redox reaction of alcohols on TiO2 suspension in aqueous solutions. Res. Chem. Intermed. 2006, 32, 725–736. [Google Scholar] [CrossRef]
- Escobedo, S.; Serrano, B.; Calzada, A.; Moreira, J.; de Lasa, H. Hydrogen production using a platinum modified TiO2 photocatalyst and an organic scavenger. Kinetic modeling. Fuel 2016, 181, 438–449. [Google Scholar] [CrossRef]
- Guayaquil, J.F.; Escobedo, S.; Calzada, A.; Serrano, B.; de Lasa, H. Hydrogen Production via Water Dissociation Using Pt–TiO2 Photocatalysts: An Oxidation–Reduction Network. Catalysts 2017, 7, 324. [Google Scholar] [CrossRef] [Green Version]
- Panagiotopoulou, P.; Karamerou, E.E.; Kondarides, D.I. Kinetics and mechanism of glycerol photo-oxidation and photo-reforming reactions in aqueous TiO2 and Pt/ TiO2 suspensions. Catal. Today 2013, 209, 91–98. [Google Scholar] [CrossRef]
- Besov, A.S.; Vorontsov, A.V.; Parmon, V.N. Fast adsorptive and photocatalytic purification of air from acetone and dimethyl methylphosphonate by TiO2 aerosol. Appl. Catal. B Environ. 2009, 89, 602–612. [Google Scholar] [CrossRef]
- Boulamanti, A.K.; Philippopoulos, C.J. Photocatalytic degradation of C5-C7 alkanes in the gas-phase. Atmos. Environ. 2009, 43, 3168–3174. [Google Scholar] [CrossRef]
- Weibel, a.; Bouchet, R.; Knauth, P. Electrical properties and defect chemistry of anatase (TiO2). Solid State Ionics 2006, 177, 229–236. [Google Scholar] [CrossRef] [Green Version]
- Sauer, L.M.; Ollis, F.D. Acetone Oxidation in Photocatalytic Monolith Reactor. J. Catal. 1994, 149, 81–94. [Google Scholar] [CrossRef]
- Trong On, D.; Desplantier-Giscard, D.; Danumah, C.; Kaliaguine, S. ChemInform Abstract: Perspectives in Catalytic Applications of Mesostructured Materials. ChemInform 2010, 33, 299–357. [Google Scholar] [CrossRef]
- Hoffmann, M.R.; Martin, S.T.; Choi, W.; Bahnemannt, D.W. Environmental Applications of Semiconductor Photocatalysis. Chem. Rev. 1995, 95, 69–96. [Google Scholar] [CrossRef]
- Cassano, A.E.; Martín, C.A.; Brandi, R.J.; Alfano, O.M. Photoreactor Analysis and Design: Fundamentals and Applications. Ind. Eng. Chem. Res. 1995, 34, 2155–2201. [Google Scholar] [CrossRef]
- Davydov, L.; Smirniotis, P.G.; Pratsinis, S.E. Novel differential reactor for the measurement of overall quantum yields. Ind. Eng. Chem. Res. 1999, 38, 1376–1383. [Google Scholar] [CrossRef]
- Yamazaki-Nishida, S.; Nagano, K.; Phillips, L.A.; Cervera-March, S.; Anderson, M.A. Photocatalytic degradation of trichloroethylene in the gas phase using titanium dioxide pelle. J. Photochem. Photobiol. A Chem. 1993, 70, 95–99. [Google Scholar] [CrossRef]
- Ibrahim, H.; de Lasa, H. Novel photocatalytic reactor for the destruction of airborne pollutants reaction kinetics and quantum yields. Ind. Eng. Chem. Res. 1999, 38, 3211–3217. [Google Scholar] [CrossRef]
- Ibrahim, H.; de Lasa, H. Photo-catalytic degradation of air borne pollutants apparent quantum efficiencies in a novel photo-CREC-air reactor. Chem. Eng. Sci. 2003, 58, 943–949. [Google Scholar] [CrossRef]
- Valadés-Pelayo, P.J.; Moreira del Rio, J.; Solano-Flores, P.; Serrano, B.; de Lasa, H. Establishing photon absorption fields in a Photo-CREC Water II Reactor using a CREC-spectroradiometric probe. Chem. Eng. Sci. 2014, 116, 406–417. [Google Scholar] [CrossRef]
- Garcia-Hernandez, J.M.; Serrano-Rosales, B.; de Lasa, H. Energy efficiencies in a photo-CREC-air reactor: Conversion of model organic pollutants in air. Ind. Eng. Chem. Res. 2012, 51, 5715–5727. [Google Scholar] [CrossRef]
- Serrano, B.; de Lasa, H. Photocatalytic Degradation of Water Organic Pollutants. Kinetic. Ind. Eng. Chem. Res. 1997, 36, 4705–4711. [Google Scholar] [CrossRef]
- Masood, H.; Toe, C.Y.; Teoh, W.Y.; Sethu, V.; Amal, R. Machine Learning for Accelerated Discovery of Solar Photocatalysts. ACS Catal. 2019, 11774–11787. [Google Scholar] [CrossRef]
- Eskandarloo, H.; Badiei, A.; Behnajady, M.A. Study of the Effect of Additives on the Photocatalytic Degradation of a Triphenylmethane Dye in the Presence of Immobilized TiO2/NiO Nanoparticles: Artificial Neural Network Modeling. Ind. Eng. Chem. Res. 2014, 53, 6881–6895. [Google Scholar] [CrossRef]
- Ardabili, S.F.; Najafi, B.; Shamshirband, S.; Bidgoli, B.M.; Deo, R.C.; Chau, K. Computational intelligence approach for modeling hydrogen production: A review. Eng. Appl. Comput. Fluid Mech. 2018, 12, 438–458. [Google Scholar] [CrossRef]
- Tabatabai-yazdi, F.; Ebrahimian, A.; Khalil, F.E.; Gilani, N. Construction of graphene based photocatalysts for photocatalytic degradation of organic pollutant and modeling using artificial intelligence techniques. Phys. B Phys. Condens. Matter 2021, 608, 412869–412887. [Google Scholar] [CrossRef]
- Mageed, A.K. Modeling photocatalytic hydrogen production from ethanol over copper oxide nanoparticles: A comparative analysis of various machine learning techniques. Biomass Convers. Biorefinery 2021, 1–9. [Google Scholar] [CrossRef]


| Semiconductor Phase | Crystalline Form | Density (g cm−3) | Wavelength (nm) | Band Gap Energy (eV) |
|---|---|---|---|---|
| Rutile | Tetragonal | 4.27 | 413 | 3.0 |
| Anatase | Tetragonal | 3.90 | 388 | 3.2 |
| Brookite | Orthogonal | 4.13 | 365 | 3.4 |
| Reference | Lamp Type | λ = Wavelength (nm) | Nominal Output Power (W) |
|---|---|---|---|
| [60] | Xe lamp | Λ ≤ 420 or λ ≥ 420 | 300 |
| [114] | Xe arc lamp | Simulated solar light | 300 |
| [103] | High-pressure Hg lamp | - | 400 |
| [27,65,66] | USHIO polychromatic blacklight blue (BLB) | 340 to 410 | 15 |
| [88] | Hg Philips visible light lamp | 300 to 700 | 15 |
| [90] | Hg lamp Ace-Hanovia | - | 450 |
| [93] | Shinan UV-lamp | 365 | 180 |
| [75] | Black-Ray mercury lamp | 340 to 410 | 20 |
| [94] | Philips Sun-lamp | 400 to 700 | 100 |
| [95] | Philips PL-S | 315 to 400 | 9 |
| Ref. | Photocatalyst | Adsorbate | Adsorption Constants | R2 |
|---|---|---|---|---|
| (L mol−1) | ||||
| [6,129] | 1 wt.% Pt/DP25 | C2H5OH | 1.427 | 0.998 |
| [126] | 0.25 wt.% Pd/mpTiO2 | H2O2 | 31.633 × 10³ | 0.995 |
| [95] | 0.5 wt.% Pt/(5 wt.%) rGO/DP25 | CH3OH | 1.138 | 0.993 |
| [52,95] | Pt/TiO2 | C2H5OH | 1.521 | 0.990 |
| [97] | 2 wt.% NiO/TiO2 | C3H8O3 | 3.000 | 0.930 |
| Parameter | Value (h−1) | 95% CI (%) | ±SD (%) |
|---|---|---|---|
| k1 | 2.01 × 10⁻⁶ | 21.6 | 11.5 |
| k2 | 2.23 × 10⁻⁶ | 23.5 | 10.4 |
| k3 | 1.63 × 10⁻² | 4.6 | 83.0 |
| k4 | 5.18 × 10⁻⁶ | 3.9 | 2.3 |
| k5 | 6.63 × 10⁻⁶ | 4.4 | 2.2 |
| Reaction Path | Reactant | Product | # Photons | H2 Generated | |
|---|---|---|---|---|---|
| 1 | C2H5OH | CH4, CO2 | 5 | 2 | 0.80 |
| 2 | C2H4O | 2 | 1 | 1 | |
| 3 | C2H3OOH | 4 | 2 | 1 | |
| 4 | C2H4O | 2 | 1 | 1 | |
| 5 | C2H3OOH | CH4, CO2 | 1 | 0 | 0 |
| 6 | C2H4O | 3 | 1 | 0.66 | |
| 7 | 2 C2H3OOH | C2H6, CO2 | 2 | 2 | 1 |
Publisher’s Note: MDPI stays neutral with regard to jurisdictional claims in published maps and institutional affiliations. |
© 2021 by the authors. Licensee MDPI, Basel, Switzerland. This article is an open access article distributed under the terms and conditions of the Creative Commons Attribution (CC BY) license (https://creativecommons.org/licenses/by/4.0/).
Share and Cite
Escobedo, S.; de Lasa, H. Synthesis and Performance of Photocatalysts for Photocatalytic Hydrogen Production: Future Perspectives. Catalysts 2021, 11, 1505. https://doi.org/10.3390/catal11121505
Escobedo S, de Lasa H. Synthesis and Performance of Photocatalysts for Photocatalytic Hydrogen Production: Future Perspectives. Catalysts. 2021; 11(12):1505. https://doi.org/10.3390/catal11121505
Chicago/Turabian StyleEscobedo, Salvador, and Hugo de Lasa. 2021. "Synthesis and Performance of Photocatalysts for Photocatalytic Hydrogen Production: Future Perspectives" Catalysts 11, no. 12: 1505. https://doi.org/10.3390/catal11121505