Article

Kinetics of Grape Seed Oil Epoxidation in Supercritical CO2

by
Juan Catalá
,
Jesús Manuel García-Vargas
,
María Jesús Ramos
,
Juan Francisco Rodríguez
and
María Teresa García
*
Department of Chemical Engineering, Universidad de Castilla-La Mancha, Avda. Camilo José Cela 12, 13071 Ciudad Real, Spain
*
Author to whom correspondence should be addressed.
Catalysts 2021, 11(12), 1490; https://doi.org/10.3390/catal11121490
Submission received: 23 November 2021 / Accepted: 2 December 2021 / Published: 6 December 2021
(This article belongs to the Special Issue Catalytic Epoxidation Reaction)

Abstract

:
The epoxidation of grape seed oil in supercritical CO2, to the best of our knowledge, has been only superficially described in the literature, apart from a short communication and our own previous published work on the topic. In this work, a thorough study of the performance of the supercritical epoxidation of grape seed oil is performed in a wide range of conditions, and the kinetic parameters of the supercritical epoxidation of vegetable oils are reported for the first time in the literature. The experimental work has covered a 40–60 °C temperature range at 150 bar, sampling during a period of 48 h. The nature and extent of the side reactions and secondary products obtained have been evaluated, being hydrolysis products and their oligomerization derivatives the major by-products. Reaction rate constants (10−2 h−1 order) and activation energy parameters were finally calculated from the experimental conversion and epoxy yield data to establish the effect of temperature on the kinetics of the process.

Graphical Abstract

1. Introduction

The great importance of the use of epoxidized vegetable oils is due to their suitability as an alternative biobased precursor for many industrially relevant products. Thus, they can be used for the synthesis of lubricants, plasticizers, adhesives, thermosets, polyols or non-isocyanate polyurethanes [1].
The most widespread way of carrying out the epoxidation of the double bonds present in vegetable oils involves the use of percarboxylic acids that come from organic acids.
This procedure is carried out by what is known as the Prileschajew reaction, which firstly consists of the formation in situ of these peroxyacids from the reaction of acids, such as acetic and formic, with hydrogen peroxide (H2O2) molecules [2].
The peracid formation follows the reaction mechanism shown in Equation (1).
H 2 O 2 + RCOOH RCOOH + H 2 O
Furthermore, the peracid produced within the aqueous phase formed by the concentrated hydrogen peroxide is capable of migrating into the oil. There, acting as an oxygen carrier, generates oxirane rings in the active sites which are, in this case, unsaturations (Figure 1), and releases the original carboxylic acid which allows the reaction cycle to be restarted [3,4]. This process also requires the use of acid type catalysts, such as sulfuric acid.
The product obtained requires a purification process consisting of the settling of the liquid phases, followed by a series of washing steps, neutralization of the oil phase, and its final drying. This whole process is necessary in order to neutralize the acidity of the epoxidized oil to obtain an isolated product. Remaining acidity and water traces can lead to further parallel oxirane ring cleavage and undesired side products [5]. The side products generation is the main issue in conducting the selectivity of the process to the formation of epoxides [4] and can be as diverse as those exemplified in Figure 2.
Therefore, environmental concerns related to the use of mineral acids and organic solvents, in addition to the need to simplify and improve the purification processes of the products, leads to a growing interest in outlining an alternative route to the traditional epoxidation process.
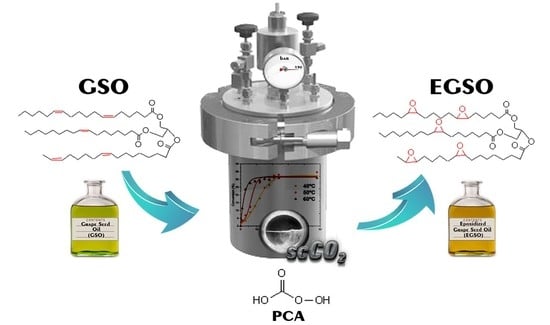
In this context, the possibility arises of obtaining the oxygen transfer agent from an unconventional source, such as carbon dioxide, which acts as a substitute for conventional carboxylic organic acids and is able to react with hydrogen peroxide in an analogous way (Equation (2)) and to form its corresponding peracid, peroxycarbonic acid (PCA) [6].
O = C = O + H O O H OH CO OOH  
CO2 can not only be one of the reagents for epoxidation but can also be the reaction media when CO2 in supercritical conditions (scCO2) is used as the reaction solvent. In addition, scCO2 is neither explosive, nor toxic and it can be removed after the process has been completed simply by means of controlled depressurization and it allows obtaining an epoxidized vegetable oil completely solvent-free.
A previous work by our research group confirmed the feasibility of this reaction as well as the positive effect on the overall process performance of various enhancer compounds [7]. Firstly, sodium bicarbonate, which according to Nolen et al. (2002) ionizes peroxycarbonic acid by increasing its effective concentration [3], and secondly, the so-called phase transfer agents or PTCs, which improve the mass transfer between phases, are two enhancers that help to overcome those mentioned limiting factors when carrying out the transformation of the oil and obtaining optimum performance, especially as it is a multiphase system. Hexadecyltrimethylammonium bromide (HDTMAB) was selected as the PTC agent that showed the best performance under the operating conditions studied.
So far, the background obtained by the group in supercritical epoxidation of vegetable oil has been obtained considering mild operating conditions and optimized the molar ratios of the reagents and enhancer compounds.
Although the epoxidation kinetics according to Prileschajew’s reaction have been widely studied with no CO2 pressure, it seems compelling to extend this study to supercritical media, of which, to the best of our knowledge, there is no records in the literature.
This study would allow an in-depth understanding of the mechanisms involved in these conditions, how the use of peroxycarbonic acid affects the occurrence of the abovementioned oxirane ring opening phenomena and the subsequent formation of side products, as well as the evolution of the whole system over time while the epoxides are formed, and its overall behavior when it is carried out at different temperatures [8].
Therefore, the analysis and comprehension of the kinetics of the process is vital for the selection of optimal operating conditions that allow obtaining an epoxidation yield as close as possible to what is theoretically achievable according to the reaction stoichiometry.

2. Results

A qualitative approach to the grape seed oil epoxidation kinetic based on the FTIR spectra of GSO at different reaction times is shown in Figure 3.
A period of time as long as 48 h was considered appropriate to be sure of having a complete view of the main product and the by-product formed by the evolution of the epoxy compound to oligomers or oxidation products until its complete conversion.
The analysis of the different peaks allows one to see the advancement of the reaction and the different phenomena that occur as the reaction time moves on. It is observed that at longer times there is a decrease in the intensity of the peaks related to the alkene groups (~720 cm−1, ~3015 cm−1), confirming the conversion of the double bonds present in the initial triglycerides. In the same way, there is a peak that was not found in the initial oil, which evolves gradually and is attributed to the formation of the oxirane group (~980 cm−1), as well as the growth in intensity of the peak of the hydroxyl groups (~3450 cm−1) which could indicate the presence of secondary products from hydrolysis and/or the opening of the epoxy rings previously formed.
In order to explore in detail the above-mentioned appearance of undesired secondary reaction products, a GPC analysis was carried out. Figure 4 shows the GPC chromatogram obtained, in which three clearly differentiated regions can be observed, in terms of molecular weights.
Region nº 1 corresponds to the main signal where the peak corresponding to the triglycerides appears (877 g/mol). A slight shift to the left is highlighted as the reaction time increases, which is directly attributed to the slight increase in molecular weight caused by the introduction of an oxygen atom to every doble bond to form the oxirane ring. This shift is also consistent with the reaction advancement since it is proportional to the reaction time elapsed, and therefore, to the expected yield achieved. Another outstanding aspect is the decrease in the relative size of the area under this peak due to the transformation of triglycerides into compounds with a significant difference in molecular weight, which already suggests the formation of polymerization products.
Region nº 2 includes the peaks corresponding to low molecular weight products, i.e., mainly diglycerides and free fatty acids (confirmed by 1,3-dinonadecanoin and oleic acid standards). The most important aspect is that there is no significant generation of any of these products depending on the reaction time, remaining very similar to those already found in the starting oil. This behavior confirms that the relative decrease in the quantity of triglycerides has not been oriented to the breakage of the ester links of the fatty acids with the glycerol, and therefore, that the hydroxyl presence observed in the infrared spectrum is due to the opening of oxirane rings and not to the breaking of triglyceride chains.
In the case of region nº 3, the appearance of a region of new products is observed, which did not exist in the raw material and corresponds to molecular weights higher than the main region formed by triglycerides. The formation of these products is attributed to the development of post-oxirane cleavage polymerization [9], which occurs following the reactions that are alike, as exemplified in Figure 5.
The different areas that are observed correspond to dimers (~1900–2000 g/mol), trimers, or even high molecular weight oligomers (>3000 g/mol), all of which are the result of the polymerization reactions of the secondary products formed during epoxidation [10].
In addition, Figure 6 shows a representation of the relative amounts corresponding to each region as a function of time and it is obtained by calculating the enclosed areas under those curves.
As shown in Figure 6, the relative concentration of low-molecular-weight compounds remains practically constant at considerably low values and yet the concentration of high-molecular-weight products increases in direct proportion to the way in which the triglycerides decrease.
Once primary characterization of the epoxidation products is concluded, the influence of temperature on the reaction kinetics was studied over the temperature range from 40 to 60 °C. The values of conversion and epoxide yield are presented in Figure 7.
As expected, the reaction kinetic is strongly affected by the temperature increase. While the final epoxy content is almost achieved in 9 h at 60 °C, more than twice that time is needed at 40 °C. However, the maximum conversion value is achieved, in the studied range, independently of the temperature, which suggests that certain limitations to get greater levels of epoxidation in scCO2 have not yet been overcome.
As mentioned in Section 1 and highlighted by different authors, the in situ formation of percarboxylic acids is the first and the controlling one of the two reaction steps that comprise the epoxidation mechanism [11,12,13], and it is, therefore, essential for the completion cleavage of the double bonds of the oil. When the epoxidation is carried out in supercritical CO2, it seems to be clear that there is not sufficient peroxycarbonic acid concentration to achieve the full conversion of the reactant and this may be due to different factors. The proposed hypothesis is that although mass transfer, (key to put peroxycarbonic acid precursors in contact, which is enhanced by the use of PTCs [14,15] is not enough to counter the negative effect of H2O2 decomposition (Equation (3)), involving the reduction of the epoxidizing precursor concentration that competes with PCA formation [16] and releases oxirane ring cleaving species like the ones shown in Figure 2.
H 2 O 2 + O H O O H + H 2 O O O H 1 2 O 2 + O H
Another fact that should be highlighted is that the profiles for the conversion and yield do not strictly coincide. Although both follow very similar trends, there is an offset between the conversion values and the total epoxy yield. The yield values are lower than the conversion values for the same reaction times. This observation confirms that it is not possible by these means to completely avoid the formation of ring-opening products, which occur from the beginning and in parallel with the in situ epoxidation and post-oxirane cleavage procedures [8], and they represent precisely the difference between the two parameters.
The initial hypothesis is that conversion of double bonds by peroxycarbonic acid is expected to behave similarly when compared with the kinetics of the epoxidation of vegetable oils with conventional solvents, that, when organic acids are used, according to the Prileschajew reaction, follows pseudo-first-order kinetics [9].
In order to check that assumption, the kinetic equation that would define this process is taken as starting point:
−d[DB]/dt = k[DB]n1[PCA]n2
where [DB] and [PCA] are molar concentrations of double bonds and peroxycarbonic acid, respectively, k is a kinetic constant, and n1, n2 are the reaction orders with respect to each one of the reagents.
Assuming that the reaction is of pseudo first-order for both double bonds and peroxycarbonic acid, the rate equation would be expressed as follows:
−d[DB]/dt = k[DB]
Now the kinetic constant is redefined as a pseudo first-order constant k’ = k[PCA], and Equation (5) should be integrated, obtaining the final expression:
ln([DB]/[DB]0) = −k’t
Equation (6) is plotted in Figure 8 taking into consideration that the measured parameter for the concentration of double bounds in this work is the iodine value, and assuming that it is directly proportional to it, and so ln([DB]/[DB]0) = ln(IV/IV0).
Coefficients of determination (R2) and reaction rate constants (k’) obtained from the slopes of the linearly fitted data in Figure 8 are shown in Table 1.
High R2 values for the three temperature series imply a really good fitting to a linear adjustment of the experimental data and confirm that the reaction follows pseudo first-order kinetics in the initial stages, when the rate of reaction control is the controlling step of the process.
Rate constants (k′) values (Table 1) cover a range at 10−2 h−1, one order slower than catalyzed epoxidation using organic acids like peracetic o performic acids [9]. Those values can be fitted to Arrhenius Equation (Equation (7)) in its linear form (Equation (8)), to calculate the dependence of reaction rate with temperature [17] and to obtain activation energy (Ea) term, as illustrated in Figure 9.
k   ( T ) = A · e E a R T
l n ( k ) = l n ( A ) E a R ( 1 T )
The activation energy value calculated is 74.2 kJ/mol, a bit greater than those obtained in traditional epoxidation that used to be around ~55 kJ/mol [9].

3. Materials and Methods

3.1. Materials

Grapeseed oil (GSO) was kindly provided by Alvinesa S.A. (Daimiel, Ciudad Real, Spain). Hexadecyltrimethyl-ammonium bromide (HDTMAB) (<98%), hydrogen peroxide solution (30% wt.), sodium bicarbonate (99.5–100.5%), oleic acid (analytical standard), and 1,3-Dinonadecanoin (standard) were supplied by Sigma–Aldrich, Inc. (Spanish division, Madrid, Spain).
Extended information about the oil composition is described as follows: C16:0 palmitic (6.9% wt.), C18:0 stearic (4% wt.), C18:1 oleic (19% wt.) and C18:2 linoleic (69.1% wt.) acids. Iodine value (IV) and average molecular weight (MW) were 137.05 g I2/100 g sample and 877.29 g/mol, respectively, as determined in previous publications [7,18].

3.2. Experimental Setup

The experiments were carried out in a high-pressure setup operated as a closed system (Figure 10). The high-pressure reactor is a Berghof BR-300 model (300 °C and 200 bar max.) and it is equipped with the following components: electrical heating jacket, mechanical stirring system, and a Berghof BTC-3000 temperature controller (Berghof Products + Instruments GmbH, Eningen unter Achalm, Germany). The reactor main body is a stainless-steel vessel (390 mL) with an inner insert made out of TFMTM-PTFE (310 mL). Additionally, a relief valve (Set pressure = 180 bar) is installed to ensure personal safety in case of undesired overpressure. Auxiliary equipment is depicted as a Milton–Roy Miniroyal Series (MD140G4M500/Z) dosing pump (Milton Roy Company, Pont-Saint-Pierre, France) and a “Frigiterm-TFT-10 SELECTA” refrigeration bath (JP SELECTA, Abrera, Spain).

3.3. Experimental Procedure

Except for CO2, all reactants are placed into the vessel before closing it. Following that, CO2 is pre-cooled and pumped until it reaches the desired pressure. In the meantime, the heating system maintains the vessel’s temperature at the desired process value. The stirring is then activated and maintained throughout the reaction time. Finally, the CO2 is released through the vent valves, and the product is obtained from within the vessel. To avoid altering the internal pressure of the system through sampling, a complete experiment was carried out to obtain each data. The epoxidation product is then separated from the non-fatty byproducts using a 1760 g centrifuge.

3.4. Operating Conditions

The operating conditions and reagent ratios were also set based on the results obtained formerly [7]. Pressure and temperature were established as 150 bar and 40 °C. Reagents molar ratios used for the epoxidation experiments were the following: 1(Oil):6(H2O2):0.3(NaHCO3):0.075(HDTMAB).
The aim of this study was to study the epoxidized oil product through a broad time range (0–48 h), sampling every 3 h during the first 24 h, with the final product at 48 h as the final sample and reaction result. Agitation speed used for every experiment was 500 rpm.

3.5. Characterization Methods

3.5.1. Iodine Value

Standard UNE-EN14111 procedure was the method used to determine the iodine value of the samples [19]. This determination was carried out in a Titrino 728 Stirrer automatic titrator. From these values, it is possible to determine the unsaturation content of every oil sample.

3.5.2. Oxirane Oxygen

The amount of oxirane oxygen contained in every sample was calculated from the Epoxy Equivalent acquired by UNE-EN ISO 3001 Official Method [20].
E O = 1 E E M W O
  • EO: Oxirane Oxygen (g oxygen/g sample)
  • EE: Epoxy Equivalent (g sample/mol epoxide)
  • MWO: Atomic weight of oxygen (g/mol)

3.5.3. Conversion and Yield Calculations

Conversion is calculated based on the double bonds’ disappearance, by means of the difference on its concentration, given by iodine value (IV).
x   ( % ) = ( 1 I V I V 0 ) · 100
Yield (η) is defined by the product of the conversion (x) of the double bonds involved in the reaction and the selectivity (s) to the transformation into oxirane rings.
η = x · s
s   ( % ) = E O E O max X · 100
E O max X = ( I V 0 I V ) · M W O M W I 2 · 100
  • IV: Iodine value of the sample
  • IV0: Iodine value of the unreacted reagent
  • MWI2: Atomic weight of molecular iodine (g/mol)
  • MWO: Atomic weight of oxygen (g/mol)
  • EO: Oxirane oxygen content of the sample.
  • EOmaxX: Maximum theoretical oxirane oxygen content, with complete selectivity towards epoxides, considering the reached conversion.

3.5.4. Infrared Spectrometry

A Spectrum Two spectrometer (Perkin Elmer España S.L., Tres Cantos, Spain) was used to obtain infrared spectra. The samples were scanned from 4000 to 450 cm−1 at a resolution of 16 cm−1. All measurements were performed at room temperature.

3.5.5. Gel Permeation Chromatography (GPC)

A Shimadzu chromatograph (Izasa Scientific, Madrid, Spain) was used with two Waters HR-2 columns (pore size 500 Å) and HR-0.5 (pore size 50 Å) and a detector of refractive index (Waters España, Madrid, Spain), which allows the detection of molecular weights between 100 and 20,000 g/mol. The analysis conditions were a flow rate of 1 mL/min and a sample concentration of 10 mg/mL using tetrahydrofuran (THF) as mobile phase. Polyethylenglycol was used as a standard for the calibration. Oleic acid and 1,3-Dinonadecanoin were used as standards for the identification of free fatty acids and diglycerides, respectively.

4. Conclusions

A study of grape seed oil epoxidation reaction kinetics in supercritical media has been carried out at 40, 50 and 60 °C.
The development of the overall reaction evolves rapidly and is clearly and positively influenced by the increase in temperature, reaching maximum conversion at around 9 h in the most favorable case.
Limited mass transfer between phases, undesired hydrolysis products, oligomer formation and rapid depletion of H2O2 were the main limitations to get greater values of epoxy yield.
The values obtained for reaction rate constants (k) were 0.0157 h−1 for 40 °C, 0.0209 h−1 for 50 °C, and 0.0872 h−1 for 60 °C. Activation energy calculated with the Arrhenius equation was 74.2 kJ/kmol.
These facts highlight the need to optimize the epoxidation process of vegetable oils in scCO2, under an environmental approach, and find a proper non-hazardous catalyst that could enhance the reaction rate and the selectivity of the epoxidation in supercritical conditions.

Author Contributions

Conceptualization, visualization, formal analysis, writing—original draft preparation, writing—review and editing, J.C., J.M.G.-V., M.J.R., J.F.R. and M.T.G.; methodology, software, validation, investigation, data curation, J.C.resources, supervision, project administration, J.M.G.-V., M.J.R., J.F.R. and M.T.G. All authors have read and agreed to the published version of the manuscript.

Funding

This research received no external funding.

Conflicts of Interest

The authors declare no conflict of interest.

References

  1. Tan, S.G.; Ahmad, Z.; Chow, W.S. Reinforcing ability and co-catalytic effects of organo-montmorillonite clay on the epoxidized soybean oil bio-thermoset. Appl. Clay Sci. 2014, 90, 11–17. [Google Scholar] [CrossRef]
  2. Tavassoli-Kafrani, M.H.; van de Voort, F.R.; Curtis, J.M. The use of ATR-FTIR spectroscopy to measure changes in the oxirane content and iodine value of vegetable oils during epoxidation. Eur. J. Lipid Sci. Technol. 2017, 119, 1–11. [Google Scholar] [CrossRef]
  3. Santacesaria, E.; Tesser, R.; Di Serio, M.; Turco, R.; Russo, V.; Verde, D. A biphasic model describing soybean oil epoxidation with H2O2 in a fed-batch reactor. Chem. Eng. J. 2011, 173, 198–209. [Google Scholar] [CrossRef]
  4. He, W.; Fang, Z.; Ji, D.; Chen, K.; Wan, Z.; Li, X.; Gan, H.; Tang, S.; Zhang, K.; Guo, K. Epoxidation of soybean oil by continuous micro-flow system with continuous separation. Org. Process Res. Dev. 2013, 17, 1137–1141. [Google Scholar] [CrossRef]
  5. Adolfsson, H.; Copéret, C.; Chiang, J.P.; Yudin, A.K. Efficient epoxidation of alkenes with aqueous hydrogen peroxide catalyzed by methyltrioxorhenium and 3-cyanopyridine. J. Org. Chem. 2000, 65, 8651–8658. [Google Scholar] [CrossRef] [PubMed]
  6. Nolen, S.A.; Lu, J.; Brown, J.S.; Pollet, P.; Eason, B.C.; Griffith, K.N.; Gläser, R.; Bush, D.; Lamb, D.R.; Liotta, C.L.; et al. Olefin epoxidations using supercritical carbon dioxide and hydrogen peroxide without added metallic catalysts or peroxy acids. Ind. Eng. Chem. Res. 2002, 41, 316–323. [Google Scholar] [CrossRef]
  7. Catalá, J.; García-vargas, J.M.; Ramos, M.J.; Rodríguez, J.F.; García, M.T. Analysis and optimization of grape seed oil epoxidation in supercritical CO2. J. Supercrit. Fluids 2021, 168, 105070. [Google Scholar] [CrossRef]
  8. Kousaalya, A.B.; Beyene, S.D.; Gopal, V.; Ayalew, B.; Pilla, S. Green epoxy synthesized from Perilla frutescens: A study on epoxidation and oxirane cleavage kinetics of high-linolenic oil. Ind. Crops Prod. 2018, 123, 25–34. [Google Scholar] [CrossRef]
  9. Petrović, Z.S.; Zlatanić, A.; Lava, C.C.; Sinadinović-Fišer, S. Epoxidation of soybean oil in toluene with peroxoacetic and peroxoformic acids-Kinetics and side reactions. Eur. J. Lipid Sci. Technol. 2002, 104, 293–299. [Google Scholar] [CrossRef]
  10. de Haro, J.C.; Izarra, I.; Rodríguez, J.F.; Pérez, Á.; Carmona, M. Modelling the epoxidation reaction of grape seed oil by peracetic acid. J. Clean. Prod. 2016, 138, 70–76. [Google Scholar] [CrossRef]
  11. Jalil, M.J.; Hadi, A.; Azmi, I.S. Catalytic epoxidation of palm oleic acid using in situ generated performic acid – Optimization and kinetic studies. Mater. Chem. Phys. 2021, 270, 1–7. [Google Scholar] [CrossRef]
  12. Janković, M.R.; Govedarica, O.M.; Sinadinović-Fišer, S.V. The epoxidation of linseed oil with in situ formed peracetic acid: A model with included influence of the oil fatty acid composition. Ind. Crops Prod. 2020, 143, 111881. [Google Scholar] [CrossRef]
  13. Rios, L.A.; Echeverri, D.A.; Franco, A. Epoxidation of jatropha oil using heterogeneous catalysts suitable for the Prileschajew reaction: Acidic resins and immobilized lipase. Appl. Catal. A Gen. 2011, 394, 132–137. [Google Scholar] [CrossRef]
  14. Dillow, A.K.; Yun, S.L.J.; Suleiman, D.; Boatright, D.L.; Liotta, C.L.; Eckert, C.A. Kinetics of a phase-transfer catalysis reaction in supercritical fluid carbon dioxide. Ind. Eng. Chem. Res. 1996, 35, 1801–1806. [Google Scholar] [CrossRef]
  15. Anantpinijwatna, A.; Kim, S.H.; Sales-Cruz, M.; Gani, R. Predictive Modelling of Phase-Transfer Catalyst Systems for Improved and Innovative Design; Elsevier Masson SAS: Amsterdam, The Netherlands, 2016; Volume 38. [Google Scholar] [CrossRef]
  16. Santacesaria, E.; Russo, V.; Tesser, R.; Turco, R.; Di Serio, M. Kinetics of Performic Acid Synthesis and Decomposition. Ind. Eng. Chem. Res. 2017, 56, 12940–12952. [Google Scholar] [CrossRef]
  17. Zavitsas, A.A. Energy barriers to chemical reactions. Why, how and how much? Non-arrhenius behavior in hydrogen abstractions by radicals. J. Am. Chem. Soc. 1998, 120, 6578–6586. [Google Scholar] [CrossRef]
  18. Ramos, M.J.; Fernández, C.M.; Casas, A.; Rodríguez, L.; Pérez, Á. Influence of fatty acid composition of raw materials on biodiesel properties. Bioresour. Technol. 2009, 100, 261–268. [Google Scholar] [CrossRef] [PubMed]
  19. AENOR. European Standard for Iodine Value Determination (UNE-EN 14111); AENOR: Madrid, Spain, 2003. [Google Scholar]
  20. AENOR. European Standard for Epoxy Equivalent Determination (UNE-EN ISO 3001); AENOR: Madrid, Spain, 2000. [Google Scholar]
Figure 1. Vegetable oil epoxidation reaction mechanism.
Catalysts 11 01490 g001
Figure 2. Side product formation reactions.
Catalysts 11 01490 g002
Figure 3. FT-IR spectra of the epoxidized products through time.
Catalysts 11 01490 g003
Figure 4. GPC chromatograms of the epoxidized products through time. Three depicted regions (1: Triglycerides, 2: Low molecular weight products, 3: High molecular weight products).
Catalysts 11 01490 g004
Figure 5. Polymerization mechanism derived from an epoxidized and a hydrolyzed product.
Catalysts 11 01490 g005
Figure 6. Molecular Weight distribution vs. reaction time. T = 40 °C. L-MW: Low Molecular Weight, H-MW: High Molecular Weight.
Catalysts 11 01490 g006
Figure 7. (a) Conversion and (b) yield values vs. time for the supercritical epoxidation of grape seed oil. P = 150 bar, T = 40 °C, 50 °C, 60 °C.
Catalysts 11 01490 g007
Figure 8. Reaction rate equation fitting of experimental data at 40, 50 and 60 °C.
Catalysts 11 01490 g008
Figure 9. Arrhenius fitting of rate constants.
Catalysts 11 01490 g009
Figure 10. Experimental high-pressure setup.
Catalysts 11 01490 g010
Table 1. Coefficients extracted from linear adjustment of the conversion experimental data at 40, 50 and 60 °C.
40 °C50 °C60 °C
R20.98510.94010.9818
k’(h−1)0.01570.03550.0872
Publisher’s Note: MDPI stays neutral with regard to jurisdictional claims in published maps and institutional affiliations.

