Article

Wastewater Contaminated with Hydrazine as Scavenger Agent for Hydrogen Production by Cu/Ti Nanostructures

by
Mariana Hinojosa Reyes
1,
Roberto Camposeco
2 and
Vicente Rodríguez González
1,*
1
División de Materiales Avanzados, IPICyT, Instituto Potosino de Investigación Científica y Tecnológica, Camino a la Presa San José 2055 Col. Lomas 4a. sección, C.P. 78216 San Luis Potosí, S.L.P., Mexico
2
Instituto de Ciencias Aplicadas y Tecnología, Universidad Nacional, Autónoma de México, Circuito Exterior S/N, Ciudad Universitaria, A. P. 70-186, Delegación Coyoacán, C.P. 04510 México, D.F., Mexico
*
Author to whom correspondence should be addressed.
Catalysts 2021, 11(1), 74; https://doi.org/10.3390/catal11010074
Submission received: 3 December 2020 / Revised: 22 December 2020 / Accepted: 4 January 2021 / Published: 7 January 2021
(This article belongs to the Special Issue Commemorative Issue in Honor of Professor Akira Fujishima)

Abstract

:
Cu/Ti photocatalysts were prepared by the sol-gel process with different copper loadings (1.0, 2.5, and 5.0 wt.%) and then thermally treated at several calcination temperatures from 400 to 600 °C. The materials were characterized by X-ray diffraction (XRD), N2 physisorption, Scanning Electronic Microscopy with Energy Dispersive X-ray Spectroscopy (SEM-EDS), Ultraviolet-visible-Diffuse Reflection Spectroscopy, Ultraviolet-visible spectroscopy as a function of the temperature, (Temperature Programmed Reduction) TPR-chemisorption, XPS (X-ray Photoelectron Spectroscopy) and OH determination through DRIFTS (Diffuse reflectance infrared Fourier transform spectroscopy). The Cu/Ti photocatalysts were evaluated for the photocatalytic production of hydrogen using hydrazine as scavenging agent. Moreover, a detailed study of the Cu1+/Cu2+ ratio and the corresponding formation of copper oxide was carried out to understand the correlation between the copper species and the photocatalytic activity. Simultaneously, the OH groups on the TiO2 surface also show insights into the behavior of these materials during the photocatalytic reaction. Despite the low hydrazine concentration (20 mM), the 1.0 (wt.%) Cu/Ti 500 photocatalyst enhanced the hydrogen production three and two times more than photolysis and bare TiO2, respectively. The 1.0 Cu/Ti 500 photocatalyst displayed outstanding stability for at least three continuous cycles of 8 h each, preserving the hydrogen production. The novel ability shown in this work represents an alternative to reduce the hydrazine residues in wastewater to transform it into a hydrogen-producing energy source and must be extended to other reductive pollutants found in wastewater.

1. Introduction

The water-splitting reaction could be considered as an environmentally sustainable method for producing hydrogen. This reaction proceeds with the use of a semiconductor and radiation with energy equal or greater than its band-gap. In this way, the excitation of electrons from the valence to conduction band is achieved. Therefore, the reduction in H+ to generate H2 takes place as described by Fujishima and Honda [1].
According to the literature, the yield of the water-splitting reaction improves when organic molecules are used as hole scavengers. In this regard, ethanol has been used widely as a sacrificial agent [2]. Other electron donors or hole scavengers that have been used successfully are glycerol [3], ethanolamines [4], oxalic acid [5], chloroacetic acid [6], glucose [7], sulfites [4,5,6,7,8], glyceraldehyde [9], and Na2S among others [10]. As a sacrificial agent, ethanol has the disadvantage of being used in high concentrations to carry out the water-splitting reaction. For this reason, hydrazine has been proposed as a sacrificial agent, mainly for its reducing properties. In addition, this compound and its derivatives are major constituents of a variety of rocket fuels and missile propellants; these uses have led to the release of these toxic hydrazine fuels into the environment, causing their accumulation in industrial wastewater [11]. Fortunately, the production of hydrogen using a diluted water–hydrazine mixture represents a sustainable way to recycle hydrazine wastewater into alternative energy sources.
To catalyze the water-splitting reaction, a semiconductor with a narrower band gap than the radiation with which it will be excited is necessary. For this purpose, titania (TiO2) is an excellent semiconductor due to its physicochemical properties. However, it has been modified to enhance these properties, where the deposition of precious metal nanoparticles such as gold, palladium and platinum represents an expensive method [12]. On the other hand, TiO2 can be modified by doping with transition metals to improve the electron flow in redox reactions [13].
Due to their low cost and remarkable properties, the use of copper species at very low concentrations has been proposed to dope the TiO2 in order to form oxygen vacancies on the surface, where the rest of the copper that is not present in the TiO2 lattice is capable of carrying out the formation of copper oxides. The advantages of using copper consist of having low costs with respect to noble metals, not undergoing corrosion under photocatalytic conditions and decreasing the recombination of the hole/electron pairs. Specifically, Cu2O is a simple metal oxide semiconductor with low band-gap energy. As shown by an energy correlation between the band-gap model of Cu2O and the redox potentials of relevant electrode reactions in an aqueous solution at pH 7, the conduction and valence band edges of Cu2O, which are separated by band-gap energy values from 2.0 to 2.2 eV, seem to be available for the reduction and oxidation of water, respectively [14].
In this work, the photocatalytic production of hydrogen using copper-TiO2 nanomaterials and hydrazine at negligible concentrations as a sacrificial agent is proposed. In this sense, hydrazine wastewater was used with the environmental and energy purpose of producing hydrogen.

2. Results and Discussion

2.1. Characterization of the Nanostructures

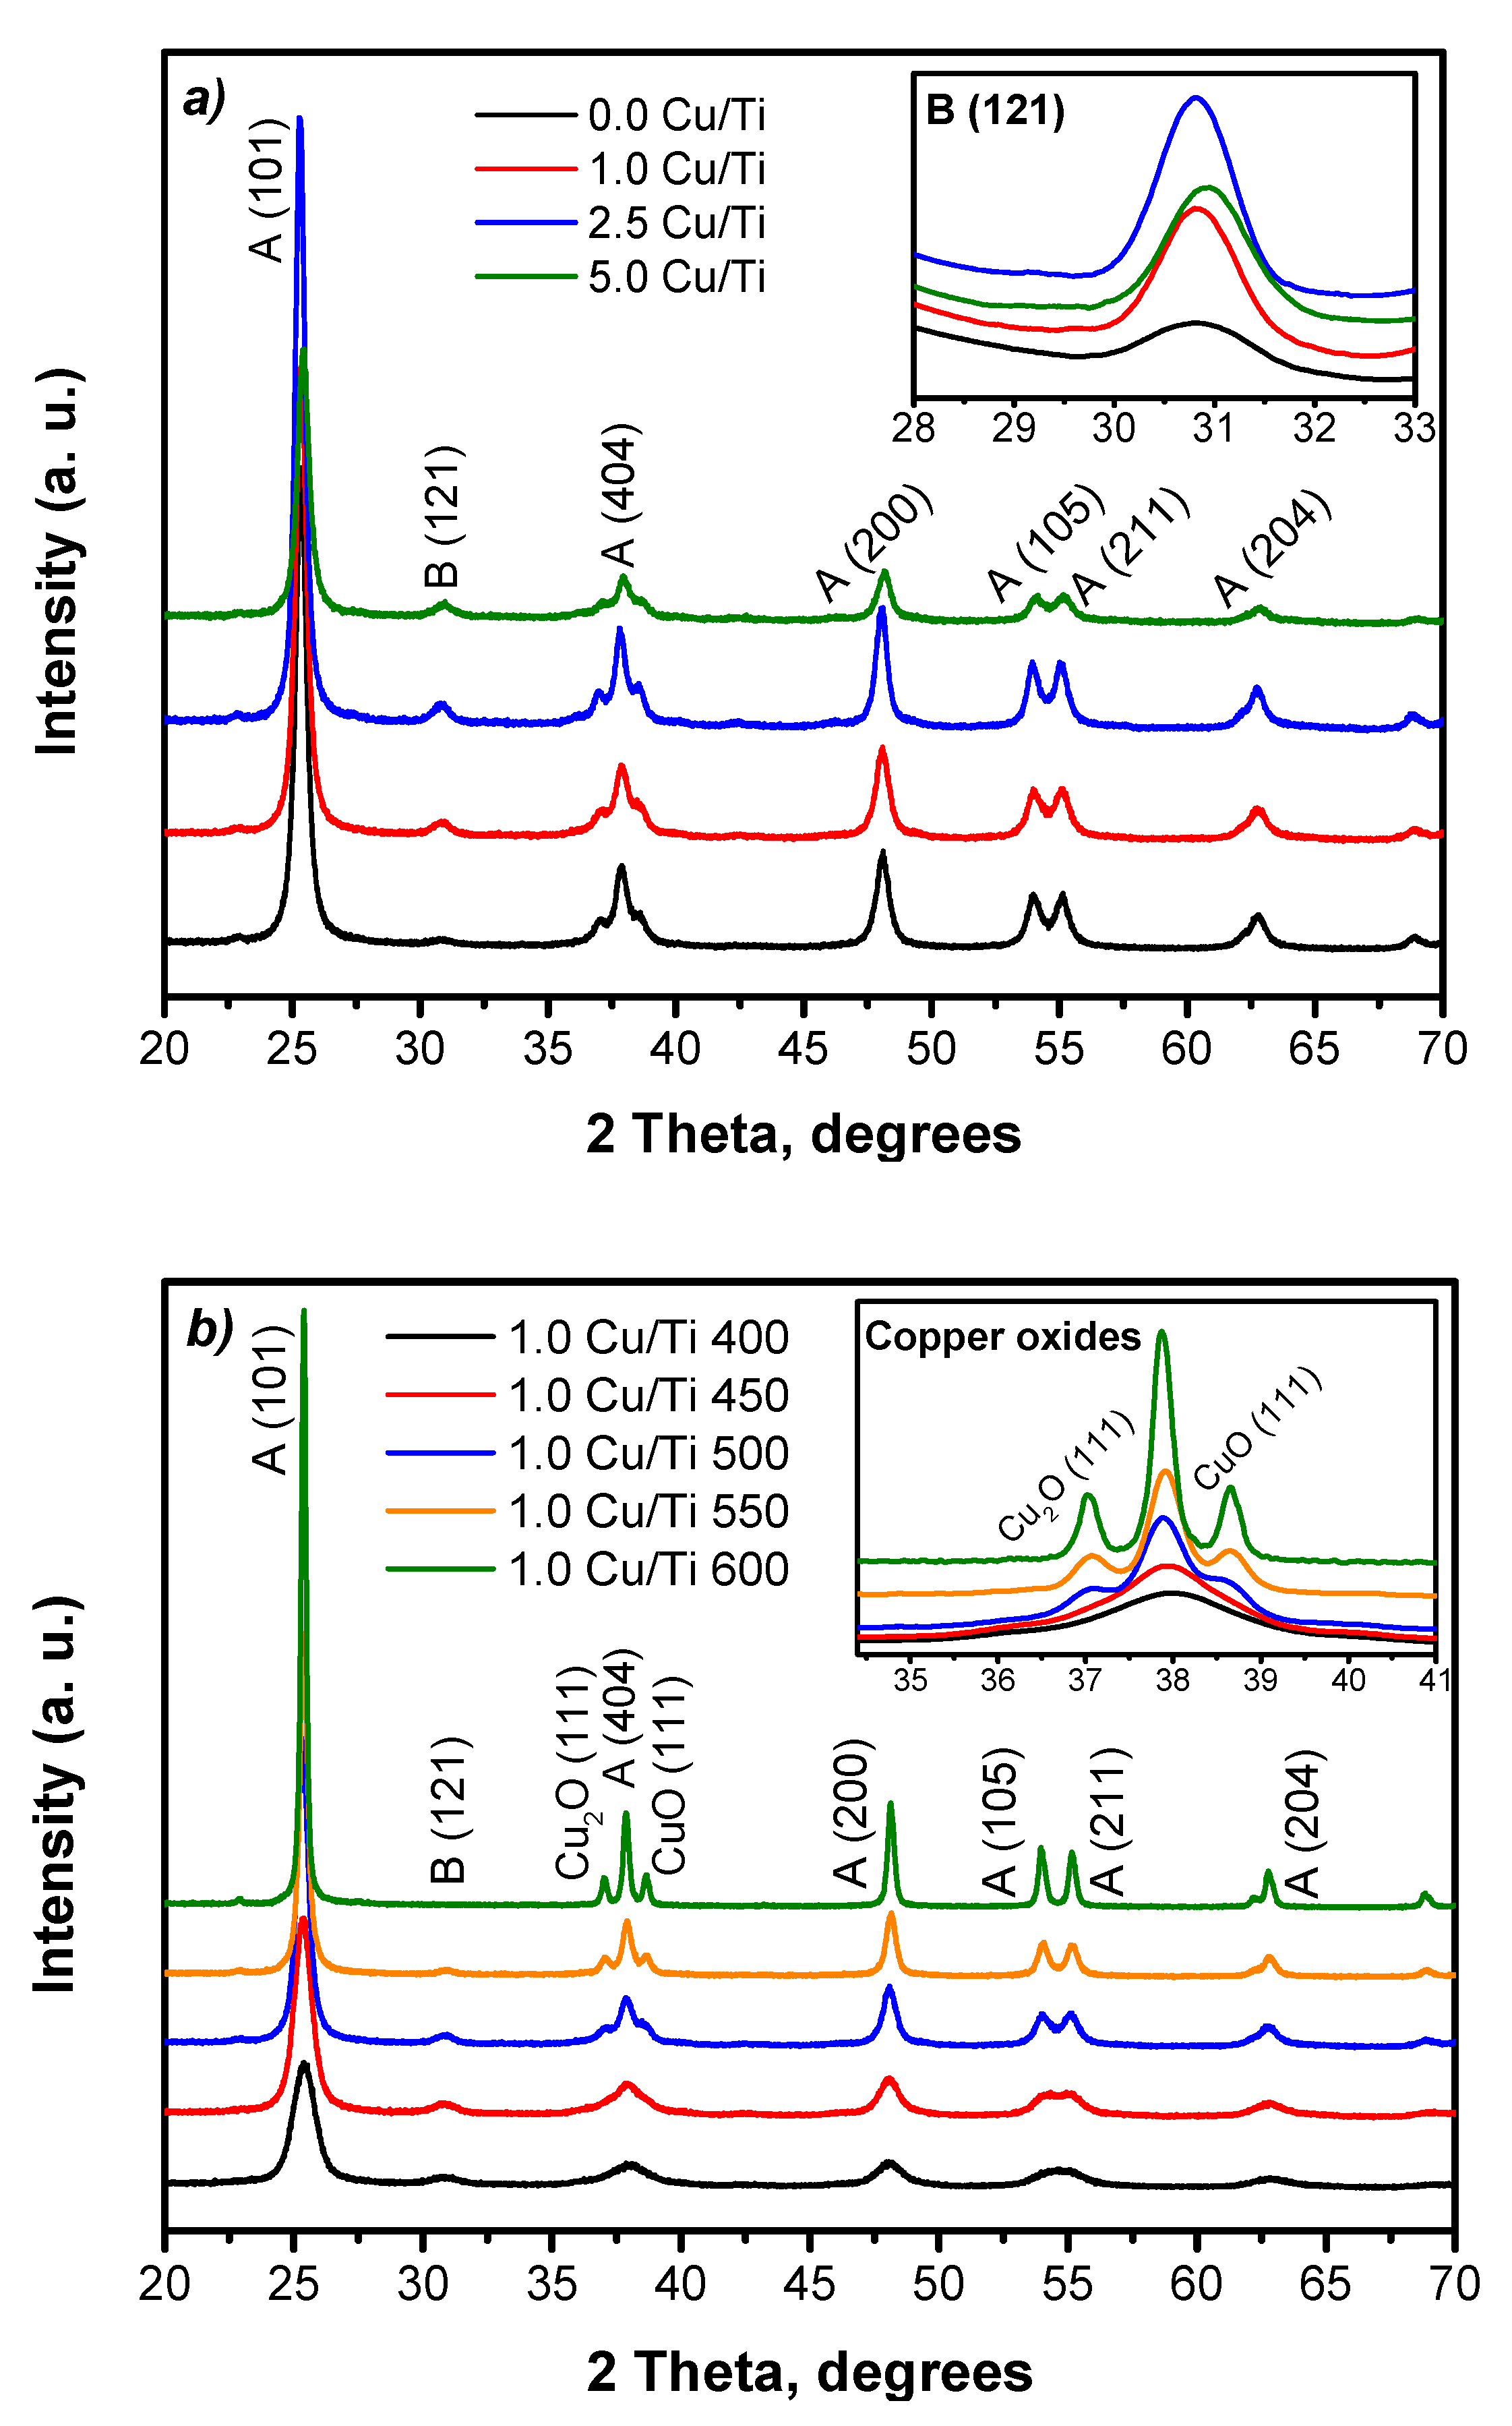
2.1.1. Cu/Ti Structure Determination

X-ray diffraction patterns are shown in Figure 1a,b. In all cases, the crystalline anatase phase (JCPDS 21-1272) is present with the characteristic crystallographic plane (101) at 25°. As the copper concentration increases, the presence of the brookite crystalline phase starts to appear with the well-known crystallographic plane (121) at 30.7° (JCPDS 29-1360). Such growth starts with even a minimal copper load of 1 wt.%; see inset of Figure 1a. For the different heat treatments, the brookite crystalline phase disappears as the temperature increases. Just at 500 °C, Cu2O (JCPDS 05-0667) becomes present with the crystalline plane (111) located at 37.0°, simultaneously with the CuO oxide (JCPDS 45-0937) which is evident with the crystalline plane (111) located at 38.7° of 2 theta; see inset in Figure 1b. Therefore, copper induces the presence of the brookite phase, whereas the increase in temperature restricts the growth of brookite and favors the formation of the corresponding copper oxides.
Using the Scherrer equation, the crystallite size of the samples was calculated, see Table 1. For different copper contents, the crystallite sizes range from 16 to 20 nm, whereas for the different calcination temperatures, the values are between 8.2 and 39.3 nm. As seen, the calcination temperature plays a fundamental role since the crystallite size increases as the temperature increases.
The above information can be correlated with the nitrogen physisorption measurements, where it is found that the surface area decreases with the increase of the copper content from 65 to 35 m2/g, where the highest value corresponds to the lowest copper content; see Table 1. For the 1.0 Cu/Ti sample treated at different temperatures, the surface area decreased from 115 m2/g (400 °C) to 14 m2/g (600 °C). In both cases, the decrease in surface area was due to the segregation of copper species as oxides on the surface of TiO2 [15]. Nitrogen adsorption–desorption isotherms are shown in the Supplementary Materials Section, Figure S1.

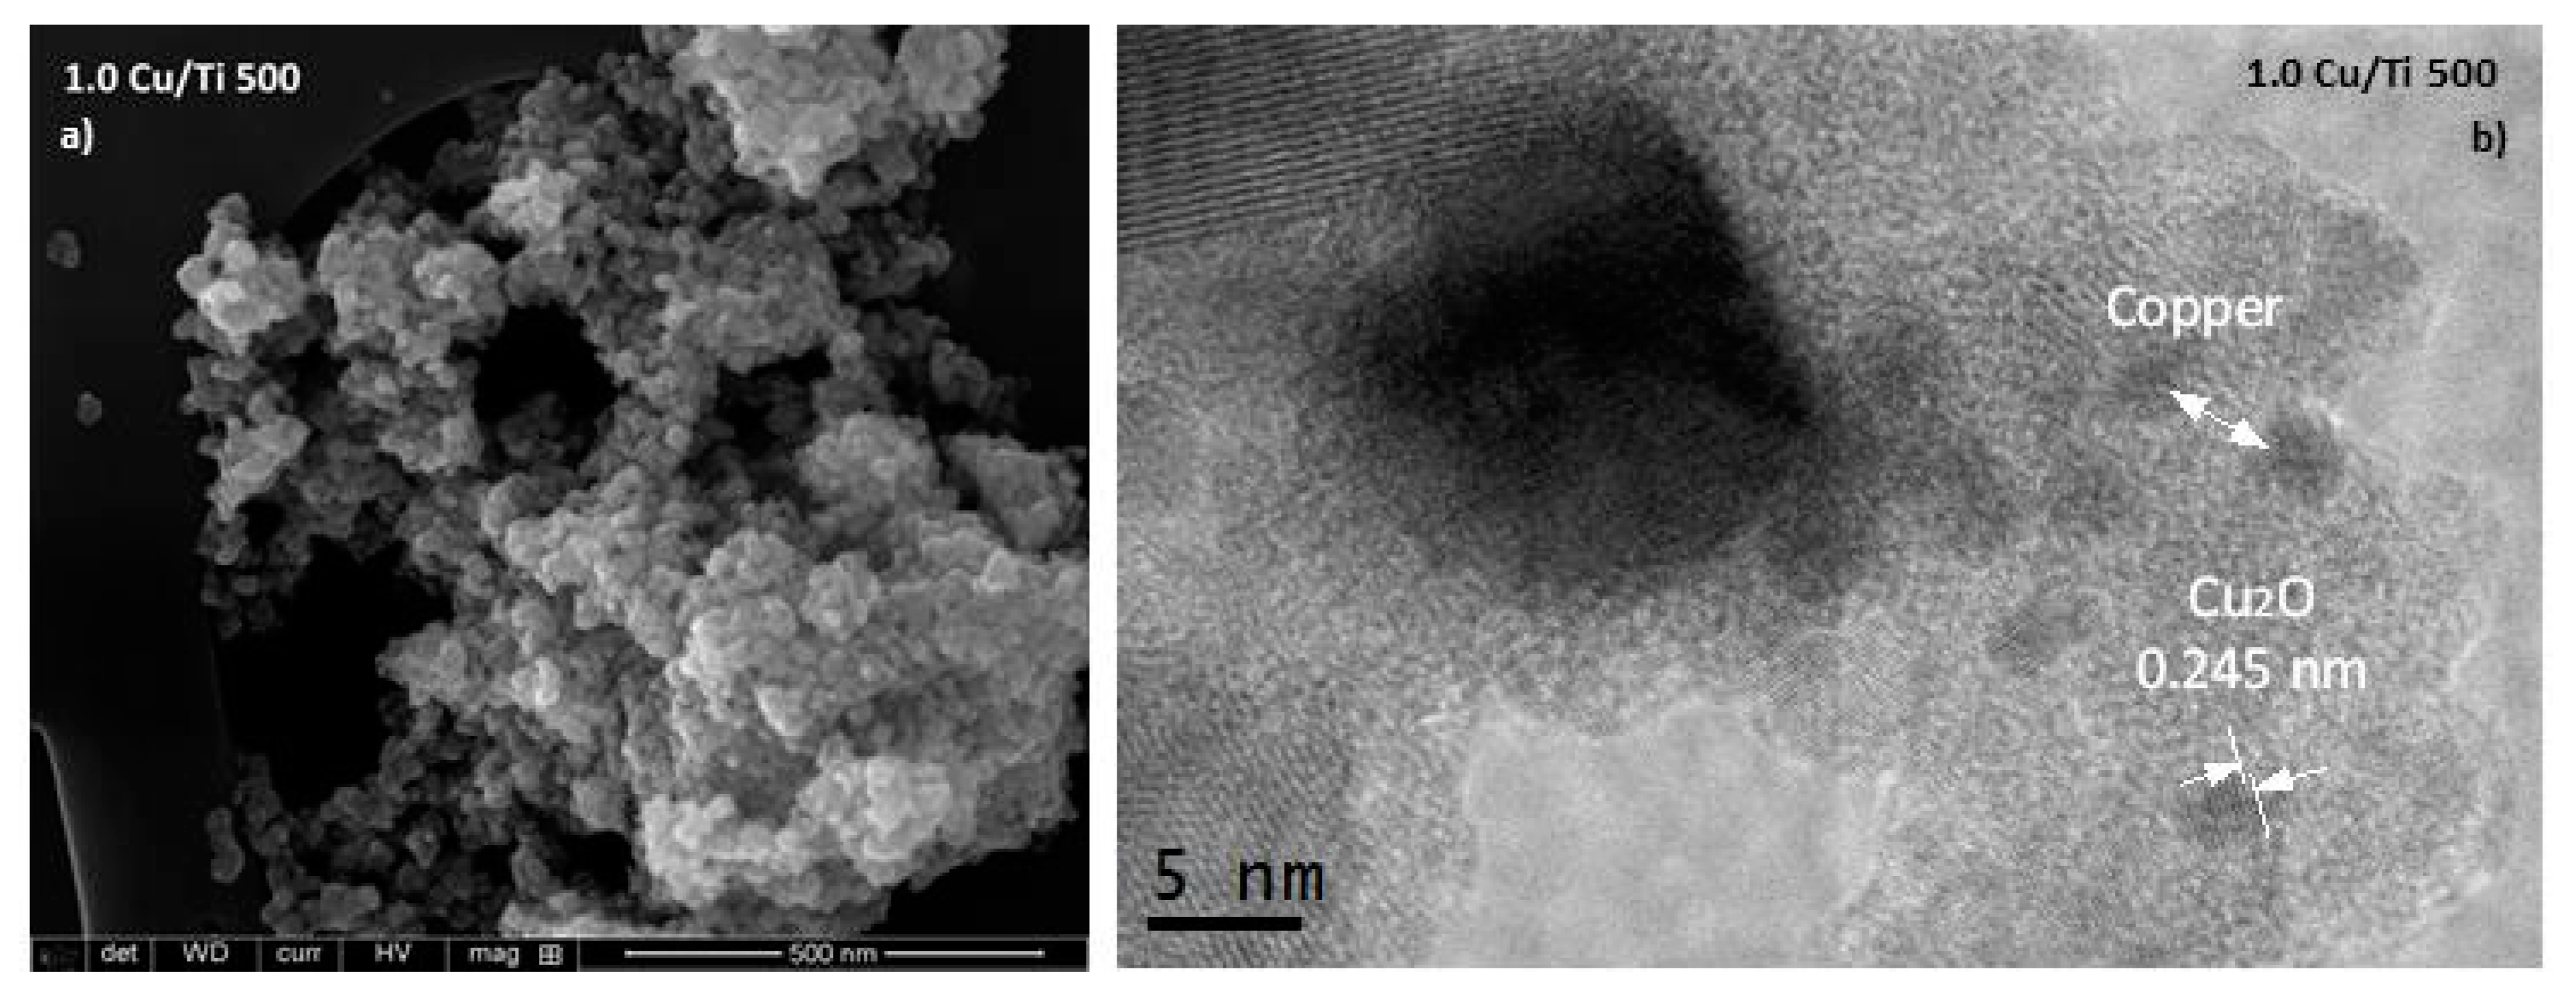
2.1.2. Morphology, Structure and Elemental Semi-Quantitative Analysis

Figure 2a shows a SEM (Scanning Electronic Microscopy) image of the 1.0 Cu/Ti 500 photocatalyst. This sample was chosen because it displays the highest hydrogen production, as will be shown later. As seen, a homogeneous cluster of titania particles with mainly quasi-spherical morphology predominates. On the other hand, the HRTEM (High Resolution Transmission Electron Microscopy) image reveals semi-spherical copper nanoparticles of around 2 to 4 nm on the TiO2 surface. The measured value of the crystalline interplanar distance was 2.4 Å, which is in good agreement with Cu2O oxide according to the JCPDS 05-0667and 45-0937 cards. This type of morphology should not exhibit any representative change according to the copper concentration and the heat treatment temperature.
The copper content was measured by X-ray Fluorescence technique, see Table 1. For 1.0 Cu/Ti sample, the experimental copper content corresponds to 0.95 wt.%. For 2.5 Cu/Ti material, the real copper amount corresponds to 2.30 wt.%, whereas a 4.60 wt.% of copper was found in the 5.0 Cu/Ti photocatalyst. In this sense, a slight variation was found in the nominal and experimental copper contents. Moreover, copper lixiviation did not occur in any sample during the sol-gel process. Therefore, this method guarantees good incorporation into the TiO2 lattice or during the formation of copper oxides.

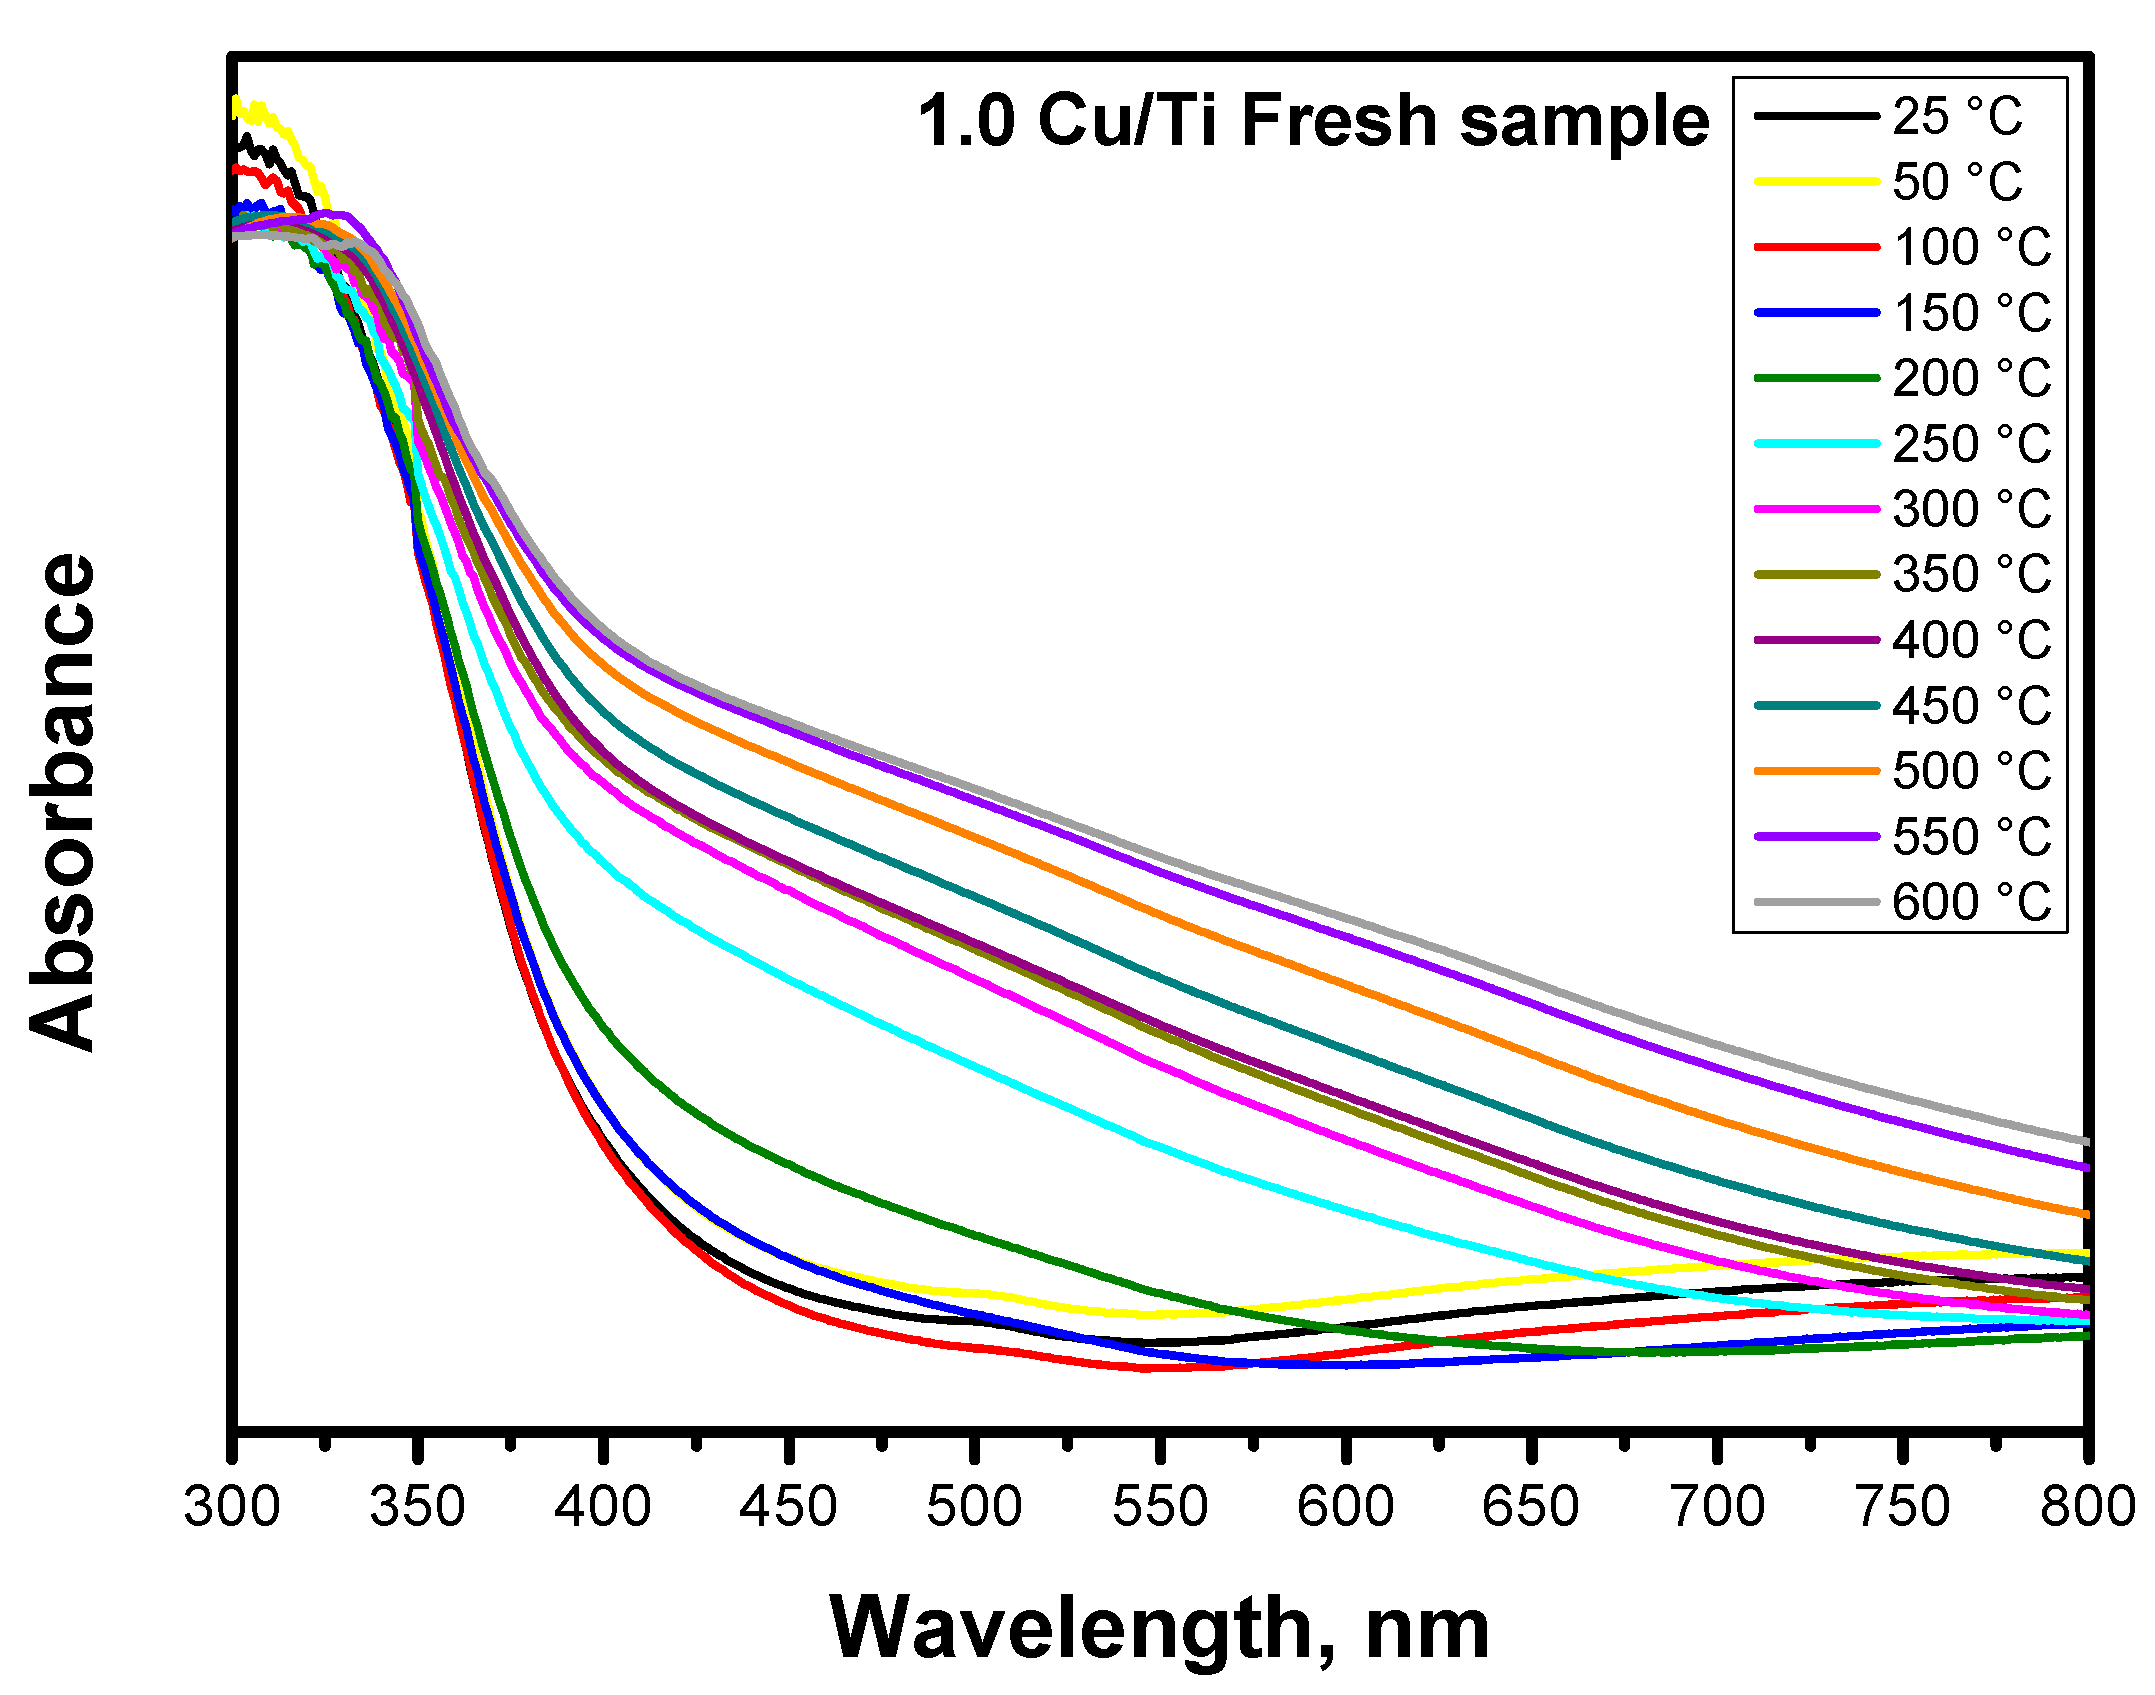
2.1.3. Optical Characterization by UV-Vis Measurements

The band gap energies (Eg) were calculated according to F(R) UV-vis spectra and the corresponding values are shown in Table 1. As the copper concentration increased, the Eg decreased from 3.4 to 2.3 eV. The samples show a blue-shift, indicating that the Cu-photocatalysts could be activated in the visible region while the Cu/Ti materials calcined at different temperatures show almost the same Eg values of 3.3 and 3.2 eV for all the samples. The UV-vis spectra are shown in the Supplementary Materials Section, Figure S2.
An additional UV-vis DRS experiment was carried out as a function of temperature to elucidate the behavior of the 1.0 Cu/Ti fresh sample at different temperatures from 25 up to 600 °C, see Figure 3. As the temperature increases, a shift towards a higher wavelength was detected, while the absorbance tends to decrease as the temperature increases. On the other hand, two additional bands are observed in the spectra ranging from 25 to 100 °C: (1) one centered at 500 nm, which corresponds to the Cu2O interband absorption, and the weak absorption from 500 to 400 nm originating from the interfacial charge transfer from the TiO2 valence band to the copper oxides [16,17]; (2) a band starting at around 530 nm and attributable to the intrinsic exciton band of CuO and the d–d transition of Cu (II) species [18].
The presence of copper in titania photocatalysts was corroborated through this experiment, but the two bands associated with copper oxides were not detected as the temperature increased. The photocatalysts used for the photocatalytic production of hydrogen were tested in the range from 400 to 600 °C. At these temperatures, additional bands corresponding to copper oxides were not visible. However, the calcination temperature plays an important role due to the changes related to the copper species.

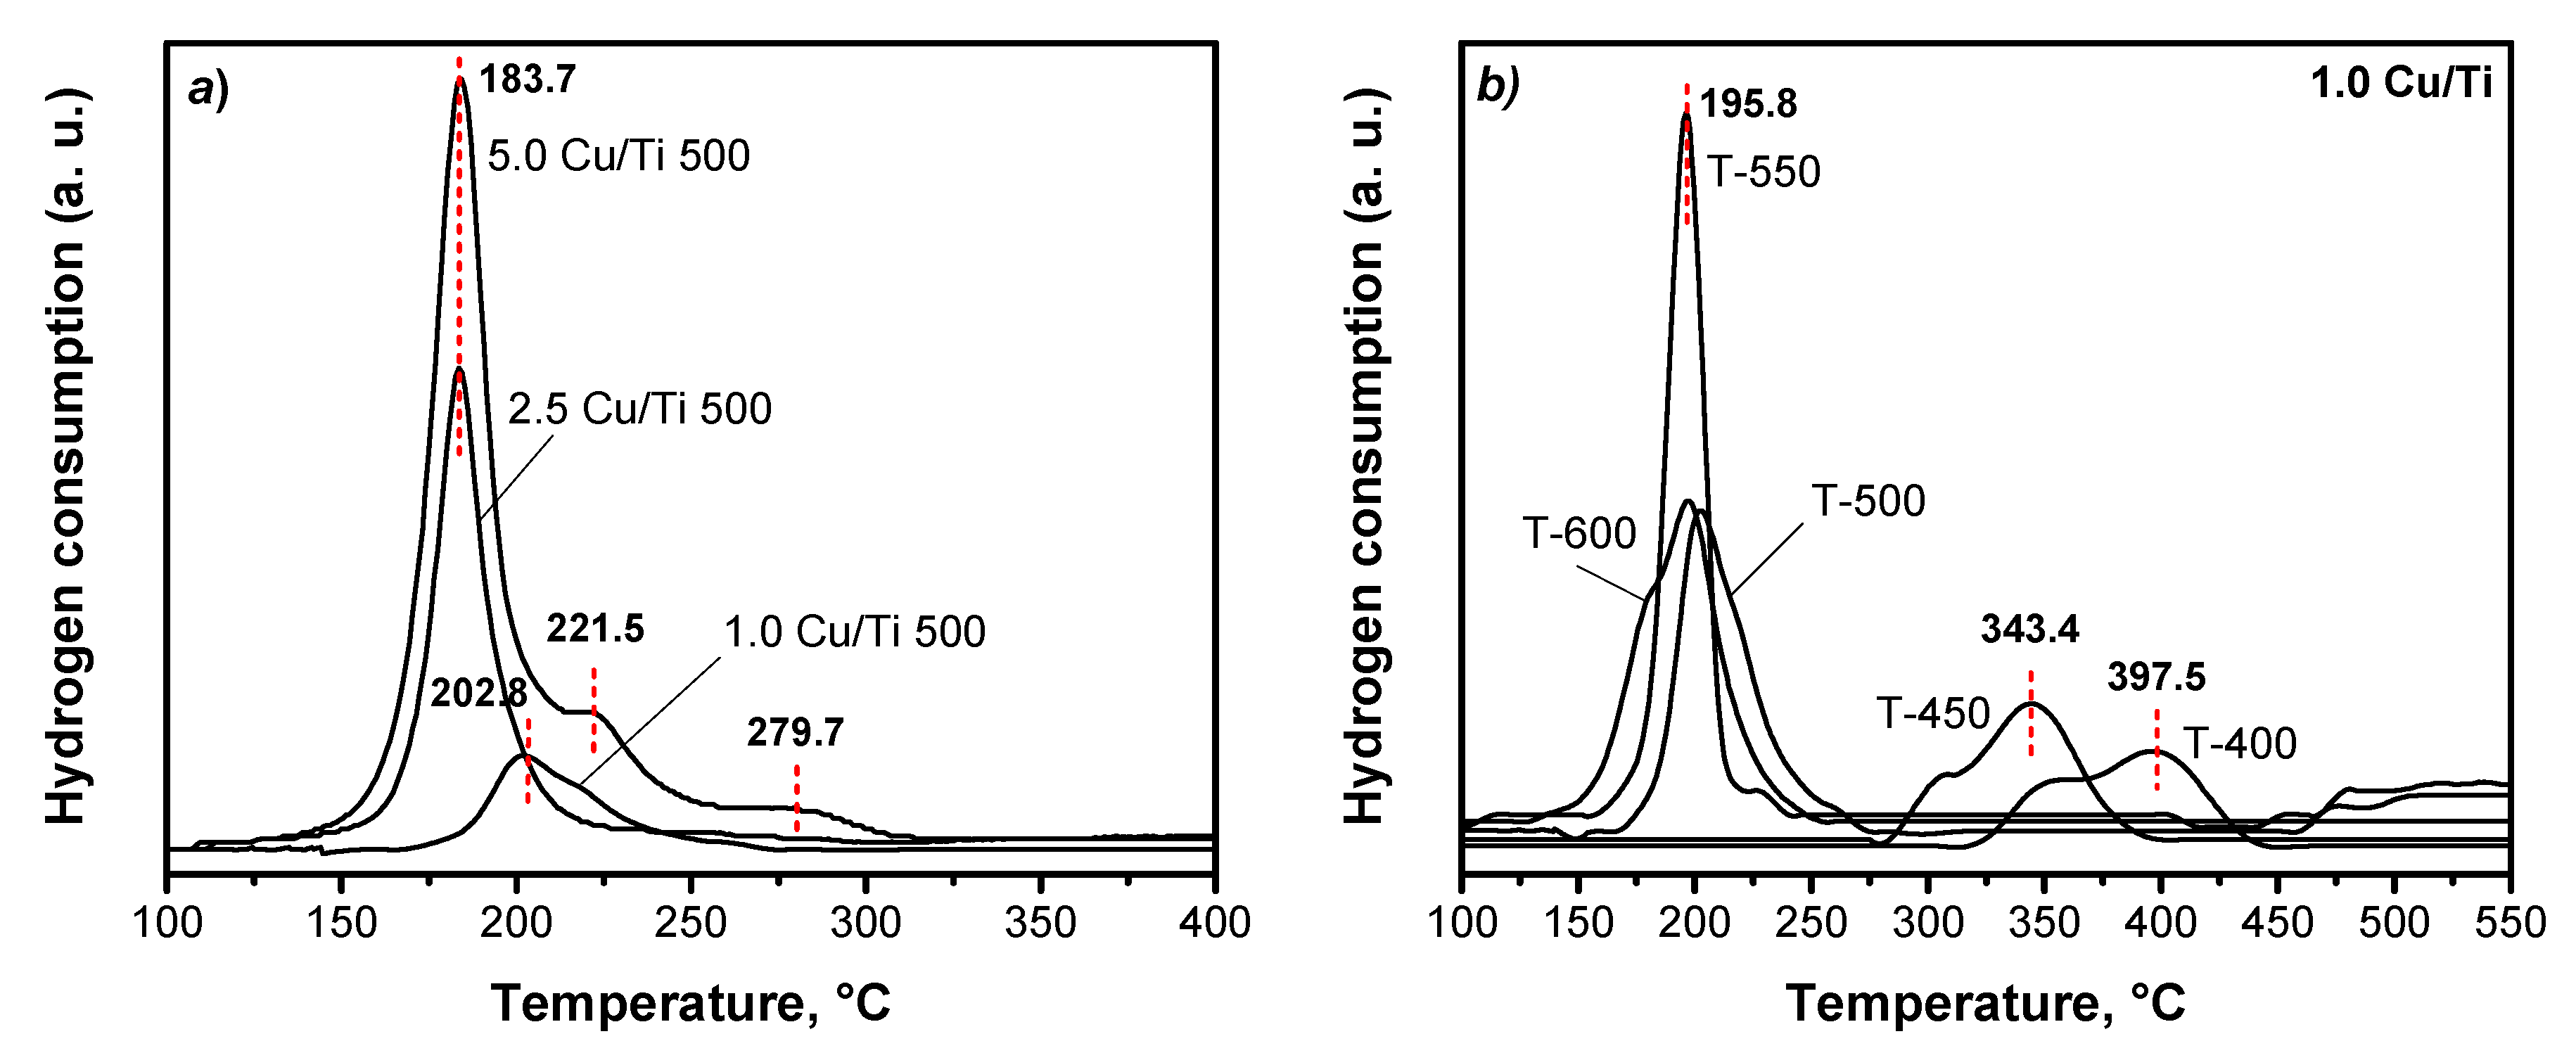
2.1.4. Temperature Programmed Reduction

The effect of the temperature and copper load during the copper oxidation stage was evaluated through temperature-programmed reduction experiments. Figure 4a shows the effect of varying the copper concentration. For copper loads equal to 1.0 wt.%., a low intensity peak with width from 180 to 250 °C was detected. This peak is associated with the Cu2+ → Cu+ reduction, corresponding to the copper oxide, CuO, and Cu2+ → Cu1+ reduction [19,20]. In addition, the 2.5 Cu/Ti and 5.0 Cu/Ti samples thermally treated at 500 °C show a well-defined reduction peak that starts at 160 and ends at 210 °C; this peak is also related to the Cu2+ → Cu+ reduction. The shoulders observed for the 5.0 Cu/Ti 500 sample at 225 and 275 °C are associated with the continuous reduction from Cu+ to Cu0 species [21].
The behavior of the 1.0 Ti/Cu photocatalyst calcined between 400 and 600 °C is shown in Figure 4b. Calcination temperatures of 500, 550, and 600 °C revealed a well-defined reduction peak at 195.8 °C, which is associated with the Cu2+ ion reduction [22,23,24]. For the samples calcined at 400 and 450 °C, lower intensity peaks between 280 and 450 °C with maximum intensities at 340 and 400 °C were observed. These peaks are associated with the Cu+ → Cu0 reduction, but exhibited a shift at higher temperatures with respect to the other samples. This shift is related to the well-dispersed copper into the TiO2 lattice. According to the literature, the copper reduction occurs as follows: CuO → Cu2O → Cu0 [25].
The TPR profiles gave information about the copper species and their correlation with the calcination temperature. Moreover, a detailed XPS analysis was carried out to corroborate the presence of the copper species. It is important to mention that neither Cu2+ nor Cu+ species were detected by XRD due to the low copper loading, but they were identified by the TPR technique and well corroborated by XPS.

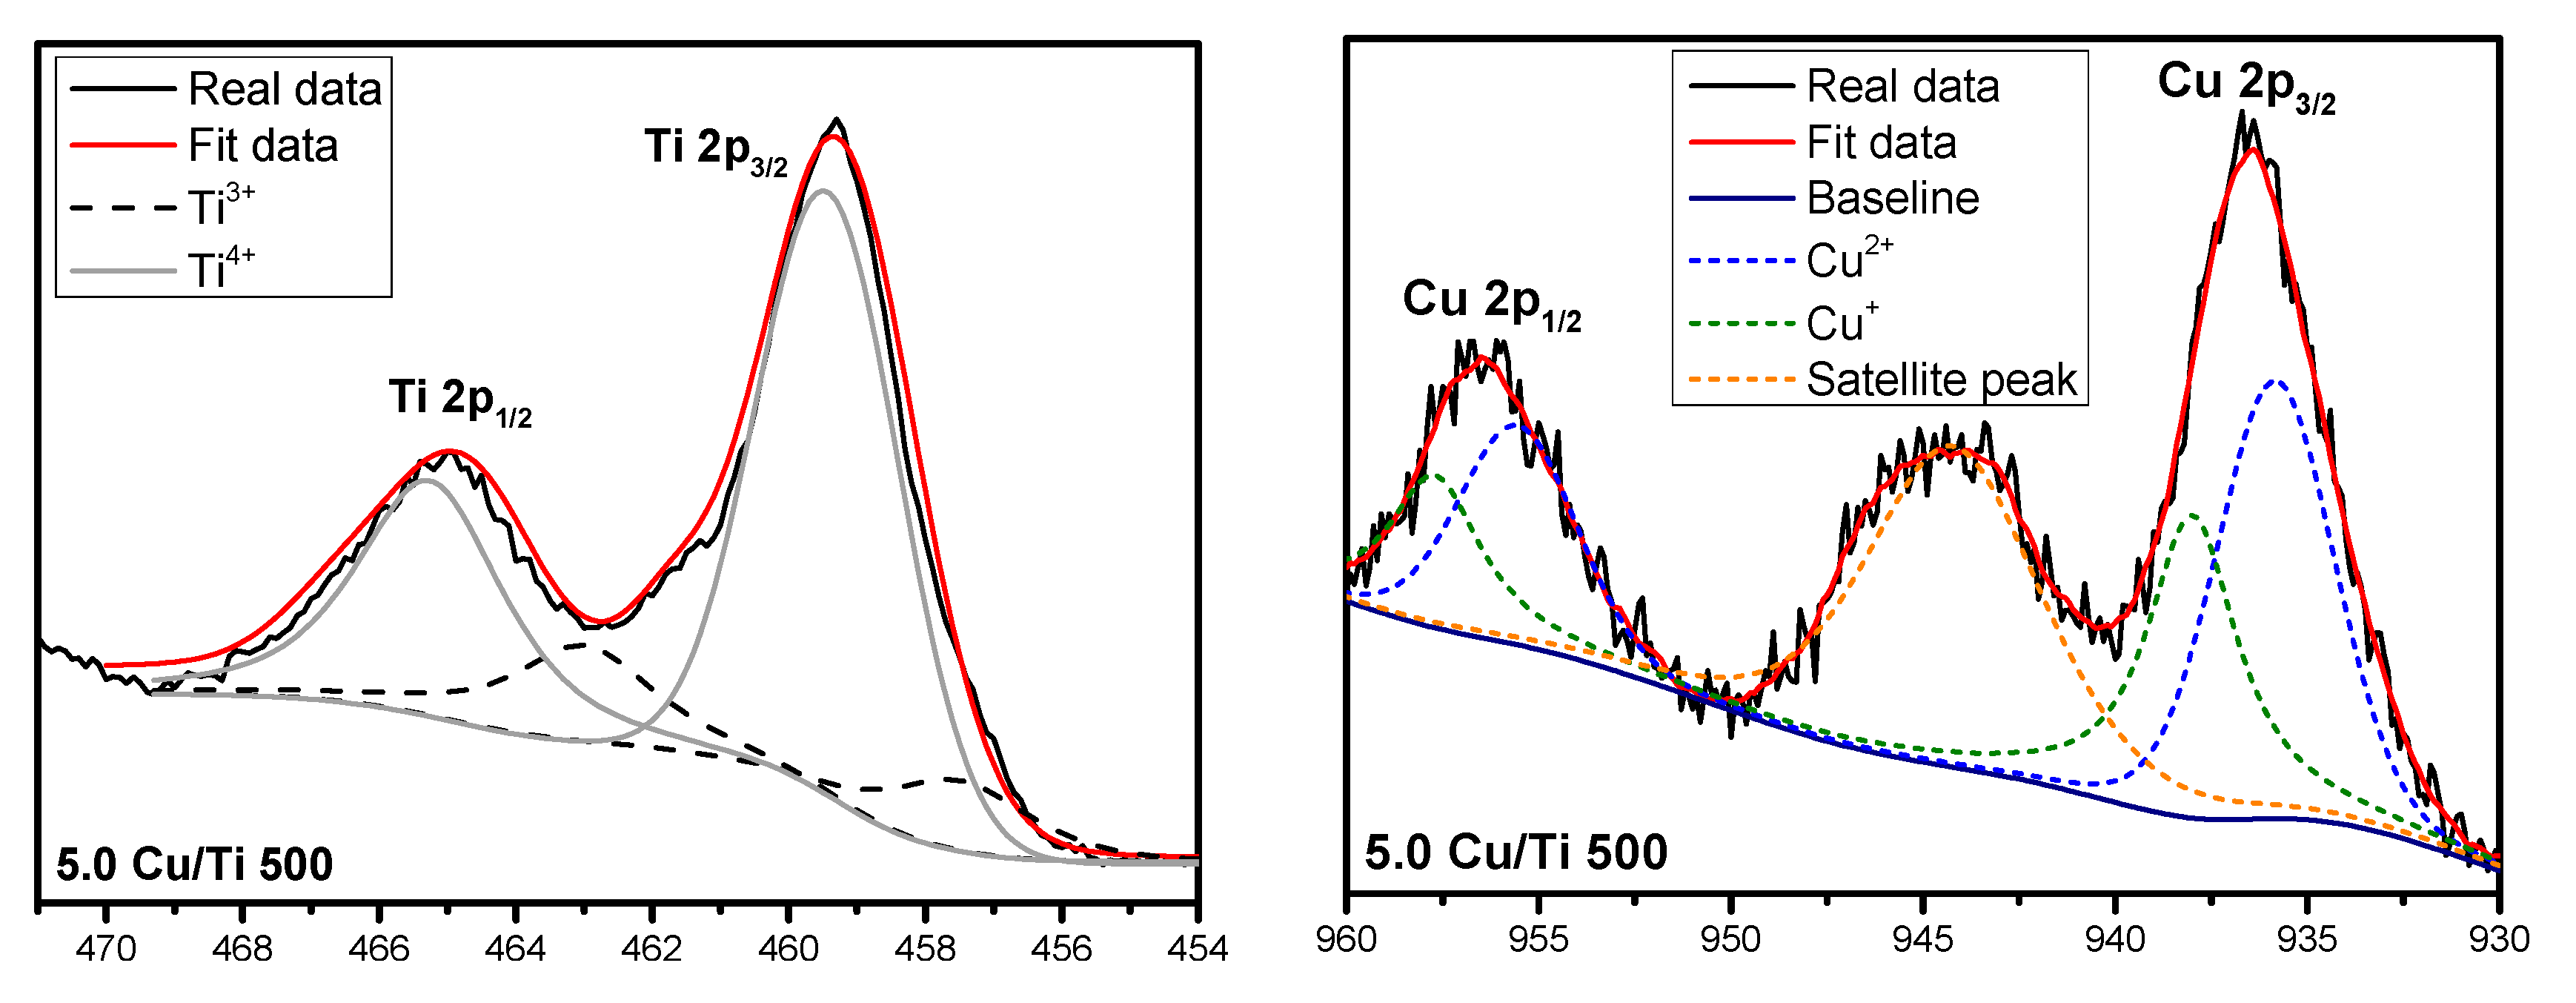
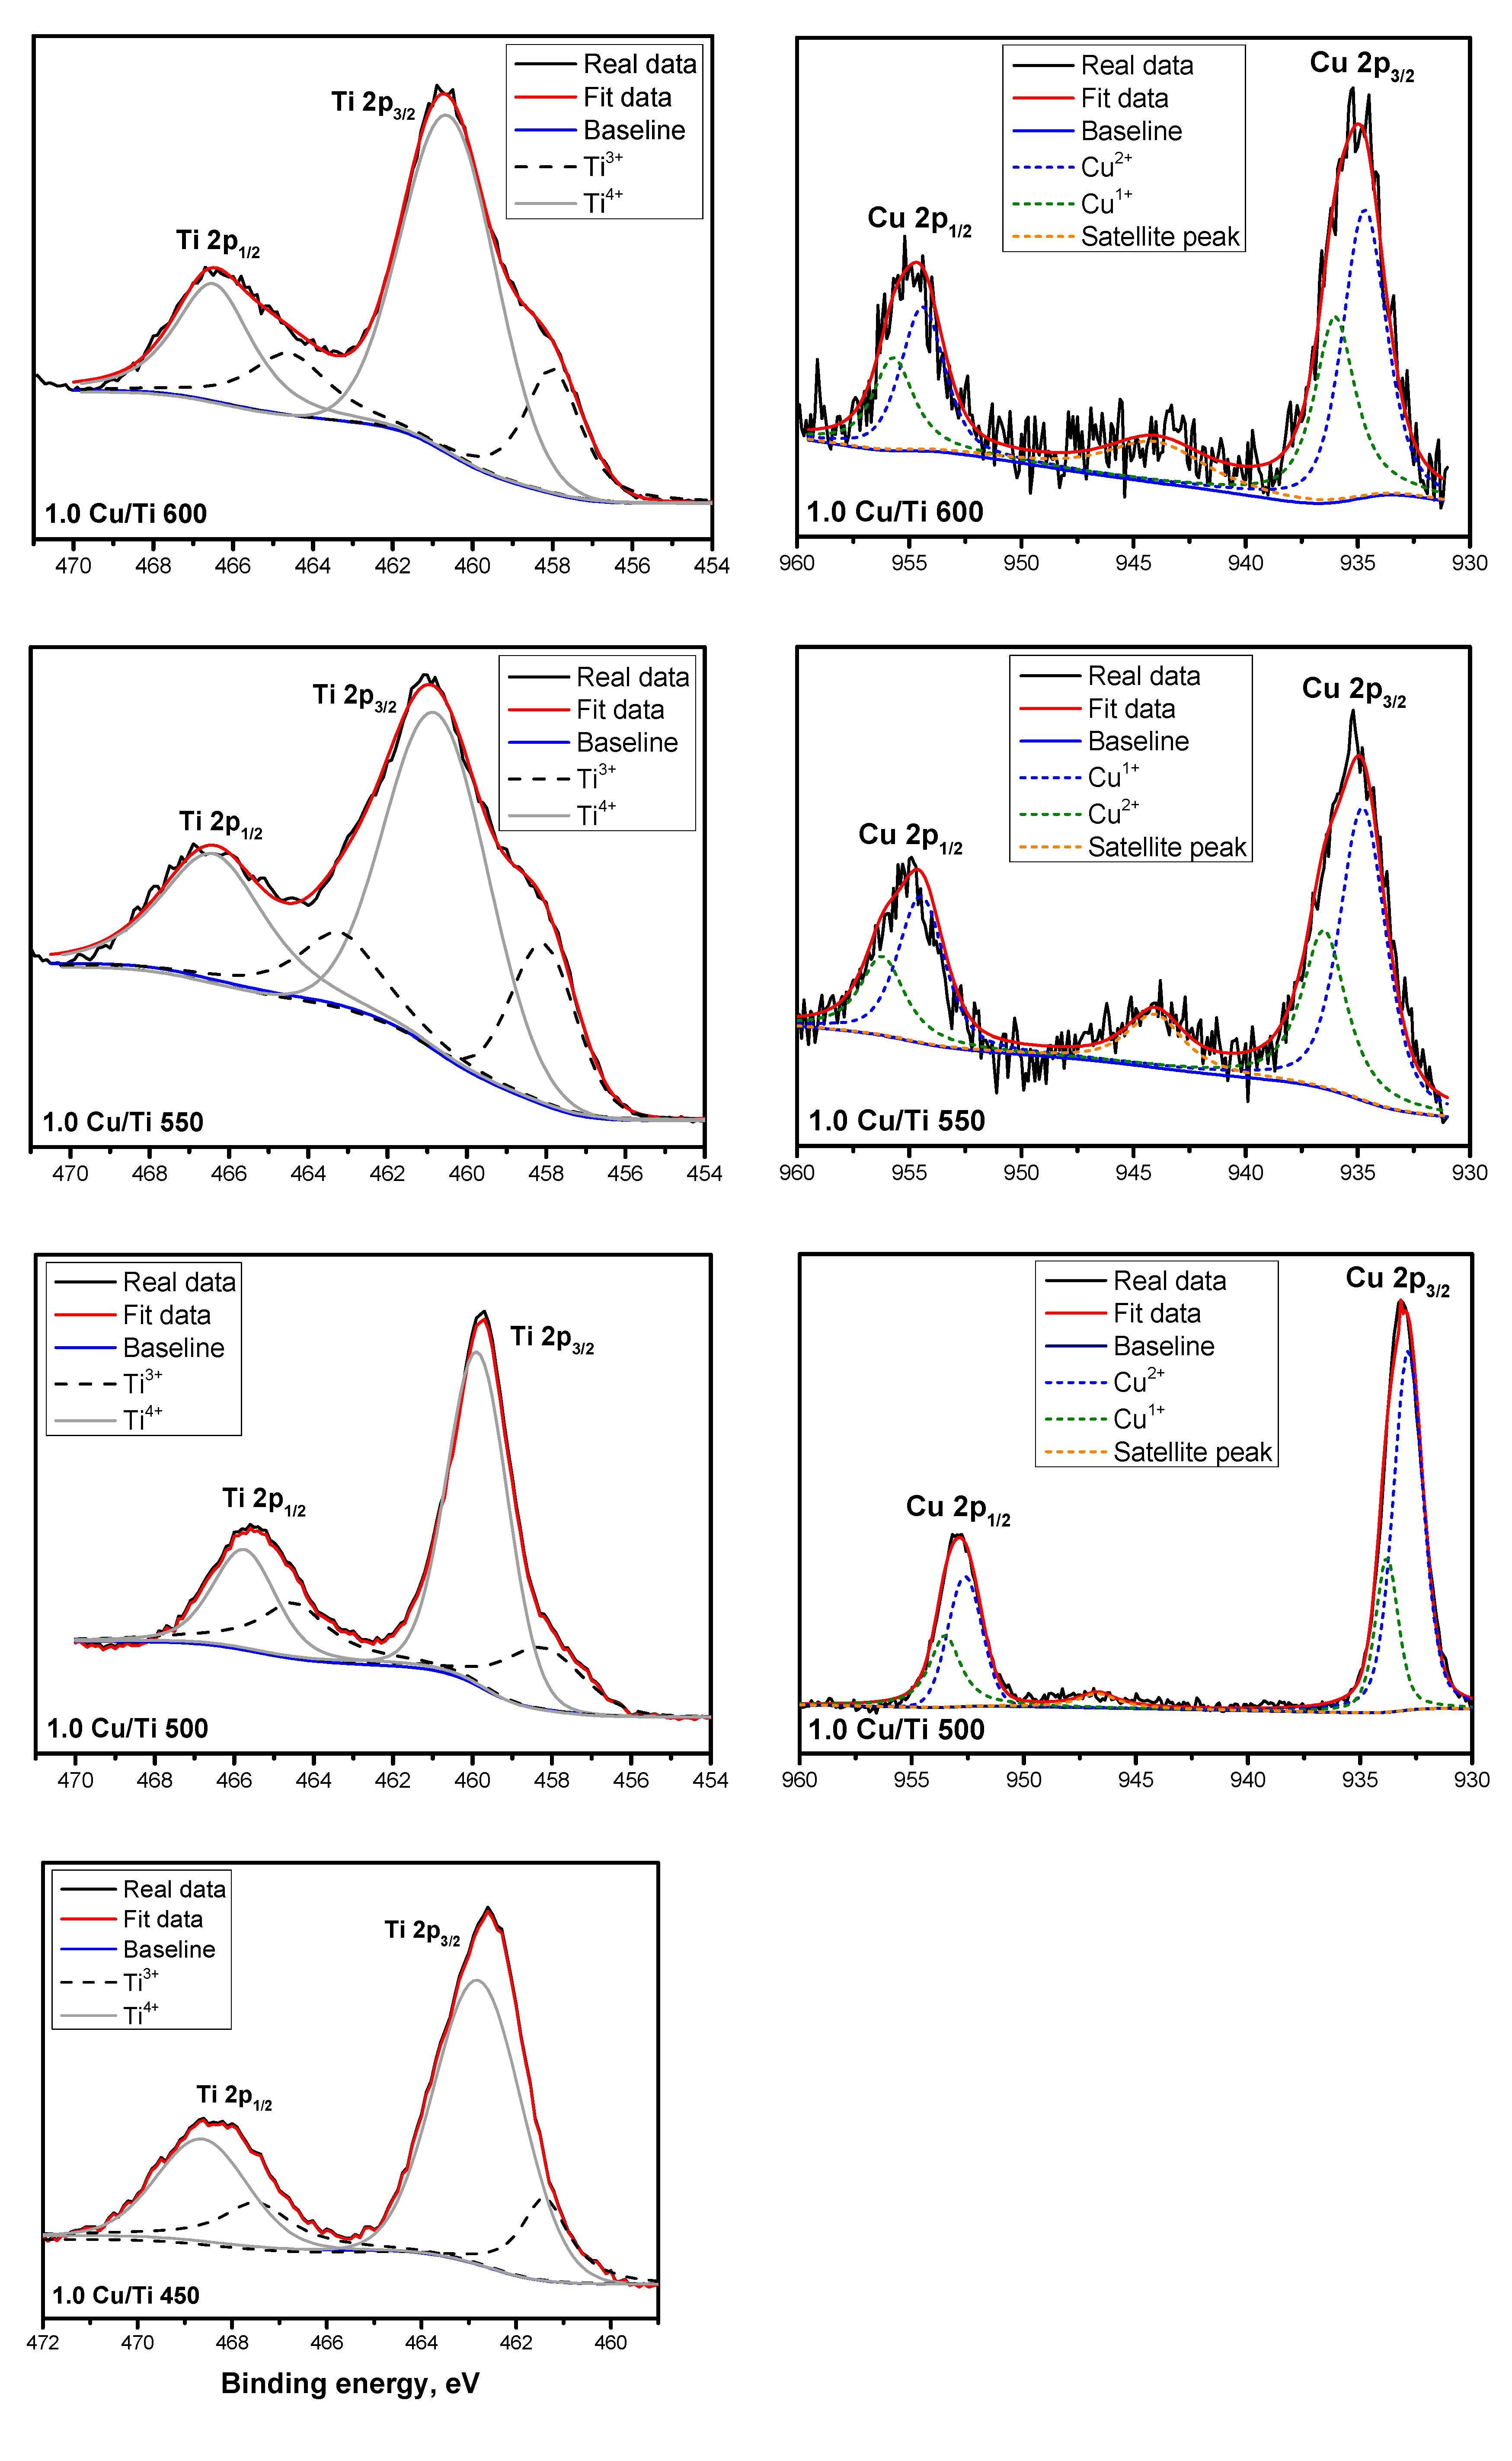
2.1.5. Oxidation States of the Cu/Ti Surface by XPS

The XPS measurements are shown in Figure 5. The plots on the left correspond to the photoelectronic splitting of Ti 2p1/2 and Ti 2p3/2 located at around 466 and 460 eV, respectively [26]. Simultaneously, a shift towards lower binding energies could be detected as the temperature increased. This shift is related to the surface and structural changes caused by the thermal treatment and copper loading.
According to the Ti4+/Ti3+ rates, the percentage of Ti4+ diminished as the temperature and copper loading increased, see Table 2. At the same time, the Ti3+ rate increased as the temperature increased. For example, for the 1.0 Cu/Ti 450 catalyst, the Ti4+/Ti3+ ratio is 8.1 while for the 1.0 Cu/Ti 600 photocatalyst, it is equal to 2.0, indicating a Ti3+ percentage of 33. The presence of Ti3+ is an evidence of the copper doped TiO2 lattice. With a high copper load of 5 wt.%, almost the same Ti4+/Ti3+ ratio was found, which means that 1 wt.% was the highest copper concentration for doping the titania lattice; the rest of the copper was located on the TiO2 surface, forming the corresponding copper oxides, CuO and Cu2O, information that was corroborated by X-ray diffraction.
According to the information in the plots on the right, the presence of three bands is evident, which are associated with the photoelectronic splitting of Cu 2p3/2 and Cu 2p1/2 located at around 933 and 953 eV, respectively. The third band corresponds to a shake-up satellite of the Cu 2p3/2 line located at around 944 eV. This last band is related to the open 3d9 shell configurations in the Cu state [27,28,29,30].
The calcination temperature exerts an important effect on the copper species rate. According to the deconvoluted spectra, the presence of Cu1+ and Cu2+ species can be seen, which are related to Cu2O and CuO oxides. Then, when the calcination temperature increases, the Cu+/Cu2+ rate decreases, see intensities in Figure 5 on the right. When the copper content increases, this rate decreases significantly. Therefore, at low copper loads (1 wt.%) and low calcination temperature (500 °C), the formation of Cu2O on the TiO2 surface is guaranteed.
Specifically, Cu2O is a simple metal oxide semiconductor with low band-gap energy. As shown by an energy correlation between the band-gap model of Cu2O and redox potentials of relevant electrode reactions in an aqueous solution at pH 7, the conduction and valence band edges of Cu2O, which are separated by band-gap energy values from 2.0 to 2.2 eV, seem to be available for the reduction and oxidation of water, respectively [31]. Therefore, the presence of Cu2O in the Cu/Ti photocatalysts represents an advantage during the photocatalytic hydrogen production.

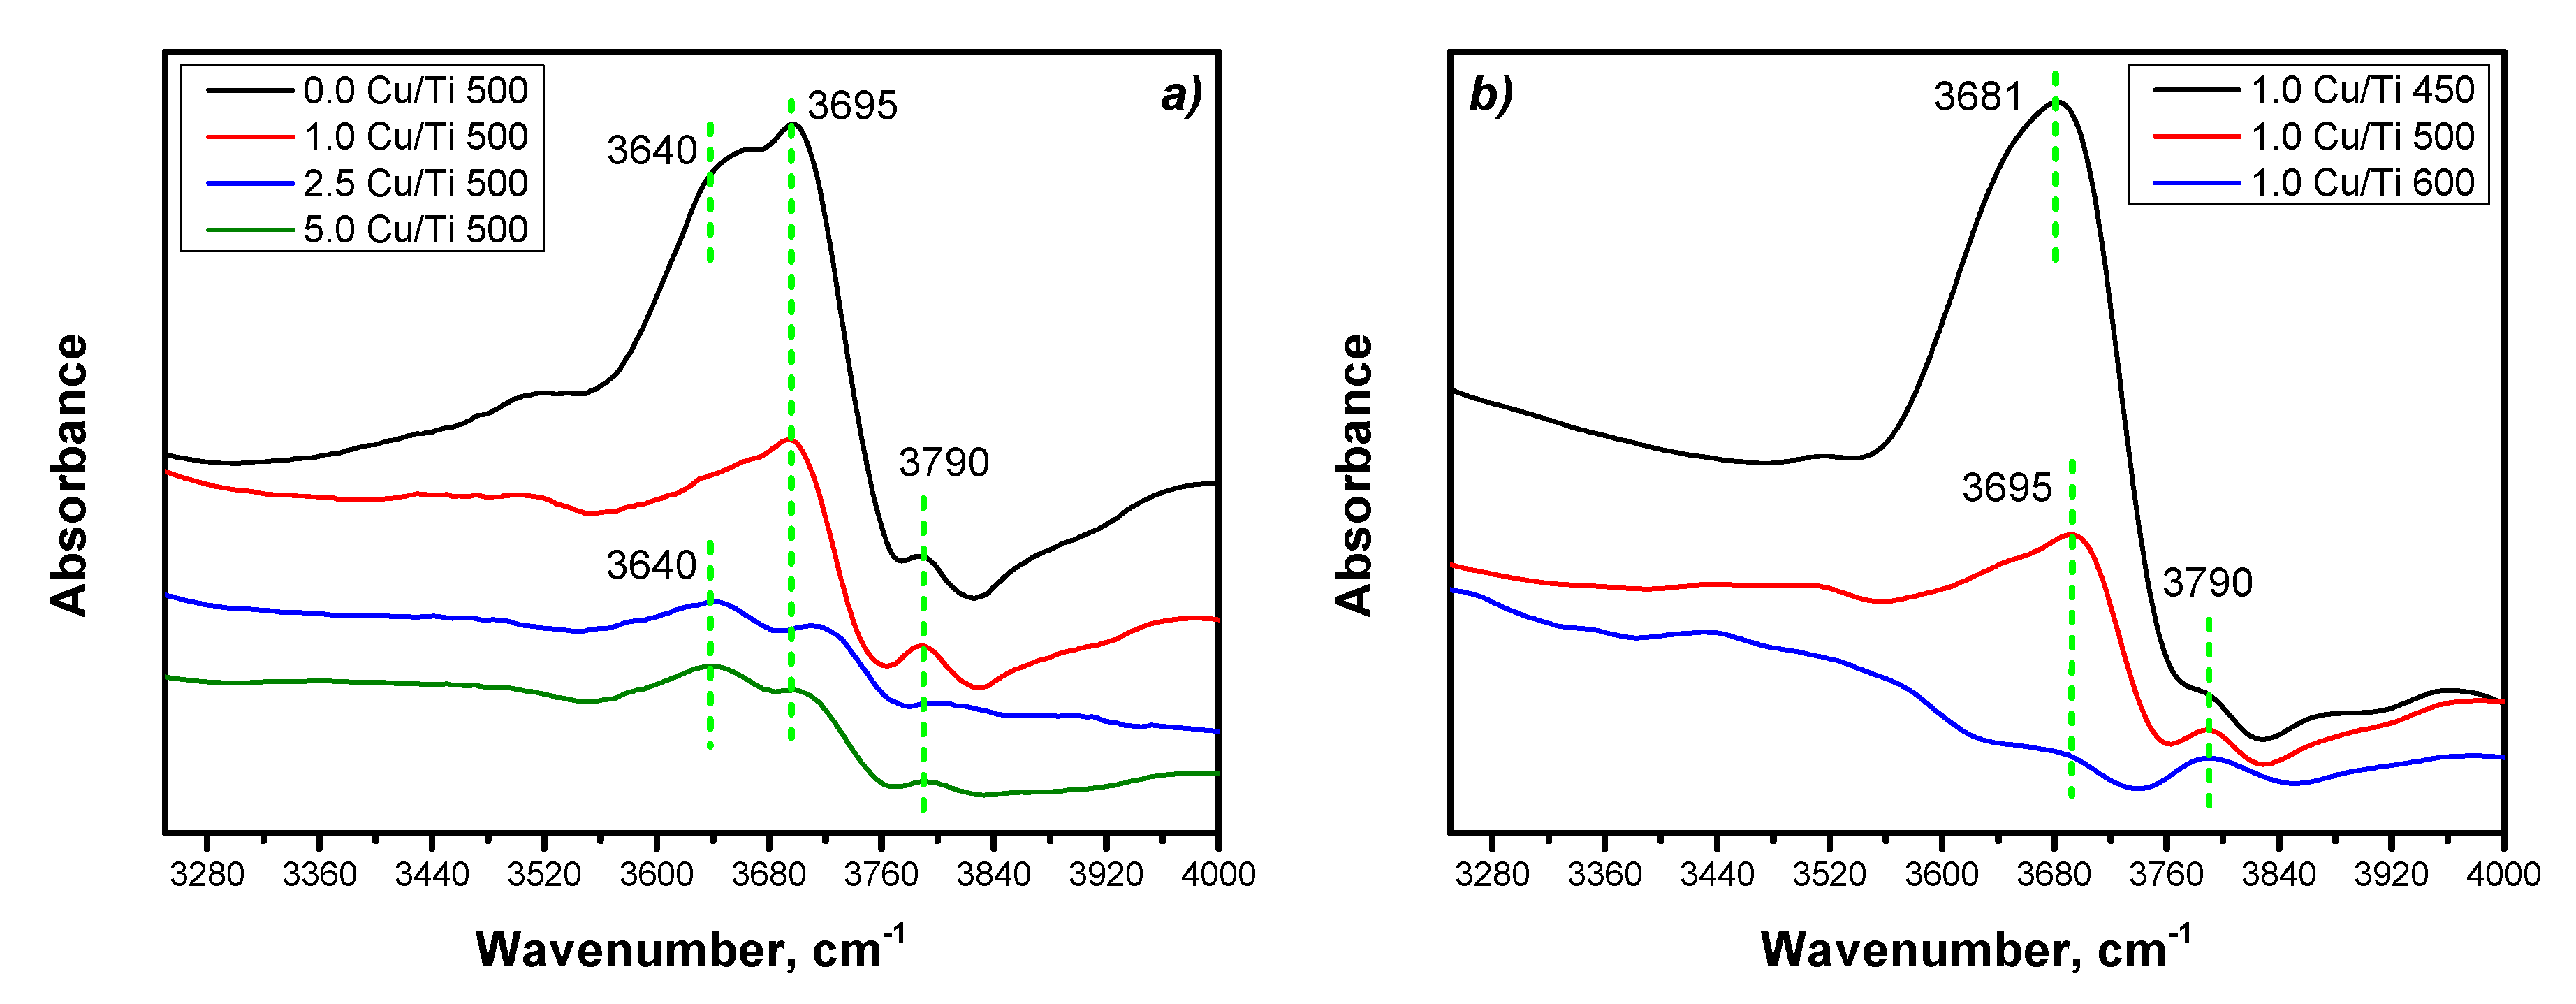
2.1.6. Surface OH Groups

Figure 6 displays the hydroxyl information of the Cu/Ti photocatalysts. It is important to mention that all the spectra were recorded at 600 °C. Figure 6a shows the spectra corresponding to the photocatalysts with different copper loadings. In this graph, three bands are detected: one is located at 3640, the other at 3695 and the last one at 3790 cm−1. On the other hand, Figure 6b reports the behavior of the 1.0 Cu/Ti photocatalyst thermally treated at 450, 500 and 600 °C, where three bands located at 3681, 3695 and 3970 cm−1 are also detected.
The bands located at 3640, 3681 and 3695 cm−1 are assigned to hydrogen bound to adjacent OH groups in terminal positions due to the stretching modes of Ti-OH, while the band located at 3790 cm−1 is assigned to the vibrational mode of isolated/terminal OH groups on Ti4+ centers [32,33].
In comparison, at different copper contents, the intensity of the bands at around 3640 and 3695 cm−1 indicate the probable presence of more OH groups on the TiO2 surface than the undoped Cu/Ti photocatalyst, followed by the 1.0 Cu/Ti 500 photocatalyst; see Figure 6a. On the other hands, at the different calcination temperatures, the 1.0 Cu/Ti 450 catalyst showed the highest number of OH surface groups, followed by the 1.0 Cu/Ti 500 photocatalyst.
The low OH concentration in the 1.0 Cu/Ti 500 sample is due to the copper bound to OH functional groups in the TiO2 structure. Therefore, at higher copper loadings, the OH intensity decreases while for a higher temperature treatment, a lower OH concentration is found on the TiO2 surface. For this reason, the 1.0 Cu/Ti 500 sample has the optimal number of OH groups necessary to carry out the water-splitting reaction. The way that OH interacts during the hydrogen production is through the titanol groups present on the TiO2 surface. These groups are responsible for oxidizing the organic or inorganic sacrificial agents, which in turn are responsible for enhancing the production of hydrogen [34].

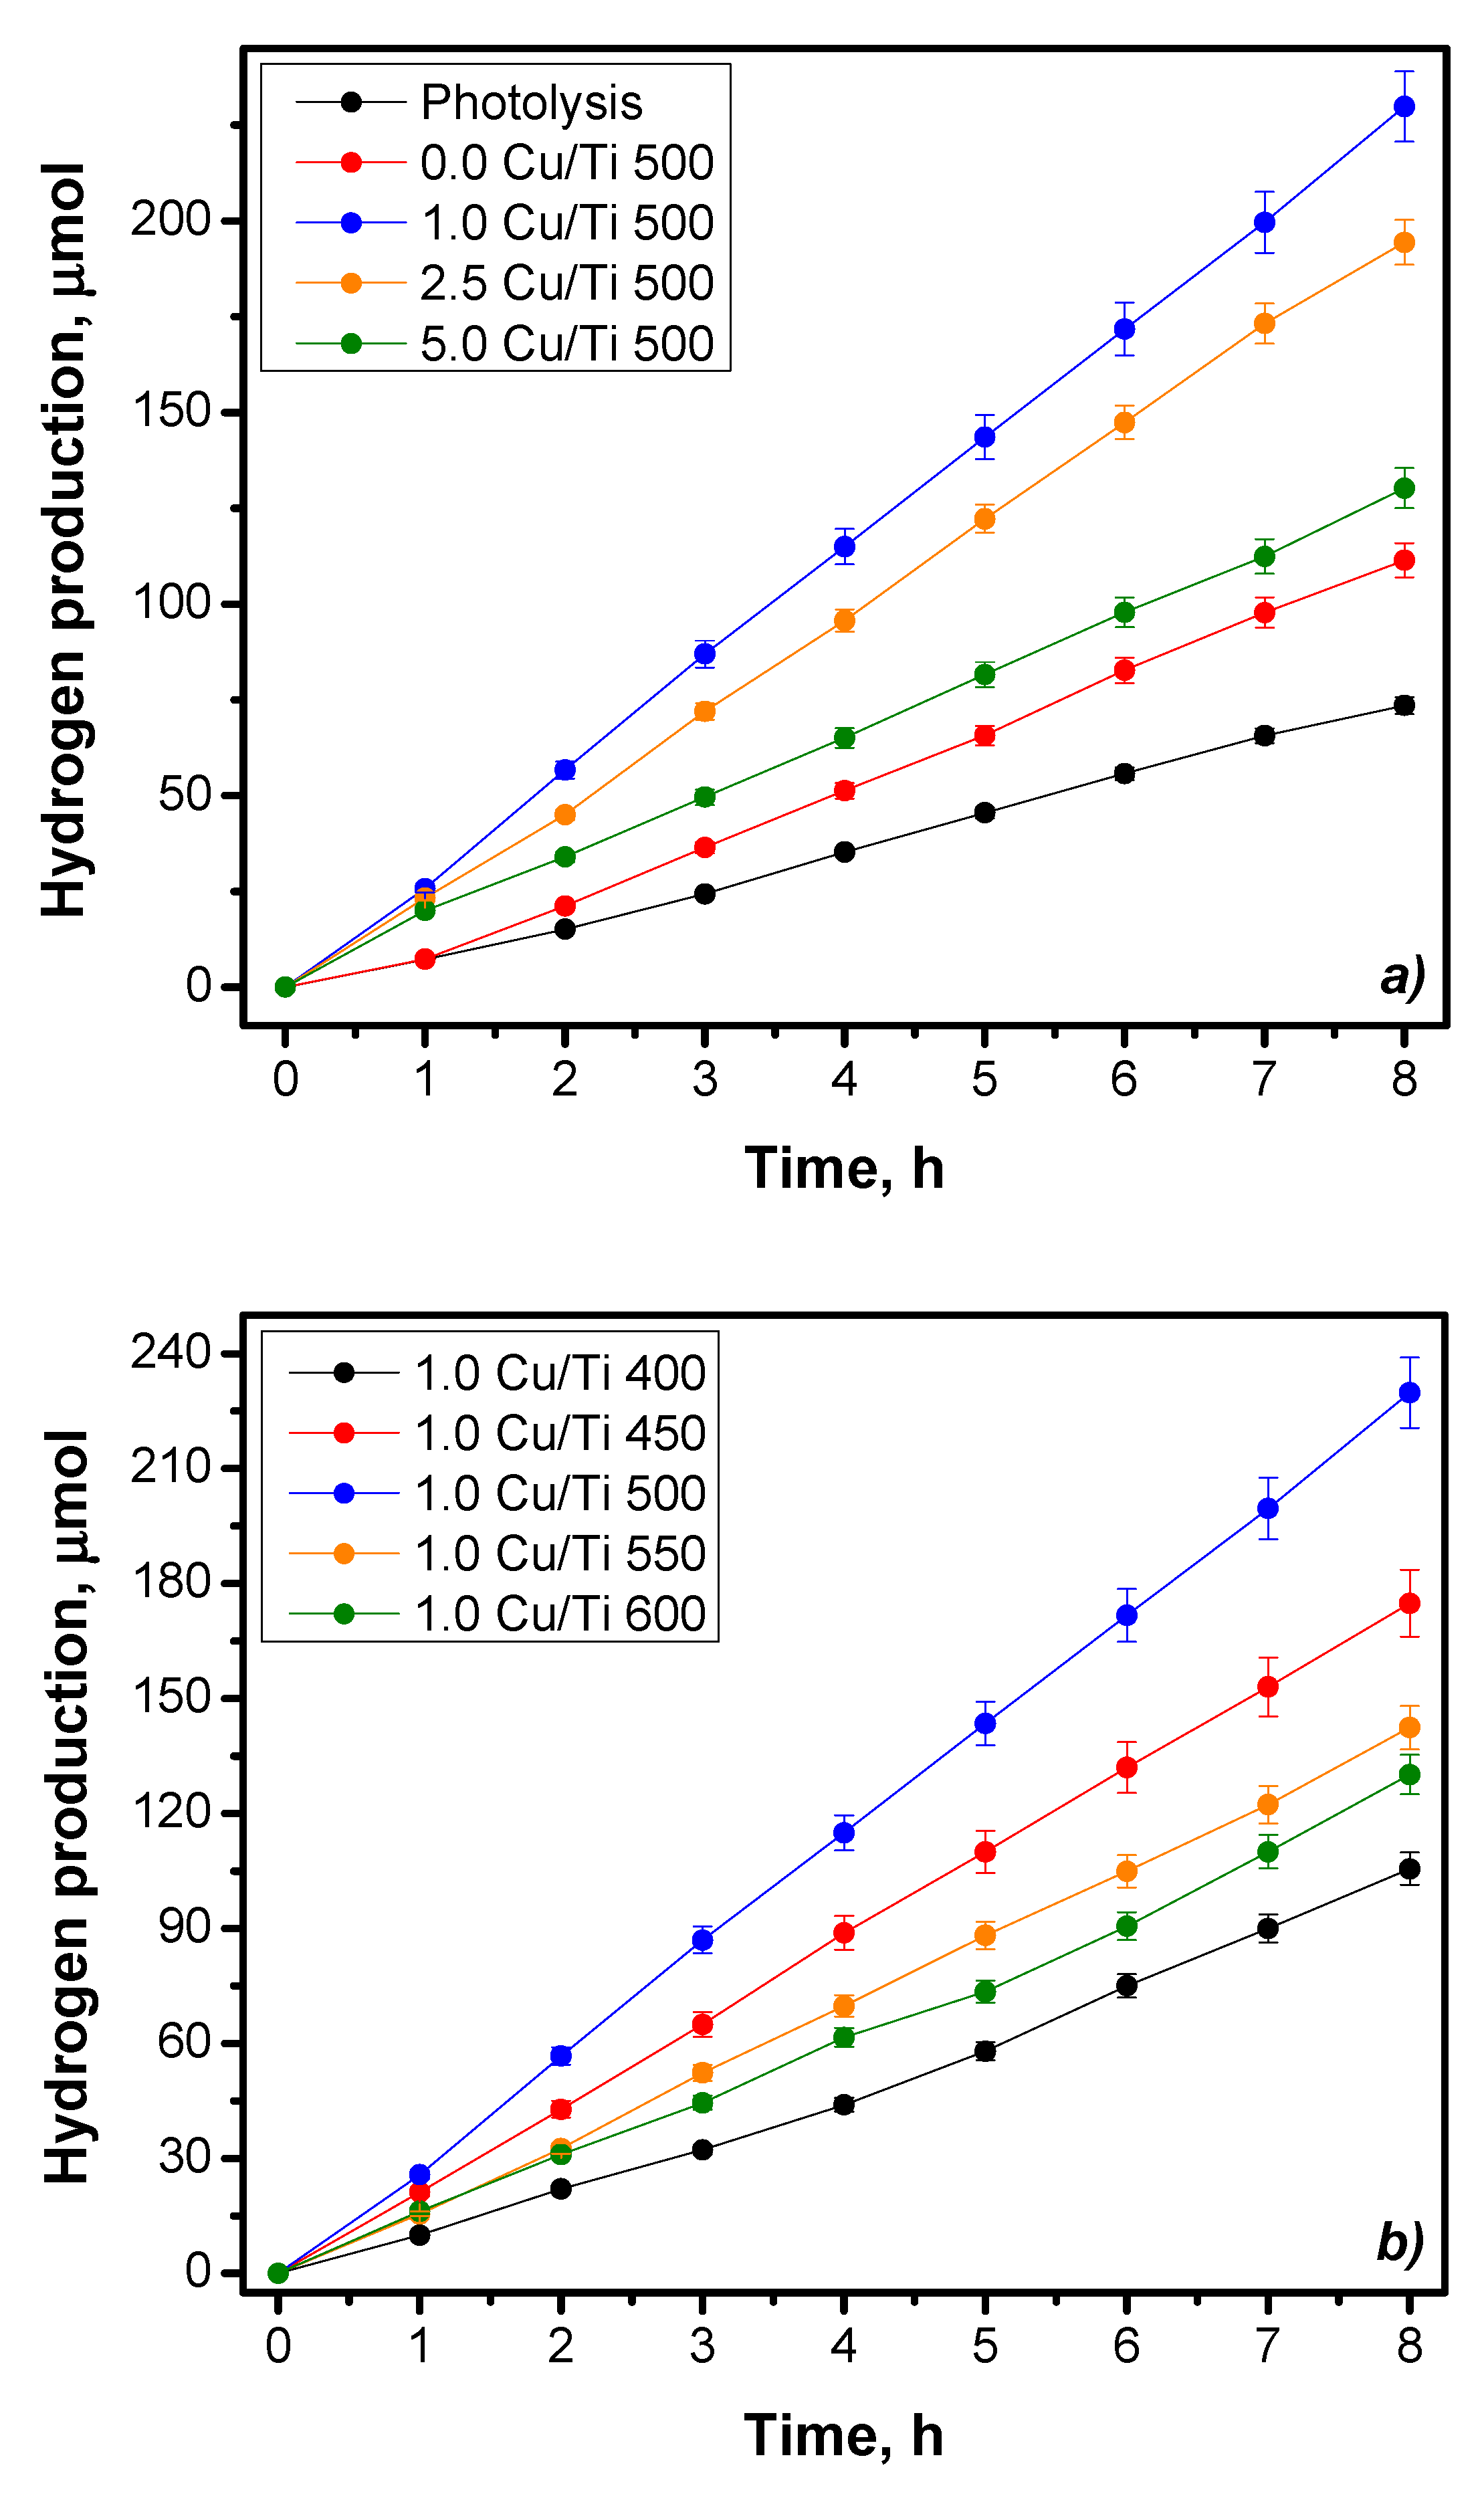
2.2. Photocatalytic Performance

The previously characterized copper photocatalysts, thermally treated at 500 °C, were evaluated during the water-splitting reaction and the results are shown in Figure 7a. Comparatively, the hydrogen amount produced by the simple photolysis is 9.1 µmol h−1 while the bare TiO2 shows a slight increment with a hydrogen production of 13.9 µmol h−1. There was a remarkable enhancement during this reaction with the use of copper photocatalysts, showing that copper concentrations of 1.0, 2.5, and 5.0 wt.% have a hydrogen production of 28.9, 24.3 and 16.3 µmol h−1, respectively. The best behavior was displayed by the 1.0 Cu/Ti 500 photocatalyst with an overall hydrogen production three times higher than that obtained with photolysis. As the copper concentration increases, the hydrogen production decreases. This behavior is directly related to the copper oxides present in the photocatalysts. According to XRD information, the 1.0 Cu/Ti material treated at 500 °C starts showing the presence of copper oxides, which is in good agreement with XPS data with the highest Cu1+/Cu2+ ratio of 2.3.
Figure 7b shows the behavior of the 1.0 Cu/Ti photocatalyst thermally treated at different temperatures (from 400 to 600 °C). The 1.0 Cu/Ti catalyst was selected due to the highest hydrogen production in comparison to other copper photocatalysts. According to the scanning of temperatures, the thermal treatment that showed the best behavior occurred at 500 °C, while higher or lower temperatures show a decrease during the hydrogen production. The 1.0 Cu/Ti 500 sample with a full hydrogen production of 28.9 µmol h−1 was followed by the samples treated at 450, 550, 600, and 400 °C with hydrogen production rates of 21.9, 17.8, 16.3, and 13.2 µmol h−1, respectively.
In both cases, the highest hydrogen production was reached by the 1.0 Cu/Ti 500 photocatalyst, which was due to its copper loading and, at this calcination temperature, the highest Cu2O and Ti3+ formation was found; consequently, the optimal brookite concentration and number of OH groups were obtained. All these factors are responsible for enhancing the hydrogen production, which is due to a possible heterojunction, where the conduction band of the Cu2O semiconductor donates electronic density to brookite particles, and the anatase particles receive these electrons to allow the reduction of H+ to H2.
To clarify this situation, Table 3 shows a summary of the copper species ratio and produced hydrogen. The amount of Cu1+ and corresponding produced H2 are clearly displayed. The 1.0 Cu/Ti 500 catalyst displayed the highest Cu1+ proportion in comparison to the other materials that were analyzed by the XPS technique. At this copper content, the highest hydrogen production of 231.1 µmol for a Cu1+ of 71% was found. For the rest of the materials, both the proportion of Cu1+ and hydrogen production decreased.
Finally, a stability test was carried out to corroborate the behavior of the 1.0 Cu/Ti 500 photocatalyst in the same water–hydrazine solution; see Figure 8. Three cycles were carried out showing a production of 28.91, 31.84, and 30.33 µmol h−1 for each cycle after 8 h of reaction. This experiment confirmed a constant hydrogen production with the same water–hydrazine solution. According to our previous work [15], hydrazine catalyzed the reaction and, at the same time, enhanced the hydrogen production. Hydrazine as an oxygen scavenger drives the hydrogen production from water, and its reaction profits gradually, removing dissolved oxygen from the aqueous environment at room temperature, in synergy with the Cu species, e.g., 4CuO + N2H4 → 2Cu2O + 2H2O + N2. According to the problematic of the wastewater contaminated with space fuels, the technology showed in this work represents an alternative to reduce the hydrazine residues in wastewater to be transformed into an energy source producing hydrogen, and should be extended to other reductive contaminants found in wastewater. These materials are also cost-effective catalysts due to the use of copper, which is as effective as expensive transition metals, see Table S1.

3. Experimental Section

3.1. Synthesis of Cu/Ti Nanostructures from Sol–Gel TiO2

Sol-gel-TiO2-Cu photocatalysts were prepared by means of a controlled sol-gel process using titanium (IV) isopropoxide (Sigma-Aldrich, 97%, St. Louis, MO, USA) as a titanium precursor and copper nitrate trihydrate (II) (Sigma-Aldrich, 98%) as a copper precursor (doping agent). Ethanol (Le Cap Group, 96%, St. Louis, MO, USA) and distilled water were used as solvents. According to a reported sol-gel synthesis, an appropriate amount of nitrate salt was dissolved in water to obtain 1.0, 2.5, and 5.0 wt.% of copper. The Cu/Ti catalysts were prepared by adding dropwise 75.6 mL of titanium isopropoxide to an ethanol (22.9 mL)-water (18 mL) solution to which the copper precursor solution was added; the mixture was poured into a 4-neck-round-bottom flask (1 L) equipped with a magnetic stirrer and thermometer. The alkoxide/ethanol/water molar ratio was 1/3/8. Later on, the solution was vigorously stirred at 50 °C during the addition of the reagents. Subsequently, the solution was gradually heated up to 70 °C. The gelled product was aged for 48 h at 70 °C. The solvents and unreacted precursors were slowly removed at 80 °C and dried overnight under vacuum at 100 °C. Finally, the materials were thermally treated at different temperatures within an interval ranging from 400 to 600 °C for 4 h at a rate of 2 °C min−1 [13]. The samples were identified as X-Cu/Ti-Y, where X represents the copper load (wt.%) and Y the calcination temperature.

3.2. Characterization Techniques

The calcined samples were characterized by X-ray diffraction using an X-ray diffractometer SmartLab RIGAKU (Tokyo, Japan) with CuKα radiation (1.5404 Å).
Diffuse reflectance UV–vis spectra of the photocatalysts were obtained using a Cary 5000 (UV-vis-NIR) spectrophotometer (Santa Clara, CA, USA); Spectralon teflon (from Agilent, Santa Clara, CA, USA) was used as a reference blank and the band-gap energy was determined by the linearization of the slope according to Eg = (1239 × m)/(−b). when the absorbance results were equal to zero. The physical adsorption of N2 at −196 °C was carried out using a Quantachrome Nova 3200e soptometer (Boynton Beach, FL, USA) on previously out-gassed samples at 150 °C. The Brunauer–Emmett–Teller (BET) method was used to calculate the specific surface area. Temperature-programmed reduction was performed in a ChemBET TPR/TPD chemisorption analyzer within a temperature interval ranging from room temperature to 600 °C with a rate of 10 °C/min and flow of 30 mL min−1 of H2 (10%)/Ar gas. A wavelength dispersive X-ray fluorescence (WDXRF) spectrometer Rigaku ZSX Primus II model (Tokyo, Japan) (rhodium X-ray tube; 4 kW maximum power), equipped with an automatic sampler for 12 pellets was used for a quantitative copper content in all the Cu/Ti photocatalysts. SEM images were obtained in a Dual Beam Field Emission Scanning Electronic Microscopy (FESEM): FEI Nanolab 600 (Lake City, UT, USA). TEM image was obtained in a Tecnai FEI 300 transmission electron microscope (Waltham, MA, USA) operated at 300 kV. XPS was performed with an XPS Multiab 2000 system (Waltham, MA, USA) with an X-ray AlKα (1486.6 eV) source operated at 15 Kv and 1 mA, 400 W and 1 ma. The binding energy was determined by using carbon C (1 s) as a reference line (284.6 eV). Peak fitting was done by using the XPS fitting program XPSPEAK 41 with Shirley background.

3.3. DRIFTS and In-Situ UV-Vis Characterization

FTIR spectra were obtained using a Shimadzu IRTracer-100 spectrophotometer (Tokyo, Japan) equipped with a Praying Mantis for DRIFT spectroscopy and a low/high temperature reaction chamber by Harrick. In each experiment, approximately 25 mg of dried sample were packed in the sample holder. The experiment was carried out from room temperature under constant N2 flow (30 mL/min), and a spectrum was recorded at room temperature and afterward, every 100 °C until reaching 600 °C.
Diffuse reflectance UV–vis spectra of the catalysts were obtained using a CARY 5000 (UV-VIS-NIR) spectrophotometer (Santa Clara, CA, USA) equipped with a Praying Mantis and a high temperature reaction chamber (Harrick). The spectra were recorded during the activation thermal treatment. In each experiment, approximately 25 mg of the dried sample were packed in the sample holder under constant nitrogen flow (30 mL min−1). A Teflon spectrum (Aldrich Company, Santa Clara, CA, USA) was used as a reference. From 25 °C and every 50 °C, spectra were taken until reaching 600 °C.

3.4. Water Splitting Test

The photocatalytic activity of the Cu/Ti materials was evaluated in a home-made cylindrical glass reactor with an inner quartz tube equipped with a UV pen-ray Hg lamp (λ = 254 nm, I0 = 4400 microwatts/cm2). This glass reactor had a full operation volume of 250 mL and the scavenger solution consisted of water–hydrazine hydrate (199.5:0.5 mL, 99.93 vol.% of H2O). Hydrazine hydrate was purchased from Fluka (Rupert-Mayer-Str, Munich, Germany) (24–26%). The optimal hydrazine concentration was taken from previous experiments [35]. In all the experiments, 50 mg of photocatalyst powder were used and the suspension was stirred for 20 min while it was purged with nitrogen to remove the dissolved oxygen from the solution. Once natural oxygen dissolved was removed, the reactor system was sealed, and the UV lamp was turned on. Hydrogen determination was done every hour for 8 h in a Gas Chromatograph by Thermo Scientific with thermal conductivity detector (Waltham, MA, USA) and TracePLOT TG-BOND Msieve 5A Thermo Scientific column (Waltham, MA, USA). The system was calibrated previously in order to quantify the hydrogen production.
For the stability test, three cycles of 8 h each were carried out for the most active photocatalyst (1.0 Ti-Cu), which was calcined at 500 °C. After running the experiments, the UV lamp was turned off, the produced hydrogen was released, and the reaction system was purged with nitrogen until the hydrogen chromatographic signal was zero. Then, the reactor system was sealed, and the lamp was turned on again to start the next cycle, and so on until the third cycle was completed.

4. Conclusions

By means of Cu/TiO2 nanostructures and hydrazine as a scavenging agent, an alternative method to produce hydrogen from polluted water is presented. According to the obtained results, there is a narrow correlation between the physicochemical properties of the Cu/Ti catalysts and photocatalytically produced hydrogen. The copper loading and the thermal treatment temperature play an important role, leading to an optimal brookite/anatase and Cu1+/Cu2+ ratio of 2.3. The OH groups elucidated by FTIR spectroscopy generate the titanol groups that were responsible for oxidizing the hydrazine and reducing the H+ to H2. Simultaneously, a synergistic effect occurred due to the conduction band position of the semiconductor, and Cu2O donated electronic density to brookite particles, and the anatase particles received these electrons to allow the reduction of H+ to H2. The 1.0 Cu/Ti 500 catalyst annealed at 500 °C with 1 wt.% Cu featured the highest hydrogen production. At the same time, the stability of this kind of copper materials for at least three continuous cycles represents an alternative means to produce hydrogen from an environmentally sustainable point of view, because hydrazine represents a hazardous chemical that is found in wastewater due to its wide use as a space fuel. These materials are also cost-effective catalysts due to the use of copper, which is as effective as expensive transition metals, see Table S1.

Supplementary Materials

The following are available online at https://www.mdpi.com/2073-4344/11/1/74/s1, Figure S1: Adsorption—desorption nitrogen isotherms of (a) different copper loading Cu/Ti calcined at 500 °C, (b) 1.0 Cu/Ti calcined at different temperatures, Figure S2: UV-Vis spectra of (a) different copper loading Cu/Ti calcined at 500 °C, (b) 1.0 Cu/Ti calcined at different temperatures, Table S1: Some comparative examples of hydrogen production from current literature using several transition metals.

Author Contributions

M.H.R.: Experimental development, writing—original draft preparation, formal analysis. R.C.: XPS interpretation, formal analysis, writing—review editing. V.R.G.: Review & Editing, Supervision, project administration, funding acquisition. All authors have read and agreed to the published version of the manuscript.

Funding

This study was partly supported by MEXT Promotion of Distinctive Joint Research Center Program Grant Number JPMXP0618217662.

Acknowledgments

The authors would like to thank CONACYT-CB-2011/169597, Infra-2014/225945 projects. We also thank the LINAN and LAMBAMA for the provided equipment and infrastructure. We wish to acknowledge B. A. Rivera Escoto, G. Labrada Delgado and Ma. Carmen Rocha Medina for their valuable technical support.

Conflicts of Interest

The authors declare that there is no conflict of interest. There is not a competing financial interest nor personal relationships that could have appeared to influence the work reported in this paper.

References

  1. Fujishima, A.; Honda, K. Electrochemical photolysis of water at a semiconductor electrode. Nature 1972, 238, 37–38. [Google Scholar] [CrossRef] [PubMed]
  2. Kudo, A.; Miseki, Y. Heterogeneous photocatalyst materials for water splitting. Chem. Soc. Rev. 2009, 38, 253–278. [Google Scholar] [CrossRef] [PubMed]
  3. Daskalaki, V.M.; Panagiotopoulou, P.; Kondarides, D.I. Production of peroxide species in Pt/TiO2 suspensions under conditions of photocatalytic water splitting and glycerol photoreforming. Chem. Eng. J. 2011, 170, 433–439. [Google Scholar] [CrossRef]
  4. Kumaravel, V.; Imam, M.D.; Badreldin, A.; Chava, R.K.; Do, J.Y.; Kang, M.; Abdel-Wahab, A. Photocatalytic Hydrogen Production: Role of Sacrificial Reagents on the Activity of Oxide, Carbon, and Sulfide Catalysts. Catalysts 2019, 9, 276. [Google Scholar] [CrossRef] [Green Version]
  5. Li, Y.; Lu, G.; Li, S. Photocatalytic hydrogen generation and decomposition of oxalic acid over platinized TiO2. Appl. Catal. A 2001, 214, 179–185. [Google Scholar] [CrossRef]
  6. Li, Y.; Xie, Y.; Peng, S.; Lu, G.; Li, S. Photocatalytic hydrogen generation in the presence of chloroacetic acids over Pt/TiO2. Chemosphere 2006, 63, 1312–1318. [Google Scholar] [CrossRef]
  7. Li, Y.; Wang, J.; Peng, S.; Lu, G.; Li, S. Photocatalytic hydrogen generation in the presence of glucose over ZnS-coated ZnIn2S4 under visible light irradiation. Int. J. Hydrog. Energy 2010, 35, 7116–7126. [Google Scholar] [CrossRef]
  8. Schneider, J.T.; Firak, D.S.; Ribeiro, R.R.; Peralta-Zamora, P. Use of scavenger agents in heterogeneous photocatalysis: Truths, half-truths, and misinterpretations. Phys. Chem. Chem. Phys. 2020, 22, 15723–15733. [Google Scholar] [CrossRef]
  9. Durán-Pérez, J.F.; García-Martínez, J.C.; Puebla-Núñez, H.; González-Brambila, M.M.; Colín-Luna, J.A. Kinetic Model of Photocatalytic Hydrogen Production Employing a Hole Scavenger. Chem. Eng. Technol. 2019, 42, 874–881. [Google Scholar] [CrossRef]
  10. Tawkaew, S.; Fujishiro, Y.; Yin, S.; Sato, T. Synthesis of cadmium sulfide pillared layered compounds and photocatalytic reduction of nitrate under visible light irradiation. Colloids Surf. A 2001, 179, 139–144. [Google Scholar] [CrossRef]
  11. Nwankwoala, A.U.; Egiebor, N.O.; Nyavor, D. Enhanced biodegradation of methylhydrazine and hydrazine contaminated NASA wastewater in fixed-film bioreactor. Biodegradation 2001, 12, 1–10. [Google Scholar] [CrossRef] [PubMed]
  12. Zanella, R.; Delannoy, L.; Louis, C. Mechanism of deposition of gold precursors onto TiO2 during the preparation by cation adsorption and deposition-precipitation with NaOH and urea. Appl. Catal. A 2005, 291, 62–72. [Google Scholar] [CrossRef]
  13. Hinojosa-Reyes, M.; Rodríguez-González, V.; Arriaga, S. Enhancing ethylbenzene vapors degradation in a hybrid system based on photocatalytic oxidation UV/TiO2-In and a biofiltration process. J. Hazard. Mater. 2012, 209–210, 365–371. [Google Scholar] [CrossRef] [PubMed]
  14. Hara, M.; Kondo, T. Cu2O as a photocatalyst for overall water splitting under visible light irradiation. Chem. Commun. 1998, 357–358. [Google Scholar] [CrossRef]
  15. Hinojosa-Reyes, M.; Hernández-Gordillo, A.; Zanella, R.; Rodríguez-González, V. Renewable hydrogen harvest process by hydrazine as scavenging electron donor using gold TiO2 photocatalysts. Catal. Today 2016, 266, 2–8. [Google Scholar] [CrossRef]
  16. Obregón, S.; Lee, S.W.; Rodríguez-González, V. Loading effects of silver nanoparticles on hydrogen photoproduction using a Cu-TiO2 photocatalyst. Mater. Lett. 2016, 173, 174–177. [Google Scholar] [CrossRef]
  17. Irie, H.; Miura, S.; Kamiya, K.; Hashimoto, K. Efficient visible light-sensitive photocatalysts: Grafting Cu(II) ions onto TiO2 and WO3 photocatalysts. Chem. Phys. Lett. 2008, 457, 202–205. [Google Scholar] [CrossRef]
  18. Qiu, X.; Miyauchi, M.; Sunada, K.; Minoshima, M.; Liu, M.; Lu, Y.; Li, D.; Shimodaira, Y.; Hosogi, Y.; Kuroda, Y.; et al. Hybrid CuxO/TiO2 nanocomposites as risk-reduction materials in indoor environments. ACS Nano 2012, 6, 1609–1618. [Google Scholar] [CrossRef]
  19. Zedan, A.F.; Allam, N.K.; AlQaradawi, S.Y. A Study of Low-Temperature CO Oxidation over Mesoporous CuO-TiO2 Nanotube Catalysts. Catalysts 2017, 7, 129. [Google Scholar] [CrossRef] [Green Version]
  20. Kundakovic, L.; Stephanopoulos, M.F. Reduction characteristics of copper oxide in cerium and zirconium oxide systems. Appl. Catal. A 1998, 171, 13–29. [Google Scholar] [CrossRef] [Green Version]
  21. Clavijo-Chaparro, S.L.; Hernández-Gordillo, A.; Camposeco-Solis, R.; Rodríguez-González, V. Water splitting behavior of copper-cerium oxide nanorods and nanocubes using hydrazine as a scavenging agent. J. Mol. Catal. A Chem. 2016, 423, 143–150. [Google Scholar] [CrossRef]
  22. Beutel, T.; Sárkány, J.; Lei, G.D.; Yan, J.Y.; Sachtler, W.M.H. Redox chemistry of Cu/ZSM-5. J. Phys. Chem. 1996, 100, 845–851. [Google Scholar] [CrossRef]
  23. Chen, S.; Zhang, H.; Wu, L.; Zhao, Y.; Huang, C.; Ge, M.; Liu, Z. Controllable synthesis of supported Cu-M (M = Pt, Pd, Ru, Rh) bimetal nanocatalysts and their catalytic performances. J. Mater. Chem. 2012, 22, 9117–9122. [Google Scholar] [CrossRef]
  24. Nagaveni, K.; Hegde, M.S.; Madras, G. Structure and photocatalytic activity of Ti1-xMxOδ (M = W, V, Ce, Zr, Fe and Cu) synthesized by solution combustion method. J. Phys. Chem. B 2004, 108, 20204–20212. [Google Scholar] [CrossRef]
  25. Li, G.; Dimitrijevic, N.M.; Chen, L.; Rajh, T.; Gray, K.A. Role of surface/interfacial Cu2+ sites in the photocatalytic activity of coupled CuO-TiO2 nanocomposites. J. Phys. Chem. C 2008, 112, 19040–19044. [Google Scholar] [CrossRef]
  26. Kim, J.Y.; Rodríguez, J.A.; Hanson, J.C.; Frenkel, A.I.; Lee, P.L. Reduction of CuO and Cu2O with H2: H embedding and kinetic effects in the formation of suboxides. J. Am. Chem. Soc. 2008, 125, 10684–10692. [Google Scholar] [CrossRef]
  27. Lee, H.L.; Flynn, N.T. X-ray Photoelectron Spectroscopy. In Handbook of Applied Solid State Spectroscopy; Vij, D., Ed.; Springer: Boston, MA, USA, 2006. [Google Scholar] [CrossRef]
  28. Perry, D.L.; Taylor, J.A. X-ray photoelectron and Auger spectroscopic studies of Cu2S and CuS. J. Mater. Sci. Lett. 1986, 5, 384–386. [Google Scholar] [CrossRef]
  29. Borgohain, K.; Murase, N.; Mahamuni, S. Synthesis and properties of Cu2O quantum particles. J. Appl. Phys. 2002, 92, 1292–1297. [Google Scholar] [CrossRef]
  30. Ghijsen, J.; Tjeng, L.H.; van Elp, J.; Westerink, E.J.; Sawatzky, G.A.; Czyzyk, M.T. Electronic structure of Cu2O and CuO. Phys. Rev. B 1988, 38, 11322–11330. [Google Scholar] [CrossRef]
  31. Yan, L.; Yang, F.; Tao, C.; Luo, X.; Zhang, L. Highly efficient and stable Cu2O-TiO2 intermediate photocatalytic water splitting. Ceram. Int. 2020, 46, 9455–9463. [Google Scholar] [CrossRef]
  32. Li, G.; Huang, J.; Chen, J.; Deng, Z.; Huang, Q.; Liu, Z.; Guo, W.; Cao, R. Highly Active Photocatalyst of Cu2O/TiO2 Octahedron for Hydrogen Generation. ACS Omega 2019, 4, 3392–3397. [Google Scholar] [CrossRef] [PubMed]
  33. Camposeco, R.; Castillo, S.; Navarrete, J.; Gómez, R. Synthesis, characterization and photocatalytic activity of TiO2 nanostructures: Nanotubes, nanofibers, nanowires and nanoparticles. Catal. Today 2016, 266, 90–101. [Google Scholar] [CrossRef]
  34. Camposeco, R.; Castillo, S.; Mejía-Centeno, I.; Navarrete, J.; Gómez, R. Effect of the Ti/Na molar ratio on the acidity and the structure of TiO2 nanostructures: Nanotubes, nanofibers and nanowires. Mater. Charact. 2014, 90, 113–120. [Google Scholar] [CrossRef]
  35. Park, H.; Vecitis, C.D.; Choi, W.; Weres, O.; Hoffmann, M.R. Solar-powered production of molecular hydrogen from water. J. Phys. Chem. C 2008, 112, 885–889. [Google Scholar] [CrossRef] [Green Version]
Figure 1. X-ray diffractograms of (a) X Cu/Ti 500, and (b) 1.0 Cu/Ti calcined at different temperatures. The insets correspond to the brookite (121) crystallographic plane and copper oxides, respectively.
Catalysts 11 00074 g001
Figure 2. (a) SEM image, (b) TEM image for the 1.0 Cu/Ti 500 photocatalyst.
Catalysts 11 00074 g002
Figure 3. UV-vis -DRS collected spectra for the 1.0 Cu/Ti fresh sample with temperature increasing from 25 to 600 °C.
Catalysts 11 00074 g003
Figure 4. Temperature-programmed reduction of (a) X Cu/Ti and (b) 1.0 Cu/Ti Y photocatalysts.
Catalysts 11 00074 g004
Figure 5. XPS high-resolution spectra over Ti 2p peaks (left) and Cu 2p peaks (right) for the Cu/Ti photocatalysts at different temperatures and copper loadings.
Catalysts 11 00074 g005aCatalysts 11 00074 g005b
Figure 6. FTIR spectra for (a) X Cu/Ti, and (b) 1.0 Cu/Ti Y in the absorption band of hydroxyl species in the 3200–4000 cm−1 region from 25 up to 400 °C.
Catalysts 11 00074 g006
Figure 7. Photocatalytic evaluation during the water-splitting reaction of the (a) X Cu/Ti 500 materials, and (b) 1.0 Cu/Ti calcined at different temperatures.
Catalysts 11 00074 g007
Figure 8. Stability test of the 1.0 Cu/Ti 500 photocatalyst during three continuous cycles in the same water–hydrazine solution.
Catalysts 11 00074 g008
Table 1. Physicochemical properties of the Cu/Ti catalysts.
Crystallite Size (nm) aCrystalline PhasesCopper Content (%)Band Gap (eV)Surface Area (m2/g)
NominalActual b
0.0 Cu/Ti 50017.7A0.00.03.465
1.0 Cu/Ti 50017.5A, B1.00.953.359
2.5 Cu/Ti 50020.0A, B2.52.303.240
5.0 Cu/Ti 50016.2A, B5.04.602.335
1.0 Cu/Ti 4008.2A, B1.00.953.3115
1.0 Cu/Ti 45010.9A, B1.00.953.385
1.0 Cu/Ti 50017.5A, B1.00.953.359
1.0 Cu/Ti 55024.5A, B, CuO, Cu2O1.00.953.241
1.0 Cu/Ti 60039.6A, B, CuO, Cu2O1.00.953.214
a Crystallite size for the anatase crystallographic plane (101); A: Anatase crystalline phase; B: Brookite crystalline phase; b Actual copper content (X-Ray Fluorescence technique).
Table 2. Titanium and copper species ratios of the Cu/Ti photocatalysts.
Ti3+Ti4+Ti4+/Ti3+Cu1+Cu2+Cu1+/Cu2+
1.0 Cu/Ti 45020804.0
1.0 Cu/Ti 50022783.571292.3
1.0 Cu/Ti 55032682.164361.7
1.0 Cu/Ti 60028722.760401.5
5.0 Cu/Ti 50018824.557421.3
Table 3. Proportion of copper species and hydrogen produced after 8 h of reaction.
* Cu1+* Cu2+H2 µmol
1.0 Cu/Ti 450 174.6
1.0 Cu/Ti 5007129231.1
1.0 Cu/Ti 5506436143.0
1.0 Cu/Ti 6006040130.3
5.0 Cu/Ti 5005742100.9
* Cu1+ and Cu2+ ratios obtained by XPS.
Publisher’s Note: MDPI stays neutral with regard to jurisdictional claims in published maps and institutional affiliations.

