Article

Photocatalytic Properties of Core-Shell Structured Wool-TiO2 Hybrid Composite Powders

1
Research Centre for Functional Textile Materials, School of Textile Science and Engineering, Xi’an Polytechnic University, Xi’an 710048, China
2
Key Laboratory of Functional Textile Material and Product (Xi’an Polytechnic University), Ministry of Education, Xi’an 710048, China
3
School of Environmental and Chemical Engineering, Xi′an Polytechnic University, Xi’an 710048, China
4
School of Design, University of Leeds, Leeds LS2 9JT, UK
*
Authors to whom correspondence should be addressed.
Catalysts 2021, 11(1), 12; https://doi.org/10.3390/catal11010012
Submission received: 21 November 2020 / Revised: 19 December 2020 / Accepted: 22 December 2020 / Published: 24 December 2020

Abstract

:
In this study, a special core–shell structured wool-TiO2 (WT) hybrid composite powder also having TiO2 nanoparticles incorporated inside cortical cells was reported. The wool pallets were pulverized from wool fibers using vibration-assisted ball milling technique and the WT powders having mesopores and macropores were produced in hydrothermal process. Experimental results indicated that the infiltrated TiO2 nanoparticles were amorphous structure, while the coated TiO2 nanoparticles were anatase phase structure. The crystallized TiO2 nanoparticles were grafted with wool pallets by the N−Ti4+/S−Ti4+/O−Ti4+ bonds. The BET surface area was measured as 153.5 m2/g and the particle sizes were in the 600–3600 nm and 4000–6500 nm ranges. The main reactive radical species of the WT powders were holes, and •O2, 1O2, and •OH were also involved in the photodegradation of MB dye under visible light irradiation. The experimental parameters for photodegradation of MB dye solution were optimized as follows: 0.25 g/L of WT powders was added in 40 mL of 3 mg/L MB dye solution containing 50 mL/L H2O2, which resulted in the increases of COD value of degraded MB dye solution up to 916.9 mg/L at 120 min. The WT powders could be used for repeatedly photodegradation of both anionic and cationic dyes.

Graphical Abstract

1. Introduction

Wool as abundant natural protein fibers has been applied in a wide range of fields especially textile industry owing to its exceptional physical and chemical properties, such as good texture, moderate strength, high elasticity, strong water absorption, and easy dye-ability [1]. More importantly, wool fibers can be biodegradable in landfill with certain bacteria in the environment. It is worthwhile noting that wool fibers have a complex structure containing amorphous cortex and non-crystalline cuticle layer, which are composed of 18 different amino acids [2]. The α-helices in microfibrils in the cortex are generally held together by intra- and inter-molecular interactions including hydrogen bonds, disulfide bonds (crosslinks) between two cysteine residues, a salt bridge between an arginine residue and a glutamic acid residue [2]. The disulfide bonds between the polypeptide structures form a quaternary structure that yields a protein insoluble in water and displaying extraordinary stability against chemical and physical attack.
To make full use of the high value-added proteinaceous fibers, besides various physical and chemical routes [3], an environmentally benign milling technique [4] has recently received considerable attention because the increased surface area of wool powders can significantly enhance their surface reactivity [5], adsorption capacity [6], and liquid absorbency [7]. It has been demonstrated that the inherent multi-level structures, microstructure, crystallinity, and porosity of wool keratins are maintained after treatment with milling process [8]. The improved active group sites like amino, hydroxyl, and thiol can be used for binding functional molecules. The higher reactivity of wool particles than wool fibers is mainly derived from the disruption of cuticle cells [8]. A number of strategies such as keratin solution, mechanical attrition, and chemical–mechanical techniques, have been developed to produce wool powders. For example, the superfine wool powders were hot-pressed into a complex film using glycerol as the plasticizing agent [9] or chitosan as the chelating agent [10]. The viscose/wool fibers blended with different amounts of superfine wool powders were fabricated using wet spinning method [11]. The mechanical properties, glass transition temperature, and thermal decomposition temperature of poly(propylene carbonate) could be greatly improved when a small content of wool powders was added [12]. Furthermore, the wool powders could be modified with silver nanoprisms via an assembly method at first, and then pressed into disks to enhance the Raman signal of thiram with high sensitivity [13].
Wool fibers are used as the templates to prepare functional materials [14]. The presence of reactive groups in wool powders provides a suitable substrate for immobilizing photocatalytic semiconductor nanomaterials like TiO2 [15] and CdS [16]. It was found in recent studies that wool powders could reduce Au ions to Au nanoparticles in an enhanced reducibility in comparison with wool fibers [17]. This is ascribed to the wool powders having larger surface area and exposure of more active groups such as peptide bonds, side chains of amino acid residues, and disulfide cross-links [17]. In addition, wool powders were used as catalysts for cyclo-addition coupling of CO2 with propylene oxide to generate propylene carbonate, which could be repeatedly used to catalyze coupling of other mono-substituted terminal epoxides with CO2 without apparently losing the activity [18].
It is known that, when titanium dioxide (TiO2) absorbs lights with higher energy than its band-gap, the electrons will be excited from valence band to conduction band in TiO2, and electrons and holes are produced consequently in both conduction band and valence band respectively. The photogenerated electrons and holes react with dissolved oxygen and water to produce reactive radical species adsorbed on the catalyst surface [19]. However, due to its wide band-gap (3.2 eV for anatase), TiO2 cannot be activated to absorb enough energy under visible light irradiation. Hence, different methods like sol–gel [20] and hydrothermal method [21] were employed to narrow the band-gap of TiO2 nanoparticles. For instance, radio frequency plasma, microwave plasma, vacuum-UV light irradiation, and wet chemical techniques were adopted to improve the bondability of TiO2 on wool textiles [22]. By using the coating [23] or sol–gel [24] method, the photocatalytic self-cleaning wool fibers were obtained after being deposited with anatase TiO2 nanoparticles. While TiO2 nanoparticles on the surface of wool fibers acted primarily as UV absorbers on wool in dry conditions rather than as photocatalysts [25], TiO2 modified wool fibers exhibited a remarkable UV-induced photodegradation for methyl orange and the photocatalytic activities could be maintained to a great extent [26]. Moreover, wool fibers were used as the sources of doping species (N, S, and C) to prepare the rutile-type TiO2 photocatalysts for the wastewater treatment of dyeing effluents [27], and the TiO2 modified keratin hydrogel had the photocatalytic activities towards the degradation of trimethoprim [28].
In previous studies [21,29,30,31], we found that the N and S elements on the surfaces of wool keratin could have TiO2 nanoparticles doped to have unique significant photocatalytic effects under visible light irradiation. So, the increases of the contact surface area between TiO2 nanoparticles and wool keratin materials might facilitate the effect of wool doped TiO2 nanoparticles. However, it is very difficult for TiO2 nanoparticles to infiltrate into the substrate of wool fibers to increase the possibility of N- and S- doped TiO2 nanoparticles because of the complex and impermeable structure of wool cuticles.
In this paper, both small wool pallets and ball grinding techniques were used to increase the contact areas between TiO2 nanoparticles and well keratin to increase the possibility of N- and S- doped TiO2 particles. We used the vibration-assisted ball milling method to make wool fibers into wool pallets which avoids the barrier effect of wool cuticles and facilitates the penetration of TiO2 nanoparticles into the microfibrils in the cortex for better doping TiO2 with N and S elements to improve its photocatalytic activity under visible light irradiation. The microstructure of the resultant TiO2 particles incorporated with the wool pallets (wool-TiO2, WT) were examined including morphology, chemical composition, crystal phase, micro-structure, binding state, specific surface area, Zeta potential, particle size; they were characterized using field emission scanning electron microscopy (FESEM), energy dispersive X-ray (EDX) spectroscopy, X-ray diffraction (XRD) spectroscopy, transmission electron microscopy (TEM), X-ray photoelectron spectroscopy (XPS), Brunauer–Emmett–Teller (BET) analyzer, and nanolaser particle size analyzer. The optical properties of these TiO2 modified wool pallets were also characterized by employing UV–vis diffuse reflection spectroscopy (DRS), ultraviolet photoelectron spectroscopy (UPS), and photoluminescence (PL) spectroscopy. The results from this research showed that the core–shell structured WT powders could be used as efficient photocatalysts to degrade repeatedly the organic dyes under visible light irradiation. The high photocatalytic activity of the WT hybrid composites obtained was mainly ascribed to both the morphology change and the exposed reactive groups for TiO2 doping.

2. Results and Discussion

2.1. Examination of Particle Morphologies

The microscopic morphologies of the grinded wool pallets before and after treatment with TBT under hydrothermal condition were observed on a FESEM instrument. The element mapping of the cross-section of WT pallets was conducted on an EDX equipment coupled to the FESEM. The images were shown in Figure 1. It was clear that after 30 min of vibration grinding, the fibrous wools were converted into small flakes without porous structure combined with a few granular substances in the range of sub-micrometer or micrometer sizes. These grinded small wool particles were piled up to form into the wool pallets having larger grain sizes, while still having both increased specific surface area and exposed more active groups [17]. The surfaces of the as-grinded wool pallets were very clean without any attachments (Figure 1a). After hydrothermal treatment with TBT, they were completely covered by a large number of agglomerates dotted with some cracks and pores (Figure 1b). The high-resolution FESEM image indicated that these agglomerates were composed of nano-scaled particles (Figure 1c). The irregular topography [25] and large surface area resulted from pores [32] were helpful for the WT powders to absorb and scatter the incident light. The EDX spectrum of the WT powders confirmed the presence of C, O, N, S, and Ti elements. The atom percentage of the Ti element was 10.53% (Figure 1d). The element mapping images of the cross-section of WT powders suggested that the C, O, N, S, and Ti elements were homogeneously distributed in the whole section (Figure 1e).

2.2. Crystal Structure and Microstructure

The XRD patterns of wool fibers, wool pallets before and after loading TiO2 nanaoparticles, and pure TiO2 nanoparticles were shown in Figure 2a. It was noticed that the typical diffraction peaks at around 2θ = 9.9° and 22.4° for wool keratins did not change when wool fibers were converted into wool pallets. The typical diffraction peaks at 9.9° and 22.4°were associated with α helix structure and β fold structure of wool keratin, indicating the microstructure of wool keratin was not destroyed after being ground into pallets from fibers, but the crystallinity would be changed to some extent [33]. After hydrothermal treatment, a series of diffraction peaks appeared at 2θ = 25.3°, 37.8°, 48.0°, 53.9°, 55.1°, 62.7°, 68.8°, 70.3°, and 75.0° were detected in the WT powders, which corresponded to (101), (004), (200), (105), (211), (204), (116), (220), and (215) reflection planes of anatase phase TiO2 (JCPDS card no. 21-1272) [34]. However, the diffraction peaks of wool keratin disappeared, suggesting the coating of TiO2 nanoparticles on the wool pallets was thick enough to withstand the penetration of the X-rays. The as-synthesized pure TiO2 particles possessed the anatase-type crystalline structure. The average crystalline sizes were calculated to be 10.2 nm for the pure TiO2 particles and 10.8 nm for the WT powders based on Scherrer equation [35].
The TEM images of the cross-section of the WT powders and the corresponding selected area electron diffraction (SAED) patterns were shown in Figure 2b,f. It was seen that the wool pallets were covered by a thick layer of nanoparticle aggregates to form a core–shell structured hybrid composite (Figure 2b). Furthermore, some nanoparticles were found infiltrated into the cortex of wool pallets (Figure 2c). An intimate contact interfacial junction between wool pallets and TiO2 nanoparticles was constructed (Figure 2d), which could provide charge transfer channels for achieving the rapid charge migration, thus possibly enhance the photocatalytic activity of WT hybrid composite powders [36]. The SAED patterns confirmed that the nanoparticles inside the wool pallets were amorphous (Figure 2e), while the nanoparticles outside wool pallets were crystal (Figure 2f). Therefore, we could conclude that the WT pallets obtained in this vibration ground wool-hydrothermal technical route was a hybrid composite having the TiO2-wool-TiO2 core–shell structure.

2.3. Chemical Bonding Formations

The chemical bonding states between wool pallets and TiO2 nanoparticles outside were characterized by XPS analysis technique, as shown in Figure S1. The elemental composition data were summarized in Table S1. The characteristic peaks of C1s, N1s, O1s, and S2p of wool keratin were observed in the XPS survey spectrum of wool pallets (Figure S1a). It was confirmed by TEM observation that there was a thick layer of TiO2 aggregates on the surface of the WT powders. However, besides the Ti element, the elements of C1s, N1s, O1s, and S2p were also found on the XPS survey spectrum of the WT powders. The atomic concentration of Ti was 19.98%, indicating the high loading of TiO2 on wool pallets. Moreover, the presence of C, N, O, and S elements in the WT powders suggested that wool keratin might be partly dissolved and chemically bonded with TiO2 under high-temperature hydrothermal condition. The C1s core-level XPS spectra of wool pallets had no obvious change after being loaded with TiO2 (Figure S1b,f). For the N1s core-level XPS spectra, one new subpeak at the binding energy of 399.32 eV (N-Ti4+/ N-Ti3+) was fitted (Figure S1c,g), which was ascribed to N atoms of wool pallets bonded to Ti of TiO2. In the case of O1s core-level XPS spectra, two new subpeaks at 529.45 eV (O-Ti3+) and 529.47 eV (O-Ti4+) were fitted in the WT powders (Figure S1d,h). It was implied that TiO2 nanoparticles were bonded with wool pallets. With regard to the S2p core-level XPS spectra, one new subpeak at 162.60 eV (S-Ti3+/S-Ti4+) was fitted (Figure S1e,i), which was assigned to the S element of wool pallets bonded to Ti of TiO2. The subpeak at 167.98 eV (or 168.23 eV) was associated to the satellite peak of S2p. The Ti2p peak of the WT powders could be fitted into four subpeaks together with a satellite peak at 471.70 eV (Figure S1j). The subpeaks at 458.63 eV and 464.47 eV corresponded to N-Ti4+/S-Ti4+/O-Ti4+2p3/2 and N-Ti4+/S-Ti4+/O-Ti4+2p1/2, respectively. The space of 5.84 eV between Ti2p3/2 and Ti2p1/2 confirmed that the Ti elements existed in the form of Ti4+ ions [37]. The subpeaks at 458.20 eV and 463.56 eV with a spin-orbital splitting of 5.36 eV were correlated to N-Ti3+/S-Ti3+/O-Ti3+2p3/2 and N-Ti3+/S-Ti3+/O-Ti3+2p1/2, respectively. The XPS spectra of C1s, N1s, O1s, and S2p were in well agreement with the Ti2p XPS spectra in the WT pallets. Importantly, the Ti3+ ions, which acted as the electron trapping sites, were formed in the surface of the WT pallets. The reduction of Ti4+ to Ti3+ions was favorable for the formation of photogenerated electrons [38]. Therefore, the XPS analysis results testified that the crystallized TiO2 nanoparticles were chemically grafted with wool pallets via the N-Ti4+/S-Ti4+/O-Ti4+ bonds.
In addition, the FT-IR spectra of wool fibers and pallets were shown in Figure S1k. After being pulverized into wool pallets from wool fibers, the amide I (C=O stretching), amide II (N-H bending), and amide III (C-N stretching) bands were intensified and shifted from 1630 cm−1,1513 cm−1, and 1232 cm−1 to 1642 cm−1, 1518 cm−1, and 1234 cm−1, respectively. The band at 1074 cm−1 (C-O stretching) increased to 1078 cm−1 and the band at 1042 cm−1 (C-O stretching) was intensified. Hence, more reactive groups of wools would be produced after being grinded into pallets, which might be help for immobilizing of TiO2 nanoparticles on wool pallets in hydrothermal process and could improve the photocatalytic ability of the WT powders.

2.4. Specific Surface Area and Particle Size of the WT Powders

The N2 adsorption–desorption isotherms, pore diameter distribution curve, and particle size distribution curves of the WT powders were shown in Figure 3. The BET specific surface area of the WT powders was measured to be 153.5 m2/g, much larger than those of the commercially available P25 powders (50 m2/g) [39] and the wet attritor and air jet milling processed wool powders (14.89 m2/g) [40]. It was apparent that the isotherms of the WT powders were primarily attributed to type IV of IUPAC classification imparted with the mesoporous (2–50 nm) distribution characteristics [41]. This was demonstrated by the pore diameter curve of the WT powders resulted from the BJH desorption branch of the isotherm. The pore diameters were mainly located in the range of 10–90 nm with a maximum at 30 nm, along with a smaller pore diameter distribution at around 5 nm. Additionally, the typical H3 hysteresis loop occurred in the isotherm of WT powders at the relative pressure range of 0.5–1.0, suggesting the slit-like pores were formed due to the accumulation of TiO2 nanoparticles on wool pallets. The abundant mesoporous and macroporous pores resulted in a large specific surface area, thereby providing more active sites for the adsorption of organic compounds.
The particle size distribution curves of the WT powders before and after photodegradation experiments indicated that most of the as-prepared WT powder aggregates was distributed in the range of 600–3600 nm, and the rest of WT powder aggregates was from 4000–6500 nm. After the first cycle photodegradation (see the photodegradation section), the particle sizes were in the range of 1500–3000 nm. This was because the agglomerated WT powders were completely scattered into smaller particles owing to the long period of soaking and stirring.

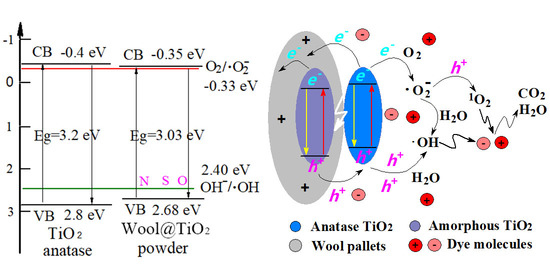
2.5. Band-Gap Structure

The diffuse reflection spectra of wool pallets before and after loading TiO2 were shown in Figure 4a. In comparison with wool pallets, the light absorption capability of the WT powders was significantly improved in both UV and visible light regions. The absorption edge was red-shifted due to the electron transitions from VB to CB (O2p→Ti3d) of TiO2 deposited on wool pallets [42]. The average reflectance was reduced from 50.9% to 29.2% in UV region and from 96.5% to 77.7% in visible light region. The band-gap energy was calculated on the basis of Kubelka-Munk equation [43]. As shown in Figure 4b, the direct band-gap was considered for the WT powders, and the band-gap energy (Eg) was estimated as 2.98 eV from the intercept of the tangent to the x-axis by extrapolating the plot of (αhv)2 versus the photon energy (hv). In comparison with anatase phase TiO2 [36], the band-gap of the WT powders decreased from 3.2 to 3.03 eV because of the incorporation of N, S, and O elements of wool keratin with TiO2 nanoparticles to form N-, S-, and C-doped TiO2 nanoparticles.
The UPS spectrum of the WT powders was displayed in Figure 4c. It was obtained from the x-intercept of the UPS spectrum that the valence band potential (EVB) of the WT powders was 2.68 eV, which was larger than the redox potential of OH/•OH (2.40 eV vs. NHE) couples [44]. Thus, the conduction band potential of the WT powders was calculated to be −0.35 eV, which was much more negative than the redox potential of O2/•O2 (−0.33 eV vs. NHE) couples [45]. The schematic energy band-gap of the WT powders was shown in Figure 4d. The narrowed band-gap of the WT powders was helpful for the generation of electron–hole pairs, and the positive valence band and negative conduction band potentials could oxidize H2O and reduce dissolved O2 to produce •OH and •O2 radicals, respectively.

2.6. Separation Efficiency of Photogenerated Electron–Hole Pairs

The steady-state PL and time-resolved transient PL spectra of the WT powders and the corresponding TiO2 nanoparticles were shown in Figure 5, and corresponding fitting data were displayed in Table S2. The fluorescence intensity of the TiO2 nanoparticles was slightly stronger than that of the WT powders, suggesting that the WT powders possess high separation efficiency of photogenerated electron–hole pairs [46]. The time-resolved transient PL spectra of the WT powders and the TiO2 nanoparticles were fitted using a bi-exponential function. The decay time τ1 and τ2 were 0.29 and 10.02 ns for the WT powders and 0.49 and 0 ns for the TiO2 nanoparticles, respectively. This indicated that the transfer of photogenerated charge carriers on the WT powders was faster than that on the TiO2 nanoparticles [47]. The fast separation of photogenerated electron–hole pairs in the WT powders might be attributed to both the TiO2 nanoparticles infiltrated inside the wool cortex and the TiO2 nanoparticles coated on the wool pallets (see Section 2.9).

2.7. Photocatalytic Performance

2.7.1. Optimization of Photocatalytic Degradation Efficiency

(a)
Optimization of the amount of TBT
To optimize the amount of TBT, 0.25 g/L of the as-prepared WT powders (0.5, 1.0, 1.5, and 2.0 mL TBT in relative to 0.1 g wool pallets respectively) was added into 30 mL of 3 mg/L MB dye solution. After absorption–desorption equilibrium, the four dye solutions were separately irradiated under 119 mW/cm2 white light for 180 min. The photocatalytic activities of the TiO2 modified orthocortex and paracortex [48] were also compared under the same conditions. The photodegradation efficiencies were shown in Figure S2. As the amount of TBT increased, both k (apparent photodegradation rate constant) and E (degradation rate) values increased at first, and then reached the maximum values when 1.0 mL TBT was used. Afterwards, the k and E values decreased with the increases of the amount of TBT. Moreover, the photocatalytic performance of the optimized WT powders (0.1 mL TBT) was inferior to those of the TiO2 modified orthocortex and paracortex. This was because the particle numbers of the TiO2 modified orthocortex or paracortex were significantly more than those of the WT powders when their masses were identical. The fabrication procedure for the WT powders was simple and feasible, while it was complex for the TiO2 modified cortical cells.
(b)
Effect of the wavelength of light exposure
To investigate the effect of the wavelength of light on photodegradation efficiency of dye solutions, five monochromic LED lamps having different wavelengths as well as a white LED lamp were used to irradiate 40 mL of the MB dye solutions (pH = 8) at the light power density of 119 mW/cm2 for 180 min, respectively. 0.25 g/L of the resultant WT powders was added. The photodegradation efficiencies of the WT powders under different conditions were shown in Figure S3. The adsorption of the WT powders had little effect on the degradation of MB dye. The orders for both k and E values were 660 nm > 620 nm > 420 nm > white light > 470 nm > 520 nm under the same light power density conditions. Interestingly, after 180 min of illumination, the MB dye solution was quickly photodegraded when the wavelength of light was close to the maximum absorption wavelength of the dyes [49]. In fact, the control MB solution without photocatalyst was also significantly decolorized under 660 nm light irradiation. This was mainly because the MB dye had a strong absorption band at around 660 nm [50]. Furthermore, the 420 nm monochromic light also behaved much better than the white light. This was due to the fact that the photocatalytic degradation of MB dye depended on the excitation light energy [51] and the reason why the excitation light energy of the 420 nm monochromic light had high efficiency for the photodegradation of MB dye will be investigated in future. Therefore, the wavelength of light had a great influence on the photodegradation efficiency of MB dye. The white light and 660 nm monochromic light were selected as the light sources for the irradiation intensity investigation because of the presence of wool pallets.
(c)
Effect of the irradiation intensity
To investigate the effect of the irradiation intensity on the photodegradation efficiency of dye solution, three light power densities of 79, 155, and 185 mW/cm2 for white light and 118, 204, and 287 mW/cm2 for the monochromic light of 660 nm in wavelength were used to irradiate 40 mL of the MB solutions (pH = 8) for 180 min, respectively. 0.25 g/L of WT powders was added. The photodegradation efficiencies were shown in Figure S4. It was clear that both k and E values increased gradually with the increase of light power density, which was consisted with previous study [52]. This was because the larger the light power density was, the more energy the catalysts received. Thus, more reactive radical species would be produced. The light power density of 155 mW/cm2 for white light was selected as the irradiation intensity for the subsequent investigation.
(d)
Effect of the dosage of the WT photocatalysts
To investigate the effect of the photocatalyst dosage on the photodegradation efficiency of dye solution, 0.0625, 0.125, 0.25, and 0.5 g/L of the WT powders were applied in 40 mL of the MB solutions (pH = 8) exposure to 155 mW/cm2 white light for 180 min, respectively. 0.25 g/L of P25 powder solutions was used for comparison. The testing results were shown in Figure S5. When the dosage of the WT powders increased up to 0.25 g/L, both k and E values gradually increased. The greater the dosage of WT powders was, the larger the specific surface areas of catalysts were. This was beneficial to adsorb the dye molecules. Also, more photogenerated radical species would be produced and decomposed the dye molecules in a short period of time [53]. However, when the dosage of the WT powders exceeded 0.25 g/L, both k and E values decreased with the increase of the dosage of the catalysts. This might be attributed to the light scattering caused by the excess WT powders suspended in the solutions, which prevented the light penetrate into the depth of the MB solution. Therefore, the active sites on the surface of the WT powders were not fully utilized [54]. In addition, both k and E values of the WT powders were obviously greater than those of P25 powders under the same dosages, implying the high photocatalytic activities of the WT powders. Hence, the dosage of 0.25 g/L of WT powders was selected as one of the optimal parameters for the subsequent investigation.
(e)
Effects of the initial dye concentrations
To investigate the effect of the initial dye concentrations on the photodegradation efficiency of dye solutions (pH = 8), the MB dye solutions with concentrations of 1, 3, and 5 mg/L were exposed to white light at the light power density of 155 mW/cm2 for 180 min, respectively. 0.25 g/L of the WT powders was added. The testing results were shown in Figure S6. It was seen that the smaller the initial concentration of MB solution was, the larger the k and E values were. This was because there were only a small amount of dye molecules in the MB solutions of low concentrations, so the dye molecules absorbed on WT powders could be quickly decomposed by the photogenerated radical species. With the increases of the dye concentrations, more dye molecules were adsorbed on the surface of the WT powders. The reactive sites on the catalysts were occupied by the thick layer of dye molecules [55]. Meanwhile, the transmission of light through dye solutions was shielded to some degree due to the presence of large amounts of dye molecules. Consequently, the amount of photogenerated radical species was reduced, leading to a lower photodegradation efficiency. Therefore, 3 mg/L of MB dye solution was selected as the optimum dye concentration for the subsequent investigation.
(f)
Effect of the pH value of the dye solutions
To investigate the effect of the pH value of the dye solutions on the photodegradation efficiency of the solutions, the pH value of MB dye solutions were adjusted to 3, 5, 8, 10, and 12 using 0.1 mol/L HCl or NaOH, respectively. 0.25 g/L of the WT powders was added in 40 mL of the MB solution exposure to white light at the light power density of 155 mW/cm2 for 150 min. The testing results were shown in Figure S7. The adsorption capacity of the WT powders to MB dye molecules was very low under acidic conditions. This was because the cationic MB dye molecules had to compete with a large number of protons for the binding sites on the TiO2 modified wool pallets [56]. As the pH values increased, the concentration of protons decreased, and the cationic MB dye molecules could be easily adsorbed by the available binding sites on the surface of the WT powders. The maximum k and E values were obtained at the pH value of 10. When the pH value was greater than 10, both k and E values decreased to some extent probably owing to the partial hydrolysis of dye molecules in an alkali solution [57]. The photocatalytic reaction normally occurred at the surface of the photocatalysts. The surface of the TiO2 modified wool powders was positively charged in acidic solutions, whereas under alkaline conditions it was negatively charged. Excess negative charges promoted the repulsion of the dyes by the photocatalysts, resulting in the decreased photocatalytic activities of the WT powders [55].
(g)
Effect of the oxidant agent, H2O2
To investigate the effects of the co-catalyst H2O2 on the photodegradation efficiency of the WT powders on dye solutions, prior to white light irradiation at the light power density of 155 mW/cm2, 0.1, 0.5, 1.0, and 2.0 mL of 30 wt % H2O2 were added in 40 mL of MB dye solutions (pH = 8) having the concentration of 3 mg/L, respectively. 0.25 g/L of the WT powders was used. The testing results were shown in Figure S8. After 120 min of light irradiation, both k and E values of the MB dye solutions degraded by the WT powders were 13.89×10⁻³ min−1 and 84.2% in the absence of H2O2, respectively. When H2O2 was added, both k and E values gradually increased with the increase of the volume of H2O2. This was because the •OH radicals produced from H2O2 could promote the decomposition of MB dye molecules [58], and the recombination of electron–hole pairs was inhibited to some degree [55].
(h)
Effects of air and N2
To investigate the effect of gas environment on the photodegradation efficiency of the WT powders on dye solutions, air and N2 were introduced into the MB dye solutions at a flow rate of 40 standard cubic centimeters per minute (sccm) under 155 mW/cm2 white light irradiation conditions for 180 min, respectively. 0.25 g/L of the WT powders was added in 40 mL of the MB dye solutions (pH = 8). The testing results were shown in Figure S9. It was noted that the k and E values decreased to some extent when N2 or air was ventilated into the MB dye solutions under the same light irradiation condition. As expected, the introduction of N2 made the dissolved O2 in water less, inhibiting the generation of •O2 [59]. To ventilate air in the dye solution was detrimental to the photodegradation of MB dye solution. The presence of air bubble probably affected the production of photogenerated electrons and holes.
(i)
Comparison of the photodegradation efficiency of the WT powders onto the MB dye solutions
The photodegradation of MB dye solution was carried out using the optimized parameters determined above. 0.25 g/L of the WT powders was added in 40 mL of the MB dye solution having the concentration of 3 mg/L and containing H2O2 of 50 mL/L at pH value of 10 under 155 mW/cm2 white light irradiations for 90 min. The photodegradation efficiencies of the WT powders onto the MB solutions were compared with the photodegradation effect of H2O2 solutions without adjusting the pH value of MB solutions (pH = 8) under the same irradiation condition. The testing results were shown in Figure S10. It was apparent that the synergistic photodegradation effect of both adding H2O2 and adjusting pH value on the degradation of MB solutions was not achieved. This was because the •OH radical species generated from H2O2 was greatly inhibited in aqueous alkaline solution [60]. As a result, the optimal condition for photodegradation of the MB dye solutions was that the dosage of the WT powders was 0.25 g/L, which was added in 40 mL of the MB dye solution having the concentration of 3 mg/L and containing 50 mL/L of H2O2 without adjusting the pH value of dye solutions (pH = 8). Moreover, the COD values of the MB dye solutions after degradation by using the WT powders without adding H2O2 were measured to be 14.54 mg/L at the initial time and 9.88 mg/L at 150 min. However, the COD value of the MB dye solutions increased to 916.9 mg/L at 120 min when H2O2 was added.

2.7.2. Photodegradation Effect of the WT Powders onto Other Dye Solutions

The photodegradation of the WT powders onto the Congo red (CR) and methyl orange (MO) dye solutions were conducted under white light irradiation of 155 mW/cm2 for 120 min, respectively. 0.25 g/L of the WT powders was added in 40 mL of the dye solution having the concentration of 3 mg/L. The testing results were shown in Figure S11. The WT powders had a very strong adsorption ability to anionic CR dye. This was due to the positive charges of the WT powders, the Zeta potential of which was 11.3 mV. Moreover, the cationic MB and MO dyes could also be photodegraded after white light irradiation for 120 min. Both k and E values of the MB solution were slightly greater than those of the MO solutions. It was thus anticipated that the WT powders had similar considerable photodegradation effects onto other different types of organic dyes.

2.7.3. Reusability and Stability of the WT Powders

The recycled WT powders were obtained from the degraded dye solutions and washed with anhydrous ethanol and deionized water twice respectively, and then dried at 60 °C. They were reused in the consecutive photodegradation of a fresh MB dye solution under the same white light irradiation of 155 mW/cm2 for 90 min. The testing results were shown in Figure S12. After five recycles, both k and E values were hardly reduced, which demonstrated the high-efficiency and stability of the recycled WT powders in photodegradation of MB dye solutions. Thus, the WT powders could be used repeatedly for the wastewater treatments of the dyeing effluents in large scale applications. In comparison with the photodegradation effect in the first cycle, the increased k and E values in the second cycle were attributed to the more homogeneous dispersion and more swelling of the WT powders induced by soaking and stirring. This was evidenced in the polydisperse particle size analysis of the WT powders (see Section 3.4).

2.8. Identification of Reactive Radical Species

To identify the reactive radical species involved in the photodegradation of the MB solutions, the radical scavenging of radical species were performed by adding 1.0 mL of TBA for •OH, 1.0 mM of BQ for •O2, 1.0 mL of FFA for 1O2, and 1.0 mM of EDTA for h+ in the MB dye solutions, respectively [61]. 0.01g of the WT powders was added in 40 mL of MB dye solutions exposed to 155 mW/cm2 white light irradiations for 120 min. The testing results were shown in Figure S13. Both k and E values were slightly reduced from 29.41% and 96.8% to 23.48% and 94.3% for TBA, and 10.0% and 73.7% for BQ respectively; but they significantly decreased to 2.24% and 35.7% for EDTA, and 2.79% and 38.3% for FFA respectively. Hence, the prominent radical species of the WT powders were holes and 1O2, while •O2 and •OH radicals played the subordinate role in the MB photodegradation process. In comparison with 1O2, holes were the decisive radical species. It was reported that cysteine served as a sacrificial hole scavenger, which could be used to facilitate the charge separation of the photo-excited electron–hole pairs. For example, the charge separation at the interface between M. thermoacetica and CdS nanoparticles was aided by the oxidation of cysteine to cystine [62].
The ESR spectra of active radicals (•O2, •OH, 1O2, and h+) on the WT powders under visible irradiation were shown in Figure 6. It was noticed that no signal of DMPO-•O2, DMPO-•OH, and TEMP-1O2 could be detected in the dark. After 5 min visible light irradiation, six characteristic peaks of DMPO-•O2 in methanol dispersions, four typical peaks of DMPO-•OH in aqueous dispersions, and three characteristic peaks of TEMP-1O2 were observed. For TEMP-1O2, a triplet ESR signal of 2,2,6,6-tetramethyl-4- piperidinol-N-oxyl radical (TMPN) with g values of 2.014, 2.003, and 1.994 testified the presence of 1O2, which was indicative of oxygen vacancy [63]. The g value of 1.994 corresponded to the trapped electrons derived from Ti3+. The g values at 2.003 and 2.014 were ascribed to the trapped h+ and superimposed oxygen species of •Oand •O2. This was caused by the reaction of holes with surface bridging oxygen atoms or lattice oxygen atoms [64]. Additionally, no signal of photoinduced holes (h+) in aqueous dispersions was testified by the strong signals of spin-trapped TEMPO-h+ adducts in dark condition [65]. After 5 min of light illumination, the peak intensity of spin-trapped TEMPO-h+ adducts was reduced to some extent, suggesting the formation of more radical species of h+. The results of ESR experiments were in agreement with the trapping testing. As a result, the photoinduced active radicals of •O2, •OH, 1O2, and h+ on the WT powders were all involved in the photodegradation of organic dyes under visible light irradiation.

2.9. Photocatalytic Mechanism of the WT Powders

The photocatalytic reaction mechanism of the WT powders for the photodegradation of organic dyes was shown in Figure 7. The photoinduced electron and hole pairs could be produced on both the anatase TiO2 nanoparticles deposited on the surface of wool pallets and the amorphous TiO2 nanoparticles embedded into the wool pallets under visible light illumination. It was reported that the amorphous TiO2 nanoparticles possessed enriched surface hydroxyl groups and chemical adsorbed water in comparison with crystallized TiO2, thus leading to a rapid photo-sensitized degradation of rhodamine B dye [66]. Furthermore, the ultraviolet irradiation would result in the crystallization of amorphous TiO2 to form a thin film of rutile TiO2 on its surface, along with an increased band-gap of 3.3 eV and abundant surface active sites like reduced titanium and oxygen vacancies [67]. The photo-generated electrons and holes were immediately separated from each other by the interstitial Ti3+ defects, as testified by XPS. It was demonstrated that the Zeta potential of the pure wool pallets was negative in the range of −5 mV to −30 mV at neutral pH conditions [68]. However, the Zeta potentials of both the TiO2 nanoparticles and the WT powders were measured to be 35 mV and 11.3 mV at pH value of 7, respectively. The positive Zeta potential of the WT powders was probably ascribed to both the anatase TiO2 nanoparticles coated on wool pallets and the amorphous TiO2 nanoparticles infiltrated inside cortex of the wool pallets which was confirmed by FESEM, EDX, XRD, and TEM. Thus, the anionic CR dye molecules could be more easily adsorbed on the surface of the WT powders than the cationic MB and MO dyes. Because the absorption of anatase TiO2 to visible light is negligible [69], the visible light could penetrate the coating of TiO2 nanoparticles on the WT powders to reach the amorphous TiO2 infiltrated into wool pallets, thus the photoinduced electron–hole pairs would be produced. The photogenerated holes produced on both anatase TiO2 and amorphous TiO2 nanoparticles were prone to transfer from the interior to the outside surface in the WT powders caused by their positive Zeta potentials. At the same time, the photo-generated electrons produced from amorphous TiO2 nanoparticles might be trapped in the interior of WT powders. Some of the photogenerated electrons produced from the anatase TiO2 nanoparticles had a great potential to transfer into the interior of the WT powders, while the other photogenerated electrons would reside on the surface of the WT powders. Judged from the electronic band structure, the valence band and conduction band potentials of the WT powders were calculated to be 2.68 eV and −0.35 eV, respectively. Both of them were more positive than the redox potential of OH/•OH (2.40 eV vs. NHE) couples and more negative than the redox potential of O2/•O2 (−0.33 eV vs. NHE) couples, respectively. Therefore, the photogenerated holes on the valence band could oxidize H2O adsorbed on the surface of the WT powders to produce •OH radicals. The photogenerated electrons on the conduction band could reduce dissolved O2 to produce •O2 radicals. In addition, the reaction between •O2 and holes could result in the generation of 1O2 [70]. A further reaction of •O2 with H2O led to the protonated superoxide radicals (HO2•) and H2O2 would be produced. H2O2 reacted with the electrons or •O2 to produce •OH. Lastly, the organic dye molecules could be decomposed into CO2 and H2O under the effects of •OH, •O2, 1O2, and holes active radicals [71]. In comparison with •OH, •O2, and 1O2, the photogenerated holes were the primary active radicals in the photocatalysis of WT hybrid composites.

3. Experimental Section

3.1. Materials and Reagents

Merino wool fibers having the diameter ranging from 21.6 to 23.0 μm and soap tablets were obtained from a local woolen mill. The chemical reagents used in this study were of analytical grade and included sodium carbonate, petroleum ether, anhydrous ethanol, tetrabutyl titanate (TBT), hydrochloric acid, sodium hydroxide, hydrogen peroxide, tert-butanol (TBA), ethylenediamine tetraacetic acid (EDTA), benzoquinone (BQ), furfuryl alcohol (FFA), 5,5-dimethyl-1-pyrroline N-oxide (DMPO), 4-amino-2,2,6,6-tetramethylpiperidine (TEMP), 2,2,6,6-tetramethylpiperidine-1-oxyl (TEMPO), 1,1-diphenyl-2-picrylhydrazyl (DPPH), methylene blue (MB), Congo red (CR), and methyl orange (MO) dyes. Degussa P25 powder was purchased from Shanghai Macklin Biochemical Co., Ltd. The deionized water was applied to prepare all solutions.

3.2. Fabrication of WT Hybrid Composite Powders

The technical route for producing the WT powders was shown in Figure 8. The wool fibers were first degreased with petroleum ether according to the Soxhlet method [72], and then vibration-assisted ground using stainless steel balls under lyophilization condition to avoid thermal degradation of wool keratins. Based on the modified hydrothermal method [29], the as-prepared wool pallets were swollen in hot water and then immobilized with TiO2 nanoparticles using TBT as the precursor. Thus, the micrometer-sized core–shell WT powders having special hybrid composite structure as well as greater reactivity and larger surface area were fabricated.

3.2.1. Degreasing of Wool Fibers

According to a ratio of material to liquid 1:50, 4.0 g of as-obtained wool fibers was immersed in 200 mL aqueous solution containing 0.5 wt % Na2CO3 and 0.5 wt % soap tablets at 50 °C for 30 min, and then washed separately with anhydrous ethanol and deionized water thrice, and finally dried at 60 °C overnight. The cleaned wool fibers, which were chopped into short snippets with length smaller than 5 mm, were Soxhlet extracted with petroleum ether at 80 °C for 12 h, and then washed separately with anhydrous ethanol and deionized water twice, and finally dried at room temperature.

3.2.2. Fabrication of Wool Pallets

The degreased wool fiber snippets were frozen at 30 °C below zero for 30 min, and then ground into small flaky substances using stainless steel balls based on the vibration ball milling technique [73]. During the freeze-grinding process, the snippets were ground for 200 s every 500 s. The total grinding time was controlled at 30 min to produce the wool pallets with lateral sizes smaller than 5 μm.

3.2.3. Swelling of Wool Pallets

A certain amount of wool pallets (0.1 g) was treated with 40 mL deionized water at 100 °C for 1 h. After that, the mixture solution was naturally cooled down to ambient temperature, and then placed in a fridge at 4 °C for late use.

3.2.4. Loading of TiO2 Nanoparticles on Wool Pallets

A series of TiO2 precursor solutions were separately prepared by adding 0.5, 1.0, 1.5, and 2.0 mL TBT into 40 mL anhydrous ethanol under vigorous stirring at room temperature. 40 mL of cold mixture solution containing wool pallets was dropwise added into each one of the above TiO2 precursor solutions under vigorous stirring. The mixed solutions were immediately transferred to the 100 mL PTFE-lined stainless steel autoclaves respectively, which were put in a furnace running at a speed of 10 r/min and heated to 120 °C at a heating rate of 2.0 °C /min. After 3 h reaction, the autoclaves were naturally cooled down to room temperature and the WT powders were washed with anhydrous ethanol and deionized water thrice respectively, and finally centrifuged and freeze-dried.

3.3. Characterization Methods

The surface morphologies of wool pallets before and after loading TiO2 were observed in a Quanta-450-FEG X-MAX50 field emission scanning electron microscope (FESEM, FEI Company, USA). The chemical composition and elemental mapping of WT powders were measured in an energy dispersive X-ray (EDX) spectroscope (Oxford Inca Energy 400, UK) attached to the above FESEM instrument.
The crystal structures of wool fibers, wool pallets before and after treatments, and as-synthesized pure TiO2 were analyzed in a Benchtop Rigaku MiniFlex 600 X-ray diffractometer (XRD) with Cu Kα1 radiation (0.154056 nm) in the 2θ range of from 10° to 80° at a scanning rate of 8°/min. The average crystalline size was calculated according to the Scherrer Equation (1) [74] below.
D = Kλ/βcosθ,
where D was the average crystalline size, the k was a constant 0.89, the λ was the X-ray wavelength, the β was the full width at half maximum (FWHM), and the θ was the Bragg angle.
The microstructure of the WT powders was examined in both H-7650 (Hitachi Ltd., Tokyo, Japan) and JEM-3010 (JEOL Ltd., Akishima, Japan) transmission electron microscopes (TEM).
The chemical states of wool pallets before and after loading TiO2 were investigated on an Axis Ultra X-ray photoelectron spectrometer (XPS, Shimadzu, Japan) equipped with monochromatic Al Kα (1486.68 eV) radiation. The vacuum degree was below 1.33 × 10⁻⁶ Pa, and the high-resolution XPS spectra were calibrated by reference to the C1s peak at 284.8 eV.
The functional groups of wool fibers and wool pallets were characterized using a Spotlight 400 and Frontier Fourier transform infrared spectroscopy (FT-IR) spectrophotometer (Perkin Elmer Inc., Waltham, MA, USA). The spectra were recorded in the range of 650–1800 cm−1 with a resolution of 4 cm−1 as the KBr pellets.
The adsorption–desorption isotherms of WT powders were determined on a Gemini VII 2390 surface area analyzer (Micromeritics Instrument Corporation, Norcross, GA, USA) in liquid nitrogen environment at 77 K. The Brunauer–Emmett–Teller (BET) specific surface area, pore volume, and pore size distribution were deduced from the adsorption–desorption isotherms.
The particle sizes of the WT powders before and after irradiations as well as the Zeta potentials of both the TiO2 nanoparticles and the WT powders were acquired in a Malvern Mastersizer 3000 laser diffraction particle size analyzer.
The diffuse reflection spectra of wool pallets before and after loading TiO2 nanoparticles were performed on a Lambda 950 spectrometer (Perkin Elmer Inc., Norcross, GA, USA) using barium sulfate as reference in the wavelength range of 250–800 nm at a scanning rate of 250 nm/min. The band-gap energy, Eg, was calculated according to Kubelka-Munk Equation (2) [75] below
αhν = A(hvEg)2,
where α was the absorption coefficient, h was the Planck constant, ν was the frequency of light, and A was the constant. The Eg value was obtained by extrapolating the vertical segment of the plot to intersect on the x-axis when y-axis was zero.
The ultraviolet photoelectron spectrum (UPS) of the WT powders was recorded on an Escalab 250Xi UV photoelectron spectrometer (Thermo Fisher Scientific Inc., USA). The valence band energy was acquired by extrapolating the linear segment of the plot to intersect on the x-axis when y-axis was zero.
The photoluminescence (PL) spectra including steady-state and time-resolved transient were conducted on an Edinburgh FS5 fluorescence spectrometer (Edinburgh Instruments Ltd., West Lothian, UK) at room temperature. The excitation wavelength was 280 nm for the steady-state PL spectrum and 340 nm for the time-resolved transient PL spectrum. The average fluorescence lifetime (τavg) was calculated according to the Equation (3) [76] below
τ = (B1τ12 + B2τ22)/(B1τ1 + B2τ2),
where B1 and B2 were the relative amplitude of the decay factor, and τ1 and τ2 represented the decay time, respectively.
The electron spin resonance (ESR) spectra were tested in a Bruker A300 instrument operated at a microwave frequency of 9.85 GHz and a microwave power of 19.3 mW at a field modulation of 100 kHz and an amplitude modulation of 1.0 Gauss at ambient temperature under visible light irradiation. DMPO was used as the sensitive spin-trapping agent to identify the reactive radical species of •O2− in methanol and ·OH in H2O. TEMP and TEMPO were applied for the detection of 1O2 and h+ in aqueous dispersion, respectively. The g-tensors of the ESR signals were corrected by setting 2.004 g of DPPH as [77].

3.4. Measurements of Photocatalytic Properties

The photocatalytic performance of WT powders was assessed using MB, CR, and MO dyes as the organic pollutant models while Degussa P25 powders were used as the control exposure to visible light. Although the MB, CR, and MO dyes used are sensitive to light, they exhibit the photocatalytic effects and are widely used in literature for studying other photocatalysts. For comparison with previous research, the dyes while not ideal was still used in this research. In addition, we used control experiments to show the differences of the degradation of the dyes due to light degradation and the degradation of the dyes due to the WT photocatalytic effect. A light-emitting diode (LED) lamp (420–660 nm) was employed as the light source owing to its flexible configuration, long lifetime, and high energy efficiency. Typically, 0.01 g of the WT powders was first dispersed in 40 mL of the MB dye solution having the concentration of 3 mg/L (denoted as the MB solutions onwards) in dark with continuous stirring. After 1 h of adsorption–desorption equilibrium, the suspension was irradiated with the LED lamp of its optical power density 119 mW/cm2 at constant stirring (1500 r/min). At specific times, the suspension was shielded from the light source and about 5 mL of MB solutions were extracted from the suspension. The supernatant of the suspension was obtained in a TG16-WS high speed centrifuge separation machine running for 15 min at 11,000 r/min to remove the particulates. The absorbance of the solution at the maximum absorption wavelength of 664 nm was measured using the UV-1601 spectrophotometer. After the completion of this measurement, the solution was blended with the particulates and added into to the suspension under LED illumination. The concentration of Ct was calculated according to the calibration curve of the MB dye solutions (At = −0.0232 + 0.2003Ct, R2 = 0.99). The apparent photodegradation rate constant (k value) of the MB solution was calculated on the basis of a first order kinetic Equation (4) [78] below
ln(C0/Ct) = kt,
where C0 and Ct were the concentrations of the MB solution at initial time to = 0 and the time t. After the irradiation reaction was completed, the degradation rate of the MB solution, E, was calculated using the Equation (5) [78] below
E = (1 − Ct/C0) × 100%,
The average degradation rate was given after three measurements.
The effects of photodegradation parameters—including wavelength of light, irradiation intensity, dye concentration, catalyst dosage, pH value of dye solution, co-catalyst hydrogen peroxide, gas environment air, and nitrogen—on the photocatalytic efficiencies of the WT powders towards the photodegradatoin of MB dye were systematically investigated. For different wavelengths of light, the monochromic LED lights with wavelength of 420, 470, 520, 620, and 660 nm and white light (420–660 nm) were used to illuminate the MB dye solution under the same light power density of 119 mW/cm2. The MB stock solution with a concentration of 50 mg/L was first prepared. The desired concentration of MB solutions (1, 3, and 5 mg/L) was obtained by dilution of the stock solution with deionized water.
The reusability of the WT powders was studied for the cyclic degradation of the MB dye solution. The WT powders were recycled via centrifugation for next measurement and the irradiated solution was replaced by the fresh MB solution.
The chemical oxygen demand (COD) analyses of the initial and degraded MB dye solutions were tested in accordance with EPA method 410.4 in a semi-automated colorimetry [79]. The solution was kept at ambient temperature for 10 min, and then cooled down in air for 2 min. 2.5 mL of distilled water was subsequently added into the mixture solution, which was maintained at low temperature with cold water for 2 min. The absorbance of the solution at the wavelength of 664 nm was measured using the photoelectric colorimeter.
The reactive radical species such as h+, •OH, 1O2, and •O2 [80] were identified by the trapping experiments under visible light irradiation. This was done by adding the radical scavengers, namely 1.0 mM EDTA, 1.0 mL TBA, 1.0 mL FFA, and 1.0 mM BQ, into the MB dye solutions respectively, prior to photocatalytic experiments.

4. Conclusions

A simple, low-cost, and environmentally friendly technical route was proposed to produce the wool keratin-based WT core–shell hybrid composite powders via freezing-grinding and hydrothermal processes. It was confirmed in the examination using SEM, EDX, XRD, and TEM methods that noncrystalline TiO2 nanoparticles were homogenously formed into the cortex of the wool pallets, while crystalline TiO2 nanoparticles were deposited on the surface of the wool pallets. Thus, the core–shell structured WT hybrid composite powders with meso- and macro-pores were produced and the particle sizes were in the range of micrometers. It was demonstrated in XPS analysis that the anatase TiO2 nanoparticles were grafted onto wool pallets via the N-Ti4+/O-Ti4+/S-Ti4+ bonds. Their valence band and conduction band potentials were measured to be 2.68 eV and −0.35 eV, respectively. The high-efficiency separation of photogenerated electrons and holes in the WT hybrid composites was attributed to the homogenous distribution of both noncrystlline and crystalline TiO2 nanoparticles, the larger BET specific surface areas, and the positive Zeta potentials; resulting in the enhanced photocatalytic activity for the photocatalytic degradation of MB dye solutions. It was found in both the trapping experiment and ESR analysis that the main reactive radical species of the WT hybrid composites were holes, while •O2, 1O2, and •OH played a subordinate role in the photodegradation of MB dye solutions under visible light irradiation. The possible photodegradation mechanism of the WT hybrid composites was proposed. In addition, the parameters for the WT hybrid composites to have better photodegradation performance of MB dye solutions were identified: 0.25 g/L of the WT hybrid composites was added in 40 mL of the MB dye solution having the concentration of 3 mg/L and containing 50 mL/L H2O2, this will lead to an increased COD value of photodegraded MB dye solutions. The transformation of wool fibers from fibrous rods to flaky platelets made TiO2 nanoparticles embed easily into the matrix of wool keratins, thus a high value-added WT hybrid composites were fabricated and could be used repeatedly for the photodegradation of both anionic and cationic dyes. The WT powders have the potential to be applied in textile industry for the treatment of dyeing wastewater.

Supplementary Materials

The following are available online at https://www.mdpi.com/2073-4344/11/1/12/s1, Figure S1: XPS spectra of wool pallets before and after loading TiO2: (a) survey spectra; wool pallets for (b) C1s, (c) N1s, (d) O1s, and (e) S2p; the WT powders for (f) C1s, (g) N1s, (h) O1s, (i) S2p, and (j) Ti2p; and (k) FT-IR spectra of wool fibers and wool pallets, Figure S2: Photo-degradation of MB dye solutions exposed to white light at the light power density of 119 mW/cm2 for 180 min, Figure S3: Photo-degradation of MB dye solution exposed to different wavelength lights at the light power density of 119 mW/cm2 for 180 min, Figure S4: Photo-degradation of MB dye solution exposed to white light at the light power densities of 79, 155, and 185 mW/cm2, and exposed to 660 nm monochromic light at the light power densities of 118, 204, and 287 mW/cm2 for 180 min, respectively, Figure S5: Photo-degradation of MB dye solution by different dosages of WT powders under 155 mW/cm2 white light irradiation for 180 min, Figure S6: Photo-degradation of MB dye solution with the concentrations of 1, 3, and 5 mg/L exposure to white light at the light power density of 155 mW/cm2 for 180 min, Figure S7: Effect of the pH value of dye solution on the photo-degradation efficiency of MB dye exposed to white light at the light power density of 155 mW/cm2 for 150 min, Figure S8: Effect of the co-catalyst H2O2 on the photo-degradation efficiency of MB dye solution exposed to white light at the light power density of 155 mW/cm2 for 120 min, Figure S9: Effect of a gas environment on the photo-degradation efficiency of MB dye solution exposed to white light at the light power density of 155 mW/cm2 for 180 min, Figure S10: Comparison of photo-degradation efficiency of MB dye solution under different testing conditions for 90 min, Figure S11: Comparison of photo-degradation of MB, CR and MO dye solution by the WT powders under 155 mW/cm2 white light irradiation for 120 min, Figure S12: Recycle photo-degradation of MB dye solution by the WT powders under 155 mW/cm2 white light irradiation for 90 min, Figure S13: Trapping experiments for photo-degradation of MB dye solution by the WT powders by adding 1.0 mM EDTA, 1.0 mM BQ, 1.0 mL TBA, and 1.0 mL FFA, respectively under 155 mW/cm2 white light irradiation for 120 min, Table S1: The XPS elemental analysis data, Table S2: The fitting parameters of the time-resolved PL spectra using biexponential decay kinetics.

Author Contributions

H.Z. conceptualized, designed, and administered the experiments. H.G. contributed to the synthesis and characterization of materials. X.Z., Y.G., L.Y., and H.W. helped in collected and analyzed data. N.M. helped to revise the grammar and gave conceptual advice. All authors analyzed and discussed the data. H.G. and H.Z. wrote the manuscript. All authors have read and agreed to the published version of the manuscript.

Funding

This research was funded by the National Natural Science Foundation of China (no. 51873169), the International Science and Technology Cooperation Project of Shaanxi Province (2020KW-069), and the Sanqin Scholar Foundation (2017).

Conflicts of Interest

The authors declare no conflict of interest.

References

  1. Nazari, A.; Montazer, M.; Dehghani-Zahedani, M. Simultaneous dyeing and mothproofing of wool against Dermestes Maculatus with madder optimized by statistical model. Clean. Technol. Environ. 2014, 16, 1675–1686. [Google Scholar] [CrossRef]
  2. Aksakal, B.; Koc, K.; Bozdogan, A.; Tsobkallo, K. Uniaxial tensile properties of TiO2 coated single wool fibers by sol-gel method: The effect of heat treatment. J. Appl. Polym. Sci. 2013, 130, 898–907. [Google Scholar] [CrossRef]
  3. Patil, K.; Rajkhowa, R.; Wang, X.; Lin, T. Review on fabrication and applications of ultrafine particles from animal protein fibres. Fibers Polym. 2014, 15, 187–194. [Google Scholar] [CrossRef]
  4. Patil, K.; Smith, S.V.; Rajkhowa, R.; Tsuzuki, T.; Wang, X.; Lin, T. Milled cashmere guard hair powders: Absorption properties to heavy metal ions. Powder Technol. 2012, 218, 162–168. [Google Scholar] [CrossRef]
  5. Atef El-Sayed, A.; Salama, M.; Kantouch, A.A.M. Wool micro powder as a metal ion exchanger for the removal of copper and zinc. Desalin. Water Treat. 2014, 56, 1010–1019. [Google Scholar] [CrossRef]
  6. Li, W.B.; Ke, G.Z.; Li, G.W.; Xu, W.L. Study on the structure and properties of viscose/wool powder blended fibre. Fibres Text. East. Eur. 2015, 23, 26–29. [Google Scholar]
  7. Wen, G.; Cookson, P.G.; Liu, X.; Wang, X.G. The effect of pH and temperature on the dye sorption of wool powders. J. Appl. Polym. Sci. 2010, 116, 2216–2226. [Google Scholar] [CrossRef]
  8. Naik, R.; Wen, G.Q.; Dharmaprakash, M.S.; Hureau, S.; Uedono, A.; Wang, X.G.; Liu, X.; Cookson, P.G.; Smith, S.V. Metal ion binding properties of novel wool powders. J. Appl. Polym. Sci. 2010, 115, 1642–1650. [Google Scholar] [CrossRef]
  9. Wang, X.; Xu, W.L.; Wang, X.G. Characterization of hot-pressed films from superfine wool powder. J. Appl. Polym. Sci. 2008, 108, 2852–2856. [Google Scholar] [CrossRef]
  10. Ke, G.Z.; Xu, W.L. Preparation and properties of superfine wool powder/chitosan complex membrane. J. Text. Inst. 2012, 103, 1183–1188. [Google Scholar] [CrossRef]
  11. Ke, G.Z.; Li, W.B. Preparation of viscose/wool powder blended fibre and optimization of its acid dyeing. Indian J. Fibres Text. 2016, 41, 195–199. [Google Scholar]
  12. Chang, H.B.; Li, Q.S.; Xu, C.J.; Li, R.M.; Wang, H.X.; Bu, Z.W.; Lin, T. Wool powder: An efficient additive to improve mechanical and thermal properties of poly (propylene carbonate). Compos. Sci. Technol. 2017, 153, 119–127. [Google Scholar] [CrossRef]
  13. Tang, B.; Zeng, T.; Liu, J.; Zhou, J.; Ye, Y.; Wang, X.G. Waste fiber powder functionalized with silver nanoprism for enhanced Raman scattering analysis. Nanoscale Res. Lett. 2017, 12, 341. [Google Scholar] [CrossRef] [PubMed] [Green Version]
  14. El-Sayed, A.A.; Salama, M.; El-Rafie, M.H.; Emam, H.E. Modified rice straw as a template in syntheses of nano TiO2 loaded on wool fibers for wastewater treatment. J. Nat. Fibers 2017, 14, 297–309. [Google Scholar] [CrossRef]
  15. Li, H.Q.; Hu, J.T.; Wang, X.J.; An, L.H. Development of a bio-inspired photo-recyclable feather carbon adsorbent towards removal of amoxicillin residue in aqueous solutions. Chem. Eng. J. 2019, 373, 1380–1388. [Google Scholar] [CrossRef]
  16. Wang, Q.Z.; Lian, J.H.; Ma, Q.; Bai, Y.; Tong, J.H.; Zhong, J.B.; Wang, R.M.; Huang, H.H.; Su, B.T. Photodegradation of Rhodamine B over a novel photocatalyst of feather keratin decorated CdS under visible light irradiation. New J. Chem. 2015, 39, 7112–7119. [Google Scholar] [CrossRef]
  17. Tang, B.; Zhou, X.; Zeng, T.; Lin, X.; Zhou, J.; Ye, Y.; Wang, X.G. In situ synthesis of gold nanoparticles on wool powder and their catalytic application. Materials 2017, 10, 295. [Google Scholar] [CrossRef] [Green Version]
  18. Chang, H.B.; Li, Q.S.; Cui, X.M.; Wang, H.X.; Bu, Z.W.; Qiao, C.Z.; Lin, T. Conversion of carbon dioxide into cyclic carbonates using wool powder-KI as catalyst. J. CO2 Util. 2018, 24, 174–179. [Google Scholar] [CrossRef]
  19. Montazer, M.; Pakdel, E. Self-cleaning and color reduction in wool fabric by nano titanium dioxide. J. Text. Inst. 2011, 102, 343–352. [Google Scholar] [CrossRef]
  20. Tung, W.S.; Daoudd, W.A.; Leung, S.K. Understanding photocatalytic behavior on biomaterials: Insights from TiO2 concentration. J. Colloid Interface Sci. 2009, 339, 424–433. [Google Scholar] [CrossRef]
  21. Zhang, H.; Yang, Z.W.; Zhang, X.T.; Mao, N.T. Photocatalytic effects of wool fibers modified with solely TiO2 nanoparticles and N-doped TiO2 nanoparticles by using hydrothermal method. Chem. Eng. J. 2014, 254, 106–114. [Google Scholar] [CrossRef]
  22. Bozzi, A.; Yuranova, T.; Kiwi, J. Self-cleaning of wool-polyamide and polyester textiles by TiO2-rutile modification under daylight irradiation at ambient temperature. J. Photochem. Photobiol. A Chem. 2005, 172, 27–34. [Google Scholar] [CrossRef]
  23. Daoud, W.A.; Leung, S.K.; Tung, W.S.; Xin, J.H.; Cheuk, K.; Qi, K. Self-cleaning keratins. Chem. Mater. 2008, 20, 1242–1244. [Google Scholar] [CrossRef]
  24. Tung, W.S.; Daoud, W.A. Photocatalytic self-cleaning keratins: A feasibility study. Acta Biomater. 2009, 5, 50–56. [Google Scholar] [CrossRef]
  25. Zhang, H.; Millington, K.R.; Wang, X. The photostability of wool doped with photocatalytic titanium dioxide nanoparticles. Polym. Degrad. Stab. 2009, 94, 278–283. [Google Scholar] [CrossRef]
  26. Wang, L.Y.; Daoud, W.A. UV-induced photocatalytic cashmere fibers. Materials 2017, 12, 1414. [Google Scholar] [CrossRef] [Green Version]
  27. Zhang, H.; Wang, D.; Han, Y.; Tang, Q.; Wu, H.L.; Mao, N.T. High photoactivity rutile-type TiO2 particles co-doped with multiple elements under visible light irradiation. Mater. Res. Express 2018, 5. [Google Scholar] [CrossRef] [Green Version]
  28. Villanueva, M.E.; Puca, M.; Bravo, J.P.; Bafico, J.; Orto, V.C.D.; Copello, G.J. Dual adsorbent-photocatalytic keratin-TiO2 nanocomposite for trimethoprim removal from wastewater. New J. Chem. 2020, 44, 10964–10972. [Google Scholar] [CrossRef]
  29. Zhang, H.; Zhu, H. Modification of wool fabric treated with tetrabutyl titanate by hydrothermal method. J. Text. Inst. 2012, 103, 1108–1115. [Google Scholar] [CrossRef]
  30. Zhang, H.; Yan, H.Y.; Mao, N.T. Functional modification with TiO2 nanoparticles and simultaneously dyeing of wool fibers in a one-pot hydrothermal process. Ind. Eng. Chem. Res. 2014, 53, 2030–2041. [Google Scholar] [CrossRef] [Green Version]
  31. Zhang, H.; Xu, J.; Zhang, X.T. Hydrothermal treatment of wool fibers with tetrabutyl titanate and chitosan. J. Nat. Fibers 2015, 12, 518–530. [Google Scholar] [CrossRef]
  32. Zhang, J.H.; Fu, D.; Wang, S.Q.; Hao, R.L.; Xie, Y.X. Photocatalytic removal of chromium(VI) and sulfite using transition metal (Cu, Fe, Zn) doped TiO2 driven by visible light: Feasibility, mechanism and kinetics. J. Ind. Eng. Chem. 2019, 80, 23–32. [Google Scholar] [CrossRef]
  33. Xu, W.L.; Cui, W.G.; Li, W.B.; Guo, W.Q. Development and characterizations of super-fine wool powder. Powder Technol. 2004, 140, 136–140. [Google Scholar] [CrossRef]
  34. Kotlhao, K.; Mtunzi, F.M.; Pakade, V.; Ejidike, I.P.; Klink, M.J. Synthesis, characterization and evaluation of Ag-TiO2nanocomposites for photo-catalytic degradation of selected Chlorophenols. Dig. J. Nanomater. Biostruct. 2018, 13, 835–846. [Google Scholar]
  35. Behzadnia, A.; Montazer, M.; Rad, M.M. In situ photo sonosynthesis of organic/inorganic nanocomposites on wool fabric introducing multifunctional properties. Photochem. Photobiol. 2016, 92, 76–86. [Google Scholar] [CrossRef] [PubMed]
  36. Fan, C.Y.; Fu, X.X.; Shi, L.; Yu, S.Q.; Qian, G.D.; Wang, Z.Y. Ultrasonic-induced nanocomposites with anatase@amorphous TiO2 core-shell structure and their photocatalytic activity. RSC Adv. 2016, 6, 67444–67448. [Google Scholar] [CrossRef]
  37. Calisir, M.D.; Gungor, M.; Ddmir, A.; Kilic, A.; Khan, M.M. Nitrogen-doped TiO2 fibers for visible-light-induced photocatalytic activities. Ceram. Int. 2020, 46, 16743–16753. [Google Scholar] [CrossRef]
  38. Bai, X.; Jia, J.; Du, Y.Y.; Hu, X.Y.; Li, J.L.; Liu, E.Z.; Fan, J. Multi-level trapped electrons system in enhancing photocatalytic activity of TiO2 nanosheets for simultaneous reduction of Cr (VI) and RhB degradation. Appl. Surf. Sci. 2020, 503, 144298. [Google Scholar] [CrossRef]
  39. Zhang, Q.; Yao, C.; Hong, J.M.; Chang, C.T. Preparation of Pt/TiO2/graphene/polyethylene sheets via a facile molding process for azo dye electrodegradation. J. Nanosci. Nanotechnol. 2020, 20, 3287–3294. [Google Scholar] [CrossRef]
  40. Rajkhowa, R.; Zhou, Q.; Tsuzuki, T.; Morton, D.A.V.; Wang, X.G. Ultrafine wool powders and their bulk properties. Powder Technol. 2012, 224, 183–188. [Google Scholar] [CrossRef]
  41. Zhang, B.; He, X.; Ma, X.H.; Chen, Q.H.; Liu, G.C.; Zhou, Y.M.; Ma, D.; Cui, C.Y.; Ma, J.; Xin, Y.J. In situ synthesis of ultrafine TiO2 nanoparticles modified g-C3N4 heterojunction photocatalyst with enhanced photocatalytic activity. Sep. Purif. Technol. 2020, 247, 116932. [Google Scholar] [CrossRef]
  42. Zarrin, S.; Heshmatpour, F. Facile preparation of new nanohybrids for enhancing photocatalytic activity toward removal of organic dyes under visible light irradiation. J. Phys. Chem. Solids. 2020, 140, 109271. [Google Scholar] [CrossRef]
  43. Mutyala, S.; Sadiq, M.M.J.; Gurulakshmi, M.; Suresh, C.; Bhat, D.K.; Shanthi, K.; Mathiyarasu, J. Disintegration of flower-like MoS2 to limply allied layers on spherical nanoporous TiO2: Enhanced visible-light photocatalytic degradation of methylene blue. J. Nanosci. Nanotechnol. 2020, 20, 1118–1129. [Google Scholar] [CrossRef] [PubMed]
  44. Zhao, X.; Zhang, X.J.; Han, D.X.; Niu, L. Ag supported Z-scheme WO2.9/g-C3N4 composite photocatalyst for photocatalytic degradation under visible light. Appl. Surf. Sci. 2020, 501, 144258. [Google Scholar] [CrossRef]
  45. Chai, Y.Y.; Ding, J.; Wang, L.; Liu, Q.Q.; Ren, J.; Dai, W.L. Enormous enhancement in photocatalytic performance of Ag3PO4/HAp composite: A Z-scheme mechanism insight. Appl. Catal. B Environ. 2015, 179, 29–36. [Google Scholar] [CrossRef]
  46. Paul, K.K.; Ghosh, R.; Giri, P.K. Mechanism of strong visible light photocatalysis by Ag2O-nanoparticle-decorated monoclinic TiO2 (B) porous nanorods. Nanotechnology 2016, 27, 315703. [Google Scholar] [CrossRef] [Green Version]
  47. Shao, C.; Meng, X.D.; Jing, P.T.; Sun, M.Y.; Zhao, J.L.; Li, H.B. Enhancement of electron transfer from CdSe core/shell quantum dots to TiO2 films by thermal annealing. J. Lumin. 2011, 142, 196–201. [Google Scholar] [CrossRef]
  48. Chen, W.D.; Zhang, H.; Chen, T.Y.; Yang, L.M.; Wu, H.L.; Tong, Z.; Mao, N.T. TiO2 modified orthocortical and paracortical cells having enhanced photocatalytic degradation and photoreduction properties. Nanotechnology 2021, 32, 025714. [Google Scholar] [CrossRef]
  49. Ghosh, J.P.; Langford, C.H.; Achari, G. Characterization of an LED based photoreactor to degrade 4-chlorophenol in an aqueous medium using coumarin (C-343) sensitized TiO2. J. Phys. Chem. A 2008, 112, 10310–10314. [Google Scholar] [CrossRef]
  50. Yan, X.L.; Ohno, T.; Nishijima, K.; Abe, R.; Ohtani, B. Is methylene blue an appropriate substrate for a photocatalytic activity test? A study with visible-light responsive titania. Chem. Phys. Lett. 2006, 429, 606–610. [Google Scholar] [CrossRef] [Green Version]
  51. Mitoraj, D.; Lamdab, U.; Kangwansupamonkon, W.; Pacia, M.; Macyk, W.; Wetchakun, N.; Beranek, R. Revisiting the problem of using methylene blue as a model pollutant in photocatalysis: The case of InVO4/BiVO4 composites. J. Photochem. Photobiol. A 2018, 366, 103–110. [Google Scholar] [CrossRef]
  52. Di, G.L.; Zhu, Z.L.; Dai, Q.; Zhang, H.; Shen, X.L.; Qiu, Y.L.; Huang, Y.Y.; Yu, J.N.; Yin, D.Q.; Kueppers, S. Wavelength-dependent effects of carbon quantum dots on the photocatalytic activity of g-C3N4 enabled by LEDs. Chem. Eng. J. 2020, 379, 122296. [Google Scholar] [CrossRef]
  53. Qiu, R.L.; Song, L.; Mo, Y.Q.; Zhang, D.D.; Brewer, E. Visible light induced photocatalytic degradation of phenol by polymer-modified semiconductors: Study of the influencing factors and the kinetics. React. Kinet. Catal. Lett. 2008, 94, 183–189. [Google Scholar] [CrossRef]
  54. Zhu, C.S.; Li, Y.L.; Yang, Y.W.; Chen, Y.X.; Yang, Z.G.; Wang, P.; Feng, W.L. Influence of operational parameters on photocatalytic decolorization of a cationic azo dye under visible-light in aqueous Ag3PO4. Inorg. Chem. Commun. 2020, 115, 107850. [Google Scholar] [CrossRef]
  55. Saggioro, E.M.; Oliveira, A.S.; Pavesi, T.; Maia, C.G.; Ferreira, L.F.V.; Moreira, J.C. Use of titanium dioxide photocatalysis on the remediation of model textile wastewaters containing azo dyes. Molecules 2011, 16, 10370–10386. [Google Scholar] [CrossRef]
  56. Rajabinejad, H.; Patrucco, A.; Caringella, R.; Montarsolo, A.; Zoccola, M.; Pozzo, P.D. Preparation of keratin-based microcapsules for encapsulation of hydrophilic molecules. Ultrason. Sonochem. 2018, 40, 527–532. [Google Scholar] [CrossRef] [PubMed]
  57. De Lima, C.A.P.; Araujo, B.A.; da Silva, K.S.; Silva, C.B.; de Lima, G.G.C.; Vieira, F.F.; de Medeiros, K.M. Advanced oxidative process by heterogeneous photocatalysis for chemical laboratories effluents treatment. Desalin. Water Treat. 2020, 174, 248–257. [Google Scholar] [CrossRef]
  58. Naushad, M.; Sharma, G.; Alothman, Z.A. Photodegradation of toxic dye using Gum Arabic-crosslinked-poly(acrylamide)/Ni(OH)2/FeOOH nanocomposites hydrogel. J. Clean. Prod. 2019, 241, 118263. [Google Scholar] [CrossRef]
  59. Rahimi, S.; Ayati, B.; Rezaee, A. Kinetic modeling and determination role of sono/photo nanocatalyst-generated radical species on degradation of hydroquinone in aqueous solution. Environ. Sci. Pollut. R. 2016, 23, 12185–12198. [Google Scholar] [CrossRef]
  60. Pastrana-Martinez, L.M.; Pereira, N.; Lima, R.; Faria, J.L.; Gomes, H.T.; Silva, A.M.T. Degradation of diphenhydramine by photo-Fenton using magnetically recoverable iron oxide nanoparticles as catalyst. Chem. Eng. J. 2015, 261, 45–52. [Google Scholar] [CrossRef]
  61. Koh, P.W.; Hatta, M.H.M.; Ong, S.T.; Yuliati, L.; Lee, S.L. Photocatalytic degradation of photosensitizing and non-photosensitizing dyes over chromium doped titania photocatalysts under visible light. J. Photochem. Photobiol. A 2017, 332, 215–223. [Google Scholar] [CrossRef]
  62. Cestellos-Blanco, S.; Zhang, H.; Kim, J.M.; Shen, Y.X.; Yang, P.D. Photosynthetic semiconductor biohybrids for solar-driven biocatalysis. Nat. Catal. 2020, 3, 245–255. [Google Scholar] [CrossRef]
  63. Wang, Y.; Feng, C.X.; Zhang, M.; Yang, J.J.; Zhang, Z.J. Enhanced visible light photocatalytic activity of N-doped TiO2 in relation to single-electron-trapped oxygen vacancy and doped-nitrogen. Appl. Catal. B Environ. 2010, 100, 84–90. [Google Scholar] [CrossRef]
  64. Alivov, Y.; Grant, T.; Capan, C.; Iwamoto, W.; Pagliuso, P.G.; Molloi, S. Origin of magnetism in undoped TiO2 nanotubes. Nanotechnology 2013, 24, 275704. [Google Scholar] [CrossRef] [PubMed]
  65. Zhang, Z.Z.; Liang, Y.Q.; Huang, H.L.; Liu, X.Y.; Li, Q.; Chen, L.X.; Xu, D.S. Stable and highly efficient photocatalysis with lead-free double-perovskite of Cs2AgBiBr6. Angew. Chem. Int. Ed. 2019, 58, 7263–7267. [Google Scholar] [CrossRef]
  66. Wang, Q.; Zhao, J.C.; Cong, Y.Q.; Zhang, Y. Photo-sensitized degradation of dye pollutants on amorphous TiO2 under visible light irradiation. Chin. J. Catal. 2011, 32, 1076–1082. [Google Scholar] [CrossRef]
  67. Krylova, G.; Na, C.Z. Photoinduced crystallization and activation of amorphous titanium dioxide. J. Phys. Chem. C 2015, 119, 12400–12407. [Google Scholar] [CrossRef]
  68. Park, M.; Kim, H.Y.; Jin, F.L.; Lee, S.Y.; Choi, H.S.; Park, S.J. Combined effect of corona discharge and enzymatic treatment on the mechanical and surface properties of wool. J. Ind. Eng. Chem. 2014, 20, 179–183. [Google Scholar] [CrossRef]
  69. Frunza, L.; Diamandescu, L.; Zgura, I.; Frunza, S.; Ganea, C.P.; Negrila, C.C.; Enculescu, M.; Birzu, M. Photocatalytic activity of wool fabrics deposited at low temperature with ZnO or TiO2 nanoparticles: Methylene blue degradation as a test reaction. Catal. Today 2018, 306, 251–259. [Google Scholar] [CrossRef]
  70. Liu, H.J.; Chen, P.; Yuan, X.Y.; Zhang, Y.X.; Huang, H.W.; Wang, L.A.; Dong, F. Pivotal roles of artificial oxygen vacancies in enhancing photocatalytic activity and selectivity on Bi2O2CO3 nanosheets. Chin. J. Catal. 2019, 40, 620–630. [Google Scholar] [CrossRef]
  71. Cao, J.; Xu, B.Y.; Lin, H.L.; Luo, B.D.; Chen, S.F. Chemical etching preparation of BiOI/BiOBr heterostructures with enhanced photocatalytic properties for organic dye removal. Chem. Eng. J. 2012, 185, 91–99. [Google Scholar] [CrossRef]
  72. Eser, F.; Onal, A. Dyeing of wool and cotton with extract of the nettle (Urtica dioica L.) leaves. J. Nat. Fibers 2015, 12, 222–231. [Google Scholar] [CrossRef]
  73. Tian, B.; Chen, F.; Tong, Y.X.; Li, L.; Zheng, Y.F.; Liu, Y.; Li, Q.Z. Phase transition of Ni-Mn-Ga alloy powders prepared by vibration ball milling. J. Alloys Compd. 2011, 509, 4563–4568. [Google Scholar] [CrossRef]
  74. Shirgholami, M.A.; Karimi, L.; Mirjalili, M. Multifunctional modification of wool fabric using graphene/TiO2 nanocomposite. Fibers Polym. 2016, 17, 220–228. [Google Scholar] [CrossRef]
  75. Goswami, S.; Sharma, A.K. Investigation of the optical behavior of indium oxide thin films with the aid of spectroscopic ellipsometry technique. Appl. Surf. Sci. 2019, 495, 143609. [Google Scholar] [CrossRef]
  76. Taguchi, S.; Saruyama, M.; Teranishi, T.; Kanemitsu, Y. Quantized auger recombination of biexcitons in CdSe nanorods studied by time-resolved photoluminescence and transient-absorption spectroscopy. Phys. Rev. B 2011, 83, 155324. [Google Scholar] [CrossRef] [Green Version]
  77. Tian, S.Z.; Li, X.W.; Jiang, J.; Wang, K.; Zhang, H.Q.; Yu, A.M.; Zhang, Z.W. Application of Cu2+-based electron spin resonance spectroscopy in measurement of antioxidant capacity of fruits. Anal. Bioanal. Chem. 2019, 411, 6677–6686. [Google Scholar] [CrossRef]
  78. Ghayeb, Y.; Momeni, M.M. Novel visible-light-responsive photo-catalysts based on palladium decorated nanotube films fabricated on titanium substrates. Ceram. Int. 2016, 42, 11209–11216. [Google Scholar] [CrossRef]
  79. O’Dell, J.W. Method 410.4-The Determination of chemical oxygen demand by semi-automated colorimetry. In Methods for the Determination of Metals in Environmental Samples, 1st ed.; Elsevier: Cincinnati, OH, USA, 1996; pp. 509–521. [Google Scholar]
  80. Pelaez, M.; Falaras, P.; Likodimos, V.; O’Shea, K.; de la Cruz, A.A.; Dunlop, P.S.M.; Byrne, J.A.; Dionysiou, D.D. Use of selected scavengers for the determination of NF-TiO2 reactive oxygen species during the degradation of microcystin-LR under visible light irradiation. J. Mol. Catal. A Chem. 2016, 425, 183–189. [Google Scholar] [CrossRef]
Figure 1. FESEM images of the surface morphologies of wool pallets (a) 30,000× before and (b) 30,000× and (c) 100,000× after treatment with TBT in a hydrothermal process; (d) EDX spectrum and (e) element mapping of the WT powders.
Catalysts 11 00012 g001
Figure 2. (a) XRD patterns of wool pallets before and after loading TiO2; (bd) TEM images of the cross-section of WT powders and the (e,f) corresponding SAED patterns
Catalysts 11 00012 g002
Figure 3. Nitrogen adsorption–desorption isotherms (a), pore size distribution curve (b) of the WT powders; the particle size distribution curves (c) of the WT powders before and after one photodegradation cycle.
Catalysts 11 00012 g003
Figure 4. (a) Diffuse reflectance spectra of wool pallets before and after loading TiO2, and (b) the corresponding plot of (αhv)2~hv; (c) the UPS spectrum, and (d) schematic diagram of energy band-gap of the WT powders.
Catalysts 11 00012 g004
Figure 5. The (a) steady-state PL spectra and (b) time-resolved PL spectra of the WT powders and TiO2 nanoparticles.
Catalysts 11 00012 g005
Figure 6. EPR spectra of (a) •O2, (b) •OH, (c) 1O2, and (d) h+ for the WT powders under visible light irradiation.
Catalysts 11 00012 g006
Figure 7. Reaction mechanism of the WT powders on the photodegradation of MB dye solutions under visible light irradiation.
Catalysts 11 00012 g007
Figure 8. Schematic illustration for the fabrication of the WT hybrid composite powders.
Catalysts 11 00012 g008
Publisher’s Note: MDPI stays neutral with regard to jurisdictional claims in published maps and institutional affiliations.

