Article

Synthesis of N-Doped TiO2 for Efficient Photocatalytic Degradation of Atmospheric NOx

1
Department of Advanced Chemicals & Engineering, Chonnam National University, 77 Yongbong-ro, Buk-gu, Gwangju 61186, Korea
2
Department of Materials Science and Engineering, Chonnam National University, 77 Yongbong-ro, Buk-gu, Gwangju 61186, Korea
3
School of Chemical Engineering, Chonnam National University, 77 Yongbong-ro, Buk-gu, Gwangju 61186, Korea
4
Faculty of Engineering and IT, University of Technology, Sydney, P.O. Box 123, Broadway, NSW 2007, Australia
5
Photocatalysis International Research Center (PIRC), Research Institute for Science and Technology (RIST), Tokyo University of Science, 2641 Yamazaki, Noda, Chiba 278-8510, Japan
*
Authors to whom correspondence should be addressed.
Catalysts 2021, 11(1), 109; https://doi.org/10.3390/catal11010109
Submission received: 15 December 2020 / Revised: 11 January 2021 / Accepted: 12 January 2021 / Published: 14 January 2021
(This article belongs to the Special Issue Commemorative Issue in Honor of Professor Akira Fujishima)

Abstract

:
Titanium oxide (TiO2) is a potential photocatalyst for removing toxic NOx from the atmosphere. Its practical application is, however, significantly limited by its low absorption into visible light and a high degree of charge recombination. The overall photocatalytic activity of TiO2 remains too low since it can utilize only about 4–5% of solar energy. Nitrogen doping into the TiO2 lattice takes advantage of utilizing a wide range of solar radiation by increasing the absorption capability towards the visible light region. In this work, N-doped TiO2, referred to as TC, was synthesized by a simple co-precipitation of tri-thiocyanuric acid (TCA) with P25 followed by heat treatment at 550 degrees C. The resulting nitrogen doping increased the visible-light absorption and enhanced the separation/transfer of photo-excited charge carriers by capturing holes by reduced titanium ions. As a result, TC samples exhibited excellent photocatalytic activities of 59% and 51% in NO oxidation under UV and visible light irradiation, in which the optimum mass ratio of TCA to P25 was found to be 10.

Graphical Abstract

1. Introduction

Atmospheric pollution resulting from photochemical oxidants, such as nitrogen oxides (NOx; NO+NO2) and ozone, has been considered one of the critical concerns in urban areas. [1]. NOx, a by-product resulting from fossil fuel incineration and photochemical conversion in nature, is mainly considered a dominant contributor to environmental problems such as photochemical smog, acid rain, haze, etc. [2,3]. The atmospheric NOx concentration (annual mean concentrations of 0.01–0.05 ppm in urban areas over the world [4]) has drastically increased over the past few decades due to industrial genesis and automobile development [2]. NOx has stimulating effects on the environment, human and animal health, and plant vegetation [5]. Consequently, over the past few decades, the demand to mitigate the detrimental effects of NOx has increased in light of sustainable climate policy, and this has inspired increased focus on NOx efficacy. Therefore, researchers have manifested various schemes such as direct decomposition [6], selective catalytic/non-catalytic reduction [7], solid–liquid adsorption [8], plasma-assisted catalytic reduction [9], and photocatalytic oxidation (PCO) for effective removal of NOx from the atmosphere. However, most of those propositions are not commercially feasible for NOx removal at low concentration levels and require intricate devices, engineering, or relatively high temperatures.
Among various approaches, PCO is a potential and cost-effective method to manage atmospheric pollutants [10]. The PCO of NOx is an effective process due to its ability to use enormous, inexhaustible solar energy, moderate reaction conditions appropriate for cheap and large-scale application [11,12]. TiO2 has gained significant attention as a photocatalyst with the breakthrough of photocatalytic water splitting capability. What is more, TiO2 features a strong photocatalytic oxidation competence, photostability, non-toxicity, and cost-effectiveness [13]. Usually, from theoretical and experimental studies, it has been demonstrated that the dominant anatase facets have better photoactivity than rutile [14]. Under UV light irradiation, TiO2 generates electrons and holes in the conduction band and valence bands, respectively, facilitating the oxidation-reduction (redox) reactions for pollutant degradation [15,16]. However, the photocatalytic activities of anatase TiO2 are restricted by their large energy bandgap (~3.6 eV) and immediate recombination of photogenerated e/h+ pairs [17]. Consequently, typical TiO2 primarily exhibits low quantum efficiency under UV irradiation with a wavelength of <387 nm. Therefore, TiO2 can utilize a maximum of 4–5% of the solar radiation during photocatalysis [17], mostly wasted for recombination in their bulk phase. So far, researchers have proposed many strategies for the improvement of photocatalytic activity of TiO2 in NO oxidation by varying their crystal phase [18], engineering the energy bandgap to shift its absorption edge into the visible region [19,20], increasing specific surface area via porosity introduction [21], and doping of anions such as nitrogen and carbon in TiO2 [22,23,24].
In this study, nitrogen is considered to be an effective dopant because of its similar size (155 pm) to oxygen (152 pm) as well as similar ionization energy (first ionization energy 1402.3 kJ/mol) compared to oxygen (first ionization energy 1313.9 kJ/mol) [25]. N-doped TiO2 also has an improved photocatalytic activity in the visible light region, similar to oxidation of CO, C2H6, and ethylene [26,27]. It is well established that the doping of nitrogen into the TiO2 lattice produces a narrower band gap by coupling N 2p states with O 2p states and creates donor states over the valence band (VB). This process attenuates the energy band gap of TiO2 and generates oxygen vacancy, both of which enhance the absorbance of visible light [28]. Therefore, in this study, N-doped TiO2 powder was fabricated by a simple co-precipitation of TCA and TiO2 P25, followed by calcination at 550 °C for 4 h in N2 atmosphere. This is the novel strategy to synthesize N-doped TiO2 from TCA as a nitrogen precursor. In general, the substitution of nitrogen with oxygen in TiO2 happens above 675 °C under N2 atmosphere using cyanamide, melamine, and melem as nitrogen sources. Nevertheless, in this study, using TCA lowers the temperature to 550 °C since the SH group acts as a leaving group, and at lower temperatures polycondensation takes place, which facilitates doping of nitrogen into TiO2 [29,30]. The synthesized N-doped TiO2 materials showed a pronounced ability to absorb visible light and improved the bandgap structure with more negative (0.73 eV) conduction band (CB) potential than O2/˙O2 potential of −0.33 eV for NO oxidation. Thus, with such a narrow energy bandgap and broad absorption ability of visible light, the synthesized N-doped TiO2 materials exhibited enhanced photocatalytic oxidation of NO under both UV and visible light irradiation. This study governs a new method for fabricating N-doped TiO2 for efficient photocatalytic degradation of noxious atmospheric NOx.

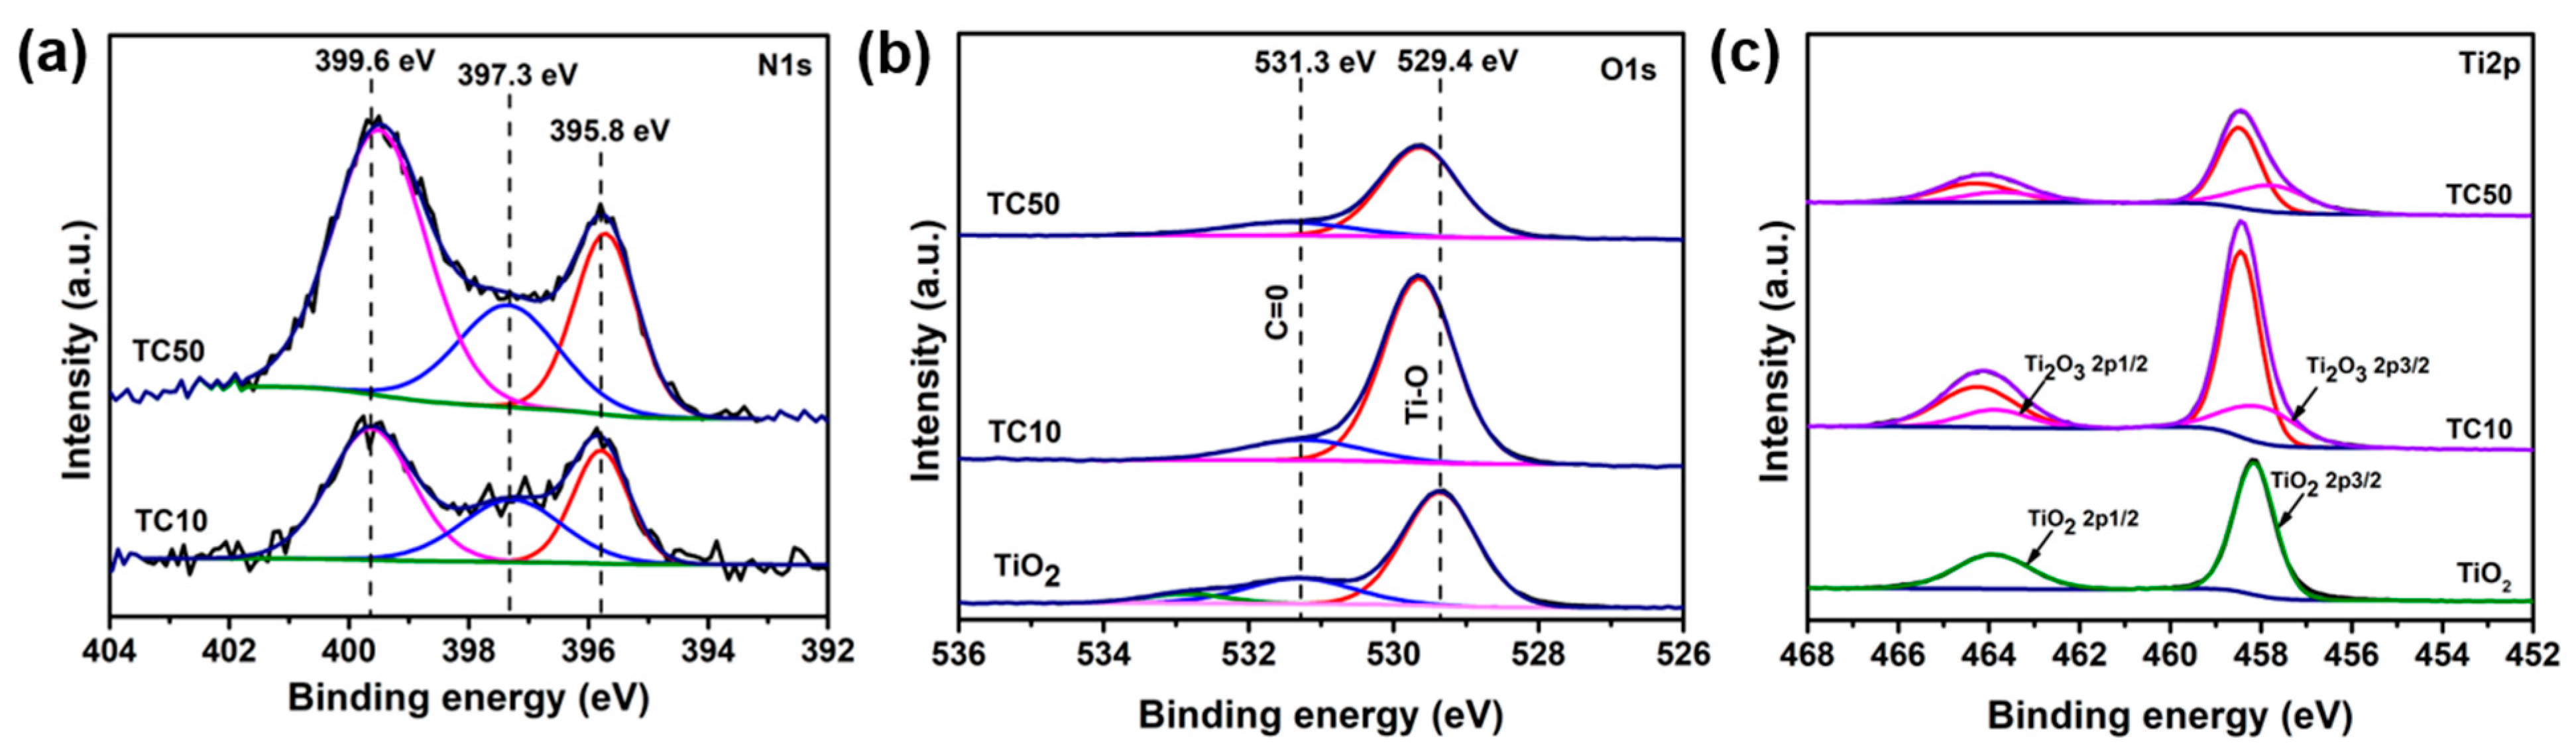
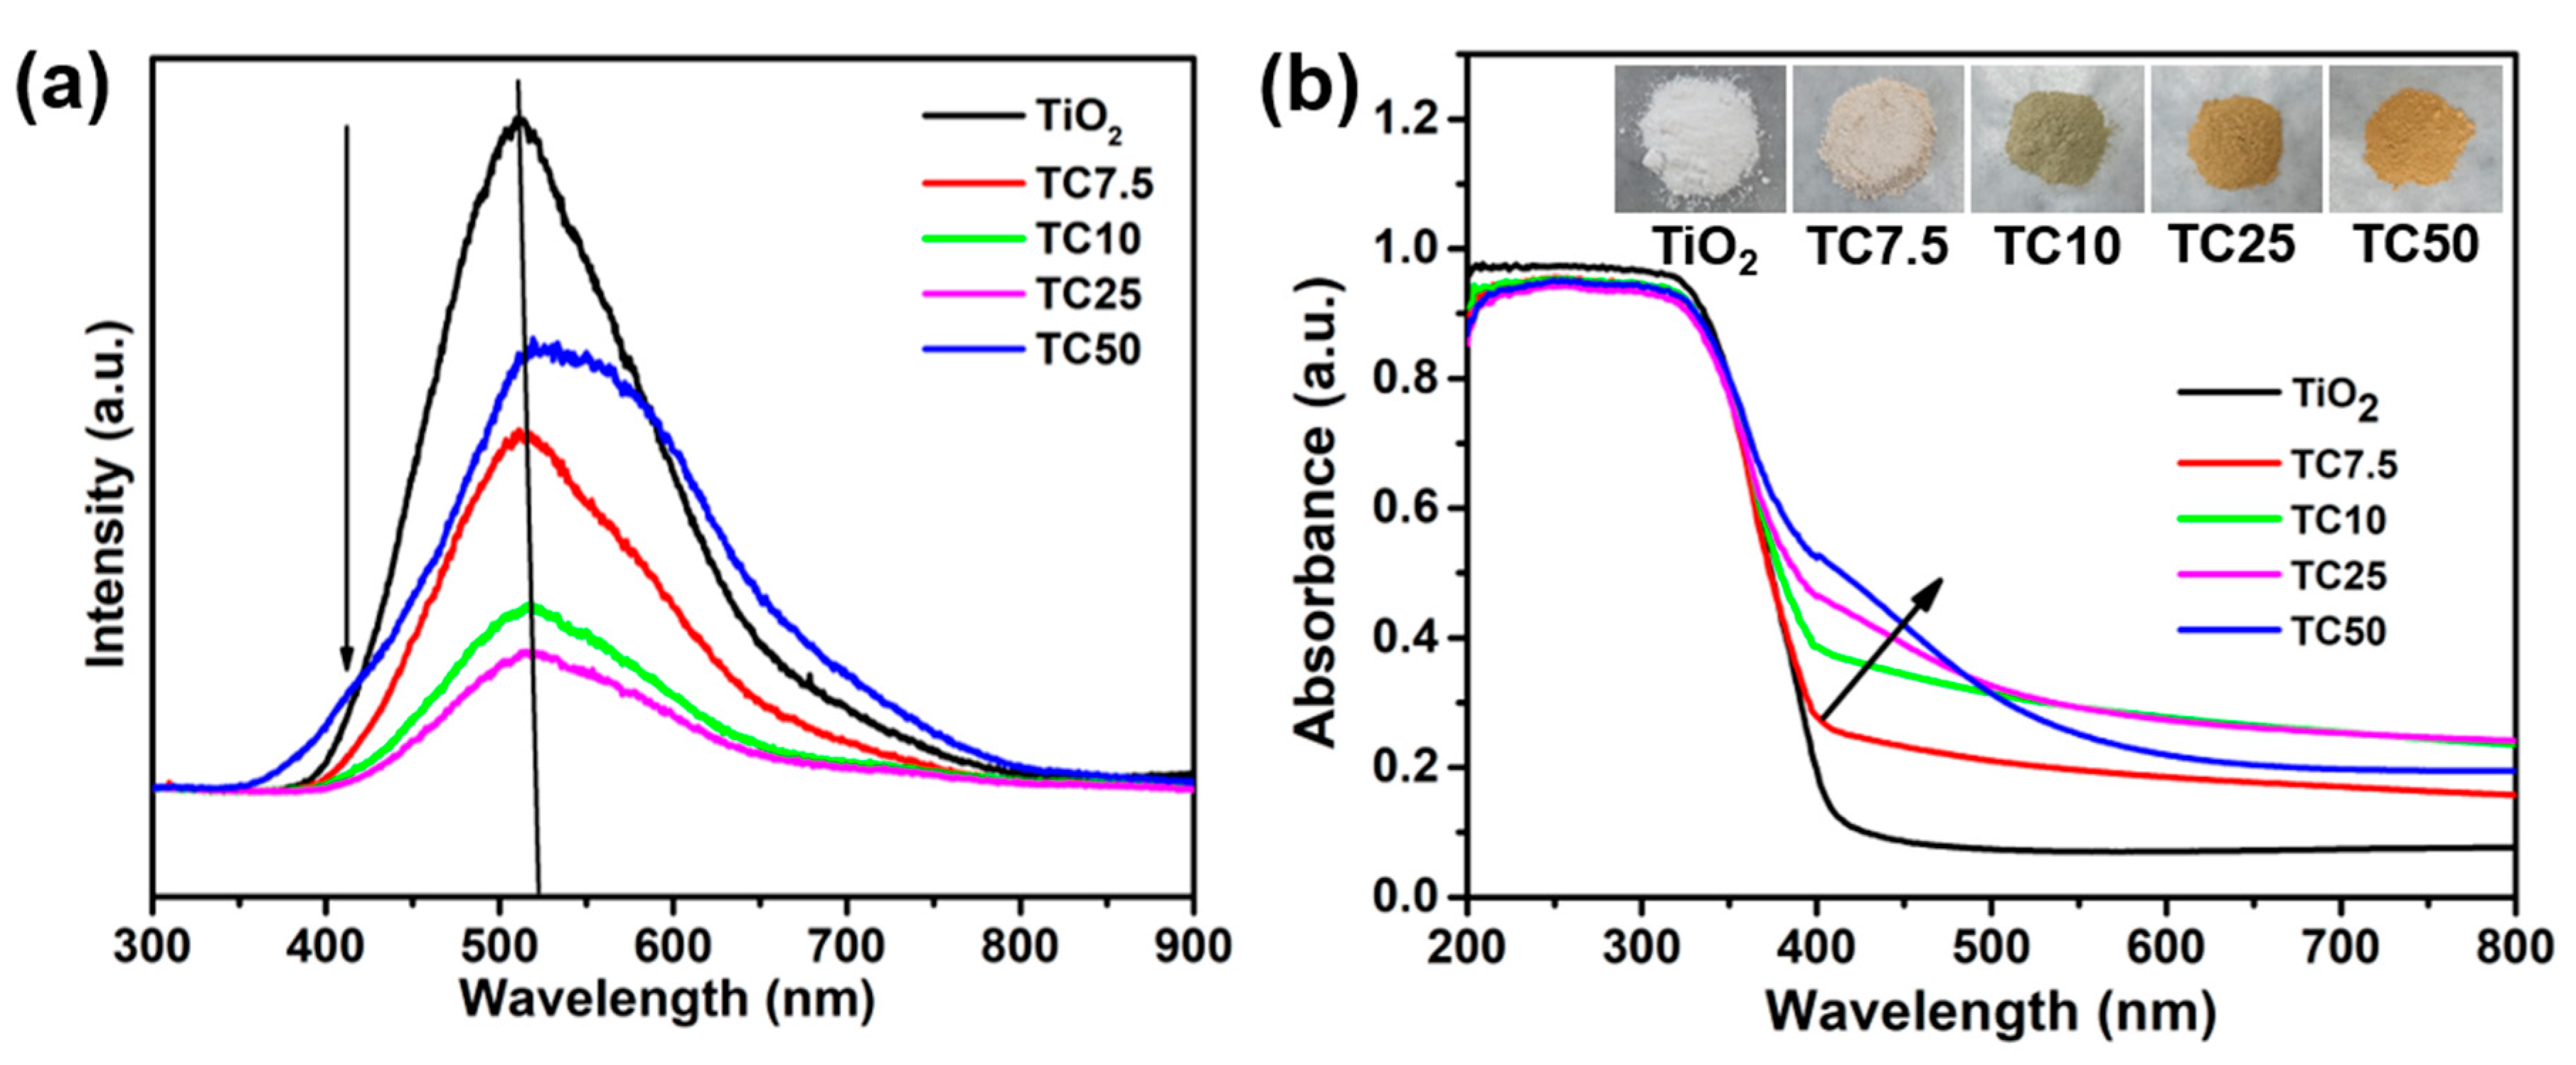
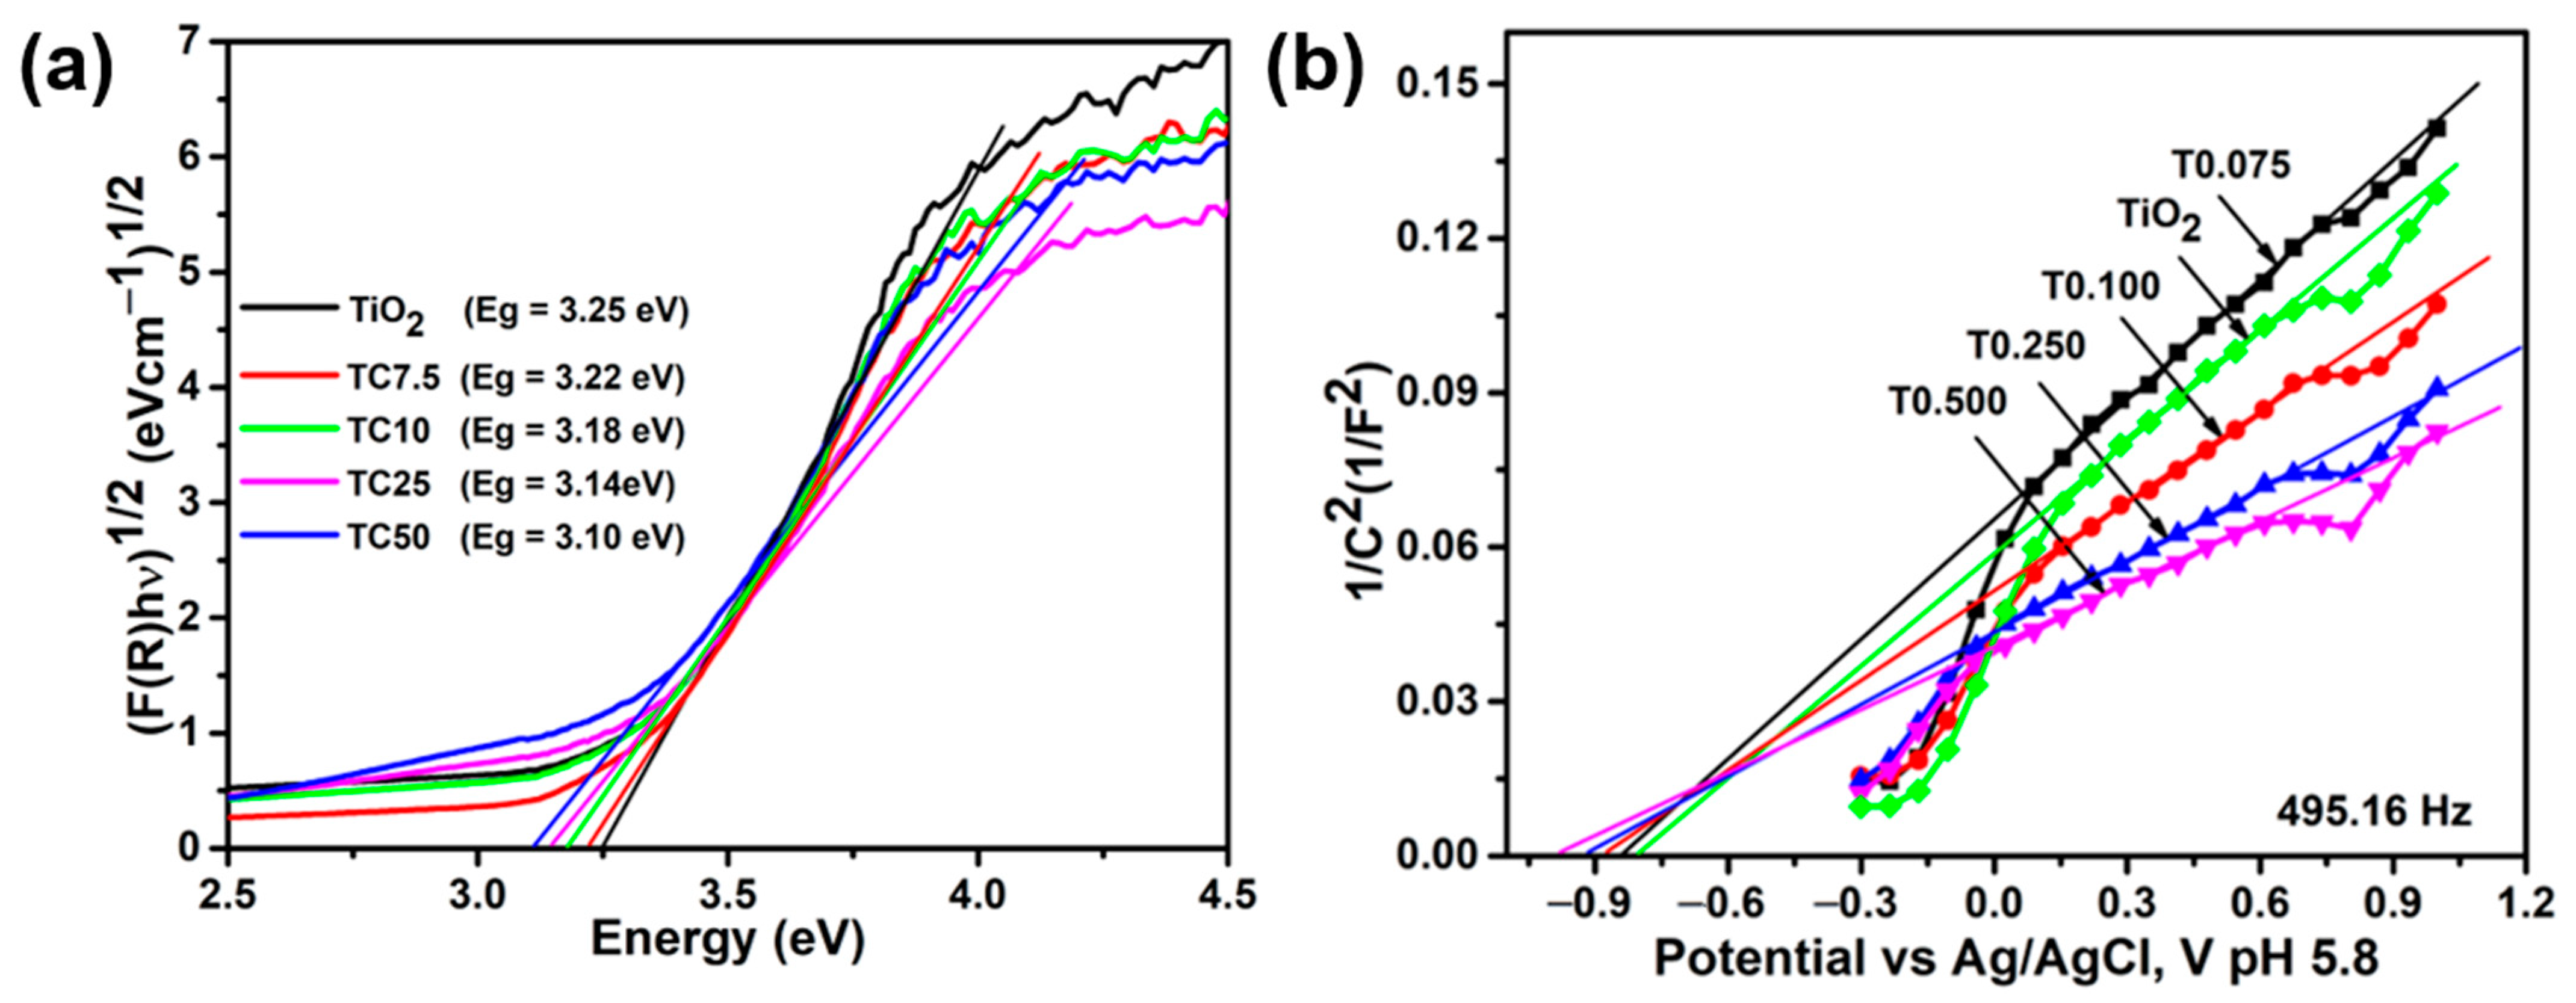
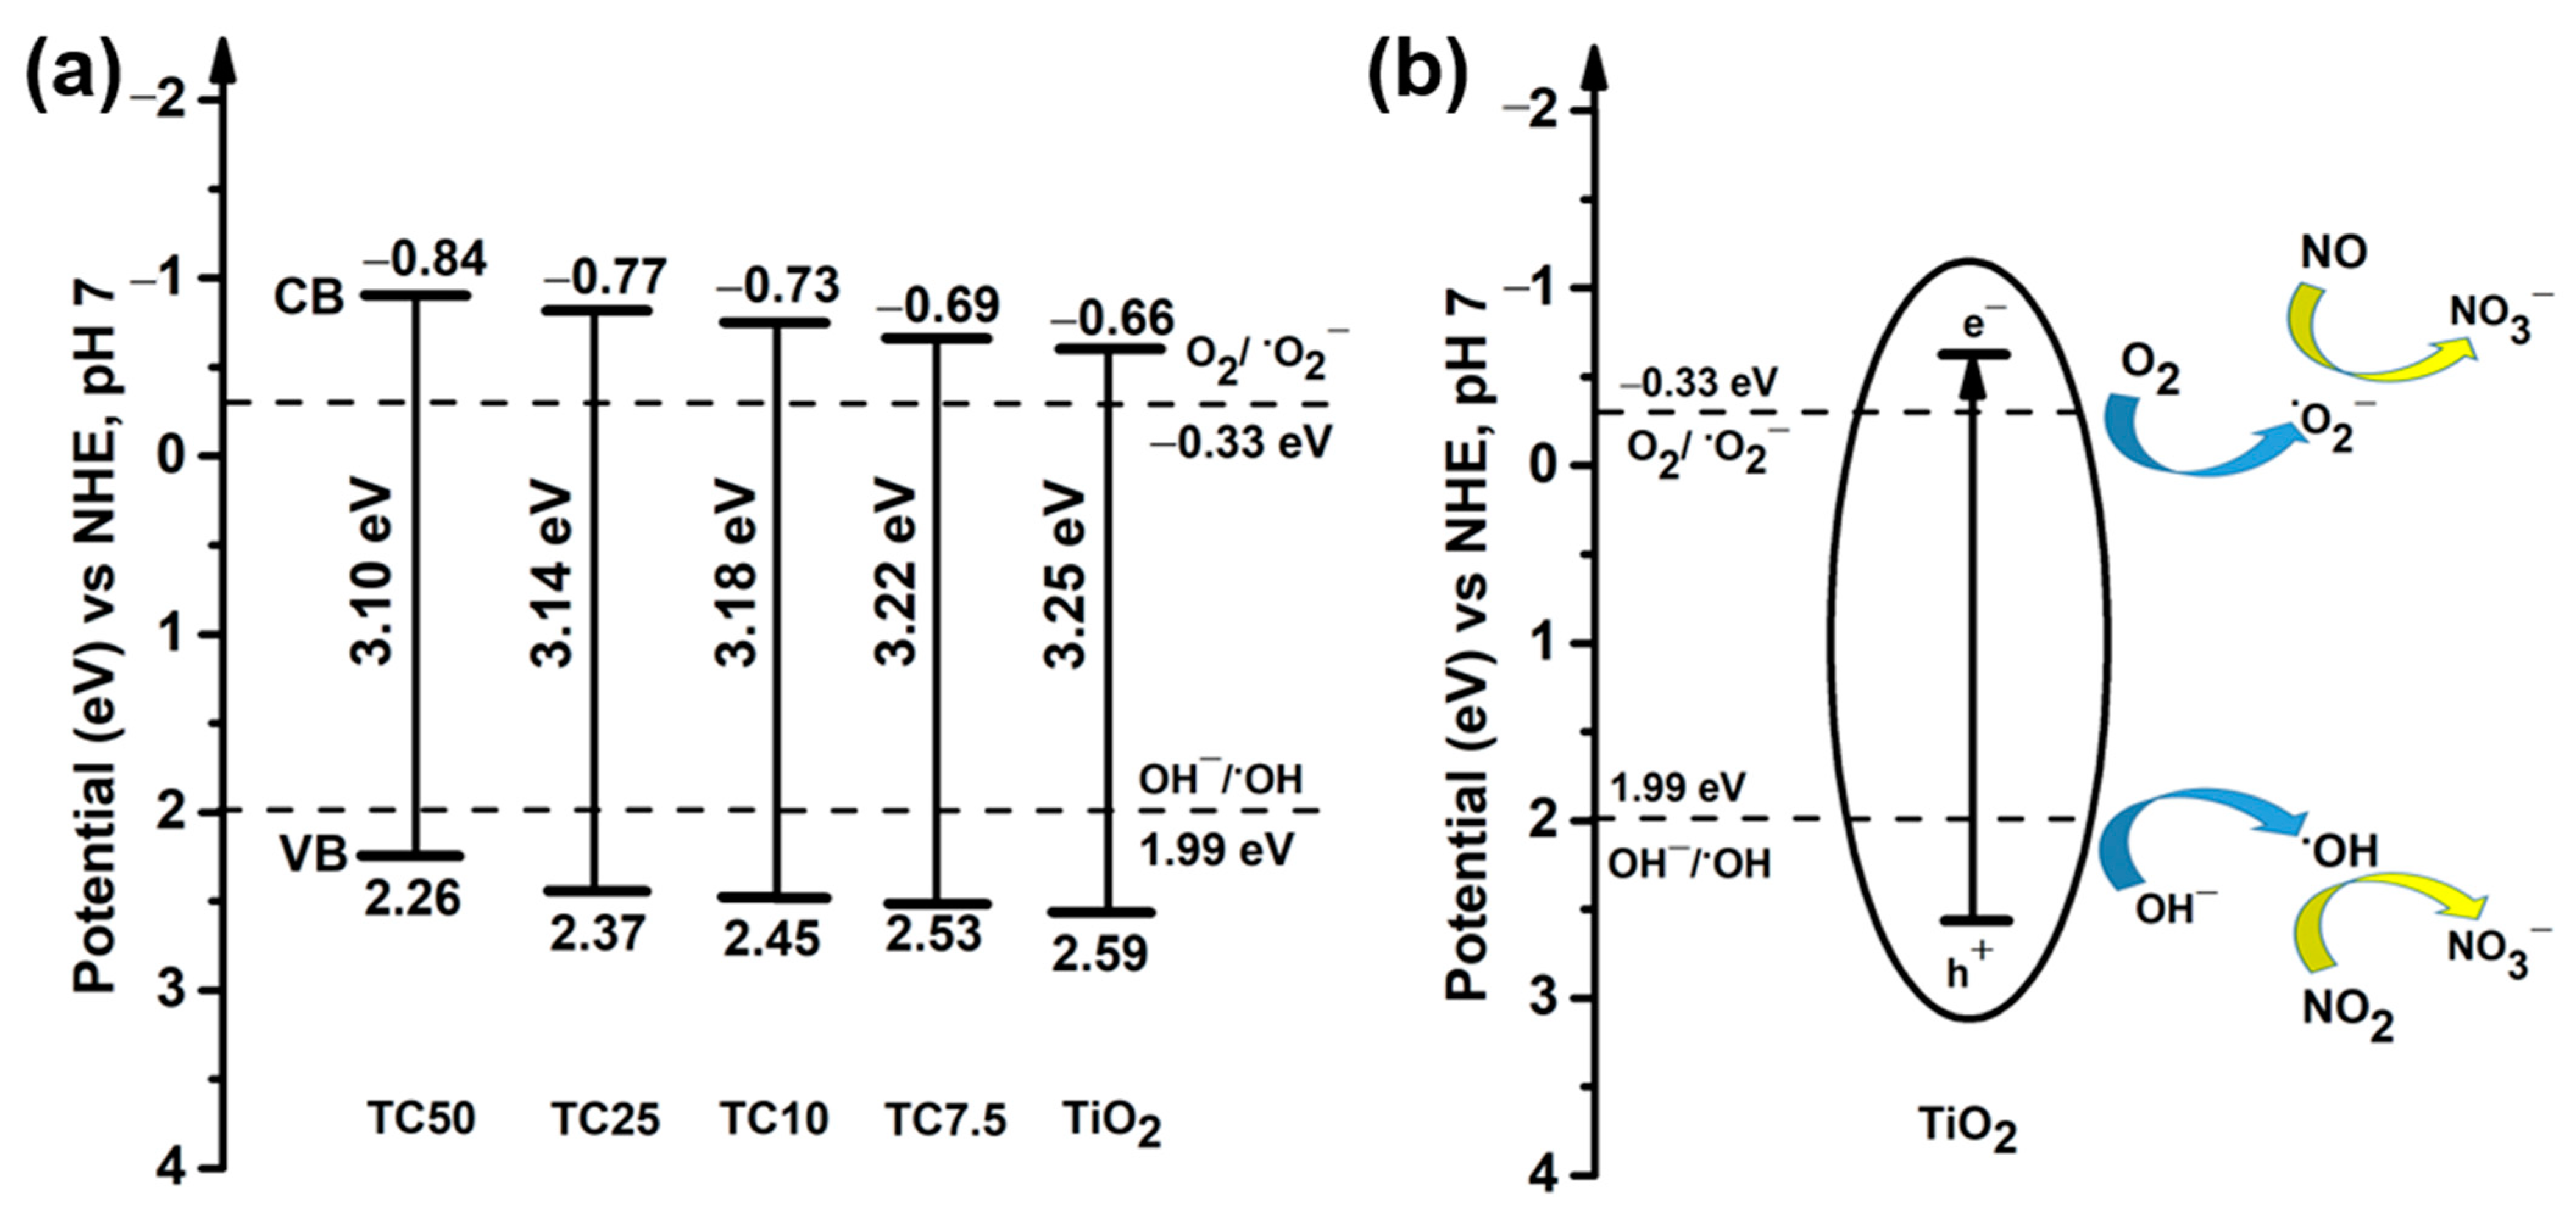
2. Results and Discussion
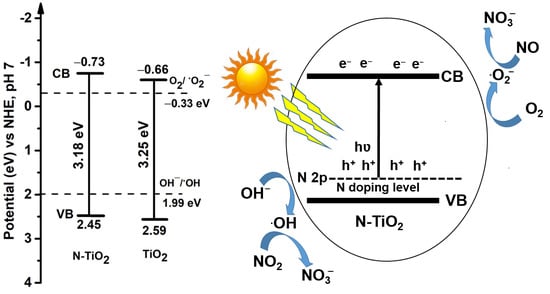
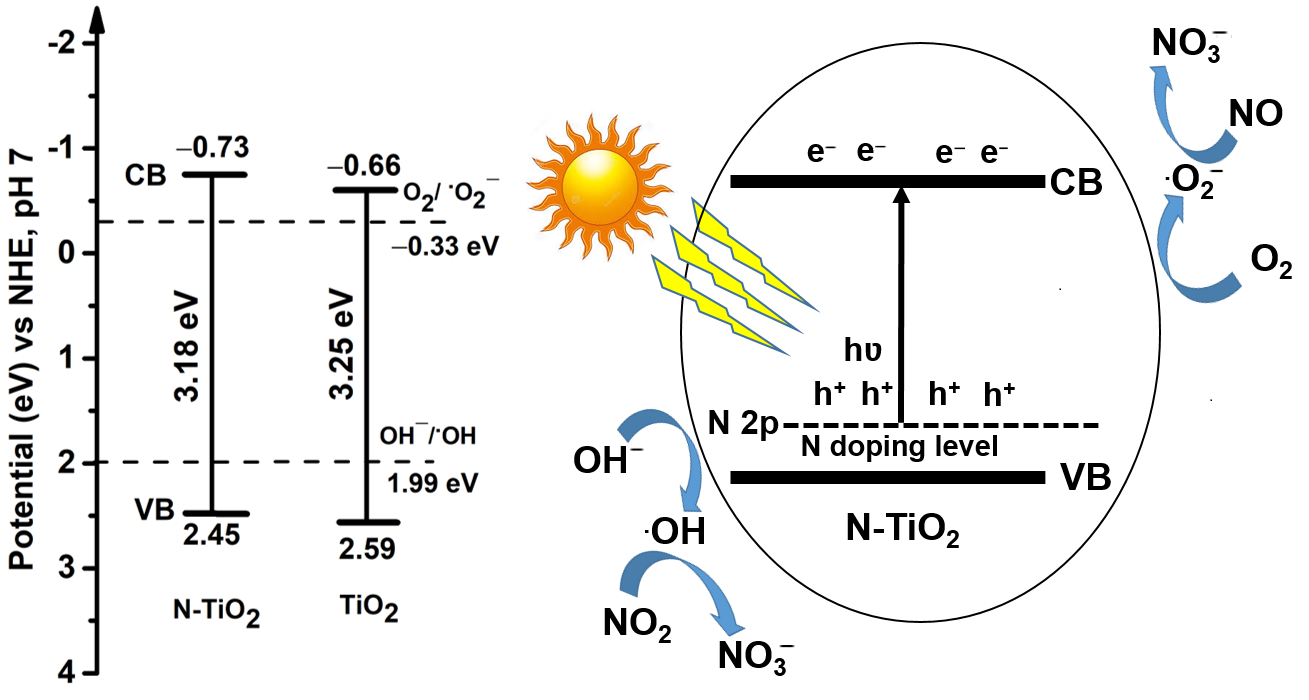
The crystal phase structure of the prepared materials was investigated using XRD. Figure 1a compares the XRD patterns of pure TiO2 P25 and all the prepared N-doped TiO2 materials (TCX; TC means N-doped TiO2, X is wt% of TCA on TiO2). It showed that both the anatase phase (JCPDS21-1272) and the rutile phase (JCPDS21-1276) of TiO2 were present in pure TiO2 as well as N-doped TiO2 materials. This is consistent with the biphasic structure of commercial TiO2 P25. The XRD patterns also indicate that there were no other characteristic peaks from impurities. To further investigate N doping effects on crystallite size, the calculated crystal size of pure TiO2 P25 and the synthesized N-doped TiO2 are given in supporting information in Table S1. The crystal size of synthesized materials was determined from half-width of (101) peak using Scherrer’s formula. The crystallite size of pure TiO2 P25 was found at 16.60 nm [31]. The crystallite size increased up to 18.54 nm with doping of larger atomic radius nitrogen (N3− 170 Å) into oxygen (O2− 140 Å) [32]. In this study, though the shifting of peak position was not observed significantly, the crystallite size increased with nitrogen doping. This phenomenon can be explained by the fact that the nitrogen doping may sharpen the XRD peak by enhancing the growth rate of crystal and increase the crystallite size.
FT˗IR spectra of pure TiO2 P25 and the synthesized N-doped TiO2 materials are illustrated in Figure 1b. The absorption peak in the region between 650 cm−1 and 800 cm−1 was identified for the Ti–O and O–Ti–O bond vibrations for both the N-doped TiO2 and pure TiO2 P25 [33]. The broad absorption peak between 3000 cm−1 and 3600 cm−1 was attributed to the N-H stretching vibration of the residual N-H group or O-H of absorbed H2O [34]. The small absorption peak at 1050 cm−1 for the N-Ti-O bond was observed for all the synthesized N-doped TiO2 materials, confirming the nitrogen incorporation into TiO2 P25 [35].
The morphological structure of pure TiO2 P25 and N-doped TiO2 was assessed to determine whether the particle size changed with nitrogen doping using SEM and HR-TEM (Figure 2). There was no particular particle size change on nitrogen doping until TC50 compared to TiO2 P25, where the spherical nanoparticles were observed (Figure 2a–e). Though the change of particle size was not clearly observable from SEM images, the surface area was investigated by an N2 adsorption desorption isotherm (Figure S2). The BET surface area and the pore volume for pure TiO2 P25 and synthesized N-doped TiO2 materials are given in Table S1. From N2 adsorption desorption isotherm it is clearly seen that the surface area decreased with nitrogen doping, suggesting the doping of nitrogen into TiO2. Figure 2f depicts the HR-TEM image of TC10. The lattice fringe with d-spacing of 0.350 nm and 0.240 nm was observed due to the anatase (101) lattice planes of TiO2 nanoparticles and 0.320 nm due to the rutile (110) lattice plane of pure TiO2 P25 [36].
XPS was carried out to investigate the surface chemical composition and the electronic state of each element. The XPS survey scan spectra and elemental composition of pure TiO2 P25, TC10, and TC50 are provided in Supporting Information Figure S1 and Table S2. The photoelectron peaks on the survey spectra at around the binding energies of 285, 399, 459.5, and 530.5 eV were assigned to C1s, N1s, Ti2p, and O1s, respectively, indicating the presence of nitrogen in the N-doped TiO2 materials. Here, the nitrogen contents increased with increasing TCA contents in Table S2, suggesting incorporating nitrogen into TiO2 lattice. The N1s spectrum in Figure 3a consists of three peaks at 399.6, 397.3, and 395.8 eV. The peak at around 399.6 eV is characterized by the absorbed NHx at the surface of the particle. The peak at 397.3 eV is assigned to Ti-O-N bond; it is due to the interstitial position of N into TiO2 lattice. Furthermore, around 395.8 eV peaks are attributed to the Ti-N-Ti bond due to N substitutional doping on the oxygen site into the TiO2 lattice [37]. Figure 3b shows the O1s spectra of pure TiO2 P25, TC10, and TC50. The peak at 529.4 eV is marked for the Ti-O bond [38]. The minor peak at 531.3 eV is possibly characterized by the impurity hydrocarbon C=O bond [39]. The substitutional Ti-N-Ti bond was also confirmed from the Ti2p XPS spectrum. Figure 3c illustrates the Ti2p spectra of pure TiO2 P25 compared to as-prepared samples of TC10 and TC50. For pure TiO2 P25, at 463.9 eV and 458.3 eV the peak positions confirm the Ti2p1/2 and Ti2p3/2, which affirms the presence of Ti in the Ti4+ species [33]. At 463.6 eV and 458.2 eV, minor peaks in N-doped TiO2 are mainly due to Ti2p1/2 and Ti2p3/2 of Ti2O3, which are usually found due to oxygen vacancy creation on the lattice structure [39]. In comparison to pure TiO2 P25, the N-doped TiO2 had a shift of binding energy to higher energy for both O1s and Ti2p peaks due to the interaction between titanium and nitrogen [40].
Photoluminescence (PL) analysis of pure TiO2 P25 and the prepared N-doped TiO2 for different nitrogen contents was performed at an excitation wavelength (266 nm) to investigate the rate of recombination and separation efficiency of photo-excited electrons and hole pairs. The PL intensity mainly resulted from the recombination of e/h+ pairs. The lower intensity suggests a lower recombination rate and higher separation efficiency of e/h+ pairs [41]. Figure 4a demonstrates the PL spectra of pure TiO2 P25 and the synthesized N-doped TiO2. The PL peaks were found at around 522 nm for pure TiO2 P25, possibly due to the partially reduced titanium ion, surface nitrogen species, and oxygen vacancies [42]. In pure TiO2, usually the energy levels of oxygen vacancies are below the CB of TiO2. The photogenerated electrons in the CB of TiO2 can fall into the oxygen vacancies by the non-irradiation process and then are easily recombined with photogenerated holes on the VB generated by fluorescence emissions [43]. In this study, the PL intensity of N-doped TiO2 decreased and, thus, increased the separation efficiency of photogenerated e/h+ pairs due to capturing of the photogenerated holes by reduced titanium ion (Ti3+). UV–Vis DRS spectroscopy analysis was performed to determine the estimated energy bandgap of pure TiO2 P25 and synthesized N-doped TiO2 materials. Figure 4b illustrates the absorbance spectra of TiO2 and N-doped TiO2 for different nitrogen contents. In this study, the N-doped TiO2 materials compared to pure TiO2 showed yellow color (Figure 2b), suggesting the ability to absorb light in the visible region [40]. The N-doped TiO2 with increasing nitrogen content exhibited a significant red-shift of the absorption edge into the visible light region. This result suggests that nitrogen doping into the TiO2 lattice can successfully narrow the bandgap energy due to modifying the band structure [44].
The energy bandgaps of the pure TiO2 P25 and synthesized N-doped TiO2 materials with different nitrogen contents were determined using the Kubelka–Munk function (F(R)). Extrapolating (F(R)hʋ)1/2 vs. hʋ plot is used to calculate the indirect semiconductor energy bandgap. The estimated energy band gaps were 3.25, 3.22, 3.18, 3.14, and 3.10 eV for pure TiO2 P25, TC7.5, TC10, TC25, and TC50, respectively (Figure 5a). The estimated energy bandgap also revealed the substitutional doping of nitrogen into the TiO2 lattice since interstitial nitrogen doping narrows the energy bandgap significantly more than substitutional doping does [45]. Figure 5b demonstrates the Mott–Schottky plot of pure TiO2 P25 and N-doped TiO2 with different nitrogen contents at 495.16 Hz. In this study, the flat-band potential (Efb) was determined by the Mott–Schottky plot as conduction band minimum (CBM), and the valence band maximum (VBM) was estimated based on the difference from the CBM using the “optical bandgap energy” determined by the Tauc plot. The Schottky formula can be applied to measure the flat-band potentials and the conduction band edge of pure TiO2 and N-doped TiO2, since thin compact TiO2 film behaves similarly to conventional macroscopic semiconductor electrode [46]. TiO2 is an n-type semiconductor, where vacancies act as electron donors. In Mott–Schottky measurements, a semiconductor is in contact with a solution where a redox couple is present. An electron exchange can then occur to match the two Fermi energies (Ef and Eredox). Such electron flow induces a band bending. The flat band potential (Efb) is a counter-potential that flattens the potential back again by compensating the migrated charge capacity effects, which is measured from the M-S plot. Here, the measured flat band potential represents the lower edge of the conduction band, which is approximately the Fermi energy value, on an electrochemical scale [47]. The figure shows that the increase in nitrogen content resulted in a steady shift of the estimated flat-band potentials towards more negative values. The calculated CB and VB potential values are given in Table S3, and the synthesized sample energy diagrams are given in Figure 6a. The potentials were recalculated vs. NHE at pH 7 by the following equations [46].
VCB ≈ VFB(NHE, pH 7) = VFB(Ag/AgCl, pH 5.8) + V − 0.059 ∗ (7 − 5.8)
VVB = VCB + Eg/e,
The N-doped TiO2 with different nitrogen contents showed the steady shift of CB and VB potentials towards more negative and less positive directions (Figure 6a). The nitrogen incorporation into TiO2 lattice had the advantage to form new energy states since the N 2p position is more negative than the O 2p state, which thus decreases the energy bandgap of TiO2 and shifts the optical absorption towards the visible light region. Therefore, under visible light irradiation, the possibility of electron migration from the valence band to the conduction band increased, which leads to the activity of N-doped TiO2 materials into visible light [45,48].
A proposed schematic for the oxidation of NO is depicted in Figure 6b. The TiO2 incited under photo irradiation and generated e/h+ pairs. The photogenerated e can immediately reduce adsorbed O2 to ˙O2 on CB, and the h+ can directly oxidize H2O/OH to ˙OH radicals on VB. Such ˙O2 and ˙OH radicals are the fundamental elements for the successful oxidation of NO to neutral component NO3 [49]. The more negative the CB band potential is (than the O2/˙O2 potential of −0.33 eV) and the more positive the VB band potential is (than OH/˙OH potential of 1.99 eV), the greater the oxidation of NO [33]. The reactions correspond to the formation of radicals, and a feasible pathway for NO oxidation is as follows [49]:
photocatalyst + hʋ → e + h+
O2 + e → ˙O2
OH + h+ → ˙OH
NO + ˙O2 → NO3
NO + ˙OH → NO2
NO2 + ˙OH → NO3
Figure 7 demonstrates the time profile for NO, NO2, and NOx and the efficiency of NO removal, NO2 generation, NOx removal, and NO3 selectivity of pure TiO2 P25 and the synthesized N-doped TiO2 sample under both UV and visible light irradiation, respectively, for 1h. All samples compared to pure TiO2 P25 exhibited enhanced NO oxidation. Under UV irradiation (Figure 7a, Table S4), the TC10 sample exhibited the maximum NO removal with a superior efficiency of 59% compared to the pure TiO2 P25 (47%), approximately 1.26 times higher. The NOx removal efficiency of the TC10 (34%) was increased by 17% compared to TiO2 P25 (17%) under UV irradiation. The intensified NO expulsion could be clarified by the fact the narrow energy bandgap with more negative CB potentials facilitates the reduction of O2 to ˙O2 radicals and, thus, intensifies the formation of the photo-oxidation product (i.e., NO3). It is further validated by the decreasing trend of the NO2 generation rate. Here, NO2 generation was decreased (Figure 7c) over TC10 compared to TiO2, which leads to higher NOx removal.
Under visible light irradiation (Figure 7b, Table S5), all the synthesized N-doped TiO2 materials exhibited significantly enhanced photocatalytic performance in both NO and NOx removal compared to pure TiO2 P25 samples, though the NO2 generation is relatively higher than pure TiO2. Among all the samples, TC10 showed maximum NO and NOx removals of 51% and 29%, respectively, almost 2.55 and 2.23 times higher than the pure TiO2 P25 of 20% and 13%. Nitrogen doping into the TiO2 lattice enhanced the absorption ability towards the visible light region and narrowed the energy bandgap with more negative CB potentials, which enhanced the formation of superoxide radicals and, therefore, oxidation of NO. For practical application, the goal is to produce materials with high selectivity to NO3. Comparing Tables S4 and S5, the selectivity of NO3 of pure TiO2 significantly differed and was much higher under visible irradiation (about 64%). This phenomenon can be explained by the energy band structure of pure TiO2 and N-doped TiO2. As we mentioned, the more negative the CB band potential than the O2/˙O2 potential (−0.33 eV), and the more positive the VB band potential than OH/˙OH potential (1.99 eV), the greater the oxidation of NO and the formation of NO3. For pure TiO2 the more positive valence band (2.59 eV vs. NHE) than doped TiO2 (<2.53 eV vs. NHE) favors NO3 formation on the valence band (favors Equation (7)). However, in case of VIS experiment of TC50, a superior increase in NO3 selectivity was shown (77%). This might be due to the direct conversion of NO to NO3 on the more negative conduction band (−0.84 eV vs. NHE) than pure TiO2 (−0.66 eV vs. NHE), which is more favorable for reduction of NO and formation of NO3 (favors Equation (5)). Compared to pure TiO2 P25, for the N-doped TiO2 sample, the generation of NO2 was higher (Figure 7d). This can be explained by the fact that the N-doped TiO2 showed increased charge transfer/separation efficiency. Therefore, the formation of OH radicals on the valence band, followed by formation of NO2, was increased under visible light irradiation. The substitutional nitrogen doping into the TiO2 lattice can enhance the photocatalytic activity of NO oxidation by enhancing its absorption ability towards the visible light region, improving separation efficiency of e/h+ pairs, and narrowing the energy band gaps under both UV and visible light irradiation.
Here, NOx removal performance was compared with some other progressive studies (Figure 8). Nitrogen-doped with P25 using urea as a precursor achieved NOx removal performances of approximately 18% and 8% at UV and visible regions, respectively [19,50,51,52]. Composite of carbon nitride with anatase TiO2, composite of modified carbon nitride with TiO2, and composite of hydroxyapatite with TiO2 achieved 18/17, 24/18, and 27/0% NOx removal proficiencies in the UV/visible region, respectively [19,50,51,52]. In the present study, 34/28% NOx removal was attained in the UV/visible region, which indicates significant progress for the NOx removal strategy. The present study can be further improved by making a composite with carbon nitride with advanced synthesized N-doped TiO2 in the future.

3. Materials and Methods

3.1. Preparation of N-Doped TiO2

All the chemicals were used as of analytical grade without further purifications. The N-doped TiO2 powder was synthesized as follows. Firstly, tri-thiocyanuric acid (TCA, Sigma-Aldrich, St. Louis, MO, USA; 95.0%) was dissolved into 10 mL dimethyl sulfoxide (DMSO, Daejung, Siheung, Korea, 99.5%), and TiO2 P25 (Evonik Degussa GmbH, Essen, Germany) was dispersed into 20 mL of H2O by sonication for 1h. Then, the solution was mixed and kept for 1 h followed by filtering and drying at 80 °C. The dried powders were then calcined in a tube furnace at 550 °C for 4h under an N2 atmosphere. Different TCAs (50, 25, 10, and 7.5 wt.%.) were mixed with TiO2 P25 and named as TC50, TC25, TC10, and TC7.5, sequentially, to prepare the N-doped TiO2 powder. The pure TiO2 P25 was named TiO2.

3.2. Characterization

The crystallinity of synthesized powders was evaluated using the X-ray diffraction (XRD) technique (Rigaku D/max Ultima III, The Woodlands, TX, USA) with Cu Kα radiation at 40 kV and 40 mA. The synthesized powder surface morphology was assessed using scanning electron microscopy (FE-SEM, HITACHI, EX-200, Santa Clara, CA, USA). High-resolution transmission electron microscopy (HR-TEM, TECNAI F20 UT) was used to examine the N-doped TiO2 morphology’s fine details. A Fourier transform infrared (FT-IR) spectrometer (FT-IR-4100, Jasco, Portland, OR, USA) was used to identify the synthesized sample chemical bonds. X-ray photoelectron spectroscopy (XPS) was employed using MultiLab2000, VG, USA, to identify the synthesized samples’ elements and their chemical state. The photogenerated e/h+ pairs recombination rate of the synthesized samples was evaluated using a photoluminescence (PL) measurement system (Spectrograph 500i, Acton Research Co., Acton, MA, USA) with an excitation wavelength of 266 nm. A UV–vis spectrometer (Lambda 365, PerkinElmer, Waltham, MA, USA) equipped with an integrating sphere accessory was used to obtain the synthesized sample UV–vis spectra within a range of 200–800 nm. The Kubelka–Munk function (F(R)) was used as follows: F(R) = K/S, K = (1 − R)2 and S = 2R, where K, S, and R are the molar absorption coefficient, scattering factor, and reflectance, respectively, to determine the energy bandgap of the synthesized samples. The indirect energy bandgap was verified by extrapolation of (F(R)hʋ)1/2 vs. hʋ plot. The specific surface area was measured by N2 adsorption–desorption measurements at 77 K (Micromeritics new Tristar II surface area and porosity analyzer 3020, USA) using the Branauer–Emmet Teller (BET) method. The samples were degassed at 150 °C for 24 h before measurements.

3.3. Electrochemical Measurements

The electrochemical performance of the synthesized N-doped TiO2 was examined using Bio-logic VSP potentiostat equipped with a handmade three-electrode cell containing conductive fluorine-doped tin oxide (FTO) as a working electrode, Pt electrode as a counter, and Ag/AgCl KCl (3 M) electrode as a reference electrode, respectively. The electrode materials were prepared by dispersing 50 mg of investigated materials in 2 mL solution containing 1.8 mL of ethanol (DAEJUNG) and 0.2 mL of Nafion (Sigma Aldrich, St. Louis, MO, USA 5 wt% in ethanol), followed by sonication and stirring. After that, 100 µL of the dispersion was cast on the FTO electrode, followed by drying at 60 °C for 8 h. The electrolyte used in the experiment was 0.2 M sodium sulfate (Na2SO4, Sigma Aldrich, 99%, Darmstadt, Germany). Before measurements, N2 gas was purged for 30 min. The experiment was performed at room temperature. These measurements were performed to calculate the CB edge potential of synthesized samples. While the CB edge potentials and flat band potentials practically coincide for n-type semiconductors, the Mott–Schottky relation can be used for the determination of VFB [46].
1 C 2   =   1 ε ε 0 eN D     ( V -   V FB -   kT e )
Here, C is the space charge capacitance, ε and ε0 are the dielectric constants of the semiconductor and free space, e is the charge of the elementary electron, ND is the dopant density, k is the Boltzmann constant, and T is the absolute temperature. The flat band potential VFB is determined by intercepting the plot’s linear part with the potential axis.

3.4. Photocatalytic Activity Measurements

The NOx removal efficiencies of pure TiO2 P25 and the synthesized N-doped TiO2 samples were determined using a NOx removal photocatalytic analyzer (KS ISO 22197-1 standard) under both UV and visible light irradiation. The emission spectra of UV and visible light sources are given in Figure S3 in the Supporting Information. According to ISO protocol, the reaction parameters were maintained at 1 ± 0.003 ppm initial NO concentration, 3 L/min gas flow, relative humidity of 50%, and reaction temperature of 25 °C. The samples were prepared by casting a slurry of catalyst powders and water on a glass plate, and the exposed catalyst surface had an area of 40 cm2. The loading mass for each sample was 5 mg cm−2. During the measurement procedure, the UV and visible light intensities were 1.00 ± 0.30 W m−2 and 6000 ± 300 lux. All the experiments were performed for 100 min, where 20 min was used for adsorption of gas and 60 min for light irradiation. To measure the NO and NO2 concentrations, a NOx analyzer (Sernius 40, Ecotech, Melbourne, Australia) was fixed at the reactor’s outlet. The rates of NO removal, NO2 generation, NOx removal, and nitrate ( NO 3 - ) selectivity were calculated by the following equations:
NO removal = NO in   NO out NO in
NO 2 ,   generation = NO 2 ,   out     NO 2 ,   in NO in
NO x ,   removal = NO x ,   in   NO x ,   out NO in
NO 3   selectivity - = NO x ,   removal NO removal   ×   100

4. Conclusions

In the present study, nitrogen-doped TiO2 was prepared in a straightforward way by calcination of precipitates from the solution mixture of tri-thiocyanuric acid in DMSO and TiO2 P25 in H2O. The optimized TC10 materials showed impressive light absorption capability in the visible region by narrowing the bandgap (TC10: 3.18 eV; TiO2 P25: 3.25 eV). The ratio of nitrogen doping assisted in tuning the conduction band and valance band positions. Most significant, the electron and hole separation efficiencies were improved for nitrogen doping on the titanium oxide. Consequently, the TC10 (N doped TiO2 P25) removed 51% NO and 28% NOx, which are 2.55 and 2.23 times higher than that for pure TiO2 P25 in the visible region. Similarly, in the UV region, TC10 removed 59% NO and 34% NOx and was 1.26 and 2 times higher than that for TiO2 P25. N-doped titanium oxide (TC10) is a unique material that offers excellent potential to remove noxious nitrogen oxide (NOx) from the environment and maintain sustainable urban life for the well-being of human continued existence.

Supplementary Materials

The following are available online at https://www.mdpi.com/2073-4344/11/1/109/s1, Figure S1: The broad scan survey spectra of pure TiO2 P25 and N-doped TiO2 samples with 10 wt% and 50 wt% nitrogen contents. Figure S2: N2 adsorption desorption isotherm of pure TiO2 P25 and synthesized N-doped TiO2. Figure S3: Emission spectra of (a) UV, and (b) visible light sources. Table S1: Estimated FWHM and crystal size of the prepared samples along with the anatase (101) plane of TiO2, and BET surface area and pore volume from N2 adsorption desorption isotherm. Table S2: XPS elemental analysis of purer TiO2 P25 and N-doped TiO2 samples with 10wt% and 50wt% nitrogen contents. Table S3: The energy band gap, CB and VB edge potential of pure TiO2 P25 and N-doped TiO2 samples. The CB and VB edge potentials was measured vs Ag/AgCl at pH 5.8 and calculated vs NHE at pH 7. Table S4: Photocatalytic efficiency of samples in NO removal, NO2 generation, NOx removal and NO3 selectivity under UV irradiation. Table S5: Photocatalytic efficiency of samples in NO removal, NO2 generation, NOx removal and NO3 selectivity under visible light irradiation.

Author Contributions

Conceptualization, T.T.K., and Y.-S.J.; methodology, T.T.K., and Y.-S.J.; formal analysis, T.T.K., T.-G.L., J.-W.P., H.J.H., J.S.M.; investigation, T.T.K., G.A.K.M.R.B., H.-J.K., T.-G.L., and Y.-S.J.; data curation, T.T.K., G.A.K.M.R.B., H.-J.K., T.-G.L., and Y.-S.J.; writing—original draft preparation, T.T.K.; writing—review and editing, T.T.K., G.A.K.M.R.B., T.-G.L., H.-J.K., H.K.S., J.-H.K., S.M.H., N.S., A.F., and Y.-S.J.; supervision, Y.-S.J.; funding acquisition, J.-H.K., and Y.-S.J. All authors have read and agreed to the published version of the manuscript.

Funding

This research was financially supported by the R&D Convergence Program of NST (National Research Council of Science & Technology) of the Republic of Korea (CAP-15-02-KBSI), the National Research Foundation of Korea (NRF) grant funded by the Korean government (MSIT) (No. 2019R1C1C1007745), and the National Research Foundation of Korea (NRF) grant funded by the Korean government (Ministry of Science, ICT & Future Planning) (No. 2019R1A4A2001527).

Institutional Review Board Statement

Not applicable.

Informed Consent Statement

Not applicable.

Data Availability Statement

The data presented in this study are available within the article and the supplementary materials.

Acknowledgments

This study was partly supported by the Joint Usage/Research Program of the Photocatalysis International Research Center, Research Institute for Science and Technology, Tokyo University of Science, Japan.

Conflicts of Interest

The authors declare no conflict of interest.

References

  1. Venkanna, R.; Nikhil, G.; Rao, T.S.; Sinha, P.; Swamy, Y. Environmental monitoring of surface ozone and other trace gases over different time scales: Chemistry, transport and modeling. Int. J. Environ. Sci. Technol. 2015, 12, 1749–1758. [Google Scholar] [CrossRef]
  2. Zhao, B.; Wang, S.; Liu, H.; Xu, J.; Fu, K.; Klimont, Z.; Hao, J.; He, K.; Cofala, J.; Amann, M. NOx emissions in China: Historical trends and future perspectives. Atmos. Chem. Phys. 2013, 13, 9869–9897. [Google Scholar] [CrossRef] [Green Version]
  3. He, H.; Wang, Y.; Ma, Q.; Ma, J.; Chu, B.; Ji, D.; Tang, G.; Liu, C.; Zhang, H.; Hao, J. Mineral dust and NOx promote the conversion of SO2 to sulfate in heavy pollution days. Sci. Rep. 2014, 4, 4172. [Google Scholar] [CrossRef] [PubMed]
  4. Kotchmar, D.J.; Garner, J.; Gardner, D.; Comfort, B. Air Quality Criteria for Oxides of Nitrogen; Diane Publishing: Darby, PA, USA, 1996. [Google Scholar]
  5. Lebowitz, M.D.; Walkinshaw, D.S. Indoor Air’90: Health effects associated with indoor air contaminants. Arch. Environ. Health Int. J. 1992, 47, 6–7. [Google Scholar] [CrossRef]
  6. Damma, D.; Boningari, T.; Ettireddy, P.R.; Reddy, B.M.; Smirniotis, P.G. Direct decomposition of NOx over TiO2 supported transition metal oxides at low temperatures. Ind. Eng. Chem. Res. 2018, 57, 16615–16621. [Google Scholar] [CrossRef]
  7. Zong, L.; Zhang, J.; Lu, G.; Tang, Z. Controlled Synthesis of TiO2 Shape and Effect on the Catalytic Performance for Selective Catalytic Reduction of NO x with NH3. Catal. Surv. Asia 2018, 22, 105–117. [Google Scholar] [CrossRef]
  8. Mamaghani, A.H.; Haghighat, F.; Lee, C.-S. Photocatalytic oxidation technology for indoor environment air purification: The state-of-the-art. Appl. Catal. B Environ. 2017, 203, 247–269. [Google Scholar] [CrossRef]
  9. Oskooei, A.B.; Koohsorkhi, J.; Mehrpooya, M. Simulation of plasma-assisted catalytic reduction of NOx, CO, and HC from diesel engine exhaust with COMSOL. Chem. Eng. Sci. 2019, 197, 135–149. [Google Scholar] [CrossRef]
  10. Yu, Q.; Brouwers, H. Indoor air purification using heterogeneous photocatalytic oxidation. Part I: Experimental study. Appl. Catal. B Environ. 2009, 92, 454–461. [Google Scholar] [CrossRef]
  11. Schwartz-Narbonne, H.; Jones, S.H.; Donaldson, D.J. Indoor lighting releases gas phase nitrogen oxides from indoor painted surfaces. Environ. Sci. Technol. Lett. 2019, 6, 92–97. [Google Scholar] [CrossRef] [Green Version]
  12. Yang, L.; Hakki, A.; Zheng, L.; Jones, M.R.; Wang, F.; Macphee, D.E. Photocatalytic concrete for NOx abatement: Supported TiO2 efficiencies and impacts. Cem. Concr. Res. 2019, 116, 57–64. [Google Scholar] [CrossRef] [Green Version]
  13. Long, R. Electronic structure of semiconducting and metallic tubes in TiO2/carbon nanotube heterojunctions: Density functional theory calculations. J. Phys. Chem. Lett. 2013, 4, 1340–1346. [Google Scholar] [CrossRef] [PubMed]
  14. Huang, Q.; Hu, Y.; He, G.; Lin, C.; Wei, C. Photocatalytic oxidation of nitrogen oxides over {001} TiO2: The influence of F− ions. Environ. Sci. Pollut. Res. 2018, 25, 35342–35351. [Google Scholar] [CrossRef] [PubMed]
  15. Maggos, T.; Bartzis, J.; Leva, P.; Kotzias, D. Application of photocatalytic technology for NOx removal. Appl. Phys. A 2007, 89, 81–84. [Google Scholar] [CrossRef]
  16. Wu, Z.; Wang, H.; Liu, Y.; Gu, Z. Photocatalytic oxidation of nitric oxide with immobilized titanium dioxide films synthesized by hydrothermal method. J. Hazard. Mater. 2008, 151, 17–25. [Google Scholar] [CrossRef] [PubMed]
  17. Huang, J.; Li, D.; Li, R.; Chen, P.; Zhang, Q.; Liu, H.; Lv, W.; Liu, G.; Feng, Y. One-step synthesis of phosphorus/oxygen co-doped g-C3N4/anatase TiO2 Z-scheme photocatalyst for significantly enhanced visible-light photocatalysis degradation of enrofloxacin. J. Hazard. Mater. 2020, 386, 121634. [Google Scholar] [CrossRef]
  18. Tseng, Y.-H.; Kuo, C.-S.; Huang, C.-H.; Li, Y.-Y.; Chou, P.-W.; Cheng, C.-L.; Wong, M.-S. Visible-light-responsive nano-TiO2 with mixed crystal lattice and its photocatalytic activity. Nanotechnology 2006, 17, 2490. [Google Scholar] [CrossRef]
  19. Todorova, N.; Vaimakis, T.; Petrakis, D.; Hishita, S.; Boukos, N.; Giannakopoulou, T.; Giannouri, M.; Antiohos, S.; Papageorgiou, D.; Chaniotakis, E. N and N, S-doped TiO2 photocatalysts and their activity in NOx oxidation. Catal. Today 2013, 209, 41–46. [Google Scholar] [CrossRef]
  20. Zhou, L.; Tan, X.; Zhao, L.; Sun, M. Photocatalytic oxidation of NOx over visible-light-responsive nitrogen-doped TiO2. Korean J. Chem. Eng. 2007, 24, 1017–1021. [Google Scholar] [CrossRef]
  21. Todorova, N.; Giannakopoulou, T.; Pomoni, K.; Yu, J.; Vaimakis, T.; Trapalis, C. Photocatalytic NOx oxidation over modified ZnO/TiO2 thin films. Catal. Today 2015, 252, 41–46. [Google Scholar] [CrossRef]
  22. Abramović, B.F.; Šojić, D.V.; Anderluh, V.B.; Abazović, N.D.; Čomor, M.I. Nitrogen-doped TiO2 suspensions in photocatalytic degradation of mecoprop and (4-chloro-2-methylphenoxy) acetic acid herbicides using various light sources. Desalination 2009, 244, 293–302. [Google Scholar] [CrossRef]
  23. Ma, Y.; Zhang, J.; Tian, B.; Chen, F.; Wang, L. Synthesis and characterization of thermally stable Sm, N co-doped TiO2 with highly visible light activity. J. Hazard. Mater. 2010, 182, 386–393. [Google Scholar] [CrossRef] [PubMed]
  24. Xie, Z.; Zhang, Y.; Liu, X.; Wang, W.; Zhan, P.; Li, Z.; Zhang, Z. Visible light photoelectrochemical properties of N-doped TiO2 nanorod arrays from TiN. J. Nanomater. 2013, 2013, 930950. [Google Scholar] [CrossRef] [Green Version]
  25. Park, C.; Zhang, S.; Wei, S.-H. Origin of p-type doping difficulty in ZnO: The impurity perspective. Phys. Rev. B 2002, 66, 073202. [Google Scholar] [CrossRef]
  26. Sato, S.; Nakamura, R.; Abe, S. Visible-light sensitization of TiO2 photocatalysts by wet-method N doping. Appl. Catal. A Gen. 2005, 284, 131–137. [Google Scholar] [CrossRef]
  27. Lin, Y.-T.; Weng, C.-H.; Hsu, H.-J.; Lin, Y.-H.; Shiesh, C.-C. The synergistic effect of nitrogen dopant and calcination temperature on the visible-light-induced photoactivity of N-doped TiO2. Int. J. Photoenergy 2013, 2013, 268723. [Google Scholar] [CrossRef] [Green Version]
  28. Yang, G.; Jiang, Z.; Shi, H.; Xiao, T.; Yan, Z. Preparation of highly visible-light active N-doped TiO2 photocatalyst. J. Mater. Chem. 2010, 20, 5301–5309. [Google Scholar] [CrossRef]
  29. Jun, Y.S.; Hong, W.H.; Antonietti, M.; Thomas, A. Mesoporous, 2D hexagonal carbon nitride and titanium nitride/carbon composites. Adv. Mater. 2009, 21, 4270–4274. [Google Scholar] [CrossRef]
  30. Zhang, J.; Sun, J.; Maeda, K.; Domen, K.; Liu, P.; Antonietti, M.; Fu, X.; Wang, X. Sulfur-mediated synthesis of carbon nitride: Band-gap engineering and improved functions for photocatalysis. Energy Environ. Sci. 2011, 4, 675–678. [Google Scholar] [CrossRef]
  31. Hossain, M.K.; Pervez, M.; Mia, M.; Tayyaba, S.; Uddin, M.J.; Ahamed, R.; Khan, R.A.; Hoq, M.; Khan, M.A.; Ahmed, F. Annealing temperature effect on structural, morphological and optical parameters of mesoporous TiO2 film photoanode for dye-sensitized solar cell application. Mater. Sci.-Pol. 2018, 35, 868–877. [Google Scholar] [CrossRef] [Green Version]
  32. Sun, S.; Gao, P.; Yang, Y.; Yang, P.; Chen, Y.; Wang, Y. N-doped TiO2 nanobelts with coexposed (001) and (101) facets and their highly efficient visible-light-driven photocatalytic hydrogen production. ACS Appl. Mater. Interfaces 2016, 8, 18126–18131. [Google Scholar] [CrossRef] [PubMed]
  33. Giannakopoulou, T.; Papailias, I.; Todorova, N.; Boukos, N.; Liu, Y.; Yu, J.; Trapalis, C. Tailoring the energy band gap and edges’ potentials of g-C3N4/TiO2 composite photocatalysts for NOx removal. Chem. Eng. J. 2017, 310, 571–580. [Google Scholar] [CrossRef]
  34. Du, X.; Bai, X.; Xu, L.; Yang, L.; Jin, P. Visible-light activation of persulfate by TiO2/g-C3N4 photocatalyst toward efficient degradation of micropollutants. Chem. Eng. J. 2020, 384, 123245. [Google Scholar] [CrossRef]
  35. Hendarsa, A.; Mustofa, S. Photodegradation of methylcyclohexane in two phases with modified-titania immobilized on pumice. Int. J. Technol. 2017, 8, 27–36. [Google Scholar]
  36. Mutuma, B.K.; Shao, G.N.; Kim, W.D.; Kim, H.T. Sol–gel synthesis of mesoporous anatase–brookite and anatase–brookite–rutile TiO2 nanoparticles and their photocatalytic properties. J. Colloid Interface Sci. 2015, 442, 1–7. [Google Scholar] [CrossRef]
  37. Zhou, Z.; Huang, Y. The stable and uniform characteristics of nitrogen in nitrogen doped titanium dioxide nano photocatalytic particles. In Journal of Physics: Conference Series; IOP Publishing: Bristol, UK, 2009; pp. 1–5. [Google Scholar]
  38. Ji, T.; Liu, Q.; Zou, R.; Zhang, Y.; Wang, L.; Sang, L.; Liao, M.; Hu, J. Enhanced UV-visible light photodetectors with a TiO2/Si heterojunction using band engineering. J. Mater. Chem. C 2017, 5, 12848–12856. [Google Scholar]
  39. Batalović, K.; Bundaleski, N.; Radaković, J.; Abazović, N.; Mitrić, M.; Silva, R.; Savić, M.; Belošević-Čavor, J.; Rakočević, Z.; Rangel, C. Modification of N-doped TiO2 photocatalysts using noble metals (Pt, Pd)–a combined XPS and DFT study. Phys. Chem. Chem. Phys. 2017, 19, 7062–7071. [Google Scholar]
  40. Liu, G.; Yang, H.G.; Wang, X.; Cheng, L.; Pan, J.; Lu, G.Q.; Cheng, H.-M. Visible light responsive nitrogen doped anatase TiO2 sheets with dominant {001} facets derived from TiN. J. Am. Chem. Soc. 2009, 131, 12868–12869. [Google Scholar] [CrossRef]
  41. Liu, H.; Liu, G.; Xie, G.; Zhang, M.; Hou, Z.; He, Z. Gd3+, N-codoped trititanate nanotubes: Preparation, characterization and photocatalytic activity. Appl. Surf. Sci. 2011, 257, 3728–3732. [Google Scholar] [CrossRef]
  42. Preclíková, J.; Galář, P.; Trojánek, F.; Daniš, S.; Rezek, B.; Gregora, I.; Němcová, Y.; Malý, P. Nanocrystalline titanium dioxide films: Influence of ambient conditions on surface-and volume-related photoluminescence. J. Appl. Phys. 2010, 108, 113502. [Google Scholar] [CrossRef]
  43. Wang, E.; He, T.; Zhao, L.; Chen, Y.; Cao, Y. Improved visible light photocatalytic activity of titania doped with tin and nitrogen. J. Mater. Chem. 2011, 21, 144–150. [Google Scholar] [CrossRef]
  44. Dong, G.; Ho, W.; Li, Y.; Zhang, L. Facile synthesis of porous graphene-like carbon nitride (C6N9H3) with excellent photocatalytic activity for NO removal. Appl. Catal. B Environ. 2015, 174, 477–485. [Google Scholar] [CrossRef]
  45. Ansari, S.A.; Khan, M.M.; Ansari, M.O.; Cho, M.H. Nitrogen-doped titanium dioxide (N-doped TiO2) for visible light photocatalysis. New J. Chem. 2016, 40, 3000–3009. [Google Scholar] [CrossRef]
  46. Beranek, R. (Photo) electrochemical methods for the determination of the band edge positions of TiO2-based nanomaterials. Adv. Phys. Chem. 2011, 2011, 786759. [Google Scholar] [CrossRef] [Green Version]
  47. Spadavecchia, F.; Cappelletti, G.; Ardizzone, S.; Ceotto, M.; Falciola, L. Electronic structure of pure and N-doped TiO2 nanocrystals by electrochemical experiments and first principles calculations. J. Phys. Chem. C 2011, 115, 6381–6391. [Google Scholar] [CrossRef]
  48. Kang, X.; Liu, S.; Dai, Z.; He, Y.; Song, X.; Tan, Z. Titanium dioxide: From engineering to applications. Catalysts 2019, 9, 191. [Google Scholar] [CrossRef] [Green Version]
  49. Song, X.; Hu, Y.; Zheng, M.; Wei, C. Solvent-free in situ synthesis of g-C3N4/{0 0 1} TiO2 composite with enhanced UV-and visible-light photocatalytic activity for NO oxidation. Appl. Catal. B Environ. 2016, 182, 587–597. [Google Scholar] [CrossRef]
  50. Hossain, S.M.; Park, H.; Kang, H.-J.; Mun, J.S.; Tijing, L.; Rhee, I.; Kim, J.-H.; Jun, Y.-S.; Shon, H.K. Facile synthesis and characterization of anatase TiO2/g-CN composites for enhanced photoactivity under UV–visible spectrum. Chemosphere 2020, 262, 128004. [Google Scholar] [CrossRef]
  51. Papailias, I.; Todorova, N.; Giannakopoulou, T.; Yu, J.; Dimotikali, D.; Trapalis, C. Photocatalytic activity of modified g-C3N4/TiO2 nanocomposites for NOx removal. Catal. Today 2017, 280, 37–44. [Google Scholar] [CrossRef]
  52. Giannakopoulou, T.; Todorova, N.; Romanos, G.; Vaimakis, T.; Dillert, R.; Bahnemann, D.; Trapalis, C. Composite hydroxyapatite/TiO2 materials for photocatalytic oxidation of NOx. Mater. Sci. Eng. B 2012, 177, 1046–1052. [Google Scholar] [CrossRef]
Figure 1. (a) XRD patterns and (b) FT˗IR spectra of pure TiO2 P25 and the synthesized N-doped TiO2 materials (TCX; TC means N-doped TiO2, X is wt% of TCA on TiO2).
Catalysts 11 00109 g001
Figure 2. SEM images of (a) pure TiO2 P25, (b) TC7.5, (c) TC10, (d) TC25, (e) TC50, and (f) HRTEM image of TC10 sample.
Catalysts 11 00109 g002
Figure 3. XPS spectra of pure TiO2 P25, TC10, and TC50 (a) N1s, (b) O1s, and (c) Ti2p.
Catalysts 11 00109 g003
Figure 4. (a) PL spectra and (b) UV–Vis DRS spectra of pure TiO2 P25 and synthesized materials.
Catalysts 11 00109 g004
Figure 5. (a) Tauc plot and (b) Mott˗Schottky plot of pure TiO2 P25 and synthesized materials.
Catalysts 11 00109 g005
Figure 6. (a) Energy diagram with an energy bandgap, CB and VB edge potentials of pure TiO2 P25 and N-doped TiO2 materials, and (b) schematic for NO oxidation mechanism of TiO2 under light irradiation.
Catalysts 11 00109 g006
Figure 7. Time profiles of NO, NO2, and NOx under (a) UV and (b) visible light irradiation; the profile of estimated NOremoval, NO2, generation, NOx, removal, and NO3selectivity of TiO2 and N-doped TiO2 with different N contents under (c) UV and (d) visible light irradiation, respectively.
Catalysts 11 00109 g007
Figure 8. Comparison of NOx removal performance in the UV and visible regions with some advanced studies.
Catalysts 11 00109 g008
Publisher’s Note: MDPI stays neutral with regard to jurisdictional claims in published maps and institutional affiliations.

