Article

Strong Activity Enhancement of the Photocatalytic Degradation of an Azo Dye on Au/TiO2 Doped with FeOx

1
State Key Laboratory of Catalysis, Dalian Institute of Chemical Physics, Chinese Academy of Sciences, Dalian 116023, China
2
University of Chinese Academy of Sciences, Beijing 100049, China
3
Institute of Materials and Process Engineering, Zurich University of Applied Sciences (ZHAW), Technikumstrasse 9, CH-8400 Winterthur, Switzerland
4
School of Chemistry and Chemical Engineering, Qufu Normal University, Qufu 273165, China
5
Department of Chemistry and Applied Biosciences, Institute for Chemical and Bioengineering, ETH Zurich, Hönggerberg, HCl, CH-8093 Zurich, Switzerland
*
Authors to whom correspondence should be addressed.
Catalysts 2020, 10(8), 933; https://doi.org/10.3390/catal10080933
Submission received: 14 July 2020 / Revised: 7 August 2020 / Accepted: 11 August 2020 / Published: 13 August 2020
(This article belongs to the Special Issue TiO2-Based Nanostructures and Photocatalysts)

Abstract

:
The doping of Au/TiO2 with FeOx is shown to result in a strong enhancement of its photocatalytic activity in the degradation of the azo dye Orange II. In order to examine the source of this enhancement, Au-FeOx/TiO2 nanocomposites containing different molar ratios of Au:Fe were synthesized, and X-ray diffraction (XRD), X-ray photoemission spectroscopy (XPS), and high-resolution transmission electron microscope (HRTEM) analyses indicated that the TiO2-supported Au nanoparticles were partially covered with an amorphous layer of FeOx species, in which the iron was present as Fe2+ and Fe3+. The metal-semiconductor system, i.e., Au/TiO2, showed only a moderate degradation rate, whereas doping with FeOx strongly enhanced the degradation activity. The bandgap energy decreased gradually from Au/TiO2 (3.13 eV) to the catalyst with the highest FeOx loading Au-FeOx (1:2)/TiO2 (2.23 eV), and this decrease was accompanied by a steady increase in the degradation activity of the catalysts. XPS analyses revealed that compared to Au/TiO2, on Au-FeOx/TiO2 a much higher population density of chemisorbed and/or dissociated oxygen species was generated, which together with the decreased bandgap resulted in the highest photocatalytic activity observed with Au-FeOx (1:2)/TiO2. The processes occurring during reaction on the catalyst surface and in the bulk liquid phase were investigated using operando attenuated total reflection IR spectroscopy (ATR-IR) combined with modulation excitation spectroscopy (MES), which showed that the doping of Au/TiO2 with FeOx weakens the interaction of the dye with the catalyst surface and strongly enhances the cleavage of the azo bond.

Graphical Abstract

1. Introduction

Increasing public concern about the detrimental environmental impact of organic pollutants in wastewater effluents from industrial and domestic sources has urged the development of suitable technologies for their cleaning. Conventional large-scale water-treatment systems comprising coagulation, sedimentation, filtration, chemical, and membrane technologies are not efficient enough to remove all toxic and environmentally harmful contaminants. This deficiency has fostered the development of biological treatment and photocatalytic methods as promising environmentally friendly and sustainable technologies [1,2,3,4,5]. Photocatalytic degradation of organic pollutants in wastewaters is driven by photogenerated electrons and holes on the semiconductor surface, which act as electron donors and acceptors, respectively, initiating the formation of highly active radicals that degrade the pollutant into water, carbon dioxide, and inorganic salts [1,6]. The mechanisms of these processes have been the subject of extensive research, which has been covered in several reviews [1,6,7,8,9]. Efficient absorption of light and the separation of photogenerated charge carriers have been identified as key prerequisites for developing photocatalysts with high degradation efficiency. Various semiconductor catalysts, including TiO2, ZnS, ZnO, CdS, and Fe3O4 are employed in the heterogeneous photocatalytic degradation of dyes [2,3,5]. Among them, TiO2 is the most active and most frequently applied catalyst due to its excellent stability, non-toxic feature, and low production cost [8]. Some limitations in the application of TiO2 as a photocatalyst arise from its large intrinsic bandgap energy and the relatively fast recombination of photogenerated electron-hole pairs, which reduce the quantum efficiency and photocatalytic activity [1,6]. A recent review critically considers the potential of TiO2-based photocatalysis and provides a historical view of its development [10].
Azo dyes, such as Methylene Blue, Methyl Orange, and Orange II, are commonly used for dyeing and printing of textile fibers, plastics, furs, papers, elastomers, hides, and woods. Generally, these dyes do not easily undergo biological degradation in plants for wastewater treatment due to their high stability, toxicity, and the presence of residual surfactants. Orange II, a typical example of these class of dyes, has frequently been used as a model compound in photocatalytic degradation studies on TiO2-based catalysts covering various aspects [6,11,12,13,14,15,16,17,18,19,20,21].
Gold/TiO2 catalysts have been applied in the photocatalytic degradation of dyes due to some interesting electronic properties of their metal-semiconductor interface [22,23,24,25]. Photo-excited TiO2 nanoparticles experience charge equilibration when they are in intimate contact with gold nanoparticles and this charge distribution controls the energetics of the Au/TiO2 system, shifting the Fermi level to more negative potentials [24]. Doping TiO2 with gold nanoparticles could retard the quick recombination of the electron-hole pairs in titania by transferring the photogenerated electrons from the TiO2 surface. Gold could also play a mediating role in shuttling photogenerated electrons from the TiO2 to an electron acceptor in the photocatalytic process [24].
Preliminary tests of the photocatalytic degradation of Orange II showed that doping of the Au/TiO2 catalysts with FeOx results in a strong enhancement of the photodegradation rate. This prompted us to examine the origin of this rate enhancement and to explore the possible potential of these catalysts for comprising both metal-semiconductor and semiconductor-semiconductor junctions. To the best of our knowledge, such catalysts have not been scrutinized for the photocatalytic degradation of azo dyes so far. For this purpose, we synthesized Au-FeOx/TiO2 catalysts with different molar ratios of Au:Fe and characterized them using X-ray diffraction (XRD), high-resolution transmission electron microscopy (HRTEM), X-ray photoelectron (XPS), and UV-Vis spectroscopies. To our knowledge, for the first time, operando modulation excitation ATR-IR spectroscopy (MES-ATR-IR) of the catalyst surface and the liquid phase was employed to shed some light on the molecular processes occurring in this catalytic system.

2. Results

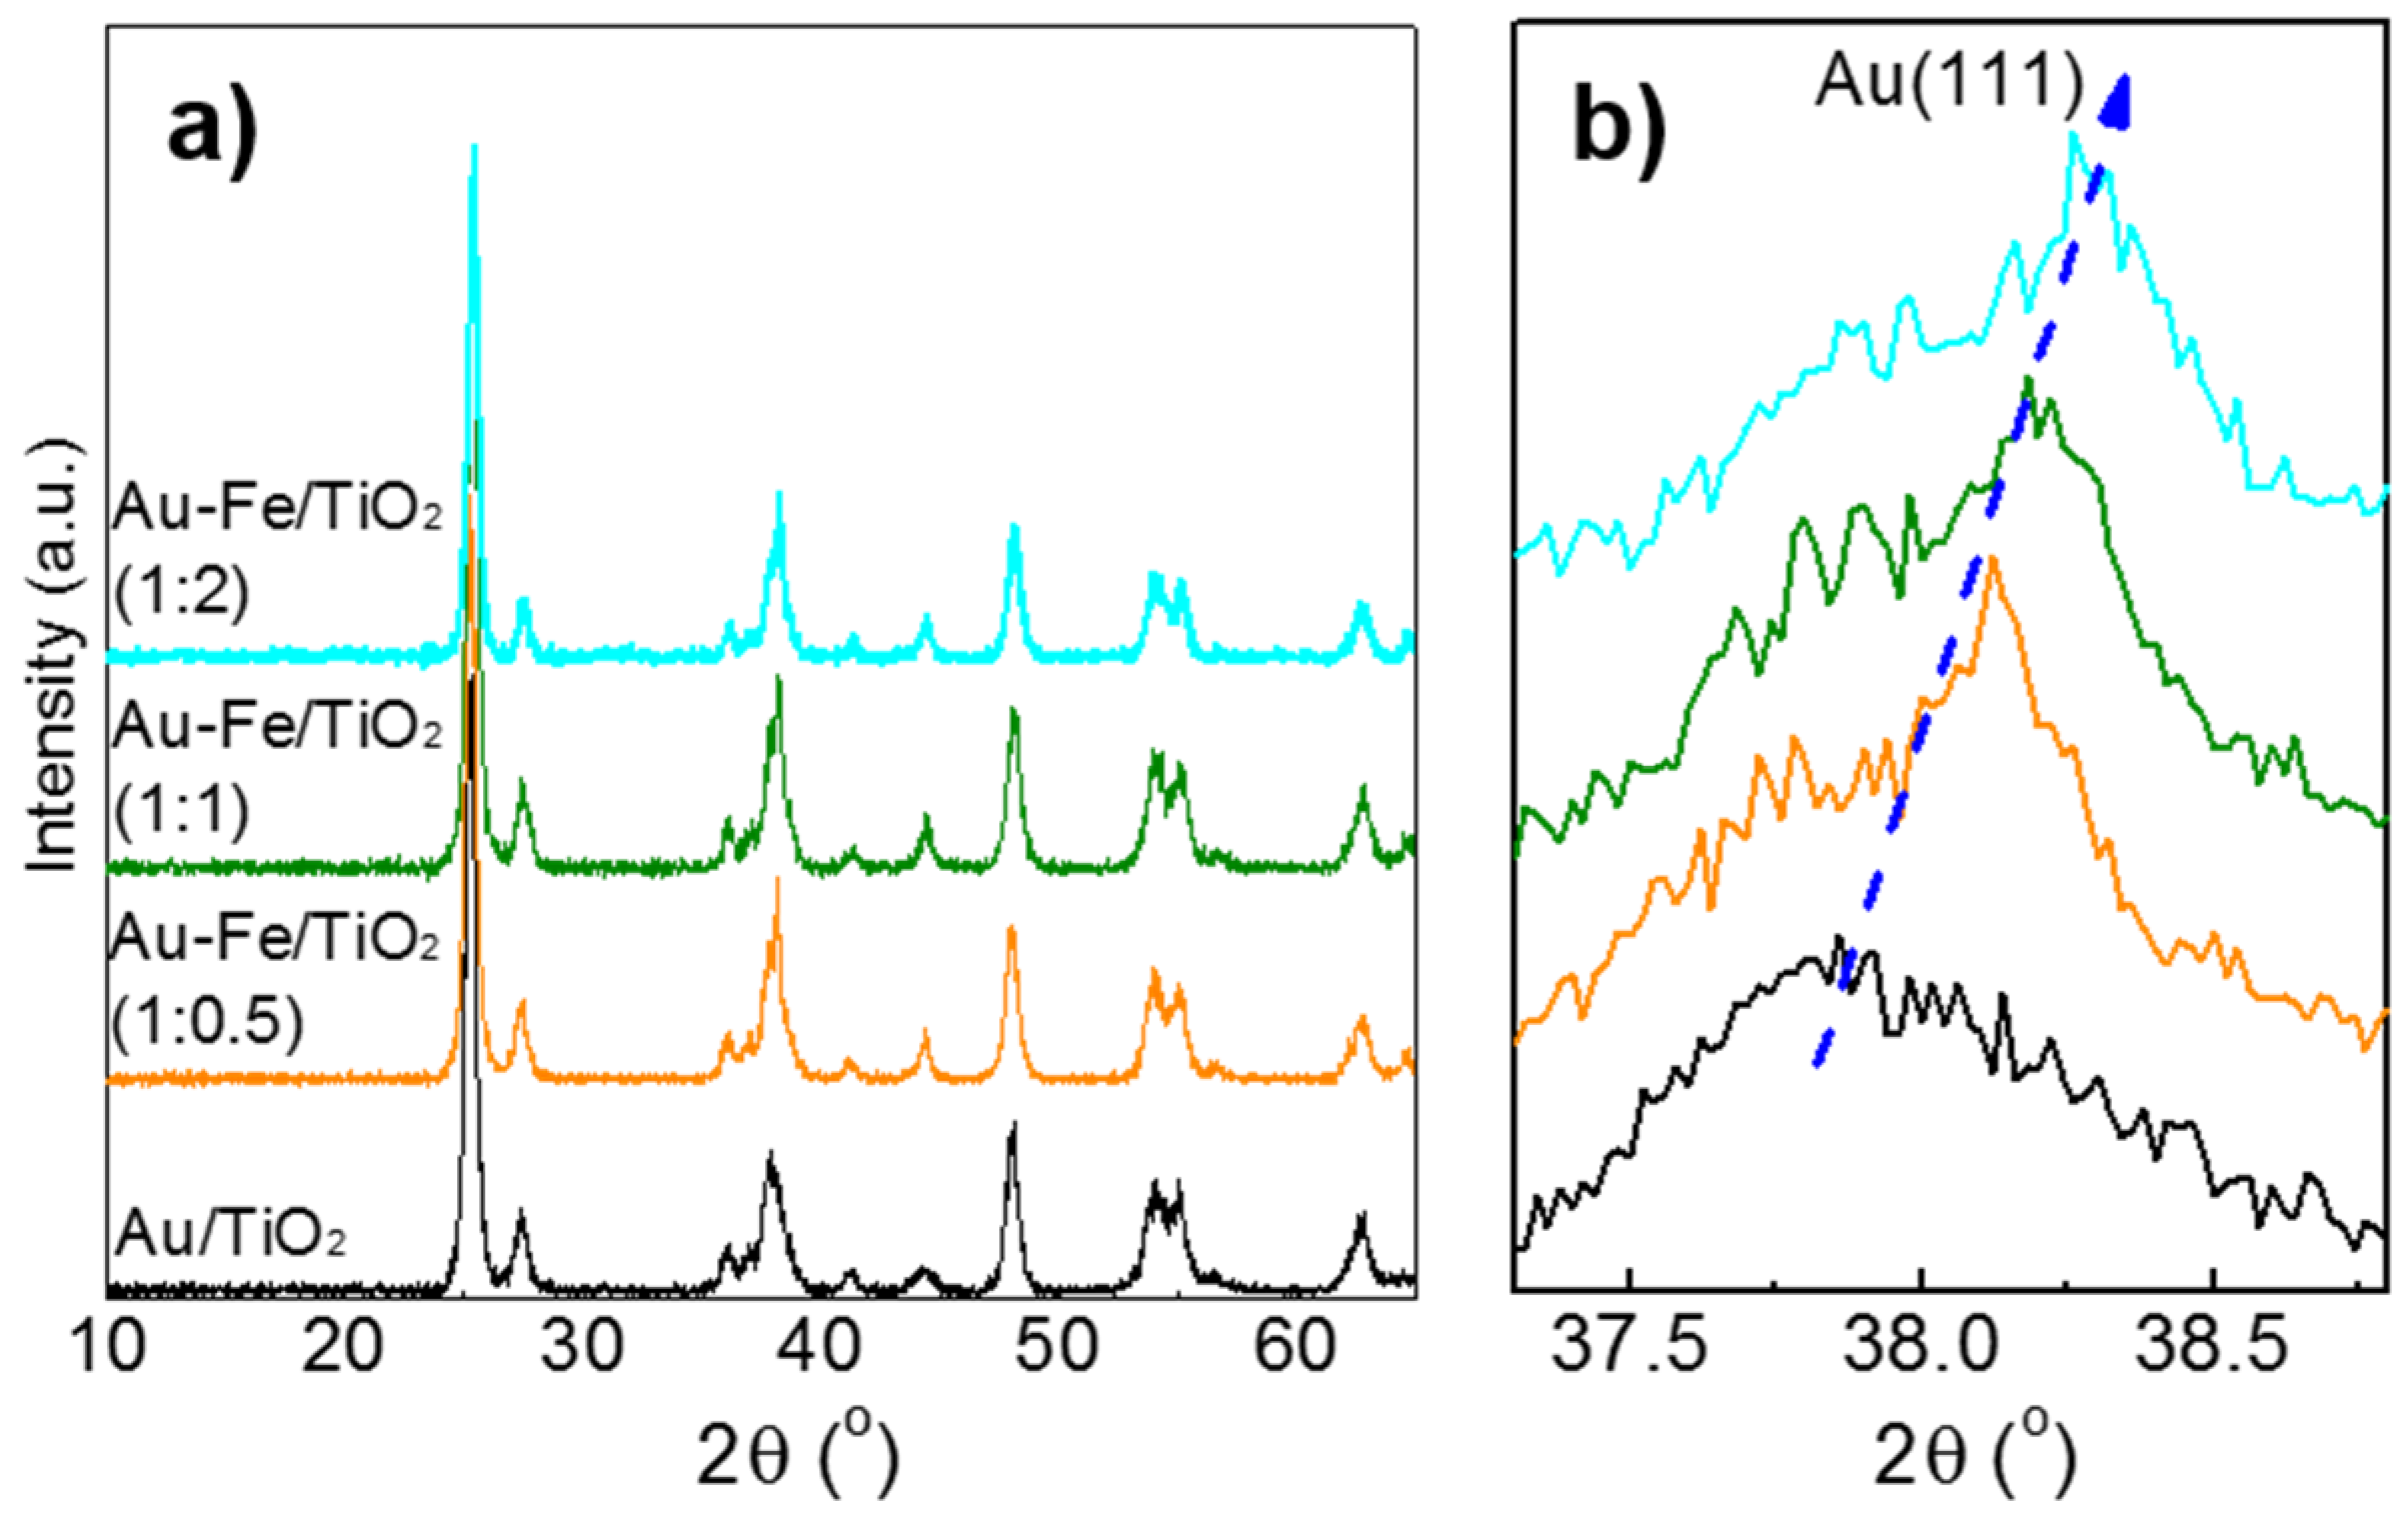
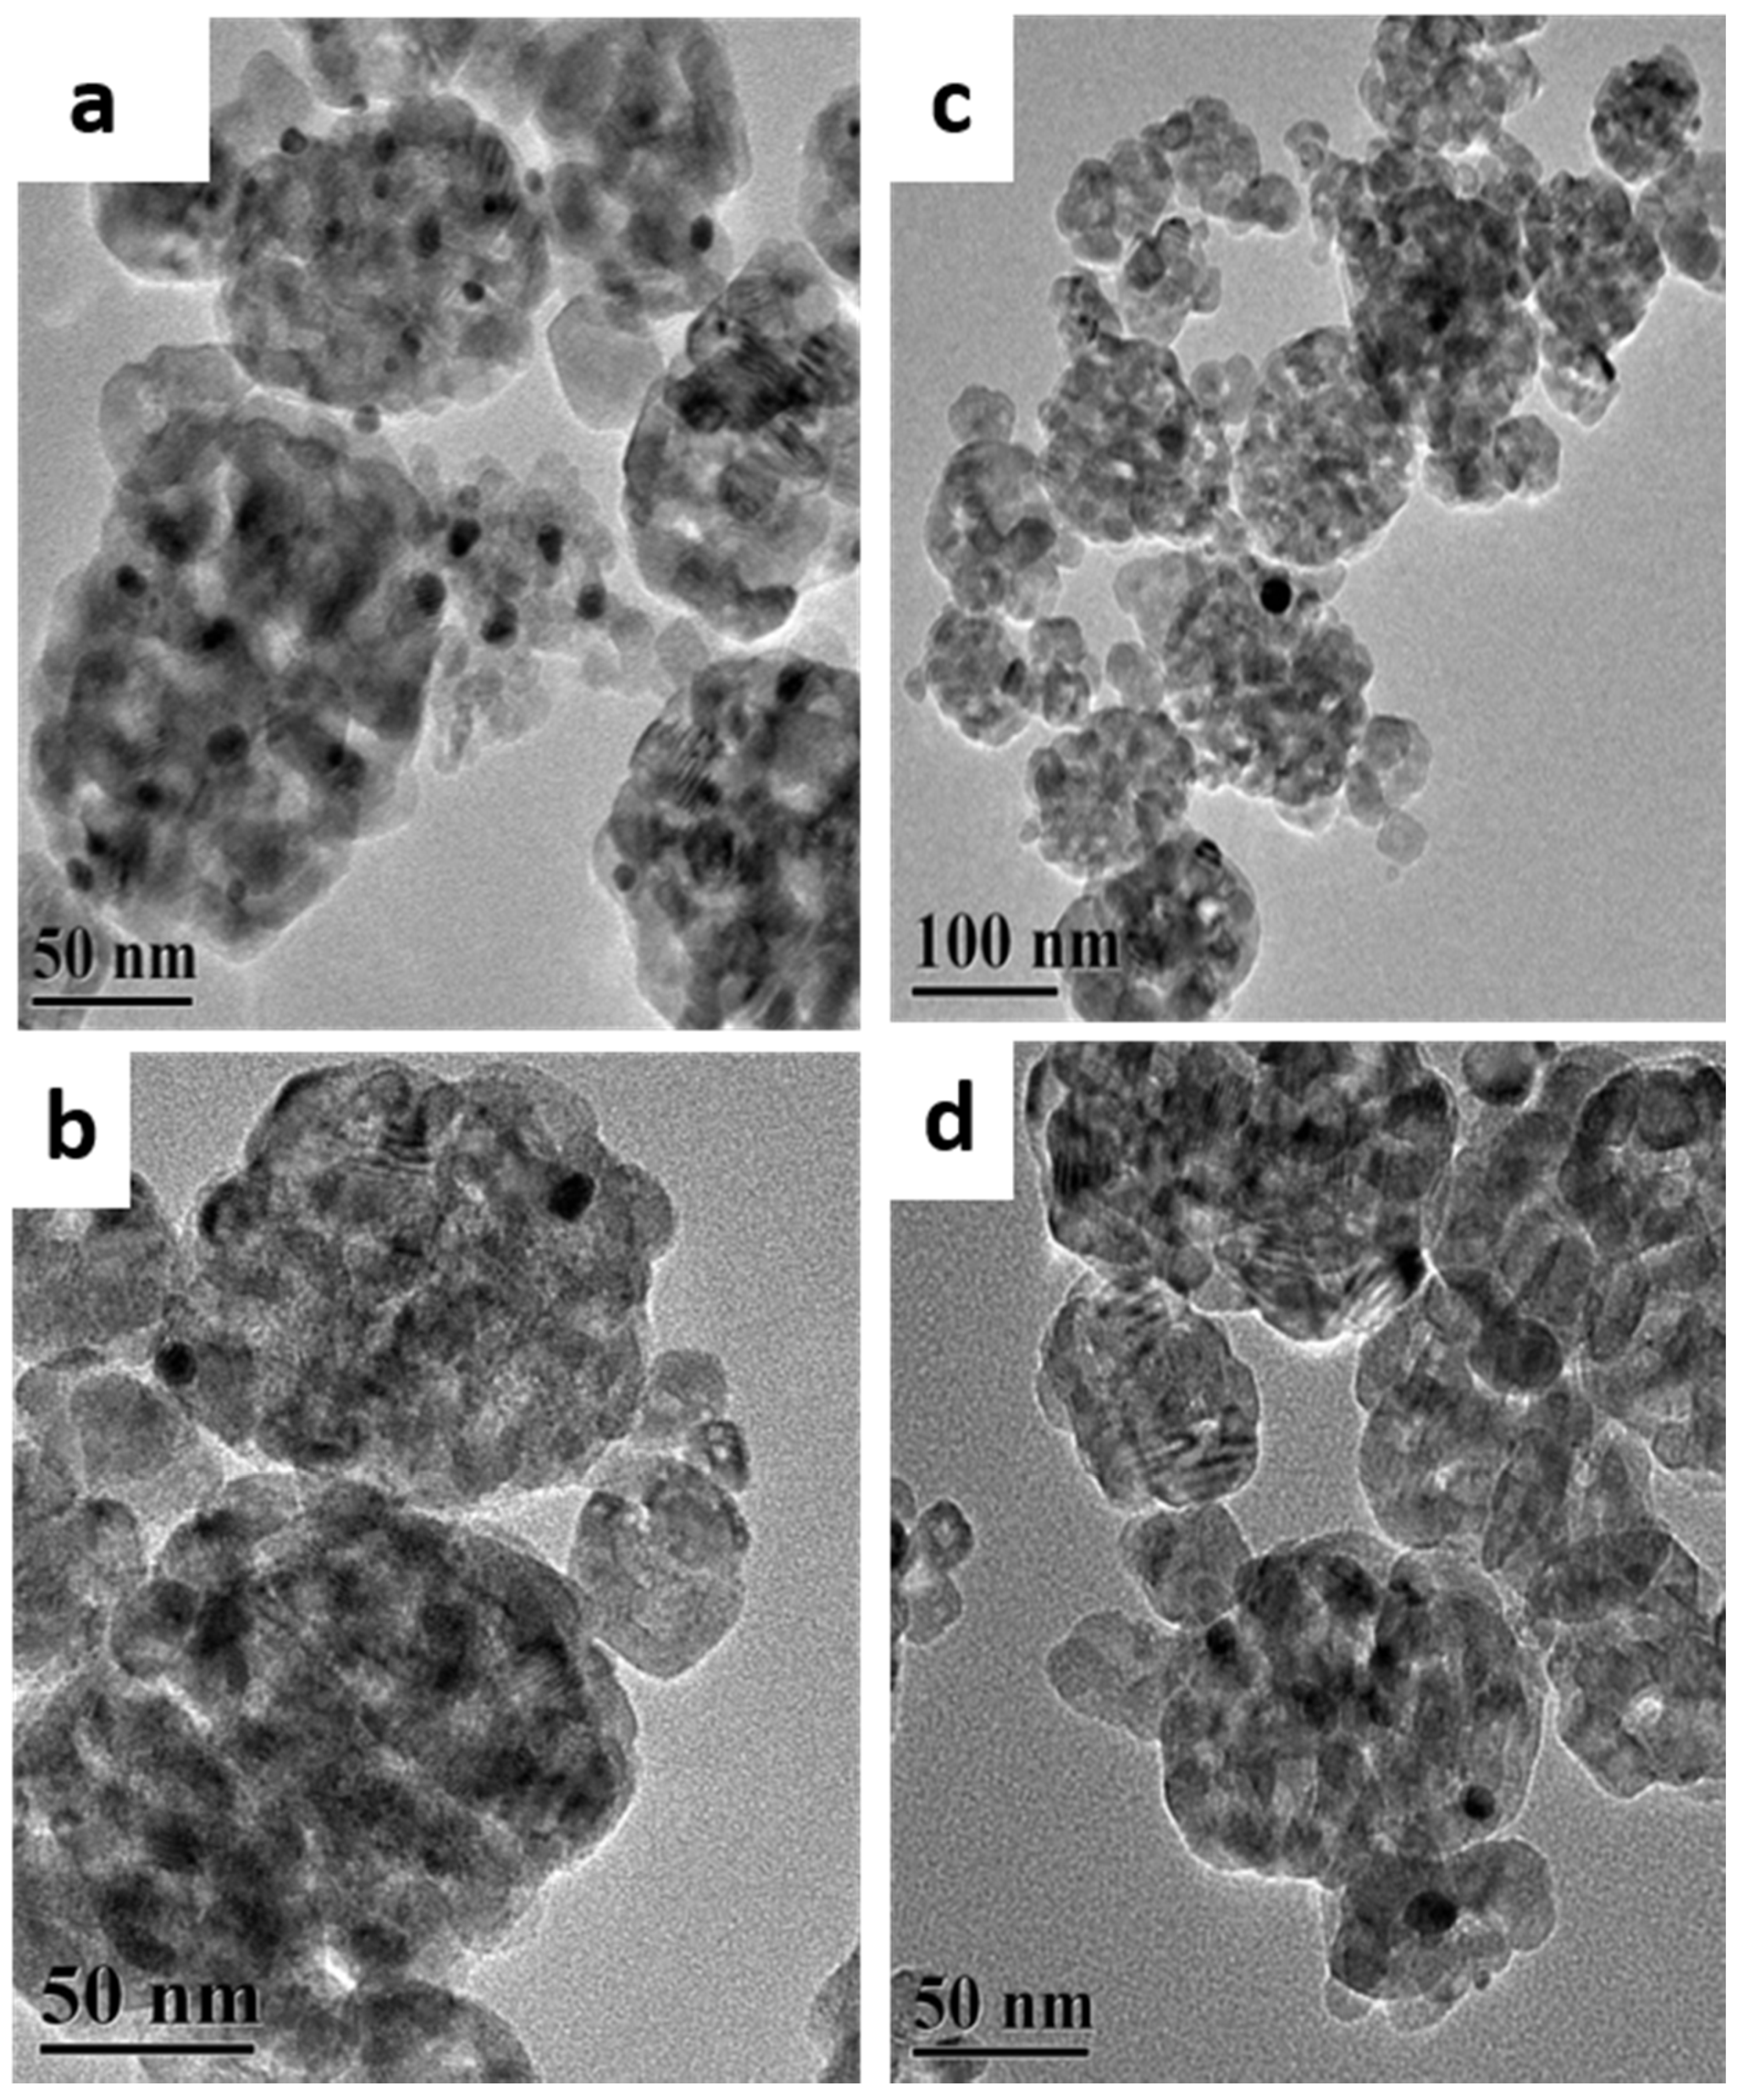
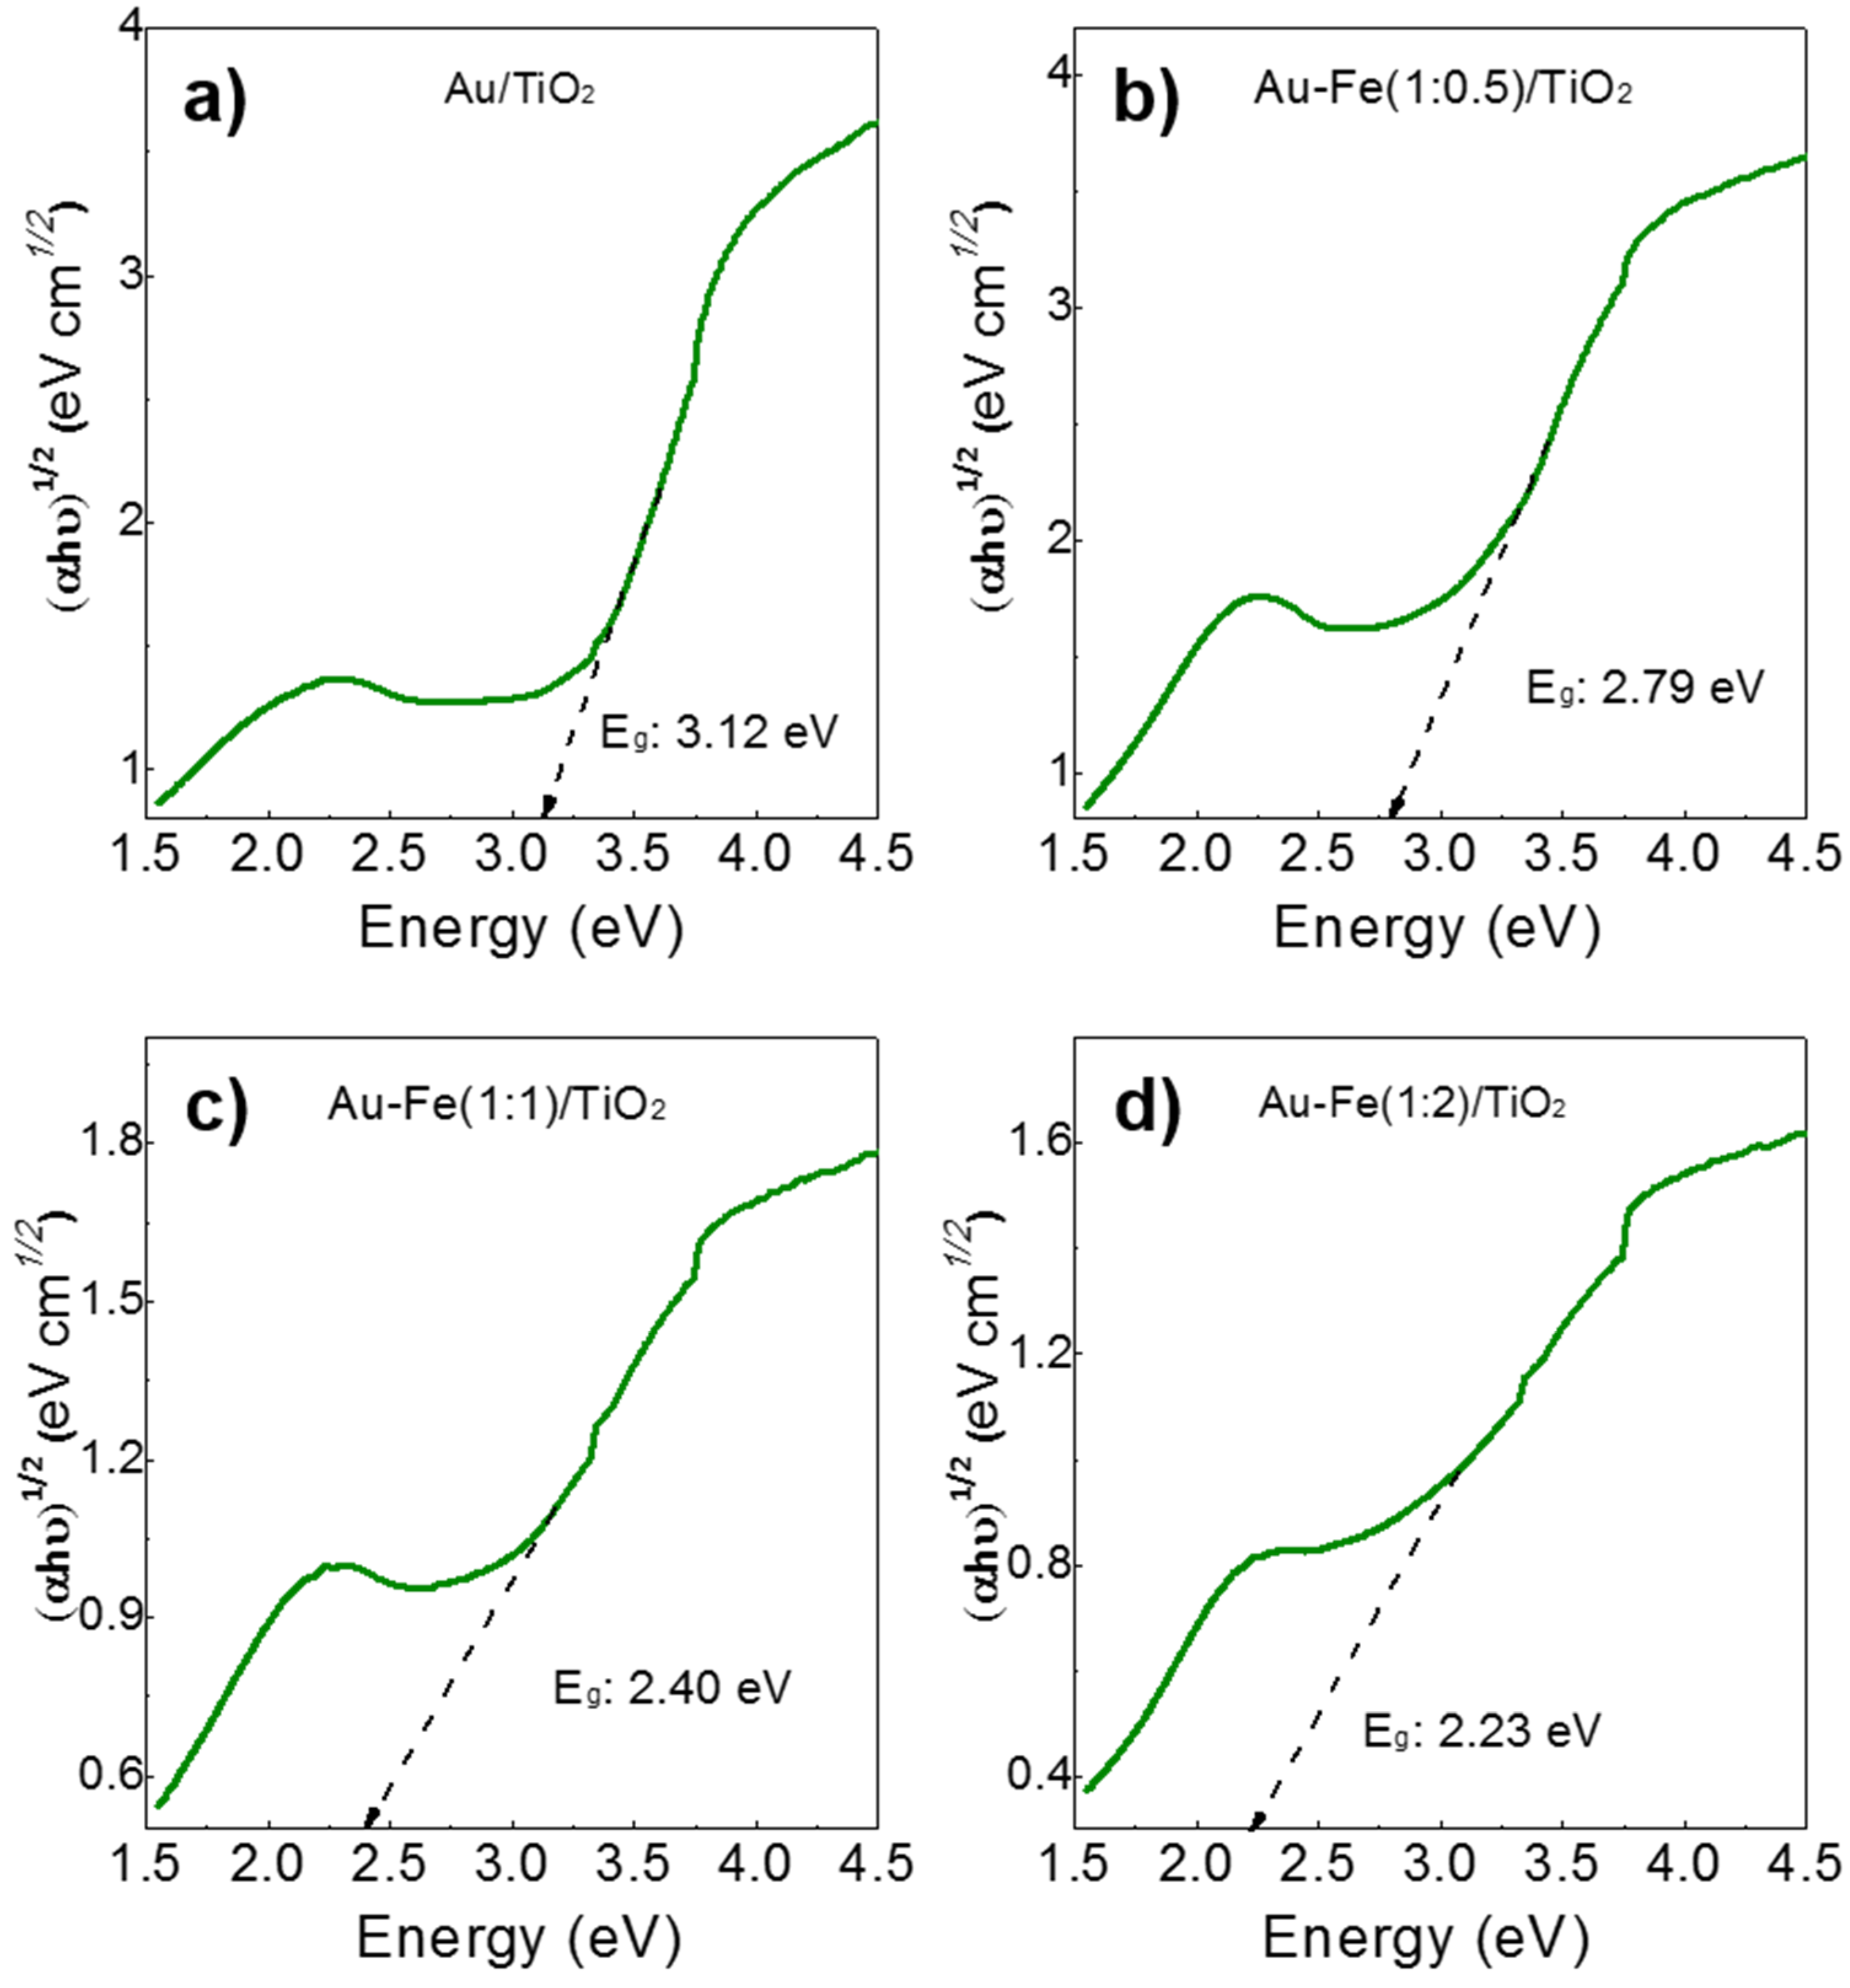
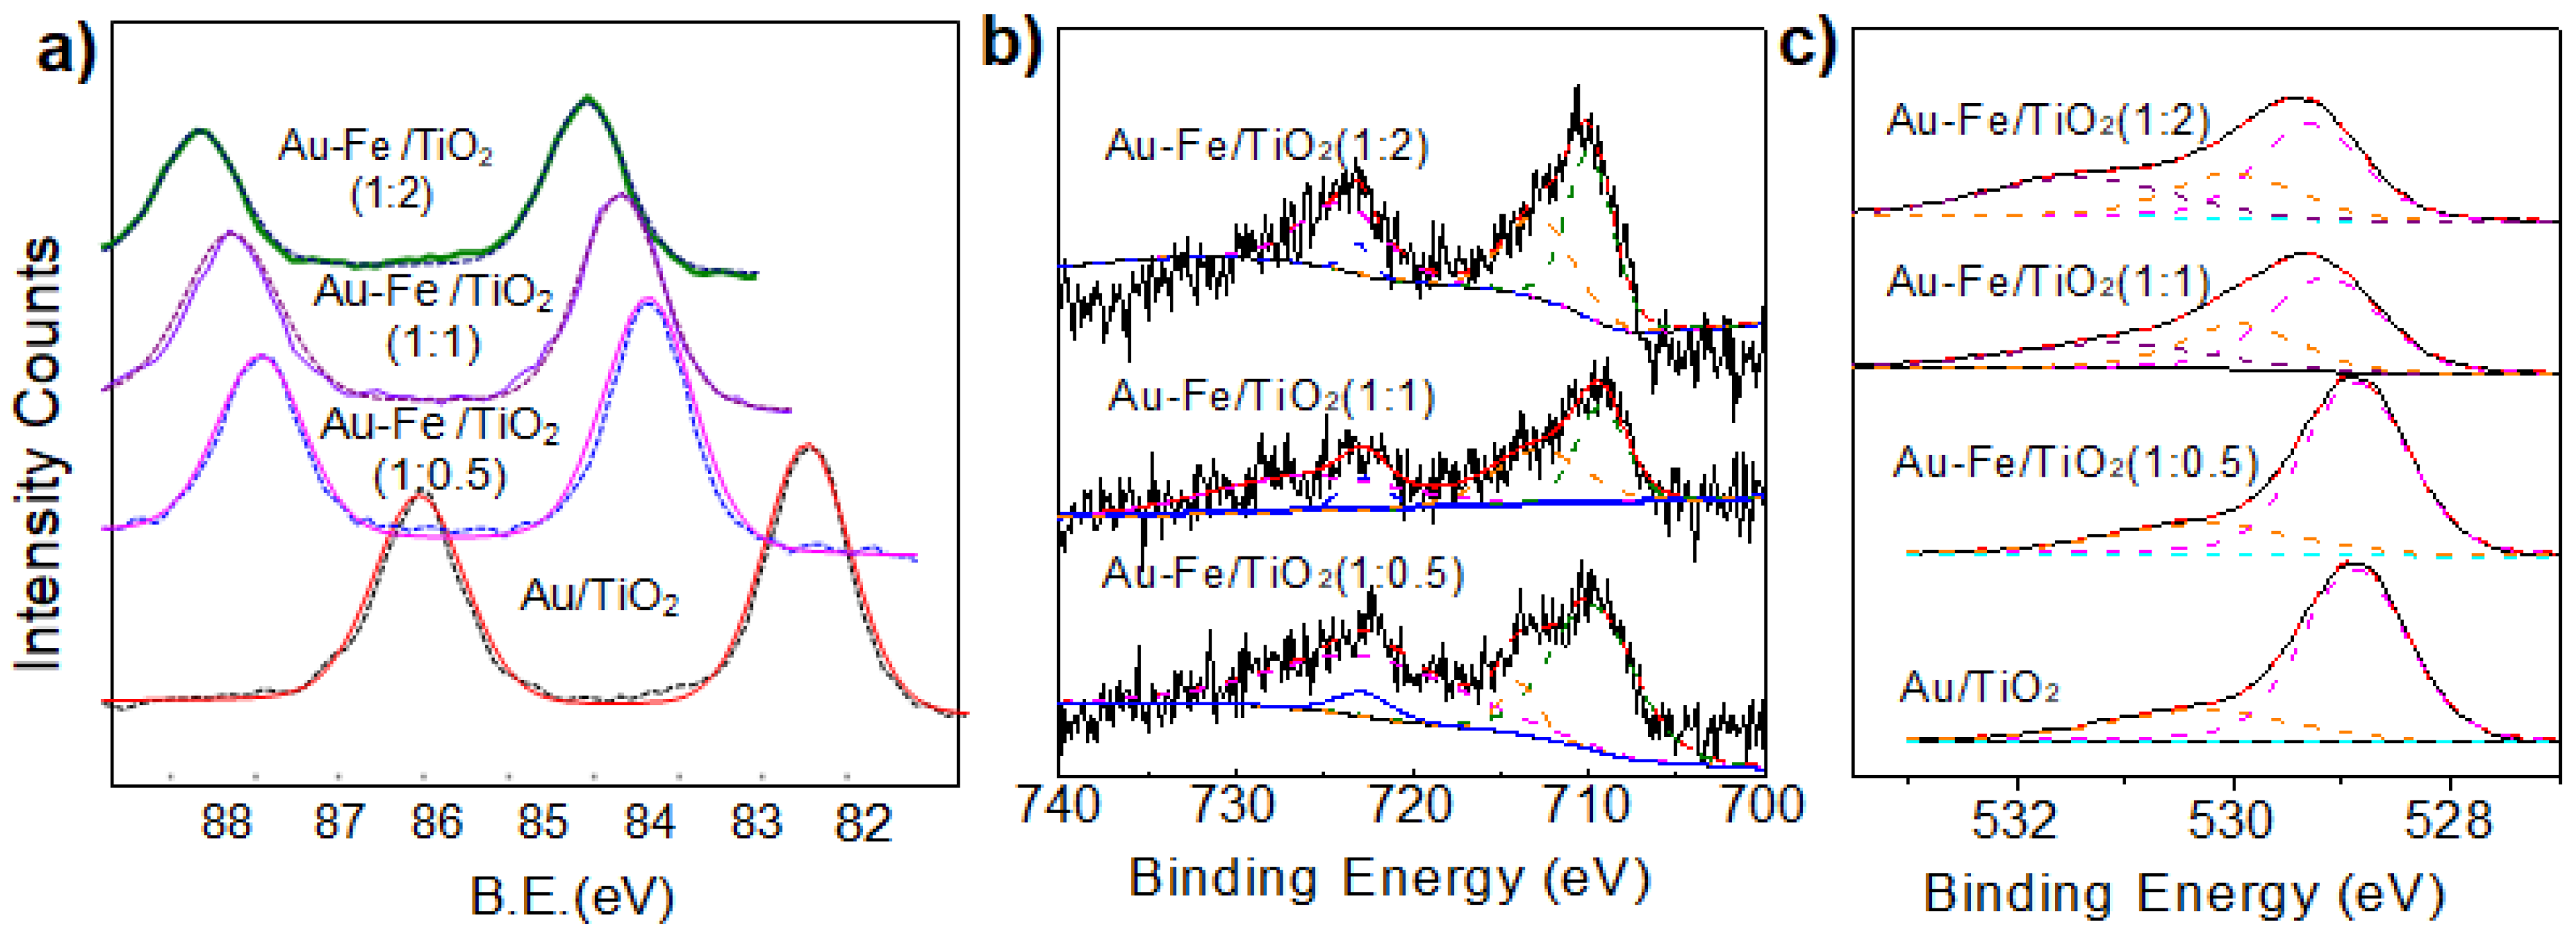
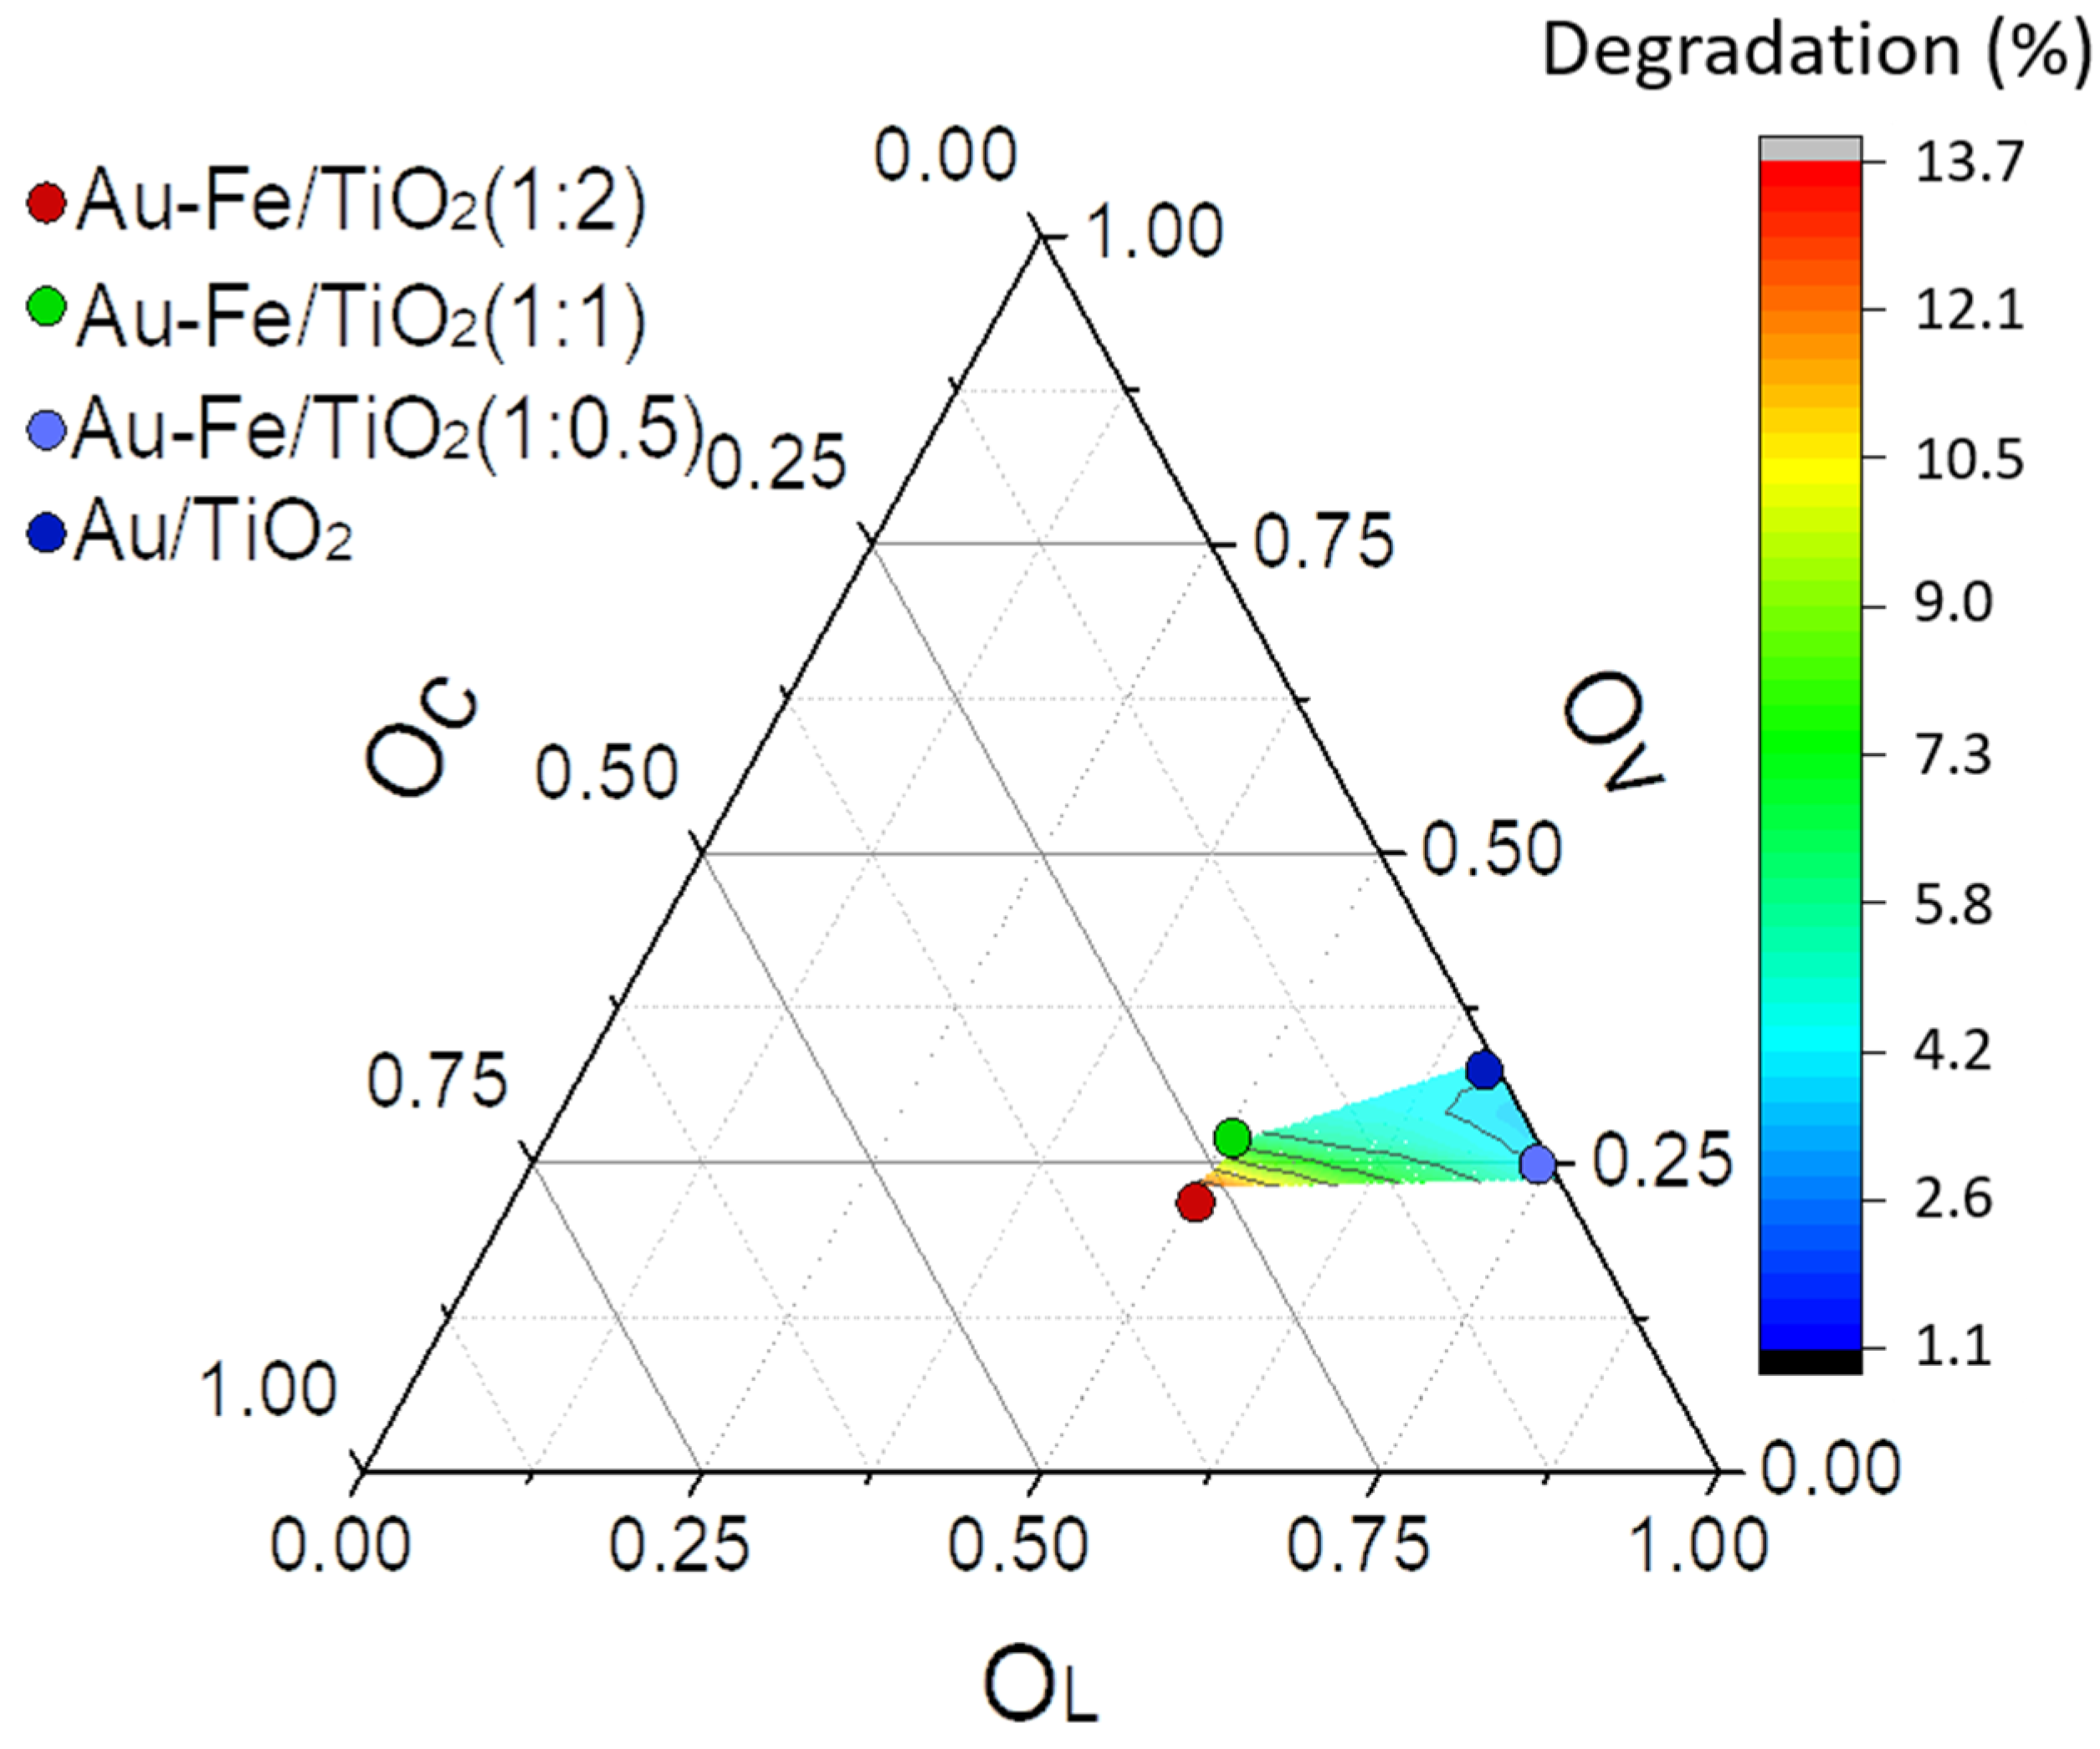
2.1. Structural Properties and Bandgap Energies of Catalysts

The crystalline phases of the Au/TiO2 and Au-Fe/TiO2 catalysts were characterized using XRD, as shown in Figure 1. Five major characteristic diffraction peaks at 2θ = 25.3°, 38.6°, 48.0°, 55.1°, 62.6° were detected, corresponding to the (101), (112), (200), (211), and (204) planes of the anatase-phase [26]. Some other peaks belonging to the rutile-phase ((110), (101), and (211) planes) were also detected at 2θ = 27.4°, 36.1°, 54.3° [27]. The XRD peak at 38.1° is attributed to the reflection of Au(111) lattice planes of gold nanoparticles. The continuous shift of the Au peak to higher 2θ values with increasing Fe concentration (Figure 1b) indicates that the FeOx species were deposited on or near to Au particles as mono or multilayers [28]. The Au diffraction peak became sharper with increasing FeOx content, in line with the increase of the Au particle size (see Table 1). Note that no diffraction peak of crystalline FeOx was discernible, inferring that the FeOx species were well-dispersed as an amorphous phase. Using the Scherrer equation, the crystallite sizes of anatase and rutile particles were estimated to be ca. 17 and 18 nm, respectively. The amount of deposited FeOx had no significant effect on the grain size of TiO2. However, the specific surface area of Au-FeOx/TiO2 determined by BET analyses increased with the amount of loaded FeOx (see Table 1).
Figure 2 displays the HRTEM images of the supported nanogold catalysts. The Au nanoparticles were highly dispersed on the surface of the TiO2 microspheres. The mean size of Au nanoparticles was in the range of 4 to 5 nm, but particles of bigger size were also discernible. As mentioned above, a slight increase in the mean Au particle size was observed with the FeOx loading. The Au nanoparticles were in intimate contact with the TiO2 support, which favors a photo-generated electron transfer between the Au and TiO2 [24,25].
The bandgap energies were estimated from the Kubelka–Munk function via an exploration of the corresponding plots, using the relation αhν = K(hν − Eg)n/2, in which K is a material independent constant; α is the absorption coefficient (2.303); hν is the incident photon energy; Eg is the optical bandgap energy of the material (1240 eV); and n depends on the type of transition in the semiconductor [29]. The calculated bandgap energies are listed in Table 1 and corresponding absorbance spectra are shown in Figure 3. The bandgap energy of TiO2 decreased upon deposition of Au from 3.23 to 3.12 eV, followed by its further gradual decrease to 2.23 eV caused by the doping with FeOx.

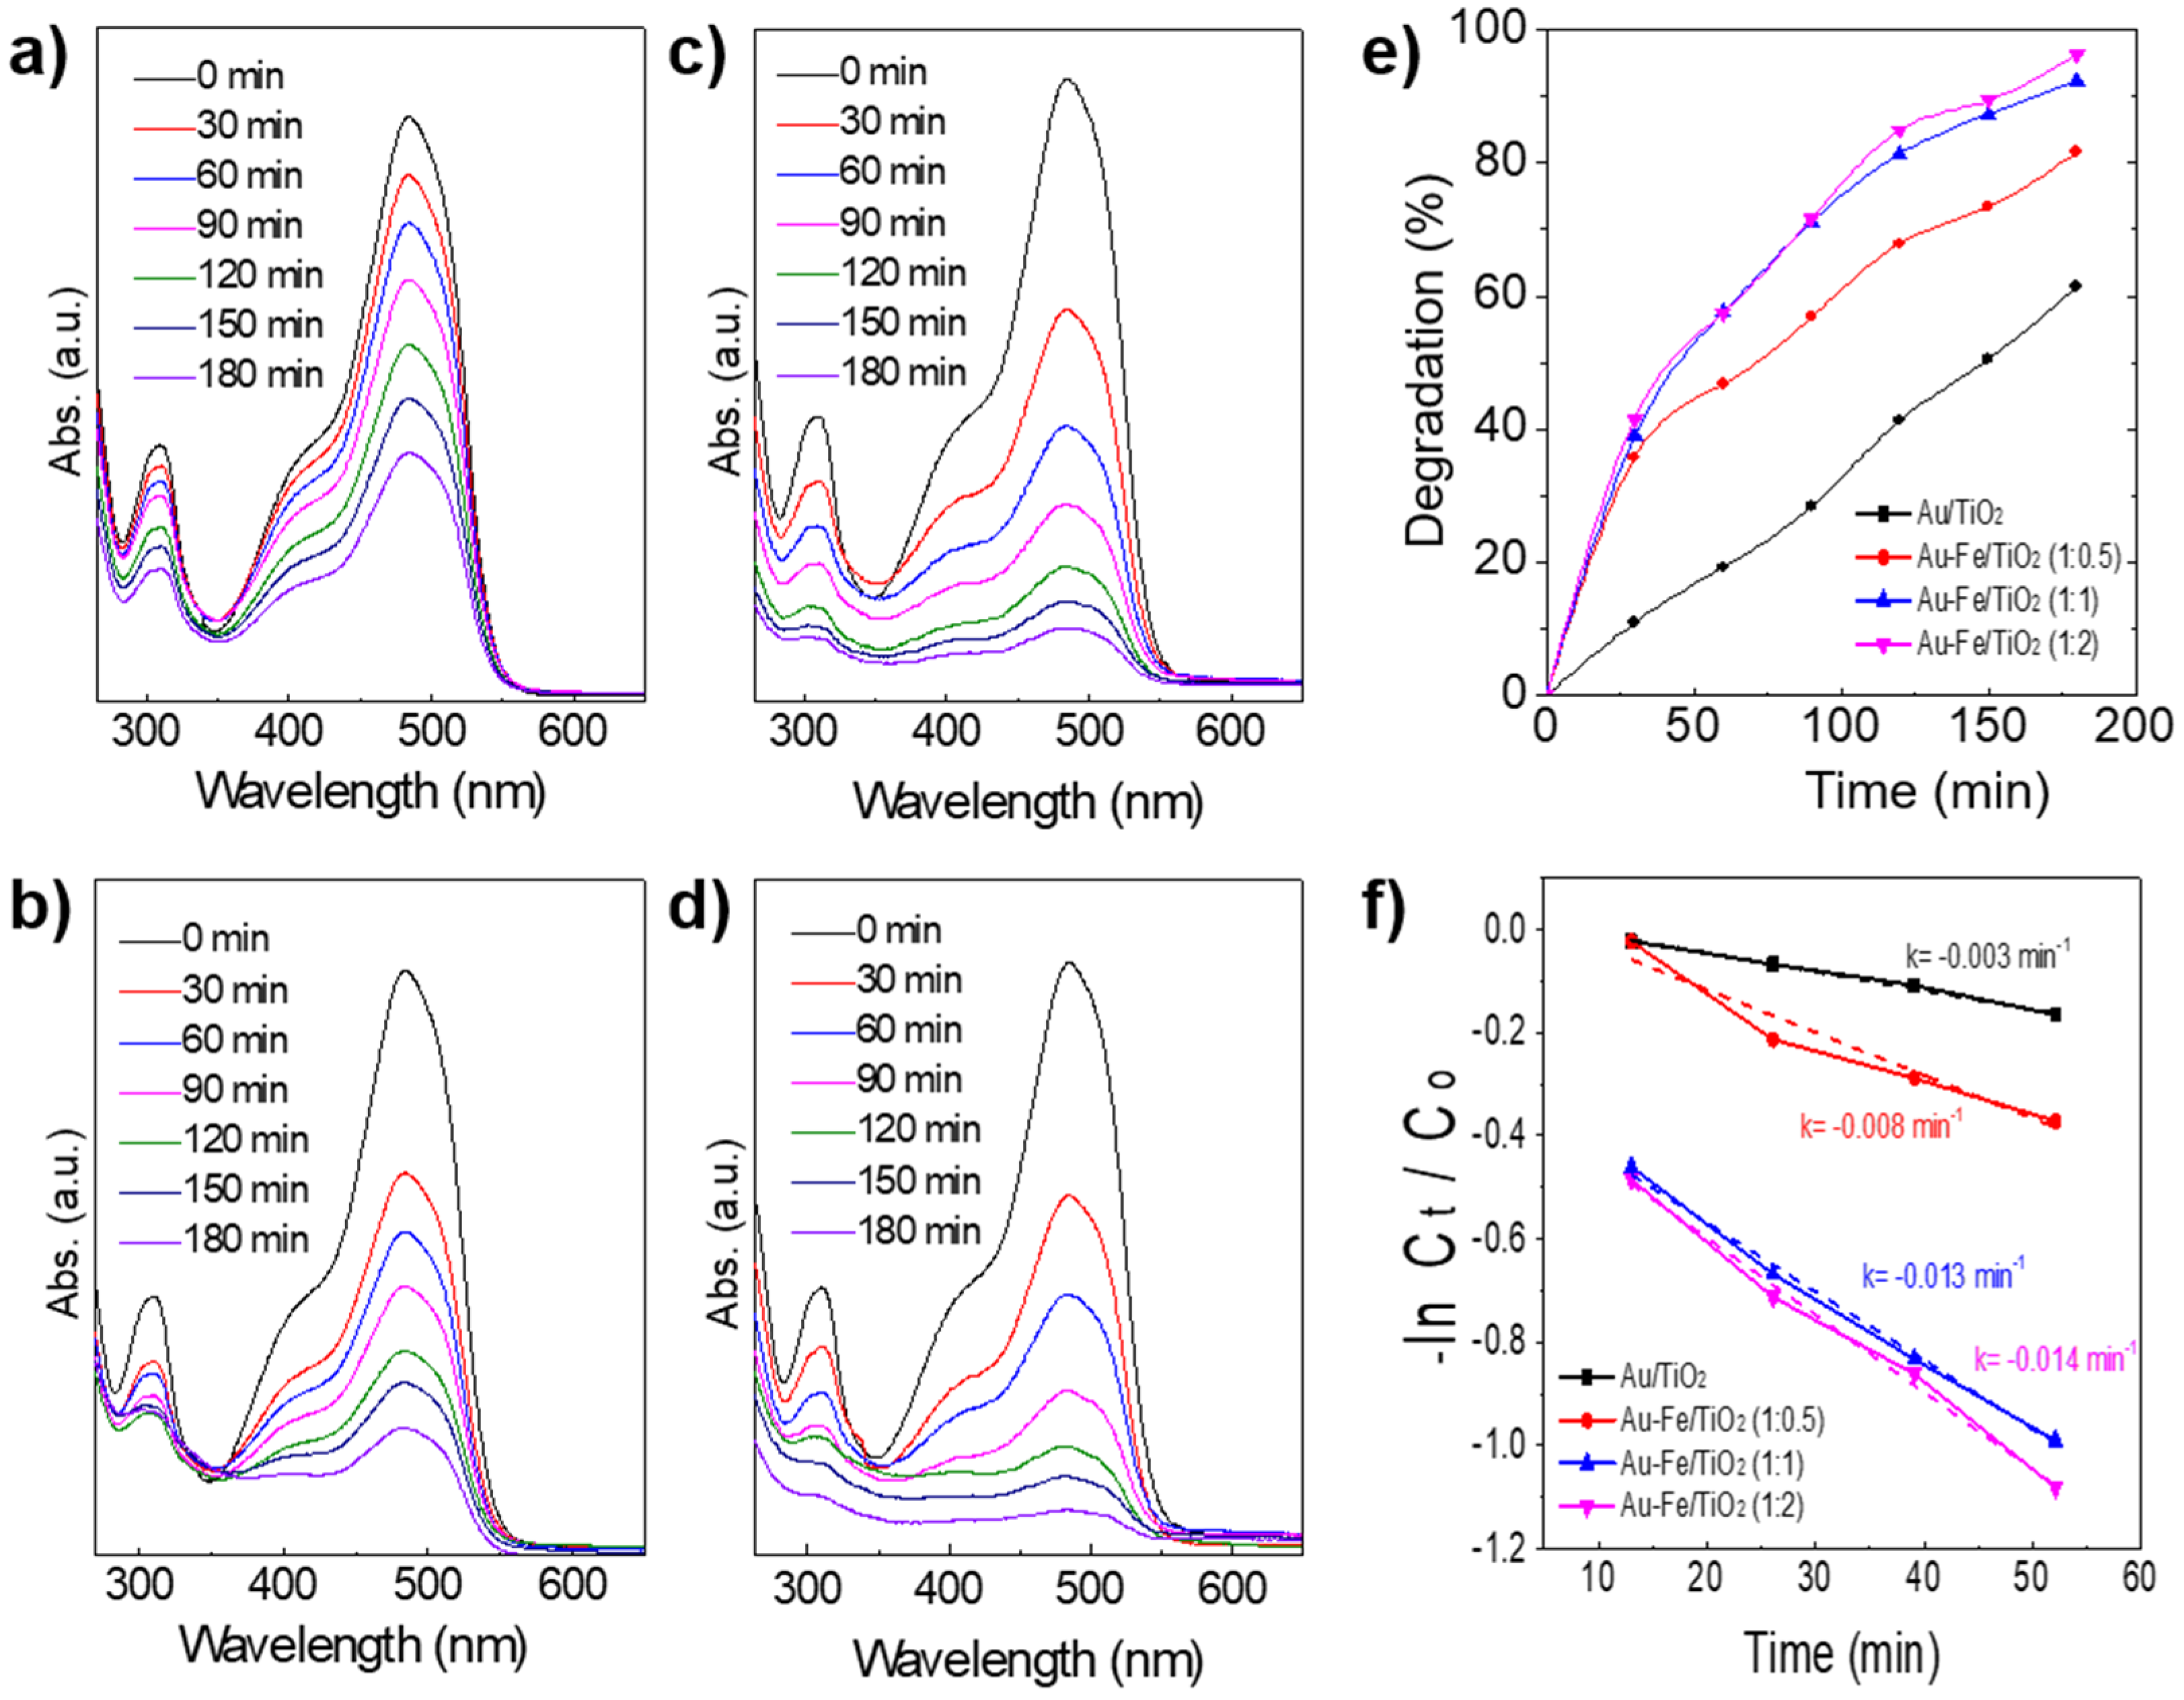
2.2. Catalytic Performance in Photo-Degradation of Orange II

The photocatalytic performance of the nanogold catalysts was evaluated for the degradation of Orange II under UV-light irradiation (365 nm). Three absorbance bands of Orange II, two bands in the visible region and one in the ultraviolet region, were used to monitor the photocatalytic process. The UV band at 310 nm is ascribed to the naphthalene rings of the dye [30], while the bands in the visible region at 484 nm and 430 nm are assigned to Orange II in hydrazone and azo forms (Scheme 1), respectively. As shown in Figure 4a, Au/TiO2 exhibited an inferior degradation of Orange II in an irradiation time of 180 min, which is mainly caused by the inability to generate enough free radicals during the photocatalysis. However, the degradation rate of Orange II was greatly enhanced when FeOx species were impregnated onto the Au/TiO2, as seen in Figure 4. Increased loading of FeOx species further accelerated the photodegradation process. The reaction rate obeyed fairly well pseudo first-order kinetics r = k Corange II, and the estimated reaction rate constants were: Au/TiO2, 0.003 min−1; Au-Fe(1:0.5)/TiO2, 0.008 min−1; Au-Fe(1:1)/TiO2, 0.013 min−1; and, Au-Fe(1:2)/TiO2, 0.014 min−1, respectively. Thus, the catalytic efficiency followed the order of Au-Fe(1:2)/TiO2 ≈ Au-Fe(1:1)/TiO2 > Au-Fe(1:0.5)/TiO2 > Au/TiO2. This order is in line with the decrease of the bandgap energies (Table 1), as frequently observed in the photodegradation of azo dyes. As seen in Table 1, a slight increase in the BET surface area was confirmed. However, considering the huge difference in the catalytic activity highlighted in Figure 4, the slight increase of the surface area cannot account for the observed activity enhancement. By adding FeOx, the reaction rate slightly decreased in the initial period of reaction (Figure 4e,f). This could originate from changes in the surface configuration and oxidation state of FeOx reaching a steady state after a certain induction period. Importantly, no colored intermediate species were generated in the solution during the photocatalytic process, as shown by the UV-Vis spectra presented in Figure 4. The advantage of the addition of Fe oxide to TiO2 in photocatalysis was demonstrated by Mercyrani et al. [20], who reported that the best degradation performance was achieved with a catalyst containing 80% Fe3O4 and 20% TiO2. The addition of Fe3O4 contributes to the activation of O2 molecules via e transfer from the conduction band (CB) of TiO2 to the one of Fe3O4 as follows [20]:
TiO2 + → TiO2 (eCB, h+VB)
TiO2 (eCB) + Fe3O4 → TiO2 + Fe3O4 (eCB)
Fe3O4 (eCB) + O2 → Fe3O4 + O2
In our study with UV light, a small amount of FeOx (equal molar ratio with Au) was sufficient for the above e transfer through the Au nanoparticles due to the combination of Au, FeOx, and TiO2.
The oxidation state of Au nanoparticles is well known to be crucial in the photocatalytic degradation reactions [25]. Hence, we performed XPS measurements to elucidate the chemical properties of the Au, Fe, and O species. Figure 5 depicts the measured spectra of Au4f, Fe2p, and O1s of the Au/TiO2 and Au-FeOx/TiO2 catalysts. Only Au and Fe and no extra peak corresponding to any impurities were discernible. The fitted Au4f spectra show that gold nanoparticles were present in a single oxidation state, i.e., metallic Au0. The 4f7/2 photoelectron peak was located at the binding energy (BE) in the range of 83.1 to 83.4 eV. The BE was slightly lower than that of the reference Au foil (83.4 eV) caused by an electron transfer from TiO2 to gold nanoparticles. The Au 4f7/2 signal showed a negative shift in binding energy for Au/TiO2 and a continuous shift to higher BE with increasing FeOx content. The reported negative shifts of the Au 4f7/2 BE are scattered in a wide range from 0.2 to −1.2 eV. The particle–support interaction is suggested to be the possible reason for the negative energy shift. According to literature, the shift of the Au 4f7/2 peak toward lower BE can be better explained by an initial state effect associated with electron transfer from Ti3+ surface defect sites to Au clusters [31]. Interestingly, the Au4f7/2 peak showed a continuous shift to higher BE with increasing FeOx content due to the electron transfer from Au particles to the FeOx species.
The BE peaks at ~709.8 eV (Fe2p3/2) and 722.7 eV (Fe2p1/2) are characteristic of Fe2+ species in the form of FeO [32]. However, Fe3+ species (Fe2O3) also existed in all catalysts, as evidenced by the Fe2p3/2 at ~713.5 eV and Fe2p1/2 at ~723.6 eV. The concentration of Fe2+ species increased with the FeOx content (see Table 2), indicating an electron transfer from gold nanoparticles to FeOx, which is in agreement with the results of Au XPS analyses. The asymmetric O1s spectra were deconvoluted into three peaks, i.e., the BE values at ca. 529.5 eV, 530 eV, and 531.4 eV, as shown in Figure 5c. These peaks are associated with lattice oxygen species (OL), oxygen vacancies or defects (OV), and chemisorbed or dissociated oxygen species (OC), respectively [33,34,35]. Figure 6 shows the relative concentrations of these species on the catalyst surface together with the corresponding degrees of degradation of the catalysts achieved after 30 min under UV light irradiation. Obviously, the catalytic activity of Au-FeOx/TiO2 composites depends on their OC concentration, whereas OL is unfavorable for the photodegradation of Orange II molecules, as emerges from Figure 6, which shows the dependence of the concentration of OL, OV, and OC species. The chemisorbed OC is normally existing in the form of hydroxyl groups and adsorbed H2O/O2 on the surface of oxides. The surface hydroxyl groups and adsorbed O2 can facilitate the trapping of photoinduced electrons and holes, thus enhancing the photocatalytic degradation process [6]. These hydroxyl free radicals (·OH) and possibly also superoxide radicals (O2−•) are generated by the conduction band electrons via the reduction of the dissolved O2, reacting with Orange II molecules. The doping of the Au/TiO2 catalyst with FeOx enhances the production of the chemisorbed oxygen species on the surface. This is supported by the fact that the Au-Fe(1:2)/TiO2 photocatalysts with abundant OC species exhibited the highest activity in the photocatalytic degradation of Orange II.

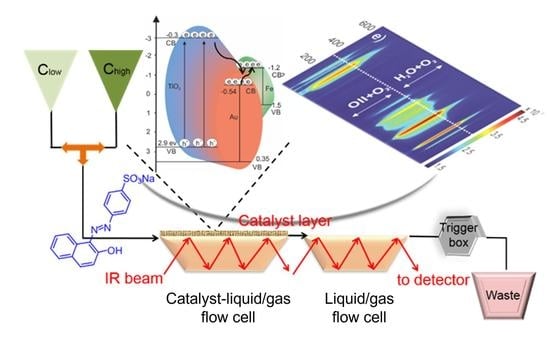
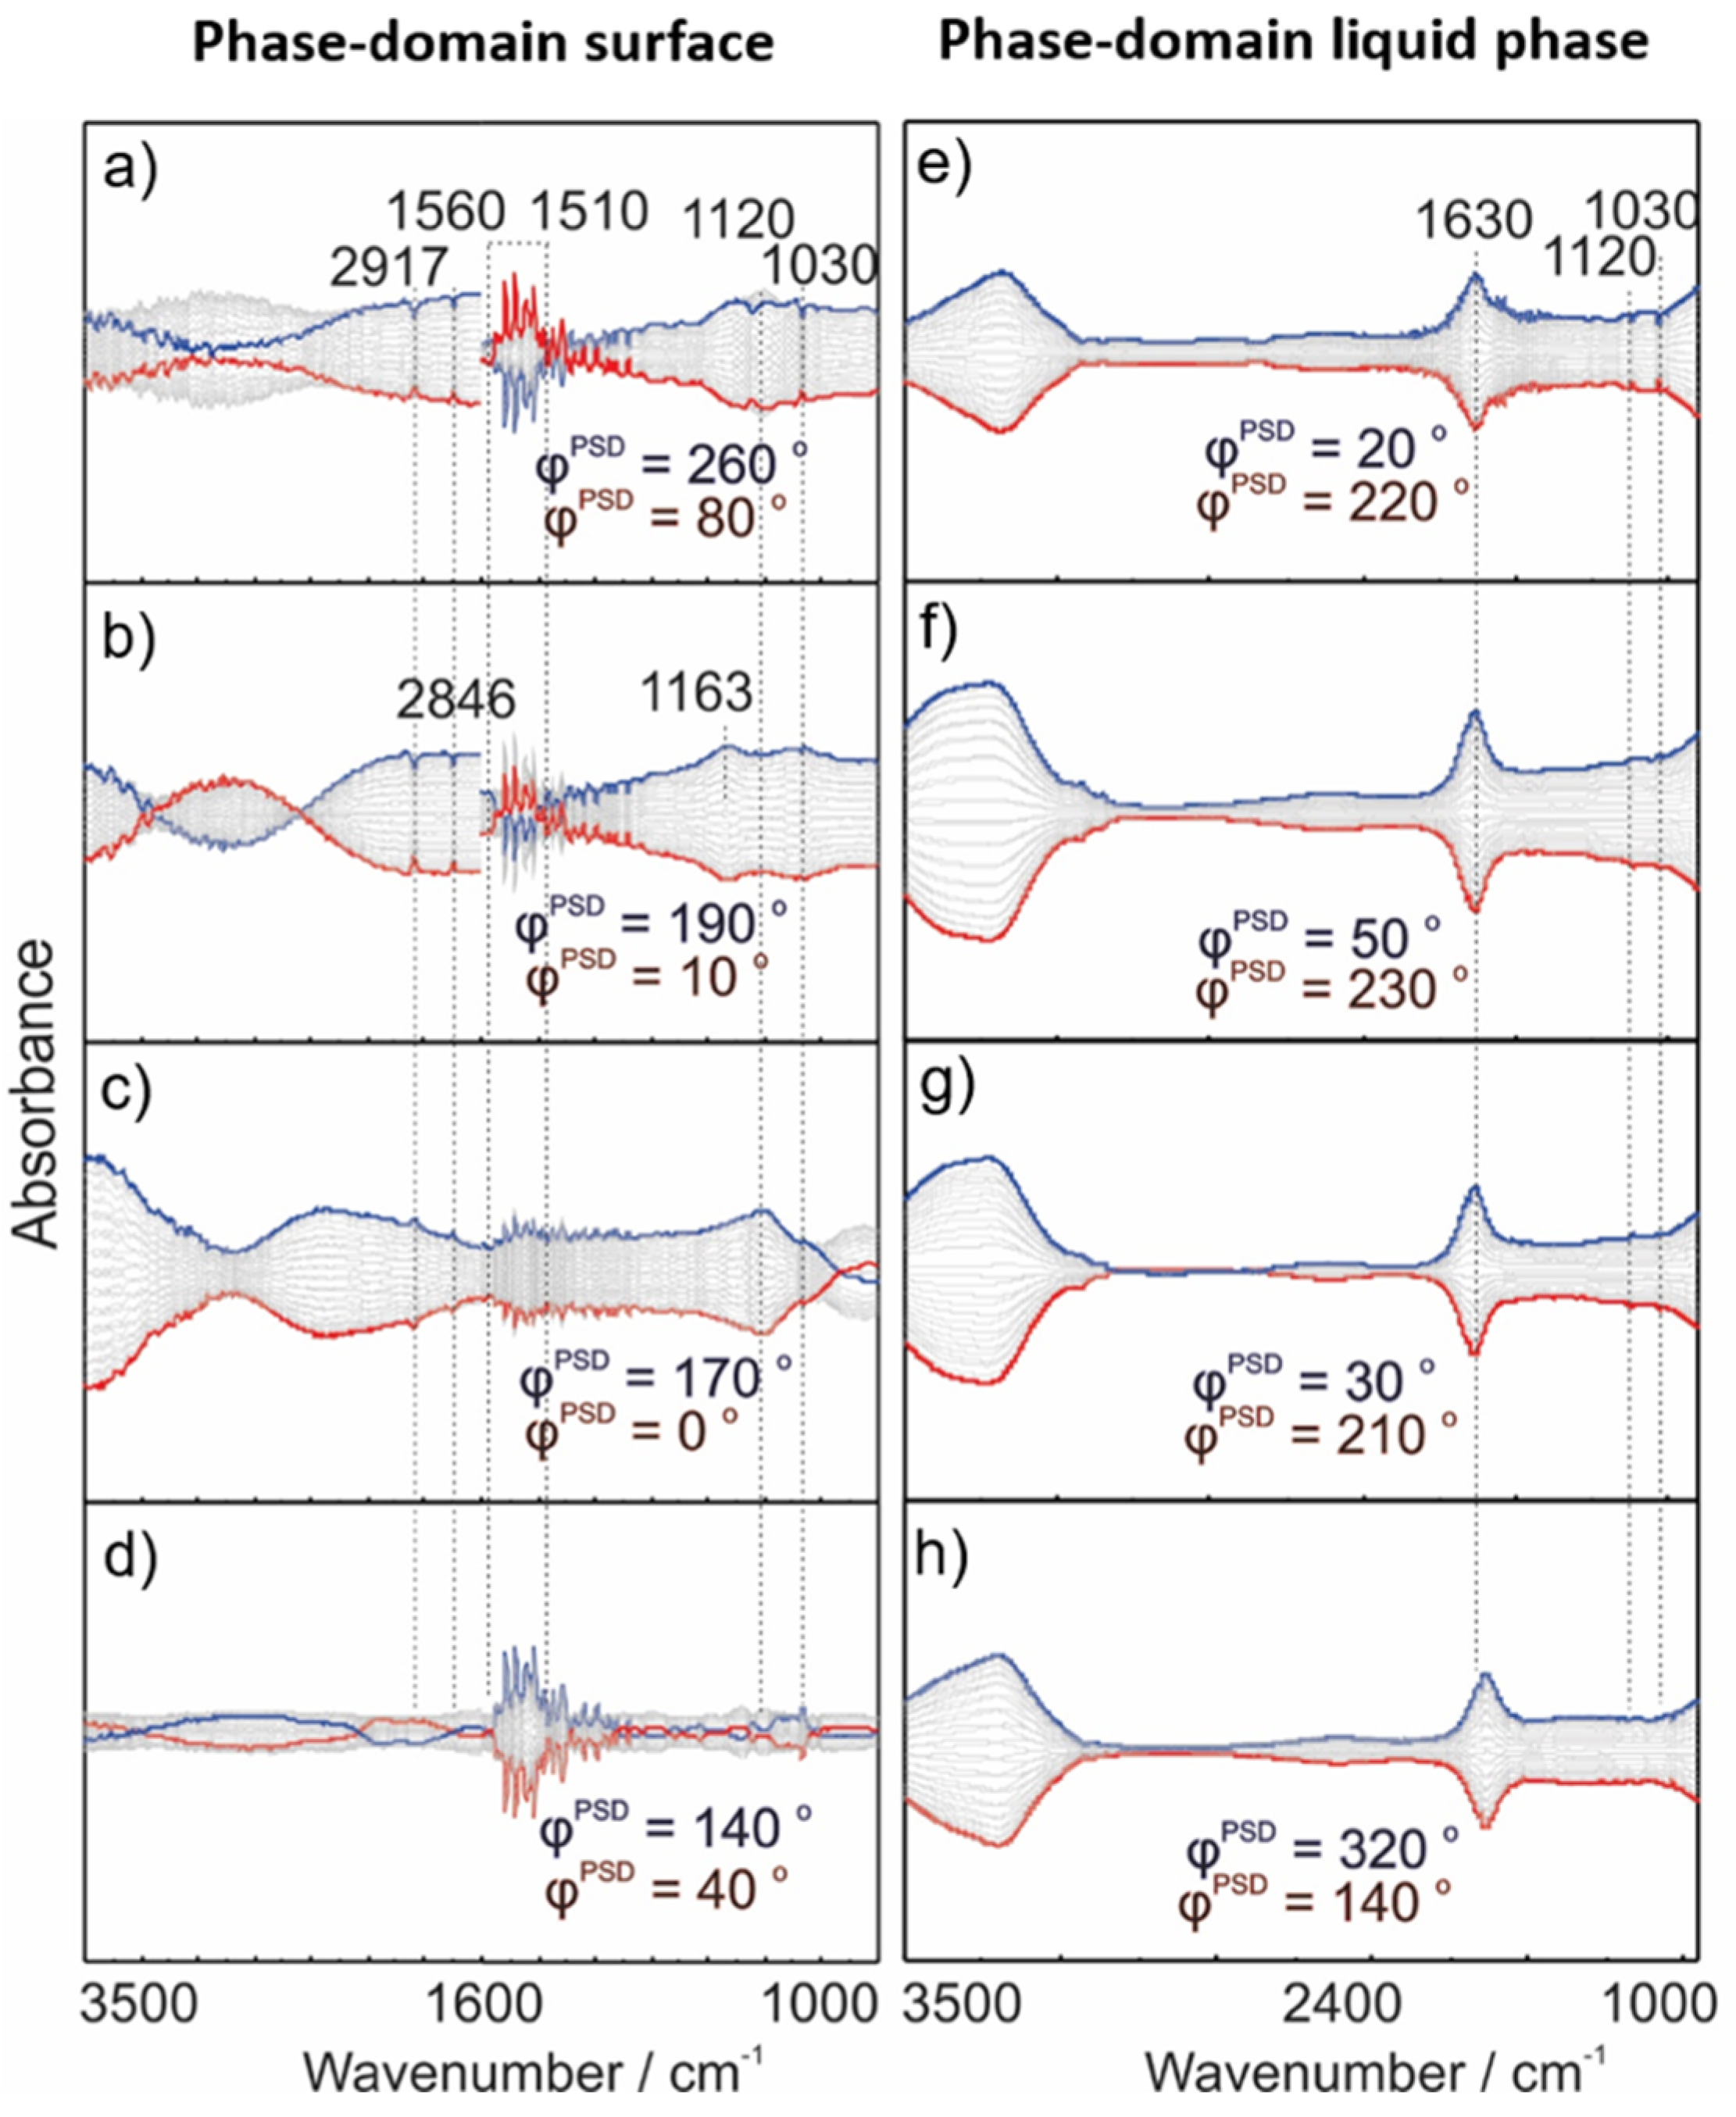
2.3. Operando MES-ATR-IR Spectroscopy

2.3.1. Concentration Modulation

The Orange II concentration modulation experiments were performed by periodically altering the feeding of two different solutions (Orange II + H2O + O2 + UV ↔ H2O + O2 + UV) at 25 °C. The surface spectra and the liquid phase spectra in the phase-domain are depicted in Figure 7. In the surface spectra, the IR band at 1510 cm−1 is assigned to the characteristic azo bond (N=N stretching vibration) of Orange II [16,18]. The band at 1454 cm−1 is due to the aromatic skeletal vibrations or the bending vibration mode (N–H) of the hydrazone form [14]. These bands became very weak with Au-Fe(1:2)/TiO2, indicating a rapid decomposition of the azo dye and aromatic ring cleavage of Orange II. This was also confirmed by the weak band at 1554 cm−1, originating from the aromatic skeletal vibrations of Orange II [31]. Interestingly, Au-Fe(1:2)/TiO2 showed a negative band (at 1260 cm−1) [14] for C–O–H stretching vibration. This is because the Orange II is subjected to intramolecular hydrogen bonding tautomeric interactions between the oxygen of the naphthyl group and the β-hydrogen of the corresponding azo linkage, converting Orange II into the hydrazone form. This transformation might be key for the high photodegradation activity of the Au-Fe(1:2)/TiO2 catalyst. The weak intensity of IR bands at 1554 cm−1 (C=C) [14] and 1213 cm−1 (=C–H bending) [12] also reflects the destruction of the aromatic group of the dye on Au-Fe(1:2)/TiO2. The sharp band at 1120 cm⁻1 is ascribed to the symmetric vibration of the sulfonate groups (SO3) [19]. The bands at 1033 and 1006 cm−1 are assigned to the coupling between the benzene mode and SO3 [16]. Significantly, destruction of the aromatic components occurs on the Au-FeOx/TiO2 surface during the photocatalytic process, as evidenced by the persistence of the very weak band intensities related to the hydrazone part of the azo dye, such as the aromatic C=C, N–H, and O–H stretching vibrations at 1554 and 1454 and 1260 cm−1, respectively (Figure 7a–c). These IR observations support the fact that Au-Fe(1:2)/TiO2 outperforms the other catalysts in degrading Orange II. The phase-domain spectra (Figure 7a–d) were demodulated at the phase angle φPSD of each 10° step in the range of 0–350°. Obviously, the presence of FeOx species on the Au/TiO2 surface significantly increased the amount of adsorbed Orange II; the absorbance of the band at 1120 cm−1 was highest (4.5 × 10⁻³) for Au-Fe(1:2)/TiO2. It is worthy to note that the promotion of Au/TiO2 with FeOx species leads to slower adsorption of Orange II, whereas its desorption was rather quick as indicated in Figure 7e–h (colored time-domain spectra). This change in the adsorption-desorption dynamics indicates that the population of adsorption sites was increased, but the interaction of Orange II with the catalyst surface became much weaker upon the promotion of Au/TiO2 with FeOx. The stronger adsorption of Orange II on Au/TiO2 seems to suppress its photodegradation activity.
The liquid phase spectra of Orange II concentration modulation (Figure 7i–l) also show that the intensity of the characteristic azo bond decreases faster with increasing concentration of FeOx species on Au-Fe/TiO2. This is in good agreement with the UV-Vis analyses in Figure 4. The degradation of Orange II has been shown to generate SO42− and BH4+ [16]. Our surface spectra showed no sign of these species adsorbed on the surface. Therefore, they must be in the liquid phase but probably under the detection limit of FT-IR. Our operando MES-ATR-IR set-up successfully monitored both the liquid and surface spectra on the same time scale.

2.3.2. Gas Modulation

Finally, the surface and liquid phase spectra of MES-ATR-IR during gas composition modulation (replacement of O2 by He), Orange II + O2 + UV ↔ Orange II + He + UV, is shown in Figure 8. IR bands detected in the gas modulation were much weaker than those observed in the Orange II concentration and UV light modulation. The bands from 1560 to 1510 cm−1 are assigned to the combination of vibrations involving N=N aromatic skeletal vibrations [16], N–H bending and –N=C stretching of the NH–N=C group, and the phenyl ring vibrations [36]. These characteristic bands of the azo dye appeared as negative bands over Au-Fe(1:2)/TiO2 and Au-Fe(1:1)/TiO2, and they show up as positive weak bands with Au-Fe(1:0.5)/TiO2, and comparatively strong bands with Au/TiO2. It suggests that the dye molecules are cleaved at the azo bonds and that the Orange II was totally degraded over the Au-Fe(1:2)/TiO2 and Au-Fe(1:1)/TiO2 catalysts in the presence of O2. This finding is consistent with the observations in the liquid phase spectra (Figure 8e–h).

3. Experimental

3.1. Chemicals and Materials

The azo dye Orange II, exhibiting a maximum absorbance at 486 nm, has been purchased from Sigma-Aldrich. Commercial TiO2 nanopowder, consisting of rutile and anatase (Degussa, P25, approximate composition: anatase 85%, rutile 15%), was used as a catalyst support. Chloroauric acid (HAuCl4·H2O, 98%), Fe(NO3)3·9H2O (Sigma-Aldrich, St. Louis, MO, USA, >98%) and aqueous ammonia solution (Adams, 25–28%) were employed for catalyst preparations.

3.2. Preparation of Au/TiO2 and Au-FeOx/TiO2 Catalysts

The Au/TiO2 catalysts were prepared using a deposition-precipitation method [37]. Sixty mg of HAuCl4·H2O was dissolved in 100 mL of deionized water. The solution was heated to 70 °C, and the pH was adjusted to 7.0 by adding 1.0 M aqueous ammonia solution. Afterward, the TiO2 powder was added to the solution under constant stirring. The gold loading was controlled at a nominal value of 3 wt% as Au metal (97 wt% TiO2). The resulting slurry was aged for 1 h, while the pH was maintained at around 7.0. Then, the solid was filtered off and washed with deionized water. The obtained powder was dried at 60 °C overnight and calcined at 300 °C for 1 h in air to obtain 3 wt% Au/TiO2. For the preparation of Au-FeOx/TiO2, the appropriate amount of iron(III) nitrate was dissolved in 100 mL of deionized water, and the Au/TiO2 powder was added, resulting in a suspension, which was stirred for 1 h at room temperature. Subsequently, the suspension was heated to 60 °C in a rotary evaporator and aged for 1 h, followed by solvent evaporation at 35 °C under vacuum. The powders were then dried at 60 °C overnight and calcined at 300 °C for 1 h. The Au-FeOx/TiO2 catalysts with different Au:Fe molar ratios are designated as Au-Fe(1:0.5)/TiO2, Au-Fe(1:1)/TiO2, and Au-Fe(1:2)/TiO2.

3.3. Characterization

UV–Vis absorption spectra of Orange II in aqueous solutions were analyzed from 200 to 600 nm on a Hewlett-Packard Agilent 8453 diode array spectrophotometer (Agilent Technologies, Inc., Santa Clara, CA, USA). The UV-Vis diffuse reflection spectra of the samples were measured using a Shimadzu UV2600 UV-Vis Spectrophotometer (Shimadzu Corporation, Kyoto, Japan). The bandgap energies of the photocatalysts were determined employing the Kubelka-Munk theory of reflectance.
The crystalline structure of the catalysts was analyzed using XRD recorded on a PANalytical X’Pert powder X-ray diffractometer (PANalytical, Almelo, Netherlands) operated at a voltage of 60 kV and a current of 55 mA using a Cu Kα radiation source in the 2θ range (λ = 1.5406 Å) from 5 to 80° with a step of 0.02°. The average crystallite sizes of anatase and rutile were calculated employing the Scherrer equation: Dhkl = 0.9 λ/β cos θ, where λ is the wavelength, β is the FWHM (full width at half maximum) measured in radians on the 2θ scale, and θ is the Bragg angle. The average crystal size of rutile and anatase was estimated by averaging the values of all the diffraction patterns.
XPS measurements were performed under ultrahigh vacuum (UHV) using the following conditions: 1.0 × 10⁻⁷ Torr, axis HS using a monochromatic Al Kα cathode source at 150W, focused X-ray 100 μm beam, pass energy: 55 eV with 0.1 eV step length, detection angle (take off): 45° on the X-ray microprobe (ULVAC-PHI Quantera SXM) (ULVAC-PHI, Inc., Chigasaki, Japan). All binding energies are referenced to the binding energy of C 1s at 284.6 eV.
HRTEM images were obtained on a FEI Tecnai G2 F30S-Twin microscope (FEI Company, Hillsboro, OR, USA) operated at an acceleration voltage of 300 kV. The specimen was prepared by ultrasonically dispersing the sample into ethanol, and droplets of the suspensions were deposited on a carbon-enhanced copper grid and then dried in air. Two-hundred Au particles were analyzed to estimate their mean size on each sample.
The specific surface areas of all catalysts were determined using nitrogen adsorption measurements at 77 K on an ASAP 2020 apparatus (Micromeritics, Norcross, GA, USA) using the Brunauer-Emmett-Teller (BET) method. Prior to adsorption measurements, all samples were degassed at 250 °C for 4 h to remove adsorbed CO2 and H2O.

3.4. Catalytic Photodegradation

Catalytic photodegradation was performed in a 500 mL three-neck round bottom flask. Two-hundred mL of 0.02 mmol/L Orange II solution was photolyzed with a catalyst dose of 30 mg. UV light with λ = 365 nm was applied for photodegradation of Orange II at 25 °C controlled by a thermostat (Julabo GmbH, Seelbach, Germany). Oxygen gas was saturated in the catalyst-containing suspension as an oxidant at a rate of 20 mL/min. Samples of the suspension were taken at intervals of 30 min and immediately treated with centrifugation to remove the catalysts. The resulting solutions were analyzed using UV-Vis to determine the catalytic performance.

3.5. Operando ATR-IR Combined with Modulation-Excitation Spectroscopy

ATR-IR studies [38,39,40] were performed on a Vertex 70 v spectrometer (Bruker, Billerica, MA, USA) equipped with a liquid-nitrogen-cooled mercury-cadmium-telluride (MCT) detector (ID316, Ge Window) and an optical filter (F321). Catalyst layers for in situ measurements were prepared using a deposition-evaporation method. Also, 180 mg of catalyst was added to 24 mL of ethanol, then the slurry was ultrasonicated for 15 min to obtain a uniform suspension. Afterward, 1.6 mL of the slurry was brought onto a Ge internal reflection element (IRE, bevel of 45°, 52 mm × 20 mm × 2 mm), and subsequently the ethanol was evaporated at room temperature overnight. The prepared catalyst layer adhered to the IRE so that no loss of catalyst powders was observed for several hours under flow-through conditions.
Operando IR experiments were performed in the flow-through cell, which was mounted onto an ATR-IR attachment (HARRICK Scientific Products, Inc.), Pleasantville, NY, USA). The temperature of the cell was controlled by a thermostat at 25 °C. Spectra were recorded at 4 cm−1 of spectral resolution and 60 kHz of scanning velocity. Solutions were filled in glass tanks kept at atmospheric pressure. The tanks were connected to the reactor cell by Teflon tubing and a three-way valve. The solutions were introduced by a peristaltic pump installed downstream of the reactor cell. The liquid outlet was connected to another ATR-IR cell without a catalyst layer so that concentration changes in the liquid phase could also be monitored to realize operando spectroscopy.
Modulation-excitation ATR-IR spectroscopy (MES-ATR-IR) experiments [41,42,43,44] were carried out by periodically changing the reaction conditions. Three different types of modulation experiments were performed: (a) Orange II concentration modulation (Orange II/H2O/O2/UV - H2O/O2/UV); (b) gas modulation (Orange II/H2O/O2/UV - Orange II/H2O/He/UV); and (c) UV-light modulation (Orange II/H2O/O2/UV-on - Orange II/H2O/O2/UV-off). Eight cycles were repeated, and the last five cycles were averaged into one cycle to enhance the S/N ratio and time resolution. Phase-sensitive detection (PSD) was used to further remove the noise and to obtain kinetic information of responding surface species. The acquired time-domain spectra were mathematically treated with PSD to obtain phase-domain spectra according to the following equation:
A k ( v ˜ ) cos ( φ k + φ k d e l a y ( v ˜ ) ) = 2 T 0 T A ( t ,   v ˜ ) sin ( k ω t + φ k ) d t
where T is the length of a cycle, ω is the demodulation frequency (where ω = 1 in this study), φk is the demodulation phase angle, k is the demodulation index (where k = 1 in this study), and A(t, v ˜ ) and Ak( v ˜ ) are the active species responses in the time and phase domains, respectively.

4. Conclusions

The doping of a TiO2-supported Au catalyst, containing 3 wt% metallic Au nanoparticles of 4–6 nm mean size, with an amorphous layer of FeOx species, in which the iron was present as Fe2+ and Fe3+, resulted in a nearly five-fold higher photocatalytic degradation rate of the azo dye Orange II compared to the parent Au/TiO2. The reason for this rate enhancement could be traced back to a strong decrease of the bandgap energy from 3.12 eV to 2.34 eV for the Au-FeOx/TiO2 catalyst with a molar ratio of Au:Fe = 1:2, and a dramatic increase of the surface population of chemisorbed and/or dissociated oxygen species. The metallic gold nanoparticles acted as electron scavengers, as confirmed by XPS analyses, which indicated an electron transfer from TiO2 to Au, resulting in a lowering of the bandgap energy from 3.23 eV to 3.12 eV. Operando MES-ATR-IR spectroscopy investigations of the catalytic solid/liquid-gas interface and the bulk liquid-gas phase during the photocatalytic degradation revealed that the FeOx doping enhanced the cleavage of the azo bond and weakened the interaction of Orange II with the catalyst surface, resulting in a change of its adsorption-desorption dynamics. To the best of our knowledge, this is the first application of operando MES-ATR-IR spectroscopy to study the surface processes occurring at the solid-liquid interface of a photocatalytic reaction.

Author Contributions

Conceptualization, N.M. and A.B.; formal analysis, Q.S. and Z.Q.; investigation, A.W.; writing—original draft preparation, A.W.; writing—review and editing, N.M.; D.M.M.; G.L. and A.B.; supervision, N.M. and G.L.; project administration, N.M and A.B.; funding acquisition, D.M.M. and G.L.; All authors have read and agreed to the published version of the manuscript.

Funding

This research was funded by the National Natural Science Foundation of China, grant number 21773189, and Liaoning Revitalization Talents Program, grant number XLYC1807121.

Conflicts of Interest

The authors declare no conflict of interest.

References

  1. Kamat, P.V. Photochemistry on nonreactive and reactive (semiconductor) surfaces. Chem. Rev. 1993, 93, 267–300. [Google Scholar] [CrossRef]
  2. Kaur, P.K.; Badru, R.; Singh, P.P.; Kaushal, S. Photodegradation of organic pollutants using heterojunctions: A review. J. Environ. Chem. Eng. 2020, 8, 103666. [Google Scholar] [CrossRef]
  3. Li, X.; Yu, J.; Jaroniec, M. Hierarchical photocatalysts. Chem. Soc. Rev. 2016, 45, 2603–2636. [Google Scholar] [CrossRef] [PubMed]
  4. Ben Mansour, H.; Boughzala, O.; Dridi, D.; Barillier, D.; Chekir-Ghedira, L.; Mosrati, R. Les colorants textiles sources de contamination de l’eau: CRIBLAGE de la toxicité et des méthodes de traitement. J. Water Sci. 2011, 24, 209–238. [Google Scholar] [CrossRef] [Green Version]
  5. Ong, C.B.; Ng, L.Y.; Mohammad, A.W. A review of ZnO nanoparticles as solar photocatalysts: Synthesis, mechanisms and applications. Renew. Sust. Energ. Rev. 2018, 81, 536–551. [Google Scholar] [CrossRef]
  6. Vinodgopal, K.; Wynkoop, D.E.; Kamat, P.V. Environmental photochemistry on semiconductor surfaces: Photosensitized degradation of a textile azo dye, acid Orange 7, on TiO2 particles using visible light. Environ. Sci. Technol. 1996, 30, 1660–1666. [Google Scholar] [CrossRef]
  7. Ajmal, A.; Majeed, I.; Malik, R.N.; Idriss, H.; Nadeem, M.A. Principles and mechanisms of photocatalytic dye degradation on TiO2based photocatalysts: A comparative overview. RSC Adv. 2014, 4, 37003–37026. [Google Scholar] [CrossRef]
  8. Konstantinou, I.K.; Albanis, T.A. TiO2-assisted photocatalytic degradation of azo dyes in aqueous solution: Kinetic and mechanistic investigations—A review. Appl. Catal. B 2004, 49, 1–14. [Google Scholar] [CrossRef]
  9. Shan, A.Y.; Ghazi, T.I.M.; Rashid, S.A. Immobilisation of titanium dioxide onto supporting materials in heterogeneous photocatalysis: A review. Appl. Catal. A Gen. 2010, 389, 1–8. [Google Scholar] [CrossRef]
  10. Horikoshi, S.; Serpone, N. Can the photocatalyst TiO2 be incorporated into a wastewater treatment method? Background and prospects. Catal. Today 2020, 340, 334–346. [Google Scholar] [CrossRef]
  11. Fernandez, J.; Kiwi, J.; Baeza, J.; Freer, J.; Lizama, C.; Mansilla, H.D. Orange II photocatalysis on immobilised TiO2 effect of the pH and H2O2. Appl. Catal. B 2004, 48, 205–211. [Google Scholar] [CrossRef]
  12. Li, G.; Qu, J.; Zhang, X.; Liu, H.; Liu, H. Electrochemically assisted photocatalytic degradation of Orange II: Influence of initial pH values. J. Mol. Catal. A Chem. 2006, 259, 238–244. [Google Scholar] [CrossRef]
  13. Liu, S.; Wang, S.; Sun, X.; Li, W.; Ni, Y.; Wang, W.; Wang, M.; Yao, S. Mechanism and kinetics studies on the degradation of acid Orange 7. Spectrosc. Spect. Anal. 2005, 25, 776–779. [Google Scholar]
  14. Lucarelli, L.; Nadtochenko, V.; Kiwi, J. Environmental photochemistry: Quantitative adsorption and ftir studies during the TiO2-photocatalyzed degradation of orange II. Langmuir 2000, 16, 1102–1108. [Google Scholar] [CrossRef]
  15. Rauf, M.A.; Meetani, M.A.; Hisaindee, S. An overview on the photocatalytic degradation of azo dyes in the presence of TiO2 doped with selective transition metals. Desalination 2011, 276, 13–27. [Google Scholar] [CrossRef]
  16. Stylidi, M.; Kondarides, D.I.; Verykios, X.E. Pathways of solar light-induced photocatalytic degradation of azo dyes in aqueous TiO2 suspensions. Appl. Catal. B 2003, 40, 271–286. [Google Scholar] [CrossRef]
  17. Stylidi, M.; Kondarides, D.I.; Verykios, X.E. Visible light-induced photocatalytic degradation of acid Orange 7 in aqueous TiO2 suspensions. Appl. Catal. B 2004, 47, 189–201. [Google Scholar] [CrossRef]
  18. Zhang, S.-J.; Yu, H.-Q.; Li, Q.-R. Radiolytic degradation of Acid Orange 7: A mechanistic study. Chemosphere 2005, 61, 1003–1011. [Google Scholar] [CrossRef]
  19. Zhao, H.-Z.; Sun, Y.; Xu, L.-N.; Ni, J.-R. Removal of acid Orange 7 in simulated wastewater using a three-dimensional electrode reactor: Removal mechanisms and dye degradation pathway. Chemosphere 2010, 78, 46–51. [Google Scholar] [CrossRef]
  20. Mercyrani, B.; Hernandez-Maya, R.; Solis-Lopez, M.; Th-Th, C.; Velumani, S. Photocatalytic degradation of Orange G using TiO2/Fe3O4 nanocomposites. J. Mater. Sci. Mater. Electron. 2018, 29, 15436–15444. [Google Scholar]
  21. May-Lozano, M.; Mendoza-Escamilla, V.; Garcia, E.R.; Medina, R.L.; Rivadeneyra-Romero, G.; Martinez-Delgadillo, S.A. Sonophotocatalytic degradation of Orange II dye using low cost photocatalyst. J. Clean. Prod. 2017, 148, 836–844. [Google Scholar] [CrossRef]
  22. Bansal, J.; Hafiz, A.K.; Sharma, S.N. Photoreduction of dye with noble metal gold permeated with metal oxide titania. J. Nanosci. Nanotechnol. 2020, 20, 3896–3901. [Google Scholar] [CrossRef] [PubMed]
  23. Li, F.; Li, X. Photocatalytic properties of gold/gold ion-modified titanium dioxide for wastewater treatment. Appl. Catal. A Gen. 2002, 228, 15–27. [Google Scholar] [CrossRef]
  24. Subramanian, V.; Wolf, E.E.; Kamat, P.V. Catalysis with TiO2/gold nanocomposites. effect of metal particle size on the Fermi level equilibration. J. Am. Chem. Soc. 2004, 126, 4943–4950. [Google Scholar] [CrossRef] [PubMed]
  25. Yu, J.; Yue, L.; Liu, S.; Huang, B.; Zhang, X. Hydrothermal preparation and photocatalytic activity of mesoporous Au–TiO2 nanocomposite microspheres. J. Colloid Interface Sci. 2009, 334, 58–64. [Google Scholar] [CrossRef] [PubMed]
  26. Chen, X.; Mao, S.S. Titanium dioxide nanomaterials: Synthesis, properties, modifications, and applications. Chem. Rev. 2007, 107, 2891–2959. [Google Scholar] [CrossRef] [PubMed]
  27. Adekoya, D.O.; Tahir, M.; Amin, N.A.S. G-C3C4/(Cu/TiO2) nanocomposite for enhanced photoreduction of CO2 to CH3OH and HCOOH under uv/visible light. J. CO2 Util. 2017, 18, 261–274. [Google Scholar] [CrossRef]
  28. Dutta, I.; Munns, C.B.; Dutta, G. An X-ray diffraction (xrd) study of vapor deposited gold thin films on aluminum nitride (aln) substrates. Thin Solid Films 1997, 304, 229–238. [Google Scholar] [CrossRef]
  29. Kosyachenko, L.A. Sollar cells thin-film technology. IntechOpen 2011. [Google Scholar] [CrossRef] [Green Version]
  30. Ahmed, S.; Rasul, M.; Martens, W.N.; Brown, R.; Hashib, M. Heterogeneous photocatalytic degradation of phenols in wastewater: A review on current status and developments. Desalination 2010, 261, 3–18. [Google Scholar] [CrossRef] [Green Version]
  31. Lin-Vien, D.; Colthup, N.B.; Fateley, W.G.; Grasselli, J.G. The Handbook of Infrared and Raman Characteristic Frequencies of Organic Molecules; Elsevier: Amsterdam, The Netherlands, 1991. [Google Scholar]
  32. Nasralla, N.; Yeganeh, M.; Astuti, Y.; Piticharoenphun, S.; Shahtahmasebi, N.; Kompany, A.; Karimipour, M.; Mendis, B.; Poolton, N.; Šiller, L. Structural and spectroscopic study of Fe-doped TiO2 nanoparticles prepared by sol–gel method. Sci. Iran. 2013, 20, 1018–1022. [Google Scholar]
  33. Han, X.-G.; He, H.-Z.; Kuang, Q.; Zhou, X.; Zhang, X.-H.; Xu, T.; Xie, Z.-X.; Zheng, L.-S. Controlling morphologies and tuning the related properties of nano/microstructured ZnO crystallites. J. Phys. Chem. C 2008, 113, 584–589. [Google Scholar] [CrossRef]
  34. Valencia, S.; Marin, J.M.; Restrepo, G. Study of the bandgap of synthesized titanium dioxide nanoparticules using the sol-gel method and a hydrothermal treatment. Open Mater. Sci. J. 2009, 4, 9–14. [Google Scholar] [CrossRef]
  35. Zheng, J.; Jiang, Q.; Lian, J. Synthesis and optical properties of flower-like ZnO nanorods by thermal evaporation method. Appl. Surf. Sci. 2011, 257, 5083–5087. [Google Scholar] [CrossRef]
  36. Bauer, C.; Jacques, P.; Kalt, A. Investigation of the interaction between a sulfonated azo dye (AO7) and a TiO2 surface. Chem. Phys. Lett. 1999, 307, 397–406. [Google Scholar] [CrossRef]
  37. Wang, X.; Maeda, N.; Baiker, A. Synergistic effects of Au and FeOx nanocomposites in catalytic NO reduction with CO. ACS Catal. 2016, 6, 7898–7906. [Google Scholar] [CrossRef]
  38. Andanson, J.M.; Baiker, A. Exploring catalytic solid/liquid interfaces by in situ attenuated total reflection infrared spectroscopy. Chem. Soc. Rev. 2010, 39, 4571–4584. [Google Scholar] [CrossRef] [Green Version]
  39. Buergi, T.; Baiker, A. Attenuated total reflection infrared spectroscopy of solid catalysts functioning in the presence of liquid-phase reactants. In Advances in Catalysis; Gates, B.C., Knozinger, H., Eds.; Elsevier: Amsterdam, The Netherlands, 2006; Volume 50, pp. 227–283. [Google Scholar]
  40. Meemken, F.; Müller, P.; Hungerbühler, K.; Baiker, A. Simultaneous probing of bulk liquid phase and catalytic gas-liquid-solid interface under working conditions using attenuated total reflection infrared spectroscopy. Rev. Sci. Instrum. 2014, 85, 084101. [Google Scholar] [CrossRef]
  41. Baurecht, D.; Fringeli, U.P. Quantitative modulated excitation Fourier transform infrared spectroscopy. Rev. Sci. Instrum. 2001, 72, 3782–3792. [Google Scholar] [CrossRef] [Green Version]
  42. Bürgi, T.; Baiker, A. In situ infrared spectroscopy of catalytic solid−liquid interfaces using phase-sensitive detection: Enantioselective hydrogenation of a pyrone over Pd/TiO2. J. Phys. Chem. B 2002, 106, 10649–10658. [Google Scholar] [CrossRef]
  43. Urakawa, A.; Bürgi, T.; Baiker, A. Sensitivity enhancement and dynamic behavior analysis by modulation excitation spectroscopy: Principle and application in heterogeneous catalysis. Chem. Eng. Sci. 2008, 63, 4902–4909. [Google Scholar] [CrossRef]
  44. Müller, P.; Hermans, L. Applications of modulation excitation spectroscopy in heterogeneous catalysis. Ind. Eng. Chem. Res. 2017, 56, 1123–1136. [Google Scholar] [CrossRef]
Figure 1. (a) XRD patterns, and (b) enlarged section of XRD patterns of Au/TiO2 and Au-FeOx/TiO2 catalysts with different molar ratios of Au:Fe.
Catalysts 10 00933 g001
Figure 2. HR-TEM images of (a) Au/TiO2 and Au-FeOx/TiO2 samples with increasing Fe content; (b) Au:Fe = 1:0.5; (c) Au:Fe = 1:1; and (d) Au:Fe = 1:2.
Catalysts 10 00933 g002
Figure 3. Absorbance spectra for the indirect electronic transition vs. E (eV) of (a) Au/TiO2, (b) Au-Fe(1:0.5)/TiO2, (c) Au-Fe(1:1)/TiO2 and (d) Au-Fe(1:2)/TiO2.
Catalysts 10 00933 g003
Scheme 1. The tautomeric forms of Orange II.
Catalysts 10 00933 sch001
Figure 4. UV-Vis monitoring of photocatalytic degradation of 0.02 mM Orange II as a function of irradiation time on (a) Au/TiO2, (b) Au-Fe(1:0.5)/TiO2, (c) Au-Fe(1:1)/TiO2, and (d) Au-Fe(1:2)/TiO2. (e) Degradation vs. time; (f) ln(Ct/C0) vs. time.
Catalysts 10 00933 g004
Figure 5. XPS spectra of (a) Au4f, (b) Fe2p, (c) O1s of Au/TiO2 and Au-FeOx/TiO2 photocatalysts.
Catalysts 10 00933 g005
Figure 6. Relative concentrations of lattice oxygen species (OL), oxygen vacancies or defects (OV), and chemisorbed or dissociated oxygen species (OC) on the catalyst surface together with the degree of degradation achieved after 30 min under UV radiation. Degradation % = 100% (A0 − A30)/A0, where A0 and A30 are the absorptions at times 0 and 30 min, respectively (cf. Figure 4).
Catalysts 10 00933 g006
Figure 7. MES-ATR-IR spectra during Orange II concentration modulation over (a,e,i) Au-Fe(1:2)/TiO2, (b,f,j) Au-Fe(1:1)/TiO2, (c,g,k) Au-Fe(1:0.5)/TiO2, and (d,h,I) Au/TiO2.
Catalysts 10 00933 g007
Figure 8. MES-ATR-IR spectra of (a,e) Au-Fe(1:2)/TiO2, (b,f) Au-Fe(1:1)/TiO2, (c,g) Au-Fe(1:0.5)/TiO2 and (d,h) Au/TiO2, obtained during Orange II + O2 + UV ↔ Orange II + He + UV modulation.
Catalysts 10 00933 g008
Table 1. Textural properties and bandgap of Au/TiO2 and Au-FeOx/TiO2 catalysts.
CatalystsAu particle Size (nm)Surface Area (m2/g)Bandgap (eV)
Au/TiO23.9503.12
Au-Fe(1:0.5)/TiO24.3512.79
Au-Fe(1:1)/TiO24.4572.40
Au-Fe(1:2)/TiO25.1582.23
Table 2. XPS analyses of Au, Fe, and O on the Au-FeOx/TiO2 catalyst surfaces. The values in parentheses are the concentrations of the corresponding species. Binding energies are given in eV.
CatalystFe2+2p3/2Fe3+2p3/2OLOVOC
Au-Fe(1:0.5)/TiO2709.8 (35%)713.9 (65%)529.3 (64%)530.6 (33%)531.2 (3%)
Au-Fe(1:1)/TiO2709.5 (44%)713.5 (56%)529.1 (52%)529.9 (26%)531.2 (22%)
Au-Fe(1:2)/TiO2709.8 (50%)713.5 (50%)529.2 (45%)530.0 (25%)531.3 (30%)

