Article

Photocatalytic Activity of Aeroxide TiO2 Sensitized by Natural Dye Extracted from Mangosteen Peel

Chemical and Biochemical Engineering Department, Western University, London, ON N6G 5L8, Canada
*
Author to whom correspondence should be addressed.
Catalysts 2020, 10(8), 917; https://doi.org/10.3390/catal10080917
Submission received: 13 July 2020 / Revised: 6 August 2020 / Accepted: 7 August 2020 / Published: 10 August 2020
(This article belongs to the Special Issue State-of-the-Art Photocatalytical Technology in North America)

Abstract

:
Natural dye sensitizers are environment-friendly and inexpensive substances that could be used for photocatalytic decontamination of organic pollutants. In this study, a natural dye extracted from mangosteen peel, containing a significant amount of anthocyanin dye, has been successfully employed to sensitize aeroxide TiO2 to lower its bandgap, thereby making the process visible sunlight-driven. We have demonstrated the photocatalytic activity of mangosteen dye-sensitized-TiO2 (MS-TiO2) under visible solar light by studying the degradation of methylene blue (MB), a well-studied model compound. A multivariate parametric study was performed using factorial design methodology with three factors—pH, MS-TiO2 dosage, and visible light intensity. The study indicated that pH and MS-TiO2 dosage are the two most dominant factors for MB degradation under visible solar light. The kinetic rate constant and adsorption equilibrium constant were determined, and a Langmuir-Hinshelwood-type equation was proposed to describe MB degradation on MS-TiO2 under visible solar light. Apparent quantum yield was also reported for the MS-TiO2 photocatalyst at optimum experimental conditions.

1. Introduction

In an era where freshwater scarcity is turning into an environmental systemic risk, degradation and complete mineralization of organic contaminants are of immense significance. In the past few decades, photocatalysis using TiO2 as a photocatalyst has been extensively studied for achieving this purpose due to its effectiveness in addressing a vast range of organics. High stability, corrosion resistance, non-toxicity, excellent optical transparency, and low cost of TiO2 makes it one of the most widely used photocatalysts for water decontamination [1]. To date, it has been vastly studied for the removal of toxic organic pollutants [2,3,4], metal ion reduction [5], and degradation of emerging pollutants [1]. However, the wide bandgap of TiO2 (~3.2 eV) makes the photocatalysis processes UV light-driven only [6,7,8]. As a result, only a small portion of the entire solar spectrum can be utilized for this purpose, thereby limiting the process of expensive UV irradiation. This necessitates the modification of conventional TiO2 photocatalyst to lower its bandgap to visible light wavelengths.
Lowering bandgaps of photocatalysts by sensitizing it with a dye molecule is a technology that has been widely investigated for dye-sensitized solar cells (DSSC) for the past few years [7,9,10,11]. The same technology has also been applied for photocatalytic hydrogen generation using dye-sensitized TiO2/Pt photocatalyst [12,13,14]. Hence, this provides an opportunity to use this dye sensitization technology for photocatalytic water decontamination processes as well [7,15,16]. In this sensitization process, the dye molecule gets excited by absorbing visible solar light, and an electron is transferred from its highest occupied molecular orbital (HOMO) to the lowest unoccupied molecular orbital (LUMO) [7]. This excited electron finally gets transferred to the conduction band of the semiconductor photocatalyst molecule, resulting in the formation of a highly reactive superoxide anion (O2) and/or hydroxyl radical (OH) [16]. In this approach, the entire photocatalytic process becomes visible sunlight-driven, which is the most abundant natural source of energy. For the successful sensitization of the semiconductor molecule, its conduction band should be more positive than the LUMO of the dye used. A successful electron injection can only be possible with an appropriate surface anchoring group, energy levels, and ground state redox potential of the dye molecule [16]. Studies show that transition metal dyes with anchoring groups like carboxylates and phosphates exhibit an effective electron transfer process [16]. Additionally, due to the formation of d6 complex, transition metal sensitizers like Ru(II), Fe(II), and Os(II) show strong absorption in the entire visible spectra [16]. Therefore, to date, the majority of dye sensitization processes have been explored using different dyes such as ruthenium dyes, rhodamine B, eosin, erythrosine, and cyanine dyes [16,17,18,19]. Most of these heavy metals and synthetic organic dyes are expensive and hazardous and are unpromising alternatives for water decontamination purposes [7]. These limitations fuel increased research on natural dyes to ensure the effective replacement of organic synthetic and heavy metal dyes.
Although natural dye sensitization has been extensively studied for solar cell applications, its use in water treatment is still in a nascent stage [20]. Artificial sensitizers pose several threats to the sustainability of the process due to the toxicity and expensiveness of the rare elements present. On the contrary, the natural sensitizers are abundantly found, easy to prepare in feasible laboratory conditions, and are environmentally friendly and inexpensive substances. Natural sensitizers are generally selected based on their anthocyanin, chlorophyll, and carotenoid contents, which are responsible for the characteristic color of the material, along with the carboxyl and hydroxyl group present [21].
Anthocyanin, a flavonoid family pigment, is one of the most commonly found pigments in several flowers, fruits, vegetables, and roots. Anthocyanins generally contain hydroxyl, methoxyl, or carboxyl groups along with its core flavylium cation structure (2-phenyl-1-benzopyrylium). Natural anthocyanins usually have one or more sugar components like β-d-Glucose, β-d-Galactose, and α-l-Rhamnose [22,23,24,25]. In this study, the dye used was extracted from mangosteen peel, which contains a significant amount of anthocyanin pigment. The peel used is a food waste that was utilized as a potential raw material for the production of the natural dye. Mangosteen (Garcinia mangostana Linn.), a Guttiferae family fruit, can be abundantly found in tropical areas. Phenolic acid, prenylated xanthone derivatives, anthocyanins, and procyanidins are a few of the major bioactive compounds found in mangosteen [26,27,28,29,30]. The primary anthocyanin compound found in mangosteen is cyanidin-3-sophoroside [26]. The LUMO level of the sensitizer is required to be higher than the conduction band of the semiconductor (i.e., for TiO2, −4 to −4.3 eV). Moreover, the HOMO level of the sensitizer needed to be lower than the redox potential of the semiconductor (in the case of TiO2, the redox potential range −4.6 to −5 eV). Mangosteen dye itself has E(LUMO) and E(HOMO) at −2.27 eV and −4.81 eV, respectively, that fulfill both criteria for efficient electron transfer to TiO2 conduction band under visible solar light [17,21].
In this study, aeroxide TiO2 was sensitized using a natural dye extracted from mangosteen (MS) peels, i.e., natural dye-sensitized aeroxide TiO2 (MS-TiO2). The photocatalytic activity of MS-TiO2 was studied by the degradation of methylene blue (MB), a widely used organic dye for dyeing leathers, fibers, and cotton [31], under visible solar light irradiation. According to our knowledge, no study has yet been performed with a mangosteen peel-based natural dye-sensitized aeroxide TiO2 system under visible solar light.
The main objectives of this investigation were:
  • To extract natural dye from mangosteen peels and prepare a novel TiO2-based natural dye-sensitized photocatalyst.
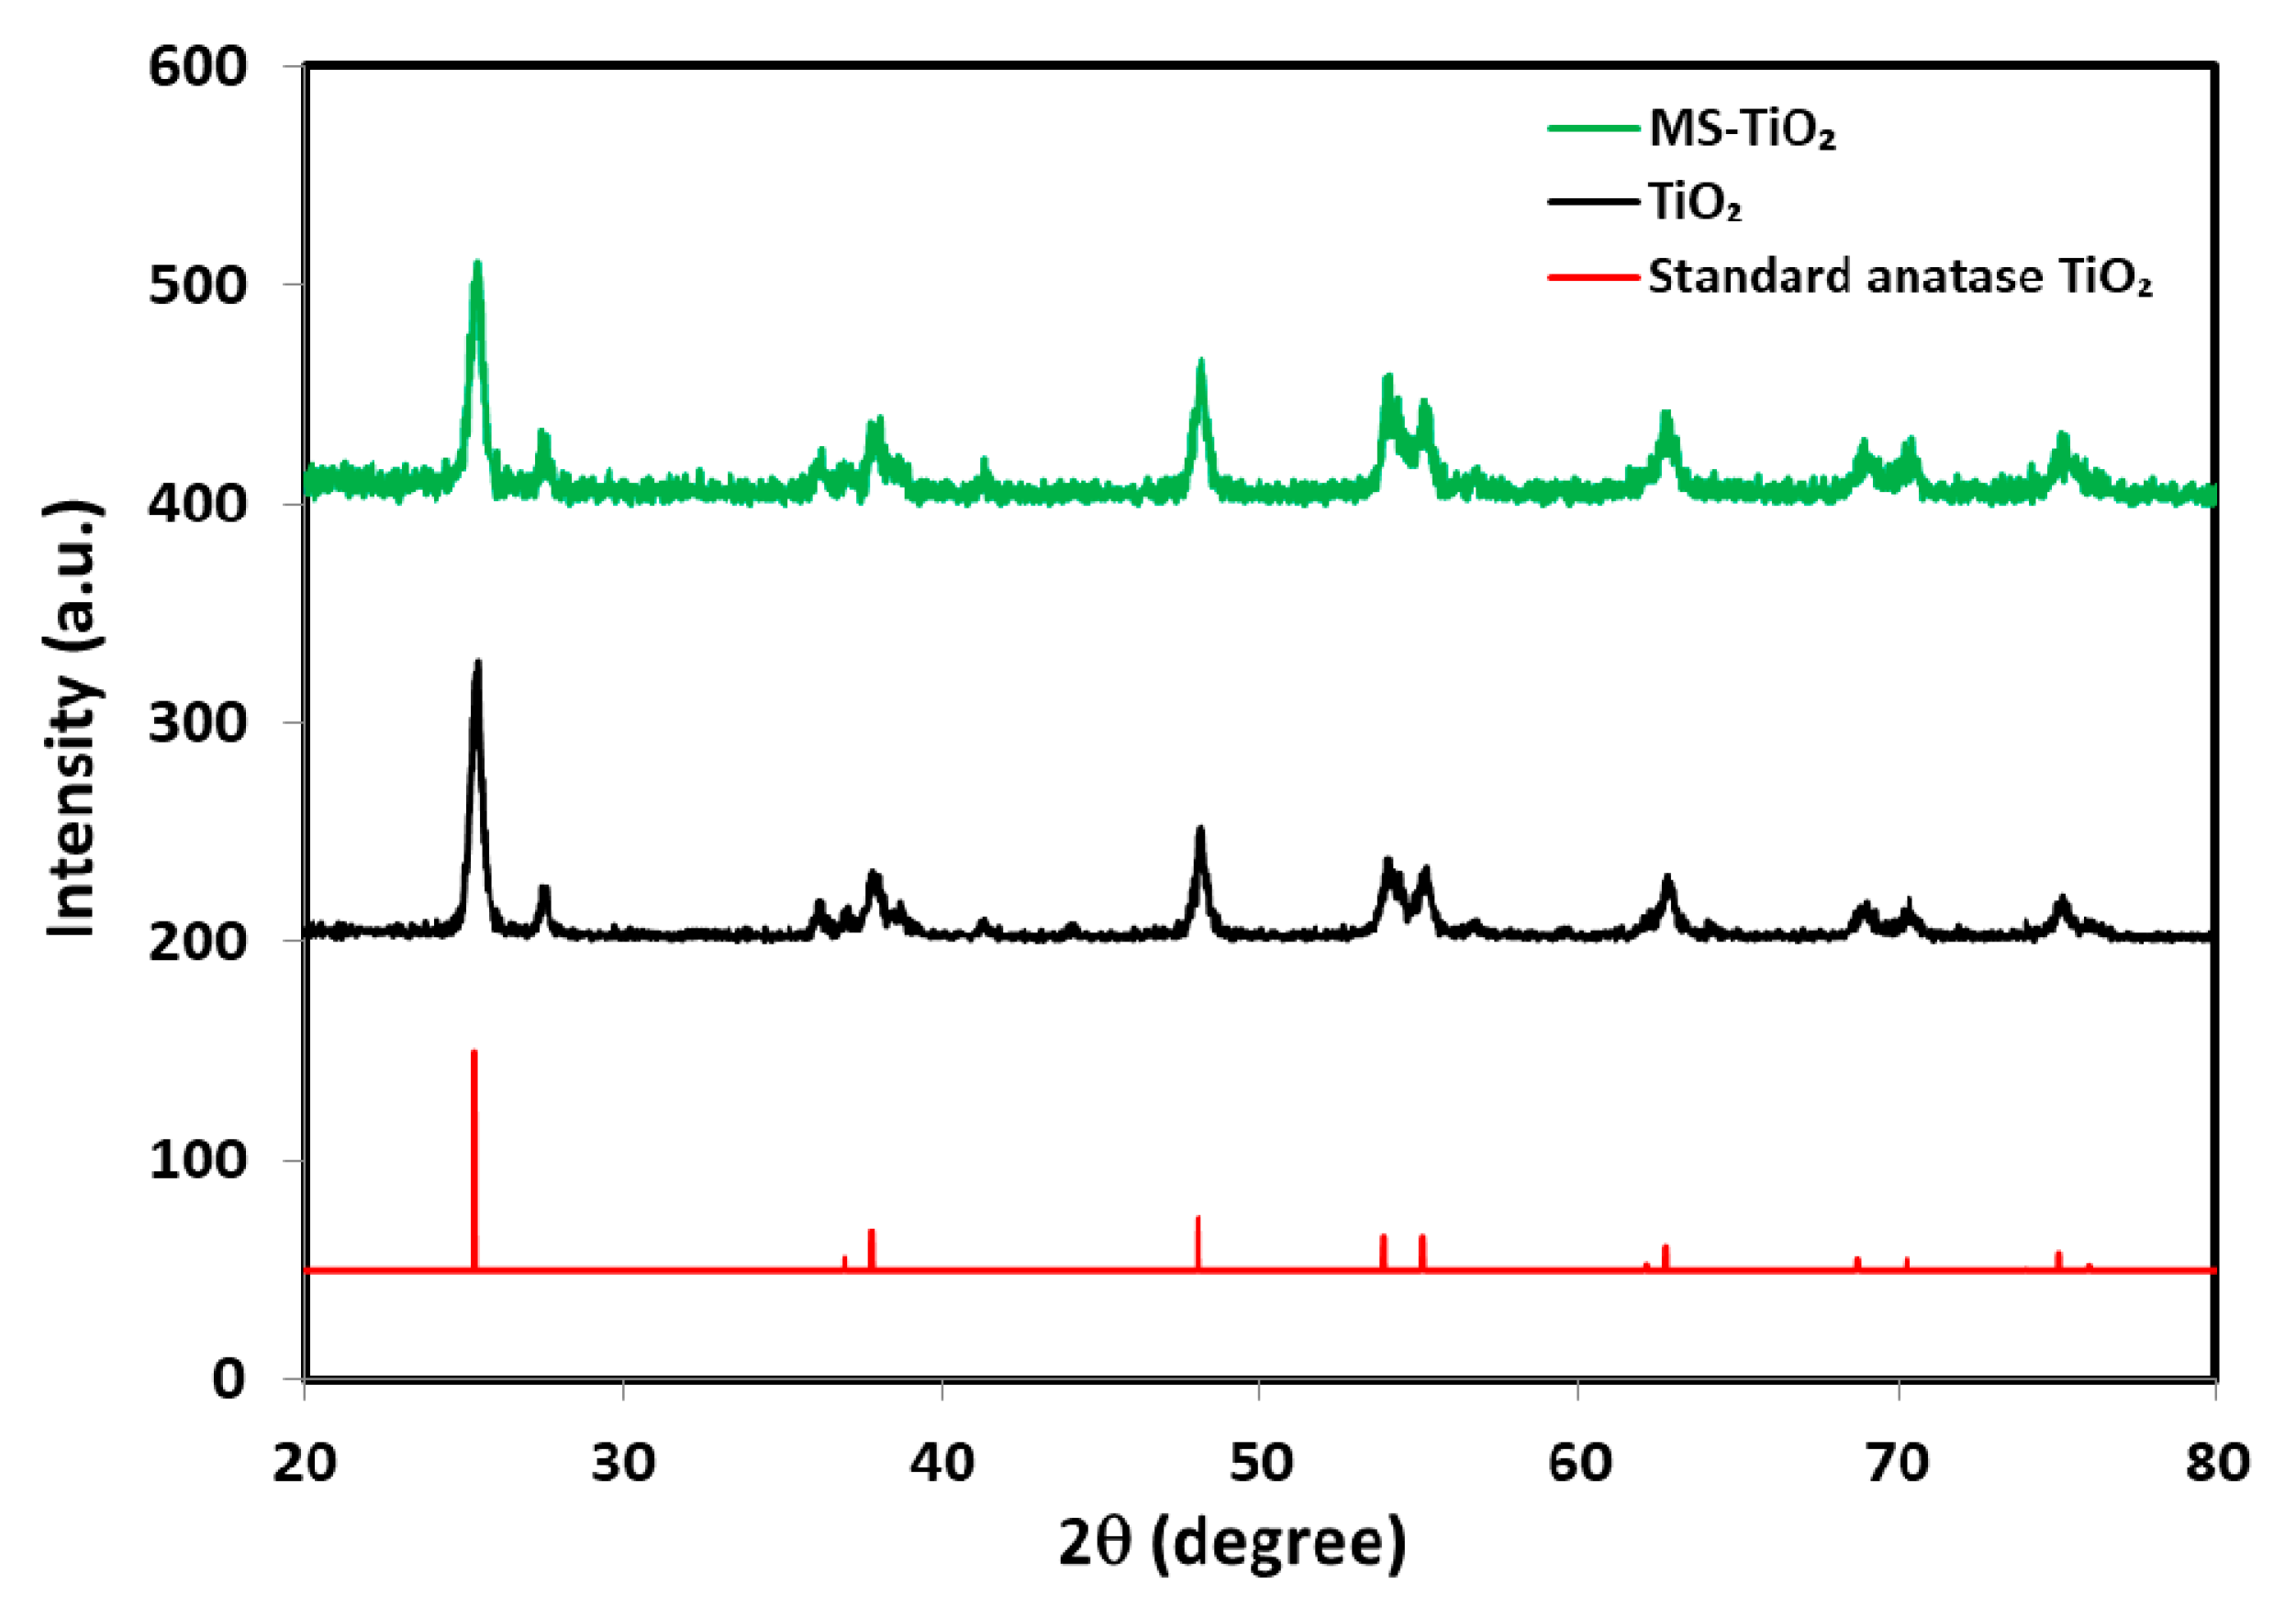
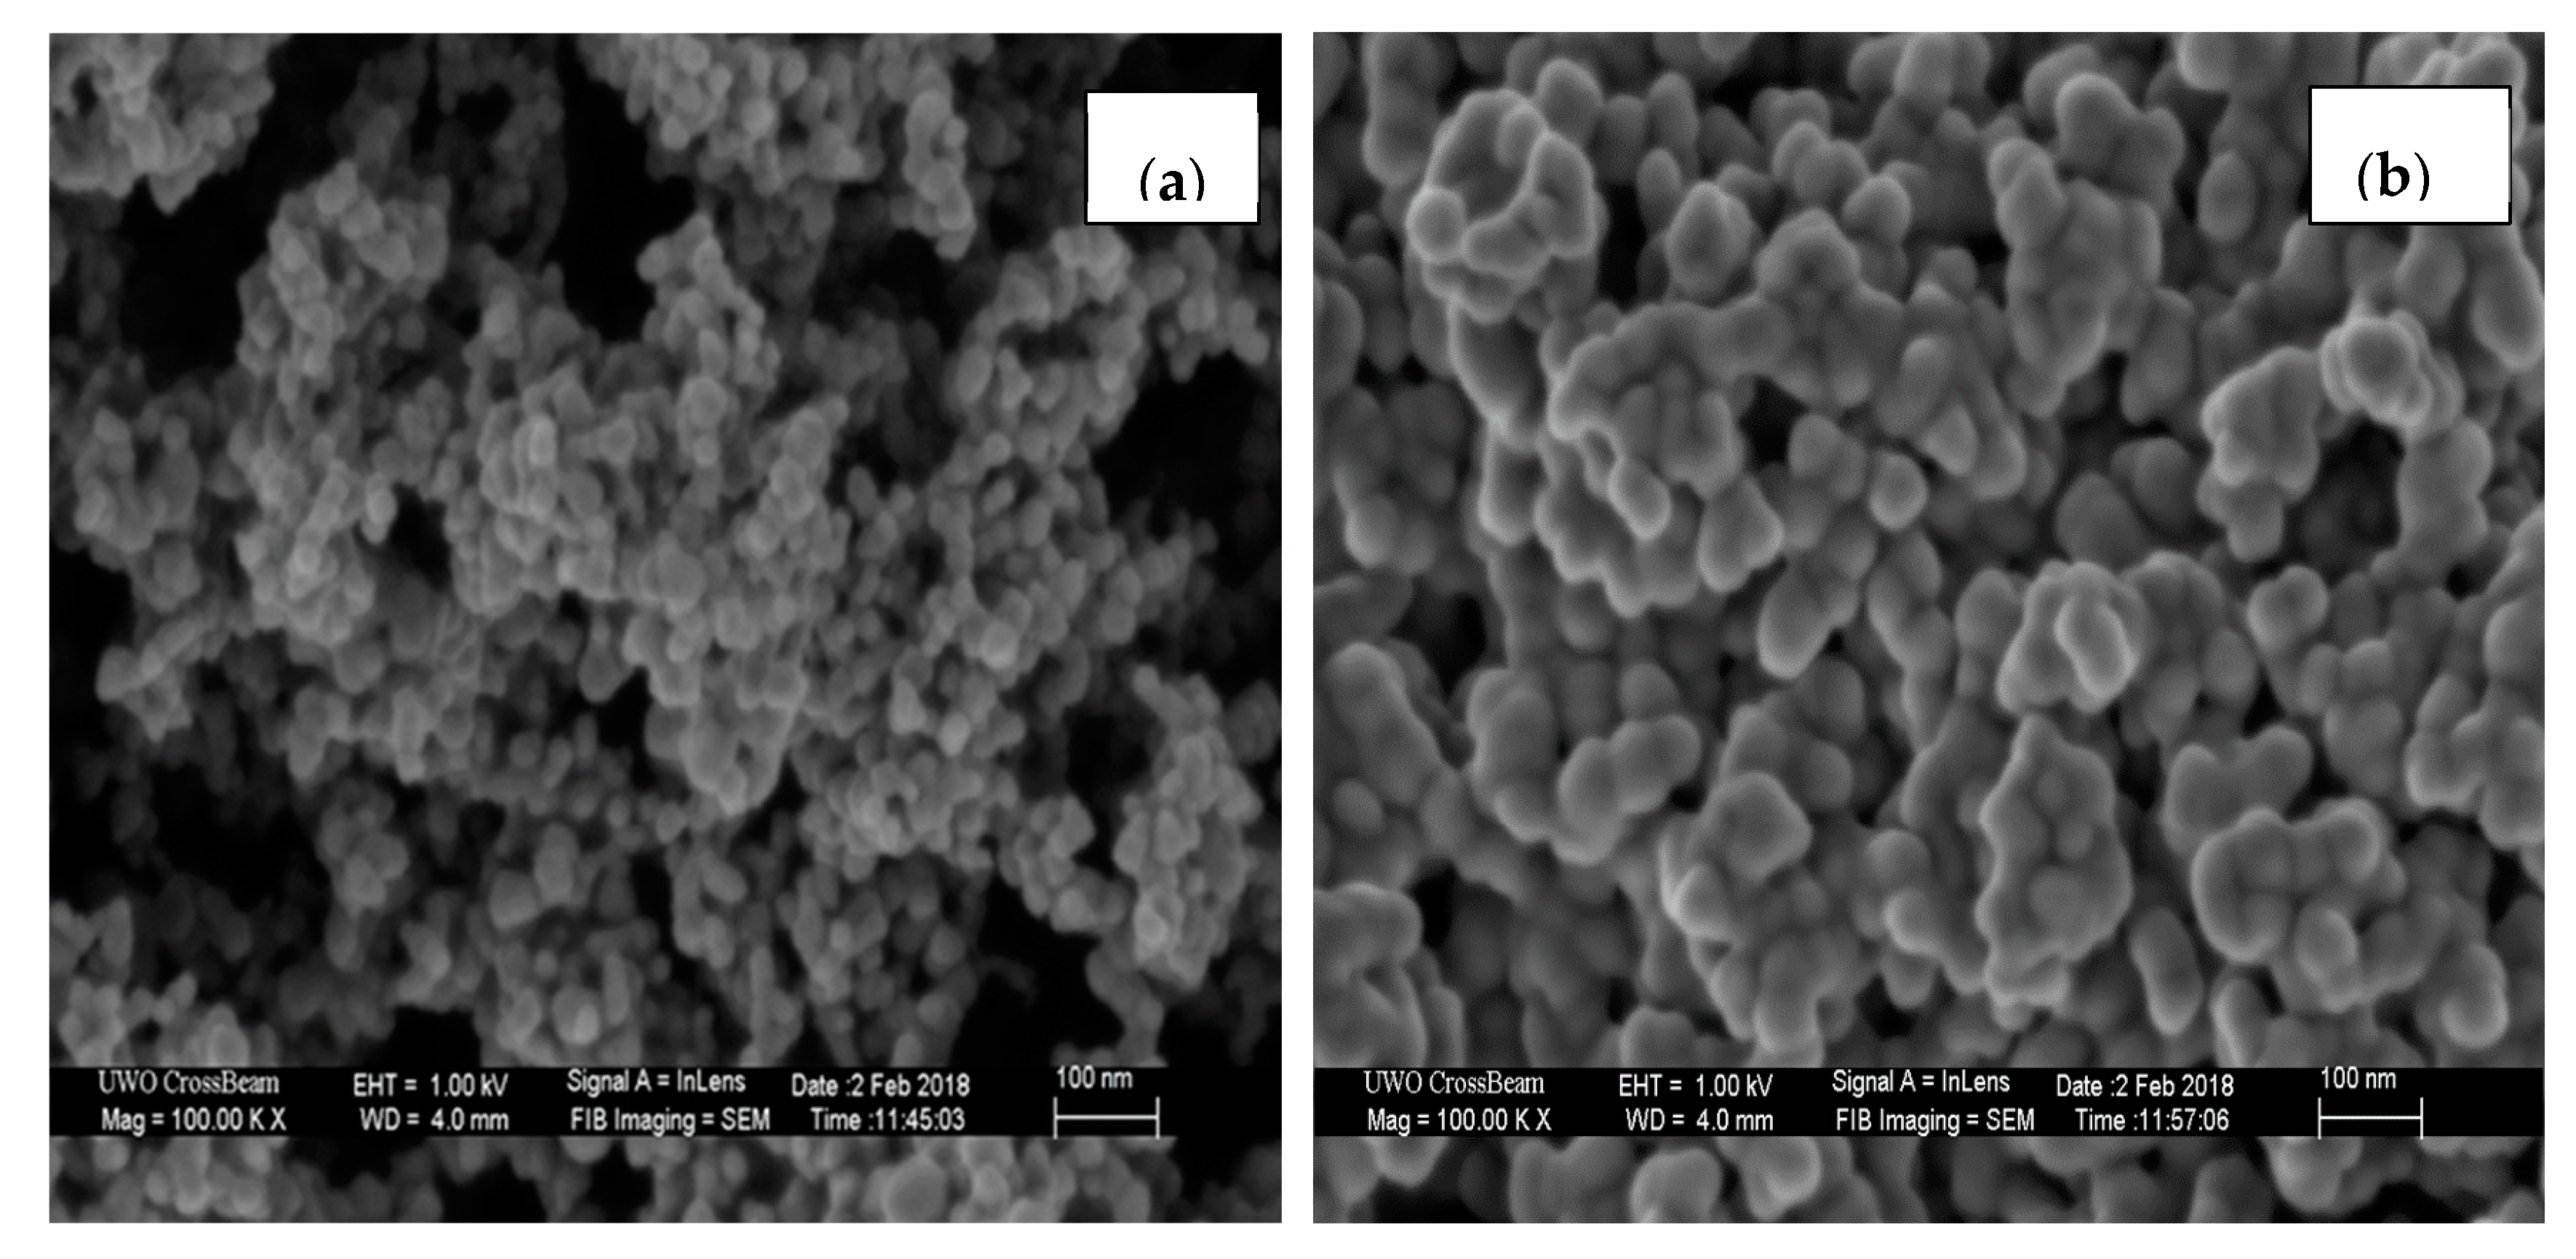
  • To carry out a full characterization of the prepared new photocatalyst (MS-TiO2) using X-ray powder diffraction (XRD), scanning electron microscopy (SEM), energy-dispersive X-ray spectroscopy (EDX), and ultraviolet-visible (UV-Vis) spectroscopy.
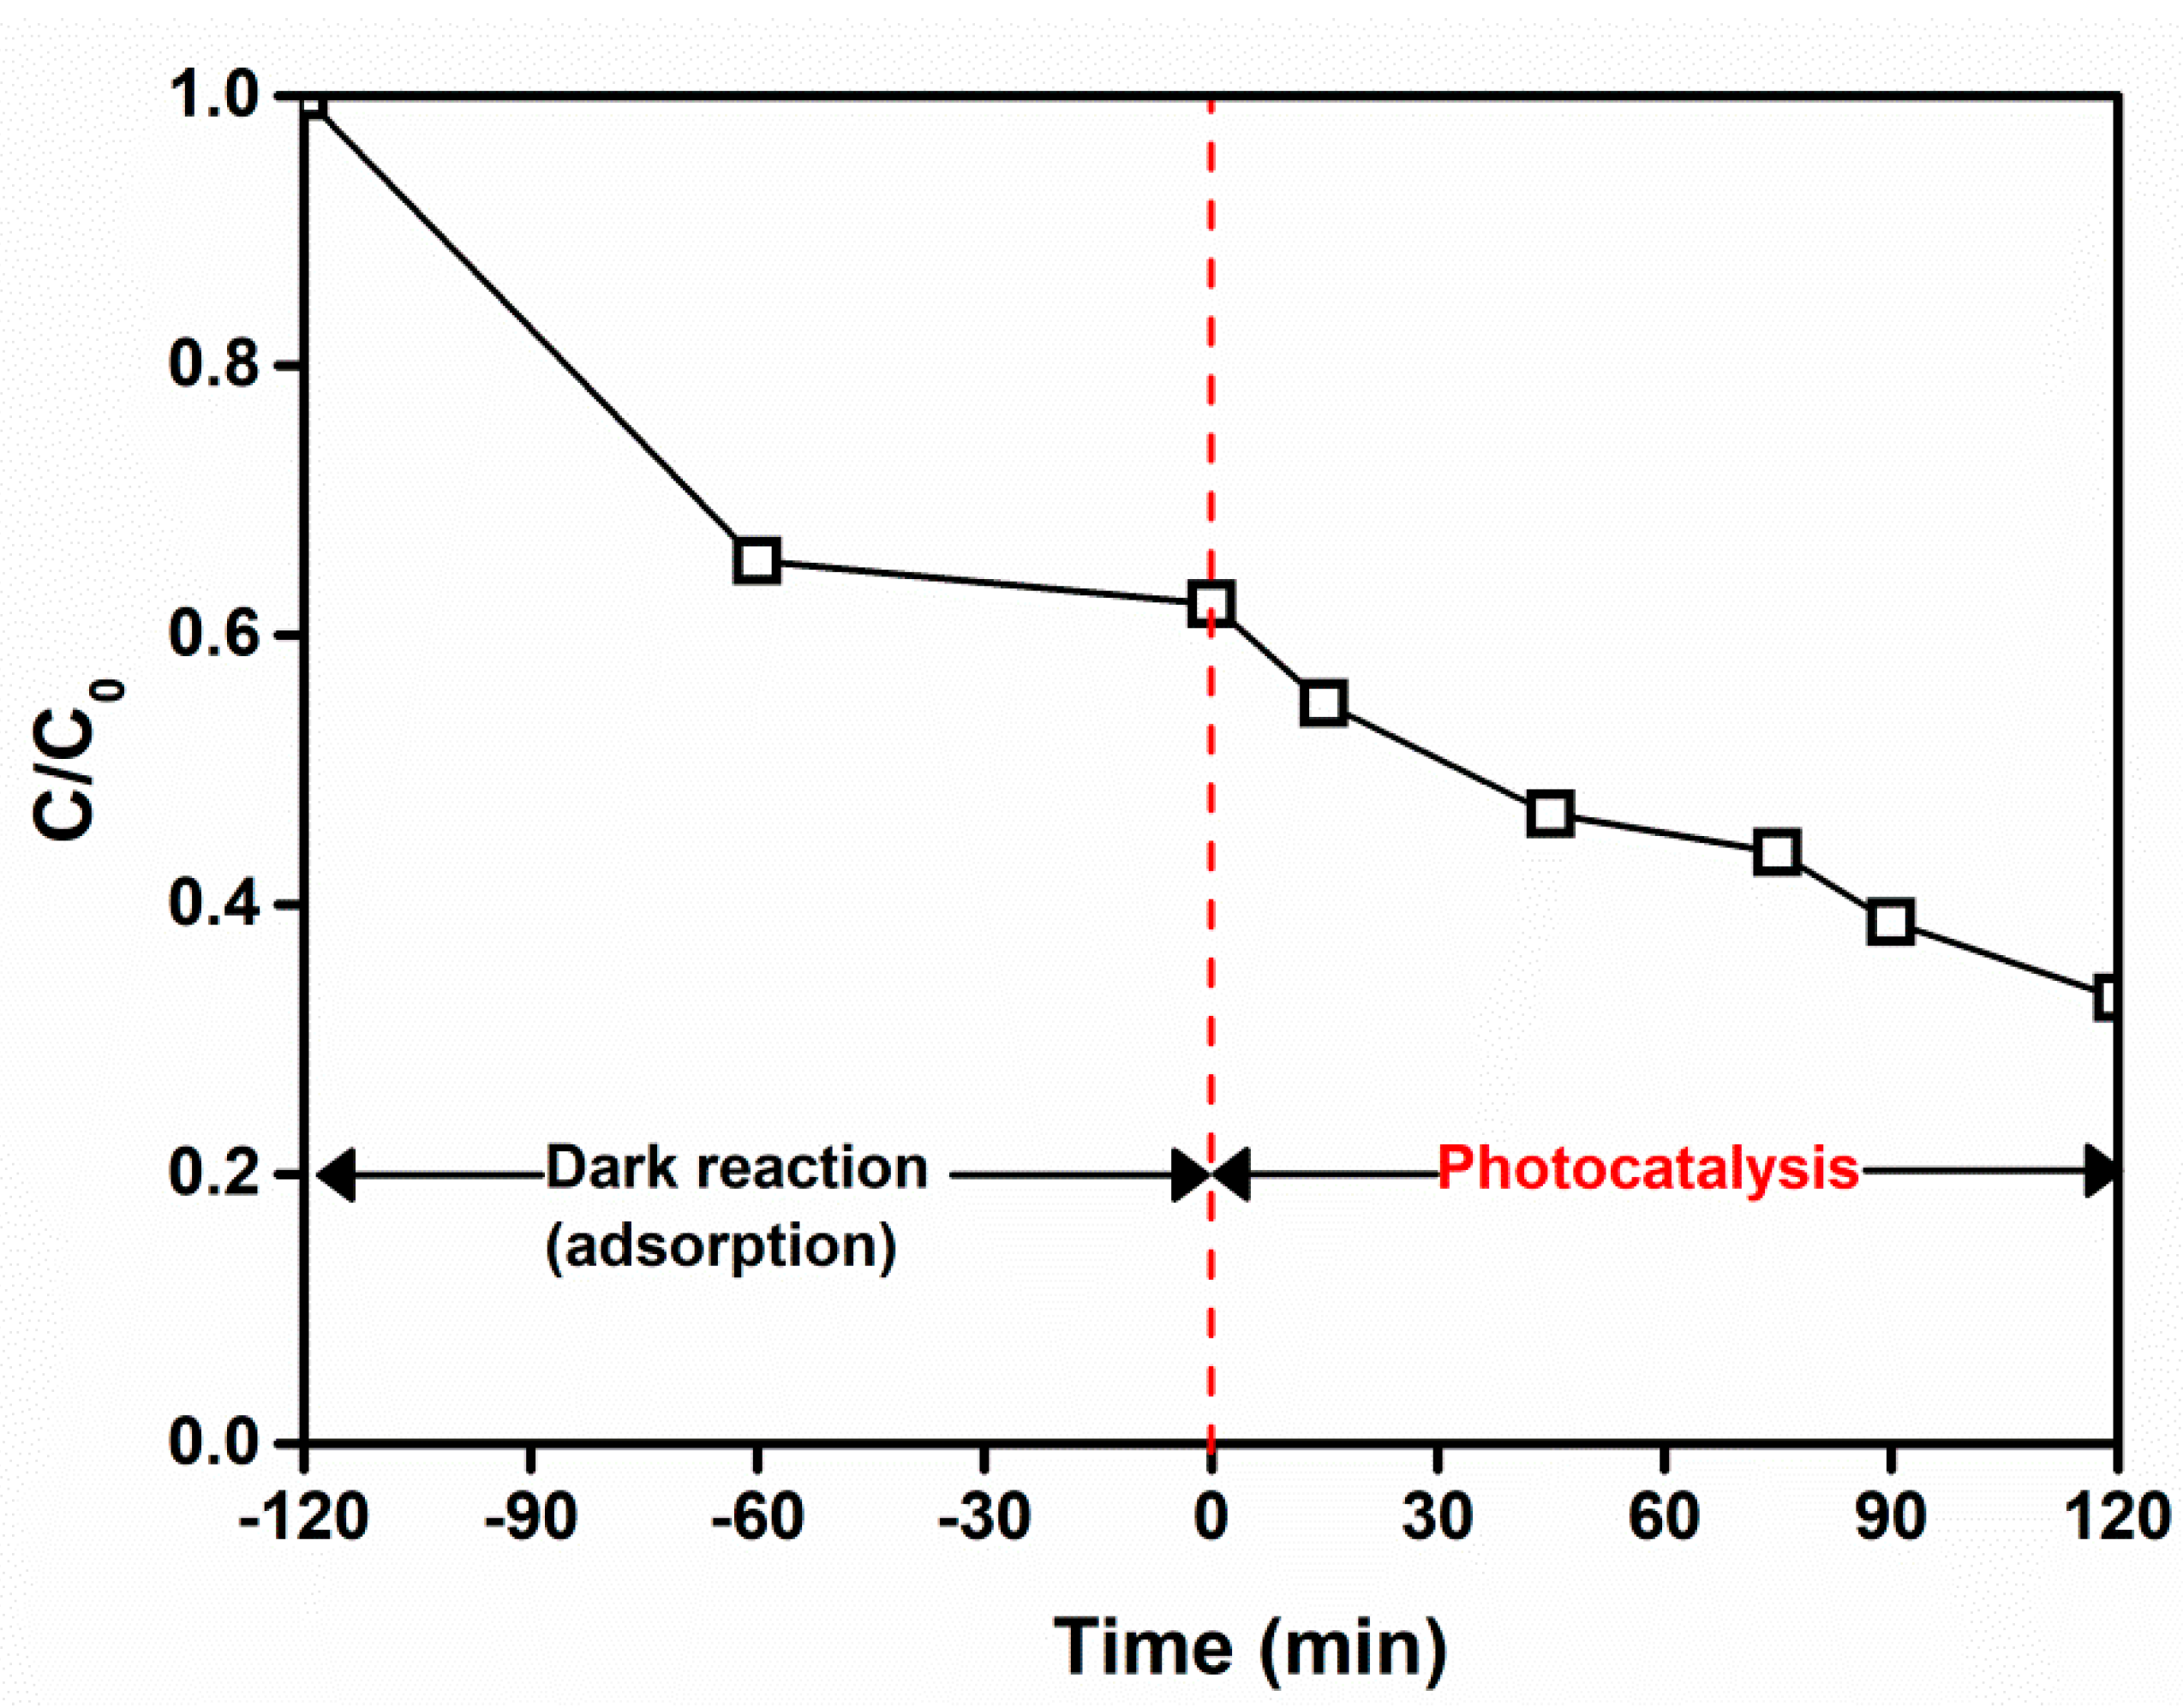
  • Demonstrate the photocatalytic activity of MS-TiO2 under visible solar light by studying the degradation of methylene blue (MB), a well-studied model compound.
  • Investigate the photocatalytic activity of MS-TiO2 under varying experimental conditions such as solution pH, visible solar light intensity, and photocatalyst dosage—a statistical approach was adopted to understand the complete and combined effect of three independent variables on the photocatalyst efficiency.
  • Apparent quantum yield was calculated for MS-TiO2 and compared the photocatalysis efficiency with literature values.

2. Results and Discussion

2.1. Anthocyanin Content in Mangosteen Peel

Anthocyanin dye undertakes reversible structural transformations with a change in pH demonstrated by significantly different absorbance spectra. The colored oxonium form dominates at pH 1.0 and the colorless hemiketal form at pH 4.5. The pH differential method is based on this reaction and permits accurate and rapid measurement of the total anthocyanins, even in the presence of polymerized degraded pigments and other interfering compounds [32]. In our case, we determined approximately 28 mg anthocyanin content per 100 g of dry mangosteen peel (mg cyanidin-3-glucoside/100 g). Anthocyanin content in our extracted mangosteen peel-based dye was very similar to literature values [33,34].

2.2. Characterization of the MS-TiO2 Photocatalyst

A detailed characterization study of MS-TiO2 was performed using XRD, SEM, EDX, and UV-Vis spectroscopy. From X-ray diffraction (XRD) studies of aeroxide TiO2 and MS-TiO2 (Figure 1), it was evident that there was no extra peak observed for MS-TiO2. Only the peak areas intensified for MS-TiO2, as compared to that of aeroxide TiO2, essentially signifying a change in surface structure in MS-TiO2 compared to the latter. For further understanding of the morphology of MS-TiO2, scanning electron microscopy (SEM) studies were performed on both aeroxide TiO2 and MS-TiO2 at different levels of magnification. The following figure (Figure 2a,b) shows the SEM picture of aeroxide TiO2 and MS-TiO2, respectively, at a magnification of 10,000 X. From these two figures, the morphological change in MS-TiO2 is clearly observed and is more prominent than that of aeroxide TiO2. The surface for MS-TiO2 became more compact with reduced pores than that of aeroxide TiO2. This change in the surface morphology of MS-TiO2 compared to that of aeroxideTiO2 signifies the adsorption of the dye on aeroxide TiO2 surface, changing its surface properties.
The energy-dispersive X-ray spectroscopy (EDX) study gives further information on the composition of both the catalysts. The result obtained from EDX is shown in the following table (Table 1 and S1). From this study, it is evident that the carbon weight % increased significantly more in MS-TiO2 than in aeroxide TiO2, which indicates the adsorption of the mangosteen dye onto the TiO2 surface.
Finally, the bandgap of MS-TiO2 was measured using a UV-Vis spectrophotometer. As mentioned earlier, the large bandgap of anatase TiO2 (~3.2 eV) makes the photocatalytic process UV light-driven, where anatase TiO2 is being used as a photocatalyst [6,7,8]. However, for MS-TiO2, the bandgap was calculated to be ~2.95 eV (Supporting Information S2). The bandgap was calculated from the absorption wavelength determined by the UV-Vis spectrophotometer. Hence, it is evident that the lowering of bandgap was achieved by the mangosteen dye-sensitizing TiO2 molecule with the natural dye (anthocyanin dye), which drives the photocatalytic process toward visible sunlight.

2.3. Evaluation of the Photocatalytic Activity of MS-TiO2 under Visible Solar Light

Aeroxide TiO2 did not show any photocatalytic activity for MB degradation under visible solar light. This is because of TiO2′s bandgap of 3.2 eV, which did not allow for electron–hole pair formation under low-energy visible light, whereas MS-TiO2 could harvest visible solar light as evident from the MB degradation (Figure 3). The main reason behind such photocatalytic reactions with visible photons can be explained with a dye sensitization mechanism. Dye-sensitized photodegradation of MB under only visible light was initiated through excitation of the dye molecule from its ground state to the excited state, which finally facilitated electron transfer to the conduction band of the semiconductor (TiO2). The oxidized dye molecule (dye) could interact with the pollutant (MB), or water to return to its ground state.

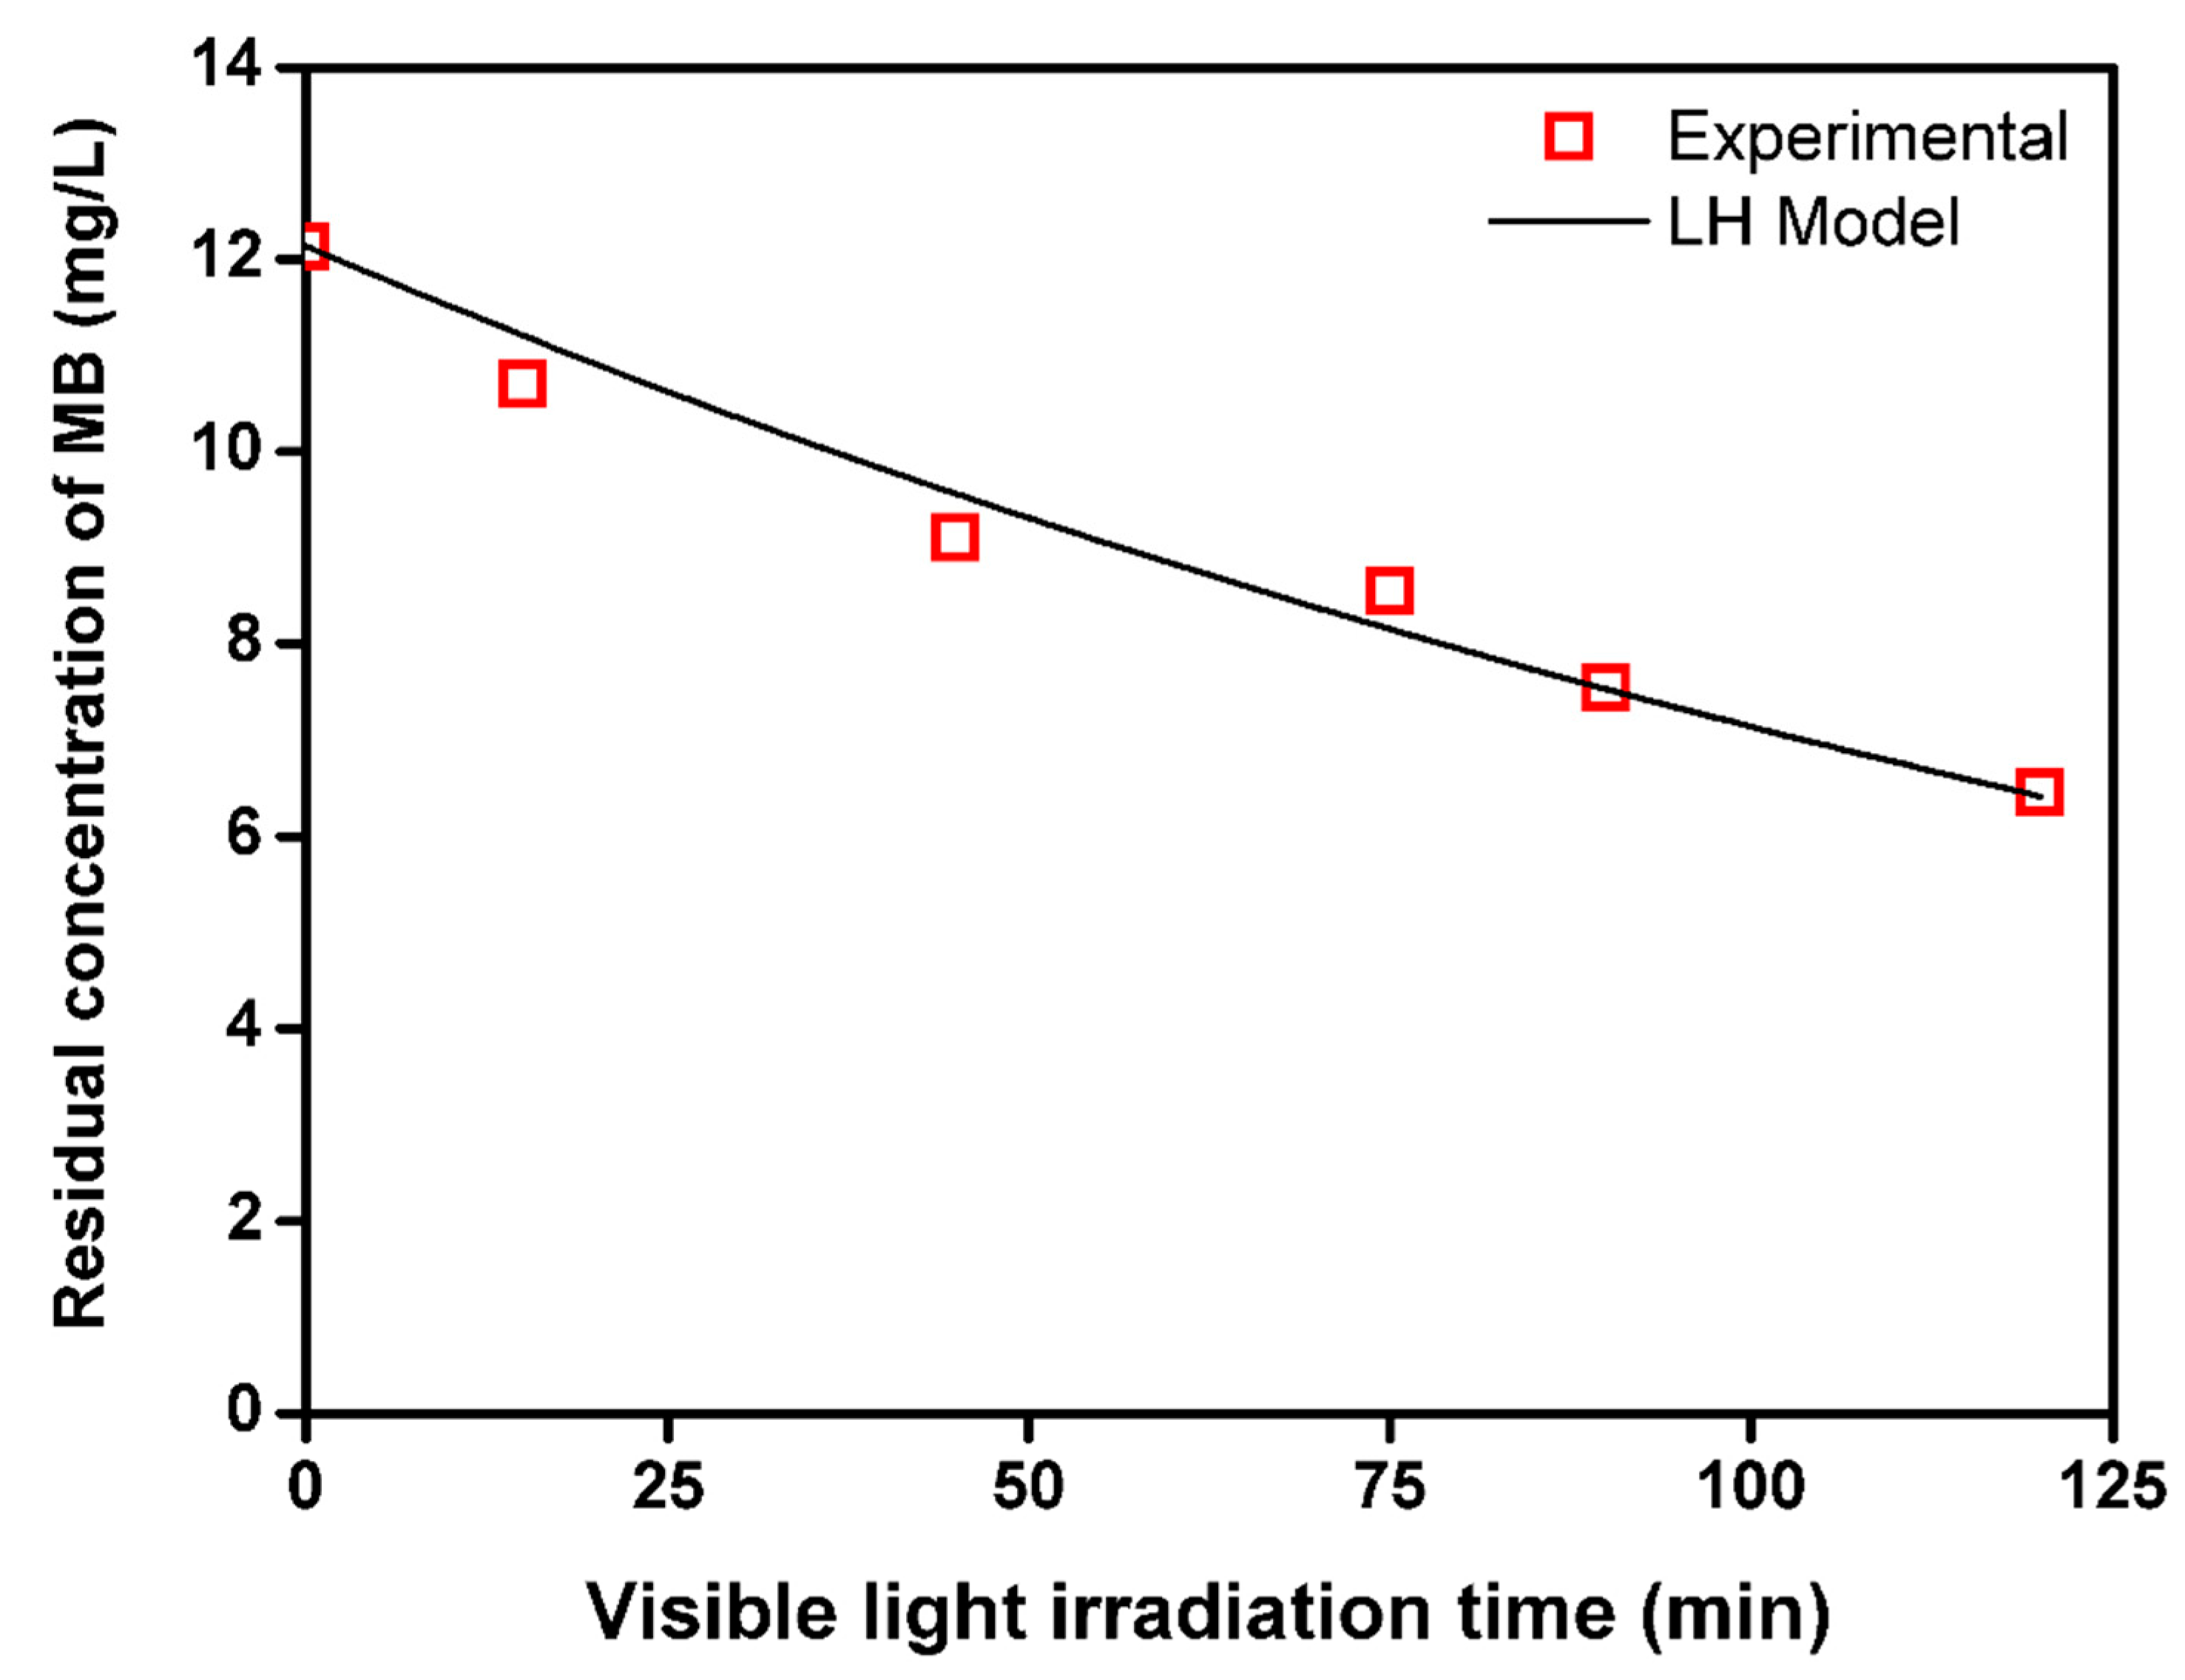
2.4. Methylene Blue Photodegradation Kinetics and Apparent Quantum Yield

The photocatalytic degradation kinetics of numerous organic substrates have been studied in terms of Langmuir−Hinshelwood (L−H) rate equations [4,35]. Mostly in the literature, the L−H equation has been applied to describe the initial rate of degradation at time zero as a function of the initial substrate concentration. Chowdhury et al. incorporated an irradiation term in the L−H equation for their eosin Y-sensitized phenol degradation study, which made it very useful for the design, scale-up, and optimization of photocatalytic reactors [35]. We followed a similar approach for the MS-sensitized photodegradation of methylene blue, which suggests a kinetic rate equation in the form of a modified L−H rate equation, given by the expression:
MB   phtocatalysis   rate =   I β   K app × C MB ( 1 + K A × C MB 0 )
where Kapp is the apparent rate constant, KA is the adsorption equilibrium constant, I is the light intensity, β is a constant, and CMB is the methylene blue concentration. The superscript 0 indicates the initial concentration. The modified L−H model fitted very well with the experimental data, as reported in Figure 4. Kinetics constants are reported in Table 2.
We also calculated the apparent quantum yield (ϕapp) to express the efficiency of the MS-sensitized photocatalytic degradation processes. The photocatalytic degradation of MB could be expressed as follows:
φ overall > φ app = ( number   of   MB   molecules   converted ) ( number   of   incident   photons )
So, at an average light intensity (60 mW/cm2), if only 420–650 nm range of wavelengths were considered, apparent quantum yields of 0.03% can be achieved.

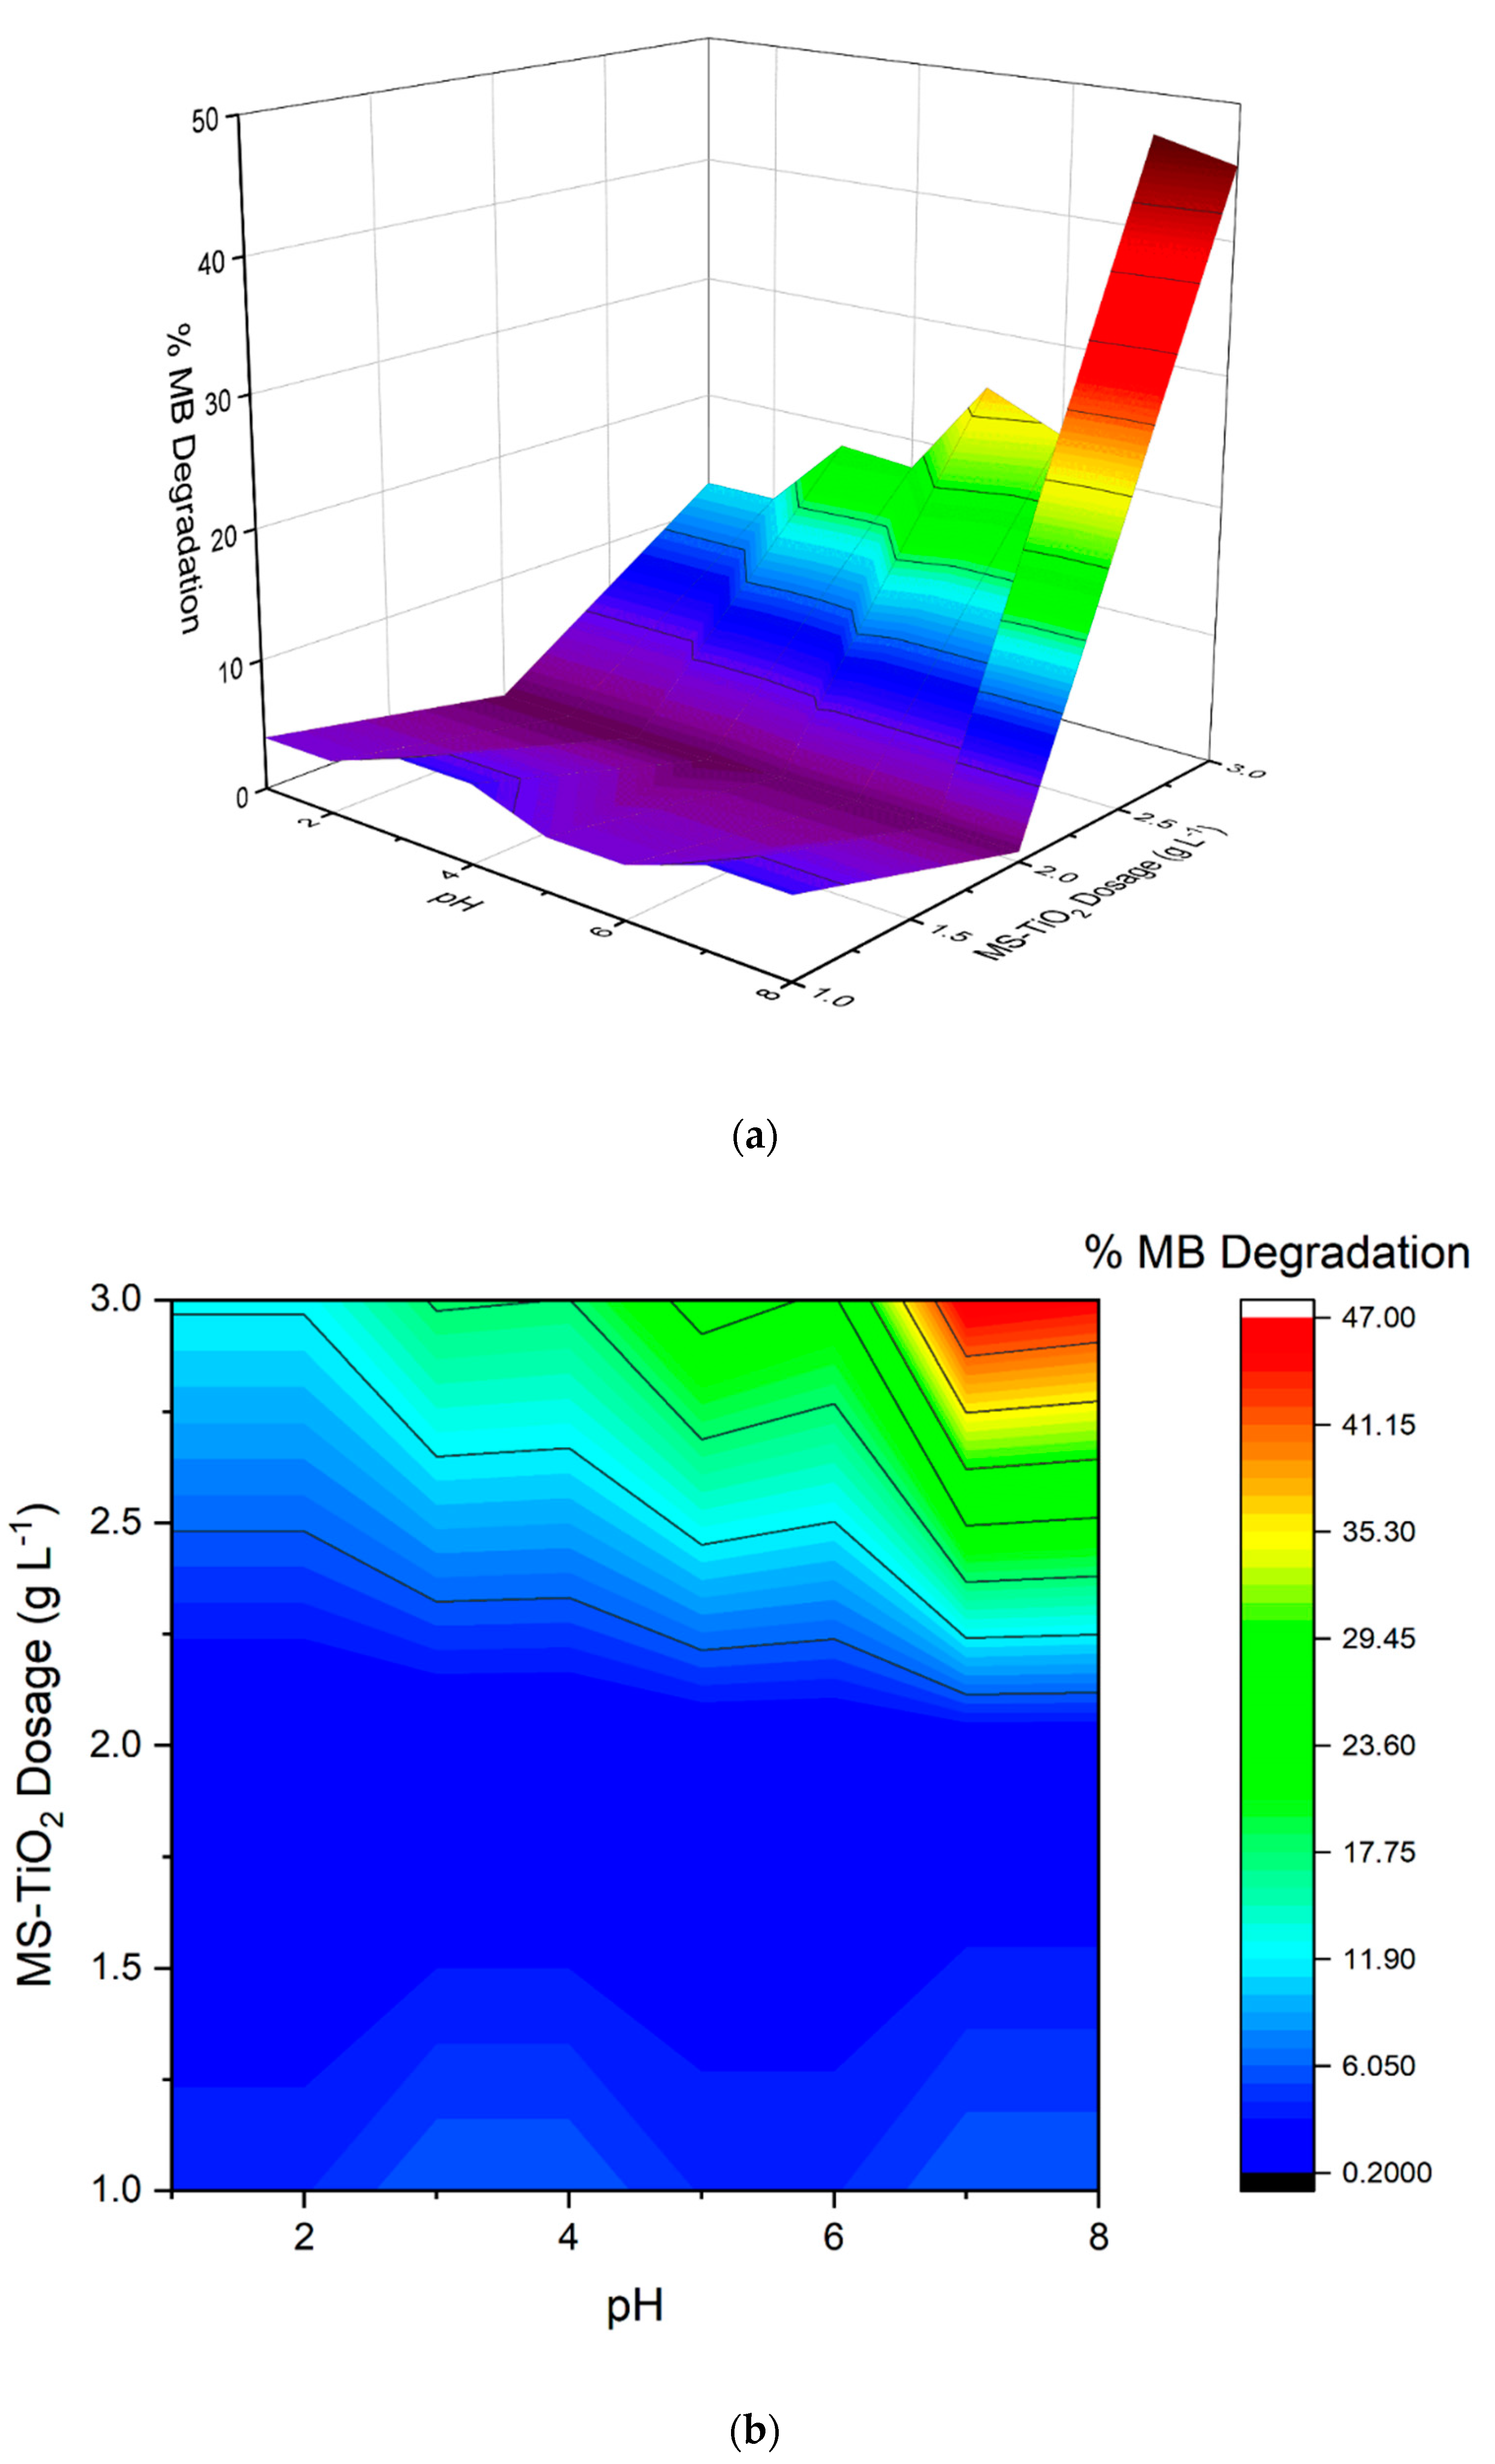
2.5. Parametric Study of Photocatalytic Degradation

Univariate parametric studies were carried out to determine the effective experimental ranges of different reaction parameters for MS-sensitized TiO2-based photocatalysis. The parameters chosen for this study were the initial concentration of MB, incident visible light intensity, and MS-TiO2 dosage. In each case, the % degradation of MB was measured using Equation (4). The details of all the univariate parametric studies are given in the Supporting Information (S3).

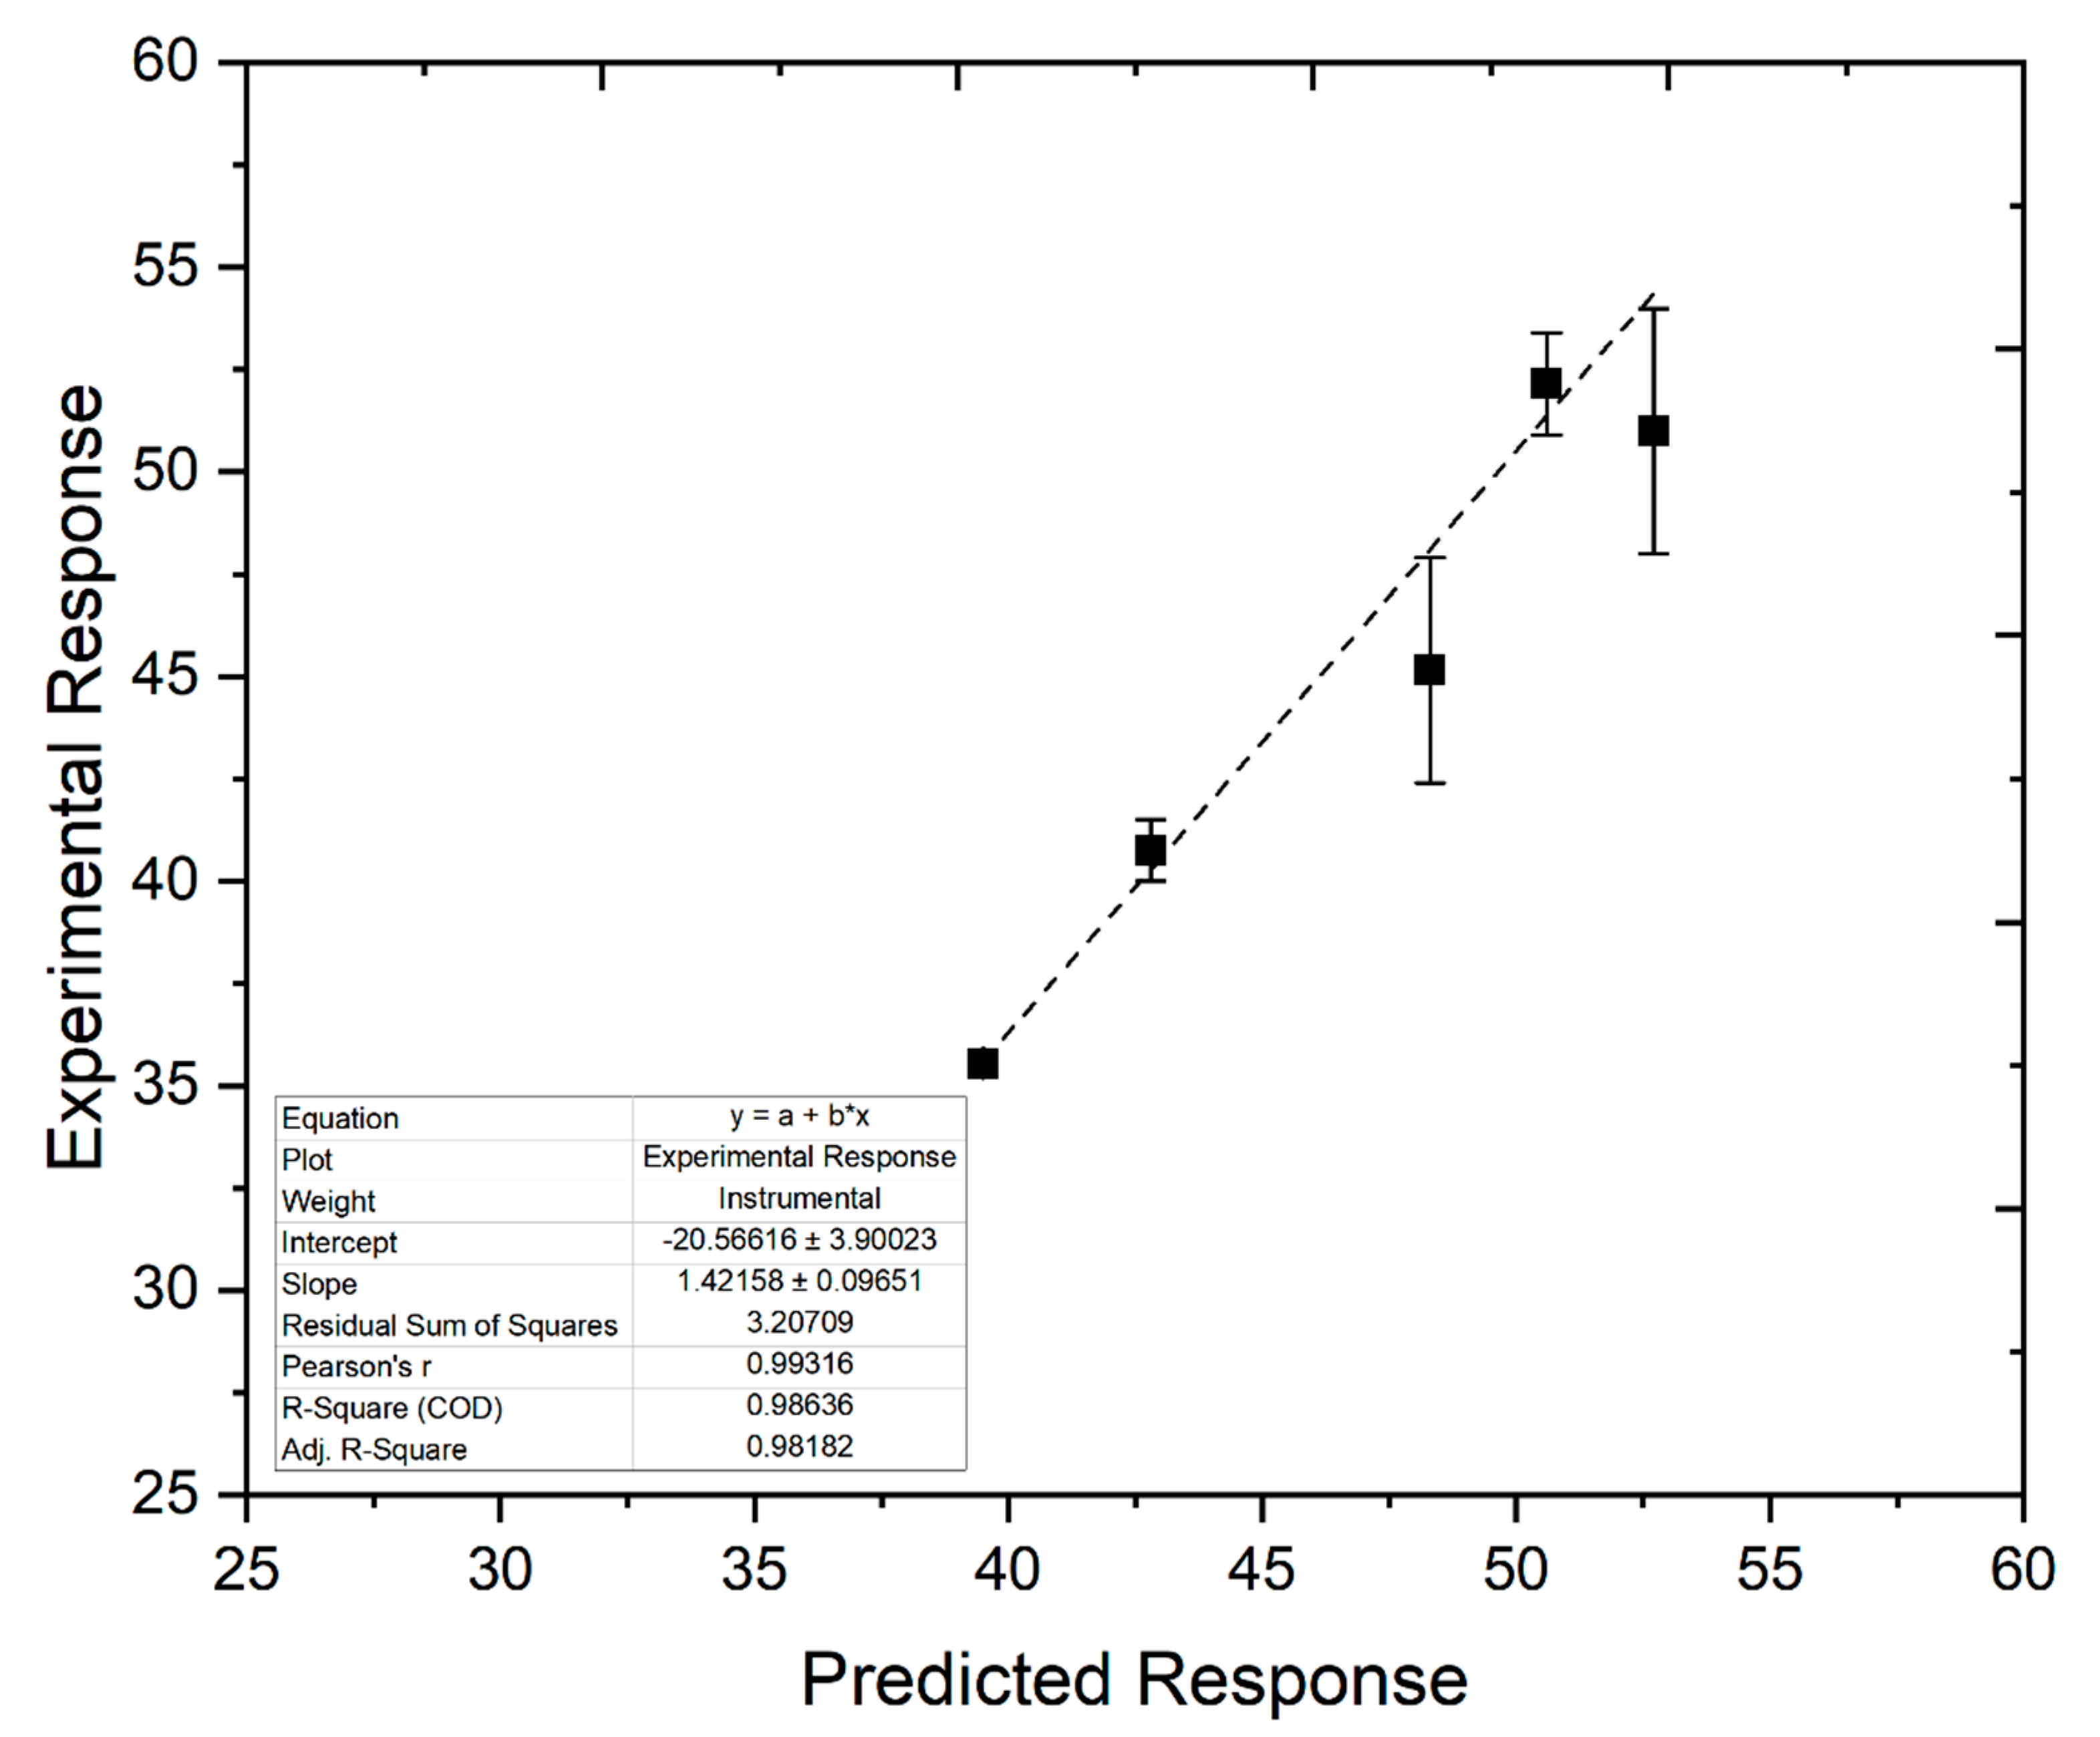
2.6. Statistical Analysis and Design of Experiments

To study the combined effects of different reaction parameters, a full factorial two-level three-factor (23) design of experiments was performed as detailed in Table 6 in Section 3.6. Since the effect of different reaction parameters cannot be compared if they are in different units, hence, there is a clear need to normalize all the parameters to a single unit. Thus, the variables were used in coded values for the modeling procedure. The normalization of the parameters was done by the following equation:
Code = X X mid 1 2   ( range )
where X is the value of a reaction parameter, Xmid is the midpoint of the highest and lowest value of the parameter, and range is the difference between the highest and lowest value of the parameter. This is the only way to fit all the reaction parameters to a single polynomial equation.
The results obtained in the factorial design study are summarized in the following table (Table 3). Here, Y has been averaged for the duplicate runs.
An empirical second-order polynomial equation was derived from the experimental design shown in Table 3 using a Minitab 17 software. The equation is given below.
Y = 25.13 + 6.887 A 0.575 B + 10.01 C + 0.0875 AB + 4.075 AC 0.4375 BC + 0.225 ABC
Here, Y represents the % degradation of MB following Equation (7), and A, B, and C represent the coded values of reaction parameters, as described in Table 6. From this model equation, it can be inferred that the independent variable A, C, and the interaction of A and C are highly significant since the values of their coefficients are considerably higher than the values of the other coefficients. From the values of the coefficients of the model equation (Equation (4)), it can be said that the order of effect of independent variables on MB degradation is catalyst dosage (C) > pH (A) > light intensity (B). The effect of B is almost negligible as compared to A and C. Hence, following further regression analysis, the final model equation was derived as described below.
Y = 25.13 + 6.887 A + 10.01 C + 4.075 AC
The R2 value predicted for this regression model (Equation (5)) is 0.9965, which is in good agreement with the adjusted R2 value of 0.9938. Moreover, the R2 value for this model is very close to 1. Both two facts indicate that this model equation can be effectively used for the degradation of MB under the experimental conditions.
The following figure (Figure 5) also shows a perfect fit (R2 > 98%) of the predicted responses with that of the experimental responses, which further validates the predictability of this model for MB degradation. The data used for the validation of this model are given in the Supporting Information (S4). The following figures (Figure 6a,b) show the response surface plot and two-dimensional contour plot, respectively, showing the combined effect of MS-TiO2 dosage (C) and pH (A) on the degradation of MB (Y). From Figure 6a,b, it is evident that as the MS-TiO2 dosage and pH is increased, the degradation of MB also increases under the experimental conditions.

2.7. Sensitivity Study

Finally, a sensitivity study was performed to determine the sensitivity of the reaction parameters toward the % degradation of MB (Y). The results are shown in the following table (Table 4). From this table (Table 4), it is observed that MS-TiO2 dosage is the most sensitive reaction parameter where 10% decrease of MS-TiO2 dosage can cause 47% decrease in Y. However, an increase in MS-TiO2 dosage does not affect Y to that extent. The effect of pH becomes more pronounced when it is decreased by 10%, which causes the degradation of MB to drop to around 23%. The effect of change in visible light intensity is less sensitive when it is increased. Y remains almost unchanged with increasing visible light intensity. However, Y is decreased to around 20% when the visible light intensity is reduced. Lastly, the following table (Table 5) shows the degradation of MB under different photocatalytic processes. From this table (Table 5), it is evident that this method is the most environmentally friendly approach for degrading MB with considerably low reaction time and a high degradation rate.

3. Materials and Methods

3.1. Materials

Mangosteen fruit was procured from the local market. This fruit was selected for a dark purple colour. TiO2 (Aeroxide P25: 80–20% anatase to rutile) was bought from Evonik Industries. Acetone was purchased from Sigma-Aldrich Company. MB (99% pure) was purchased from EM Science, Merck KGaA, Darmstadt, Germany. Ultra-pure water (18.2 MΩ·cm) was prepared from an in-house EASYPure RODI system (Thermo Scientific, Markham, ON, Canada). All chemicals used were analytical grade and used without any further purification.

3.2. Instruments

Solar simulator: A solar simulator was used to generate sunlight for photocatalysis. The solar simulator model (SS1KW, Sciencetech, London, ON, Canada) has the following specifications: 1000 W Xe arc lamp and an Air Mass (AM) 1.5 G filter; the simulator is capable of producing indistinguishable simulated 1 Sun irradiance of 100 mW/cm2 at full power. To generate only visible light, a UV cut-off filter (Omega Optical, Brattleboro, VT, USA: λ ≥ 420 nm) was used. UV Spectrophotometer: A UV-3600 UV-VIS-NIR spectrophotometer from Mandel Scientific was used for MB analysis.

3.3. Preparation of Photocatalyst

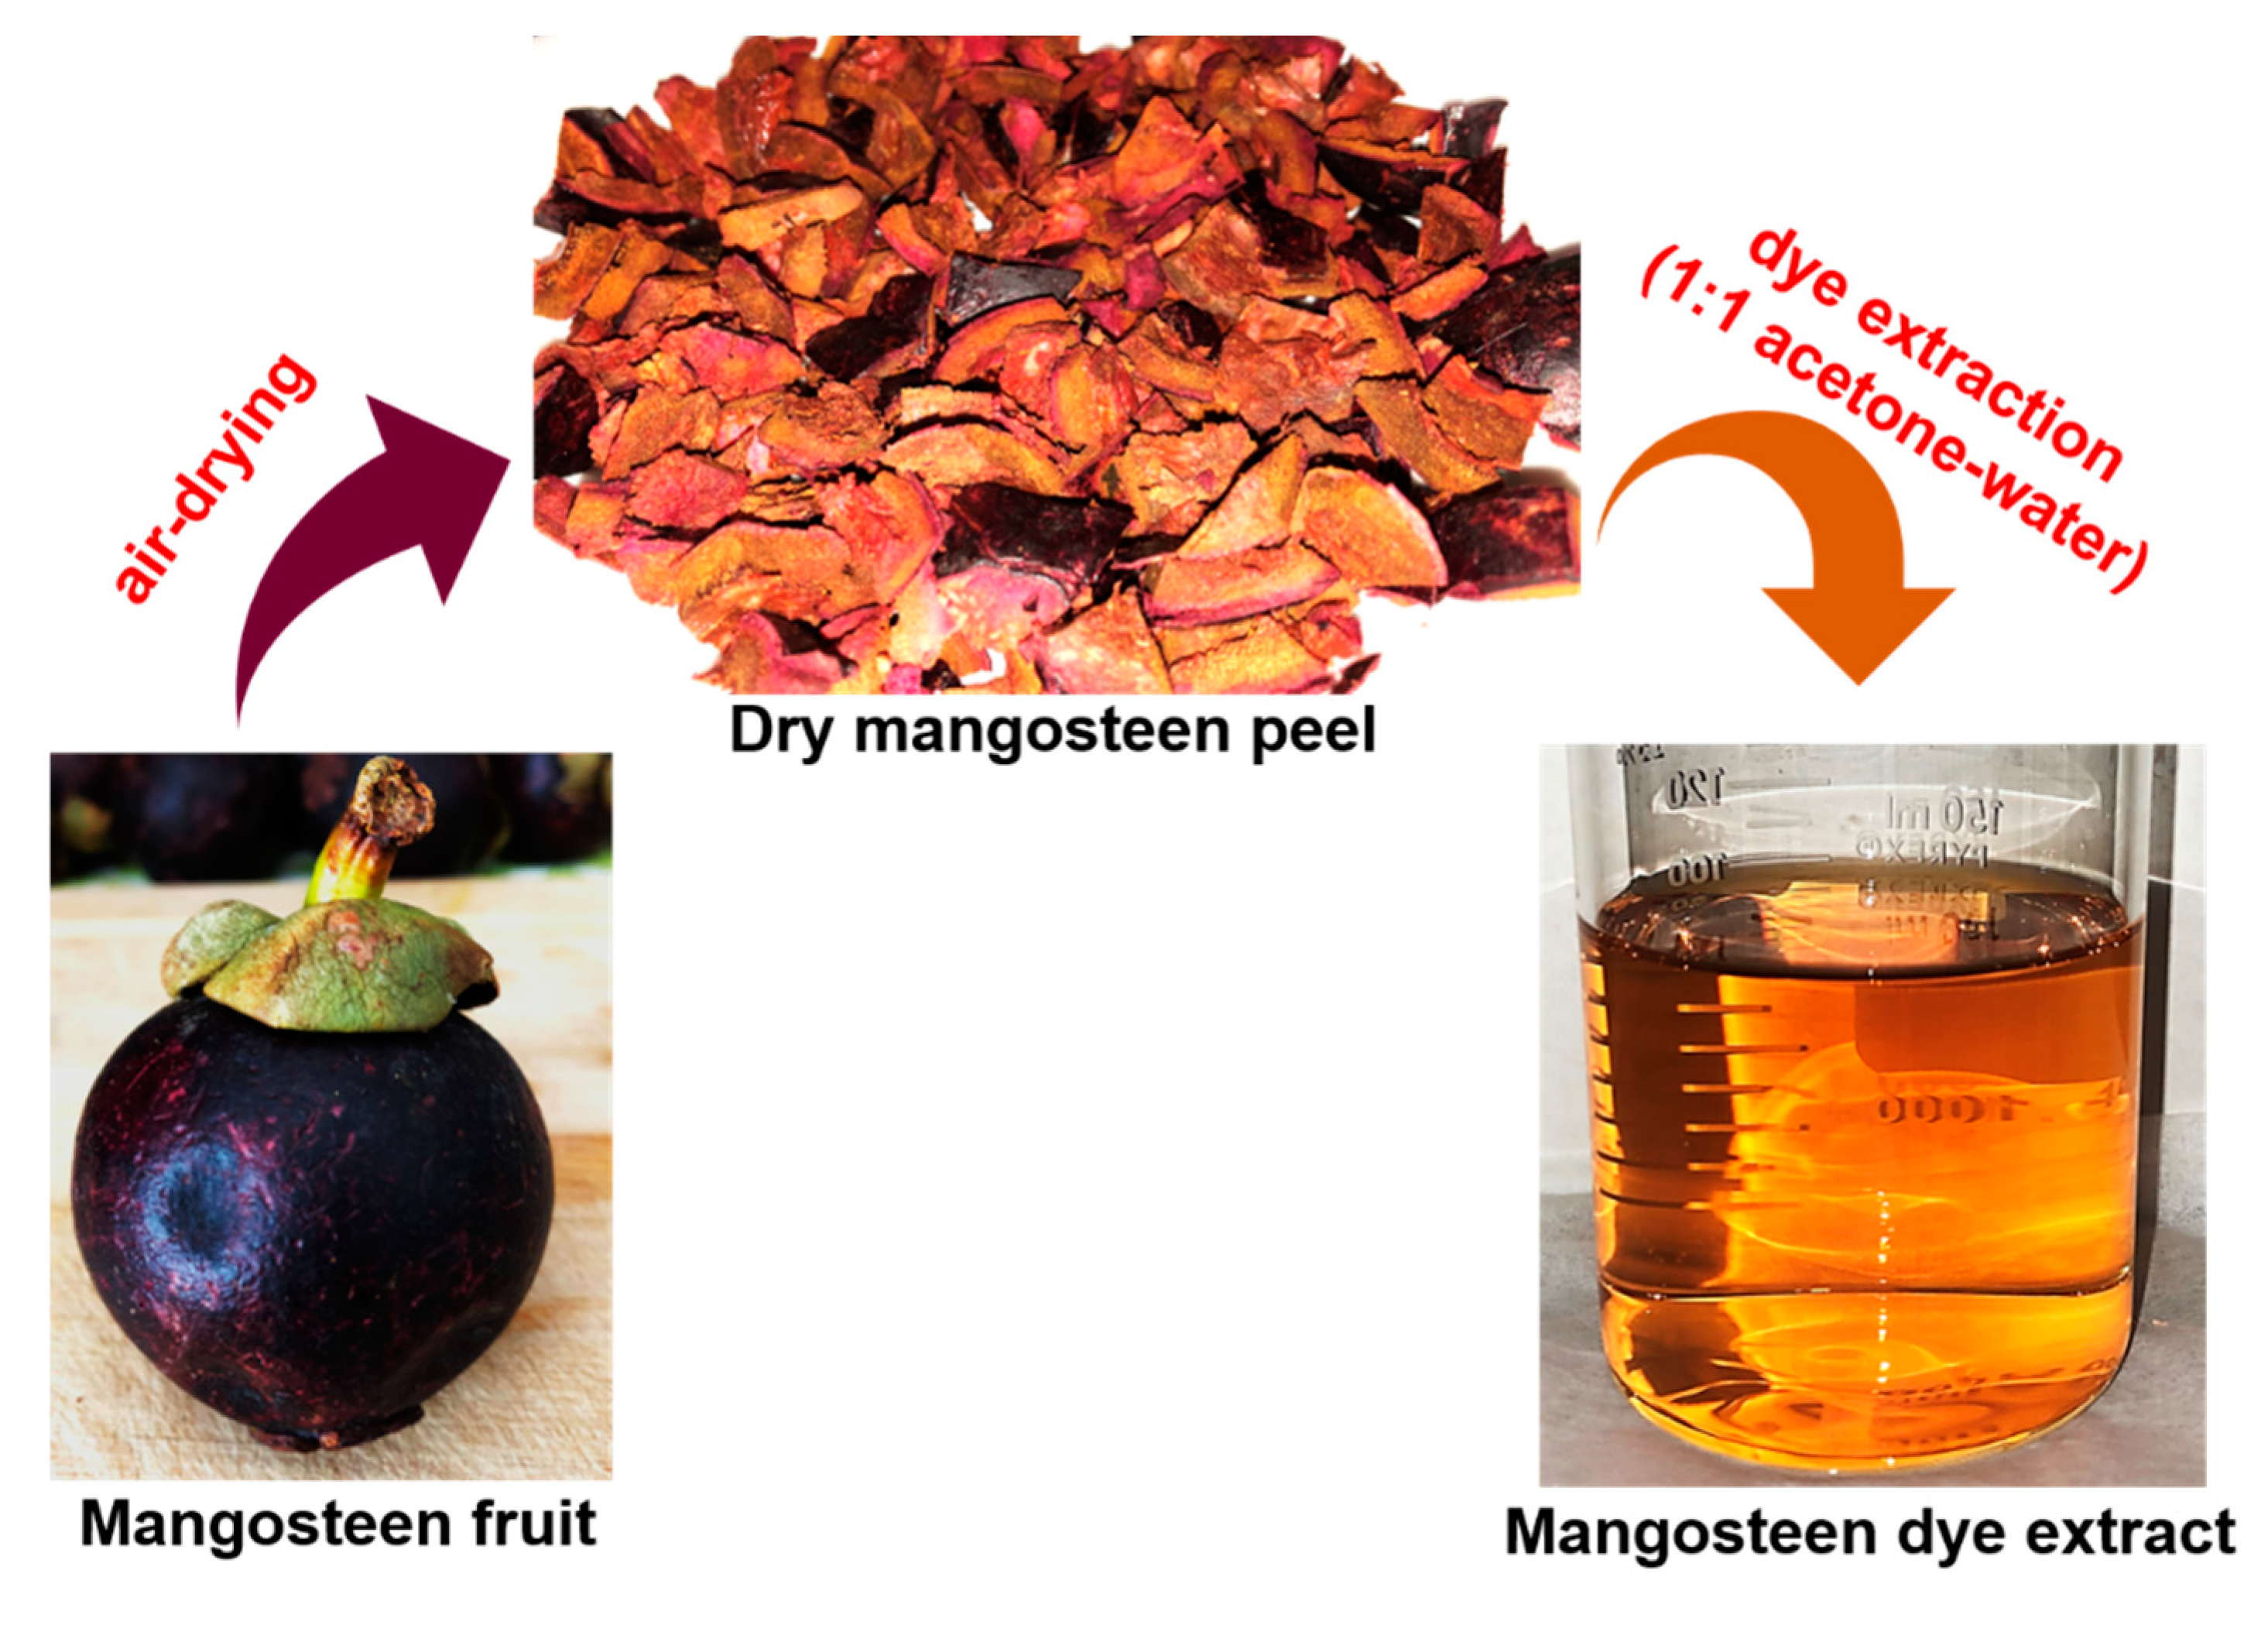
3.3.1. Preparation of Mangosteen Dye Extract

Peels from mangosteen cut into small pieces were air-dried for two days and stored in the dark for future use. 2 g of dried peels were slowly stirred overnight, under dark condition, in 200 mL of 1:1 acetone: water solvent. It was then centrifuged and vacuum filtered to get the mangosteen dye extract (Figure 7). The dye extract is orange in color. The solution was then filtered and transferred into a dark color glass bottle for further use.

3.3.2. Determination of Total Anthocyanins Content (TAC) in the Mangosteen Peel

A well-known pH differential method was used to determine the anthocyanin content of extracted mangosteen dye [32]. The anthocyanin dye concentration was expressed as cyanidin-3-glucoside equivalents as follows:
Anthocyanin   dye   ( mg / L ) = A × MW × DF × 1000 × L
where A = (A520 nm–A700 nm) pH 1.0–(A520 nm–A700 nm) pH 4.5; MW (molecular weight of cyanidin-3-glucoside) = 449.2 g/mol; DF is dilution factor, L is the cell path length for absorbance measurement in cm; ε (molar extinction coefficient of cyanidin-3-glucoside) = 26,900 L/mol/cm; and 1000 is the conversion factor from g to mg. Finally, the TAC was expressed as mg of cyanindin-3-glucoside equivalents per 100 g of dry mangosteen peel sample.

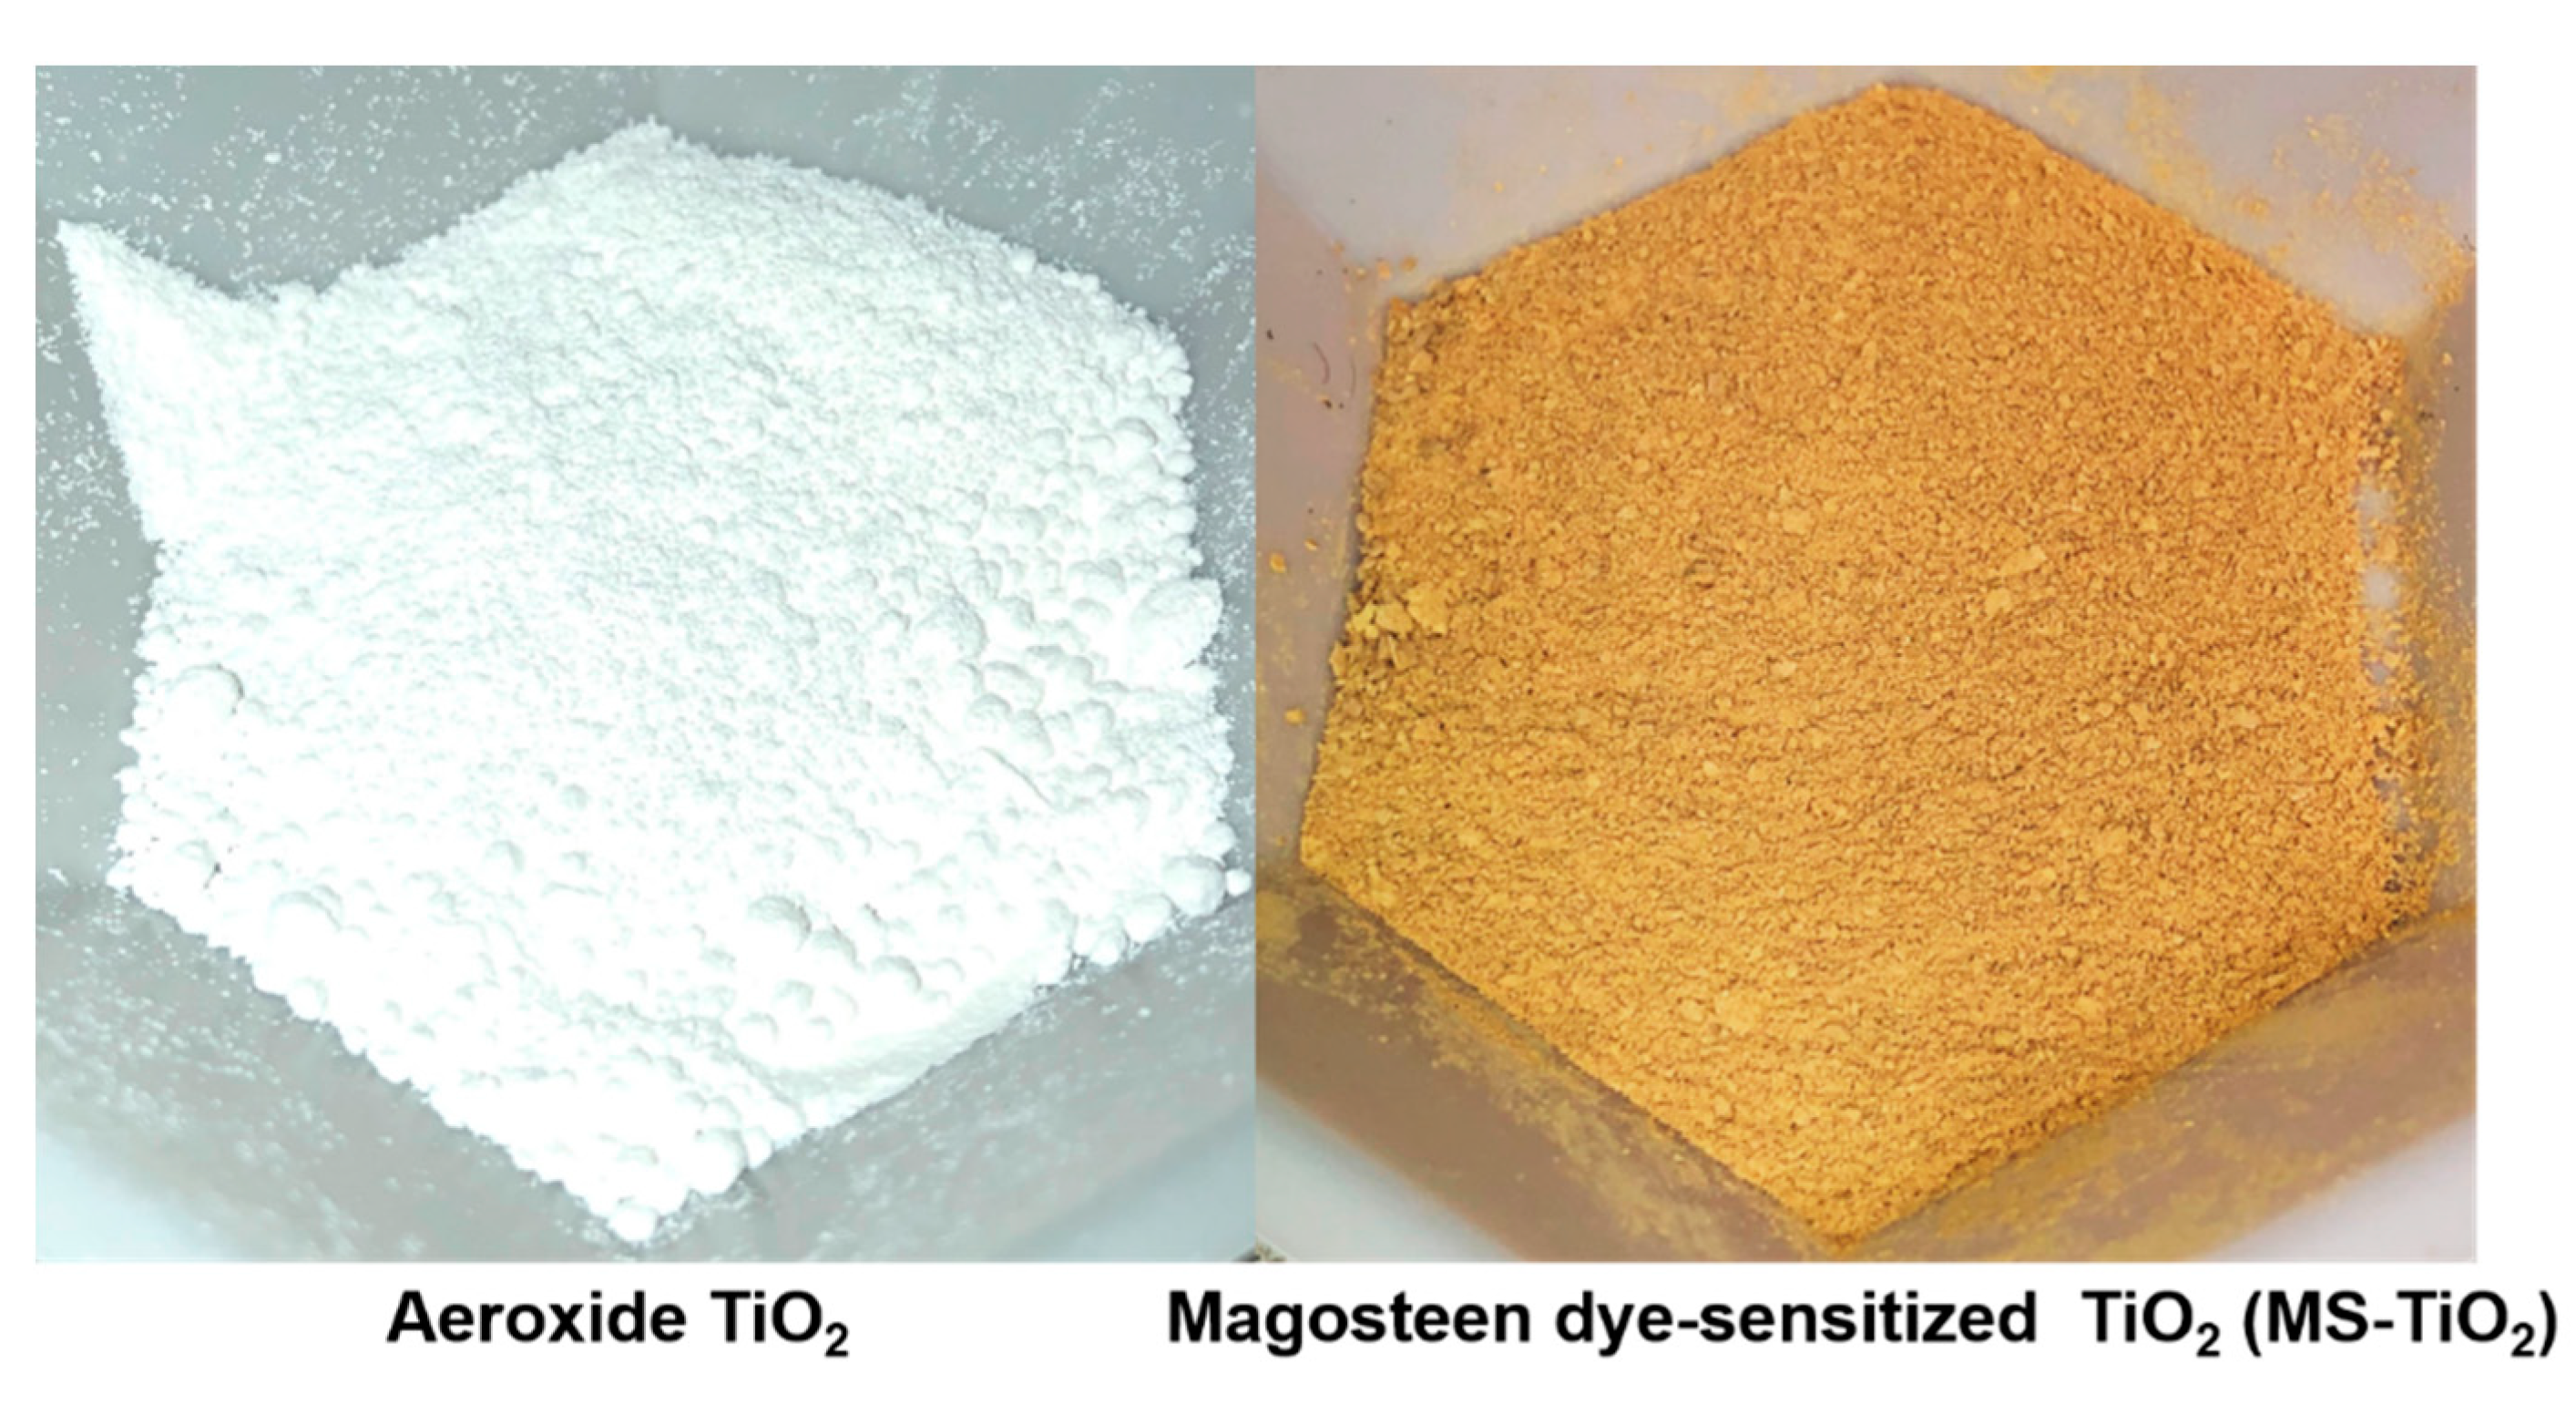
3.3.3. Preparation of Mangosteen Dye-Sensitized TiO2 (MS-TiO2)

In the prepared mangosteen dye extract, 2 g of aeroxide TiO2 powder was added and slowly stirred overnight under a dark condition. Next, it was centrifuged and vacuum dried at 70 °C for 2 h. It was then ground in a mortar-and-pestle to prepare the photocatalyst (MS-TiO2). The white TiO2 powder changed its color to yellowish-gray after treating it with dye extract (Figure 8). The prepared photocatalyst was then stored in the dark and in airtight vials for further uses.

3.4. Characterization of MS-TiO2 Photocatalyst

The bandgap of MS-TiO2 was determined using the UV-spectrophotometer to verify the bandgap shift of MS-TiO2 as compared to that of aeroxide TiO2 toward the visible range from the UV range. Chemical compositions of MS-TiO2 and aeroxide TiO2 were determined by the EDX study to confirm the adsorption of the mangosteen dye on the TiO2 surface. Finally, the change in the surface structure and morphology of MS-TiO2 compared to that of aeroxide TiO2 was analyzed through XRD followed by SEM at different magnifications.

3.5. Dye-Sensitized Photocatalysis Experiment

All the photocatalysis reactions were carried out in a Pyrex glass reactor (11 cm diameter, 6.3 cm height) with a flat window at the top for illumination, placed over a magnetic stirrer. As mentioned above (Section 3.2), solar light was irradiated by a solar simulator, where a UV cut-off filter (λ ≥ 420 nm) was used so that only the visible part of sunlight could be utilized. The volume of the reaction mixture was 150 mL, and all the reactions were carried out with constant aeration using an air pump. Dilute sodium hydroxide, and hydrochloric acid were used to adjust the pH of the reaction mixture. The reaction mixture (i.e., MB aqueous solution and MS-TiO2) was first stirred in the dark for 2 h to ascertain adsorption equilibrium and then irradiated with visible sunlight for an additional 2 h. Samples were collected and analyzed in a UV-Vis spectrophotometer after filtering through 0.45 μm membrane filters. The concentration of MB was determined by UV-Vis spectrophotometer at λmax 664 nm [38,39,40]. Percent degradation of MB was calculated using the following equation [31]:
% Degradation = ( C 0 C t C 0 ) × 100
where C0 and Ct are the concentration of MB at time 0 and t, respectively.

3.6. Experimental Design and Statistical Analysis

For the photocatalytic degradation of MB, first, univariate parametric studies were performed to determine the most effective reaction conditions. The parameters studied were the initial concentration of MB, MS-TiO2 dosage, and visible light intensity. Based on this single factor study, the most feasible reaction conditions were determined for MB degradation.
Depending on the single factor study, the initial concentration of MB for further studies was fixed at a definite value. For the multivariate parametric study, three selected reaction parameters, e.g., pH, visible light intensity, and MS-TiO2 dosage, were further studied using factorial design of experiments. A two-level three factorial design of experiment was followed, comprising of eight experiments and their duplicates, thereby amounting to 16 sets of experiments. This statistical approach was adopted to understand the complete and combined effect of three independent variables on the response, i.e., % degradation of MB. The ranges and levels of independent variables are shown in the following table (Table 6). Finally, the results obtained from 16 sets of experiments were fitted to an empirical quadratic polynomial model for three parameters in the form of the following equation:
Y = m 0 + m 1 A + m 2 B + m 3 C + m 12 AB + m 23 BC + m 13 AC
In this equation (Equation (8)), Y is the response, i.e., % degradation of MB; m0 is the intercept; m1, m2, and m3 are coefficients of independent variables; m12, m23, and m13 are coefficients of interaction terms; and A, B, and C are three independent variables as shown in Table 6. The multivariate regression analysis was performed using Minitab 17 software. Followed by the regression analysis, a sensitivity study was performed to determine the relative sensitivities of reaction parameters on the response under experimental conditions.

4. Conclusions

From this study, we can conclude that the dyes extracted from mangosteen peel can be successfully utilized for sensitizing TiO2, thereby replacing heavy metal and synthetic organic dyes, and the produced novel photocatalyst can be effectively used for visible–solar light-driven photocatalytic degradation of organic pollutants. The extracted natural dye from mangosteen peel contained a significant amount of anthocyanin dye (28 mg anthocyanin content per 100 g of dry mangosteen peel) that was responsible for the sensitization of aeroxide TiO2, resulting in a lower bandgap photocatalyst (MS-TiO2) compared to bare aeroxide TiO2. SEM and EDX studies also indicated the mangosteen dye adsorption on aeroxide TiO2 and the subsequent morphological change of the MS-TiO2 photocatalyst. MS-TiO2 could harvest visible solar light, as evident from the MB degradation. The visible light-driven photodegradation kinetics of MB fitted well with a modified Langmuir−Hinshelwood rate equation where the apparent rate constant was 2.291 × 10⁻⁶ 1/min. The apparent quantum yield for such photocatalysis was estimated as 0.03% at 60 mW/cm2, considering a 420–650 nm wavelength range. Although the novel MS-TiO2 photocatalyst showed low apparent quantum yield, the efficiency is either comparable or more competent for photocatalysis of MB under solar, visible, and UV light with various photocatalysts as mentioned in Table 6. A full factorial two-level design of experiment was successfully employed here to study the degradation of MB by solar light-driven photocatalysis using natural dye (mangosteen-based dye)-sensitized TiO2 as the photocatalyst. The process shows a significantly high MB removal under the experimental conditions. From the regression model developed by Minitab17, MS-TiO2 dosage was found to be the most influential factor for MB degradation under experimental conditions, followed by pH. The model was found to fit very well with experimental data, as confirmed by the high R2 value and the validation experiments.

Supplementary Materials

The following are available online at https://www.mdpi.com/2073-4344/10/8/917/s1. S1: EDX image of aeroxide TiO2 and MS-TiO2, S2: Diffuse Reflectance Spectra for aeroxide TiO2 and MS-TiO2, S3: Univariate Parametric Studies, S4: Data used for model validation.

Author Contributions

Conceptualization, A.K.R. and P.C.; Data curation, M.G.; Formal analysis, A.K.R., M.G. and P.C.; Funding acquisition, A.K.R.; Investigation, M.G.; Methodology, A.K.R., M.G. and P.C.; Project administration, A.K.R.; Resources, A.K.R.; Writing—original draft, M.G.; Writing—review & editing, A.K.R. and P.C. All authors have read and agreed to the published version of the manuscript.

Funding

This research was funded by Natural Sciences and Engineering Research Council of Canada: RP364721.

Acknowledgments

The authors gratefully acknowledge NSERC for providing the financial support needed for this work. The authors are thankful to Tim Goldhawk from the Physics and Astronomy Department of Western University for providing the opportunity to use their facilities to run SEM and EDX studies. The authors are also thankful to Hugo I. De Lasa from Chemical and Biochemical Engineering Department of Western University for providing the opportunity to use their facilities to run XRD studies.

Conflicts of Interest

The authors declare no conflict of interest.

References

  1. Ghosh, M.; Chowdhury, P.; Ray, A.K. Study of solar photocatalytic degradation of Acesulfame K to limit the outpouring of artificial sweeteners. Sep. Purif. Technol. 2018, 207, 51–57. [Google Scholar] [CrossRef]
  2. Mukherjee, D.; Barghi, S.; Ray, A.K. Degradation of Methyl Orange by TiO2/polymeric film photocatalyst. Can. J. Chem. Eng. 2014, 92, 1661–1666. [Google Scholar] [CrossRef]
  3. Chen, D.; Ray, A.K. Photocatalytic kinetics of phenol and its derivatives over UV irradiated TiO2. Appl. Catal. B Environ. 1999, 23, 143–157. [Google Scholar] [CrossRef]
  4. Chen, D.; Ray, A.K. Photodegradation kinetics of 4-nitrophenol in TiO2 suspension. Water Res. 1998, 32, 3223–3234. [Google Scholar] [CrossRef]
  5. Litter, M. Heterogeneous photocatalysis Transition metal ions in photocatalytic systems. Appl. Catal. B Environ. 1999, 23, 89–114. [Google Scholar] [CrossRef]
  6. Fernández, J.; Kiwi, J.; Lizama, C.; Freer, J.; Baeza, J.; Mansilla, H.D. Factorial experimental design of Orange II photocatalytic discolouration. J. Photochem. Photobiol. A Chem. 2002, 151, 213–219. [Google Scholar] [CrossRef]
  7. Zyoud, A.; Hilal, H. Curcumin-sensitized anatase TiO2 nanoparticles for photodegradation of methyl orange with solar radiation. In Proceedings of the 1st International Conference & Exhibition on the Applications of Information Technology to Renewable Energy Processes and Systems, 10–13 September; Institute of Electrical and Electronics Engineers (IEEE): Piscataway, NJ, USA, 2013; pp. 31–36. [Google Scholar]
  8. Manoli, K.; Ghosh, M.; Nakhla, G.; Ray, A.K. A Review on Ferrate (VI) and Photocatalysis as Oxidation Processes for the Removal of Organic Pollutants in Water and Wastewater. Adv. Mater. Wastewater Treat. 2017, 331–390. [Google Scholar] [CrossRef]
  9. Wongcharee, K.; Meeyoo, V.; Chavadej, S. Dye-sensitized solar cell using natural dyes extracted from rosella and blue pea flowers. Sol. Energy Mater. Sol. Cells 2007, 91, 566–571. [Google Scholar] [CrossRef]
  10. Polo, A.S.; Murakamiiha, N. Blue sensitizers for solar cells: Natural dyes from Calafate and Jaboticaba. Sol. Energy Mater. Sol. Cells 2006, 90, 1936–1944. [Google Scholar] [CrossRef]
  11. Bhogaita, M.; Shukla, A.; Nalini, R.P. Recent advances in hybrid solar cells based on natural dye extracts from Indian plant pigment as sensitizers. Sol. Energy 2016, 137, 212–224. [Google Scholar] [CrossRef]
  12. Chowdhury, P.; Gomaa, H.; Ray, A.K. Factorial design analysis for dye-sensitized hydrogen generation from water. Int. J. Hydrog. Energy 2011, 36, 13442–13451. [Google Scholar] [CrossRef]
  13. Yuan, Y.; Yin, L.-S.; Cao, S.; Xu, G.-S.; Li, C.-H.; Xue, C. Improving photocatalytic hydrogen production of metal–organic framework UiO-66 octahedrons by dye-sensitization. Appl. Catal. B Environ. 2015, 168, 572–576. [Google Scholar] [CrossRef]
  14. Qin, J.; Huo, J.; Zhang, P.; Zheng, J.; Wang, T.; Zeng, H. Improving the photocatalytic hydrogen production of Ag/g-C3N4 nanocomposites by dey-sensitization under visible light irradiation. Nanoscale 2016, 8, 2249–2259. [Google Scholar] [CrossRef] [PubMed]
  15. Zyoud, A.H.; Hilal, H.S. Silica-supported CdS-sensitized TiO2 particles in photo-driven water purification: Assessment of efficiency, stability and recovery future perspectives. In Water Purification; Novascience Pub.: New York, NY, USA, 2009. [Google Scholar]
  16. Chowdhury, P.; Gomaa, H.; Ray, A.K. Dye-Sensitized Photocatalyst: A Breakthrough in Green Energy and Environmental Detoxification. ACS Symp. Ser. 2013, 1124, 231–266. [Google Scholar] [CrossRef]
  17. Hilal, H.S.; Nour, G.Y.M.; Zyoud, A. Zyoud, Photo-degradation of methyl orange and phenazopyridine HCl with direct solar light using ZnO and activated carbon-supported ZnO. In Water Purification; Novascience Pub.: New York, NY, USA, 2009. [Google Scholar]
  18. Hara, K.; Sugihara, H.; Tachibana, Y.; Islam, A.; Yanagida, M.; Sayama, K.; Arakawa, H.; Fujihashi, G.; Horiguchi, T.; Kinoshita, T. Dye-Sensitized Nanocrystalline TiO2 Solar Cells Based on Ruthenium(II) Phenanthroline Complex Photosensitizers. Langmuir 2001, 17, 5992–5999. [Google Scholar] [CrossRef]
  19. Gratzel, M.; Kalyanasundaram, K. Metal Complexes as Photosensitizers in Photoelectrochemical Cells. In Catalysis by Metal Complexes; Springer Science and Business Media LLC.: Berlin, Germany, 1993; Volume 14, pp. 247–271. [Google Scholar]
  20. Zyoud, A.H.; Saleh, F.; Helal, M.H.; Shawahna, R.; Hilal, H.S. Anthocyanin-Sensitized TiO2 Nanoparticles for Phenazopyridine Photodegradation under Solar Simulated Light. J. Nanomater. 2018, 2018, 2789616. [Google Scholar] [CrossRef] [Green Version]
  21. Ismail, M.; Ludin, N.A.; Hamid, N.H.; Ibrahim, M.A.; Sopian, K. The Effect of Chenodeoxycholic Acid (CDCA) in Mangosteen (Garcinia mangostana) Pericarps Sensitizer for Dye-Sensitized Solar Cell (DSSC). J. Phys. Conf. Ser. 2018, 1083, 012018. [Google Scholar] [CrossRef]
  22. Pinto, A.L.M. Light Harvesting in Solar Cells Using Natural Pigments from Red Fruits Adsorbed to Mesoporous TiO2. Master’s Thesis, Universidade Nova de Lisboa, Lisbon, Portugal, November 2015. [Google Scholar]
  23. Calogero, G.; Di Marco, G.; Caramori, S.; Cazzanti, S.; Argazzi, R.; Bignozzi, C.A. Natural dye senstizers for photoelectrochemical cells. Energy Environ. Sci. 2009, 2, 1162–1172. [Google Scholar] [CrossRef]
  24. Brouillard, R. Flavonoids and flower colour. In the Flavonoids; Herborne, J.B., Ed.; Springer: Boston, MA, USA, 1988; pp. 525–538. [Google Scholar]
  25. Bridle, P.; Timberlake, C. Anthocyanins as natural food colours—Selected aspects. Food Chem. 1997, 58, 103–109. [Google Scholar] [CrossRef]
  26. Chaovanalikit, A.; Mingmuang, A.; Kitbunluewit, T.; Choldumrongkool, N.; Sondee, J.; Chupratum, S. Anthocyanin and total phenolics content of mangosteen and effect on processing on the quality of mangosteen products. Int. Food Res. J. 2012, 19, 1047–1053. [Google Scholar]
  27. Fu, C.; Loo, A.E.K.; Chia, F.P.P.; Huang, D. Oligomeric Proanthocyanidins from Mangosteen Pericarps. J. Agric. Food Chem. 2007, 55, 7689–7694. [Google Scholar] [CrossRef] [PubMed]
  28. Du, C.T.; Francis, F.J. Anthocyanins of mangosteen, Garcinia mangostana. J. Food Sci. 1977, 42, 1667–1668. [Google Scholar] [CrossRef]
  29. Zadernowski, R.; Czaplicki, S.; Naczk, M. Phenolic acid profiles of mangosteen fruits (Garcinia mangostana). Food Chem. 2009, 112, 685–689. [Google Scholar] [CrossRef]
  30. Buranaprapuk, A.; Malaikaew, Y.; Chaovanalikit, A.; Jaratrungtawee, A.; Panseeta, P.; Ratananukul, P.; Suksamrarn, S. Prenylated Xanthone Composition of Garcinia mangostana (Mangosteen) Fruit Hull. Chromatographia 2008, 69, 315–318. [Google Scholar] [CrossRef]
  31. Sahoo, C.; Gupta, A.K. Optimization of photocatalytic degradation of methylene blue using silver ion doped titanium dioxide by combination of experimental design and response surface approach. J. Hazard. Mater. 2012, 215, 302–310. [Google Scholar] [CrossRef]
  32. Lee, J.; Durst, R.W.; Wrolstad, R.E. Determination of Total Monomeric Anthocyanin Pigment Content of Fruit Juices, Beverages, Natural Colorants, and Wines by the pH Differential Method: Collaborative Study. J. AOAC Int. 2005, 88, 1269–1278. [Google Scholar] [CrossRef] [Green Version]
  33. Hiranrangsee, L.; Kumaree, K.K.; Sadiq, M.B.; Anal, A.K. Extraction of anthocyanins from pericarp and lipids from seeds of mangosteen (Garcinia mangostana L.) by Ultrasound-assisted extraction (UAE) and evaluation of pericarp extract enriched functional ice-cream. J. Food Sci. Technol. 2016, 53, 3806–3813. [Google Scholar] [CrossRef] [Green Version]
  34. Mar, A.A.; Lin, K.S.; Ni, K.T. Extraction of natural dye from mangosteen peel for application on dyeing of cotton fabric. Univ. Res. J. 2016, 9, 1–12. [Google Scholar]
  35. Chowdhury, P.; Moreira, J.; Gomaa, H.; Ray, A.K. Visible-Solar-Light-Driven Photocatalytic Degradation of Phenol with Dye-Sensitized TiO2: Parametric and Kinetic Study. Ind. Eng. Chem. Res. 2012, 51, 4523–4532. [Google Scholar] [CrossRef]
  36. Chakrabarti, S.; Dutta, B. Photocatalytic degradation of model textile dyes in wastewater using ZnO as semiconductor catalyst. J. Hazard. Mater. 2004, 112, 269–278. [Google Scholar] [CrossRef]
  37. Tang, J.; Zou, Z.; Yin, J.; Ye, J. Photocatalytic degradation of methylene blue on CaIn2O4 under visible light irradiation. Chem. Phys. Lett. 2003, 382, 175–179. [Google Scholar] [CrossRef]
  38. Eskizeybek, V.; Sarı, F.; Gülce, H.; Gülce, A.; Avcı, A. Preparation of the new polyaniline/ZnO nanocomposite and its photocatalytic activity for degradation of methylene blue and malachite green dyes under UV and natural sun lights irradiations. Appl. Catal. B Environ. 2012, 119, 197–206. [Google Scholar] [CrossRef]
  39. Shi, Y.; Yang, D.; Li, Y.; Qu, J.; Yu, Z.-Z. Fabrication of PAN@TiO2/Ag nanofibrous membrane with high visible light response and satisfactory recyclability for dye photocatalytic degradation. Appl. Surf. Sci. 2017, 426, 622–629. [Google Scholar] [CrossRef]
  40. Yao, W.; Zhang, B.; Huang, C.; Ma, C.; Song, X.; Xu, Q. Synthesis and characterization of high efficiency and stable Ag3PO4/TiO2 visible light photocatalyst for the degradation of methylene blue and rhodamine B solutions. J. Mater. Chem. 2012, 22, 4050–4055. [Google Scholar] [CrossRef]
Figure 1. XRD plot of TiO2 (aeroxide), MS-TiO2, and standard anatase TiO2.
Catalysts 10 00917 g001
Figure 2. SEM picture of (a) aeroxide TiO2 and (b) MS-TiO2.
Catalysts 10 00917 g002
Figure 3. Solar visible light-driven photocatalysis of methylene blue (MB) with MS-TiO2. Experimental conditions: [MB]o = 20 mg/L, I = 60 mW/cm2, pH = 6, [TiO2] = 0.75 g/L
Catalysts 10 00917 g003
Figure 4. Experimental and L–H model fitting. Experimental conditions: [MB]o = 20 mg/L, I = 60 mW/cm2, pH = 6, [TiO2] = 0.75 g/L.
Catalysts 10 00917 g004
Figure 5. Model predicted vs. experimental response (% degradation of MB) under different experimental conditions.
Catalysts 10 00917 g005
Figure 6. (a): Response surface plot showing the effect of pH and catalyst dosage on % degradation of MB; (b): 2D contour plot showing the effect of pH and catalyst dosage on % degradation of methylene blue.
Catalysts 10 00917 g006
Figure 7. Preparation of mangosteen dye sensitizer.
Catalysts 10 00917 g007
Figure 8. Aeroxide TiO2 (left) and mangosteen dye-sensitized TiO2 (MS-TiO2) (right).
Catalysts 10 00917 g008
Table 1. EDX study of aeroxide TiO2 and MS-TiO2.
ElementWeight %
Aeroxide TiO2MS-TiO2
Carbon2.916.9
Oxygen42.934.4
Titanium50.343.5
Table 2. Kinetic constant values.
L–H Kinetic ConstantsValuesUnits
Kapp2.291 × 10−61/min
KA0.322L/mg
β2.281
Table 3. Full factorial (23) experimental design.
Run NumberABCY (% MB Removal)
1−1−1−112.3
2+1−1−118.2
3−1+1−112.3
4+1+1−117.65
5−1−1+125.5
6+1−1+146.8
7−1+1+122.85
8+1+1+145.4
900017.8
Table 4. Result of sensitivity study.
ParameterBase Value% Increase% Decrease% Change in Y
pH65N/A−11.2
N/A5−13.0
10N/A17.4
N/A10−23.3
Visible light intensity60 mW cm−25N/A−0.2
N/A5−20.7
10N/A5.4
N/A10−16.1
MS-TiO2 dosage0.75 g L−15N/A−1.7
N/A5−38.7
10N/A13.5
N/A10−46.9
Table 5. Degradation of MB under different photocatalytic processes.
Oxidation Process[MB]0 mg L−1Light SourceI
W
CatalystCatalyst Dosage
g L−1
Time
h
% MB DegradationReference
Photocatalysis50 UV lamp16ZnO1 258%[36]
Photocatalysis15.3Xe arc lamp (with UV cut-off filter)300CaIn2O432>99%[37]
Photocatalysis15.3Xe arc lamp (with UV cut-off filter)300TiO2 Degussa P253228%[37]
Photocatalysis15.3Xe arc lamp (with UV cut-off filter)300--228%[37]
Photocatalysis3.2natural sunlight-Polyaniline/ZnO Nano-composite0.4999%[38]
Photocatalysis5visible solar light60
mW/cm2
MS-TiO20.75278%this study
Table 6. The levels and ranges of variables in statistical experimental design.
Independent VariableSymbolCoded Variable Level
LowCenterHigh
−10+1
pHA456
Visible light intensity (mW cm−2)B6080100
MS-TiO2 dosage (gm L−1)C0.250.50.75

