Article

The Impact of In Situ Polymerization Conditions on the Structures and Properties of PANI/ZnO-Based Multiphase Composite Photocatalysts

1
Faculty of Chemical Engineering and Technology, University of Zagreb, Marulićev trg 19, 10000 Zagreb, Croatia
2
Department of Physics, Faculty of Science, University of Zagreb, Bijenička, c. 32, 10000 Zagreb, Croatia
3
Ruđer Bošković Institute, P.O. Box 180, 10000 Zagreb, Croatia
*
Authors to whom correspondence should be addressed.
Catalysts 2020, 10(4), 400; https://doi.org/10.3390/catal10040400
Submission received: 28 February 2020 / Revised: 31 March 2020 / Accepted: 2 April 2020 / Published: 5 April 2020
(This article belongs to the Special Issue Commemorative Issue in Honor of Professor Hugo de Lasa)

Abstract

:
We have synthesized polyaniline/ZnO-based (PANI/ZnO) multiphase composite photocatalysts from acid media by a newly proposed two-step in situ polymerization. The first step of synthesis yielded PANI salt required for the PANI/ZnO synergistic effect. In the second step, the aniline oxidation continued, without ZnO dissolution, and it produced PANI base. Thus, both PANI salt and base phases in the composites were detected by FTIR and UV/Vis, while the presence of both ZnO and PANI polymer was confirmed by XRD. Additionally, XRD also showed Zn5(OH)8(NO3)2·2H2O and Zn(SO4)(H2O) phases in PANI/ZnO-based multiphase composites. Furthermore, the impact of the synthesis conditions on the morphology of the composites was investigated by FE-SEM. The images displayed that ZnO particles were encapsulated in PANI sheets that were formed by the aniline oligomers. Photocatalytic evaluation of PANI/ZnO-based catalysts (i.e., degradation of Acid Blue 25 dye) was conducted and the obtained results confirmed that all the studied composites experienced the PANI/ZnO synergistic effect. It was observed that the best photocatalytic properties were held by the PANI/ZnO_2 sample due to its optimal particle size.

1. Introduction

Nowadays, significant attention is focused on wastewater treatment by cost-effective processes. Due to increased economic growth in, e.g., textile industries of the developing countries, the wastewater polluted by diverse organic dyes has become a significant global factor. Some of the greatest global pollutants are diverse organic dyes. Thus, nowadays, major efforts have been focused on developing low-cost and eco-friendly photocatalysts [1,2,3,4,5,6,7,8]. However, conventional photocatalysts (e.g., TiO2 and ZnO) suffer from low photocatalytic efficiency under solar (UVA/Vis) [1] irradiation (e.g., TiO2 bandgap is between 2.86 and 3.20 eV [9]), which is a problem that needs to be resolved (see Scheme 1).
The low efficiency of TiO2 and ZnO under solar irradiation emerges from the recombination of the photoexcited electron (e) and hole (h+) pair(s) (Scheme 1). This recombination is especially problematic when realizing that UV irradiation at the planet’s surface is only 5%–7% of the total incoming irradiation. The aforementioned problem can be resolved by preparing composites based on ZnO (or TiO2) and conductive polymers. One of the available conductive polymers (polypyrrole, poly(3,4-ethylenedioxythiophene), and polythiophene [8]) especially suitable for the preparation of photocatalyst composites is polyaniline (PANI) due to its straightforward preparation procedure (Scheme 2).
Aniline oxidation at low pH yields PANI salt (i.e., emeraldine salt) which is a well-known p-type conductive polymer with a wide array of applications; i.e., it can be used in corrosion protection [14,15,16], batteries [17], supercapacitors [3,18], photocatalysis [12,19,20], etc. However, if aniline oxidation is conducted at pH >3, the formation of PANI base is expected. Thus, the aniline oxidation under different pH conditions can produce both PANI salt and base phases (Scheme 3).
As PANI salt is doped by protons (H+), it requires counter-ions (e.g., HSO4) to maintain electroneutrality (Scheme 3); and thus, it adsorbs anionic dyes well [21], such as Acid Blue 25 (AB 25) (Scheme 4). PANI can take photoexcited hVB+ from the ZnO valence band (VB) (Scheme 1). At the same time, under Vis irradiation, PANI injects its photoexcited eCB into ZnO conduction band (CB). The aforementioned PANI/ZnO iterations yield the PANI/ZnO synergistic effect that boosts the photocatalytic efficiency of ZnO under solar irradiation.
Although PANI homopolymerization is a rather simple process (Scheme 2), the preparation of PANI/ZnO composites can be a delicate task to some extent. To be precise, PANI salt should be synthesized in highly acidic conditions under which ZnO dissolves. In the previous work [10], we avoided ZnO dissolution by adding diethylene glycol (DEG). However, DEG additions also perturbed the PANI/ZnO composite’s morphology. The same effect, i.e., the perturbed PANI morphology, can be obtained by adding ortho-phenylenediamine into synthesis solutions [16].
Herein, it was decided to avoid an extra addition of DEG to prevent ZnO dissolution (Equation (1)); and thus, we bypassed the dissolution as PANI/ZnO photocatalysts were prepared in two steps. In the first step, PANI emeraldine salt was synthesized by homopolymerization of the aniline monomer at pH = 2. Please remember that under this pH condition, ZnO dissolves (Equation (1)). The second step, i.e., in situ polymerization, commenced by adding ZnO into the homopolymerization suspension which consisted of PANI salt and unreacted aniline and ammonium persulfate (APS) leftovers.
Furthermore, the amounts of the aniline monomer and APS leftovers were sufficient to enable in situ PANI/ZnO polymerization. However, under in situ polymerization conditions (pH ≈ 5), a second PANI phase (i.e., PANI base) was also obtained. What is more, the presence of NH4+, SO42− (see Scheme 2), and Zn2+ ions during in situ oxidation yielded two additional phases. As the synthesis was conducted in two different pH regions, and due to the fact that there are multiple phases (besides PANI and ZnO), it is fair to conclude that the photocatalysts in this work are PANI/ZnO-based multiphase composites.
ZnO   + 2 H +   Zn 2 + +   H 2 O
The aims of this work were to (i) avoid ZnO dissolution during in situ polymerization and (ii) synthesize a photocatalyst composite that exhibits the PANI/ZnO synergistic effect. For this reason, we have developed a new two-step in situ polymerization method. The special focus was to obtain the PANI/ZnO synergistic effect in PANI/ZnO-based multiphase composites, which boosts photocatalyst properties under the solar irradiation. To achieve these goals, we were required to prepare the conductive PANI salt after which in situ polymerization of photocatalyst was carried on. Please note that by modifying the polymerization conditions, various structures of PANI oligomers/polymers in photocatalysts were obtained. The efficiencies of the synthesized PANI/ZnO-based photocatalysts were evaluated by the degradation of AB 25 organic dye, which is a common pollutant in industrial wastewater.

2. Results and Discussion

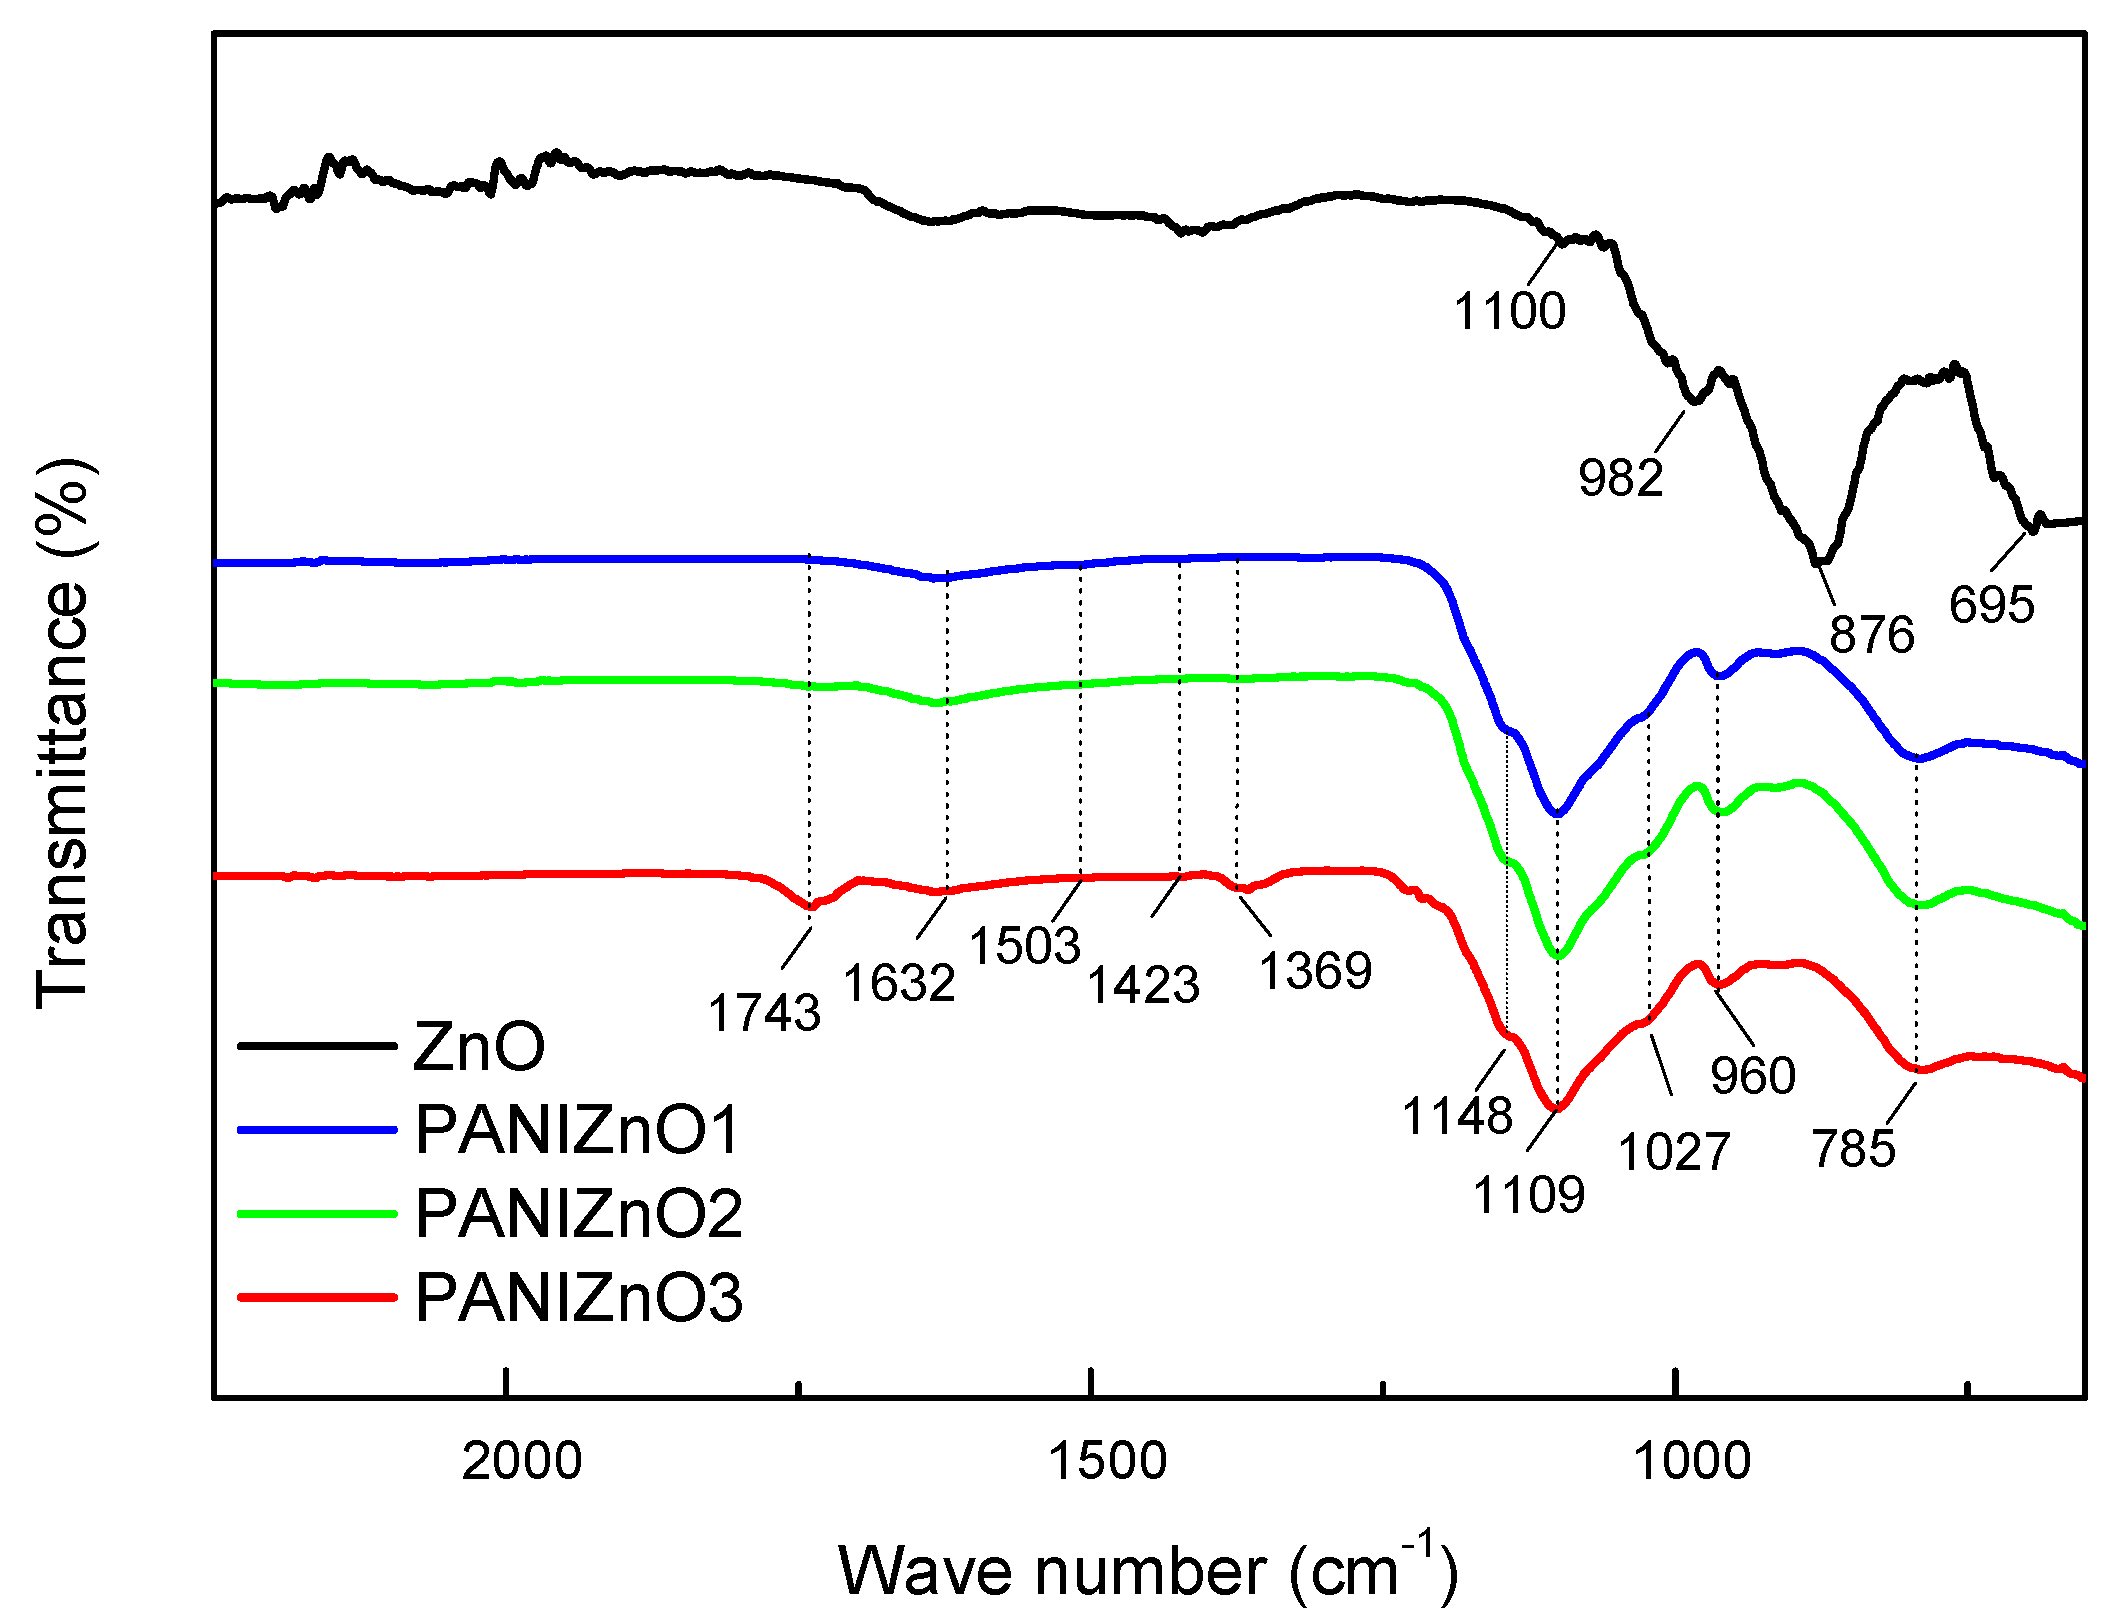
2.1. Analyses of FTIR Spectra

Figure 1 displays FTIR spectra of PANI/ZnO composite photocatalysts obtained from C dispersions of final pH ≈ 5. According to literature sources ([23]), PANI base (Scheme 3) is characterized by typical C=N, C=C, C–N, and C–H vibration peaks that are positioned at 1590, 1507, 1305, and 1146 cm−1. On the other hand, the same vibrations in the case of PANI salt (Scheme 3) are usually positioned at 1577, 1482, 1307, and 1148 cm−1 [23]. As specified above, PANI was prepared in two steps, i.e., at pH 2 and pH ≈ 5, which suggests that both PANI phases (i.e., salt and base form) are present in the prepared composites.
However, due to the presence of ZnO particles, the typical PANI C=N bond has been shifted from 1590/1577 to 1632 cm−1 (Figure 1). Furthermore, the same shift yet more prominent is observed for the C–N bond as it is shifted from 1305/1307 to 1369 cm−1. These shifts of C–N and C=N bonds suggest that zinc from ZnO interacts with N which is a part of PANI skeleton. According to the literature sources, zinc forms a stable Zn-aniline complex (i.e., Zn–N bond) that weakens C–N bond in aniline [24]. Thus, it is safe to say that Zn–N interactions can weaken C–N and C=N bonds in PANI/ZnO composite photocatalysts (Figure 1). Furthermore, C–N vibration at 1369 cm−1 can also be attributed to both C–N stretching in phenazine ring [23] and in the aniline oligomers [25].
On the other hand, C=C vibration at 1503 cm−1 in Figure 1 corresponds well to PANI base C=C vibration at 1507 cm−1. This observation correlates to work by Lee-Thrope et al. [26] as the authors presented that substitution of various cations did not have any significant impact on C–H vibrations in metal-aniline complexes. However, a weak C–H vibration at 1148 cm−1 in PANI/ZnO composite can be associated with vibrations of the charged polymer Q=NH+−B or polaron B−NH+•−B units (Figure 1) [23]. The intensity of this vibration is almost the same for all composites and it confirms the presence of PANI salt. Although composites were stirred up to 120 min in suspension C, PANI salt remained in the composites, since in order to de-dope it, one usually has to apply NH4OH solution (Scheme 3) [22,27].
FTIR spectra (Figure 1) also reveal vibrations at 1109 and 960 cm−1 that can be assigned to the stretching of sulfate-ions [22,28], which is expected due to the application of APS [13] (see Scheme 2). Next, a weak shoulder at 1027 cm−1 shows S=O stretching vibration mode, which confirms the presence of HSO4/SO42− counter-ions (Scheme 2) that are required to maintain the PANI electroneutrality [29,30]. Vibration at 785 cm−1 is ascribed to the presence of aniline oligomers [25] and to the out-of-the-plane monosubstituted aromatic rings [31].
From the detailed inspection of FITR spectra (Figure 1) it can be concluded that both PANI salt and base phases are present in the prepared composites. As PANI base and salt are detected by FTIR, we decided to conduct a UV/Vis study of the prepared PANI/ZnO composites.

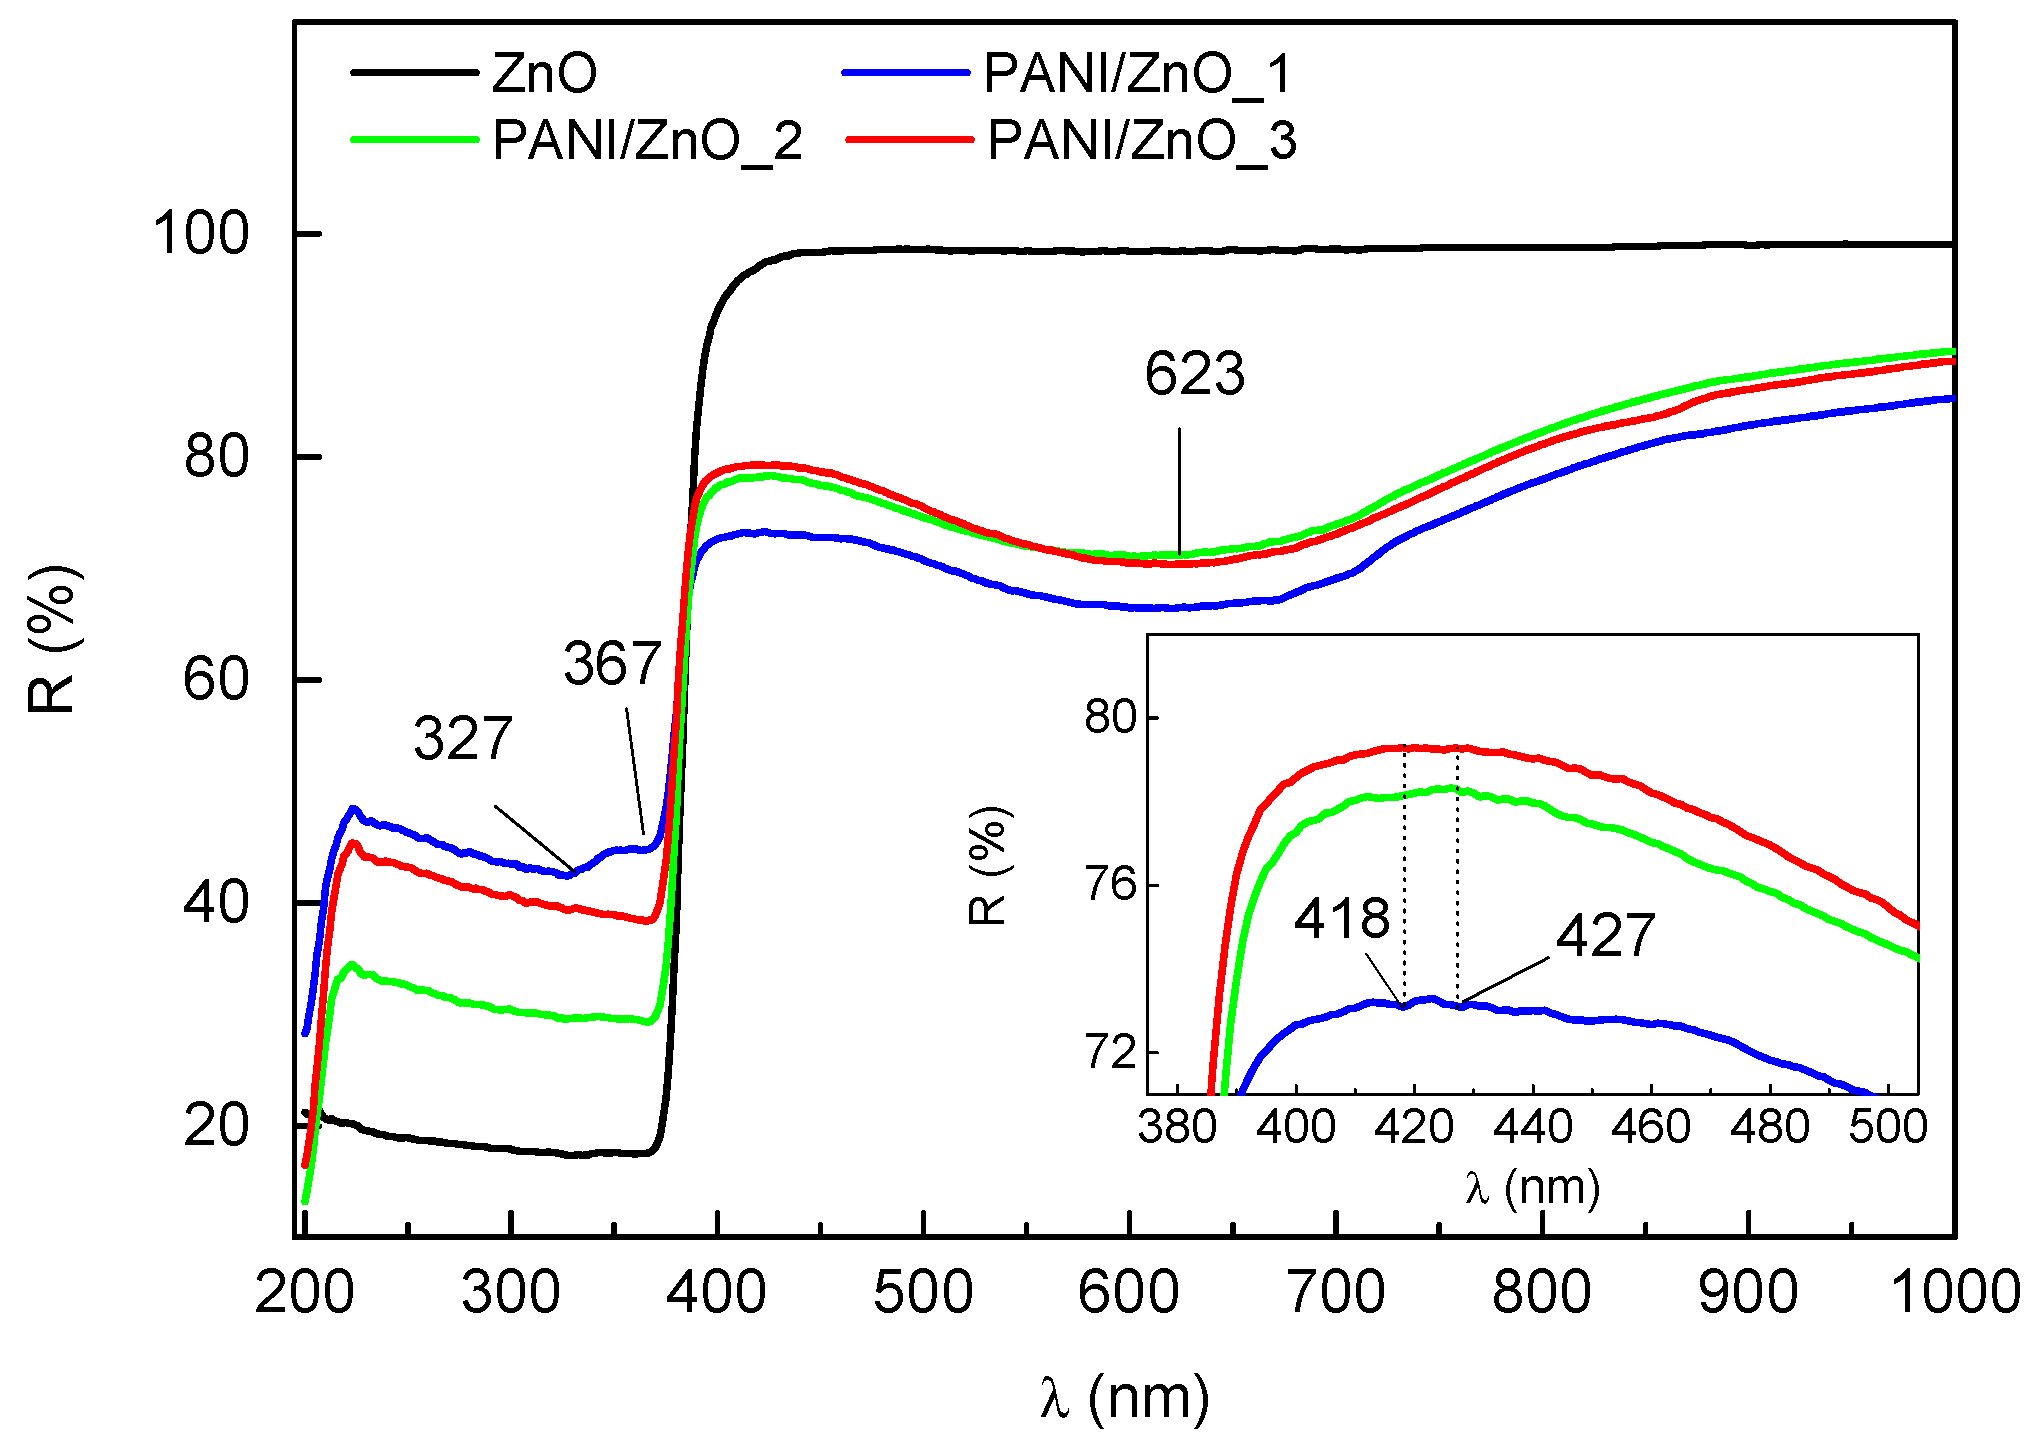
2.2. UV/VIS Analysis

The UV/VIS spectrum of pure ZnO in UV region (Figure 2) shows a high absorption, which starts to decrease after 367 nm. In the region >400 nm, the pure ZnO reflects all incoming irradiation, whereas PANI/ZnO composites absorb up to ≈ 30% of irradiation. Next, according to Figure 2, PANI/ZnO_1 absorbs the highest portion of Vis (>400 nm) irradiation, which can be assigned to the highest doping level of PANI. However, in the region up to 367 nm, it appears that PANI/ZnO_2 absorbed the highest portion of irradiation. Additionally, bandgap values of ZnO were extracted from ( α h ν ) 2   vs .   h ν curves (not shown) and displayed in Table 1.
PANI base is typically characterized by two separate absorption bonds located between 315–345 nm and 610–650 nm [32]. Spectra of the PANI/ZnO samples (Figure 2) confirmed the presence of the PANI base by two separate bonds around 327 and 623 nm for all samples. Furthermore, absorption bonds of low intensity around 418 and 427 nm (Figure 2 inset) are typical for the PANI salt, which is usually characterized by absorption between 400 and 435 nm [32]. The presence of PANI salt is of the utmost importance for the PANI/ZnO synergistic effect, which enhances composites’ photocatalytic activity (Scheme 1).

2.3. Conductivity of PANI/ZnO Composites
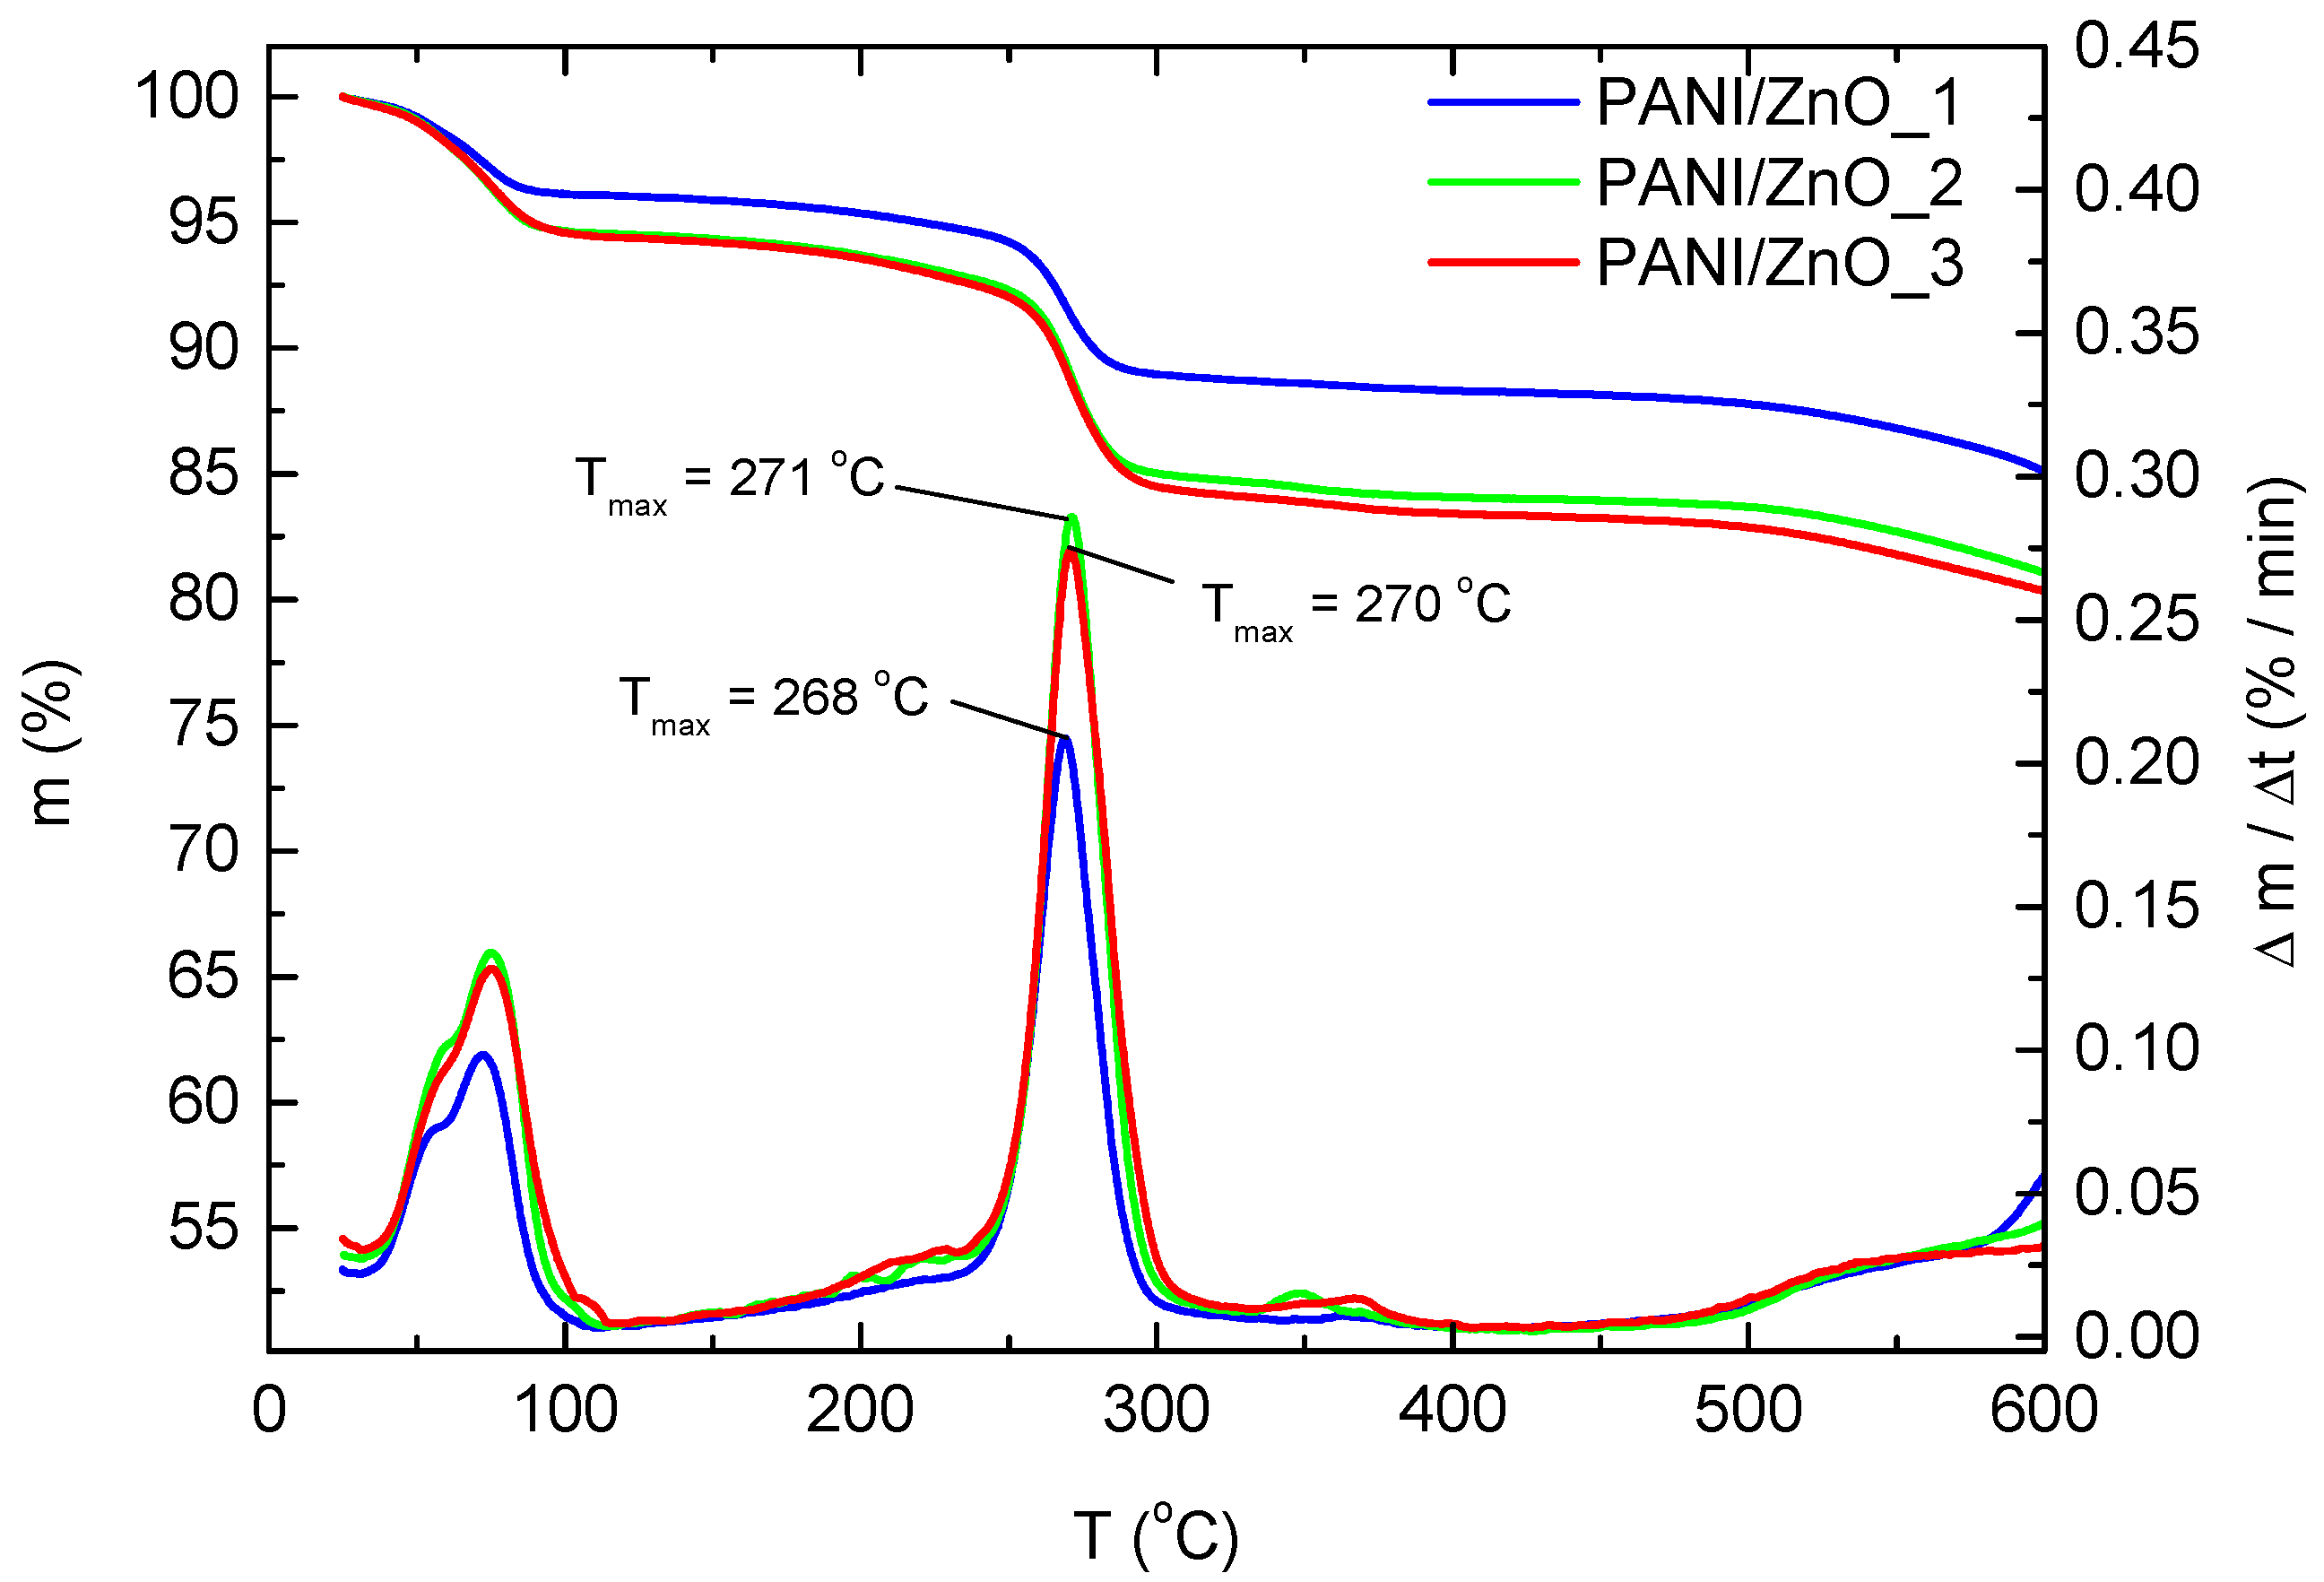
PANI/ZnO samples conductivity (Table 2) was computed by using both the four-point method and Equations (3) and (4). It follows that the conductivity of the pure ZnO sample is the lowest one (2.955 10−7 S cm−1), whereas the PANI/ZnO sample’s conductivity (≈ 2.5 10−5 S cm−1) is larger by two orders of magnitude due to the presence of the conductive PANI salt (Table 2). However, the conductivity values of PANI/ZnO samples are similar and they do not imply any trend. Nevertheless, the higher conductivity of PANI/ZnO composites (vs. pure ZnO) indicates the presence of a conductive polymer which is essential for PANI/ZnO synergistic effect.

2.4. TG Analyses

Thermogravimetric (TG) analysis is a very suitable technique to examine the amount and stability of PANI in the prepared PANI/ZnO composites (see, e.g., [10,11]). In order to obtain a more detailed insight, TG measurements were conducted in a nitrogen atmosphere. The PANI/ZnO weight loss was monitored from 25 to 600 °C (Figure 3). According to Figure 3, there are three distinguishing temperature regions that occur frequently when investigating PANI/ZnO (and TiO2 [11,33]) composites [10]. The first temperature region (0–120 °C), i.e., the first maximum, can be attributed to the water removal, which is expected, as several papers reported ingress of water during PANI oxidation [29,34] and water incorporated in zinc salts. Figure 3 also indicates that the water content is the highest in PANI/ZnO_3, which can be explained by the fact that this composite consists of the highest portion of organic matter (Table 3).
Furthermore, the second temperature region (200–380 °C) can be attributed to the removal of the aniline oligomers that are usually obtained when aniline oxidation (by APS) is conducted from circumneutral pH [13,31]. The portion of the oligomers is the highest in the case of PANI/ZnO_2 and PANI/ZnO_3 due to the prolonged time of synthesis. Moreover, it appears that the oligomers’ thermal stability increases (see peaks at 268, 270, and 271 °C) with an increase in their molecular size (Figure 3). However, in this region, i.e., up to 250–300 °C, both PANI salt and base show good thermal stability [28]. Finally, the third temperature region (500–600 °C) reveals the PANI chain’s presence. According to the literature sources, the PANI base starts to decompose after 480 °C under the N2 atmosphere [22,27]. Therefore, Figure 3 clearly demonstrates that the portion of PANI in PANI/ZnO composites increases with the polymerization time (Table 3), a conclusion that correlates to the results [22,27] obtained from measurements in N2 atmosphere.
It should be mentioned that TG can also be used to obtain data related to stability of the composite during the photocatalytic degradation. To be precise, exposure of PANI/ZnO to the solar irradiation produces radicals that degrade the dye (Scheme 1), but they also could degrade PANI in the composites. However, in our previous work [11], we used TG to analyze the PANI-based photocatalyst composite and we showed that the radicals (obtained during solar treatment) did not degrade PANI in the composite. This specific property of PANI-based photocatalyst composite was assigned to the high chemical stability of PANI; and thus, this kind of test was not conducted in this work.

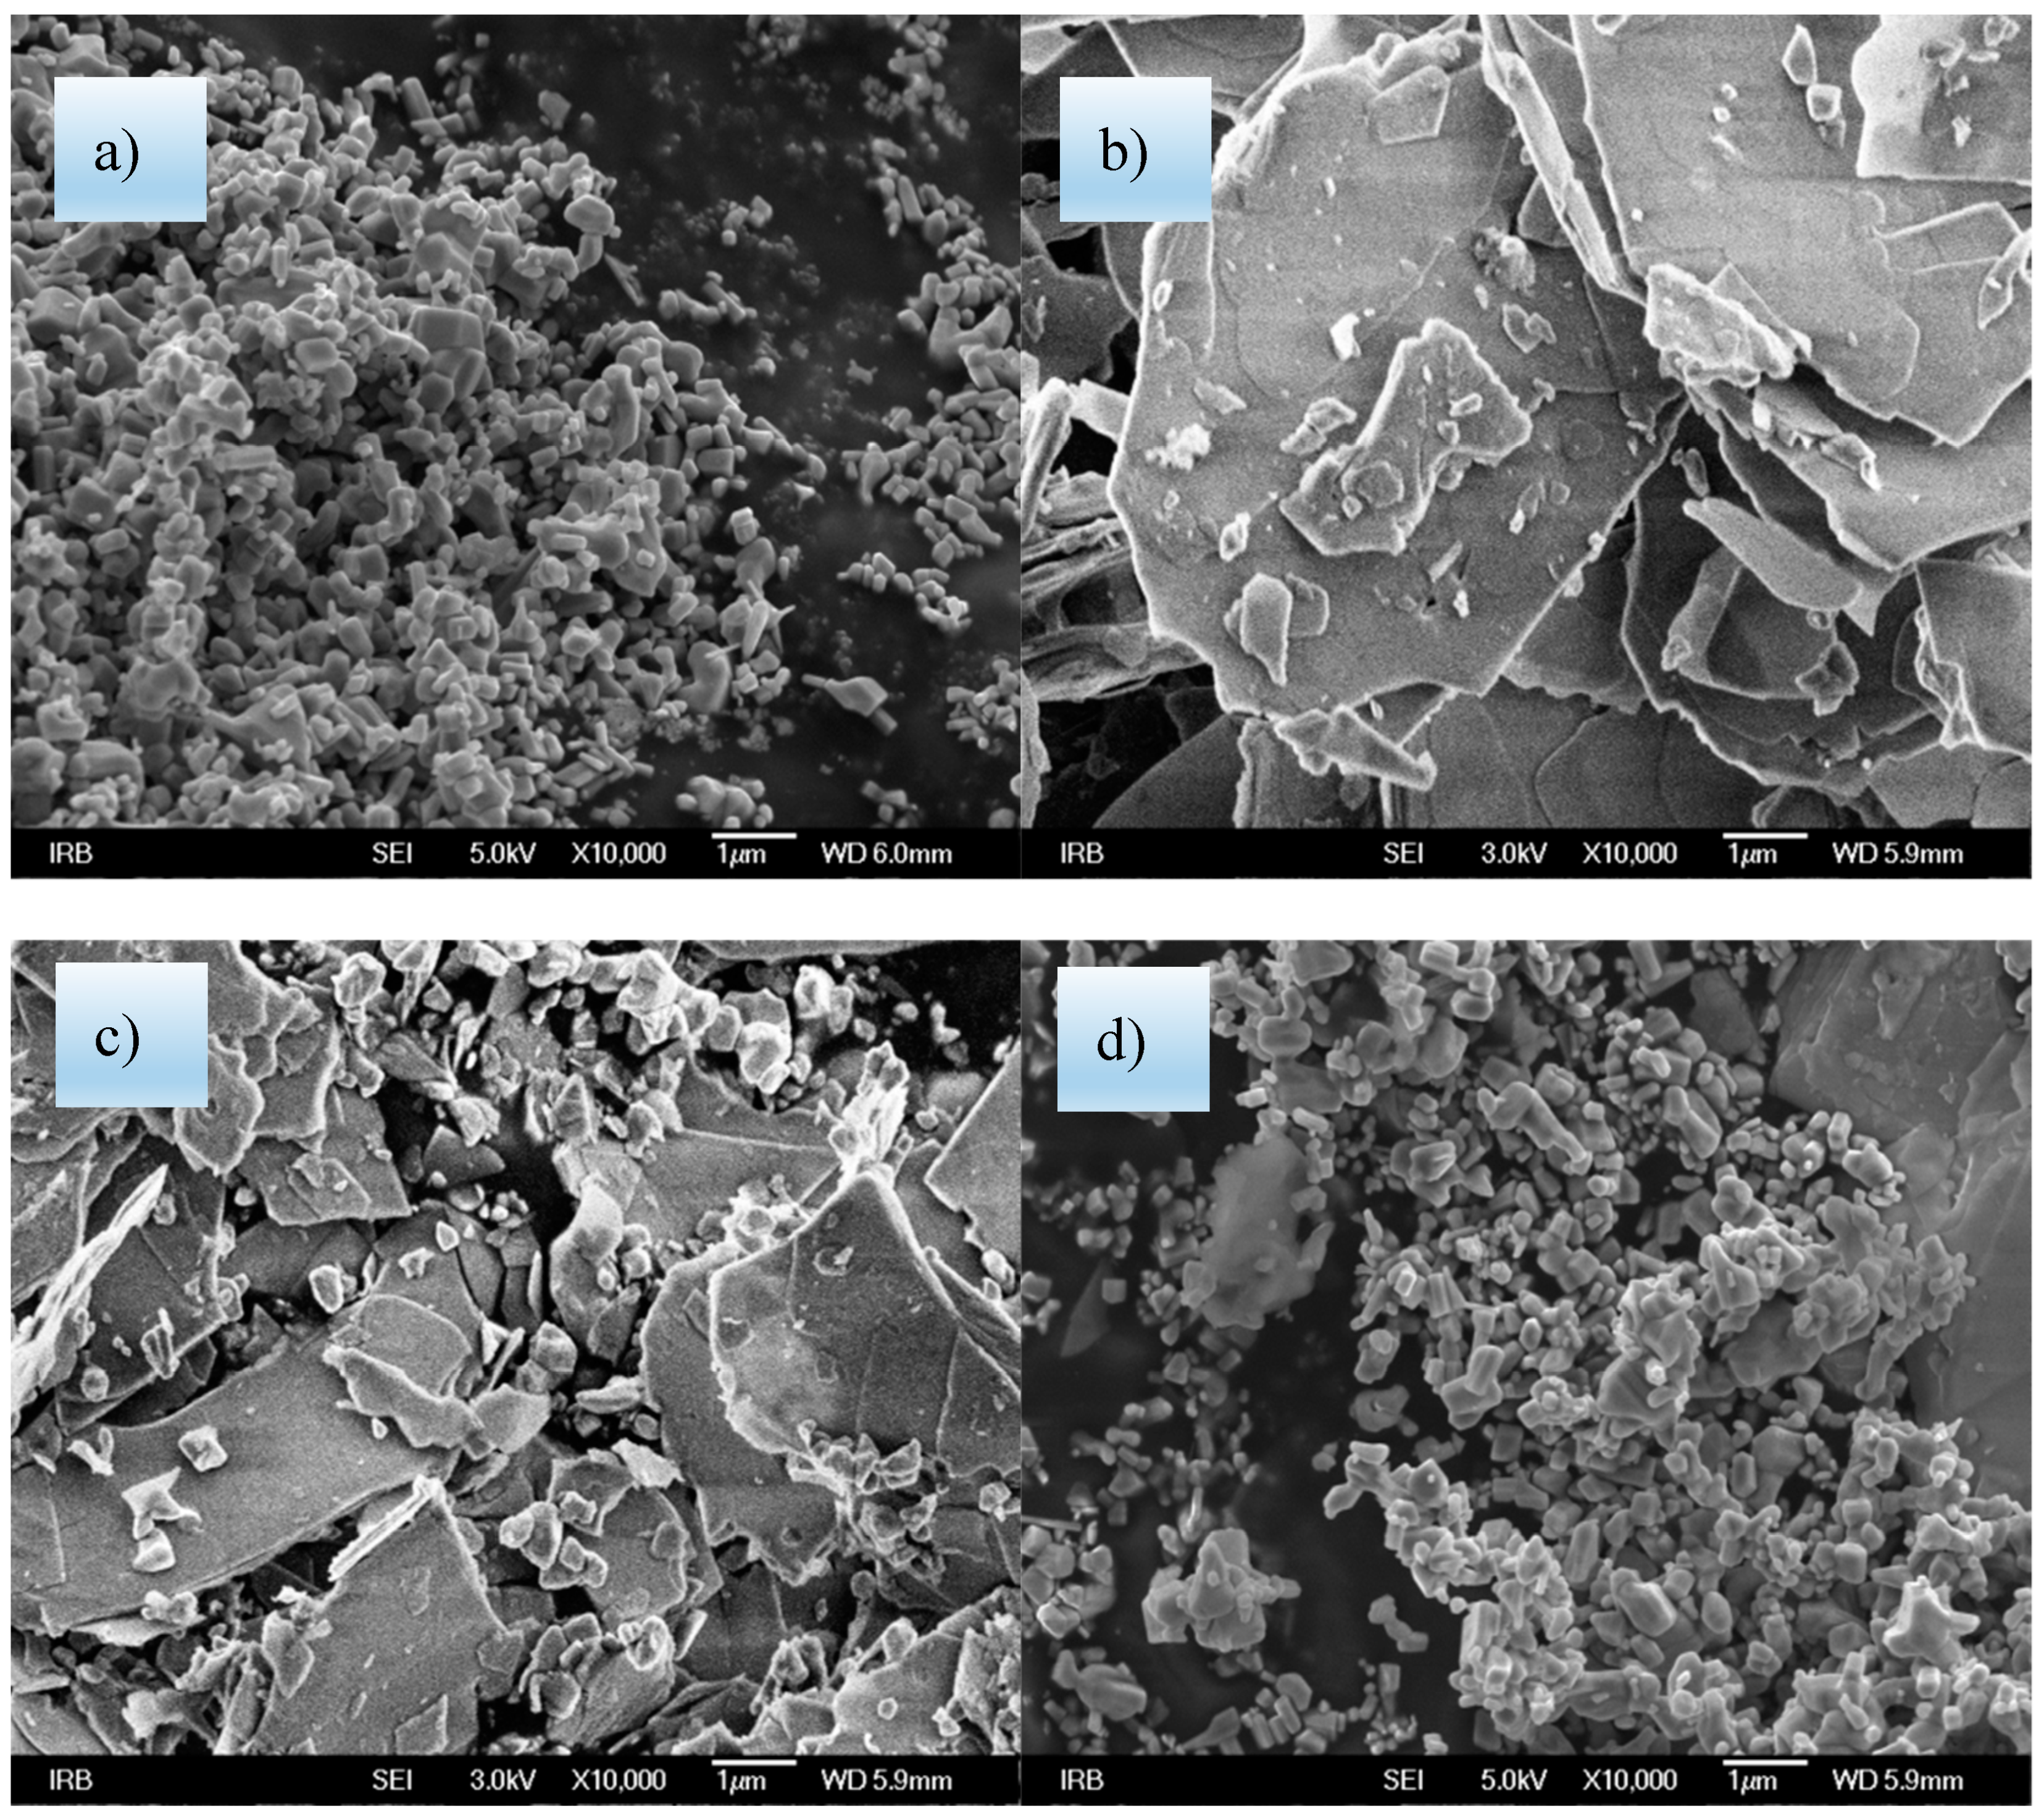
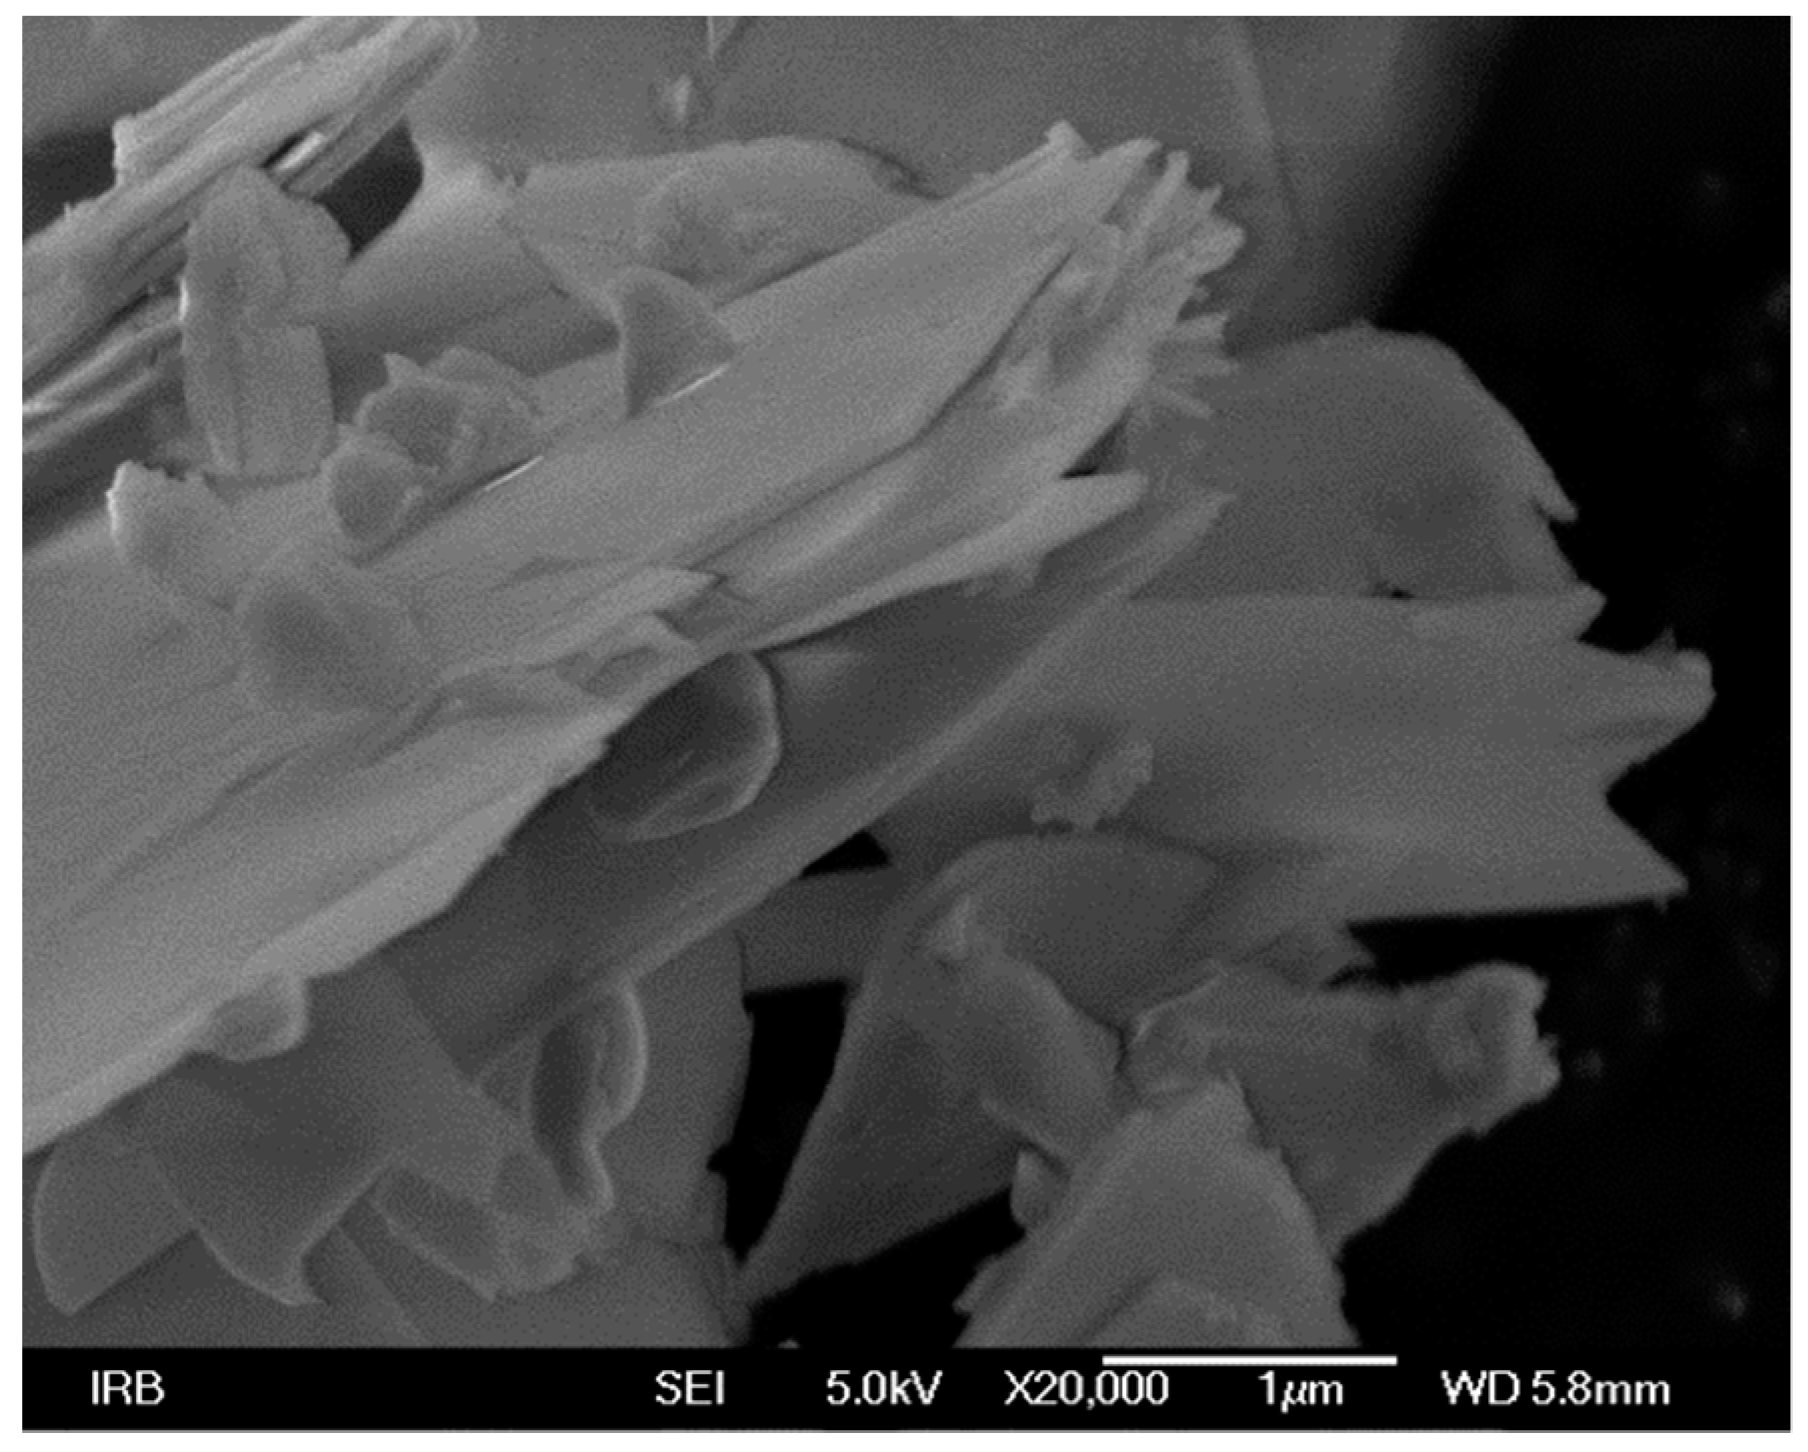
2.5. FE-SEM Analysis
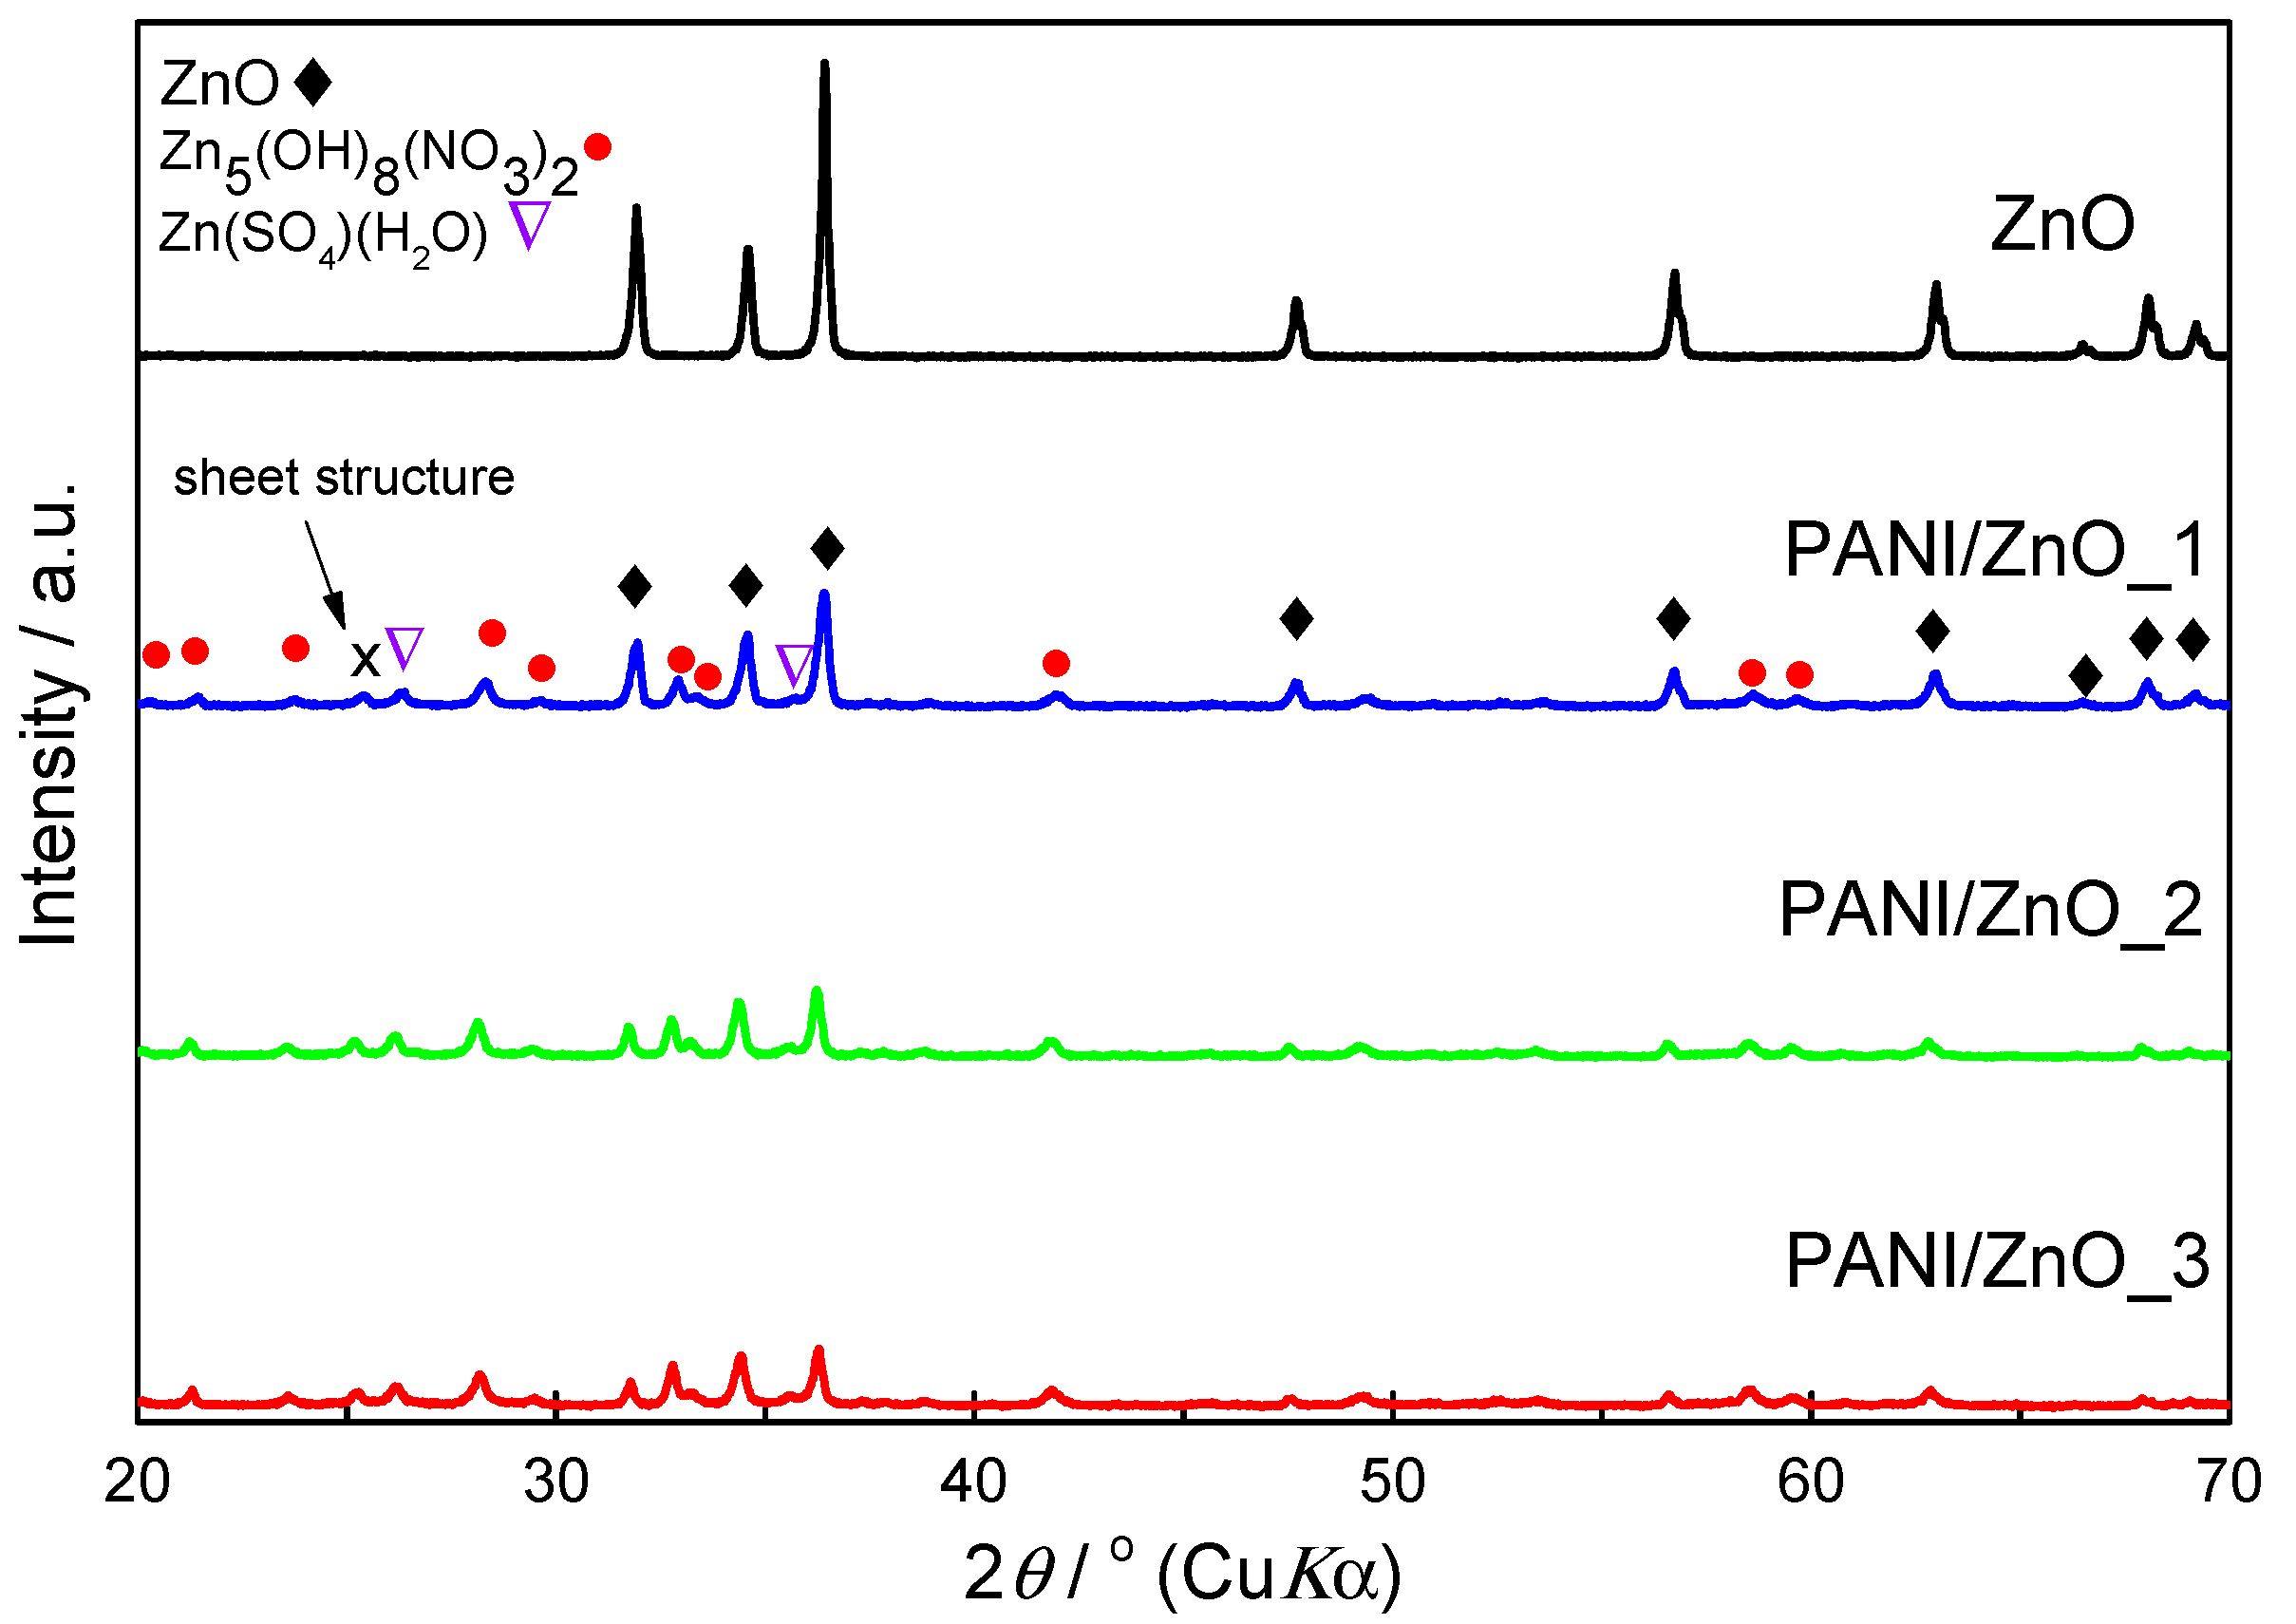
Figure 4 shows different morphologies of ZnO and PANI/ZnO photocatalysts. The size of ZnO particles is between 750 and 1000 nm (Figure 4a) which corresponds to the supplier’s specification. An inspection of Figure 4b clearly indicates that ZnO particles are encapsulated in PANI/ZnO_1 sheet/lamellar formation. It should be stressed that the presence of ZnO particles in Figure 4d clearly indicates that ZnO particles were not dissolving during in situ polymerization. Furthermore, the sheet formation was also observed by Zujović et al. [31] when they applied APS to oxidize aniline at pH 7. The authors concluded that the sheets were formed by periodical π–π stacking of oligomers, which is expected as non-protonated oligomers are subject to the self-organization [35].
Next, FE-SEM images of the studied PANI/ZnO samples indicate the reduction in the particle size with a prolonged synthesis time (Figure 4b–d). The lamellar structure of PANI/ZnO_1 composite (Figure 4b) was probably assembled by π–π stacking of small oligomers that were formed by ortho and para coupling of the aniline monomers [31]. However, as the oligomer’s molecular mass increases, the parts of adjacent oligomers’ molecules of similar electron density are placed in close proximity, which makes π–π stacking energetically less favorable [36]. Therefore, as the synthesis continues, the sheet structures become less energetically favorable, which consequently results in the formation of smaller composite particles (see Figure 5).
At this stage of the study, we can offer a possible mechanism of PANI/ZnO formation. Firstly, as ZnO was added into the acidic Suspension A, a freshly prepared PANI salt promptly encapsulated ZnO, which formed an inner composite shell (Scheme 5). Secondly, π–π interactions between the aniline oligomers of small molecular mass stared to form PANI/ZnO sheets (Figure 4b). And finally, due to an increase in the oligomers’ molecular mass, π–π stacking was no more energetically favorable, which resulted in the formation of PANI/ZnO composites of smaller size (Figure 4c,d).

2.6. XRD Analysis

The XRD pattern of the pure ZnO sample (Figure 6) shows a single crystalline phase that is typical for zincite (PDF card number: 01-080-0075). On the other hand, the PANI/ZnO-based multiphase composites are characterized by two additional phases; i.e., Zn5(OH)8(NO3)2·2H2O (PDF card number: 00-024-1460) and Zn(SO4)(H2O) (PDF card number: 00-001-0621). In PANI/ZnO samples, ZnO is a dominant phase. However, a moderate increase in Zn5(NO3)2(OH)8·H2O phase can be detected as the ratio of intensities of the diffractions lines 002 of Zn5(NO3)2(OH)8·H2O located at 2 θ ≈ 32.5°, and 002 of ZnO, located at 2θ ≈ 34.4° of PANI/ZnO_1:_2:_3 samples is 0.54:1:1 (Figure 6). An increase in this phase can be assigned to the presence of Zn2+, which originates from the fact that ZnO was added into the acidic homopolymerization suspension. Furthermore, XRD patterns show a slight increase in the background, which can be assigned to the amorphous organic phases in PANI/ZnO samples (Table 3).
Interestingly, XRD patterns display several additional features related to in situ aniline oxidation in the presence of ZnO. Namely, as APS was applied as an oxidative agent, NH4+ and SO42− were released into the polymerization dispersion. Then, NH4+ was oxidized to NO3, which consequently yielded Zn5(OH)8(NO3)2·2H2O phase. Additionally, the occurrence of this phase is expected, as it can be prepared by using ZnO and Zn(NO3)2 [37]. At the same time, the presence of SO42− resulted in the formation of Zn(SO4)(H2O) phase. XRD data also reveal one weak diffraction maximum at 25.27°, which cannot be assigned to either one of the phases, ZnO, Zn5(OH)8(NO3)2·2H2O or Zn(SO4)(H2O). As the usual π-stacking distance is 3.4–3.6 Å [36], the diffraction maximum at 25.27° (which corresponds to d-value 3.5211 Å) can be related to sheets/lamellar structures in Figure 4b. A similar conclusion was obtained by Zujovic et al. [31]; i.e., they assigned diffraction maximum at 25.6° to periodicity that was parallel and perpendicular to the PANI chain.

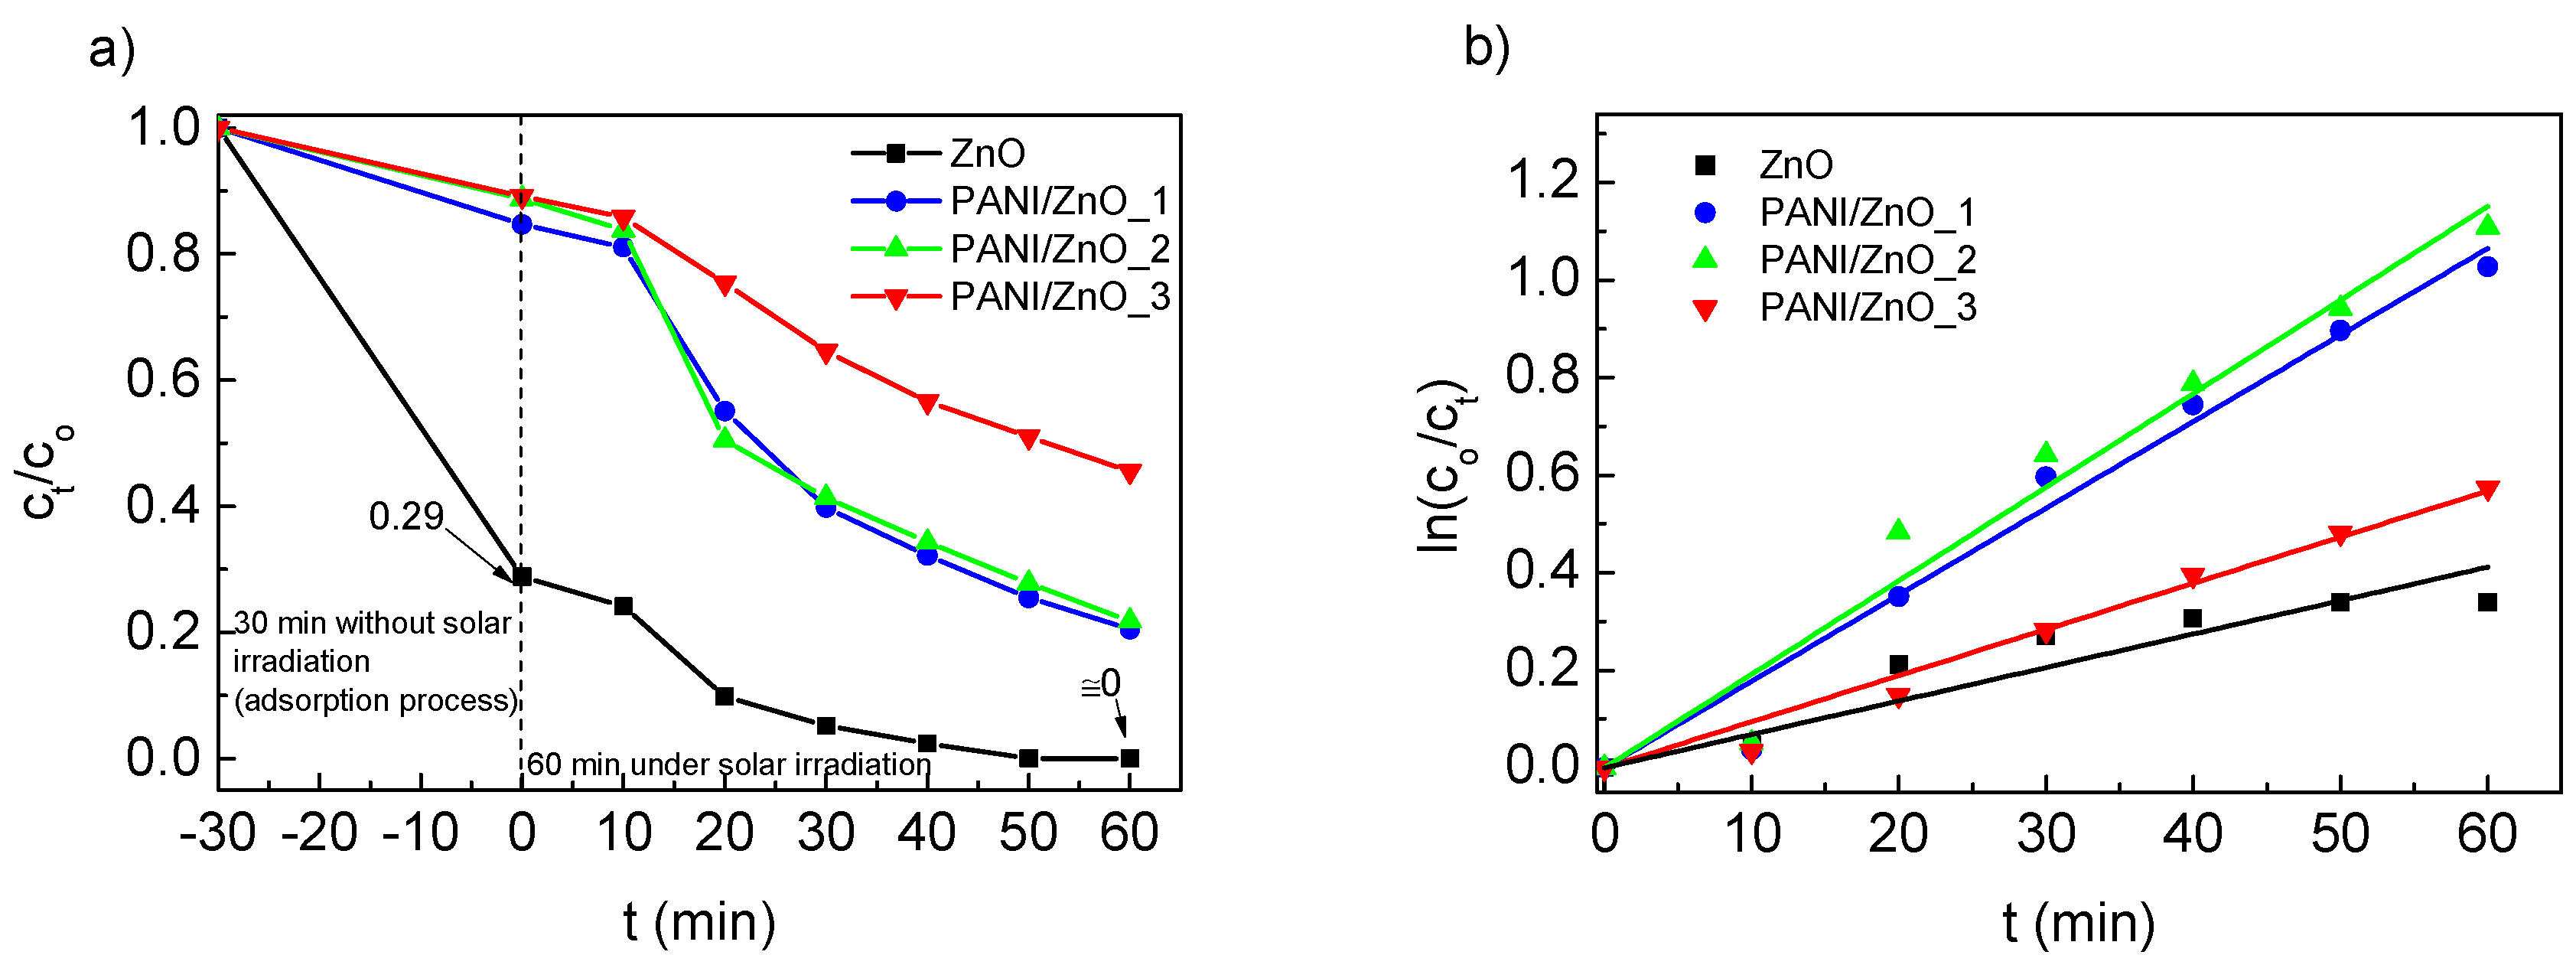
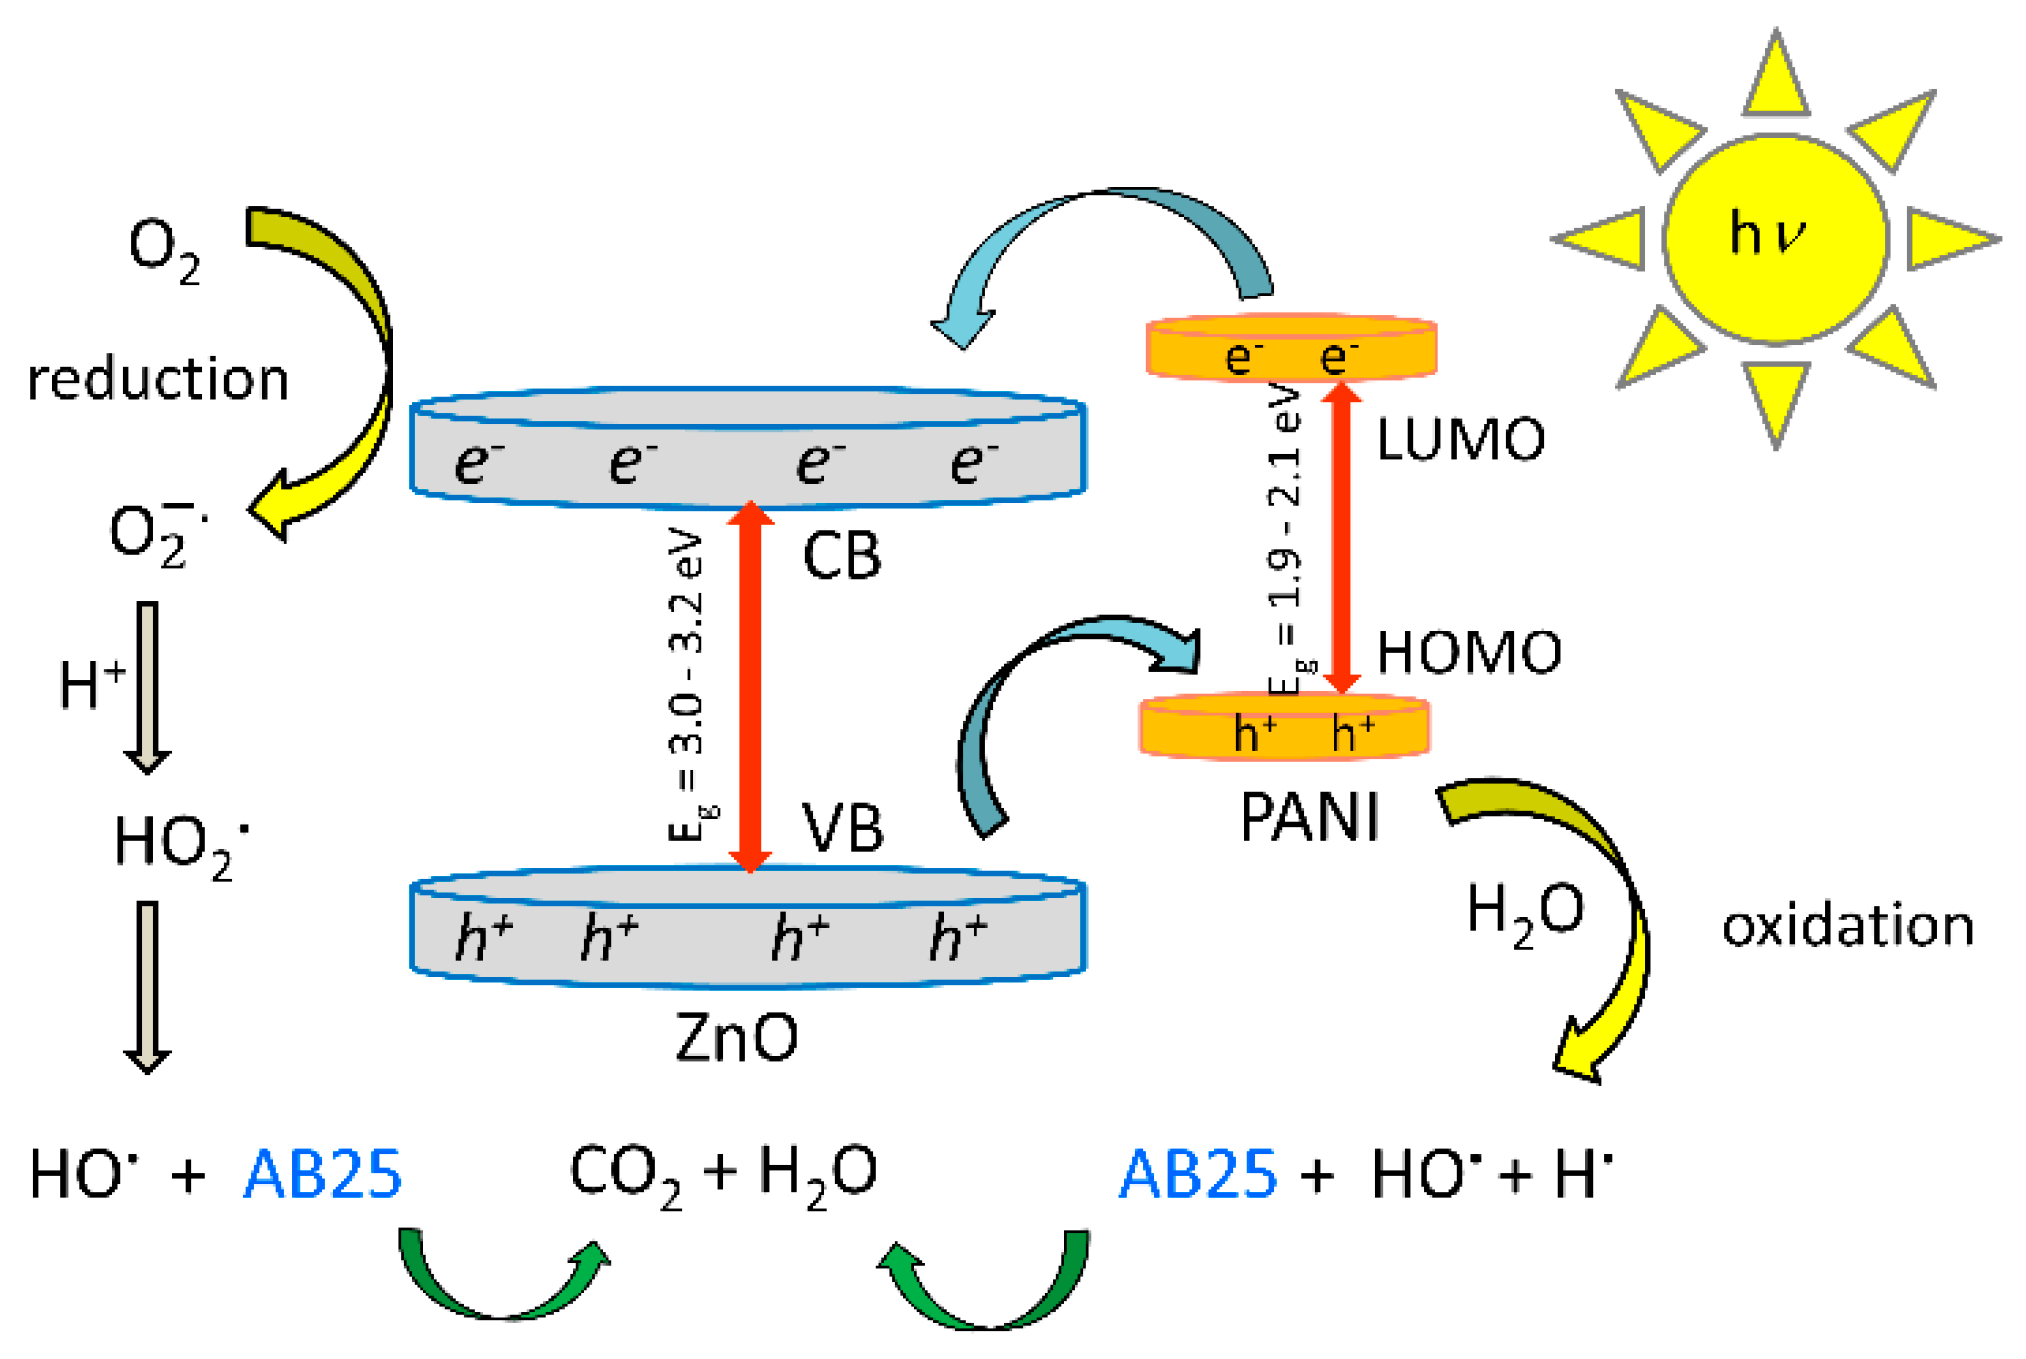
2.7. Photocatalytic Degradation of AB 25

The photocatalytic efficiency of ZnO and PANI/ZnO catalyst samples (1 g/L) was evaluated by monitoring the concentration of AB 25 dye (30 mg/L) in water during simulated solar irradiation. The AB 25 concentration value used here is the one which is routinely employed in this kind of investigation; and thus, we have continuously applied it in our studies [10,11]. The whole procedure was described in detail when PANI/ZnO and PANI/TiO2 composite photocatalysts were investigated [10,11]. Herein, the pH of the suspensions was adjusted (pH = 7) to avoid any additional ZnO dissolution.
The photocatalysts’ results (Figure 7a) clearly present that after 30 min without irradiation (i.e., adsorption process), pure ZnO catalyst adsorbed ≈ 71% (1.00–0.29) of the dye, whilst during 60 min of solar irradiation only ≈ 29% (0.29–0.00) of the dye was removed. These experiment shows that ZnO mainly removed the dye by the adsorption process, whilst the AB 25 degradation process was less pronounced. On the other hand, only ≈ 10%–15% of AB 25 was adsorbed on PANI/ZnO composites’ photocatalysts surface, whereas the majority of the dye was removed during the solar treatment. This clearly indicates that the presence of PANI in the composites boosted the degradation of the dye under solar irradiation. However, particularly efficient photocatalysts activities were observed for the PANI/ZnO_1 and PANI/ZnO_2.
Furthermore, PANI/ZnO_3 exhibited the lowest photocatalytic performance as it removed only 44% (0.54–0.10) of the dye after 60 min of the solar irradiation. Its lower photocatalytic activity is explained by the higher concentration of PANI in the composite, which hinders the dye’s diffusion and blocks the solar irradiation. In addition, the formation of smaller lamella particles composed of π–π stacked oligomers and ZnO (Figure 5) reduced the PANI/ZnO synergistic effect that decreased PANI/ZnO_3 photocatalytic activity under the solar irradiation.
To elucidate the photocatalytic efficiency of PANI/ZnO composite catalysts under solar irradiation, the apparent rate constant (kapp) has been determined by using the Langmuir-Hinshelwood equation [38]:
ln ( c 0 c t ) = k a p p t ,
where, kapp, t, c0, and ct are apparent rate constant, time, and dye concentration at the start and after some time of exposure to solar irradiation. The results are presented in Figure 7b, and in Table 4 and it can be seen that PANI/ZnO_2 yielded the highest kapp value (0.0192 min−1), whilst this value was the lowest in the case of pure ZnO. This clearly confirms that ZnO’s photocatalytic ability under solar irradiation was lower than that of ZnO-based multiphase composite photocatalysts.
Next, the higher kapp value obtained by PANI/ZnO_2 (vs. PANI/ZnO_1) sample can be attributed to the more pronounced impact of the PANI/ZnO synergistic effect. However, in order to obtain the PANI/ZnO synergistic effect (Scheme 1), PANI has to be in the conductive salt form (see, e.g., [11]). It should be emphasized that only a composite of the optimal size in which PANI salt is in contact with both ZnO and the dye can experience the full PANI/ZnO synergistic effect (Scheme 1). Therefore, better photocatalytic properties of PANI/ZnO_2 (vs. PANI/ZnO_1) are explained by a smaller particle size that enabled a contact of PANI salt with both ZnO and the dye.

3. Experimental

3.1. Materials

Zinc oxide (ZnO, Sigma-Aldrich, Saint Louis, MO, USA), powder, particle size < 1000 nm, (see Figure 4a); aniline (An, 99%, Morris Plains, New Jersey, USA); ammonium persulfate (APS, (NH4)2S2O8, Morris Plains, New Jersey, USA); and sulfuric acid (H2SO4, 96%, Kemika, Zagreb, Croatia) were applied to synthesize composite photocatalysts. The solution of organic dye C.I. Acid Blue 25 (AB 25, Ciba-Geigy, Basel, Switzerland) was applied as the model wastewater. Ultrapure water of the low conductivity < 1 μS cm−1 from the Merc Millipore Direct-Q3 UV water purification system (Merc KGaK, Darmstadt, Germany) was used for aqueous solutions.

3.2. Samples Preparation

Polyaniline/ZnO-based (PANI/ZnO) multiphase composite photocatalysts were synthesized by a newly proposed in situ polymerization in two steps. The first step of the method was PANI homopolymerization initiated by adding 5 mL of APS solution into 20 mL acidic aniline solution, which resulted in 25 mL of Suspension A (pH = 2). The ratio of [aniline] vs. [APS] was 1.25 (Table 5), which is a common practice when preparing PANI [23]. After 60 min of stirring, the Suspension A consisted of (i) freshly prepared PANI salt, (ii) the aniline oligomers, and (iii) unreacted aniline and APS leftovers.
The second step, i.e., in situ PANI/ZnO polymerization, was commenced by adding 25 mL of ZnO suspension (i.e., suspension B (ZnO suspension was stirred/stabilized for 15 min prior to adding to the Suspension A.)) into Suspension A, which yielded Suspension C (50 mL), which was stirred for different durations. Please note that a small ZnO portion was dissolved as the pH of the resulting suspension (vs. homopolymerization suspension) was increased (from 2 to 5). Interestingly, according to FE-SEM images (see Figure 4), ZnO particles were not additionally dissolved during in situ polymerization. It must be stressed out that the only difference in composites (i.e., PANI/ZnO_1, PANI/ZnO_2, and PANI/ZnO_3) was the stirring time (30, 60, and 120 min) of Suspension C. Subsequently, the prepared composite photocatalyst samples were washed several times with H2O, separated by centrifuge, and left for 24 h in 60 °C to dry.

3.3. Sample Characterization

FTIR spectrometer (Perkin-Elmer Spectrum One FT-IR Shelton, CT, USA) with an attenuated total reflection accessory (ATR with ZnSe diamond crystal) in reflection mode was used to obtain spectroscopic data. The FTIR spectra (650–4000 cm−1) were recorded with a resolution of 4 cm−1.
UV/Vis spectra were collected by a Shimadzu (UV-3600) spectrometer, form Shimadzu Corporation (Tokyo, Japan), with the integrated sphere. As the reference material, we applied barium sulfate.
To study the morphology of the PANI/ZnO composite photocatalysts, FE-SEM (JSM-700F) from JEOL Ltd., Akishima, Japan was used.
Powder samples were characterized by XRD at room temperature by using a Philips PW 1820 (Philips, Almelo, Netherlands) counter diffractometer with monochromatized CuKα radiation (graphite monochromator) in Bragg–Brentano geometry. XRD patterns were recorded in the 2θ range from 20 to 70°, scanned in steps of 0.02° (2θ), with the counting time 1 s per step.
Thermogravimetric (TG) analyses were performed by using a Q500 analyzer (TA Instruments, New Castle, DE, USA). Recording conditions were a nitrogen atmosphere (40 mL / min) and a heating rate of 10 °C/min from 23 °C to 600 °C.
We applied a four-point probe method (34461 61/2 Digit Multimeter, Keysigiht, Santa Rosa, CA, USA) to collect the conductivity of PANI/ZnO composite photocatalysts. To calculate the electrical resistance, we applied the following term:
ρ = ( 2 π dR ) / ln 2 ,
where, R is the electrical resistance (Ω), ρ is the specific electrical resistance (Ω cm), and d is the thickness of tested pastilles samples (cm). The electric conductivity (κ/S cm−1) was determined by using:
κ =   1 / ρ .
Photocatalytic properties of PANI/ZnO were studied by observing the photodegradation of AB 25 dye after we turned on a solar irradiation simulator (Osram XBO 450 W lamp, Oriel Instruments, Irvine, CA, USA). The following procedure was applied. First, 50 mg/L of the PANI/ZnO composite was added into 50 mL aqueous solution of AB 25 (30 mg/L), which was tuned to pH 7. Second, this suspension was stirred in the dark for 30 min in order to obtain the equilibrium between adsorption and desorption of the dye. Third, photocatalysis processes (total 60 min) were initiated by using a horizontal lamp-sample (25 cm distance). Forth, one aliquot was sampled each 10 min and was filtered by Chromafil XTRA RC (25 mm, 0.45 micron, Macherey-Nagel, Düren, Germany) filters. The dye’s concentration was determined by UV/Vis spectroscopic measurements at 622 nm by using a Perkin Elmer Lambda EZ 201 spectrophotometer (Perkin Elmer, Shelton, CT, USA). Finally, the results were displayed in terms of the remaining AB 25 after the exposure to irradiation according to:
C o l o r = ( A 0 A t ) A 0 · 100 % ,
where At and A0 are adsorption values at t = t and t = 0.

4. Conclusions

The findings herein showed that PANI/ZnO-based multiphase composite photocatalysts, prepared by a new proposed in situ polymerization method in two steps, demonstrated the PANI/ZnO synergistic effect. The proposed approach enabled the formation of PANI salt, which was essential to establishing the PANI/ZnO interactions that yielded PANI/ZnO’s synergistic effect.
The conductivity measurements demonstrated that composites have a conductivity two orders of magnitude higher than pure ZnO. This additionally confirms the presence of the PANI salt in the composite samples. It was explained that the PANI/ZnO composite particles were comprised of the inner and outer shells. The inner shell was mainly composed of PANI salt, whilst the outer shell was mostly made of both the aniline oligomers and PANI base. The presence of both PANI forms was proven by FTIR and UV/Vis spectra.
FE-SEM study of the prepared PANI/ZnO photocatalysts presented different morphologies obtained due to variations in molecular structures and molecular sizes of the oligomers/polymers. It was explained that π–π interactions were responsible for the sheet formation. However, an increase in the oligomers mass weakened π–π interactions, which resulted in the lower composite particles size.
The sheets formation was also detected by XRD. It was explained that π-stacking of oligomers induced a diffraction maximum located at 2θ ≈ 25.27o. Additionally, the two additional phases were detected in PANI/ZnO composites which were obtained by side-products of aniline oxidation by APS.
The PANI/ZnO synergistic effect was detected in all composite samples as the apparent rate constant of AB 25 dye removal was higher than the removal rate of pure ZnO. These results confirmed the higher photocatalytic efficiency of composite samples (vs. ZnO) under the solar irradiation. The PANI/ZnO_2 composite yielded the highest removal rate (0.0192 min−1), due to the optimal particle size, which enabled a PANI salt contact with both ZnO and the dye.

Author Contributions

V.G. and I.Ž. synthesized the photocatalysts and conducted characterization and photocatalysis tasks. T.K. and Ž.S. performed the XRD characterization. M.K.R. performed conductivity measurements of photocatalysts and contributed to the PANI salt and base characterizations. Z.H.-M. proposed and planned the research and supervised the experiment. M.Ž. designed the photocatalysts synthesis and made the FE-SEM images. All the authors collaborated and participated in the writing of the manuscript. All authors have read and agreed to the published version of the manuscript.

Funding

This work has been fully supported by Croatian Science Foundation under the project IP-2013-11-5092.

Conflicts of Interest

The authors declare no conflict of interest.

References

  1. Truppi, A.; Petronella, F.; Placido, T.; Striccoli, M.; Agostiano, A.; Curri, M.L.; Comparelli, R. Visible-Light-Active TiO2-Based Hybrid Nanocatalysts for Environmental Applications. Catalysts 2017, 7, 100. [Google Scholar] [CrossRef]
  2. Schneider, J.; Matsuoka, M.; Takeuchi, M.; Zhang, J.L.; Horiuchi, Y.; Anpo, M.; Bahnemann, D.W. Understanding TiO2 Photocatalysis: Mechanisms and Materials. Chem. Rev. 2014, 114, 9919–9986. [Google Scholar] [CrossRef]
  3. Gobal, F.; Faraji, M. Electrodeposited polyaniline on Pd-loaded TiO2 nanotubes as active material for electrochemical supercapacitor. J. Electroanal. Chem. 2013, 691, 51–56. [Google Scholar] [CrossRef]
  4. Sahu, K.; Rahamn, K.H.; Kar, A.K. Synergic effect of polyaniline and ZnO to enhance the photocatalytic activity of their nanocomposite. Mater. Res. Express 2019, 6. [Google Scholar] [CrossRef]
  5. Senapati, V.A.; Kumar, A. ZnO nanoparticles dissolution, penetration and toxicity in human epidermal cells. Influence of pH. Environ. Chem. Lett. 2018, 16, 1129–1135. [Google Scholar] [CrossRef]
  6. Mudunkotuwa, I.A.; Rupasinghe, T.; Wu, C.M.; Grassian, V.H. Dissolution of ZnO Nanoparticles at Circumneutral pH: A Study of Size Effects in the Presence and Absence of Citric Acid. Langmuir 2012, 28, 396–403. [Google Scholar] [CrossRef]
  7. Singh, D.P. Synthesis and growth of ZnO nanowires. Sci. Adv. Mater. 2010, 2, 245–272. [Google Scholar] [CrossRef]
  8. Lee, S.L.; Chang, C.J. Recent developments about conductive polymer based composite photocatalysts. Polymers 2019, 11, 206. [Google Scholar] [CrossRef] [PubMed] [Green Version]
  9. Gupta, S.; Tripathi, M. A review of TiO2 nanoparticles. Chin. Sci. Bull. 2011, 56, 1639–1657. [Google Scholar] [CrossRef] [Green Version]
  10. Gilja, V.; Vrban, I.; Mandic, V.; Zic, M.; Hrnjak-Murgic, Z. Preparation of a PANI/ZnO Composite for Efficient Photocatalytic Degradation of Acid Blue. Polymers 2018, 10, 940. [Google Scholar] [CrossRef] [PubMed] [Green Version]
  11. Gilja, V.; Novaković, K.; Travas-Sejdic, J.; Hrnjak-Murgić, Z.; Roković, M.K.; Žic, M. Stability and synergistic effect of polyaniline/TiO2photocatalysts in degradation of Azo dye in wastewater. Nanomaterials 2017, 7, 412. [Google Scholar] [CrossRef] [PubMed] [Green Version]
  12. Lin, Y.M.; Li, D.Z.; Hu, J.H.; Xiao, G.C.; Wang, J.X.; Li, W.J.; Fu, X.Z. Highly Efficient Photocatalytic Degradation of Organic Pollutants by PANI-Modified TiO2 Composite. J. Phys. Chem. C 2012, 116, 5764–5772. [Google Scholar] [CrossRef]
  13. Sapurina, I.Y.; Shishov, M.A. Oxidative Polymerization of Aniline: Molecular Synthesis of Polyaniline and the Formation of Supramolecular Structures. In New Polymers for Special Applications; Gomes, A.D.S., Ed.; IntechOpen: Rijeka, Croatia, 2012. [Google Scholar]
  14. Kraljic, M.; Zic, M.; Duic, L. O-phenlylenediamine-containing polyaniline coatings for corrosion protection of stainless steel. Bull. Electrochem. 2004, 20, 567–570. [Google Scholar]
  15. Rokovic, M.K.; Jurisic, A.; Zic, M.; Duic, L.; Schauperl, Z. Manipulation of Polymer Layer Characteristics by Electrochemical Polymerization from Mixtures of Aniline and ortho-Phenylenediamine Monomers. J. Appl. Polym. Sci. 2009, 113, 427–436. [Google Scholar] [CrossRef]
  16. Zic, M. Influence of the OPDA additions on impedance response and on anion exchange property of the modified PANI. J. Electroanal. Chem. 2010, 647, 43–52. [Google Scholar] [CrossRef]
  17. Wang, H.; Lin, J.; Shen, Z.X. Polyaniline (PANi) based electrode materials for energy storage and conversion. J. Sci. Adv. Mater. Devices 2016, 1, 225–255. [Google Scholar] [CrossRef] [Green Version]
  18. Jiang, X.; Setodoi, S.; Fukumoto, S.; Imae, I.; Komaguchi, K.; Yano, J.; Mizota, H.; Harima, Y. An easy one-step electrosynthesis of graphene/polyaniline composites and electrochemical capacitor. Carbon 2014, 67, 662–672. [Google Scholar] [CrossRef]
  19. Cheng, Y.; An, L.; Zhao, Z.; Wang, G. Preparation of polyaniline/TiO2 composite nanotubes for photodegradation of AZO dyes. J. Wuhan Univ. Technol. Mater. Sci. Ed. 2014, 29, 468–472. [Google Scholar] [CrossRef]
  20. Salem, M.A.; Al-Ghonemiy, A.F.; Zaki, A.B. Photocatalytic degradation of Allura red and Quinoline yellow with Polyaniline/TiO2 nanocomposite. Appl. Catal. B-Environ. 2009, 91, 59–66. [Google Scholar] [CrossRef]
  21. Mahanta, D.; Madras, G.; Radhakrishnan, S.; Patil, S. Adsorption of sulfonated dyes by polyaniline emeraldine salt and its kinetics. J. Phys. Chem. B 2008, 112, 10153–10157. [Google Scholar] [CrossRef]
  22. Brožová, L.; Holler, P.; Kovářová, J.; Stejskal, J.; Trchová, M. The stability of polyaniline in strongly alkaline or acidic aqueous media. Polym. Degrad. Stab. 2008, 93, 592–600. [Google Scholar] [CrossRef]
  23. Trchova, M.; Stejskal, J. Polyaniline: The infrared spectroscopy of conducting polymer nanotubes (IUPAC Technical Report). Pure Appl. Chem. 2011, 83, 1803–1817. [Google Scholar] [CrossRef]
  24. Kumar, S.; Isaacs, M.A.; Trofimovaite, R.; Durndell, L.; Parlett, C.M.A.; Douthwaite, R.E.; Coulson, B.; Cockett, M.C.R.; Wilson, K.; Lee, A.F. P25@CoAl layered double hydroxide heterojunction nanocomposites for CO2 photocatalytic reduction. Appl. Catal. B-Environ. 2017, 209, 394–404. [Google Scholar] [CrossRef]
  25. Stejskal, J.; Trchova, M. Aniline oligomers versus polyaniline. Polym. Int. 2012, 61, 240–251. [Google Scholar] [CrossRef]
  26. Lee-Thorp, J.A.; Rüede, J.E.; Thornton, D.A. The infrared spectra (3500-150 cm−1) of aniline complexes of cobalt(II), nickel(II), copper(II) and zinc(II) halides. J. Mol. Struct. 1978, 50, 65–71. [Google Scholar] [CrossRef]
  27. Ding, L.L.; Wang, X.W.; Gregory, R.V. Thermal properties of chemically synthesized polyaniline (EB) powder. Synth. Met. 1999, 104, 73–78. [Google Scholar] [CrossRef]
  28. Trchova, M.; Sedenkova, I.; Konyushenko, E.N.; Stejskal, J.; Holler, P.; Ciric-Marjanovic, G. Evolution of polyaniline nanotubes: The oxidation of aniline in water. J. Phys. Chem. B 2006, 110, 9461–9468. [Google Scholar] [CrossRef]
  29. Zic, M. The influence of the PANI structure on the conductive mechanism and on the electrical equivalent circuit analysis. J. Electroanal. Chem. 2009, 635, 29–38. [Google Scholar] [CrossRef]
  30. Žic, M. The effect of the PANI-free volume on impedance response. J. Electroanal. Chem. 2007, 610, 57–66. [Google Scholar] [CrossRef]
  31. Zujovic, Z.D.; Laslau, C.; Bowmaker, G.A.; Kilmartin, P.A.; Webber, A.L.; Brown, S.P.; Travas-Sejdic, J. Role of Aniline Oligomeric Nanosheets in the Formation of Polyaniline Nanotubes. Macromolecules 2010, 43, 662–670. [Google Scholar] [CrossRef]
  32. Stejskal, J.; Kratochvil, P.; Radhakrishnan, N. Polyaniline dispersions.2. UV-VIS absorption-spectra. Synth. Met. 1993, 61, 225–231. [Google Scholar] [CrossRef]
  33. Li, X.W.; Chen, W.; Bian, C.Q.; He, J.B.; Xu, N.; Xue, G. Surface modification of TiO2 nanoparticles by polyaniline. Appl. Surf. Sci. 2003, 217, 16–22. [Google Scholar] [CrossRef]
  34. Barbero, C.; Miras, M.C.; Haas, O.; Kotz, R. Direct in situ evidence for proton/anion exchange in polyaniline films by means of probe beam deflection. J. Electrochem. Soc. 1991, 138, 669–672. [Google Scholar] [CrossRef]
  35. Stejskal, J.; Sapurina, I.; Trchova, M. Polyaniline nanostructures and the role of aniline oligomers in their formation. Prog. Polym. Sci. 2010, 35, 1420–1481. [Google Scholar] [CrossRef]
  36. Curtis, M.D.; Cao, J.; Kampf, J.W. Solid-state packing of conjugated oligomers: From pi-stacks to the herringbone structure. J. Am. Chem. Soc. 2004, 126, 4318–4328. [Google Scholar] [CrossRef]
  37. Stahlin, W.; Oswald, H.R. Crystal structure of zinc hydroxide nitrate, Zn5(OH)8(NO3)2.2H2O. Acta Crystallogr. Sect. B-Struct. Crystallogr. Cryst. Chem. 1970, 26, 860. [Google Scholar] [CrossRef]
  38. Zhang, H.; Zong, R.L.; Zhu, Y.F. Photocorrosion Inhibition and Photoactivity Enhancement for Zinc Oxide via Hybridization with Monolayer Polyaniline. J. Phys. Chem. C 2009, 113, 4605–4611. [Google Scholar] [CrossRef]
Scheme 1. The impact of the PANI/ZnO synergistic effect on the AB 25 dye photodegradation mechanism. CB, conducting band; VB, valence band; Eg, bandgap; LUMO, the lowest unoccupied molecular orbital; HOMO, the highest occupied molecular orbital. ZnO photocatalytic properties are hindered by relatively high bandgap energy (≈> 3 eV). Scheme was adapted from [10] (also see [11,12]).
Catalysts 10 00400 sch001
Scheme 2. Oxidation of aniline with ammonium persulfate (Adapted from [13]).
Catalysts 10 00400 sch002
Scheme 3. Doping and de-doping of PANI (adaptation from [22]). PANI salt can be de-doped in NH4OH, whilst strong acids like HCl and H2SO4 are typically used to dope PANI base.
Catalysts 10 00400 sch003
Scheme 4. Molecular structure of Acid Blue 25 (AB 25) dye.
Catalysts 10 00400 sch004
Figure 1. FTIR spectra of the pure ZnO and PANI/ZnO photocatalysts.
Catalysts 10 00400 g001
Figure 2. UV/VIS reflectance spectra of the PANI/ZnO photocatalysts.
Catalysts 10 00400 g002
Figure 3. Thermogravimetric (TG) and accompanied derivative thermogravimetric (DTG) data obtained by investigation of synthesized PANI/ZnO photocatalysts.
Catalysts 10 00400 g003
Figure 4. FE-SEM images of pure (a) ZnO, and (b) PANI/ZnO_1, (c) PANI/ZnO_2, and (d) PANI/ZnO_3 samples. Images (b), (c), and (d) show the impact of the prolonged stirring time on the morphology of prepared PANI/ZnO samples. Composites particles size: PANI/ZnO_1 > PANI/ZnO_2 > PANI/ZnO_3.
Catalysts 10 00400 g004
Figure 5. FE-SEM image of PANI/ZnO_3 composite. Image shows that lamellas are assembled by π–π stacking of small oligomers. The ZnO particles are trapped within lamella formations.
Catalysts 10 00400 g005
Scheme 5. Schematic representation of the PANI/ZnO composite particle. The inner shell of the composite particle is made of PANI salt phase (as ZnO was promptly added to acid PANI Suspension A), whilst the outer shell is formed of PANI base phase and the aniline oligomers (prepared in Solution C). Due to simplicity, the two additional phases in PANI/ZnO (see Section 2.6) were not commented on.
Catalysts 10 00400 sch005
Figure 6. Diffractograms of the pure ZnO and the PANI/ZnO-based multiphase photocatalysts.
Catalysts 10 00400 g006
Figure 7. AB 25 photodegradation under solar irradiation treatment. (a) AB 25 photodegradation data and (b) linear plots of ln(c0/ct) vs. irradiation time (c0/ct data were normalized) obtained by using PANI/ZnO photocatalysts (pH = 7; cat = 1 g/L, AB 25 = 30 mg/L).
Catalysts 10 00400 g007
Table 1. ZnO bandgap (Eg) determined from UV/Vis reflectance spectra of composite photocatalysts.
SampleZnOPANI/ZnO_1PANI/ZnO_2PANI/ZnO_3
Eg (eV)3.273.233.253.26
Table 2. Conductivity of pure ZnO and prepared composite photocatalysts (PANI/ZnO).
SampleZnOPANI/ZnO_1PANI/ZnO_2PANI/ZnO_3
κ (S cm−1)2.955 10−72.632 10−52.380 10−52.874 10−5
Table 3. Portion of ZnO and organic matter (aniline oligomers and PANI) in synthesized PANI/ZnO photocatalysts.
SamplePANI/ZnO_1PANI/ZnO_2PANI/ZnO_3
Organic matter (%)15.55 18.1621.28
ZnO (%)84.4581.8478.72
Table 4. Apparent rate constants (kapp) of the AB 25 dye degradation extracted from ln(co/ct) vs. t curves given in Figure 7b.
SampleZnOPANI/ZnO_1PANI/ZnO_2PANI/ZnO_3
kapp (min−1)0.00686 ± 0.0005430.01775 ± 0.0006970.01918 ± 0.0006180.00946 ± 0.000321
Table 5. Components used to prepare PANI/ZnO_1, PANI/ZnO_2, and PANI/ZnO_3-based multiphase composites. The first step, (i.e., PANI salt homopolymerization) was conducted in acidic Solution A, whilst the second step (in situ composite preparation) was carried on in low acidic Solution C.
Suspensions Components
-Suspension A (25 mL, 250 rph)
V(An)/ml0.0390
n(APS):n(An)1.25
V(H2SO4)/ml0.0935
pH2
-Suspension B (25 mL, 250 rph)
m(ZnO)/g1
-Suspension C (50 mL, 250 rph)
m(ZnO)/g1 (i.e., 20 g/L)
m(An)/gLeftovers from the A solution
m(APS)/gLeftovers from the A solution
m(PANI)/gPANI salt from the A solution
pH≈ 5
An: aniline; APS: ammonium persulfate.

