Article

Autocatalytic Fractionation of Wood Hemicelluloses: Modeling of Multistage Operation

Department of Chemical Engineering, Faculty of Science, University of Vigo (Campus Ourense), As Lagoas, 32004 Ourense, Spain
*
Author to whom correspondence should be addressed.
Catalysts 2020, 10(3), 337; https://doi.org/10.3390/catal10030337
Submission received: 21 February 2020 / Revised: 9 March 2020 / Accepted: 12 March 2020 / Published: 17 March 2020
(This article belongs to the Special Issue Catalytic Transformation of Renewables (Olefin, Bio-sourced, et. al))

Abstract

:
Eucalyptus globulus wood samples were treated with hot, compressed water (autohydrolysis) in consecutive stages under non-isothermal conditions in order to convert the hemicellulose fraction into soluble compounds through reactions catalyzed by in situ generated acids. The first stage was a conventional autohydrolysis, and liquid phase obtained under conditions leading to an optimal recovery of soluble saccharides was employed in a new reaction (second crossflow stage) using a fresh wood lot, in order to increase the concentrations of soluble saccharides. In the third crossflow stage, the best liquid phase from the second stage was employed to solubilize the hemicelluloses from a fresh wood lot. The concentration profiles determined for the soluble saccharides, acids, and furans present in the liquid phases from the diverse crossflow stages were employed for kinetic modeling, based on pseudohomogeneous reactions and Arrhenius-type dependence of the kinetic coefficients on temperature. Additional characterization of the reaction products by High Pressure Size Exclusion Chromatography, High Performance Anion Exchange Chromatography with Pulsed Amperometric Detection, and Matrix Assisted Laser Desorption/Ionization Time of Flight Mass Spectrometry provided further insight on the properties of the soluble saccharides present in the various reaction media.

1. Introduction

A major concern of sustainability is the consumption of nonrenewable resources, and their replacement by renewable ones. Lignocellulosic materials (LCM) are interesting renewable raw materials for industry, due to their availability, widespread occurrence, carbon-neutral character, and low cost. Eucalyptus globulus shows favorable features as a feedstock for industry, including its productivity, high cellulose content, and hemicelluloses largely dominated by acetylated glucuronoxylan [1,2], with minor amounts of other components [3].
The industrial utilization of LCM can be accomplished using the biorefinery approach, which entails the selective separation of the polymeric components of LCM (cellulose, hemicelluloses and lignin) through “fractionation” treatments, and the further transformation of the resulting fractions into commercial products, taking into account the principles of green chemistry and circular economy [4].
The fractionation of woods in the scope of biorefineries can be achieved by diverse methods, depending on the fraction (or fractions) targeted. In particular, hemicelluloses can be selectively separated from cellulose and lignin by performing a mild acidic treatment in aqueous media. Under selected conditions, hemicelluloses can be converted into soluble saccharides (or saccharide-decomposition products), whereas cellulose and lignin are scarcely altered and remain in solid phase. The solids from autohydrolysis can be processed (for example, by delignification, enzymatic hydrolysis or acidic processing under harsh conditions) to yield a wide scope of products, including sugar solutions suitable as fermentation media, furans, cellulose pulp, and organic acids.
The acidic conditions promoting the hemicellulose depolymerization in aqueous media can be achieved by external addition of an acidic catalyst (typically, a mineral acid in prehydrolysis treatments), or just by aqueous processing (autohydrolysis treatments). In the latter case, the breakdown of the glycosidic bonds in hemicelluloses is catalyzed by hydronium ions, which come at the beginning of the reaction from water autoionization and uronic substituents in hemicelluloses. In further reaction stages, the acetic acid progressively released in situ from the acetyl groups becomes the major source of hydronium ions (autocatalytic reaction). As a consequence, the comparatively high acetyl group content of Eucalyptus globulus wood is an advantage for this type of reactions.
Besides the ability of autohydrolysis for causing an extensive and selective separation of hemicelluloses from the rest of the polymeric wood components, other advantages (including its “green” character, the limited problems derived from equipment corrosion, and the fact that no neutralization or sludge management stages are necessary) contribute to the interest of this technology for wood fractionation [5].
When autohydrolysis is performed under suitable operational conditions, the acetylated glucuronoxylan in E. globulus wood is mainly converted into xylooligosaccharides (XOs), which in turn can be converted into xylose and/or xylose-decomposition products. The kinetic modeling of single-stage E. globulus wood autohydrolysis has been considered in literature, including the hydrolysis of xylan under isothermal and non-isothermal conditions [5,6] and the generation of acetic acid from acetyl groups [7].
The hydrolysis of E. globulus xylan into soluble products has been interpreted in literature [5,6] using a mechanism based on the following hypotheses:
  • The reactions taking place in the reaction medium are irreversible and present a first-order, pseudohomogeneous kinetics
  • The kinetic coefficients involved in the mechanism follow the Arrhenius equation
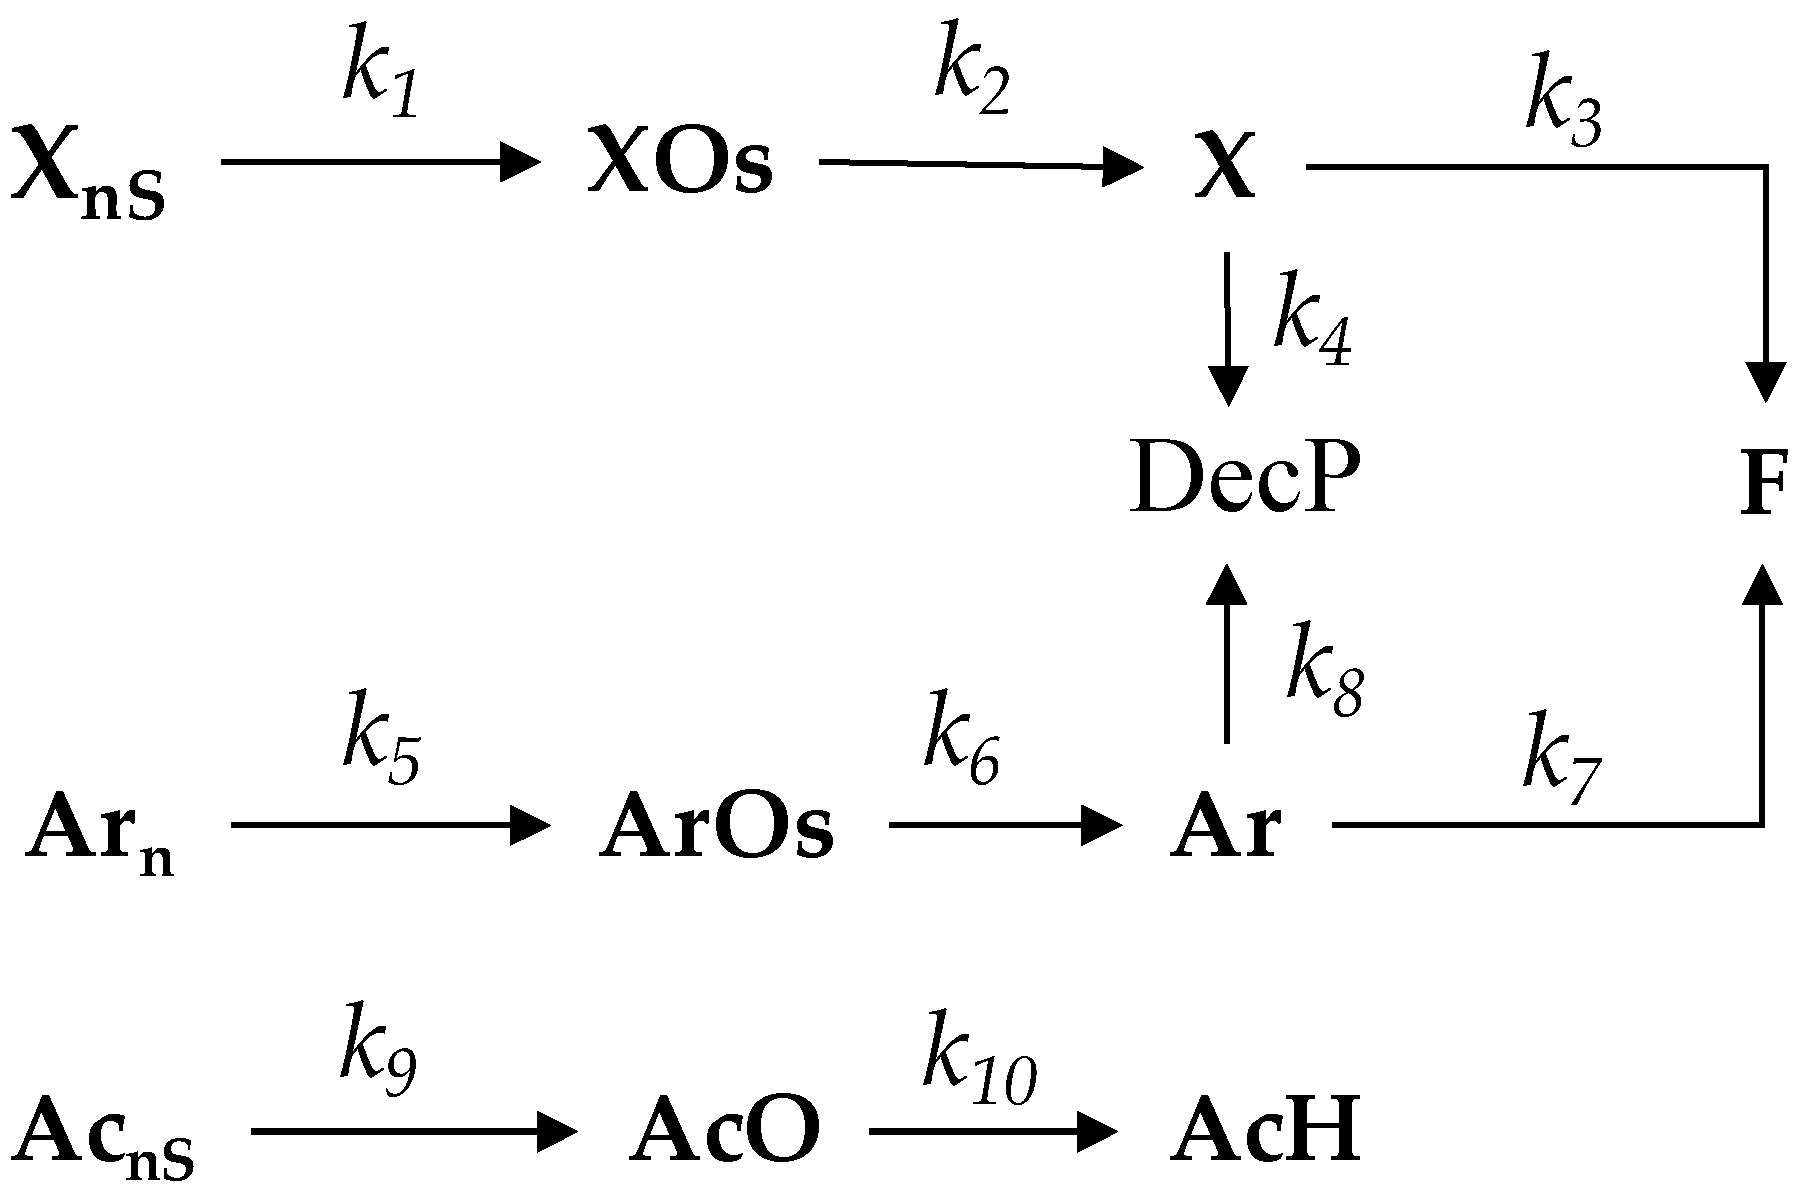
  • Eucalyptus wood xylan (Xn) is made up of two fractions, one being unreactive under the operational conditions, and the other (susceptible xylan, XnS) can be hydrolyzed to yield high-molecular weight oligosaccharides (XOH)
  • The relative proportion of hydrolyzable xylan is measured by the “susceptible fraction” αXnS (g susceptible xylan/g xylan)
  • XOH are split into low molecular weight oligosaccharides (XOL)
  • XOL are hydrolyzed into xylose (X), which is dehydrated into furfural (F)
This mechanism can be summarized as follows:
X n S k 1   > X O H k 2   > X O L k 3   > X k 4   > F
Although xylan can be hydrolyzed at high yield by autohydrolysis treatments, the volumetric concentrations of the soluble saccharides and furfural in liquid phase are limited, owing to both the xylan content of wood and the concentration of solids in the reaction media (typically, 10–12.5 g oven-dried wood/100 g water). As a consequence, the volumetric concentration range is below the desired threshold for a number of applications. Increased concentrations of the target products can be achieved by concentration (for example, by evaporation or membrane technologies) or by coupling reaction stages [8]. This latter strategy entails a number of issues, related to the higher concentrations of catalyst (acetic acid derived from acetyl groups) and to the increased conversion of susceptible substrates by hydrolysis, dehydration and/or condensation reactions.
To our knowledge, no studies have been reported on the kinetic modeling of multistage autohydrolysis. The closest precedents for our study are the articles reported for the single stage autohydrolysis of Eucalyptus globulus wood [5,6]. Other studies dealing with wood autohydrolysis have been reported for Acacia dealbata (a hardwood with hemicelluloses mainly made up of xylan) [9] and Pinus pinaster (a softwood with hemicelluloses mainly made up of glucomannan and xylan) [10]. Additional kinetic studies of single-stage autohydrolysis have been reported for a number or non-wood materials, including corncobs [11], vine shoots [12], Arundo donax [13], barley husks [14], bamboo [15], Cytisus scoparius [16], rye straw [17], and almond shells [18].
This work deals with the kinetic modeling of 
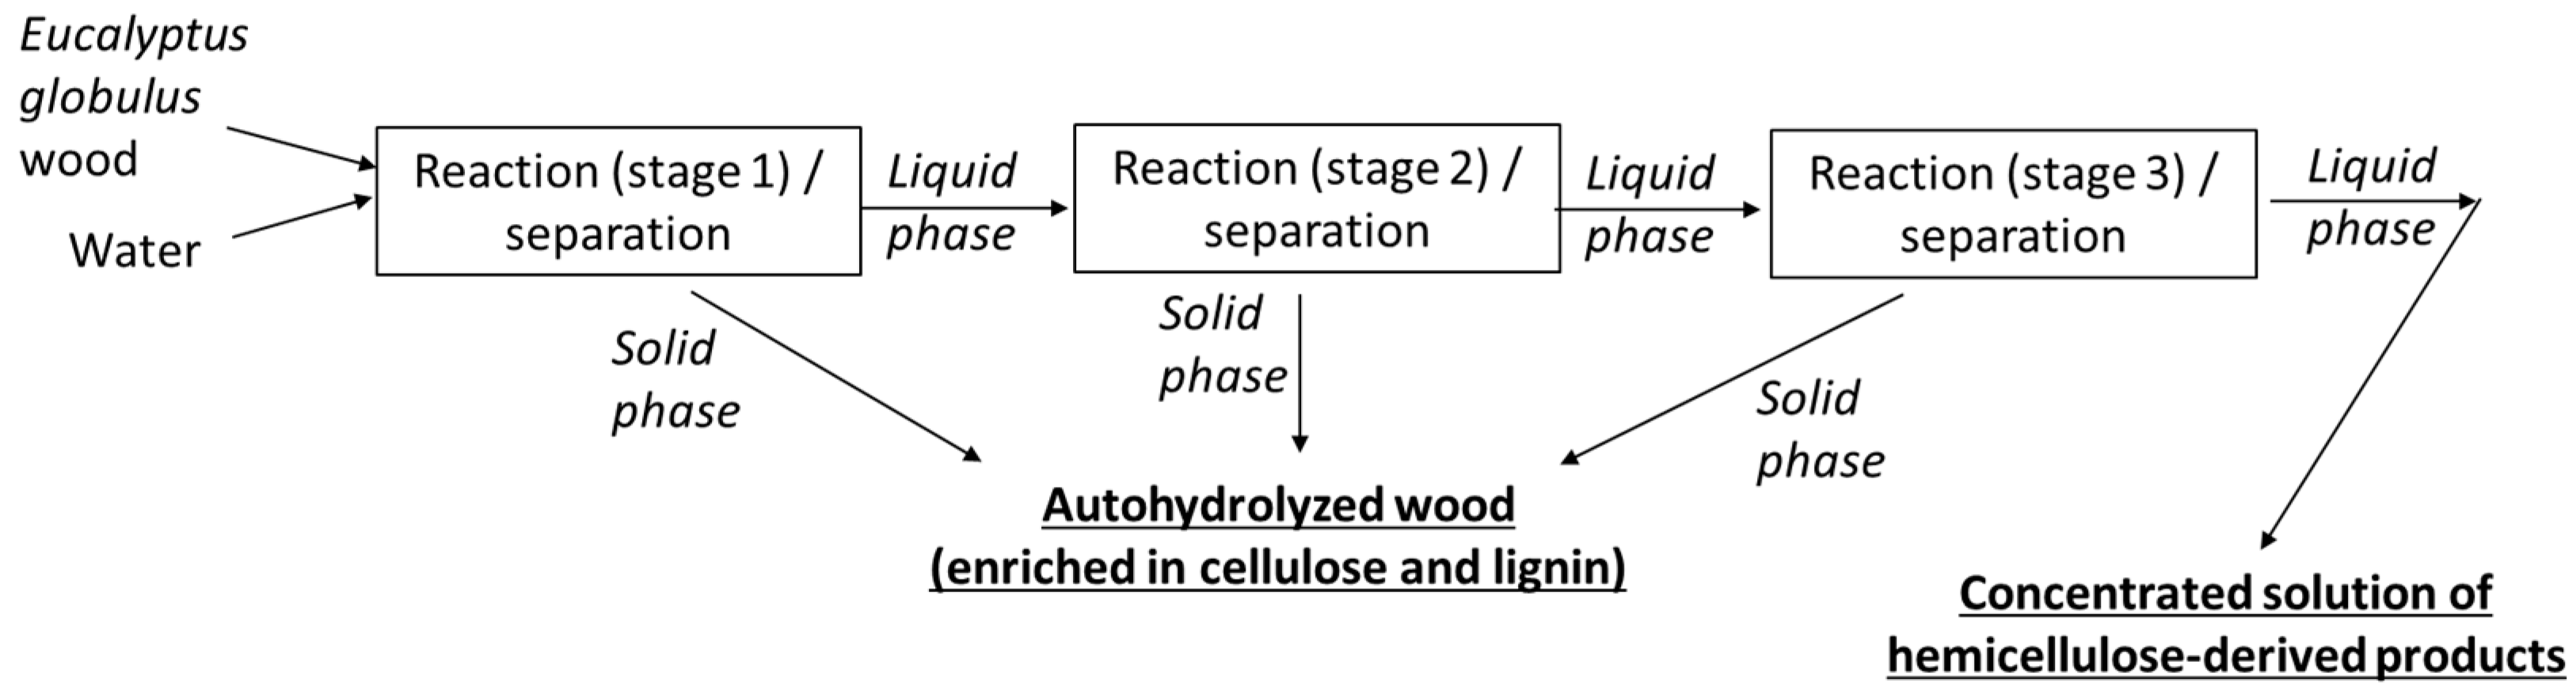
E. globulus wood processing by multistage autohydrolysis. Wood was processed in three crossflow stages (as indicated in 
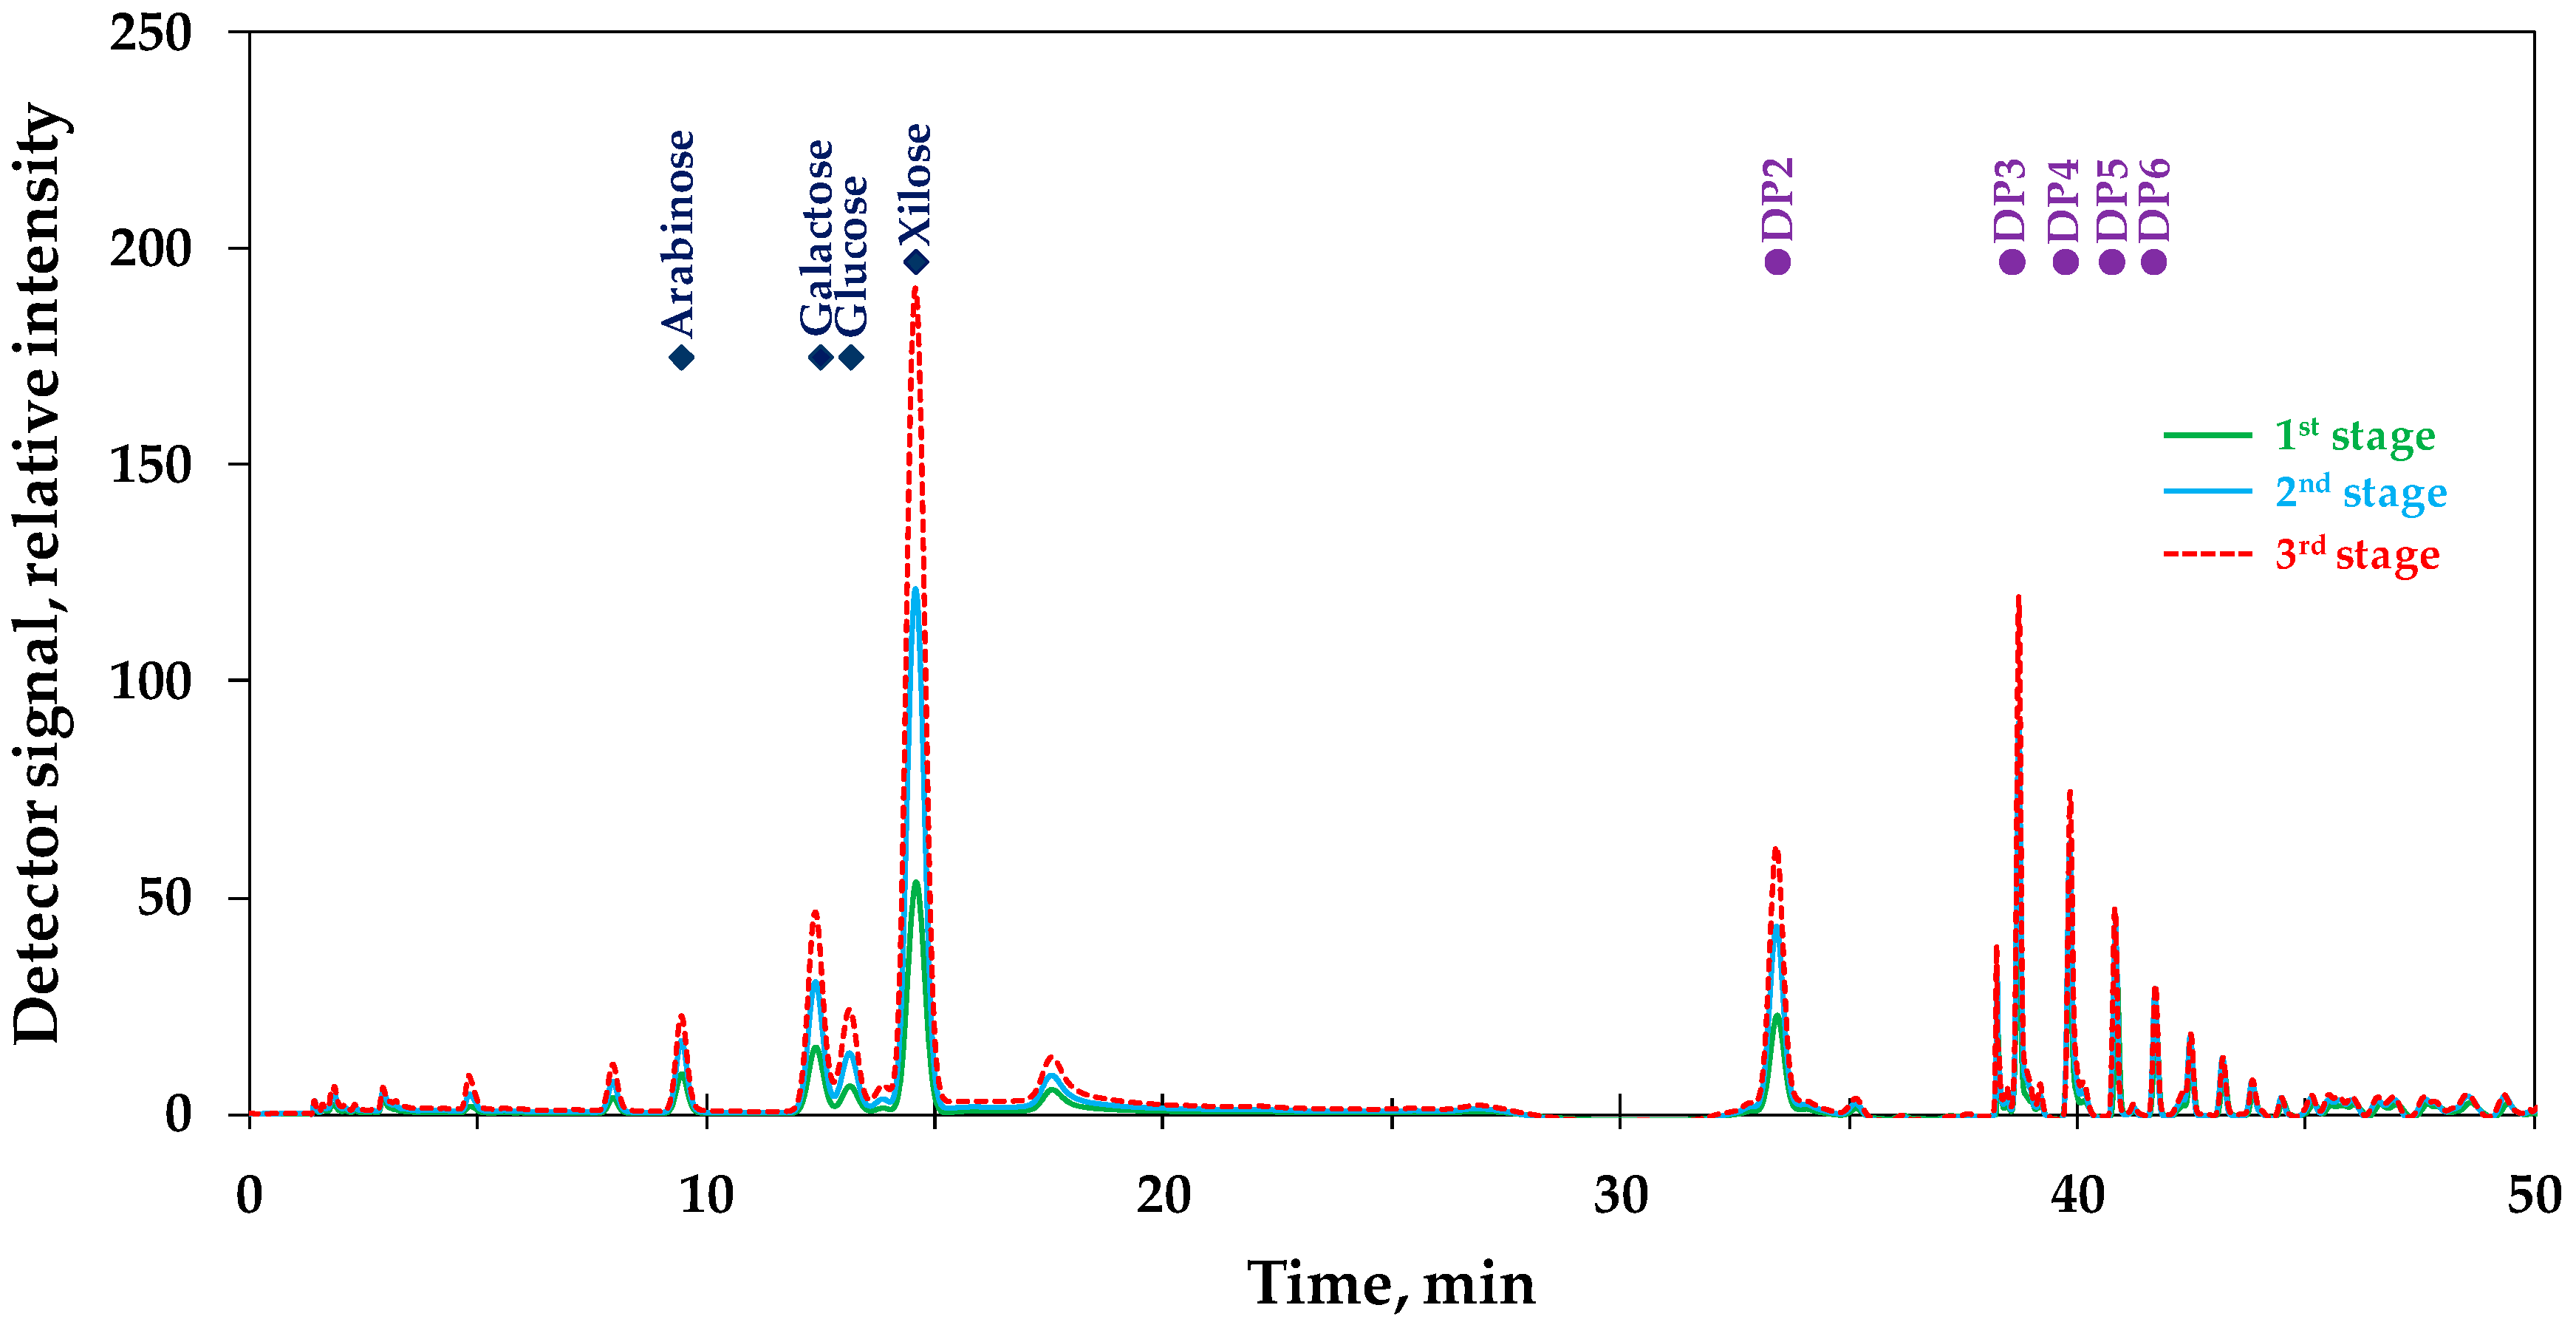
Figure 1), where the first one was a conventional hydrothermal treatment (wood was processed with water), whereas fresh wood lots were treated in the second and third stages with the liquid phases coming from stages 1 and 2, respectively. Operation was carried out under non-isothermal conditions. In experiments performed at temperatures within the range 160–220 °C, samples were withdrawn at selected reaction times, and assayed for the following reaction products: XOs, X, F, glucosyl groups in oligosaccharides (GOs), arabinosyl groups in oligosaccharides (ArOs), glucose (Gl), arabinose (Ar), acetyl groups in oligosaccharides (AcO), hydroxymethylfurfural (HMF), acetic acid (AcH), formic acid (FA), and levulinic acid (LA). Kinetic models giving a close interpretation of the experimental data were developed, and the properties of the soluble products leaving the diverse reaction stages were assessed by High Pressure Size Exclusion Chromatography (HPSEC), High Performance Anion Exchange Chromatography with Pulsed Amperometric Detection (HPAEC-PAD), and Matrix Assisted Laser Desorption/Ionization Time of Flight Mass Spectrometry (MALDI-TOF MS).

2. Results and Discussion

2.1. Wood Composition

The composition of lignocellulosic materials depends on the type of substrate and on other specific factors (growth conditions and age of the specimen, sampling method, etc.). The reactions involved in autohydrolysis processing are affected by the composition of the wood sample: for example, the acetyl group content measures the maximum amount of acetic acid that can be released (and so the concentration of hydronium ions with catalytic activity present in the media), whereas the ash fraction may present neutralizing ability. Because of this, the wood lot employed in experiments was characterized in detail, yielding the results listed in Table 1. Cellulose (40.8 wt %) and acid-insoluble lignin (22.5 wt %) were the major wood components; whereas xylan (16.8 wt %), arabinosyl groups (0.63 wt %) and acetyl groups (3.16 wt %) were the target substrates for autohydrolysis.

2.2. Effects Caused by the First Reaction Stage

According to Figure 1, the first reaction stage was a conventional non-isothermal autohydrolysis reaction, similar to the one described in literature dealing with the kinetics of Xn conversion into XOs, X and F [6]. In the present study, the concentrations of additional reaction products (GOs, ArOs, Gl, Ar, AcO, AcH, FA, HMF, and LA) were also determined to allow a deeper understanding of the underlying chemistry. The volumetric concentrations achieved at the considered temperatures are listed in Table 2. The concentration profiles determined for the products derived from xylan (XOs, X and F) were essentially the same as those reported in an earlier study [6], and are not discussed in depth here. In order to facilitate the interpretation of data, the most important experimental trends can be summarized as follows: XOs were generated from Xn by partial hydrolysis, and then converted into X. As a consequence, XOs behaved as reaction intermediates, reaching a maximum concentration (15.9 g/L) under conditions of intermediate severity (195 °C, or reaction time = 35.4 min). The concentration of X increased steadily along the heating process (to reach a maximum concentration of 10.2 g/L under the harshest conditions assayed), but the concentration increases were below the stoichiometric ones calculated from the decrease in XOs concentration, owing to the dehydration of X into F. As observed for X, the concentrations of F (generated by the dehydration of pentoses) increased steadily with the reaction time. The variation pattern observed for AcO was closely related to the one observed for XOs, with a maximum concentration (3.55 g/L) taking place under the same conditions. AcH (resulting from AcO hydrolysis) reached concentrations in the range 0.01–3.04 g/L, providing increased amounts of hydronium ions at increased temperatures. ArOs and Ar reached low concentrations (derived from the scarce amount of arabinosyl groups in the substrate), and were more susceptible to hydrolysis/dehydration than XOs and X, respectively. The concentration of F (produced from pentoses) increased steadily along the experimental domain, up to reach 1.76 g/L under the severest conditions assayed. Glucan (ascribed to cellulose), an abundant fraction in the raw material, was scarcely affected by hydrolysis reactions, resulting in low concentrations of GOs, Gl (generated from GOs) and HMF (coming from Gl rehydration). In the reaction media, FA can be generated from two sources: formyl groups in lignin, and HMF rehydration (which yields equimolar amounts of FA and LA). Since no significant amounts of LA were detected, it can be concluded that FA was produced from formyl groups.

2.3. Effects Caused by the Second Reaction Stage

Figure 1 shows that the second reaction stage was different from a conventional non-isothermal autohydrolysis reaction, since the liquid phase employed for wood processing contained reactive components (oligosaccharides, sugars, acetyl groups and furans) together with organic acids acting as catalyst sources. Because of this, the second reaction stage is expected to cause similar effects on wood than the first reaction stage, but the reactive components initially present in the liquid phase will undergo hydrolysis, dehydration, rehydration and/or condensation reactions, affecting to both kinetics and product yields. Table 3 shows the compositional data determined for experiments performed at temperatures within the range 160–220 °C using the solution from stage 1 that led to the maximum XOs concentration in the liquid phase. The overall kinetic pattern observed in the second stage was similar to the one observed in stage 1. For example, GOs and XOs behaved as reactions intermediates (reaching their maximum concentrations under conditions of intermediate severity), whereas ArOs reached their maximum concentration under the mildest conditions assayed, owing to their increased susceptibility to hydrolysis. As before, the concentrations of Gl and X increased steadily with the severity of treatments, whereas the concentration of Ar showed a defined maximum within the experimental domain, owing to its higher susceptibility to dehydration into F. The presence of organic acids, oligosaccharides and sugars at the beginning of the reaction resulted in concentration increases in the second stage that were non-proportional respect to the initial amounts of potential substrates available in the reaction medium. Owing to the increased hydrolysis of XOs, their maximum concentration (25.4 g/L, achieved at 190 °C) less than doubled the one achieved in the first stage (15.9 g/L, achieved at 195 C). Oppositely, when the second stage was performed at 190 °C, the concentrations of Gl, X, AcH, FA, F, and HMF more than doubled the respective concentrations achieved in the first stage, owing to the increased concentrations of their precursors in the reactions media.

2.4. Effects Caused by the Third Reaction Stage

According to Figure 1, stage 3 was performed by treating a fresh wood lot with the reaction liquor from stage 2. For this purpose, the solution obtained in the experiment leading to a maximum XOs concentration in the second stage was employed. The experimental trends observed in the experiments performed at 160–215 °C (see concentration profiles in Table 4) were closely related to the ones described above for stage 2. Taking the conditions leading to the maximum XOs generation in the third stage as a basis for comparison, it can be noted that the concentrations of oligomers (GOs and XOs) and acetyl groups bound to oligomers (AcO) increased less than proportionally respect to the concentrations of the potential substrates initially available in the reaction medium. The same behavior was observed for Ar, which was easily converted into F under conditions of intermediate severity. In turn, the concentrations of X, Gl, organic acids, and furans increased more than proportionally, owing to the higher concentrations of their respective precursors.

2.5. Kinetic Modeling of Multistage Operation

The concentrations listed in Table 2, Table 3 and Table 4 were employed for kinetic modeling, in order to provide a deeper understanding of the major phenomena involved in the solubilization of the hemicellulosic polymers, using a unified model for the multistage processing suitable for quantitative assessments, design and economic evaluation.
Preliminary modeling attempts of the reactions governing the consumption of Xn, arabinosyl groups in solid phase (Arn), acetyl groups in solid phase (Acn), and the products derived from them were performed using models reported for single-stage autohydrolysis of diverse lignocellulosic materials, [4,5,6,9,10,11,12,13,14,15,16,17].
The preliminary validation of the various models confirmed that some common assumptions (kinetic modeling, individual reactions with first order kinetics involving coefficients with Arrhenius-type dependence on temperature) were suitable for modeling the multistage autohydrolysis of Eucalyptus wood. The best results for Xn solubilization were achieved assuming that the xylan in the native wood was made up of a “resistant xylan” (XnR) fraction, and a “susceptible xylan” (XnS) fraction for which the relative abundance was measured by the “susceptible fraction” (αXnS, expressed as g hydrolyzable fraction/g xylan in wood). Concerning the generation of XOs, the existence of high molecular weight and low molecular weight fractions improved the fitting of data in the first stage, but this hypothesis did not improve significantly the interpretation of data regarding the second and third stages. This finding was ascribed to the higher participation of hydrolysis reactions of high molecular weight oligosaccharides, which resulted in products of lower average molecular weight (see Section 2.6). In turn, the assumption that a single type of XOs was generated from Xn led to satisfactory interpretation of data for each of the three processing stages. Similarly, the decomposition of ArOs into Ar and the generation of AcH from AcO were well interpreted by single reactions. The material balances showed that AcH was not consumed by further reactions. Oppositely, the literature models did not provide a suitable interpretation of data regarding the generation of pentoses (X and Ar) and their further dehydration into furfural. Models involving the direct generation of XOs and ArOs from their precursors followed by the formation of the monomers and their dehydration into F (and, eventually, the partial conversion of this latter compound into decomposition products, DecP) overestimated the concentrations of X and Ar. Oppositely, modified models involving both the dehydration of pentoses into F and their consumption by parasitic reactions (as shown in Figure 2) led to satisfactory results. The consumption of xylose in acidic media by parasitic reactions different from rehydration has been postulated in literature. For example, xylose can be consumed by retroaldol fragmentation [19,20], or through the formation of reactive cyclic or acyclic intermediates [21,22,23,24] able to yield furfural or to participate in non-productive reactions with other reactive species present in the reaction media. On the other hand, satisfactory interpretation of the AcO concentration profiles was achieved when the presence of resistant and susceptible acetyl groups in wood (denoted AcnR and AcnS) was assumed, in relative proportions measured by the mass fraction of susceptible fraction respect to the total acetyl groups in wood (αAcnS).
Based on these ideas, the model presented in Figure 2 was employed for kinetic modeling of the multistage autohydrolysis.
Table 5 lists the equations governing the overall reaction scheme, and Table 6a presents the results determined for the susceptible fractions (αXnS and αAcnS) and for the pre-exponential factors and activation energies corresponding to the kinetic coefficients k1 to k10 in Figure 2.; whereas Table 6b presents the values of the statistical parameter R2 measuring the correlation between experimental and calculated data. R2 of 0.921, 0.937 and 0.960 were calculated for the XOs production in the first, second and third stages, respectively. The increased R2 obtained when fitting the XOs concentrations determined for the second and third stages were ascribed to the higher contents of low molecular weight oligomers. R2 > 0.95 were calculated for X, F and AcH, whereas the poorer coefficients of determination observed for Ar, ArOs and AcO were ascribed to the increased relative errors resulting from their low concentrations.
Additionally, Figure 3a–c show the experimental concentrations and the concentration profiles calculated for the compounds involved in models. The ability of the models for giving a quantitative interpretation of results was confirmed by the close interrelationship between experimental and calculated data.

2.6. Characterization of the Reaction Products

In order to get further insight on the properties of the products from the diverse reaction stages, samples from the reaction media were analyzed by HPSEC, HPAEC-PAD and MALDI-TOF MS.
The HPSEC chromatogram shown in Figure 4 confirmed that both the amount of monosaccharides and the mass ratio monosaccharides/oligosaccharides increased from stage 1 to stage 3. In all cases, the major products were monosaccharides and higher saccharides with degrees of polymerization (DP) ≤ 7, among which xylobiose was predominant.
The HPAEC-PAD elution profiles shown in Figure 5 supported the above findings. Small amounts of oligosaccharides with DP > 6 were present in the liquid phases from stages 1 to 3, whereas monosaccharides and DP2–DP4 were the most abundant products.
Additional information on the structure of the major reaction compounds was obtained by MALDI-TOF analysis. The samples from the reaction media 1 to 3 showed a variety of structures substituted with acetyl and O-methyluronic groups. As an example, Table 7 lists the structures identified in the liquid stream from the third reaction stage, which corresponded mainly to heavily substituted oligosaccharides made up of 2–11 pentose units, containing up to 6 acetyl groups and up to 2 O-methyluronic groups. This rich substitution pattern is in agreement with literature [3,25], and are known to show biological properties, including prebiotic activity [26].

3. Materials and Methods

3.1. Raw Material and Chemical Processing

Eucalyptus globulus wood samples were collected locally, milled in a Wiley instrument fitted with an 8 mm screen, air-dried, mixed to ensure a constant composition, and stored until use. Wood samples were processed either with water (in first autohydrolysis stage) or with liquid streams from previous autohydrolysis treatments (in the second and third stages) using a solid charge of 1 kg oven-dry wood/8 kg liquid phase. Reaction was performed in a 3.75 L stainless steel reactor (Parr Instruments Company, Moline, IL, USA). Operation was carried out in non-isothermal mode (the media was heated up to reach the target temperature, and then cooled immediately). The solid phase was recovered after press-filtration, and subjected to displacement washing. Process water, reaction media, and washing effluents were processed according to the integrated scheme reported in an earlier work [8].

3.2. Analysis of Wood and Samples from Hydrothermal Treatments

Native wood and the exhausted solids from the diverse hydrothermal stages were washed with deionized water and assayed for moisture, extractives and ash using NREL standard methods. Klason lignin, acetyl groups and hemicellulose-derived sugars were measured by quantitative acid hydrolysis (NREL/TP-510- 42618 method) followed by HPLC determination, operating as reported elsewhere [8]. The liquid phases from the various reaction media were assayed by the same HPLC method (directly and after quantitative posthydrolysis according to the NREL/TP-510-42623 method), for sugars, furfural, HMF and organic acids. The concentrations of oligosaccharides and bound acetyl groups were calculated from the differences in the respective concentrations determined in the analysis of direct and posthydrolyzed samples. Uronic substituents were determined as per Blumenkrantz and Asboe-Hansen [27]. Non-volatile compounds in liquors were measured as the residue remaining after oven drying at 105 °C until constant weight.

3.3. Additional Characterization of the Reaction Products

HPSEC analysis was employed to assess the molecular weight distribution of oligosaccharides. Operation was performed at 30 °C using two TSKGel G3000PWXL columns in series in combination with a PWX-guard column (all of them from Tosoh Bioscience, Stuttgart, Germany), using Milli Q water as a mobile phase. XOs (DP 2-6, from Megazyme, Ireland) and dextrans (1000–80000 g·mol−1, from Fluka) were employed as standards low- and high- molecular weight fractions, respectively.
Liquid samples from the diverse reaction media were analyzed by HPAEC-PAD using an ICS3000 instrument (Dionex, Sunnyvale, CA, USA) equipped with a CarboPac PA-1 and a CarboPac PA guard column [28].
MALDI-TOF MS analysis of soluble saccharides was performed using an Autoflex III Smartbeam instrument (from Bruker Daltonics, Bremen, Germany). Flex Control 3.0 and Flex Analysis 3.0 were employed for data acquisition.

3.4. Error Assessment

Wood analysis was performed in triplicate, and the standard deviations are reported in Table 1. Analysis of the liquid phases from the reaction media were performed in duplicate, and the average results are reported. The relative error depended on the concentration range of each type of compounds. For example, considering the results listed in Table 2, Table 3 and Table 4, the average relative errors (measured as absolute values respect to the mean for each duplicate determination, ε) were 0.92 and 1.18%, for GOs and XOs respectively; in comparison with 8.64% for ArOs (which appeared in little concentrations, and were of little importance for the purposes of this study). The values of ε determined for the rest of target compounds were as follows: Gl, 039%; X, 0.30%; Ar, 0.35%; FA, 0.72%; AcH, 0.61%; LA, 0.75%; HMF, 0.63%; and F, 1.09%.

3.5. Fitting of Data

The set of differential equations describing the considered mechanism were solved using the 4th order Runge–Kutta method implemented in an Excel spreadsheet. The values of the parameters involved in the diverse model equations were calculated by regression of the experimental data. The optimal values of the parameters were obtained by minimization of the sum of the squares of the deviations between the experimental and calculated data, using an optimization routine (Solver) built in the Excel spreadsheet.

4. Conclusions

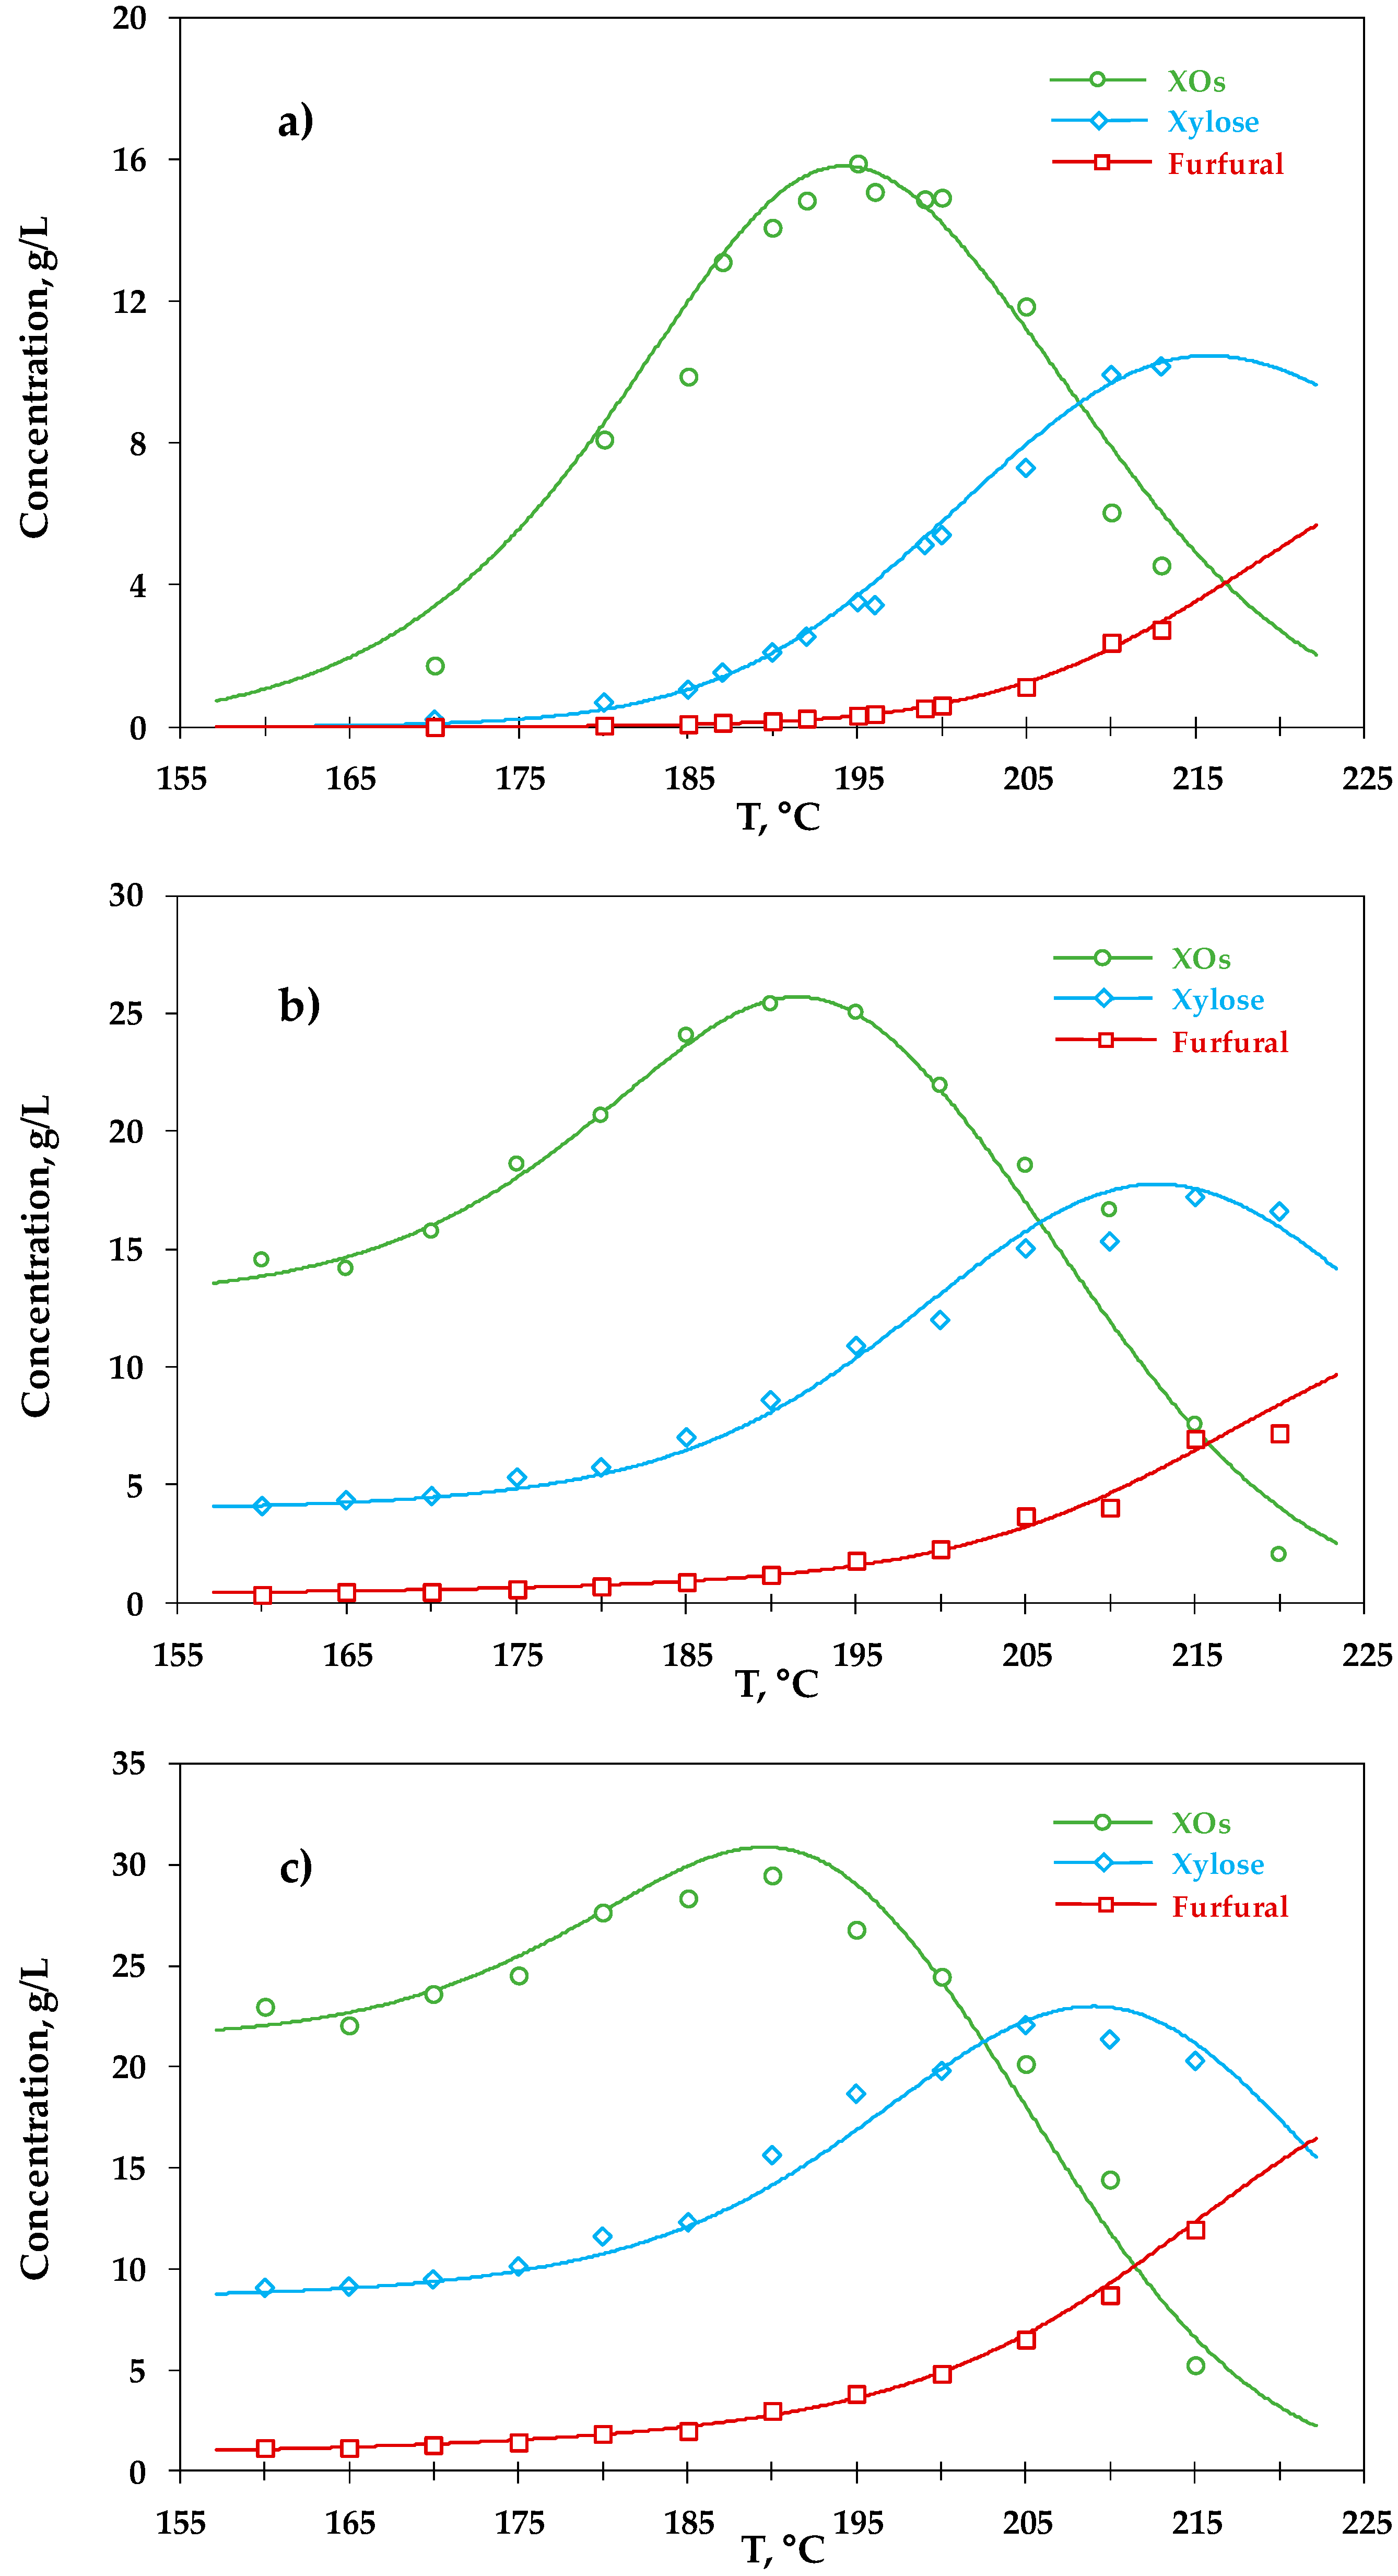
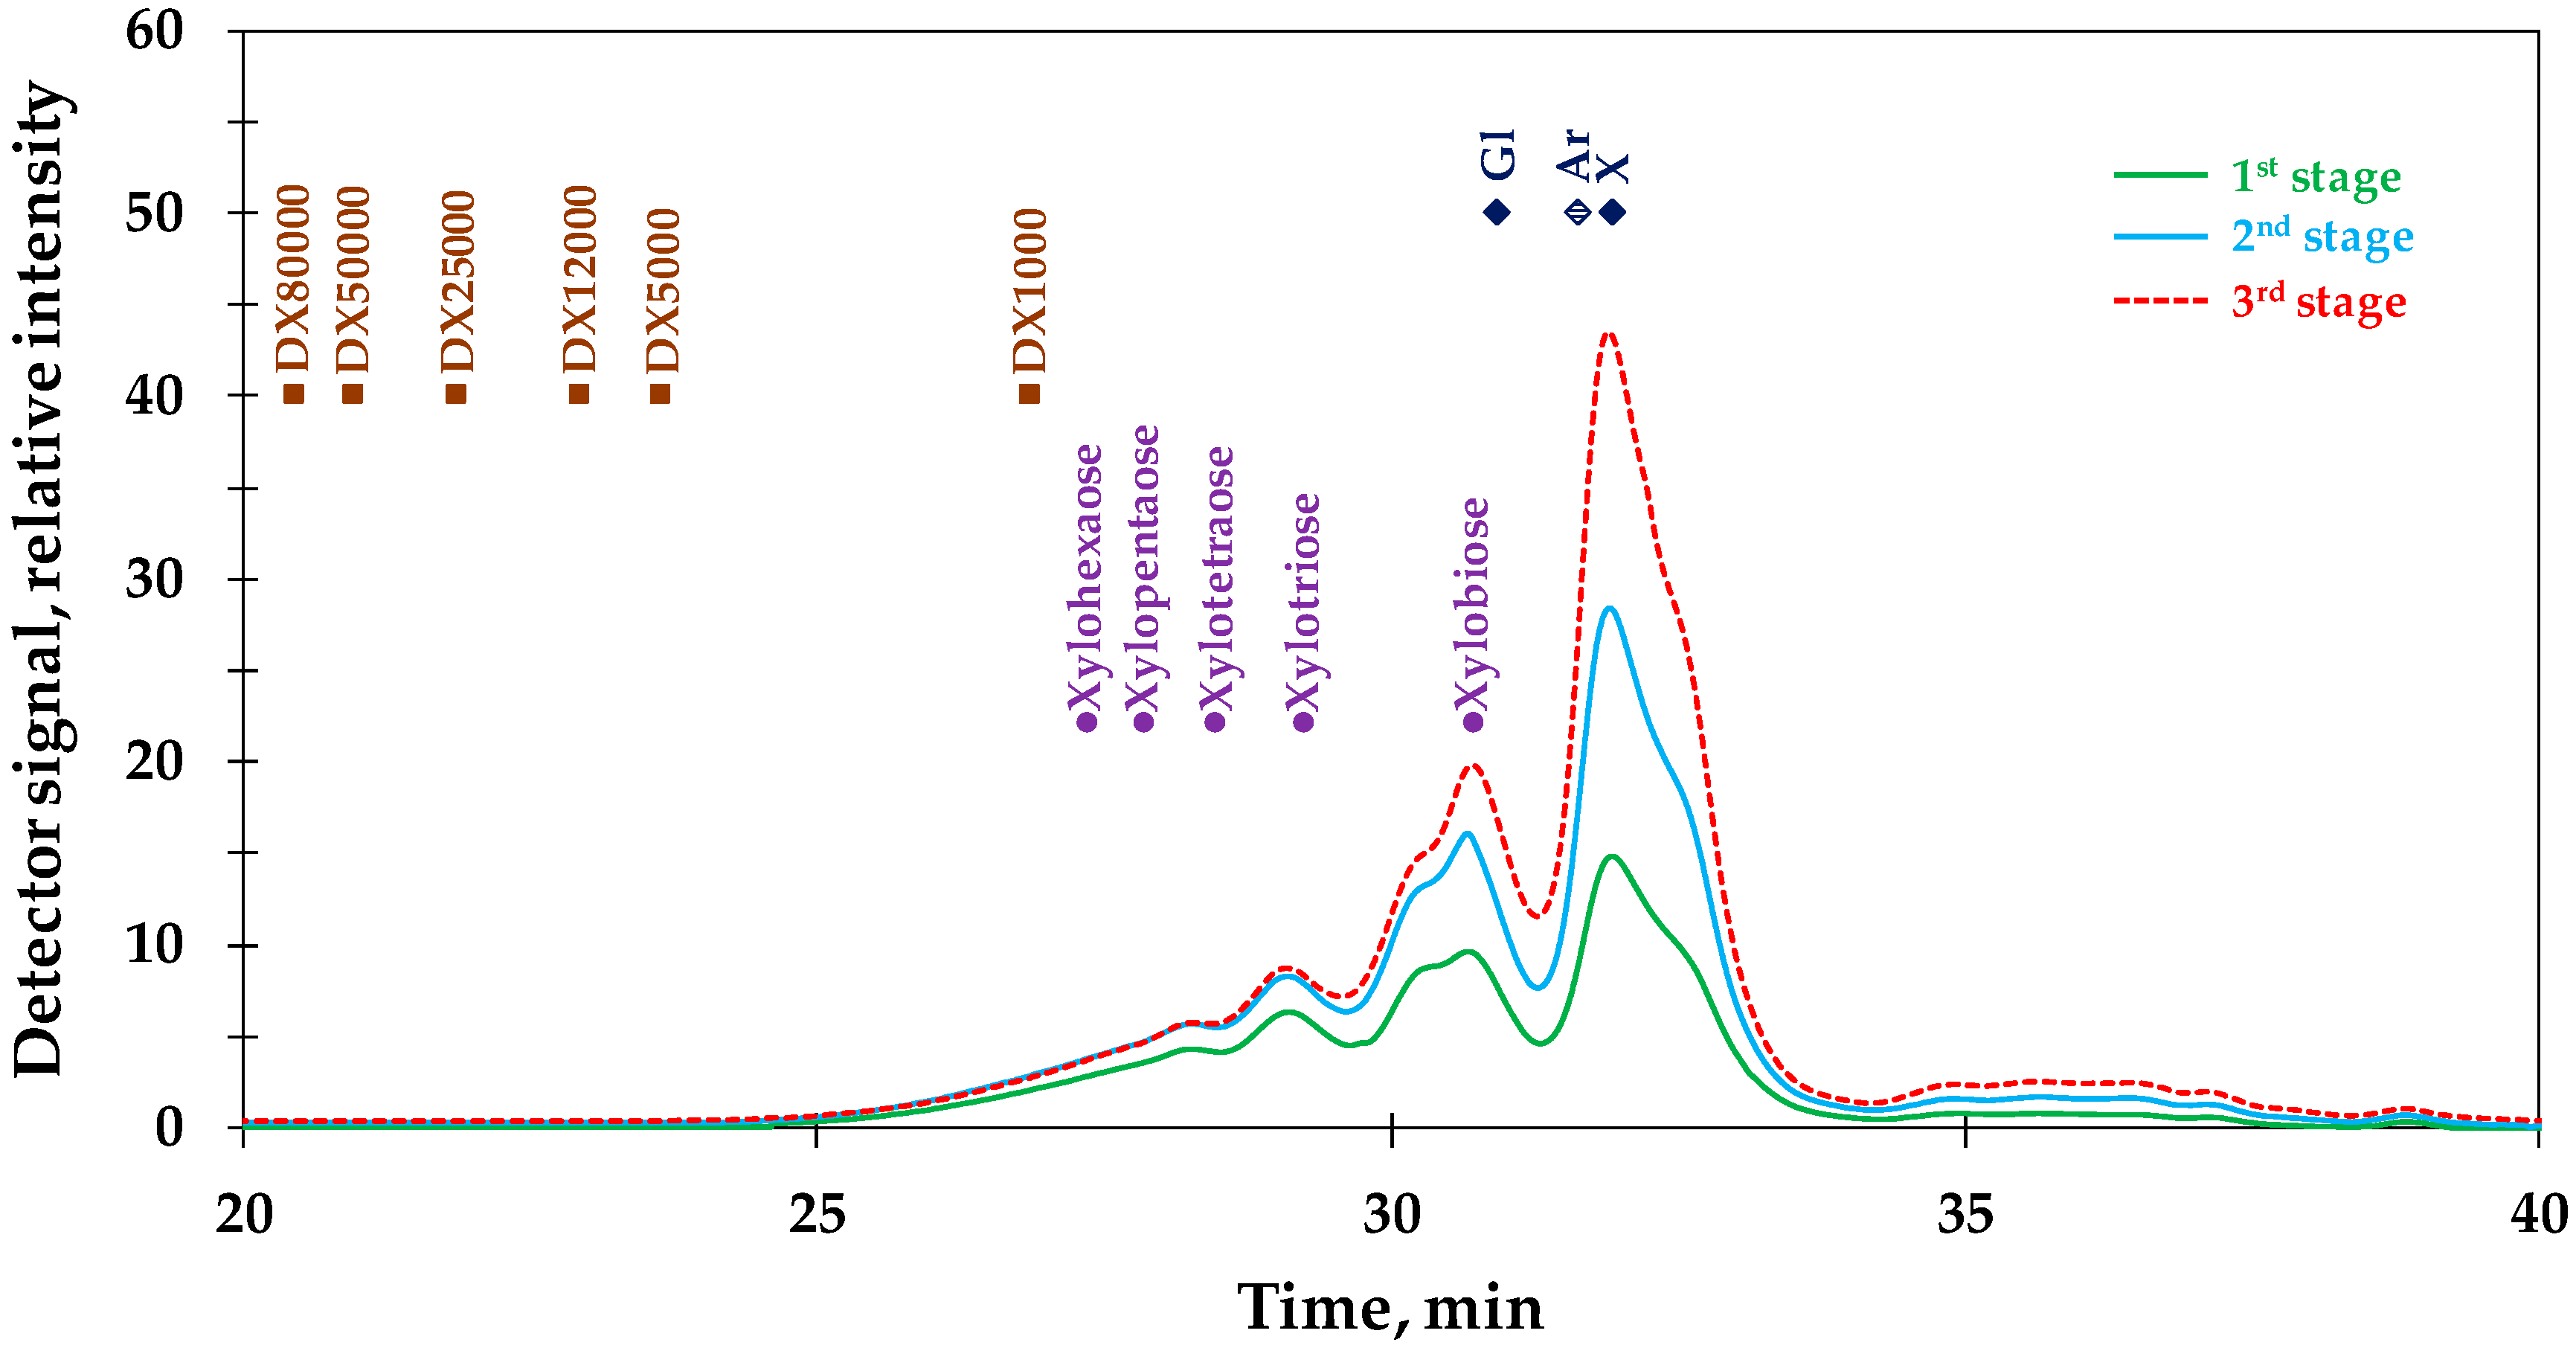
Crossflow coupling of autohydrolysis stages enables the manufacture of solutions containing a number of valuable products at increased concentrations. When Eucalyptus globulus was used as a feedstock for autohydrolysis, most of the hemicellulose fraction is converted into soluble products (including oligosaccharides, monosaccharides, furans, organic acids). The kinetic principles of conventional autohydrolysis processing has been established for a number of lignocellulosic materials (including wood), but (to our knowledge), no literature has been reported on the kinetic modeling of multistage autohydrolysis. This problem shows specific features, derived from the presence (from the beginning) of reactive intermediates and catalysts at increased concentrations. In this study, the concentration profiles determined for the target products present in the liquid phases from the diverse crossflow stages were employed for kinetic modeling. Several mechanisms based on pseudohomogeneous reactions and Arrhenius-type dependence of the kinetic coefficients on temperature were assessed. Overestimation of the predicted concentrations of pentoses was observed for kinetic models involving the generation of oligosaccharides from their precursors, with further formation of monosaccharides, and the generation of furans from sugars (with possible consumption of furfural to yield decomposition products). Oppositely, satisfactory results were achieved when the models were modified to include both the dehydration of pentoses into F and their consumption by parasitic reactions. Additional characterization of the reaction products by HPSEC, HPAEC-PAD, and MALDI-TOF MS confirmed that the major reaction products were monosaccharides and higher saccharides with degrees DP ≤ 7, which presented a rich substitution pattern by O-methyluronic and acetyl groups.

Author Contributions

Conceptualization, V.S. and J.C.P.; methodology, M.L., V.S. and J.C.P.; validation, M.L., V.S. and J.C.P.; investigation, M.L., V.S. and J.C.P.; resources, J.C.P.; data curation, M.L.; writing—original draft preparation, M.L., V.S. and J.C.P.; writing—review and editing, M.L., V.S. and J.C.P.; supervision, V.S. and J.C.P.; project administration, J.C.P.; funding acquisition, V.S. and J.C.P. All authors have read and agreed to the published version of the manuscript.

Funding

This research was funded by the “Ministry of Economy and Competitiveness” of Spain (research project “Modified aqueous media for wood biorefineries”, reference CTQ2017-82962-R).

Acknowledgments

Mar López thanks “Xunta de Galicia” and the European Union (European Social Fund – ESF) for her predoctoral grant (reference ED481A-2017/316).

Conflicts of Interest

The authors declare no conflict of interest.

References

  1. Ebringerová, A.; Hromádková, Z.; Heinze, T. Hemicellulose. Adv. Polym. Sci. 2005, 186, 1–67. [Google Scholar]
  2. Vázquez, M.J.; Alonso, J.L.; Domínguez, H.; Parajó, J.C. Production and refining of soluble products from Eucalyptus globulus glucuronoxylan. Collect. Czech. Chem. Commun. 2007, 72, 307–320. [Google Scholar] [CrossRef]
  3. Kabel, M.A.; Carvalheiro, F.; Garrote, G.; Avgerinos, E.; Koukios, E.; Parajó, J.C.; Gírio, F.M.; Schols, H.A.; Voragen, A.G.J. Hydrothermally treated xylan rich by-products yield different classes of xylo-oligosaccharides. Carbohydr. Polym. 2002, 50, 47–52. [Google Scholar] [CrossRef]
  4. Rivas, S.; Vila, C.; Santos, V.; Parajó, J.C. Furfural production from birch hemicelluloses by two-step processing: A potential technology for biorefineries. Holzforsschung 2016, 70, 901–910. [Google Scholar] [CrossRef]
  5. Garrote, G.; Domínguez, H.; Parajó, J.C. Mild autohydrolysis: An environmentally friendly technology for xylooligosaccharide production from wood. J. Chem. Technol. Biotechnol. 1999, 74, 1101–1109. [Google Scholar] [CrossRef]
  6. Garrote, G.; Parajó, J.C. Non-isothermal autohydrolysis of Eucalyptus wood. Wood Sci. Technol. 2002, 36, 111–123. [Google Scholar] [CrossRef]
  7. Garrote, G.; Domínguez, H.; Parajó, J.C. Study on the deacetylation of hemicelluloses during the hydrothermal processing of Eucalyptus wood. Holz Roh Werkst. 2001, 59, 53–59. [Google Scholar] [CrossRef]
  8. López, M.; Penín, L.; Vila, C.; Santos, V.; Parajó, J.C. Multi-stage hydrothermal processing of Eucalyptus globulus wood: An experimental assessment. J. Wood Chem. Technol. 2019, 39, 329–342. [Google Scholar] [CrossRef]
  9. Yáñez, R.; Romaní, A.; Garrote, G.; Alonso, J.L.; Parajó, J.C. Processing of Acacia dealbata in aqueous media: First step of a wood biorefinery. Ind. Eng. Chem. Res. 2009, 48, 6618–6626. [Google Scholar] [CrossRef]
  10. González-Muñoz, M.J.; Rivas, S.; Santos, V.; Parajó, J.C. Aqueous processing of Pinus pinaster wood: Kinetics of polysaccharide breakdown. Chem. Eng. J. 2013, 231, 380–387. [Google Scholar] [CrossRef]
  11. Garrote, G.; Domínguez, H.; Parajó, J.C. Kinetic modelling of corncob autohydrolysis. Process. Biochem. 2001, 36, 571–578. [Google Scholar] [CrossRef]
  12. Gullón, B.; Eibes, G.; Dávila, I.; Vila, C.; Labidi, J.; Gullón, P. Valorization of vine shoots based on the autohydrolysis fractionation optimized by a kinetic approach. Ind. Eng. Chem. Res. 2017, 56, 14164–14171. [Google Scholar] [CrossRef]
  13. Caparrós, S.; Garrote, G.; Ariza, J.; López, F. Autohydrolysis of Arundo donax L., a kinetic assessment. Ind. Eng. Chem. Res. 2006, 45, 8909–8920. [Google Scholar] [CrossRef]
  14. Garrote, G.; Domínguez, H.; Parajó, J.C. Production of substituted oligosaccharides by hydrolytic processing of barley husks. Ind. Eng. Chem. Res. 2004, 43, 1608–1614. [Google Scholar] [CrossRef]
  15. González, D.; Santos, V.; Parajó, J.C. Manufacture of fibrous reinforcements for biocomposites and hemicellulosic oligomers from bamboo. Chem. Eng. J. 2011, 167, 278–287. [Google Scholar] [CrossRef]
  16. González, D.; Campos, A.R.; Cunha, A.M.; Santos, V.; Parajó, J.C. Manufacture of fibrous reinforcements for biodegradable biocomposites from Cytisus scoparius. J. Soc. Chem. Ind. 2011, 86, 575–583. [Google Scholar]
  17. Gullón, B.; Yáñez, R.; Alonso, J.L.; Parajó, J.C. Production of oligosaccharides and sugars from rye straw: A kinetic approach. Bioresour. Technol. 2010, 101, 6676–6684. [Google Scholar] [CrossRef]
  18. Nabarlatz, D.; Farriol, X.; Montané, D. Autohydrolysis of almond shells for the production of xylo-oligosaccharides: Product characteristics and reaction kinetics. Ind. Eng. Chem. Res. 2005, 44, 7746–7755. [Google Scholar] [CrossRef]
  19. Aida, T.M.; Shiraishi, N.; Kubo, M.; Watanabe, M.; Smith, R.L., Jr. Reaction kinetics of D-xylose in sub- and supercritical water. J. Supercrit. Fluids 2010, 55, 208–216. [Google Scholar] [CrossRef]
  20. Lange, J.P.; van der Heide, E.; van Buijtenen, J.; Price, R. Furfural—A promising platform for lignocellulosic biofuels. ChemSusChem 2012, 5, 150–166. [Google Scholar] [CrossRef]
  21. Antal, M.J., Jr.; Leesomboon, T.; Mok, W.S.; Richards, G.N. Mechanism of formation of 2-furaldehyde from D-xylose. Carbohydr. Res. 1991, 217, 71–85. [Google Scholar] [CrossRef]
  22. Enslow, K.R.; Bell, A.T. The kinetics of Brönsted acid-catalyzed hydrolysis of hemicellulose dissolved in 1-ethyl-3-methylimidazolium chloride. RSC Adv. 2012, 2, 10028–10036. [Google Scholar] [CrossRef]
  23. Nimlos, M.R.; Qian, X.; Davis, M.; Himmel, M.E.; Johnson, D.K. Energetics of xylose decomposition as determined using quantum mechanics modeling. J. Phys. Chem. A 2006, 110, 11824–11838. [Google Scholar] [CrossRef] [PubMed]
  24. Rasmussen, H.; Sørensen, H.R.; Meyer, A.S. Formation of degradation compounds from lignocellulosic biomass in the biorefinery: Sugar reaction mechanisms. Carbohydr. Res. 2014, 385, 45–57. [Google Scholar] [CrossRef] [PubMed]
  25. Kabel, M.A.; Schols, H.A.; Voragen, A.G.J. Complex xylo-oligosaccharides identified from hydrothermally treated Eucalyptus wood and brewery’s spent grain. Carbohydr. Polym. 2002, 50, 191–200. [Google Scholar] [CrossRef]
  26. Gullón, P.; González-Muñoz, M.J.; van Gool, M.P.; Schols, H.A.; Hirsch, J.; Ebringerová, A.; Parajó, J.C. Structural features and properties of soluble products derived from Eucalyptus globulus hemicelluloses. Food Chem. 2011, 127, 1798–1807. [Google Scholar] [CrossRef]
  27. Blumenkrantz, N.; Asboe-Hansen, G. New method for quantitative determination of uronic acids. Anal. Biochem. 1973, 54, 484–489. [Google Scholar] [CrossRef]
  28. Peleteiro, S.; Santos, V.; Garrote, G.; Parajó, J.C. Furfural production from Eucalyptus wood using an acidic ionic liquid. Carbohydr. Polym. 2016, 146, 20–25. [Google Scholar] [CrossRef]
Figure 1. Processing scheme considered in this study.
Catalysts 10 00337 g001
Figure 2. Kinetic model considered in this study.
Catalysts 10 00337 g002
Figure 3. Experimental and calculated concentrations of the soluble products involved in the kinetic model. (a) Data determined for the first stage; (b) data determined for the second stage; (c) data determined for the third stage.
Catalysts 10 00337 g003
Figure 4. High Pressure Size Exclusion Chromatography (HPSEC) data obtained for the liquid phases from the 1st, 2nd and 3rd reaction stages, operating under conditions leading to the maximum concentration of XOs.
Catalysts 10 00337 g004
Figure 5. High Performance Anion Exchange Chromatography with Pulsed Amperometric Detection (HPAEC-PAD) data obtained for the liquid phases from the 1st, 2nd and 3rd reaction stages, operating under conditions leading to the maximum concentration of XOs.
Catalysts 10 00337 g005
Table 1. Composition of the E. globulus wood lot employed in experiments (data obtained from triplicate determinations).
FractionWeight % (Oven-Dry Basis)Standard Deviations
Glucan (Gn)40.80.71
Xylan (Xn)16.80.15
Arabinosyl groups0.630.02
Acetyl groups3.160.08
Klason lignin22.50.30
Acid soluble lignin1.110.13
Uronic acids5.350.38
Ash0.290.05
Water-soluble extractives4.360.12
Other (average value, by difference)4.92-
Table 2. Concentrations determined for the target products (in g/L) in the liquid phase from the first reaction stage.
ComponentTemperature (°C)/Reaction Time (min)
170/26.4180/30.0185/31.8187/32.5190/33.6192/34.3
GOs0.7540.9821.021.051.111.14
XOs1.758.139.8813.114.114.8
ArOs0.2010.0890.0790.0670.0200.041
AcO0.3921.772.062.913.173.33
Gl0.1600.1920.2190.2490.2690.285
X0.2040.7011.061.522.092.55
Ar0.1600.2890.3520.4080.4440.441
FA0.0250.0580.0670.0790.0790.100
AcH0.0100.2110.2750.3790.4620.554
LA<0.01<0.01<0.01<0.01<0.01<0.01
HMF0.0140.0170.0210.0390.0450.054
F0.0850.0330.0440.0850.1110.150
ComponentTemperature (°C)/Reaction Time (min)
195/35.4196/35.7199/36.8200/37.2205/39.0210/40.8213/41.9
GOs1.191.181.271.331.281.201.22
XOs15.915.114.914.911.96.044.58
ArOs<0.01<0.01<0.01<0.01<0.01<0.01<0.01
AcO3.553.483.513.683.1351.741.54
Gl0.3090.3070.3670.3740.4440.6960.734
X3.523.425.125.417.319.9510.2
Ar0.4730.4830.4880.5060.5360.3220.454
FA0.1110.1200.1320.1540.1850.2760.291
AcH0.7000.7051.051.051.562.783.04
LA<0.01<0.01<0.01<0.01<0.01<0.01<0.01
HMF0.0650.0670.0980.1060.1510.2820.310
F0.2070.2330.3350.3770.7271.531.76
Table 3. Concentrations determined for the target products (in g/L) in the liquid phase from the second reaction stage.
ComponentTemperature (°C)/Reaction Time (min)
160/22.8165/24.6170/26.4175/28.2180/30.0185/31.8
GOs1.731.832.002.212.152.34
XOs14.514.215.818.620.624.1
ArOs0.1150.1980.1820.0960.0440.010
AcO3.373.143.334.154.265.11
Gl0.4170.3960.4560.4540.5380.506
X4.104.344.495.295.737.00
Ar0.5730.6500.6720.8310.8780.943
FA0.1970.1960.2220.2370.2600.312
AcH0.9581.061.111.351.461.73
LA< 0.01< 0.01< 0.01< 0.01< 0.01< 0.01
HMF0.0570.0700.0700.0900.0900.120
F0.2250.2780.2860.380.4460.558
ComponentTemperature (°C)/Reaction Time (min)
190/33.6195/35.4200/37.2205/39.0210/40.8215/42.6220/44.4
GOs2.292.352.152.492.161.731.77
XOs25.425.021.918.516.67.541.99
ArOs< 0.01< 0.01< 0.01< 0.01< 0.01< 0.01< 0.01
AcO5.866.155.365.064.512.851.27
Gl0.6090.6220.7810.8081.011.301.34
X8.5710.912.015.015.317.216.6
Ar1.011.020.9720.9770.9680.6480.618
FA0.3500.3860.4200.4410.4560.5330.563
AcH2.052.582.904.034.326.376.45
LA< 0.01< 0.01< 0.01< 0.01< 0.01< 0.01< 0.01
HMF0.1500.1760.2170.3060.3630.6160.652
F0.7521.141.452.342.594.434.61
Table 4. Concentrations determined for the target products (in g/L) in the liquid phase from the third reaction stage.
ComponentTemperature (°C)/Reaction Time (min)
160/22.8165/24.6170/26.4175/28.2180/30.0185/31.8
GOs2.552.242.452.502.622.67
XOs23.022.023.624.527.628.4
ArOs0.1770.0950.1740.0940.031<0.01
AcO5.314.965.195.636.136.56
Gl0.7890.7460.8130.8180.9340.928
X9.079.119.4410.111.612.3
Ar0.9861.001.031.141.231.32
FA0.3860.4010.4170.4070.4500.484
AcH2.342.282.472.63.043.14
LA0.0250.0270.0300.0280.0340.032
HMF0.1370.1530.1430.1850.1800.234
F0.7220.7270.8030.9001.171.28
ComponentTemperature (°C)/Reaction Time (min)
190/33.6195/35.4200/37.2205/39.0210/40.8215/42.6
GOs2.412.462.392.622.391.89
XOs29.526.824.520.114.45.24
ArOs<0.01<0.01<0.01<0.01<0.01<0.01
AcO6.876.886.325.914.412.70
Gl1.101.201.341.461.601.86
X15.618.719.822.121.420.3
Ar1.381.531.491.271.220.806
FA0.5340.6100.6730.7210.8561.00
AcH3.994.735.426.637.479.59
LA0.0340.0230.0330.0290.0510.099
HMF0.3200.4060.4460.6470.7221.00
F1.892.443.094.175.567.67
Table 5. Equations employed for kinetic modeling of the reactions involving hemicellulosic polysaccharides and acetyl groups in wood.
X n S = [ X n S X n ] . (1)
d [ X nS ] dt = k 1 · [ X nS ] (2)
d [ XOs ] dt = k 1 · [ X nS ] k 2 · [ XOs ] (3)
d [ X ] dt = k 2 · [ XOs ] k 3 · [ X ] k 4 · [ X ] (4)
d [ Ar n ] dt = k 5 · [ Ar n ] (5)
d [ ArOs ] dt = k 5 · [ Ar n ] k 6 · [ ArOs ] (6)
d [ Ar ] dt = k 6 · [ ArOs ] k 7 · [ Ar ] k 8 · [ Ar ] (7)
d [ F ] dt = k 3 · [ X ] + k 7 · [ Ar ] (8)
Ac nS = [ Ac nS Ac n ] (9)
d [ Ac ns ] dt = k 9 · [ Ac ns ] (10)
d [ AcO ] dt = k 9 · [ Ac nS ] k 10 · [ AcO ] (11)
d [ AcH ] dt = k 10 · [ AcO ] (12)
Table 6. (a) Results achieved for the pre-exponential factors (k0i) and activation energies (Eai) of the coefficients involved in the kinetic models, and for the susceptible fractions of xylan and acetyl groups. (b) Coefficients of determination (R2) calculated for the various coefficients and stages.
(a)
(a)
ReactionCoefficientStage 1Stage 2Stage 3
Ln k0i (k0i, min−1)Eai (kJ·mol−1)Ln k0i (k0i, min−1)Eai (kJ·mol−1)Ln k0i (k0i, min−1)Eai (kJ·mol−1)
XnS →XOsk146.70182.946.84183.146.91183.3
XOs →Xk227.75118.527.85118.828.30119.9
X →Fk316.4078.216.6579.116.9079.9
X →DecPk417.4283.121.8299.823.60105.6
Arn →ArOsk525.80103.926.04104.226.32104.5
ArOs →Ark632.69124.733.12124.720.5279.1
Ar →Fk722.0299.822.40100.322.46100.4
Ar →DecPk816.4483.117.0383.317.2183.5
AcnS →AcOk933.23133.033.50133.233.54133.2
AcO →AcHk1029.14124.728.9124.829.23124.7
-αXnS0.880.900.90
-αAcnS0.900.910.93
(b)
(b)
CompoundCoefficients of Determination, R2
Stage 1Stage 2Stage 3
XOs0.9210.9370.960
X0.9900.9720.964
ArOs0.8880.6860.772
Ar0.7640.8840.844
F0.9890.9690.995
AcO0.8230.8130.830
AcH0.9630.9520.983
Table 7. Matrix Assisted Laser Desorption/Ionization Time of Flight Mass Spectrometry (MALDI-TOF) data determined for the liquid stream from the third autohydrolysis results (the m/z values corresponded to the sodium adducts of the identified compounds).
m/zPentose Units/Uronic Subst./Acetyl Subst.m/zPentose Units/Uronic Subst./Acetyl Subst.m/zPentose Units/Uronic Subst./Acetyl Subst.
537.542/1/11034.344/2/21323.857/1/4
611.584/0/11049.717/0/21339.776/2/3
653.504/0/21059.575/1/41365.847/1/5
669.273/1/11065.726/1/11371.968/1/2
695.504/0/31091.757/0/31397.989/0/4
711.453/1/21107.746/1/21413.968/1/3
785.545/0/21133.757/0/41455.958/1/4
801.534/1/11149.736/1/31471.907/2/3
827.565/0/31165.695/2/21497.918/1/5
843.504/1/21176.437/0/51546.069/1/3
869.515/0/41191.676/1/41588.109/1/4
885.494/1/31207.655/2/31630.069/1/5
917.676/0/21223.908/0/31672.039/1/6
933.615/1/11233.726/1/51720.1310/1/4
959.666/0/31239.877/1/21762.0410/1/5
975.615/1/21265.948/0/41804.0510/1/6
1001.656/0/41281.857/1/31894.1911/1/5
1017.635/1/31307.788/0/51936.2011/1/6

