The Effect of Packing Material Properties on Tars Removal by Plasma Catalysis


Abstract
:1. Introduction
2. Results and Discussion
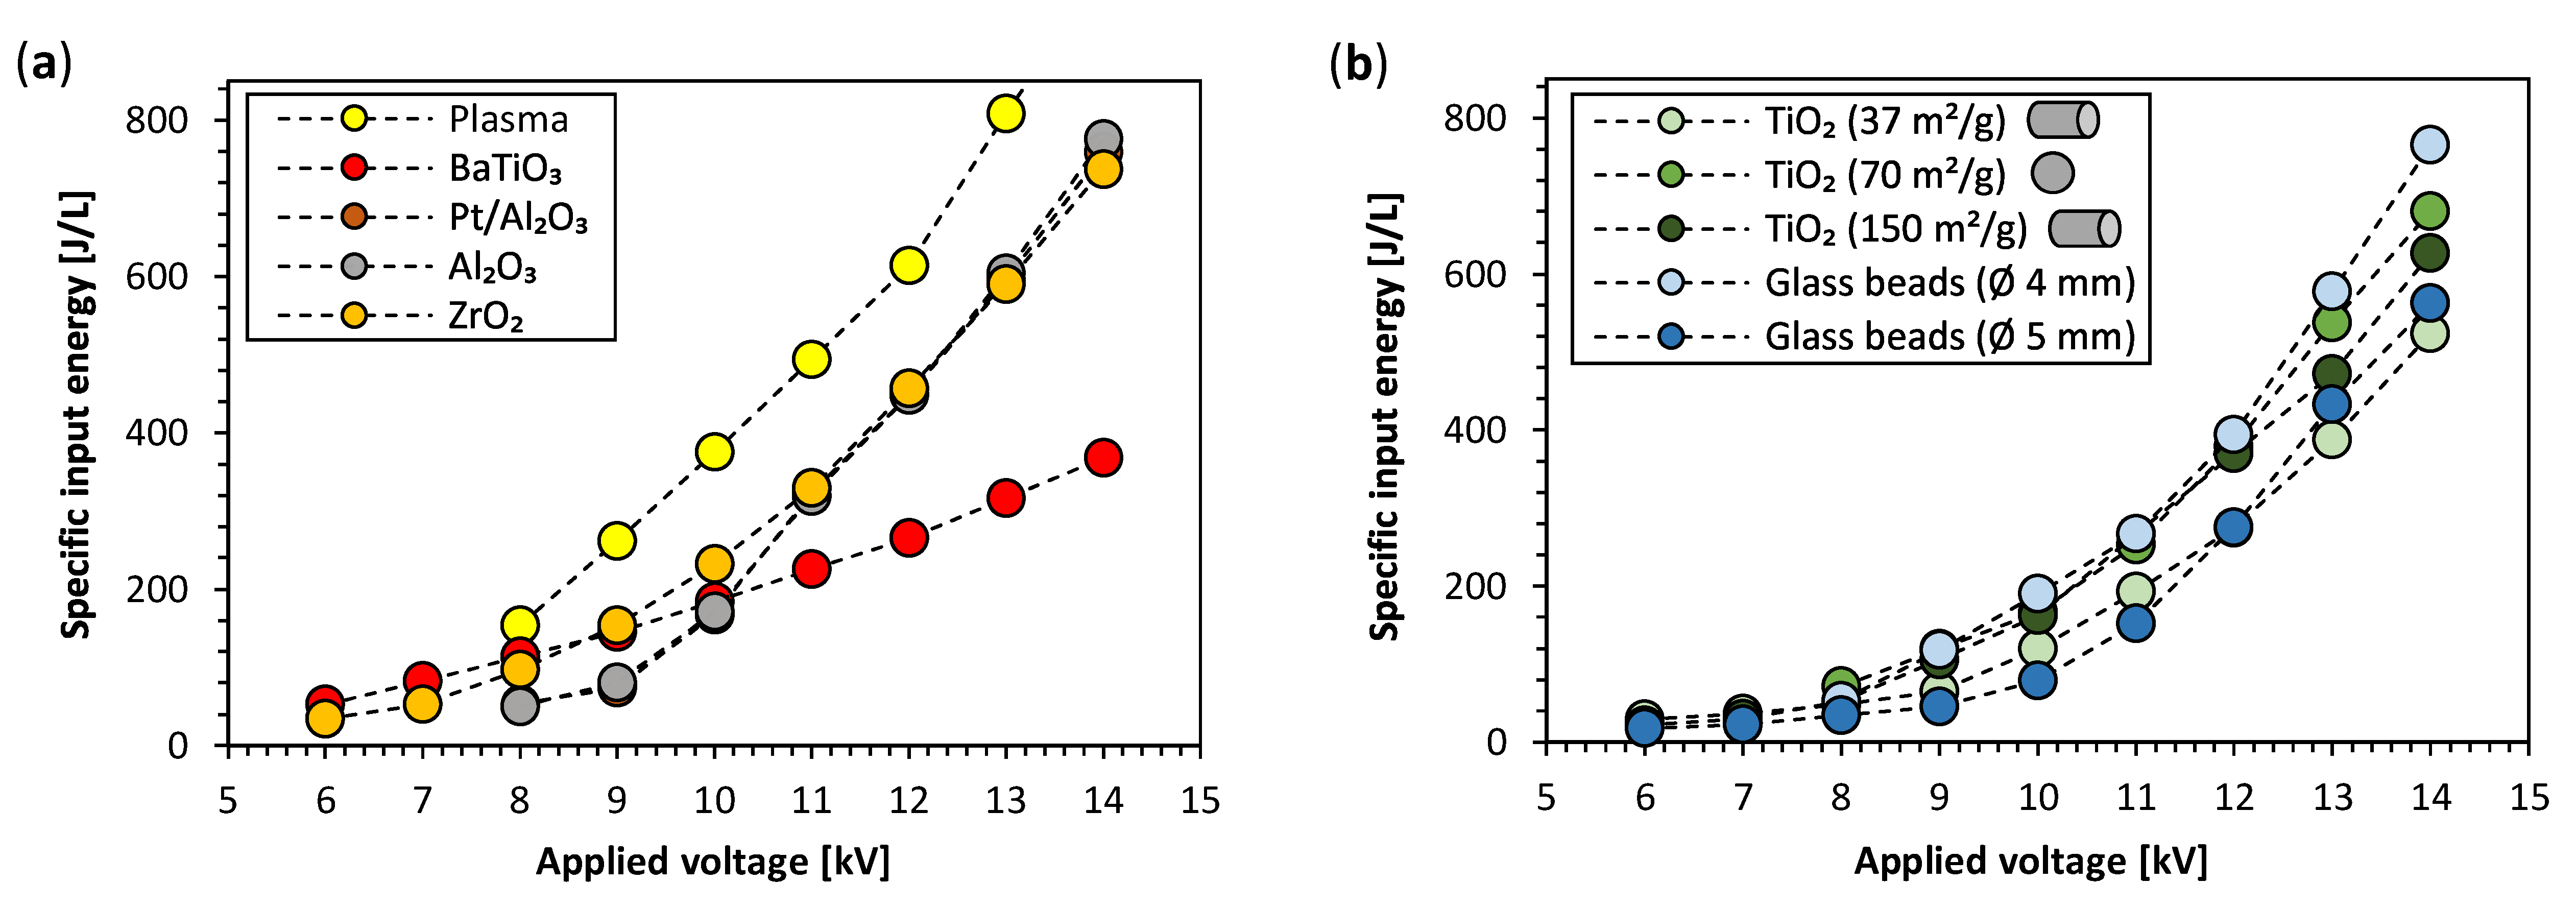
2.1. Discharge Characteristics
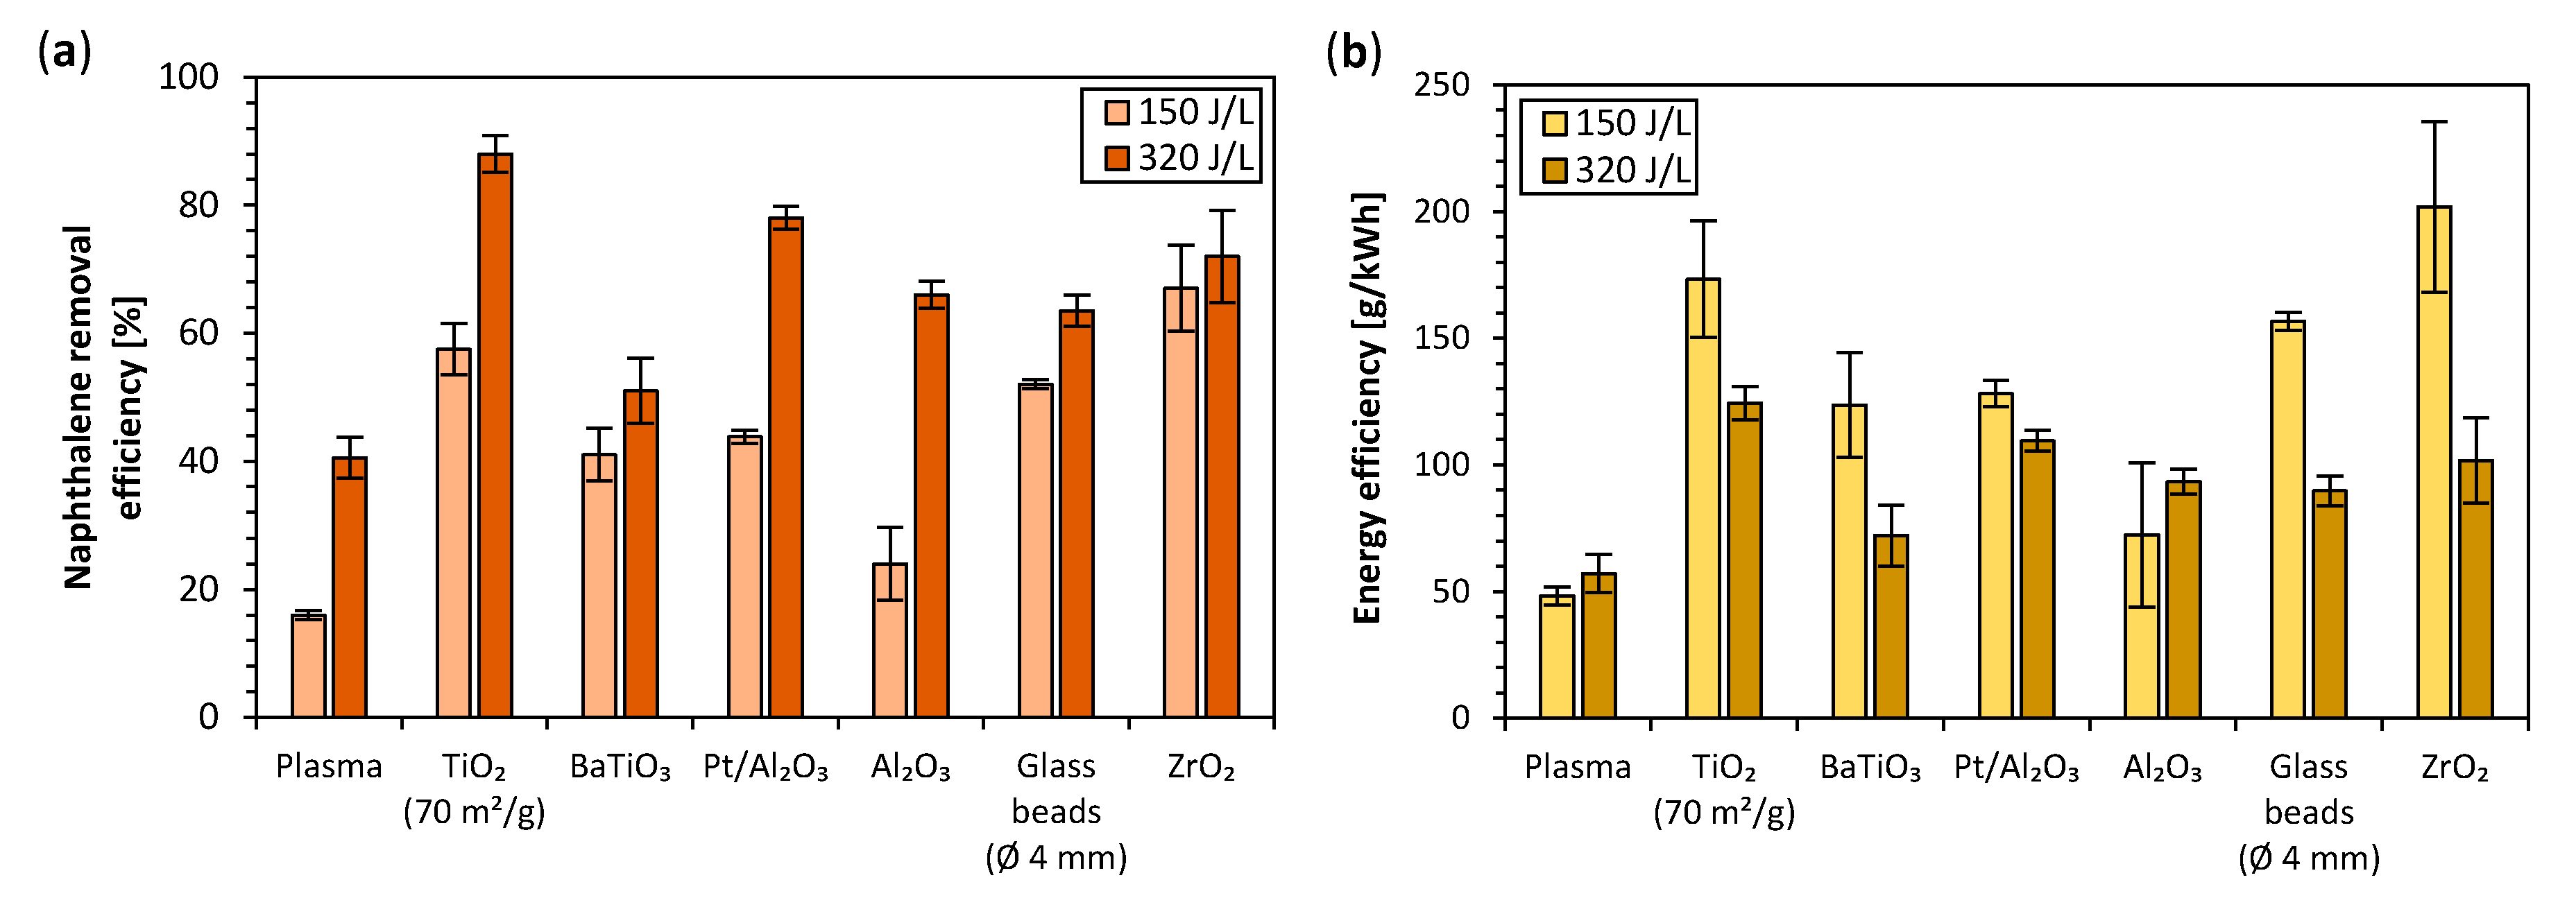
2.2. The Effect of Packing Material Type
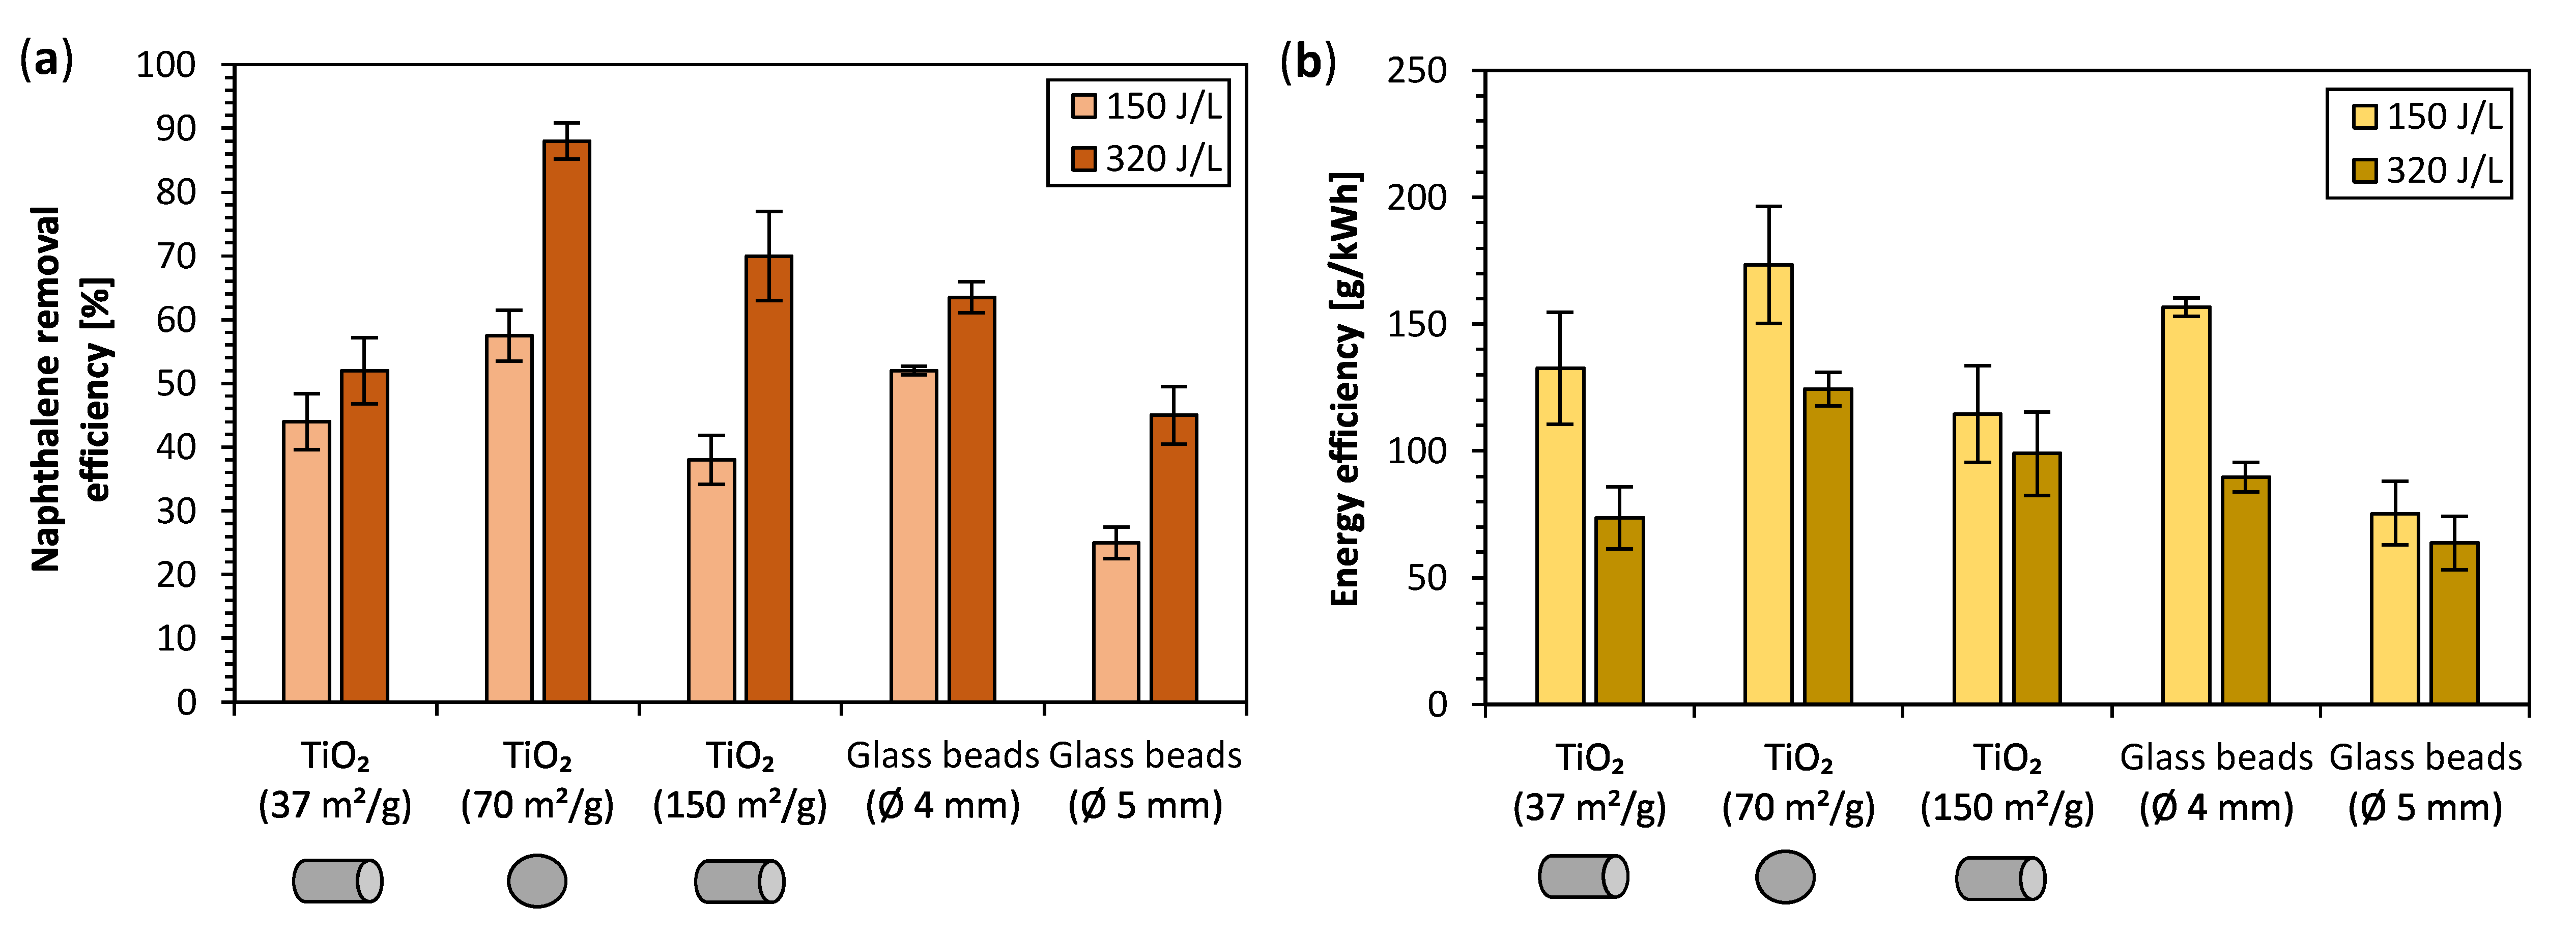
2.3. The Effect of Packing Material Properties (SSA, Shape, and Size)
2.4. Analysis of Naphthalene Decomposition By-Products
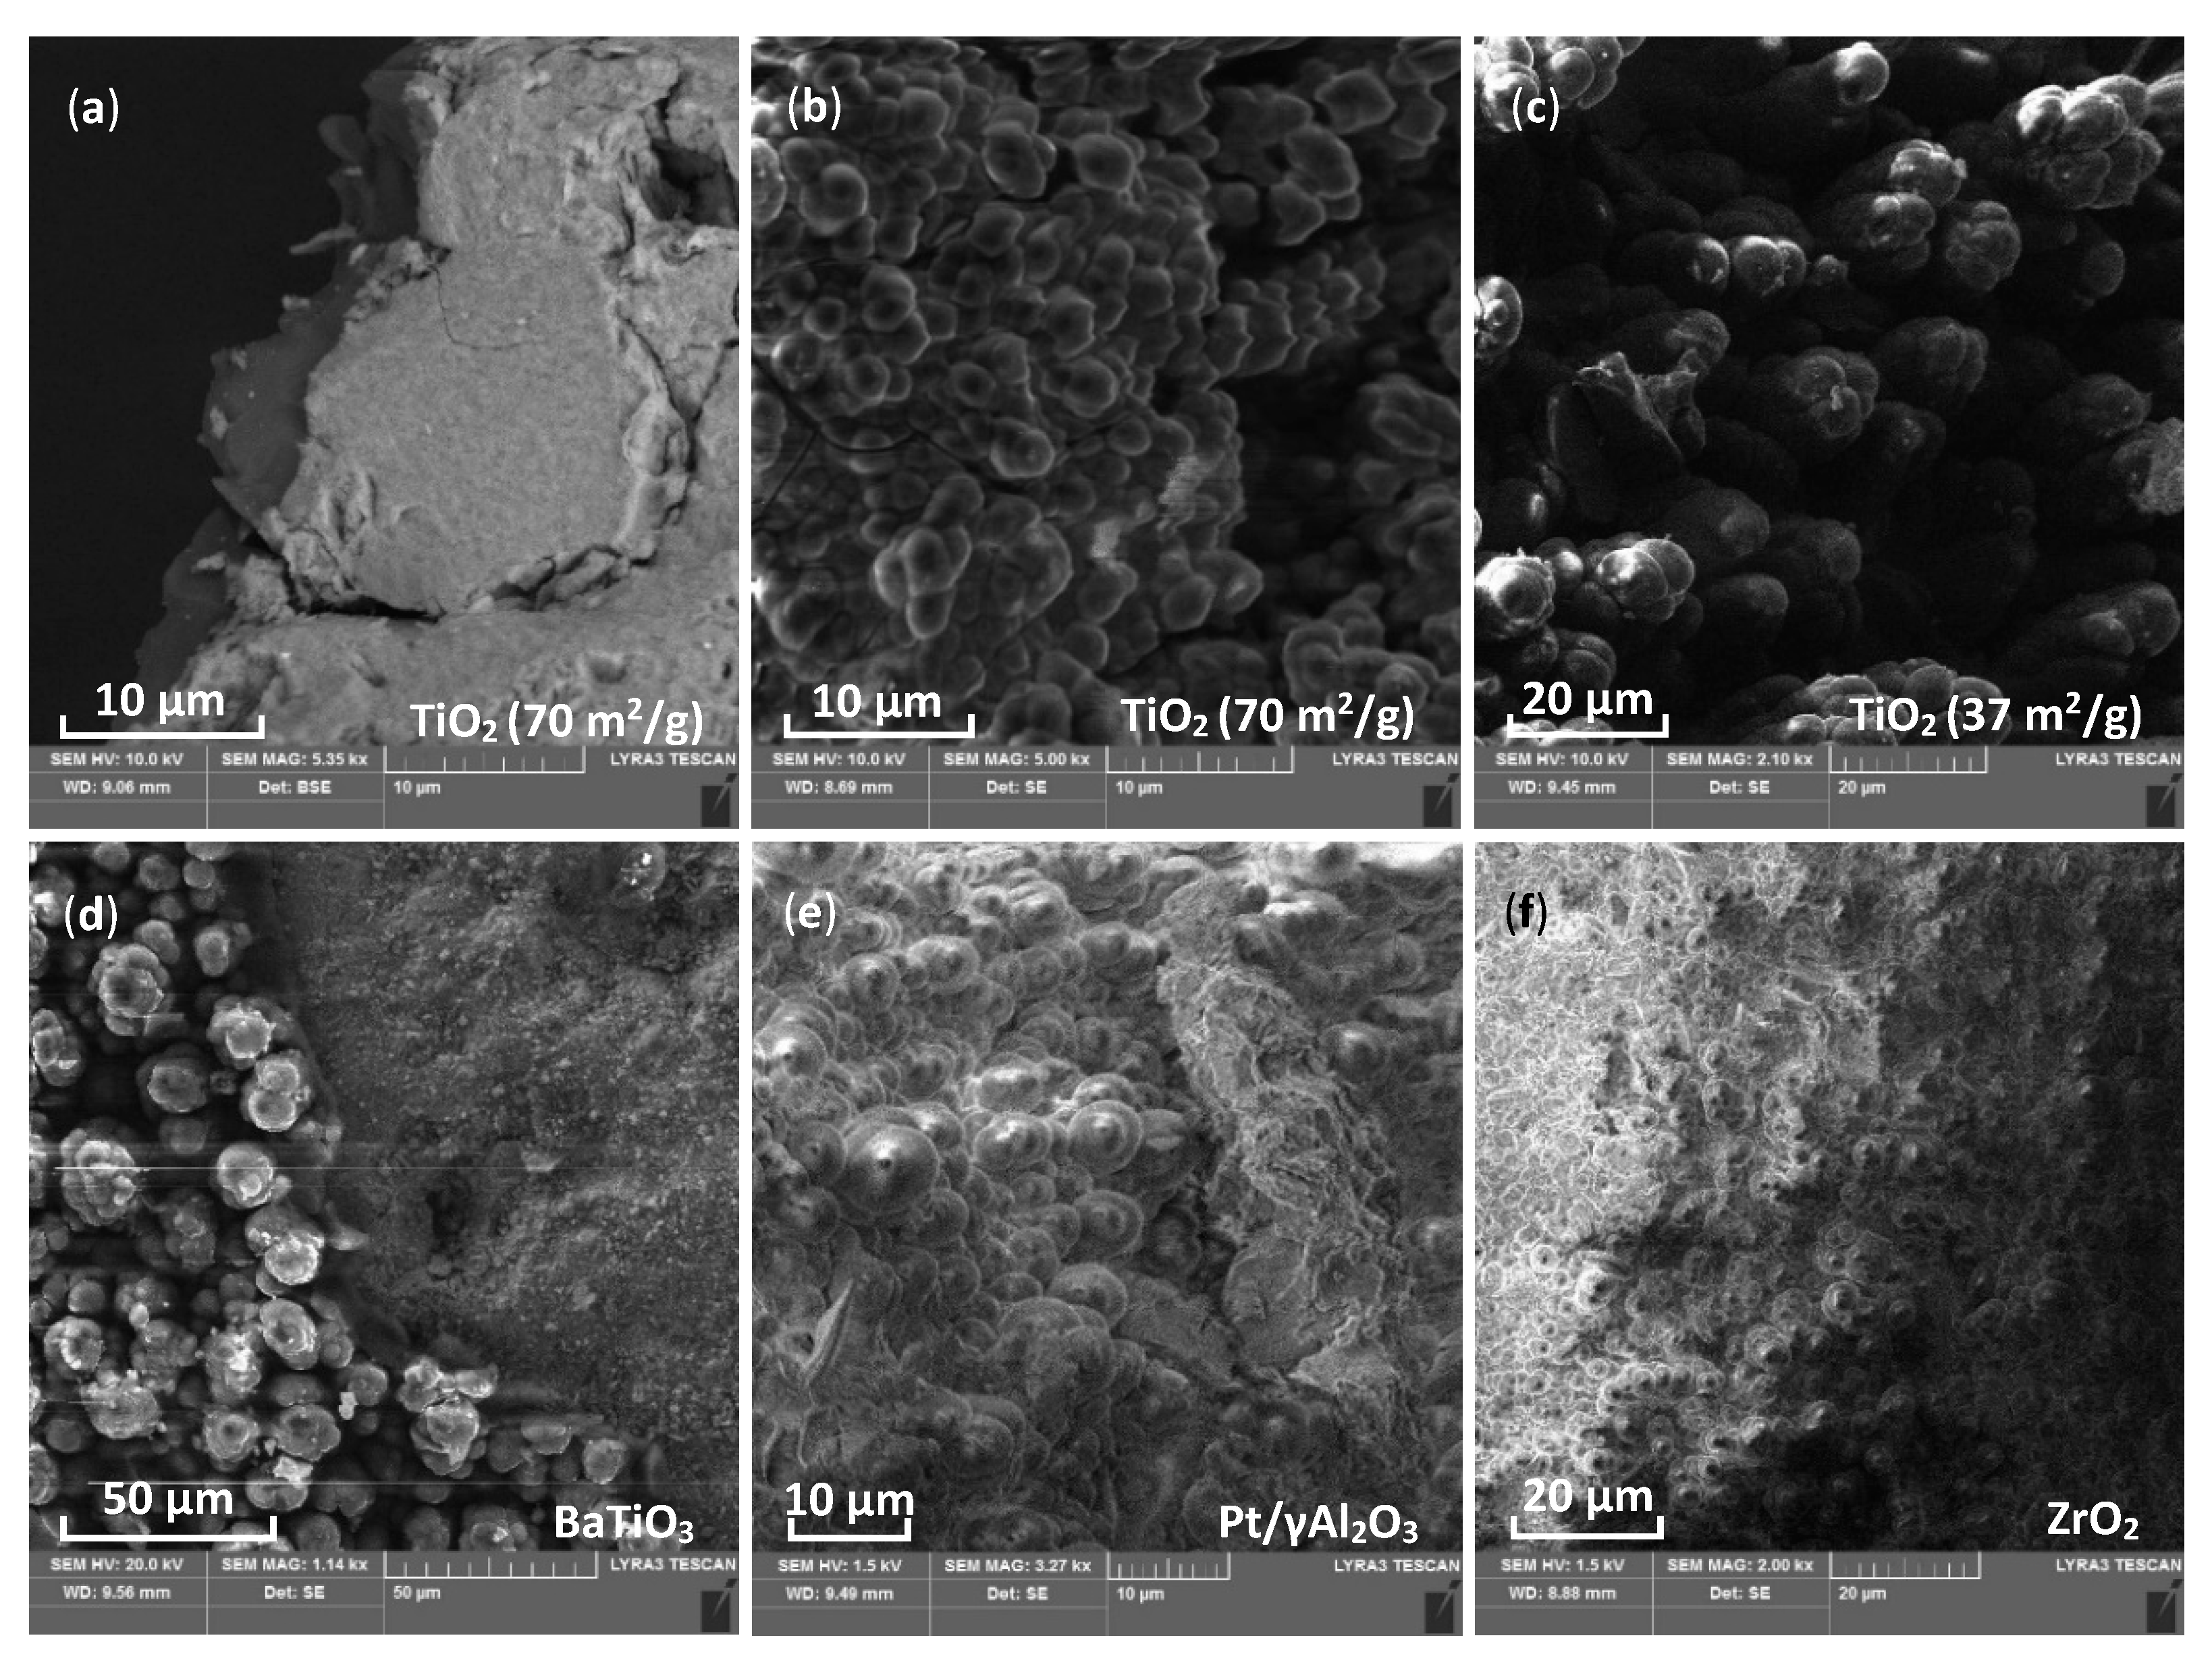
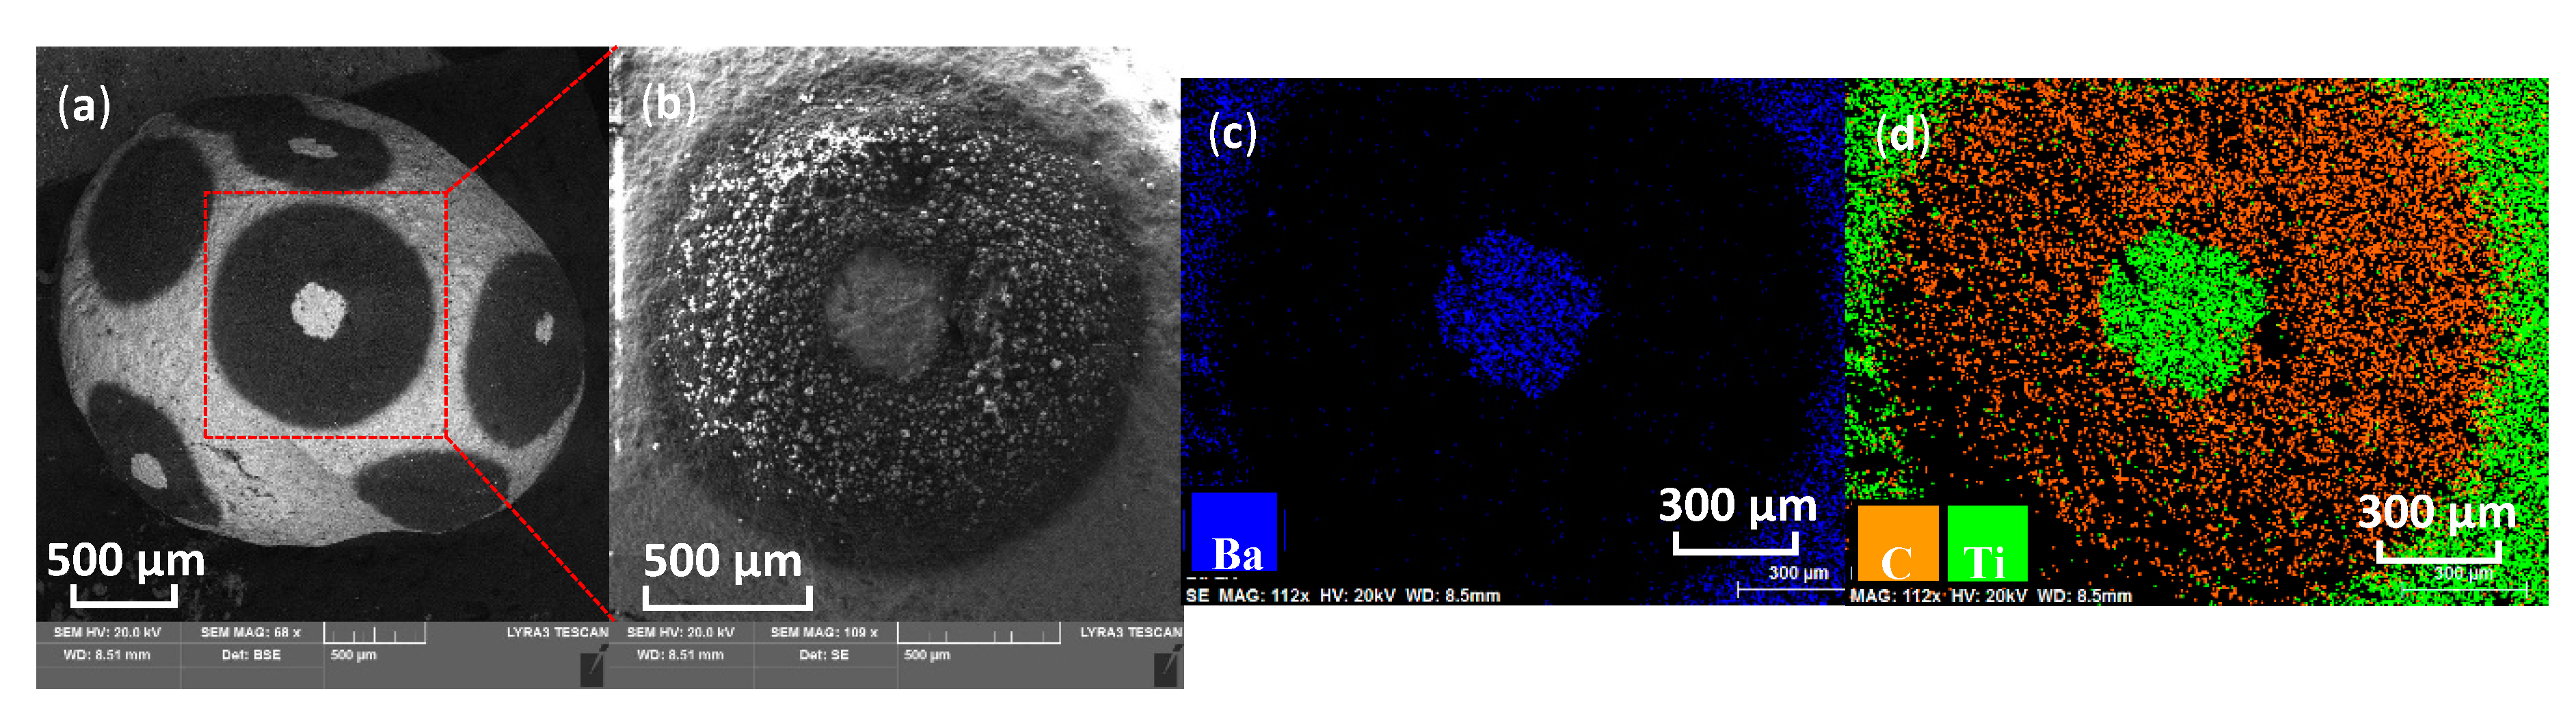
2.4.1. SEM Analysis
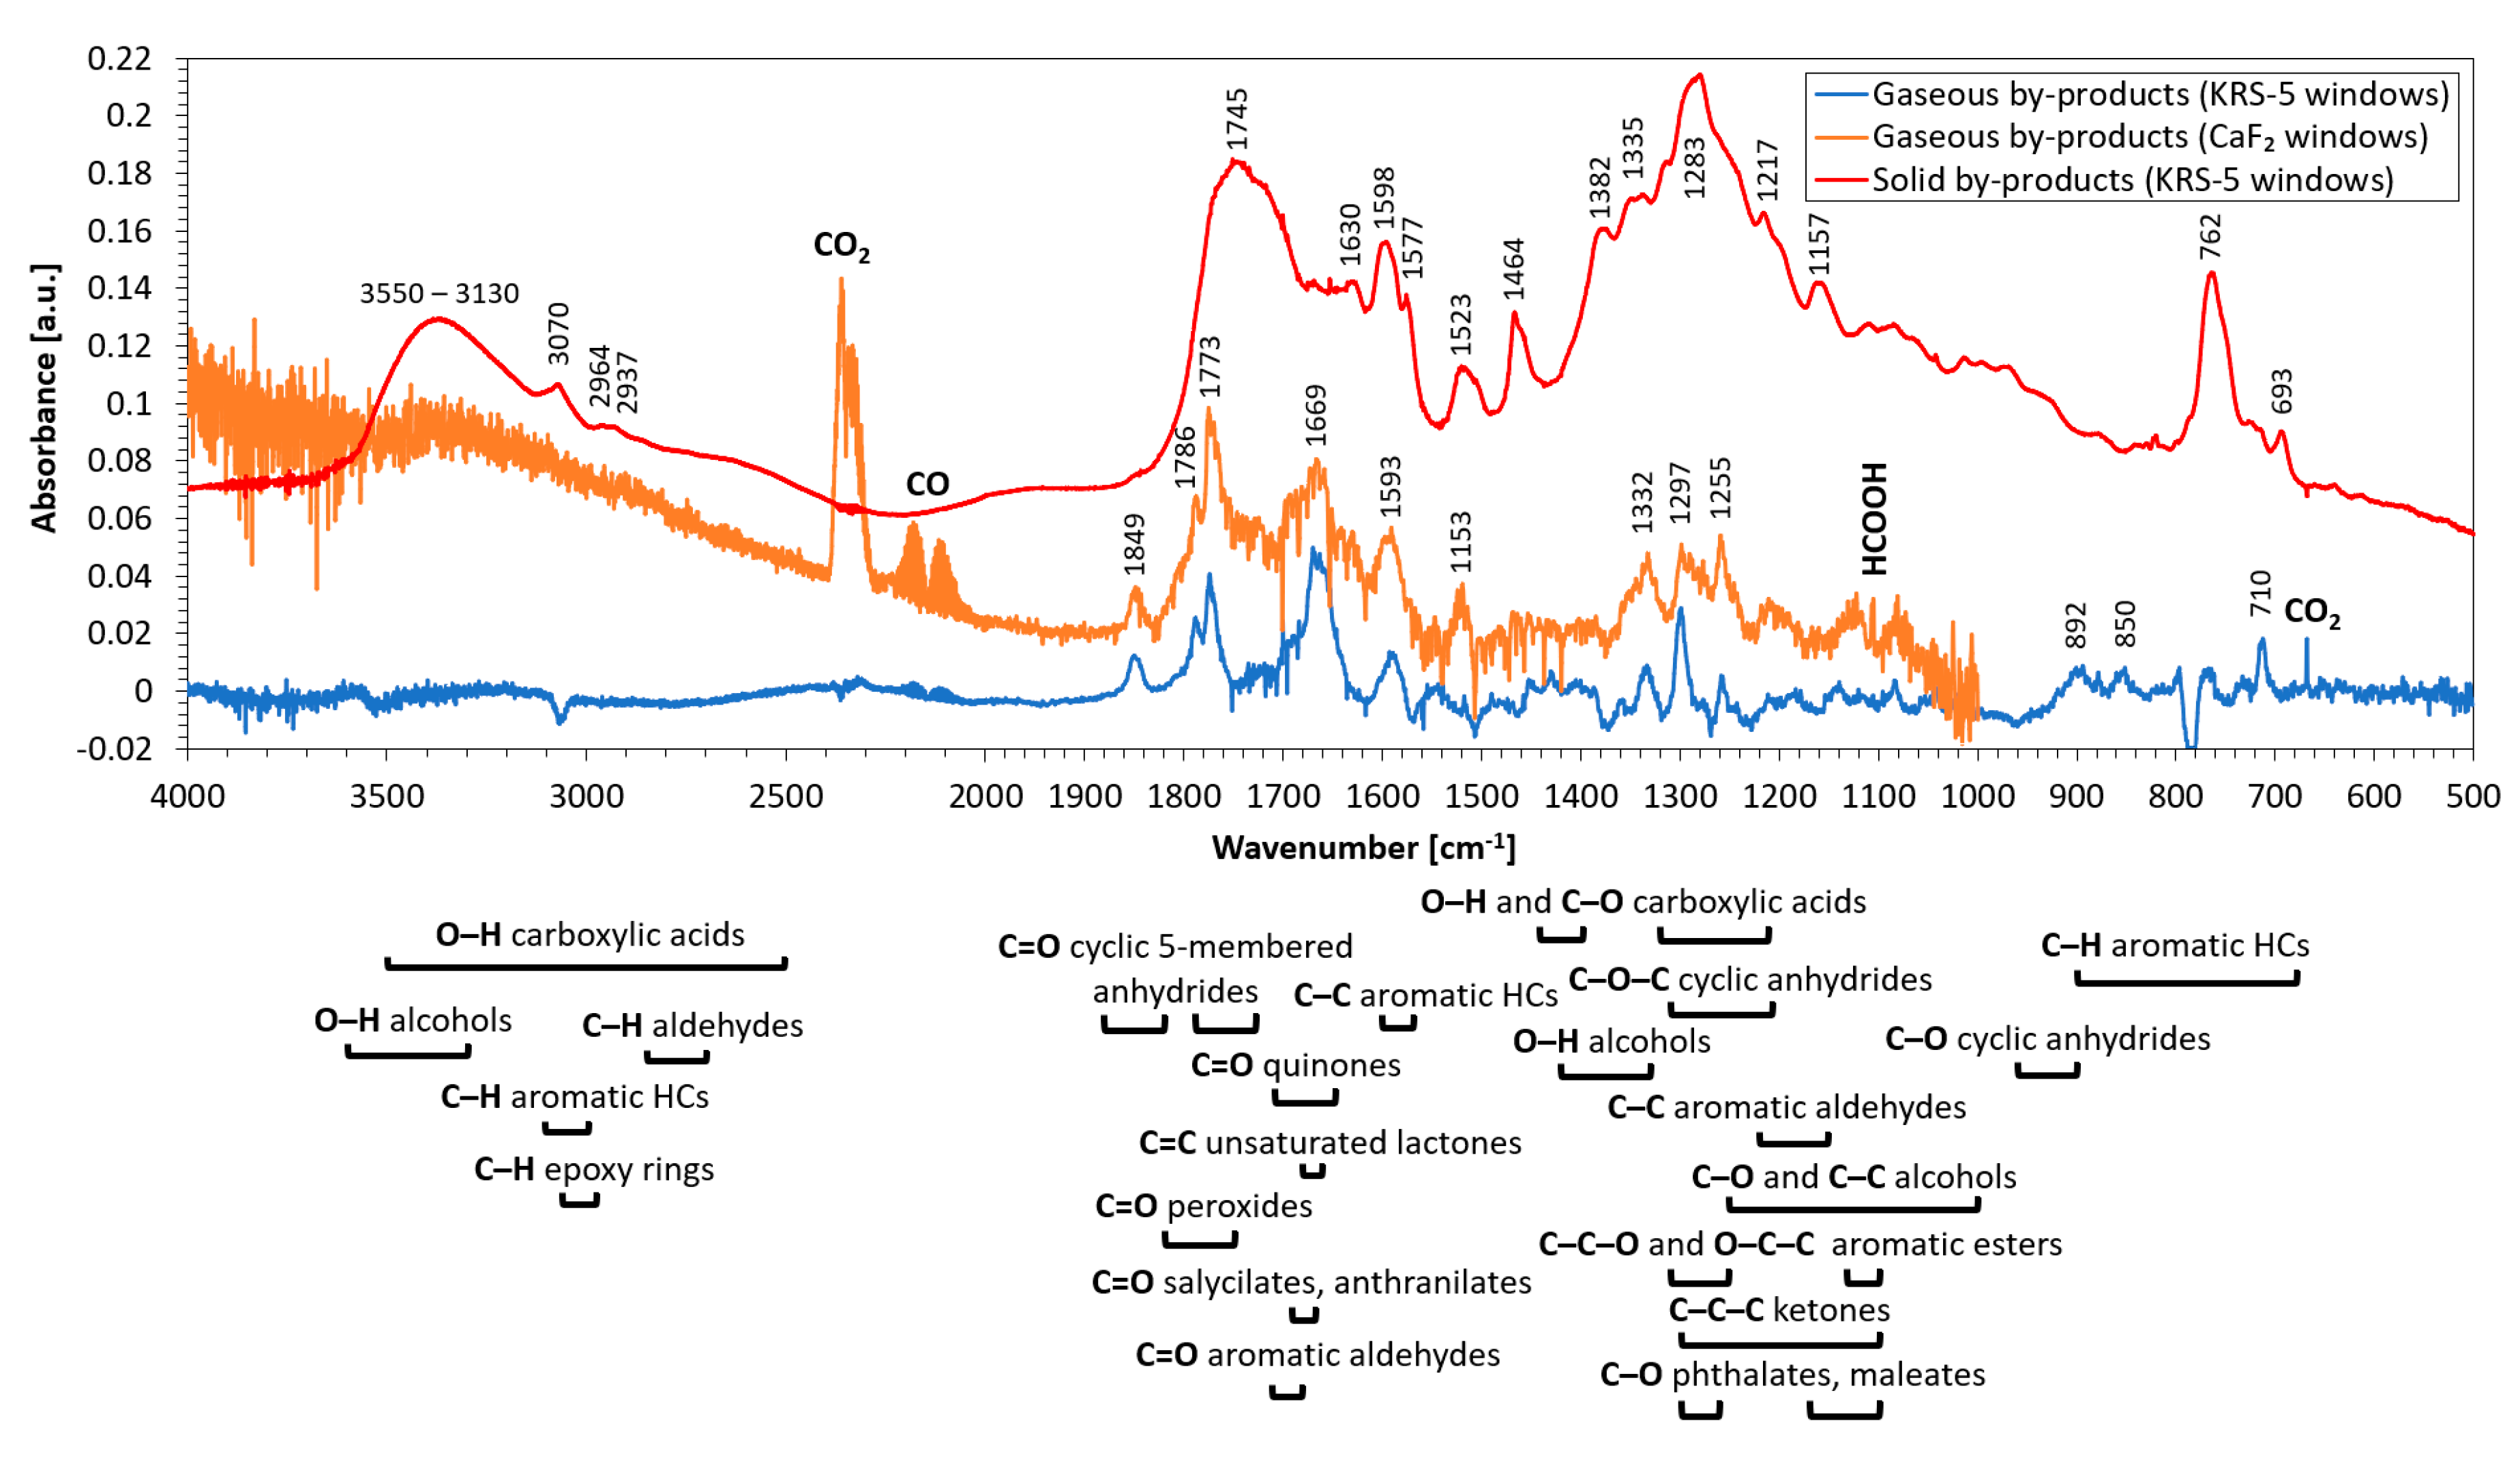
2.4.2. FTIR Analysis
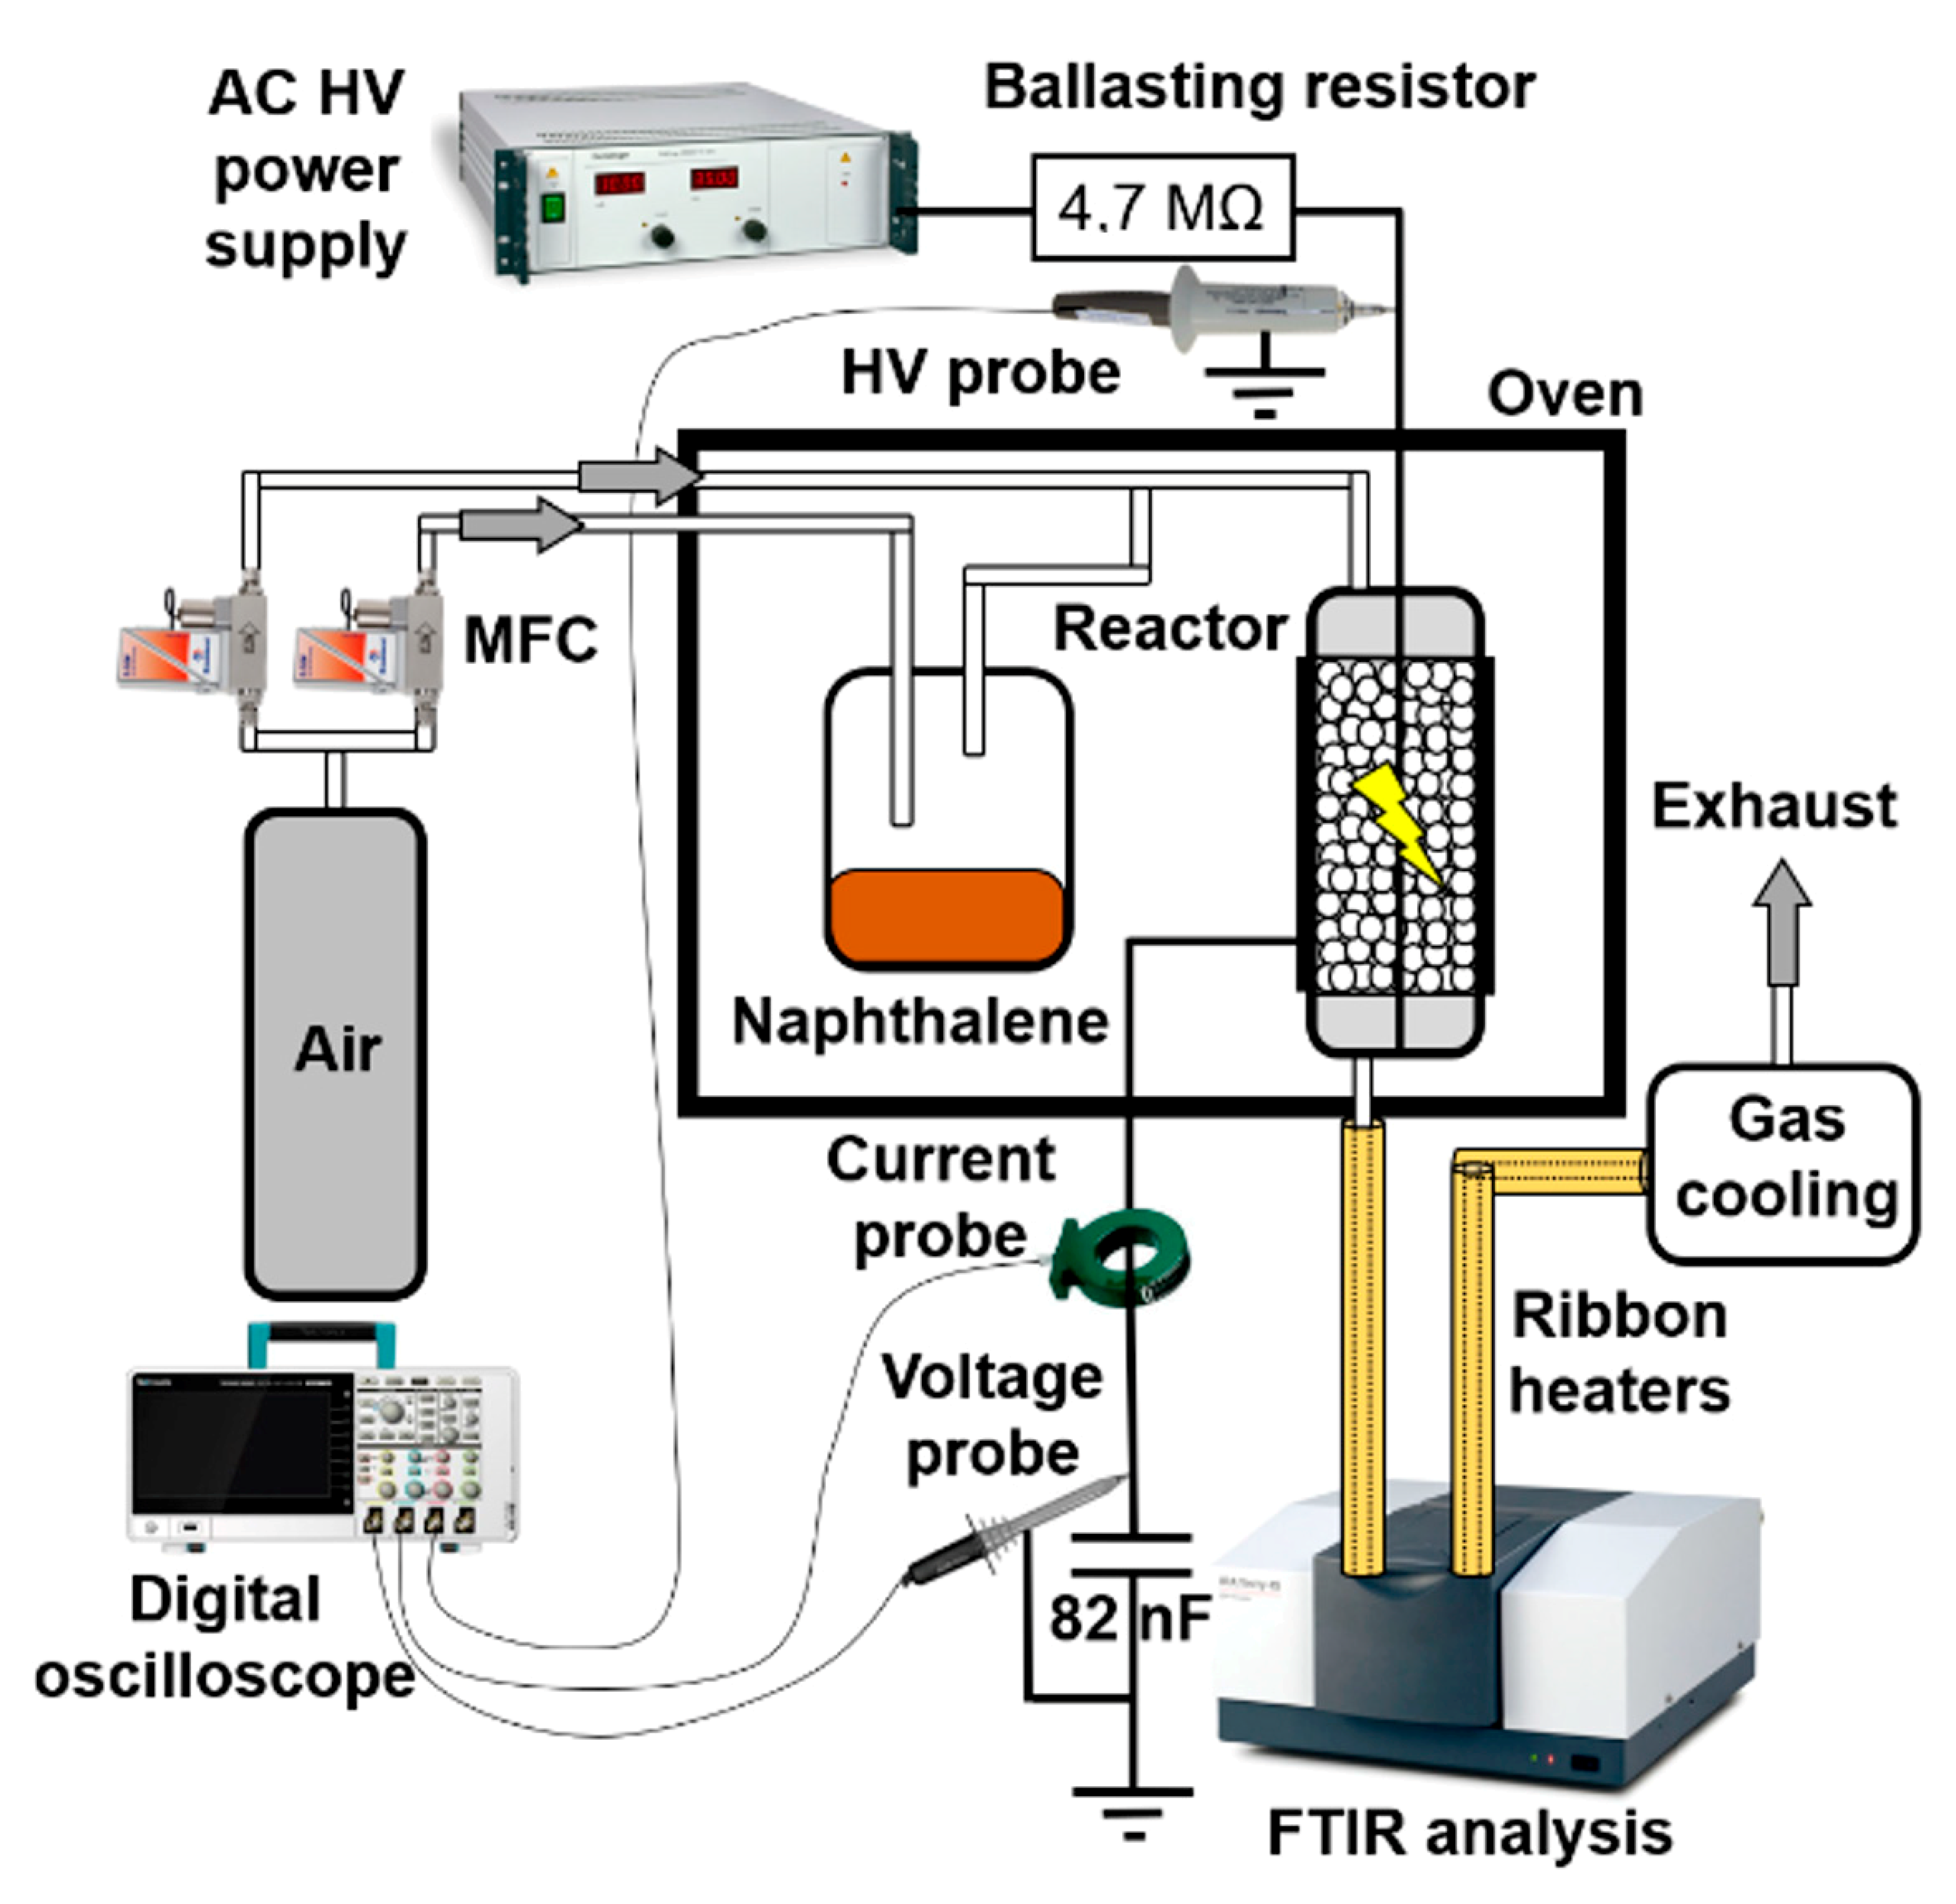
3. Materials and Methods
- Specific input energy (SIE) (i.e., energy density or discharge energy per gas volume):
- Naphthalene removal efficiency (NRE):
- Energy efficiency (EE) (i.e., the amount of removed naphthalene per specific input energy):
- Carbon balance (CB) (i.e., the sum of quantified products per amount of removed carbon):
4. Conclusions
Author Contributions
Funding
Conflicts of Interest
References
- Mizuno, A. Generation of non-thermal plasma combined with catalysts and their application in environmental technology. Catal. Today 2013, 211, 2–8. [Google Scholar] [CrossRef]
- Whitehead, J.C. Plasma-catalysis: The known knowns, the known unknowns and the unknown unknowns. J. Phys. D Appl. Phys. 2016, 49, 243001. [Google Scholar] [CrossRef]
- Carreon, M.L. Plasma catalysis: A brief tutorial. Plasma Res. Express 2019, 1, 043001. [Google Scholar] [CrossRef]
- Neyts, E.C.; Bogaerts, A. Understanding plasma catalysis through modelling and simulation—A review. J. Phys. D Appl. Phys. 2014, 47, 224010. [Google Scholar] [CrossRef]
- Neyts, E.C.; Ostrikov, K.; Sunkara, M.K.; Bogaerts, A. Plasma Catalysis: Synergistic Effects at the Nanoscale. Chem. Rev. 2015, 115, 13408–13446. [Google Scholar] [CrossRef] [PubMed]
- Bogaerts, A.; Zhang, Q.-Z.; Zhang, Y.-R.; Van Laer, K.; Wang, W. Burning questions of plasma catalysis: Answers by modeling. Catal. Today 2019, 337, 3–14. [Google Scholar] [CrossRef]
- Kim, H.-H.; Ogata, A.; Futamura, S. Oxygen partial pressure-dependent behavior of various catalysts for the total oxidation of VOCs using cycled system of adsorption and oxygen plasma. Appl. Catal. B Environ. 2008, 79, 356–367. [Google Scholar] [CrossRef]
- Mei, D.; Zhu, X.; Wu, C.; Ashford, B.; Williams, P.T.; Tu, X. Plasma-photocatalytic conversion of CO2 at low temperatures: Understanding the synergistic effect of plasma-catalysis. Appl. Catal. B Environ. 2016, 182, 525–532. [Google Scholar] [CrossRef] [Green Version]
- Tu, X.; Whitehead, J.C. Plasma-catalytic dry reforming of methane in an atmospheric dielectric barrier discharge: Understanding the synergistic effect at low temperature. Appl. Catal. B Environ. 2012, 125, 439–448. [Google Scholar] [CrossRef]
- Parvulescu, V.I.; Magureanu, M.; Lukes, P. Plasma Chemistry and Catalysis in Gases and Liquids; Wiley-VCH Verlag GmbH and Co.: Weinheim, Germany, 2012; ISBN 9783527330065. [Google Scholar]
- Pasquiers, S. Removal of pollutants by plasma catalytic processes. Eur. Phys. J. Appl. Phys. 2006, 184, 177–184. [Google Scholar] [CrossRef]
- Hammer, T.; Kishimoto, T.; Miessner, H.; Rudolph, R. Plasma enhanced selective catalytic reduction: Kinetics of NOx-removal and byproduct formation. SAE Trans. 1999, 108, 2035–2041. [Google Scholar] [CrossRef]
- Liu, M.; Li, J.; Liu, Z.; Zhao, Y.; Jiang, N.; Wu, Y. Improve low−temperature selective catalytic reduction of NOx with NH3 by ozone injection. Int. J. Plasma Environ. Sci. Technol. 2020, 14, e01007. [Google Scholar] [CrossRef]
- Van Durme, J.; Dewulf, J.; Leys, C.; Van Langenhove, H. Combining non-thermal plasma with heterogeneous catalysis in waste gas treatment: A review. Appl. Catal. B Environ. 2008, 78, 324–333. [Google Scholar] [CrossRef] [Green Version]
- Vandenbroucke, A.M.; Morent, R.; De Geyter, N.; Leys, C. Non-thermal plasmas for non-catalytic and catalytic VOC abatement. J. Hazard. Mater. 2011, 195, 30–54. [Google Scholar] [CrossRef]
- Veerapandian, S.K.P.; Leys, C.; De Geyter, N.; Moren, R. Abatement of VOCs using packed bed non-thermal plasma reactors: A review. Catalysts 2017, 7, 113. [Google Scholar] [CrossRef]
- Whitehead, J.C. Plasma catalysis: A solution for environmental problems. Pure Appl. Chem. 2010, 82, 1329–1336. [Google Scholar] [CrossRef]
- Liu, L.; Zhang, Z.; Das, S.; Kawi, S. Reforming of tar from biomass gasification in a hybrid catalysis-plasma system: A review. Appl. Catal. B Environ. 2019, 250, 250–272. [Google Scholar] [CrossRef]
- Michielsen, I.; Uytdenhouwen, Y.; Pype, J.; Michielsen, B.; Mertens, J.; Reniers, F.; Meynen, V.; Bogaerts, A. CO2 dissociation in a packed bed DBD reactor: First steps towards a better understanding of plasma catalysis. Chem. Eng. J. 2017, 326, 477–488. [Google Scholar] [CrossRef]
- Puliyalil, H.; Lašič Jurković, D.; Dasireddy, V.D.B.C.; Likozar, B. A review of plasma-assisted catalytic conversion of gaseous carbon dioxide and methane into value-added platform chemicals and fuels. RSC Adv. 2018, 8, 27481–27508. [Google Scholar] [CrossRef] [Green Version]
- Gomez-Rueda, Y.; Helsen, L. The role of plasma in syngas tar cracking. Biomass Convers. Biorefinery 2020, 10, 857–871. [Google Scholar] [CrossRef]
- Sasujit, K.; Dussadee, N.; Tippayawong, N. Overview of tar reduction in biomass-derived producer gas using non-thermal plasma discharges. Maejo Int. J. Sci. Technol. 2019, 13, 42–61. [Google Scholar]
- Saleem, F.; Harris, J.; Zhang, K.; Harvey, A. Non-thermal plasma as a promising route for the removal of tar from the product gas of biomass gasification—A critical review. Chem. Eng. J. 2020, 382, 122761. [Google Scholar] [CrossRef]
- Pemen, A.J.M.; Nair, S.A.; Yan, K.; van Heesch, E.J.M.; Ptasinski, K.J.; Drinkenburg, A.A.H. Pulsed corona discharges for tar removal from biomass derived fuel gas. Plasmas Polym. 2003, 8, 209–224. [Google Scholar] [CrossRef]
- Anis, S.; Zainal, Z.A. Tar reduction in biomass producer gas via mechanical, catalytic and thermal methods: A review. Renew. Sustain. Energy Rev. 2011, 15, 2355–2377. [Google Scholar] [CrossRef]
- Keyte, I.J.; Albinet, A.; Harrison, R.M. On-road traffic emissions of polycyclic aromatic hydrocarbons and their oxy- and nitro-derivative compounds measured in road tunnel environments. Sci. Total Environ. 2016, 566–567, 1131–1142. [Google Scholar] [CrossRef] [PubMed] [Green Version]
- Liu, L.; Wang, Q.; Ahmad, S.; Yang, X.; Ji, M.; Sun, Y. Steam reforming of toluene as model biomass tar to H2-rich syngas in a DBD plasma-catalytic system. J. Energy Inst. 2018, 91, 927–939. [Google Scholar] [CrossRef]
- Liu, S.; Mei, D.; Wang, L.; Tu, X. Steam reforming of toluene as biomass tar model compound in a gliding arc discharge reactor. Chem. Eng. J. 2017, 307, 793–802. [Google Scholar] [CrossRef] [Green Version]
- Saleem, F.; Zhang, K.; Harvey, A. Plasma-assisted decomposition of a biomass gasification tar analogue into lower hydrocarbons in a synthetic product gas using a dielectric barrier discharge reactor. Fuel 2019, 235, 1412–1419. [Google Scholar] [CrossRef] [Green Version]
- Sun, J.; Wang, Q.; Wang, W.; Song, Z.; Zhao, X.; Mao, Y.; Ma, C. Novel treatment of a biomass tar model compound via microwave-metal discharges. Fuel 2017, 207, 121–125. [Google Scholar] [CrossRef]
- Tao, K.; Ohta, N.; Liu, G.; Yoneyama, Y.; Wang, T.; Tsubaki, N. Plasma enhanced catalytic reforming of biomass tar model compound to syngas. Fuel 2013, 104, 53–57. [Google Scholar] [CrossRef]
- Liu, S.Y.; Mei, D.H.; Nahil, M.A.; Gadkari, S.; Gu, S.; Williams, P.T.; Tu, X. Hybrid plasma-catalytic steam reforming of toluene as a biomass tar model compound over Ni/Al2O3 catalysts. Fuel Process. Technol. 2017, 166, 269–275. [Google Scholar] [CrossRef]
- Jamróz, P.; Kordylewski, W.; Wnukowski, M. Microwave plasma application in decomposition and steam reforming of model tar compounds. Fuel Process. Technol. 2018, 169, 1–14. [Google Scholar] [CrossRef]
- Devi, L.; Nair, S.A.; Pemen, A.J.M.; Yan, K.; van Heesch, E.J.M.; Ptasinski, K.J.; Janssen, F.J.J.G. Tar removal from biomass gasification processes. In Biomass and Bioenergy; Nova Science Publishers: Hauppauge, NY, USA, 2006; pp. 249–274. [Google Scholar]
- Gao, X.; Shen, X.; Wu, Z.; Luo, Z.; Ni, M.; Cen, K. The Mechanism of Naphthalene Decomposition in Corona Radical Shower System by DC Discharge. In Electrostatic Precipitation; Springer: Berlin/Heidelberg, Germany, 2008; pp. 713–717. [Google Scholar]
- Nair, S.A. Corona Plasma for Tar Removal; Technische Universiteit Eindhoven: Eindhoven, The Netherlands, 2004; ISBN 9038626665. [Google Scholar]
- Blanquet, E.; Nahil, M.A.; Williams, P.T. Reduction of tars from real biomass gasification by a non-thermal plasma-catalytic system. In Proceedings of the ISPC 2017, Montreal, QC, Canada, 31 July–4 August 2017. [Google Scholar]
- Blanquet, E.; Nahil, M.A.; Williams, P.T. Enhanced hydrogen-rich gas production from waste biomass using pyrolysis with non-thermal plasma-catalysis. Catal. Today 2019, 337, 216–224. [Google Scholar] [CrossRef]
- Hübner, M.; Brandenburg, R.; Neubauber, Y.; Röpcke, J. On the Reduction of Gas-Phase Naphthalene Using Char-Particles in a Packed-Bed Atmospheric Pressure Plasma. Contrib. Plasma Phys. 2015, 55, 747–752. [Google Scholar] [CrossRef]
- Dors, M.; Kurzyńska, D. Tar Removal by Nanosecond Pulsed Dielectric Barrier Discharge. Appl. Sci. 2020, 10, 991. [Google Scholar] [CrossRef] [Green Version]
- Liu, L.; Liu, Y.; Song, J.; Ahmad, S.; Liang, J.; Sun, Y. Plasma-enhanced steam reforming of different model tar compounds over Ni-based fusion catalysts. J. Hazard. Mater. 2019, 377, 24–33. [Google Scholar] [CrossRef]
- Redolfi, M.; Blin-Simiand, N.; Duten, X.; Pasquiers, S.; Hassouni, K. Naphthalene oxidation by different non-thermal electrical discharges at atmospheric pressure. Plasma Sci. Technol. 2019, 21, 055503. [Google Scholar] [CrossRef]
- Wu, Z.; Zhu, Z.; Hao, X.; Zhou, W.; Han, J.; Tang, X.; Yao, S.; Zhang, X. Enhanced oxidation of naphthalene using plasma activation of TiO2/diatomite catalyst. J. Hazard. Mater. 2018, 347, 48–57. [Google Scholar] [CrossRef]
- Kong, X.; Zhang, H.; Li, X.; Xu, R.; Mubeen, I.; Li, L.; Yan, J. Destruction of toluene, naphthalene and phenanthrene as model tar compounds in a modified rotating gliding arc discharge reactor. Catalysts 2019, 9, 19. [Google Scholar] [CrossRef] [Green Version]
- Mei, D.; Liu, S.; Wang, Y.; Yang, H.; Bo, Z.; Tu, X. Enhanced reforming of mixed biomass tar model compounds using a hybrid gliding arc plasma catalytic process. Catal. Today 2019, 337, 225–233. [Google Scholar] [CrossRef]
- Yuan, M.H.; Chang, C.C.; Chang, C.Y.; Lin, Y.Y.; Shie, J.L.; Wu, C.H.; Tseng, J.Y.; Ji, D.R. Radio-frequency-powered atmospheric pressure plasma jet for the destruction of binary mixture of naphthalene and n-butanol with Pt/Al2O3 catalyst. J. Taiwan Inst. Chem. Eng. 2014, 45, 468–474. [Google Scholar] [CrossRef]
- Sutton, D.; Kelleher, B.; Ross, J.R.H. Review of literature on catalysts for biomass gasification. Fuel Process. Technol. 2001, 73, 155–173. [Google Scholar] [CrossRef]
- Cimerman, R.; Račková, D.; Hensel, K. Tars removal by non-thermal plasma and plasma catalysis. J. Phys. D Appl. Phys. 2018, 51, 274003. [Google Scholar] [CrossRef] [Green Version]
- Taheraslani, M.; Gardeniers, H. Coupling of CH4 to C2 hydrocarbons in a packed bed DBD plasma reactor: The effect of dielectric constant and porosity of the packing. Energies 2020, 13, 468. [Google Scholar] [CrossRef] [Green Version]
- Dou, B.; Bin, F.; Wang, C.; Jia, Q.; Li, J. Discharge characteristics and abatement of volatile organic compounds using plasma reactor packed with ceramic Raschig rings. J. Electrostat. 2013, 71, 939–944. [Google Scholar] [CrossRef] [Green Version]
- Mei, D.; Zhu, X.; He, Y.L.; Yan, J.D.; Tu, X. Plasma-assisted conversion of CO2 in a dielectric barrier discharge reactor: Understanding the effect of packing materials. Plasma Sources Sci. Technol. 2015, 24, 15011. [Google Scholar] [CrossRef] [Green Version]
- Van Laer, K.; Bogaerts, A. How bead size and dielectric constant affect the plasma behaviour in a packed bed plasma reactor: A modelling study. Plasma Sources Sci. Technol. 2017, 26, 085007. [Google Scholar] [CrossRef]
- Wang, W.; Kim, H.H.; Van Laer, K.; Bogaerts, A. Streamer propagation in a packed bed plasma reactor for plasma catalysis applications. Chem. Eng. J. 2018, 334, 2467–2479. [Google Scholar] [CrossRef]
- Tu, X.; Gallon, H.J.; Twigg, M.V.; Gorry, P.A.; Whitehead, J.C. Dry reforming of methane over a Ni/Al2O3 catalyst in a coaxial dielectric barrier discharge reactor. J. Phys. D Appl. Phys. 2011, 44, 274007. [Google Scholar] [CrossRef] [Green Version]
- Tu, X.; Gallon, H.J.; Whitehead, J.C. Transition behavior of packed-bed dielectric barrier discharge in argon. IEEE Trans. Plasma Sci. 2011, 39, 2172–2173. [Google Scholar] [CrossRef]
- Zhang, Q.Z.; Bogaerts, A. Propagation of a plasma streamer in catalyst pores. Plasma Sources Sci. Technol. 2018, 27, 035009. [Google Scholar] [CrossRef]
- Zhang, Y.-R.; Van Laer, K.; Neyts, E.C.; Bogaerts, A. Can plasma be formed in catalyst pores? A modeling investigation. Appl. Catal. B Environ. 2016, 185, 56–67. [Google Scholar] [CrossRef]
- Hensel, K.; Martišovitš, V.; Machala, Z.; Janda, M.; Leštinský, M.; Tardiveau, P.; Mizuno, A. Electrical and optical properties of AC microdischarges in porous ceramics. Plasma Process. Polym. 2007, 4, 682–693. [Google Scholar] [CrossRef]
- Lee, B.Y.; Park, S.H.; Lee, S.C.; Kang, M.; Choung, S.J. Decomposition of benzene by using a discharge plasma-photocatalyst hybrid system. Catal. Today 2004, 93–95, 769–776. [Google Scholar] [CrossRef]
- Kang, M.; Kim, B.J.; Cho, S.M.; Chung, C.H.; Kim, B.W.; Han, G.Y.; Yoon, K.J. Decomposition of toluene using an atmospheric pressure plasma/TiO2 catalytic system. J. Mol. Catal. A Chem. 2002, 180, 125–132. [Google Scholar] [CrossRef]
- Feng, X.; Liu, H.; He, C.; Shen, Z.; Wang, T. Synergistic effects and mechanism of a non-thermal plasma catalysis system in volatile organic compound removal: A review. Catal. Sci. Technol. 2018, 8, 936–954. [Google Scholar] [CrossRef]
- Wallis, A.E.; Whitehead, J.C.; Zhang, K. Plasma-assisted catalysis for the destruction of CFC-12 in atmospheric pressure gas streams using TiO2. Catal. Lett. 2007, 113, 29–33. [Google Scholar] [CrossRef]
- Theurich, J.; Bahnemann, D.W.; Vogel, R.; Ehamed, F.E.; Alhakimi, G.; Rajab, I. Photocatalytic degradation of naphthalene and anthracene: GC-MS analysis of the degradation pathway. Res. Chem. Intermed. 1997, 23, 247–274. [Google Scholar] [CrossRef]
- Ndifor, E.N.; Garcia, T.; Taylor, S.H. Naphthalene oxidation over vanadium-modified Pt catalysts supported on γ-Al2O3. Catal. Lett. 2006, 110, 125–128. [Google Scholar] [CrossRef]
- Shie, J.L.; Chang, C.Y.; Chen, J.H.; Tsai, W.T.; Chen, Y.H.; Chiou, C.S.; Chang, C.F. Catalytic oxidation of naphthalene using a Pt/Al2O3 catalyst. Appl. Catal. B Environ. 2005, 58, 289–297. [Google Scholar] [CrossRef]
- Sellick, D.R.; Morgan, D.J.; Taylor, S.H. Silica supported platinum catalysts for total oxidation of the polyaromatic hydrocarbon naphthalene: An investigation of metal loading and calcination temperature. Catalysts 2015, 5, 690–702. [Google Scholar] [CrossRef] [Green Version]
- Ndifor, E.N.; Carley, A.F.; Taylor, S.H. The role of support on the performance of platinum-based catalysts for the total oxidation of polycyclic aromatic hydrocarbons. Catal. Today 2008, 137, 362–366. [Google Scholar] [CrossRef]
- Kamal, M.S.; Razzak, S.A.; Hossain, M.M. Catalytic oxidation of volatile organic compounds (VOCs)—A review. Atmos. Environ. 2016, 140, 117–134. [Google Scholar] [CrossRef]
- Zhang, Z.; Jiang, Z.; Shangguan, W. Low-temperature catalysis for VOCs removal in technology and application: A state-of-the-art review. Catal. Today 2016, 264, 270–278. [Google Scholar] [CrossRef]
- Kauppi, E.I.; Honkala, K.; Krause, A.O.I.; Kanervo, J.M.; Lefferts, L. ZrO2 Acting as a Redox Catalyst. Top. Catal. 2016, 59, 823–832. [Google Scholar] [CrossRef] [Green Version]
- Yamaguchi, T. Application of ZrO2 as a catalyst and a catalyst support. Catal. Today 1994, 20, 199–217. [Google Scholar] [CrossRef]
- Rönkkönen, H.; Rikkinen, E.; Linnekoski, J.; Simell, P.; Reinikainen, M.; Krause, O. Effect of gasification gas components on naphthalene decomposition over ZrO2. Catal. Today 2009, 147, 230–236. [Google Scholar] [CrossRef]
- Viinikainen, T.; Rönkkönen, H.; Bradshaw, H.; Stephenson, H.; Airaksinen, S.; Reinikainen, M.; Simell, P.; Krause, O. Acidic and basic surface sites of zirconia-based biomass gasification gas clean-up catalysts. Appl. Catal. A Gen. 2009, 362, 169–177. [Google Scholar] [CrossRef]
- Juutilainen, S.J.; Simell, P.A.; Krause, A.O.I. Zirconia: Selective oxidation catalyst for removal of tar and ammonia from biomass gasification gas. Appl. Catal. B Environ. 2006, 62, 86–92. [Google Scholar] [CrossRef]
- Fang, D.; Luo, Z.; Liu, S.; Zeng, T.; Liu, L.; Xu, J.; Bai, Z.; Xu, W. Photoluminescence properties and photocatalytic activities of zirconia nanotube arrays fabricated by anodization. Opt. Mater. 2013, 35, 1461–1466. [Google Scholar] [CrossRef]
- Fisher, J.; Egerton, T.A. Titanium Compounds, Inorganic. In Kirk-Othmer Encyclopedia of Chemical Technology; John Wiley and Sons: Hoboken, NJ, USA, 2001. [Google Scholar]
- Machala, Z.; Janda, M.; Hensel, K.; Jedlovský, I.; Leštinská, L.; Foltin, V.; Martišovitš, V.; Morvová, M. Emission spectroscopy of atmospheric pressure plasmas for bio-medical and environmental applications. J. Mol. Spectrosc. 2007, 243, 194–201. [Google Scholar] [CrossRef]
- Cheng, Z.X.; Zhao, X.G.; Li, J.L.; Zhu, Q.M. Role of support in CO2 reforming of CH4 over a Ni/γ-Al2O3 catalyst. Appl. Catal. A Gen. 2001, 205, 31–36. [Google Scholar] [CrossRef]
- Meephoka, C.; Chaisuk, C.; Samparnpiboon, P.; Praserthdam, P. Effect of phase composition between nano γ- and χ-Al2O3 on Pt/Al2O3 catalyst in CO oxidation. Catal. Commun. 2008, 9, 546–550. [Google Scholar] [CrossRef]
- Ogata, A.; Yamanouchi, K.; Mizuno, K.; Kushiyama, S.; Yamamoto, T. Decomposition of benzene using alumina-hybrid and catalyst-hybrid plasma reactors. IEEE Trans. Ind. Appl. 1999, 35, 1289–1295. [Google Scholar] [CrossRef]
- Sano, T.; Negishi, N.; Sakai, E.; Matsuzawa, S. Contributions of photocatalytic/catalytic activities of TiO2 and γ-Al2O3 in nonthermal plasma on oxidation of acetaldehyde and CO. J. Mol. Catal. A Chem. 2006, 245, 235–241. [Google Scholar] [CrossRef]
- Roland, U.; Holzer, F.; Kopinke, F.D. Combination of non-thermal plasma and heterogeneous catalysis for oxidation of volatile organic compounds: Part 2. Ozone decomposition and deactivation of γ-Al2O3. Appl. Catal. B Environ. 2005, 58, 217–226. [Google Scholar] [CrossRef]
- Ray, D.; Manoj Kumar Reddy, P.; Subrahmanyam, C. Glass Beads Packed DBD-Plasma Assisted Dry Reforming of Methane. Top. Catal. 2017, 60, 869–878. [Google Scholar] [CrossRef]
- Holzer, F.; Kopinke, F.D.; Roland, U. Influence of ferroelectric materials and catalysts on the performance of Non-Thermal Plasma (NTP) for the removal of air pollutants. Plasma Chem. Plasma Process. 2005, 25, 595–611. [Google Scholar] [CrossRef]
- Kim, H.-H.; Teramoto, Y.; Negishi, N.; Ogata, A. A multidisciplinary approach to understand the interactions of nonthermal plasma and catalyst: A review. Catal. Today 2015, 256, 13–22. [Google Scholar] [CrossRef]
- Butterworth, T.; Elder, R.; Allen, R. Effects of particle size on CO2 reduction and discharge characteristics in a packed bed plasma reactor. Chem. Eng. J. 2016, 293, 55–67. [Google Scholar] [CrossRef] [Green Version]
- Xu, S.; Whitehead, J.C.; Martin, P.A. CO2 conversion in a non-thermal, barium titanate packed bed plasma reactor: The effect of dilution by Ar and N2. Chem. Eng. J. 2017, 327, 764–773. [Google Scholar] [CrossRef]
- Liu, Y.; Li, Z.; Yang, X.; Xing, Y.; Tsai, C.; Yang, Q.; Wang, Z.; Yang, R.T. Performance of mesoporous silicas (MCM-41 and SBA-15) and carbon (CMK-3) in the removal of gas-phase naphthalene: Adsorption capacity, rate and regenerability. RSC Adv. 2016, 6, 21193–21203. [Google Scholar] [CrossRef]
- Ravenni, G.; Sárossy, Z.; Ahrenfeldt, J.; Henriksen, U.B. Activity of chars and activated carbons for removal and decomposition of tar model compounds—A review. Renew. Sustain. Energy Rev. 2018, 94, 1044–1056. [Google Scholar] [CrossRef]
- Bogaerts, A.; Kozak, T.; Van Laer, K.; Snoeckx, R. Plasma-based conversion of CO2: Current status and future challenges. Faraday Discuss. 2015, 183, 217–232. [Google Scholar] [CrossRef] [PubMed]
- Van Laer, K.; Bogaerts, A. Improving the Conversion and Energy Efficiency of Carbon Dioxide Splitting in a Zirconia-Packed Dielectric Barrier Discharge Reactor. Energy Technol. 2015, 3, 1038–1044. [Google Scholar] [CrossRef]
- Whitehead, J.C. Plasma-catalysis: Is it just a question of scale? Front. Chem. Sci. Eng. 2019, 13, 264–273. [Google Scholar] [CrossRef] [Green Version]
- Wang, Y.; Yang, H.; Tu, X. Plasma reforming of naphthalene as a tar model compound of biomass gasification. Energy Convers. Manag. 2019, 187, 593–604. [Google Scholar] [CrossRef]
- Zhang, Q.-Z.; Wang, W.-Z.; Bogaerts, A. Importance of surface charging during plasma streamer propagation in catalyst pores. Plasma Sources Sci. Technol. 2018, 27, 065009. [Google Scholar] [CrossRef] [Green Version]
- Takaki, K.; Urashima, K.; Chang, J.S. Ferro-electric pellet shape effect on C2F6 removal by a packed-bed-type nonthermal plasma reactor. IEEE Trans. Plasma Sci. 2004, 32, 2175–2183. [Google Scholar] [CrossRef]
- Smith, B. Infrared Spectral Interpretation: A Systematic Approach; CRC Press: Boca Raton, FL, USA, 1999; ISBN 0849324637. [Google Scholar]
- Socrates, G. Infrared and Raman Characteristic Group Frequencies Contents; John Wiley and Sons: Hoboken, NJ, USA, 2001; ISBN 0471852988. [Google Scholar]
- Bellamy, L.J. The Infrared Spectra of Complex Molecules; John Wiley and Sons: Hoboken, NJ, USA, 1976; ISBN 9789401160173. [Google Scholar]
- Silverstein, R.M.; Webster, F.X.; Kiemle, D.J. Spectrometric Identification of Organic Compounds; John Wiley and Sons: Hoboken, NJ, USA, 2005; ISBN 0-471-39362-2. [Google Scholar]
- Xu, R.; Zhu, F.; Zhang, H.; Ruya, P.M.; Kong, X.; Li, L.; Li, X. Simultaneous Removal of Toluene, Naphthalene, and Phenol as Tar Surrogates in a Rotating Gliding Arc Discharge Reactor. Energy Fuels 2020, 34, 2045–2054. [Google Scholar] [CrossRef]
- Zhang, H.; Zhu, F.; Li, X.; Xu, R.; Li, L.; Yan, J.; Tu, X. Steam reforming of toluene and naphthalene as tar surrogate in a gliding arc discharge reactor. J. Hazard. Mater. 2019, 369, 244–253. [Google Scholar] [CrossRef] [PubMed]
- Ni, M.J.; Shen, X.; Gao, X.; Wu, Z.L.; Lu, H.; Li, Z.S.; Luo, Z.Y.; Cen, K.F. Naphthalene decomposition in a DC corona radical shower discharge. J. Zhejiang Univ. Sci. A 2011, 12, 71–77. [Google Scholar] [CrossRef]
- Wu, Z.; Wang, J.; Han, J.; Yao, S.; Xu, S.; Martin, P. Naphthalene Decomposition by Dielectric Barrier Discharges at Atmospheric Pressure. IEEE Trans. Plasma Sci. 2016, 45, 154–161. [Google Scholar] [CrossRef]
- Abdelaziz, A.A.; Seto, T.; Abdel-Salam, M.; Otani, Y. Influence of N2/O2 mixtures on decomposition of naphthalene in surface dielectric barrier discharge based reactor. Plasma Chem. Plasma Process. 2014, 34, 1371–1385. [Google Scholar] [CrossRef]
- Wypych, A.; Bobowska, I.; Tracz, M.; Opasinska, A.; Kadlubowski, S.; Krzywania-Kaliszewska, A.; Grobelny, J.; Wojciechowski, P. Dielectric properties and characterisation of titanium dioxide obtained by different chemistry methods. J. Nanomater. 2014, 2014, 124814. [Google Scholar] [CrossRef]
- Butterworth, T.; Allen, R.W.K. Plasma-catalyst interaction studied in a single pellet DBD reactor: Dielectric constant effect on plasma dynamics. Plasma Sources Sci. Technol. 2017, 26, 065008. [Google Scholar] [CrossRef]
- Gomaa, M.M.; Gobara, H.M. Electrical properties of Ni/silica gel and Pt/γ-alumina catalysts in relation to metal content in the frequency domain. Mater. Chem. Phys. 2009, 113, 790–796. [Google Scholar] [CrossRef]
- Harrop, P.J.; Wanklyn, J.N. The dielectric constant of zirconia. Br. J. Appl. Phys. 1967, 18, 739–742. [Google Scholar] [CrossRef]


| Fresh Packing Materials (Before Experiment) | Used Packing Materials (After Experiment) |
|---|---|
| TiO2 (70 m2/g) | |
 |  |
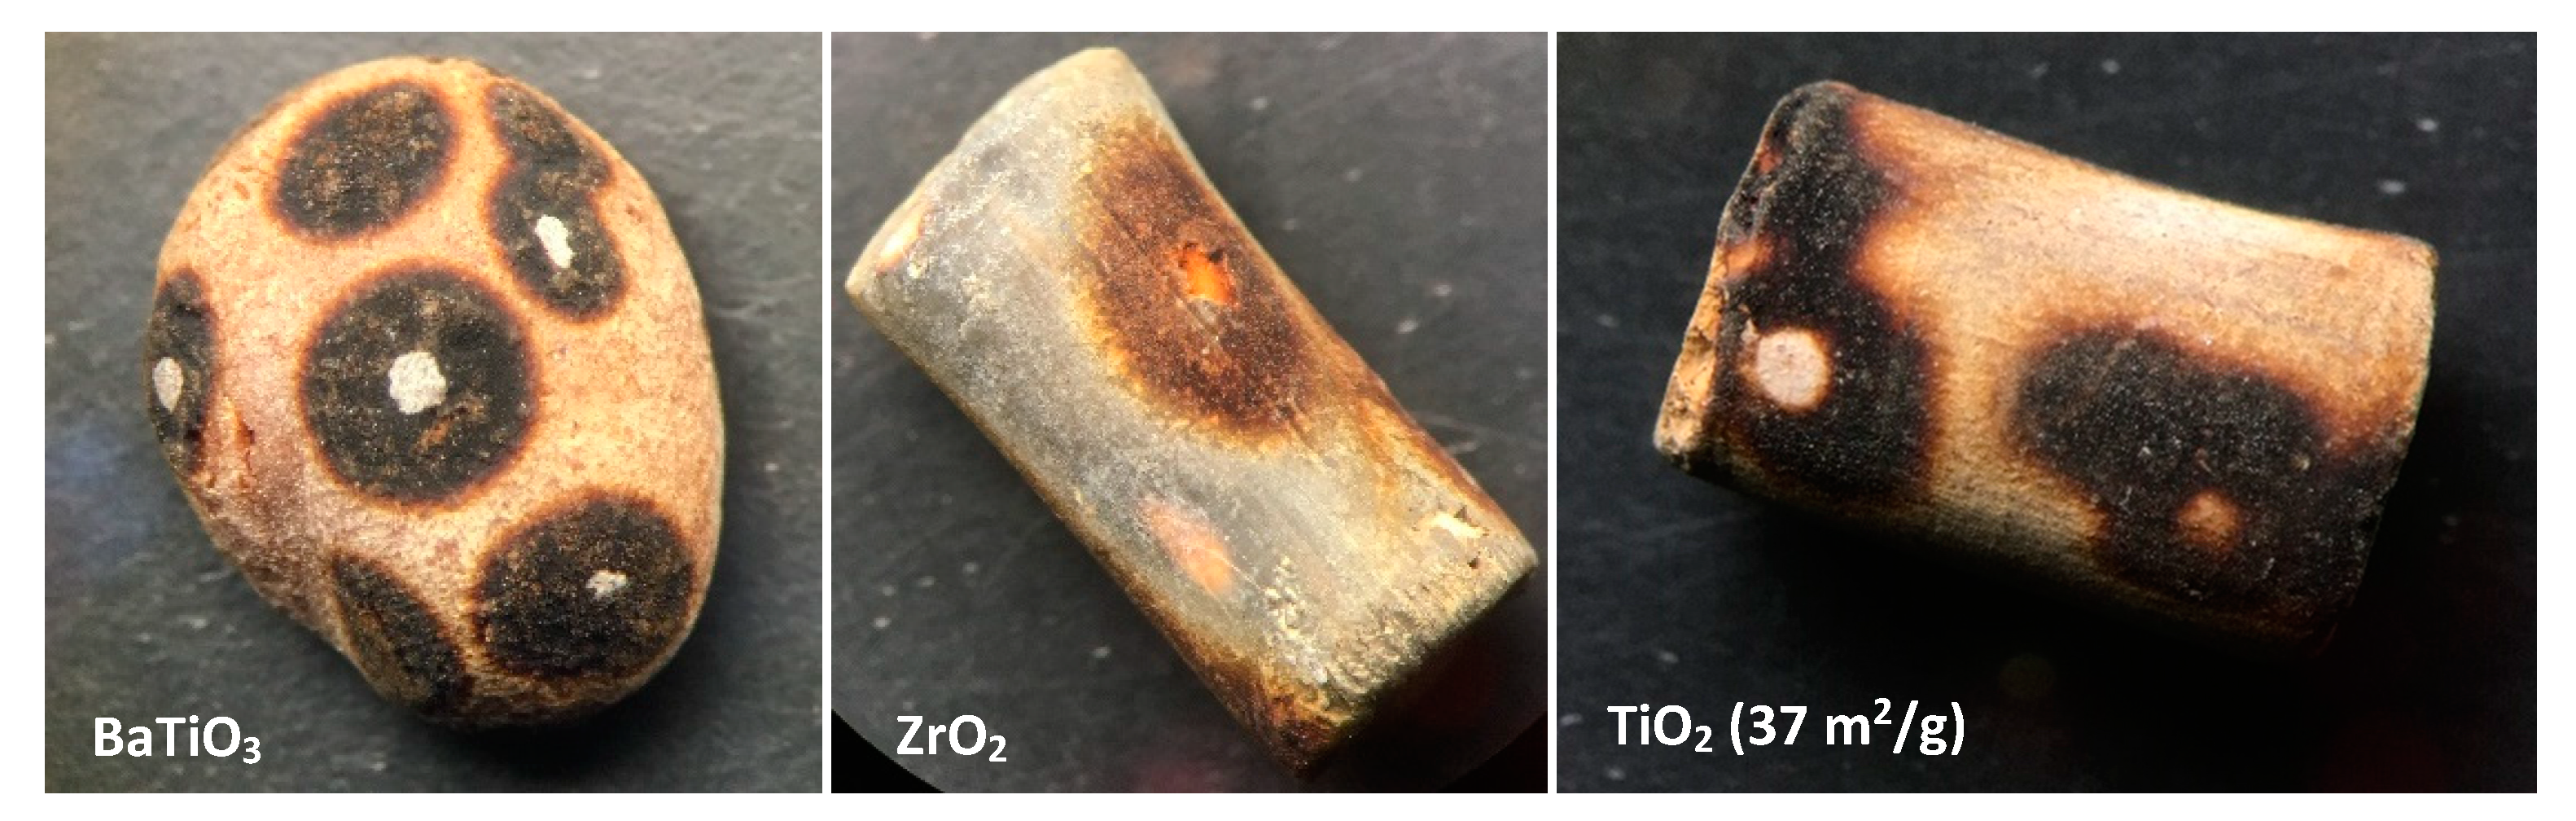
| TiO2 (37 m2/g) | |
 |  |
| BaTiO3 | |
 |  |
| Pt/γAl2O3 | |
 |  |
| ZrO2 | |
 |  |
| TiO2 | BaTiO3 | Pt/γAl2O3 | γAl2O3 | Glass beads | ZrO2 | |
|---|---|---|---|---|---|---|
| Dielectric constant | 20–100 (~85) [52,105] | 400–10000 (~4000) [86,106] | ~100 [107] | 8–11 (~9) [52,85] | ~5 [52] | 12–25 [19,52,108] |
| Shape | Spherical, cylindrical | Spherical/ cylindrical | Spherical | Spherical | Spherical | Cylindrical |
| Size [mm] (Ø = diameter; L = length) | Ø 3–4 (sphere) Ø 3–4, L 3–7 (cylinder) | Ø 3–5 | Ø 3–4 | Ø 3–4 | Ø 4, Ø 5 | Ø 3, L 4–8 |
| SSA [m2/g] | 37 (cylinder), 70 (sphere), 150 (cylinder) | N/A | N/A | typically 250–300 [85] | <0.001 | 90 |
| Producer | Sakai Chemicals Co./Abcr GmbH (Osaka, Japan/Karlsruhe, Germany) | Fuji Titanium Co. (Osaka, Japan) | unknown | Sumitomo Chemical Co. (Tokyo, Japan) | unknown | Abcr GmbH (Karlsruhe, Germany) |
Publisher’s Note: MDPI stays neutral with regard to jurisdictional claims in published maps and institutional affiliations. |
© 2020 by the authors. Licensee MDPI, Basel, Switzerland. This article is an open access article distributed under the terms and conditions of the Creative Commons Attribution (CC BY) license (http://creativecommons.org/licenses/by/4.0/).
Share and Cite
Cimerman, R.; Cíbiková, M.; Satrapinskyy, L.; Hensel, K. The Effect of Packing Material Properties on Tars Removal by Plasma Catalysis. Catalysts 2020, 10, 1476. https://doi.org/10.3390/catal10121476
Cimerman R, Cíbiková M, Satrapinskyy L, Hensel K. The Effect of Packing Material Properties on Tars Removal by Plasma Catalysis. Catalysts. 2020; 10(12):1476. https://doi.org/10.3390/catal10121476
Chicago/Turabian StyleCimerman, Richard, Mária Cíbiková, Leonid Satrapinskyy, and Karol Hensel. 2020. "The Effect of Packing Material Properties on Tars Removal by Plasma Catalysis" Catalysts 10, no. 12: 1476. https://doi.org/10.3390/catal10121476