Article

Porosity and Structure of Hierarchically Porous Ni/Al2O3 Catalysts for CO2 Methanation

1
Institute of Catalysis Research and Technology, Karlsruhe Institute of Technology (KIT), Hermann-von-Helmholtz-Platz 1, 76344 Eggenstein-Leopoldshafen, Germany
2
Institute for Chemical Technology and Polymer Chemistry, Karlsruhe Institute of Technology (KIT), Engesserstraße 20, 76131 Karlsruhe, Germany
3
Institute of Chemical Technology, Universität Leipzig, Linnéstr. 3, 04103 Leipzig, Germany
4
Chair for Process Systems Engineering, Institute of Process Engineering, Otto-von-Guericke University Magdeburg, Universitätplatz 2, 39106 Magdeburg, Germany
5
Institute of Nanotechnology (INT), Karlsruhe Institute of Technology (KIT), Hermann-von-Helmholtz-Platz 1, 76344 Eggenstein-Leopoldshafen, Germany
6
Department of Materials and Earth Sciences, Technische Universität Darmstadt, Alarich-Weiss-Straße 2, 64287 Darmstadt, Germany
7
Max Planck Institute Magdeburg, Department Process Systems Engineering, Sandtorstraße 1, 39106 Magdeburg, Germany
8
Diamond Light Source, Harwell Science and Innovation Campus, Fermi Ave, Didcot OX11 0DE, UK
9
Karlsruhe Nano Micro Facility, Karlsruhe Institute of Technology (KIT), Hermann-von-Helmholtz-Platz 1, 76344 Eggenstein-Leopoldshafen, Germany
*
Author to whom correspondence should be addressed.
Catalysts 2020, 10(12), 1471; https://doi.org/10.3390/catal10121471
Submission received: 29 November 2020 / Revised: 8 December 2020 / Accepted: 10 December 2020 / Published: 16 December 2020
(This article belongs to the Special Issue Design of Heterogeneous Catalysts and Adsorbents)

Abstract

:
CO2 methanation is often performed on Ni/Al2O3 catalysts, which can suffer from mass transport limitations and, therefore, decreased efficiency. Here we show the application of a hierarchically porous Ni/Al2O3 catalyst for methanation of CO2. The material has a well-defined and connected meso- and macropore structure with a total porosity of 78%. The pore structure was thoroughly studied with conventional methods, i.e., N2 sorption, Hg porosimetry, and He pycnometry, and advanced imaging techniques, i.e., electron tomography and ptychographic X-ray computed tomography. Tomography can quantify the pore system in a manner that is not possible using conventional porosimetry. Macrokinetic simulations were performed based on the measures obtained by porosity analysis. These show the potential benefit of enhanced mass-transfer properties of the hierarchical pore system compared to a pure mesoporous catalyst at industrially relevant conditions. Besides the investigation of the pore system, the catalyst was studied by Rietveld refinement, diffuse reflectance ultraviolet-visible (DRUV/vis) spectroscopy, and H2-temperature programmed reduction (TPR), showing a high reduction temperature required for activation due to structural incorporation of Ni into the transition alumina. The reduced hierarchically porous Ni/Al2O3 catalyst is highly active in CO2 methanation, showing comparable conversion and selectivity for CH4 to an industrial reference catalyst.

Graphical Abstract

1. Introduction

Carbon dioxide emissions must be reduced significantly to limit the negative consequences of climate change. For this reason, fossil fuels must be replaced by renewable energy sources. However, wind and solar energy, for example, are sporadic sources and, thus, not inevitably available when needed. This results in periods of energy surplus and shortage, which are not necessarily predictable. Hence, energy storage concepts are required to compensate for these fluctuations, thereby retaining energy during surplus periods and supplying it during shortages. In regions with existing natural gas infrastructure, the Power-to-Methane concept is a promising option [1,2,3]. This can be performed through conversion of CO2 and H2 to CH4, in a process called CO2 methanation. The H2 feed can be produced from surplus electricity by water electrolysis, while CO2 can be obtained from existing emission sources or extracted from the air. The synthetic natural gas (CH4) produced can be stored and fed into the natural gas grid on demand. Potentially CO2 methanation can, therefore, constitute a carbon-neutral fuel source.
The CO2 methanation process is often carried out in catalytic fixed-bed reactors [1]. In these reactors, the catalyst is typically present in the form of pellets with a few millimeter diameter. If the methanation reaction rate is too high, the reactants cannot penetrate into the interior of the catalyst pellets [4]. In consequence, a part of the catalyst pellet remains unused, which leads to a loss in space-time yield and expendable catalyst material. The most commonly applied catalyst for CO2 methanation is Ni supported on Al2O3, combining high activity and high CH4 selectivity with low cost [3,5]. A common feature of Ni/Al2O3 catalysts is the formation of spinel-type phases [6,7], which principally allow for both high thermal stability and Ni dispersion due to the even distribution of Ni atoms within the crystal structure. Indeed, some aluminate spinel-type catalysts have been employed in CO2 hydrogenation [8,9] with CoAl2O4 identified as an active methanation catalyst [8]. In the case of Ni, incorporation of NiO within the γ-Al2O3 defect-spinel structure to form the NiAl2O4 phase has been observed to start at calcination temperatures >573–673 K [10,11], in particular for preparation by co-gelation of Ni and Al [12]. Due to incorporation of Ni into NiAl2O4, high reduction temperatures of >1023 K are reported [12,13]. Therefore, NiAl2O4 has so far been primarily used as a catalyst for high-temperature applications such as CH4 reforming, operated at temperatures >973 K [11,14,15]. With Al2O3 in the γ transition form, these catalysts are mostly porous, with pore width of 2–10 nm [12,16,17]. As mass transfer limitations can occur during CO2 methanation, it is surprising that Ni catalysts based on Al2O3 with a bimodal meso-/macroporous structure, though available [18], have not yet been widely studied. Reports on the use of hierarchically porous catalysts for CO2 methanation are scarce, with the report on a polysiloxane-derived nickel-containing ceramic by Macedo et al. [19] being a notable exception.
Complementary to standard methods for characterizing catalyst porosity, i.e., N2 sorption, Hg porosimetry, or He pycnometry, tomographic imaging methods can provide valuable information about the pore systems of catalysts [20,21,22]. Tomography is a non-invasive method that produces quantitative 3D images of a sample, typically performed using electron or X-ray sources. For example, Andersson et al. investigated the macroporosity introduced by polymeric microspheres in Al2O3 with X-ray micro-computed tomography (µ-CT), focusing on the porosity and pore size distribution [23]. Shanti et al. studied the effect of porogen addition on the macroporosity and tortuosity of Al2O3 ceramics by the same technique [24]. However, due to resolution limitation, µ-CT is limited to investigating larger macropores, while meso- and micropores cannot be studied. Tariq et al. showed the importance of combining different imaging techniques to study relevant length scales of hierarchically porous Al2O3 by applying µ-CT, focused ion beam (FIB) tomography, and electron tomography (ET) [22]. However, while dual ion beam tomography could cover the size range from about one micrometer down to tens of nanometer, it is a destructive technique. A similar combination of FIB tomography and ET was used by Stoeckel et al. to study macro- and mesoporous silica [25], while it was shown that, based on FIB tomography and ET, mass-transfer properties could be calculated [26,27]. Recently, the potential of combining multiscale imaging techniques was shown for a study of the porous structure of Pt/Al2O3-based catalysts for exhaust aftertreatment [28]. In these studies, ptychographic X-ray computed tomography (PXCT) was used to image length scales from tens of nanometer to several micrometer, therefore covering large meso- and macropores. This relatively new technique for 3D imaging requires the use of synchrotron radiation but provides information about the electron density within the material and allows resolutions smaller than the scanning beam size with resolutions <20 nm [29,30]. To study even smaller structural features of pore systems in catalysis ET is a valuable tool, allowing studies of micro- and mesopores. However, it is strongly limited to sample sizes below the micrometer regime [21]. For the investigation of pore structures relevant in catalysis with imaging techniques, a combination of different tomography methods, i.e., µ-CT, PXCT, and ET, is necessary. Porosity information from tomography techniques is valuable to describe the gas transport in pores [31].
Recently, Ni/Al2O3 xerogels with hierarchical meso-/macropore system were reported to be active catalysts for dry reforming of CH4 [15]. The additional macropores gave rise to a higher CH4 conversion from 86.5% to 89.5% when compared to a purely mesoporous catalyst and suppressed the formation of unwanted carbon deposits. In the present study, we applied this material with its hierarchical meso-/macropore structure for CO2 methanation. An investigation of catalytic properties is related to a thorough characterization of the pore system, both using established bulk methods as well as the combination of PXCT and ET as multiscale imaging methods. Based on the data obtained, a model-based investigation on the macrokinetics of a hierarchically porous catalyst pellet was conducted and compared to a purely mesoporous catalyst pellet to predict potential mass transport limitations. The combination of targeted synthesis of hierarchical pore structures, multimodal characterization of pore structures, and simulation is readily applicable to other hierarchically structured materials with complex porosity.

2. Results and Discussion

2.1. Synthesis and Structural Characterization

The Ni/Al2O3 catalyst with a hierarchical meso- and macropore structure (denoted as Ni/Al2O3-h) was prepared based on the route by Herwig et al. [15]. According to inductively coupled plasma optical emission spectrometry (ICP-OES) analysis, the Ni mass fractions of the xerogel sample was 18.0 wt.% for Ni/Al2O3-h.
We analyzed the crystallographic structure of the calcined Ni/Al2O3-h sample via Rietveld refinement of powder X-ray diffraction (PXRD) data to understand the influence of the co-gelation synthesis procedure on the resulting structure. For the synthesis of Ni/Al2O3-h, the formation of a NiAl2O4 spinel phase was already known [15], while crystallographic details were not reported yet. However, this is important to properly understand the material as NiAl2O4 is a spinel structure and most transition Al2O3, e.g., γ or η-Al2O3, are typically described as defect-spinel structures [32,33,34,35]. As Ni/Al2O3-h is synthesized by co-gelation, an initially homogeneous distribution of Ni and Al can be expected. This raises the question of whether an Al2O3 transition form, NiO or NiAl2O4 as reported by Herwig et al. [15], is obtained upon calcination. From a qualitative analysis of the PXRD one can already exclude the formation of crystalline NiO. To get more insights into the formation of the Al2O3 transition form or NiAl2O4 we used Rietveld refinement. The resulting patterns for two different refinements of the same PXRD data set are shown in Figure 1a,b. An initial approach for the refinement was to use structure models of γ-Al2O3 by Zhou et al. and NiAl2O4 by O’Neill et al. without refinement of atomic parameters, which is shown in Figure 1a [33,36]. Compared to this, Figure 1b shows another refinement with the same structural models as above, but with refinement of occupancy of the Al positions of the γ-Al2O3 transition form. From the refined patterns, one can directly see that the occupancy refinement (Figure 1b) led to a better fit compared to fixed occupancies (Figure 1a). Other potentially matching Al2O3 transition forms such as η-Al2O3 by Zhou et al. were also tested for refinement but led to worse results [33].
The results obtained from the Rietveld refinements are summarized for both refinements in the Supplementary Materials Table S1. The observed better fit was also confirmed by the Rwp and GoF fit criteria of the refinement. For both refinements, the main phase was the Al2O3 transition form with a phase fraction of 95.5 wt.% versus 84.3 wt.% for the refined occupancy vs. the fixed one. In both cases, the crystallite sizes obtained by microstructure analysis were similar and resembled nanocrystalline materials of around 7 nm size for the Al2O3 transition form as well as for NiAl2O4. The nanocrystalline nature is typical for Al2O3 transition forms [34,35]. Our focus in the refinement results was on the occupancy of the Al positions. For a better structural understanding, the Al2O3 structure is illustrated in Figure 1c. The O position of the Al2O3 phase was fixed as it is generally reported that in all defect spinel-type Al2O3 transition forms (γ-, η-, θ-Al2O3) this position is fully occupied and the transition forms can be described by different Al occupancies of the octahedral and tetrahedral voids of the O sublattice [33,35]. In Figure 1c, the octahedral voids of the Al1 position are shown in blue and the tetrahedral voids of the Al2 position are orange. For clarity, the Al3 position is not shown, while it resembled a distorted octahedral position. In comparison with both refinements, the occupancy of the tetrahedral void was equal with 0.84 in the literature-reported structure and 0.839(4) in the refinement. However, the distorted Al3 position in the analysis with refined occupancy was strongly decreased compared to the literature structure and we considered this position as barely occupied. As the Ni/Al2O3-h material was prepared via co-gelation, a homogeneous distribution of Ni was expected. However, the refined Al1 occupancy showed an increased occupation with 1.156(7) compared to the literature value of 0.58. This indicates that Ni was not only present in the NiAl2O4 spinel phase, but also present in the octahedral void of the Al2O3 transition form. This higher occupancy indicates an increased electron density in the octahedral void, which could be caused by a mixed occupancy of this position by Al and Ni, as in the ideal NiAl2O4 structure. A refinement of a mixed occupancy is limited by the data quality and requires further studies.
This is partially supported by results from DRUV/vis spectroscopy, as shown in Figure 2. In several literature sources, the absorption band at around 380 nm was assigned to octahedrally coordinated Ni2+, while the bands at about 550 to 650 nm were assigned to tetrahedrally coordinated Ni2+ within the NiAl2O4 structure [11,37,38,39]. Therefore, both coordination environments of Ni2+ should be present within the Ni/Al2O3-h sample. Rietveld refinement indicates that Ni2+ was already integrated into the Al2O3 transition form by occupying the octahedral Al1 site, while we also observed the formation of NiAl2O4 secondary phase. The incorporation of Ni already into the Al2O3 transition form upon calcination resembled a potential problem regarding the reducibility of the material. However, based on the current results, a detailed structural knowledge about the incorporation pathway was missing and needs to be investigated.
The H2-TPR curves for Ni/Al2O3-h are shown in Figure 3 a. The reduction of NiO typically occurs between 473 K and 573 K, depending on the particle size, support material, and confinement within pores [40,41]. Consistently, a physical mixture (PM) of NiO powder and the Ni-free xerogel support showed a reduction peak with maximum at 580 K (Figure 3a). Compared to this mixture, the maximum reduction temperature (Tred) of Ni/Al2O3-h was 1111 K. This remarkably higher Tred was likely caused by the incorporation of Ni into the Al2O3 or the NiAl2O4 structure (Figure 1) [40], and has been suggested by Herwig et al. [15] and Titus et al. [42] for Ni/Al2O3 xerogel catalysts. Within the Al2O3 or the NiAl2O4 structure, Ni2+ is strongly bound within the framework of the crystal, which hampers its reduction to Ni0. The H2 consumption during TPR of Ni/Al2O3-h amounted to 1800 µmol g-1, which represented a reduction of only 59% of the Ni atoms based on ICP-OES results, when NiO was assumed to react with H2 in a 1:1 molar ratio. This shows that even the high temperatures of up to 1173 K were not enough to fully reduce Ni within the sample. Nevertheless, reduction during TPR resulted in color change of the powder from blue to black (Figure 3b), indicative of the transformation of Ni2+ to Ni0, consistent with UV-vis spectroscopy results (Figure 2).

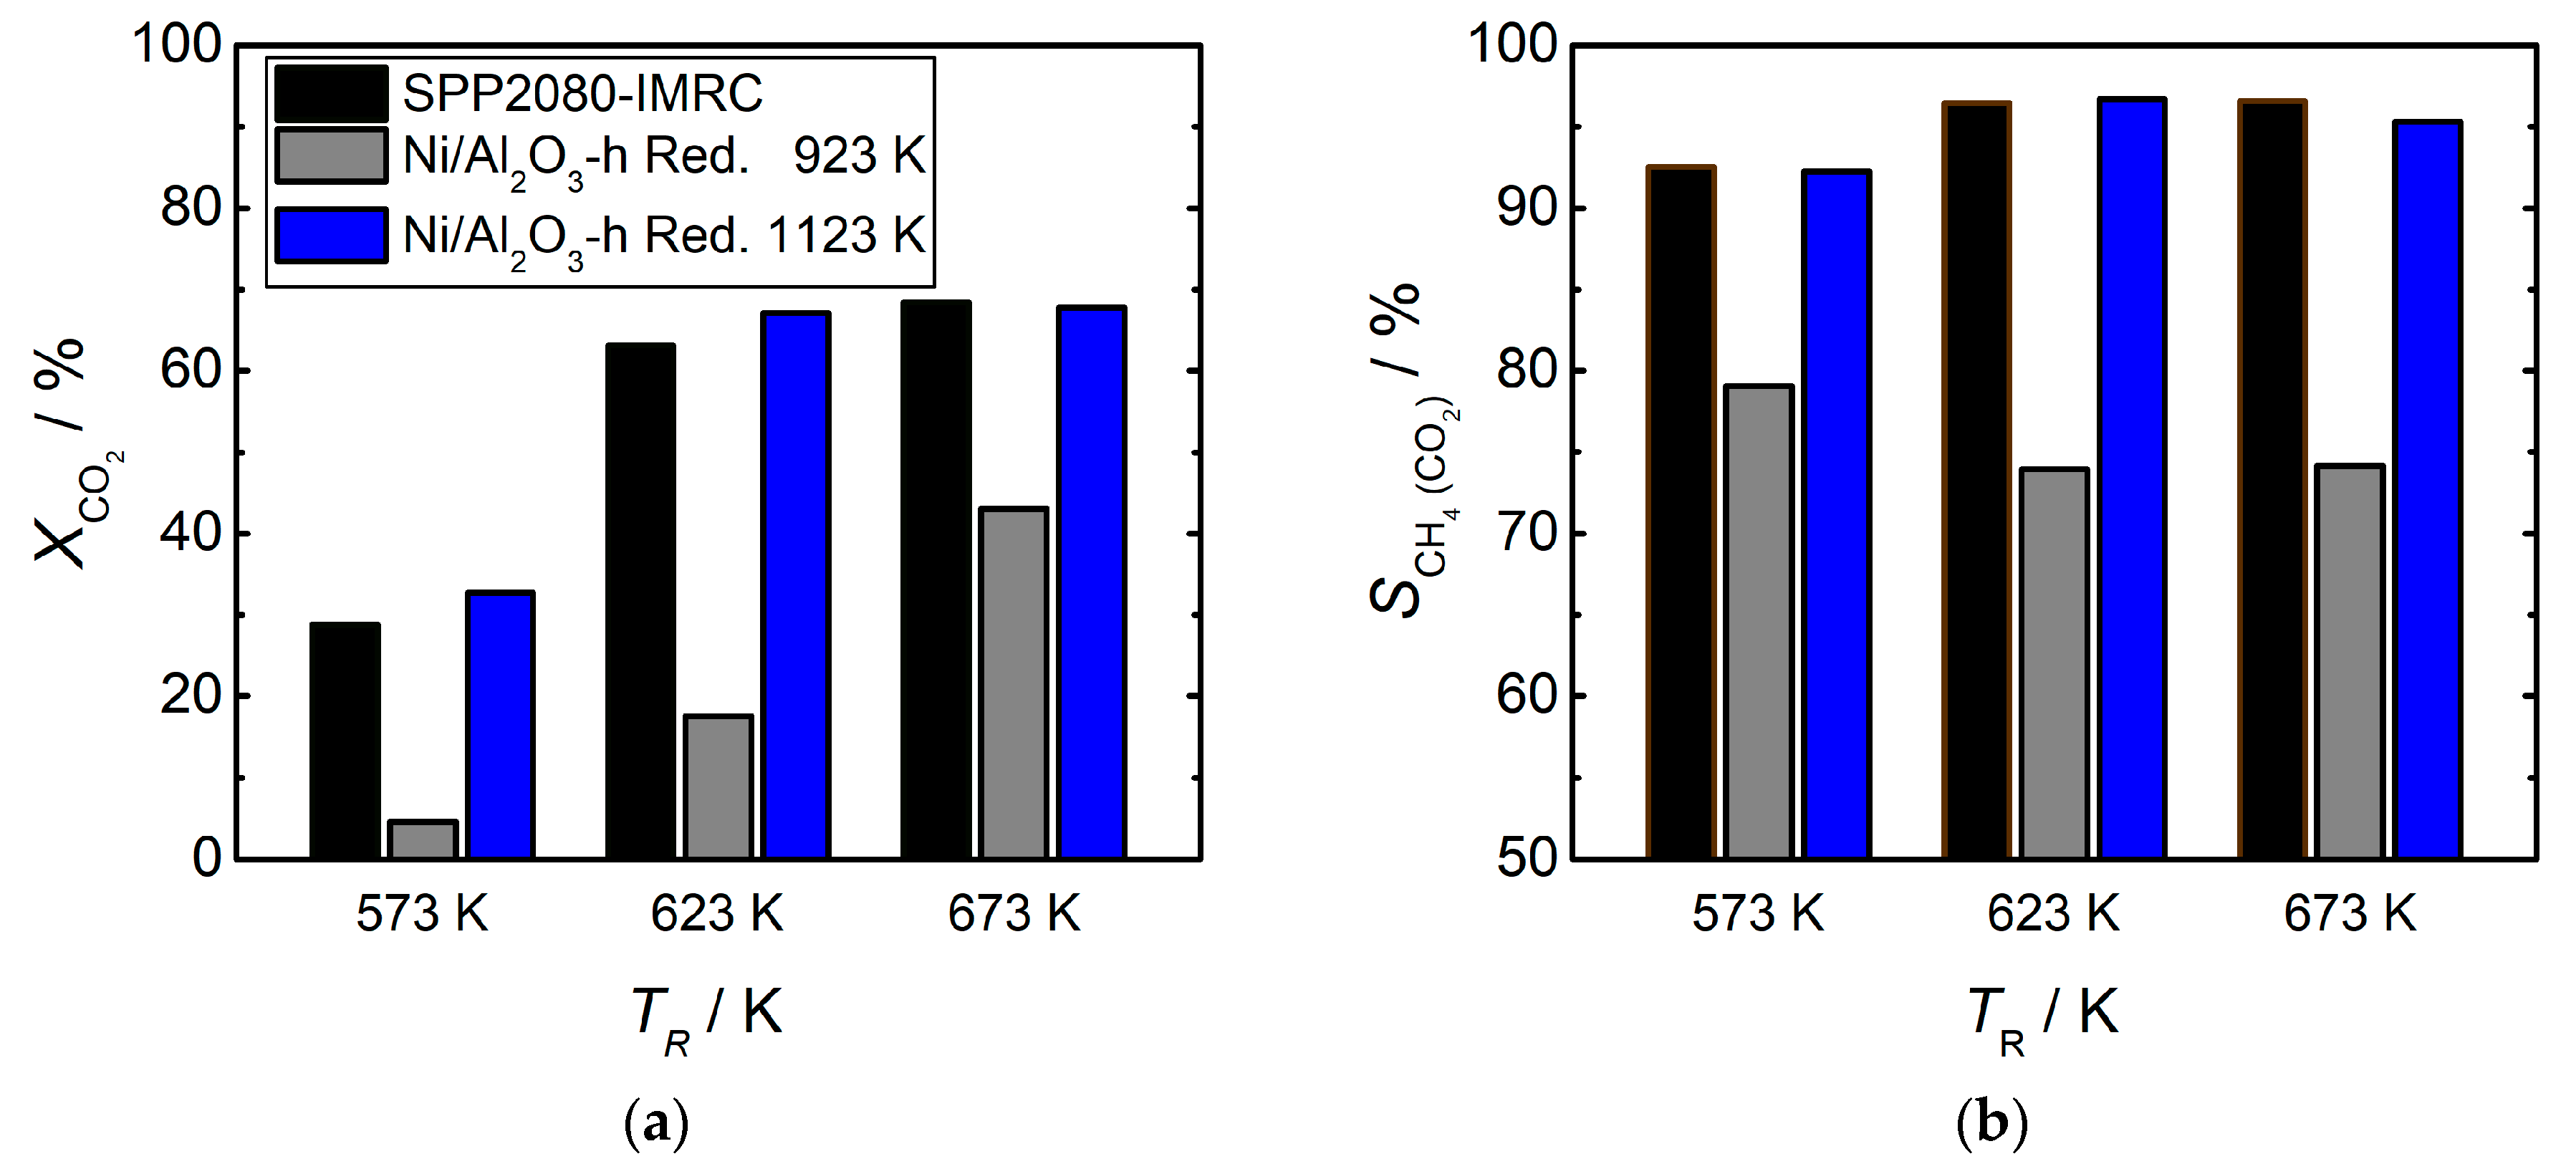
2.2. Catalytic Measurements

The catalytic activity in the methanation of CO2 with H2 was investigated for the Ni/Al2O3-h catalyst reduced at two temperatures (Figure 4). The activity of the catalyst was compared to an industrial Ni/Al2O3 reference catalyst (denoted as SPP2080-IMRC) containing 8.2 wt.% Ni and a Brunauer–Emmett–Teller (BET) surface area of 130 m2∙g−1. The activity studies were performed to determine whether the necessary harsh activation conditions of the material resulted in a functional catalyst for CO2 methanation. A substantial increase of the CO2 conversion was found if Ni/Al2O3-h was reduced at 1123 K compared to 923 K (Figure 4a), while the CH4 selectivity increased significantly to >90% (Figure 4b). This finding is conclusive with the results obtained from H2-TPR (Figure 4a), in which the temperature of 923 K represented the onset of the catalyst reduction, whereas 1123 K was close to the maximum H2 consumption. Therefore, it is reasonable to assume that increasing the reduction temperature to 1123 K led to a significantly larger fraction of Ni atoms being reduced to the elemental state and, thus, becoming active. This resulted in a significant enhancement of the CO2 conversion and the CH4 selectivity since Ni0 was mainly responsible for the hydrogenation activity of the catalyst [43,44].
When reduced at 1123 K, the CO2 conversion of 67% obtained for the Ni/Al2O3-h catalyst at a reaction temperature of 623 K and 673 K was higher than ~38% (623 K) and ~49% (673 K) for the 20 wt.% Ni/ZrO2 catalysts studied by Martínez et al. [45] under similar catalytic conditions, although the CH4 selectivity of >99% reported by Martínez et al. is higher than the values obtained in this study. The Ni/Al2O3-h catalyst reduced at 1123 K is also comparable with the SPP2080-IMRC catalyst in terms of CO2 conversion and CH4 selectivity (Figure 4). However, given both the substantially higher reduction temperature and Ni loading, the Ni/Al2O3-h catalyst did not compete with the SPP2080-IMRC catalyst in terms of activity. Furthermore, it should be noted that comparison of catalysts here based on conversion is shown purely as a qualitative method to determine whether or not the catalyst was active following synthesis of the hierarchical pore system. To quantitatively compare effectiveness or efficiency of the various catalysts in the future, further kinetic studies are required including consideration of metal loading, dispersion, turnover, and presence of mass transport phenomena over a range of conditions.

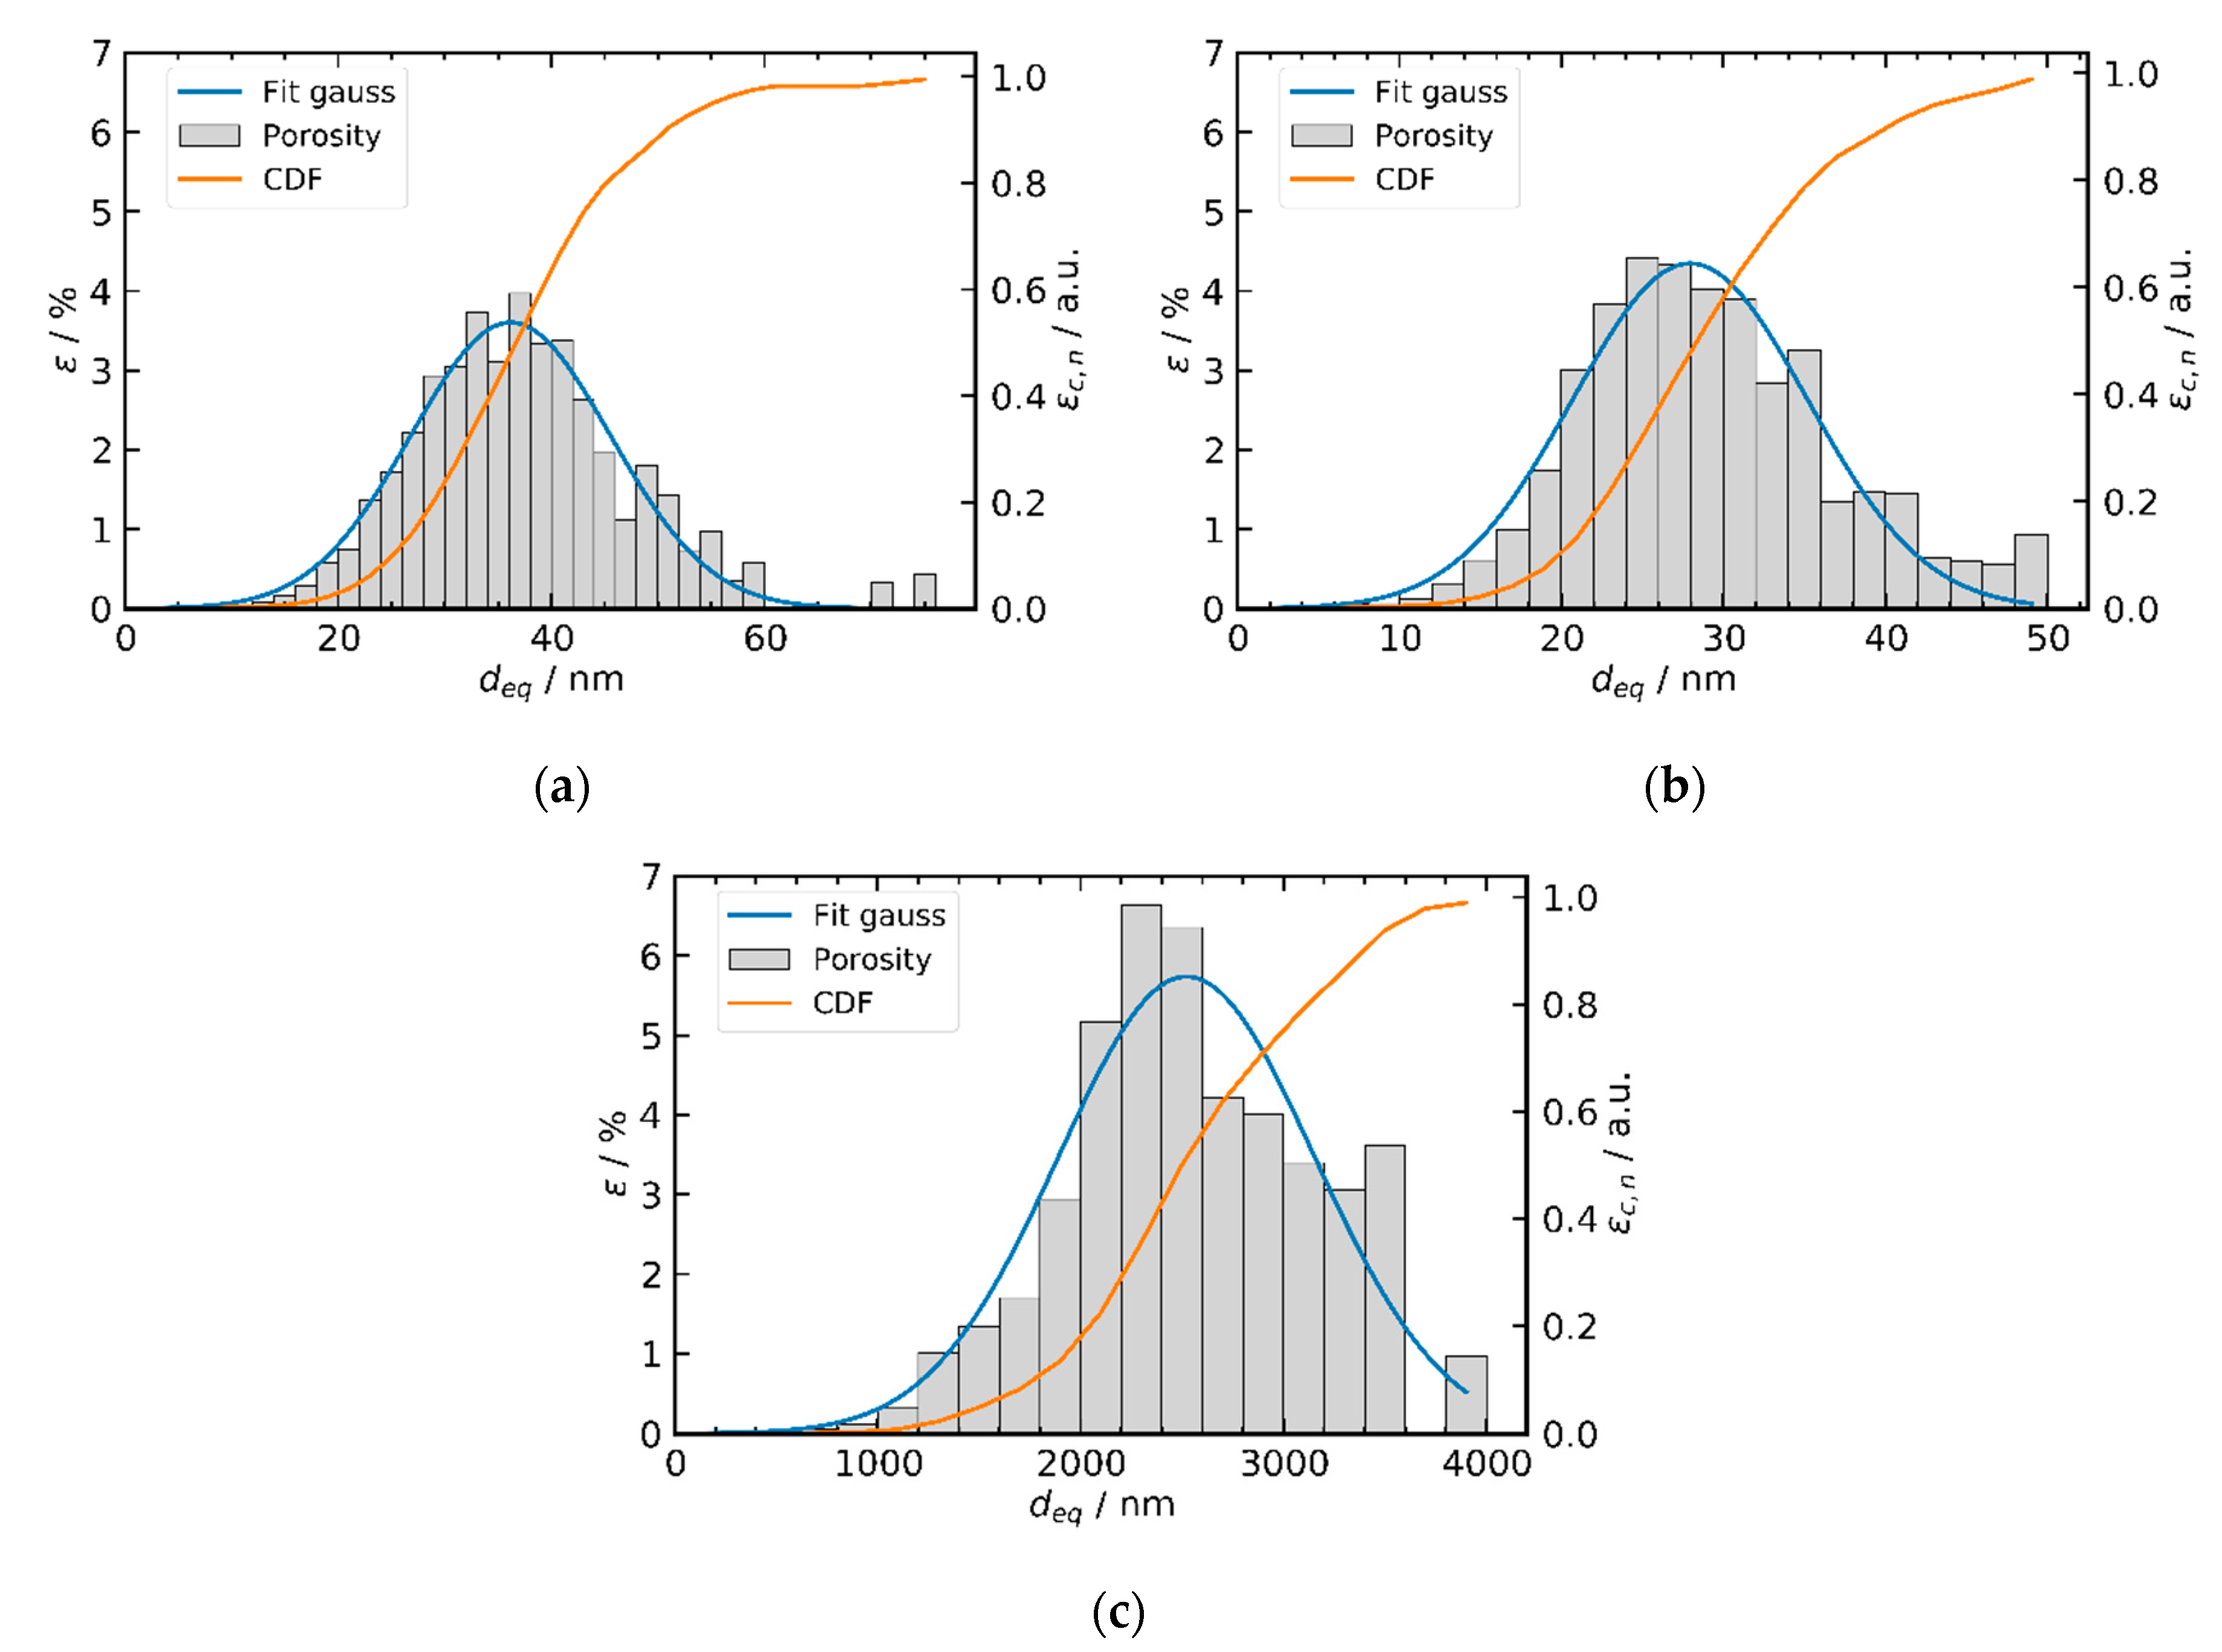
2.3. Tomography Studies

To investigate the pore structure of the hierarchical meso-/macroporous Ni/Al2O3-h catalyst we performed ET and PXCT studies. The volume renderings for the PXCT and both discrete algebraic reconstruction technique (DART)-reconstructed ETs are shown in Figure 5. For the PXCT volumes in Figure 5a, the upper part of the tomogram was cropped to remove Pt traces from the sample preparation. For original tomogram, see Supplementary Materials Figure S4. The reconstructed tomogram had a voxel size of 38.1 nm and an effective spatial resolution of 78.3 nm, estimated by Fourier shell correlation (FSC) as implemented in the reconstruction script of Odstrčil et al. [46]. The selected region and the associated FSC are shown in the Supplementary Materials Figures S5 and S6, respectively. The measured particle had a maximum diameter of about 25 µm. The sample size and the resolution allowed obtaining information about the whole macropore space of the material. The two DART-reconstructed ET volumes of the Ni/Al2O3-h catalyst are visualized in Figure 5b,c, respectively. The measured particles had a diameter of about 450 nm for ET1 and 400 nm for ET2, while the obtained voxel size after simultaneous iterative reconstruction technique (SIRT) and DART reconstruction was 0.92 nm and 0.64 nm for ET1 and ET2, respectively. The sample size and resolution of the ET volumes allowed us to investigate the mesopores of the material, though on a limited region of the sample. The effective resolutions for ET1 and ET2 were estimated as 4.2 nm and 5.6 nm based on the 10–90% rise distance analysis of an edge feature in the SIRT reconstructed tomogram (see Supplementary Materials Figures S1 and S2). For all three tomograms shown in Figure 5, image analysis was performed as described in the experimental Section 3.4. to obtain labels for the material (blue, white), the total pore space (orange), and separated individually labelled pores (8-bit color coding). For all three tomograms, a slice through the volume is shown to illustrate the total pore space together with the separated pores. The combination of PXCT and ET was essential to cover all relevant length scales of the pore system ranging from mesopores (2 nm to 50 nm) up to macropores in the µm range [28,47]. The different length scales between PXCT and ET are illustrated by the black box in Figure 5, as we can considered the ET volume as a zoom into the material label identified by PXCT. In the PXCT volume (Figure 5a), one can see a well-connected macropore network, while we did not resolve the mesopores of the material as the resolution was limited to 78.3 nm. However, by applying ET one can resolve the mesopores present inside the material label of the PXCT, as shown in Figure 5b,c. The mesopores formed a connected network, similar to the macropores. Based on this multiscale analysis, one can justify the application of the term “hierarchical” for the pore system, as the macropores formed an overall connected system as shown by PXCT, with the mesopores identified by ET connected to this macropore network. Quantitative analysis of the tomograms is presented in Section 2.4.

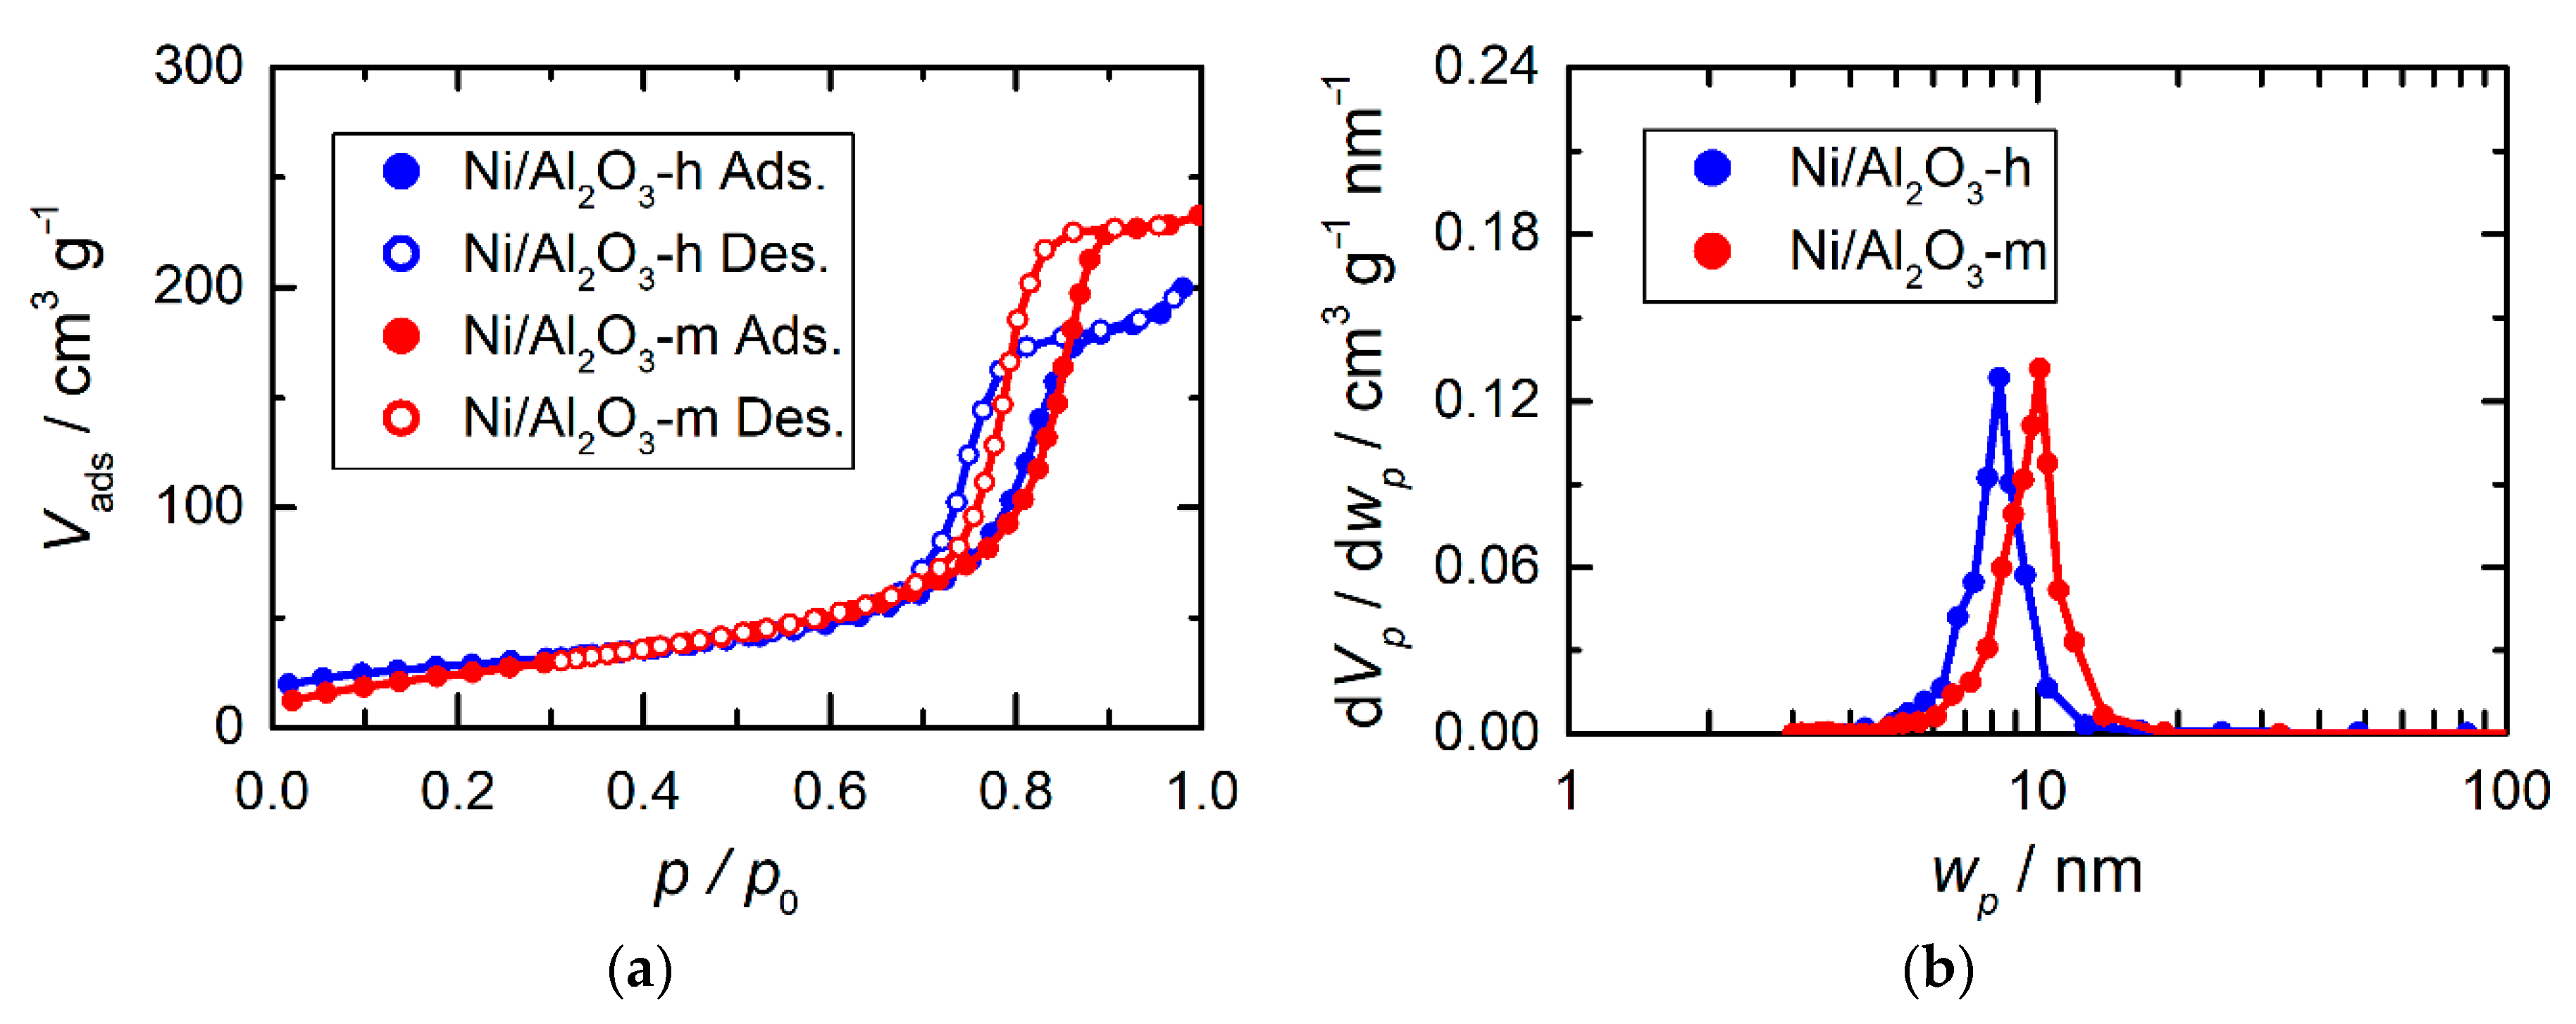
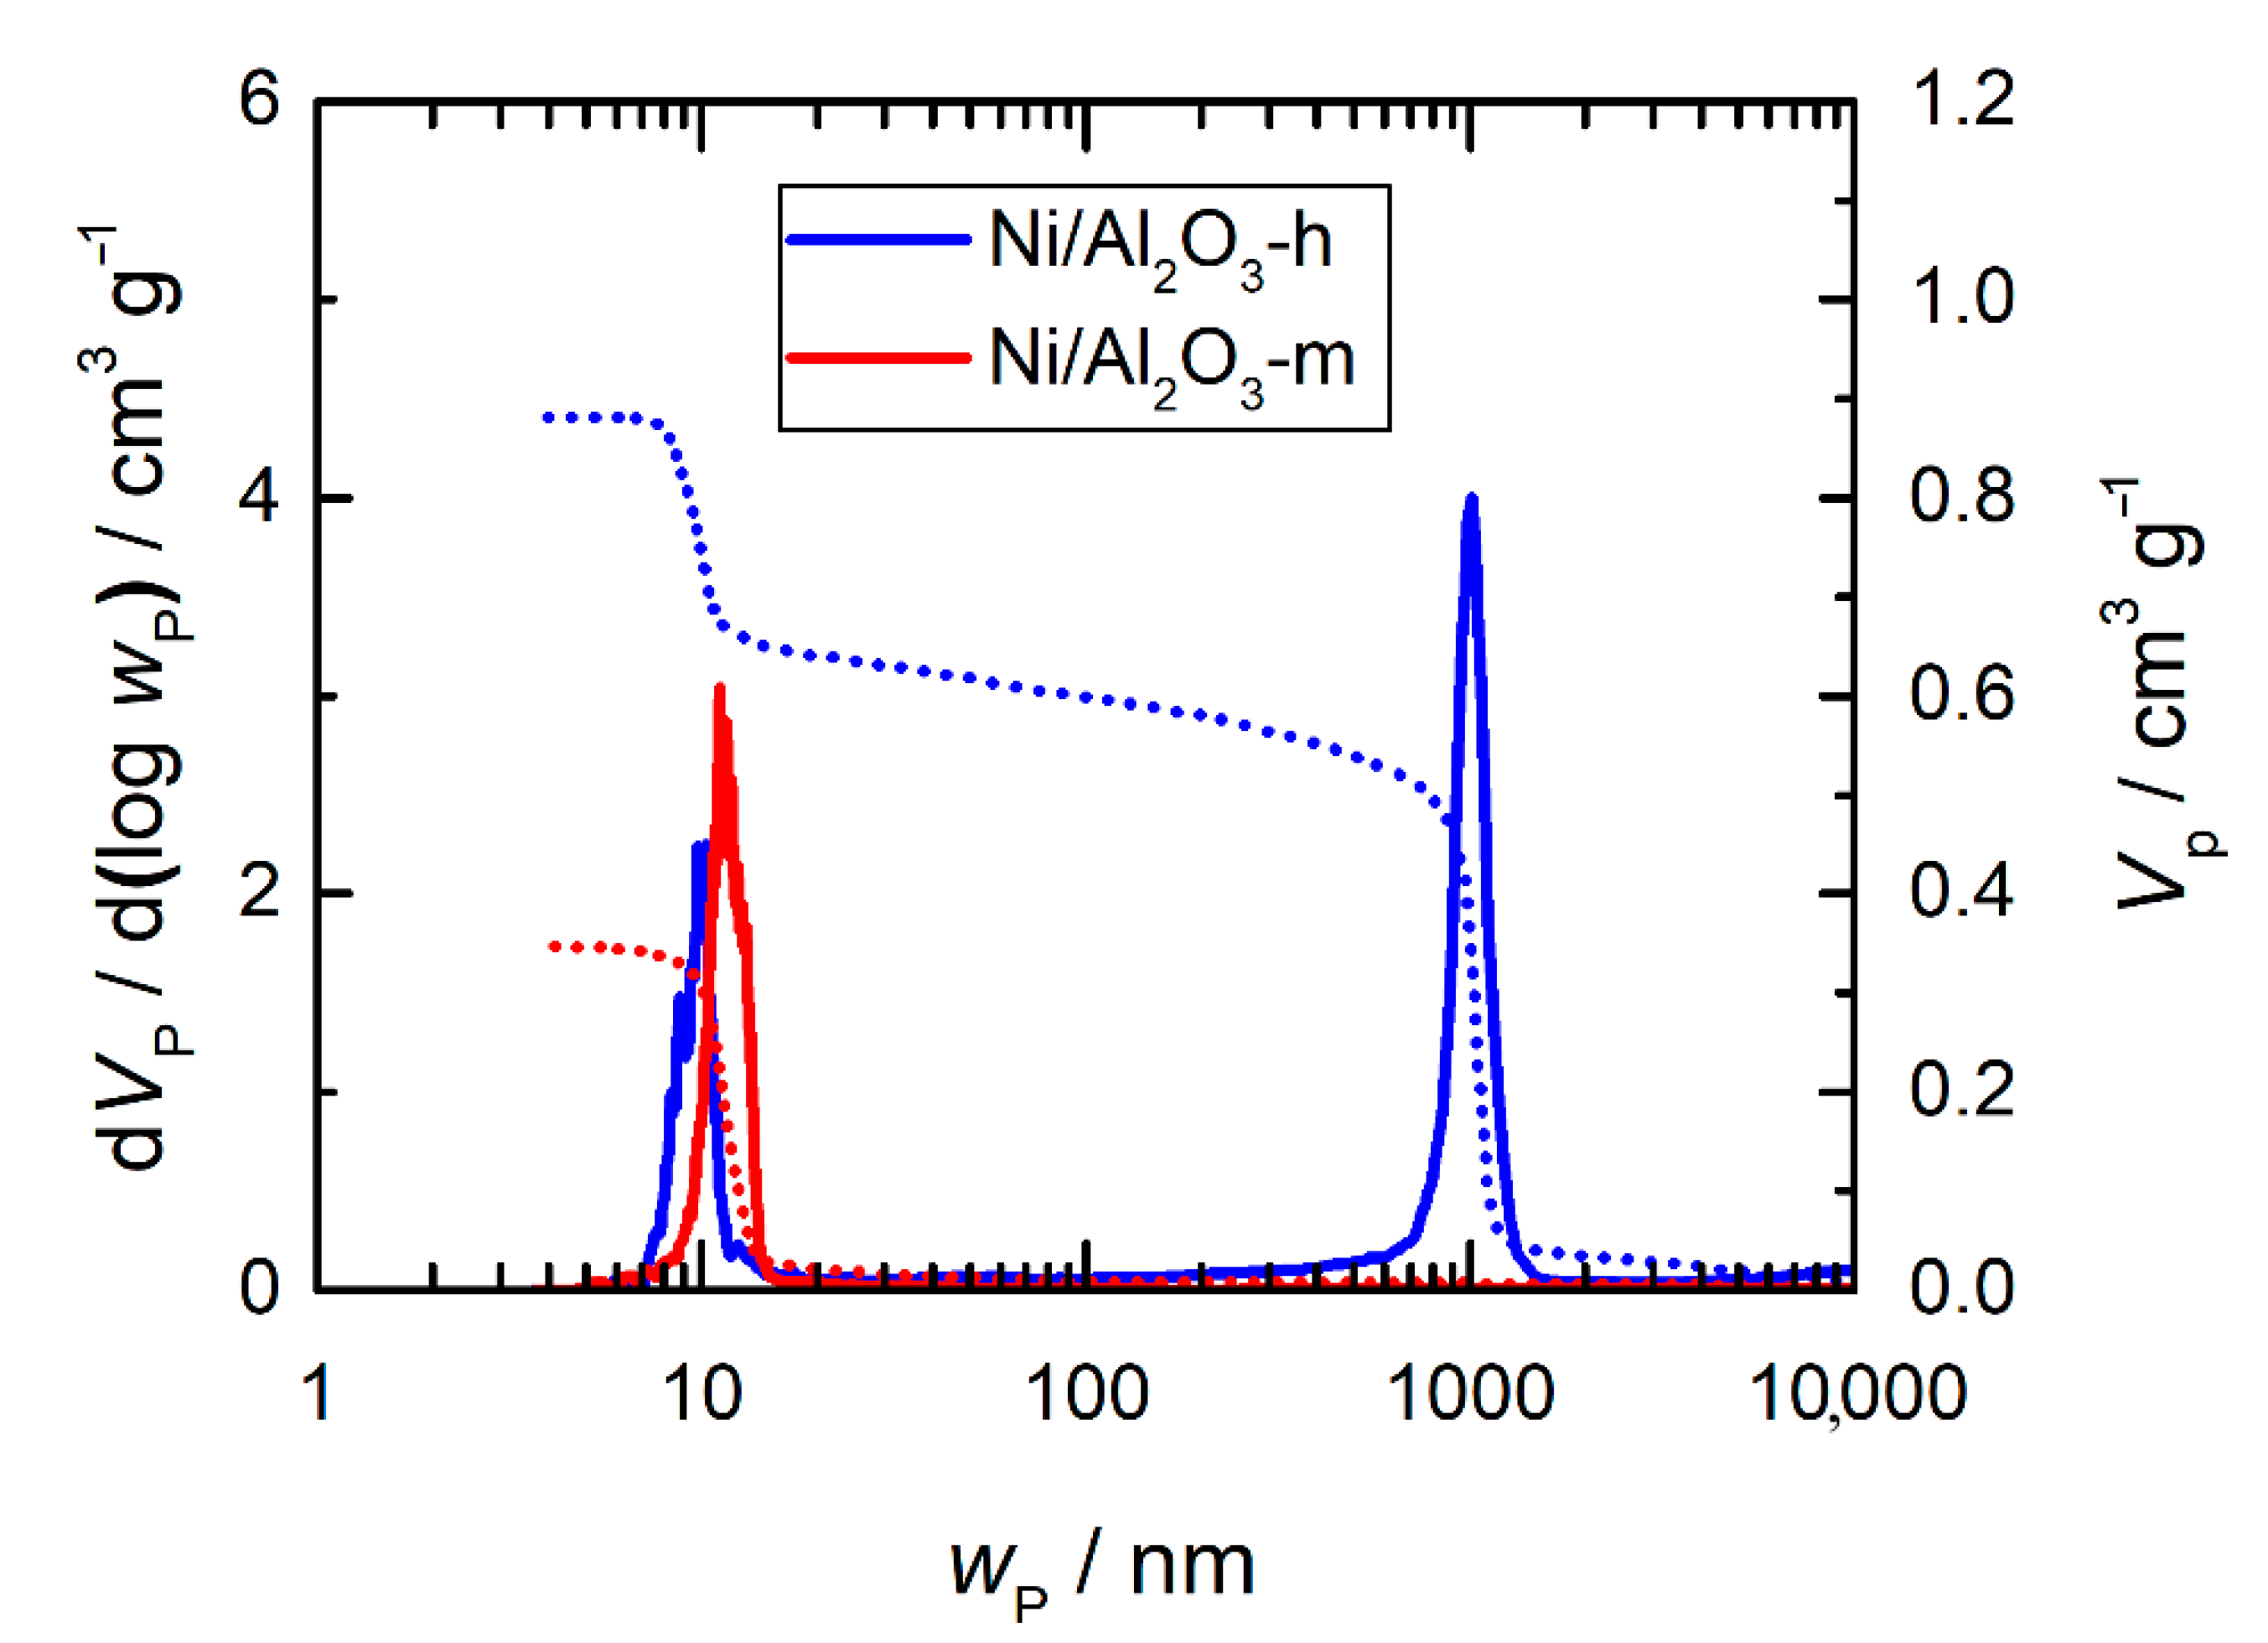
2.4. Porosity Analysis

The separated pores (8-bit color code), total pore (orange), and material (blue) labels for both the ET and PXCT volumes were quantitatively analyzed to retrieve porosity descriptors for the Ni/Al2O3-h catalyst. From the label analysis using Avizo we retrieved information such as volume and surface area for the material and total pore labels, as well as the equivalent pore diameter deq (Equation (4)) for each individual pore label, as shown in Figure 5a–c for the PXCT and ET volumes, respectively. The rounded total pore Vp,tot and material volumes Vs,tot are listed in Table 1 together with the total porosity εtomo of each tomogram. All three tomograms show a porosity larger than 40%. With respect to the resolution, εtomo of the PXCT is defined as the macroporosity εM of the Ni/Al2O3-h catalyst based on image analysis. To calculate the total porosity εtot of the material based on the tomography studies, the mesoporosity visible by ET must also be included. Therefore, the porosity of the material label in PXCT was assumed to further contain the average of the porosity values obtained from ET, which was 44.9%. Taking into account this extra porosity for the PXCT results, a εtot of 70.4% was obtained. Based on this εtot, the mesoporosity εm of the Ni/Al2O3-h catalyst based on the tomography analysis was 24.1%.
In addition to the porosity information, one can extract information about the pore size distribution from the tomograms. The frequency of the occurrence of each pore diameter for the three tomograms is shown in the Supplementary Materials Figure S7. For the PXCT volumes, one can observe a unimodal pore size distribution based on the frequency analysis with a maximum around 2 µm. The frequency-based pore distribution indicates a bimodal pore size distribution for the ET volumes with a maximum around 3 nm and another at around 22 nm to 25 nm. Based on the qualitative analysis of the ET, we can assign the small pores around 2 nm to 6 nm to mainly isolated pores or artefacts from the pore separation that were not removed by the “Opening” module or caused by the limited effective resolution. These were not considered to contribute to the total porosity. The larger mesopores represent the measurable pores of the connected pore system.
To investigate the contribution of different pore sizes toward the pore volume, the porosity of each individual pore was calculated by Equation (6), and the sum of the individual porosities was plotted depending on deq, as shown in Figure 6 for (a) ET1, (b) ET2, and (c) PXCT. The obtained pore size distributions were analyzed to obtain the weighted numerical mean pore diameter deq,w as well as the fitted mean pore diameter deq,f from the Gaussian fit. Both mean pore diameter values for all three tomograms are summarized in Table 1. The difference between deq,w and deq,f was used to estimate the error of the mean pore diameter, while, for further discussion, the values of deq,w were used. For ET1 and ET2 we obtained deq,w of 37.4 ± 1.2 nm and 29.2 ± 1.3 nm, respectively. These values represent mesopores in the Ni/Al2O3-h catalyst, while no significant amount of macropores could be detected by ET. The absence of meaningful macropore data may be due to the limited size of the sample, which can be investigated by ET (e.g., 450 nm diameter), which can potentially be the same order of magnitude as a single large macropore. The average of deq,w of ET1 and ET2 is the mean mesopore diameter deq,meso of 33.3 ± 4.1 nm of the Ni/Al2O3-h catalyst determined from tomography analysis. The mean pore diameter for the macroporosity deq,macro was similarly determined from the pore size distribution of the PXCT data as 2545 ± 23 nm. While no significant porosity contribution of macropores below 1 µm can be observed, the majority of the macropores ranged from 1 µm up to 3.5 µm, resembling a narrow macropore distribution and, thus, a relatively homogenous pore system. Compared to the study of Tariq et al. on a hierarchical Al2O3 material, we observed a much higher macro- and mesoporosity for our Ni/Al2O3-h catalysts and a narrower pore size distribution, especially for the macropore space [22]. Furthermore, by the combination of PXCT with ET we could cover the relevant length scales for the hierarchical pore system of the Ni/Al2O3-h catalyst with only two techniques, instead of a combination of ET (limited sample volume), dual-beam FIB imaging (destructive), and µ-CT (low spatial resolution). PXCT is particularly notable for allowing exceptional spatial resolutions for a hard X-ray imaging method, which can therefore be applied to extended sample volumes in the micron scale. Here the combination of ET and PXCT enabled us to detect pores ranging from about 2 nm to 80 nm (ET) up to 4 µm (PXCT).
The textural properties of Ni/Al2O3-h were also studied using well-established characterization techniques, i.e., N2 sorption and Hg porosimetry. For these conventional techniques, a purely mesoporous Ni/Al2O3-m sample, prepared via the same method but without addition of PEG, was used for comparison. The Ni/Al2O3-m sample contained a similar amount of 18.6 wt.% Ni as the Ni/Al2O3-h. According to the IUPAC definition [48], the N2 sorption isotherms displayed in Figure 7a can be classified as type IV isotherms with a H1 hysteresis, indicating mesoporous materials. Indeed, narrow pore width distributions (Figure 7b) with maxima at 8.3 nm and 10.3 nm were obtained, respectively. The different mesopore widths for these materials were most likely caused by the influences of the polymerization-induced phase separation on the gelation process, which was induced in Ni/Al2O3-h but not in Ni/Al2O3-m.
The existence of mesopores within Ni/Al2O3-h and Ni/Al2O3-m was also confirmed with Hg porosimetry (Figure 8). Additionally, Ni/Al2O3-h exhibited macropores with a narrow width distribution around 1000 nm. This illustrates the bimodal nature of the pore system with distinct meso- and macropore regimes. Approximately two-thirds of the specific total pore volume of Ni/Al2O3-h was contributed by macropores, with the remaining third from the mesopores (Table 2). Both mesopore width and specific mesopore volume of Ni/Al2O3-h and Ni/Al2O3-m are comparable to the values obtained by Herwig et al. [15], though lower values for macropore width and higher values for specific macropore volume were reported. However, the Ni loading (3.4 wt.%, 23 wt.%, and 33 wt.%) and the amount of polyethylene glycol (PEO) used during gelation, both of which were found to have a large impact on the macropore formation [15], are different from this current work. We decided on a Ni mass fraction of 18 wt.% since this is a common Ni loading for CO2 methanation catalysts [45,49]. Therefore, the comparability of the macropore systems of the materials prepared here with those from Herwig et al. [15] is limited.
The pore widths wP of Ni/Al2O3-h and Ni/Al2O3-m determined from Hg porosimetry were 1-2 nm higher and the specific mesopore volume was slightly lower compared to the results from N2 sorption (Table 2). This may be due to an inaccurate representation of the smaller mesopores (<10 nm) by Hg porosimetry at high pressure, which results in a higher impact of connectivity effects [50]. Thus, within the mesopore range, Hg intrusion could rather represent a more pore throat width distribution compared to a rather pore body width distribution for N2 sorption, as suggested by Rijfkogel et al. [51].
To experimentally determine the porosity of the Ni/Al2O3 xerogels, He pycnometry was performed and combined with the Hg porosimetry results according to Equation (1). The skeletal density of Ni/Al2O3-h and Ni/Al2O3-m was similar (Table 2), with that of Ni/Al2O3-h being slightly lower, possibly due to a higher degree of pores inaccessible to Hg. Notably, a porosity of 59% was obtained for the purely mesoporous Ni/Al2O3-m. The introduction of PEO during gelation, which generates a substantial amount of macropores, then gave rise to an increase in porosity to 78% for Ni/Al2O3-h.
To compare the results of the porosity analysis of Ni/Al2O3-h for the different techniques we focused on the pore size distributions and porosity values obtained by the standard techniques and imaging methods. The total porosity εtot from He pycnometry and Hg porosimetry was 78.0%, with a macroporosity of εM = 55.0% and a mesoporosity of εm = 23.0%. The combined values obtained from the tomography studies were 70.4% for εtot, 46.3% for εM, and 24.1% for εm. The macroporosity determination via both methods seemed to be in a similar range, with a difference of 7.4%. This behavior with similar macroporosity differences between X-ray tomography and Hg porosimetry characterization was also found by Andersson et al. and Tariq et al. [22,23]. Compared to the macroporosity determination, the difference between the mesoporosity values obtained from conventional techniques and the imaging techniques was even smaller, with only 1.1%. Tariq et al. [22] reported the major discrepancy in porosity determination for the mesoporosity analysis of Hg porosimetry compared to ET. However, in our case, the mesoporosity information matched well. The reason for the differences in the study of Tariq et al. is that, there, pores below 10 nm diameter could not be properly resolved [22]. This shows that the accuracy of quantitative porosity analysis by tomographic methods is directly linked to the spatial resolution, and it is, therefore, crucial to report on the spatial resolution during such investigations.
Aside from the porosity values, the wP,macro by Hg porosimetry with 1.012 µm was smaller than the deq,macro determined via PXCT with 2.545 µm. Hg porosimetry is known from literature to overestimate small pore sizes in the macropore range on the costs of larger pore sizes [22,52,53,54]. This can be explained considering that Hg porosimetry probes the pore throat size/pore opening size by using the Washburn equation [55], while with image analysis using the PXCT data we determined the equivalent diameter assuming spherical pores within the material according to Equation (4). In addition to the wP,macro, the wP,meso of the mesopores determined by Hg porosimetry or N2-sorption ranged from 10.3 to 8.3 nm, respectively, and was much smaller than the average 33.3 ± 4.1 nm obtained from ET. This difference can be explained, again, by the different pore size definitions as for macropores. On the other hand, the presence of a hierarchical pore network is difficult to elucidate unambiguously by conventional methods, like N2 sorption, Hg porosimetry, and He pycnometry. From the visual inspection of the pore structure from the segmented tomography data Figure 5, we can conclude that the Ni/Al2O3-h catalyst exhibits a well-connected macropores’ network, while the mesopores are located within the solid material label of the PXCT. This represents a hierarchical pore system as the macropores form a parent-connected network from which the mesopores are originating. This clearly shows the advantage of imaging methods in performing quantitative and meaningful pore structure analysis, as not only pore sizes and porosity can be analyzed, but also more complex pore network models can be retrieved and co-located in 3D space [20].

2.5. Macrokinetics

To obtain information about the macrokinetics of the hierarchically porous catalyst, a model-based investigation was conducted on the discussed sample. The results were compared to an exclusively mesoporous sample. The relevant equations are given in the Supplementary Materials. This model-based investigation aimed to evaluate the relevant conditions in CO2 methanation where a tailored hierarchical pore system might be advantageous in terms of mass-transport properties, compared to a conventional purely mesoporous material.
The calculated diffusion coefficients (DCO2,eff) based on PXCT data and Hg-Intrusion data are given in Table 3 at industrially occurring CO2 methanation conditions. According to these results, the introduction of the macroporous network into the porous catalyst material increased the effective diffusion coefficient by more than one order of magnitude. The reason for this is that in the macropores’ molecular diffusion was the main diffusion mechanism, while in the mesopores, Knudsen diffusion prevailed. Thus, much higher catalyst effectiveness factors are expected to be present for a catalyst pellet with hierarchical pore system of industrially relevant size at high temperatures.
To underline this statement, the effective reaction rates as well as effectiveness factors for a spherical catalyst pellet of 2.5 mm diameter based on the pore network properties given in Table 3 were calculated. The results are shown in the Arrhenius plots in Figure 9. On the one hand, it is evident that mass transport limitations in the exclusively mesoporous sample started at about 550 K. On the other hand, mass transport limitations for the hierarchically porous sample started at about 650 K to 675 K, depending on the data set. However, it has to be noted, that this effect was not solely based on the increased diffusion coefficient in the hierarchically porous material but also on the lower intrinsic reaction rate. This is due to the lower mesoporosity of the hierarchically porous sample, in comparison to the exclusively mesoporous sample. Based on the observed potential mass-transfer limitations from the macrokinetic simulations, further kinetic studies on the Ni/Al2O3-h and Ni/Al2O3-m samples should be carried out to experimentally validate whether a hierarchical pore system is superior in terms of minimizing mass transport phenomena, compared to a purely mesoporous material.

3. Materials and Methods

3.1. Materials and Synthesis

Chemicals used were aluminum chloride hexahydrate (AlCl3·6H2O, 99%, AlfaAesar), nickel(II) chloride hexahydrate (NiCl2·6H2O, 98%, AlfaAesar, Ward Hill, MA, USA), polyethylene glycol MW 900,000 (PEG-900k, no purity given, AlfaAesar, Ward Hill, MA, USA), (±)-propylene oxide (PO, 99.5%, Acros Organics, Fair Lawn, NJ, USA), ethanol (EtOH, for gelation: absolute, VWR, Radnor, PA, USA; for solvent exchange: 99.5% denaturated with 1% butan-2-one, VWR, Radnor, PA, USA; and nickel(II) oxide nanopowder (99.8%, Aldrich, St. Louis, MO, USA).
The synthesis of 18Ni/Al2O3-h was adapted from Herwig et al. [15]: 2.88 g NiCl2·6H2O, 12.53 g AlCl3·6H2O, and 0.200 g PEG-900k were dissolved in an EtOH-H2O-mixture to give a molar ratio of nM/nEtOH/nH2O = 1/5.4/30.1/3.5·10−6, with nM = nNi + nAl. The masses of NiCl2·6H2O and AlCl3·6H2O were calculated for a target Ni mass fraction of 20 wt.%. The solution was cooled in an ice bath to 274 to 276 K. Then, 11.52 g of propylene oxide (PO), representing a molar ratio of nM/nPO = 3.1, were added rapidly under vigorous stirring (600 rpm). The solution was stirred for 3 min in the ice bath, followed by 7 min of stirring at room temperature. The container was then sealed and stored at 323 to 328 K for 24 h. Afterwards, the gel was kept in an EtOH bath for 7 days and then dried at room temperature. Finally, the dried gel was calcined in ambient air at 1123 K for 12 h using a heating rate of 2 K min−1. For comparison, an equivalent, purely mesoporous sample (denoted as 18Ni/Al2O3-m) was prepared as stated above, but without PEG-900k added in the gelation solution. Furthermore, a standard industrial Ni/Al2O3 catalyst (denoted as SPP2080-IMRC) was used as a reference material.

3.2. Characterization

Inductively coupled plasma optical emission spectrometry (ICP-OES) was conducted using a Optima 8000 instrument (Perkin Elemer Waltham, MA, USA) equipped with a Scott/crossflow sample injection system. Samples were dissolved in a mixture of hydrofluoric (47–51 wt.%, Normatom, VWR, Radnor, PA, USA), nitric (67–90 wt.%, Normatom, VWR, Radnor, PA, USA), and hydrochloric acid (34–37 wt.%, Normatom, VWR, Radnor, PA, USA) in an Multiwave 3000 (Anton Paar, Graz, Austria) microwave prior to analysis.
Powder X-ray diffraction (XRD) patterns were recorded using a G670 Guinier-Geometry diffractometer (Huber SE, Berching, Germany) equipped with an image plate detector. Reflections were recorded between 2θ = 4 to 100° using Cu-Kα radiation (λ = 0.15406 nm), with a step size of 0.005° and an irradiation time of 15 min. TOPAS V6 software by Bruker AXS GmbH, Karlsruhe, Germany, 2018 [56] was used for Rietveld refinements of PXRD data [57,58].
Diffuse reflectance ultraviolet-visible (DRUV/vis) spectroscopy was conducted on a Lambda 650S UV/vis spectrometer (Perkin Elmer Waltham, MA, USA) equipped with a 150 mm Ulbricht sphere. Spectra were recorded in the range between 200 to 800 nm with 1-nm step size and 2-nm slit width.
N2 sorption experiments were conducted on a Sorptomatic 1990 instrument (Porotec, Hofheim am Taunus, Germany). Samples were degassed at 523 K for at least 4 h. The adsorption and desorption isotherms were recorded at 77 K and analyzed using the ASiQwin software (Quantachrome Instruments, Boynton Beach, FL, USA). The total pore volume was determined at p/p0 ≥ 0.95. Specific surface area and pore width distribution were determined by the BET method [59] (adsorption branch) and BJH method [60] (desorption branch), respectively. An experimental error of 5% was expected for specific surface area, specific pore volume, and pore width.
Hg porosimetry analysis was conducted on a Pascal 140 (ThermoScientific, Waltham, MA, USA) for data points from pressures up to 250 kPa and a Pascal 440 (ThermoScientific, Waltham, MA, USA) for data points from pressures between 250 kPa to 400 MPa. The contact angle used was 140° with a surface tension of 0.48 N m−1. The pore width was calculated by the Washburn equation [55]. The meso- and macropore widths with the maximum differential pore volume were referred to as modal mesopore width (wP,meso) and modal macropore width (wP,macro), respectively. An experimental error of 5% was expected for specific pore volumes and pore widths.
He pycnometry was performed on a Pycnomatic ACT EVO instrument (Porotec, Hofheim am Taunus, Germany) at room temperature. For analysis, at least 10 pulses of He with a gas pressure of 2 bar were used. The final skeletal density was calculated by taking the average value of four consecutive measurements. An experimental error of 0.002 g cm−3 was expected for the skeletal density. The total porosity (εtot) of the sample was calculated from Equation (1) using the skeletal density (ρ), determined via He pycnometry, and the total specific pore volume (VP,tot), determined from Hg porosimetry. The meso- and macroporosity were calculated likewise, using the specific mesopore and specific macropore volume in the numerator, respectively.
ε tot = V p ,   tot V p ,   tot + 1 ρ   · 1000
Temperature-programmed reduction (TPR) of catalysts was conducted using the ChemStarPx+ equipment (Quantachrome Instruments, Boynton Beach, FL, USA). Then, 100 mg sample were loaded in a quartz U-tube. First, the sample was heated in a He flow at 423 K for 30 min and subsequently cooled to 323 K. The reduction was performed using 10% H2 in Ar (50 cm3 (STP)/min). The temperature was raised using a ramp rate of 10 K/min to 1173 K and held at this level for 30 min. To remove moisture formed during reduction, effluents were sent through a silica gel water trap before reaching the detector. H2 consumption was measured continuously using a thermal conductivity detector (TCD). Cooling was performed in He flow. Finally, a pulse calibration with H2 was performed at 373 K. The loop volume was 528 μL and Ar was used as carrier flow.

3.3. Catalytic Measurements

Catalytic experiments were performed in an automated lab-scale catalyst testing unit equipped with a tubular quartz glass reactor (inner diameter: 8 mm). The reactor was operated at atmospheric pressure with 100 mg catalyst samples diluted with SiC (carborundum powder, coarse, 46 grit, abcr GmbH, Karlsruhe, Germany) in a ratio of 1:9. The nonpelletized samples were reduced in situ prior to the catalytic experiments in a H2/He mixture. The SPP2080-IMRC sample was reduced at 673 K for 8 h using a mixture of V ˙ H 2 / V ˙ H e = 1, with a total gas flow of 120 cm3 min−1. The Ni/Al2O3-h sample was reduced at either 923 K or 1123 K for 2 h using a mixture of V ˙ H 2 / V ˙ H e = 0.05, with a total gas flow of 120 cm3 min−1. The catalytic activity was determined at temperatures of 573 K, 623 K, and 673 K under steady-state conditions after 7 h (673 K), 10 h (623 K), and 13 h (573 K) on stream, respectivelyhh. The feed gas consisted of a gas mixture of V ˙ H 2 / V ˙ C O 2 / V ˙ H e = 4/1/5 with a total gas flow rate of 200 cm3 min−1, respectively. Then, 24 online gas chromatography (GC) measurements were taken (time about 2 h) under each set of conditions after each temperature change and equilibration time, while the last ten measurements were used for calculation of CO2 conversion and CH4 selectivity. Water was separated from the reactor effluent with a membrane unit and was not analyzed. No other carbon-containing analytes were detected apart from CH4, CO2, and CO, which were, therefore, used for the overall carbon mass balance. The CO2 conversion and CH4 selectivity (both in %) were calculated from the last 10 GC measurements, as defined in Equations (2) and (3).
X CO 2 = c C H 4 , o u t   + c C O , o u t   c C H 4 , o u t   +   c C O , o u t     +   c C O 2 , o u t     · 100 %
S CH 4 ( CO 2 ) = c C H 4 , o u t   c C H 4 , o u t   + c C O , o u t     · 100 %

3.4. Tomography Studies

Samples for ET were prepared by grinding in an agate mortar and suspending in EtOH. A droplet of the suspension was added on a 100 × 400-mesh carbon-coated Cu-TEM grid (Quantifoil Micro Tools GmbH, Großlöbichau, Germany) with a support film thickness of 10–20 nm and dried under atmospheric conditions for 30 min, before adding Au colloidal particles (6.5 nm diameter). ET measurements of the sample were performed using a Fischione 2020 tomography holder (Fischione Instruments, Export, PA, USA), on a Titan 80–300 (FEI Company, Hillsboro, OR, USA) microscope with an acceleration voltage of 300 kV in STEM mode. Tilt series of high-angle annular dark field STEM images were collected for two particles with the Xplore3D software 3.1 (FEI Company, Hillsboro, OR, USA) over a tilt range of −72 to 76° for ET1 and −74 to 78° for ET2, with an increment of 2°. Alignment of the tilt series was performed in IMOD [61], by tracking 20 Au particles as fiducial markers, manually refining their position, enabling refinement of magnification and image rotation, and grouping tilt angles every three tilts without applying a distortion correction. A mean residual alignment error of 0.34 and 0.48 pixels was obtained for ET1 and ET2, respectively. After applying a simultaneous iterative reconstruction technique (SIRT) [62] with 100 iterations to the aligned projection series, the reconstructions were denoised by employing the ImageJ [63] plugins Filters/Median 3D and Enhance Local Contrast (ELAHE). Final reconstructions were obtained by ten iterations of discrete algebraic reconstruction technique (DART) [64] using TomoJ plugin in Fiji [63,65]. The reconstructed tomograms had a final voxel size of 0.94 × 0.94 × 0.94 nm3 for ET1 and 0.64 × 0.64 × 0.64 nm3 for ET2.
The sample for PXCT was first reduced in a micro-capillary setup under the following conditions: He:H2 (15:5 cm3 min−1), heated at 20 K/min then held for 30 min at 1023 K, followed by reaction conditions of He:H2:CO2 (15:4:1 cm3 min−1) for 30 min at 773 K. For PXCT the resulting catalyst was mounted on an Al-pin of the OMNY design [66] using a Strata 400 S FIB/SEM (FEI Company, Hillsboro, OR, USA). A suitable particle was Pt-glued to a micromanipulator and then transferred and Pt-glued on the Al-pins. The mounted particle is shown in the Supplementary Materials Figure S3.
PXCT experiments were carried out at the coherence branch I13-1 of Diamond Light Source (DLS, UK) [67,68] at a photon energy of 9.7 keV and a beam size of about 5 µm on the sample. Far-field diffraction patterns were recorded using a MerlinX detector with a Quad system of 512 × 512 pixels and a pixel size of 55 µm, positioned at a sample-detector distance of 4.13 m. For collection of tomography data, two-dimensional projections of the sample were recorded over a rotational range of 180° in 0.18 ° steps (1000 projections), with a field of view of 40 × 22 µm2 and an exposure time of 30 ms per sampling point. The total acquisition of the tomogram took about 19 h. Ptychographic reconstructions were done on a cropped area of 256 × 256 pixels, corresponding to a pixel size of 37 nm, with the PtyREX package [69] to obtain a 2D projection series. This series was aligned and reconstructed into 3D volumes with a reconstructed voxel size of 38.1 nm and effective isotropic resolution of 78.3 nm using the MATLAB script by Odstrcil et al. [46].
Image processing and analysis of the obtained ET and PXCT tomograms was carried out using Avizo 9.7.0 software (FEI SAS, Thermo Fisher Scientific, Merignac, France). For the DART-reconstructed ET data, the material was first segmented using thresholding. Then, the object was masked using the “Lasso” and “Interpolation” tools to separate pores from background. For the masked object, the pores were labeled by thresholding. The material and pore labels were analyzed by “Label Analysis” to determine the label volumes and surfaces. To analyze individual pores, the pores’ label was separated into individual pores by combination of the watershed, distance map, and H-Maxima analysis as implemented in Avizo’s “Separate Objects” module. An “Opening” module was used afterwards to remove point artifacts of the pore separation. The separated pores were then analyzed by “Label Analysis” to determine characteristics of the individual pores, focusing on the single pore volume and equivalent pore diameter deq, which is defined as follows:
d e q =   6 · V 3 D π 3
with V3D as the voxel-based calculated 3D volume of a single pore.
For the reconstructed PXCT data, first the Pt residues from sample preparation were cropped, as shown in the Supplementary Materials Figure S4. Then a nonlocal-means filter was applied on the grayscale images. This was followed by masking the material and pores from the background using the “Convex Hull” module. Subsequently the masked imaged was separated into pores and material by thresholding. This simple segmentation was possible due to sufficient contrast in electron density between air in the pores and the Ni/Al2O3 material. The obtained material and pore labels were further analyzed, as described for the ET data.
The porosity of the ET and PXCT data εtomo was calculated as follows:
ε t o m o =   V p , t o t V p , t o t +   V s , t o t     · 100 %
with the total volume of the material (Vs,tot) and the total pore volume (Vp,tot) as obtained from label analysis of the unseparated pores. To retrieve the porosity distribution depending on deq, the porosity of an individual pore is defined as εind.
ε i n d =   V 3 D V p , t o t +   V s , t o t     · 100 %
with the individual pore volume V3D of a single pore. The distribution of the individual porosity depending on deq was analyzed regarding its weighted numerical mean pore diameter and by fitting a Gaussian function. The difference of the mean values from the weighted numerical analysis and the fit was assumed as the standard deviation of the mean pore diameter from the numerical analysis.

3.5. Macrokinetics

Detailed information about the calculation of the diffusion properties and macrokinetics are provided in the Supplementary Materials section “Catalyst Particle Model”.

4. Conclusions

A hierarchically porous Ni/Al2O3 catalyst was shown to be active for CO2 methanation, having previously shown increased performance in dry reforming of CH4. The hierarchical catalyst showed a similar performance for CO2 methanation as a standard industrial Ni/Al2O3 reference catalyst, with CO2 conversion of 69% and >90% selectivity for CH4 at 623 K. However, the catalyst needed to be pretreated at a high temperature of 1123 K to reduce Ni2+ to Ni0. This is due to the incorporation of Ni into spinel-type structures of Al2O3 and NiAl2O4. A similar behavior is to be expected for other Ni/Al2O3 catalysts prepared by co-gelation. Therefore, co-gelation is likely not a suitable preparation method for applications at moderate temperatures (523–773 K) such as CO2 methanation, and impregnation methods should be preferred. The hierarchical Ni/Al2O3 catalyst exhibited a volume-based total porosity of 78%, mesoporosity of 23.0%, macroporosity of 55.0%, and mean pore width of about 1 µm for the macropores and 8.3 nm to 10.3 nm for the mesopores based on Hg porosimetry and He pycnometry. Using ET and PXCT for a multiscale analysis of the pore system, we retrieved similar porosity values as from Hg porosimetry. However, the mean pore diameters of the meso- and macropores obtained from the imaging methods were more than twice the size compared to Hg porosimetry. We attributed this to different definitions of the pore width and diameter and the technical limitations of Hg porosimetry. Additionally, we proved and can quantify the hierarchical pore structure of the catalyst and the thoroughly connected macropores by tomography, which is not practical using conventional porosimetry methods. A simulation of diffusion properties from experimental porosity data together with macrokinetic properties revealed potential mass transport limitations. The introduction of macropores and the hierarchical pore structure are suggested to strongly improve the mass transport and can, thus, lead to a higher effectiveness of the catalyst in comparison to a purely mesoporous catalyst. This study demonstrates the great benefit of a combined synthetic, analytic, and computational approach for quantifiable characterization and rational design of porous supported methanation catalysts. The chosen system is ideal for future extensive kinetic studies of the influence of mass transport phenomena, to confirm the results obtained from simulations.

Supplementary Materials

The following are available online at https://www.mdpi.com/2073-4344/10/12/1471/s1. Figure S1: Selected slice of the SIRT-reconstructed ET1. Figure S2: Selected slice of the SIRT-reconstructed ET2. Figure S3: SEM images of the Ni/Al2O3-h sample mounted on the Al-pin for the PXCT experiment. Figure S4: Uncropped PXCT of the Ni/Al2O3-h sample and cropped tomogram. Figure S5: Selected region of the PXCT tomogram of the Ni/Al2O3-h sample and resulting input for the FSC analysis. Figure S6: FSC analysis of the NiAl2O3-h PXCT. Figure S7: Frequency distribution of different pore diameters obtained from the label analysis of the separated pores from the ET and PXCT experiments of the Ni/Al2O3-h catalyst. Table S1: Structural parameters obtained from Rietveld analysis for the refinements of Ni/Al2O3-h.

Author Contributions

Conceptualization, S.W., K.L.A., R.T.Z., K.S., R.G., and T.L.S.; methodology, S.W., K.L.A., R.T.Z., X.H., J.B., D.B., S.C., J.T., C.K., R.G., K.S., and T.L.S.; validation, S.W., K.L.A., R.T.Z., X.H., J.B., L.K.R.-S., D.B., S.C., D.P., J.T., C.K., R.G., K.S., and T.L.S.; formal analysis, S.W., K.L.A., R.T.Z., X.H., and D.B.; investigation, S.W., K.L.A., R.T.Z., X.H., L.K.R.-S., D.B., S.C., and T.L.S.; data curation, S.W., K.L.A., R.T.Z., X.H., J.B., L.K.R.-S., D.B., S.C., D.P., J.T., C.K., R.G., K.S., and T.L.S.; writing—original draft preparation, S.W., K.L.A., and R.T.Z.; writing—review and editing, S.W., K.L.A., R.T.Z., X.H., J.B., L.K.R.-S., D.B., S.C., D.P., J.T., C.K., R.G., K.S., and T.L.S.; visualization, S.W., K.L.A., and R.T.Z.; supervision, D.P., J.T., C.K., R.G., K.S., and T.L.S.; project administration, S.W., K.L.A., R.T.Z., R.G., K.S., and T.L.S.; funding acquisition, R.G., K.S., and T.L.S. All authors have read and agreed to the published version of the manuscript.

Funding

Gefördert durch die Deutsche Forschungsgemeinschaft (DFG)—406914011, funded by the Deutsche Forschungsgemeinschaft (DFG, German Research Foundation)—406914011.

Acknowledgments

This work was partly carried out with the support of the Karlsruhe Nano Micro Facility (KNMF), a Helmholtz Research Infrastructure at Karlsruhe Institute of Technology (KIT), which provided access to FIB and TEM instruments via proposal 2019-022-026980. Thanks to Di Wang (Institute of Nanotechnology, KIT) for support during TEM experiments. This work was carried out with the support of Diamond Light Source, instrument I13-1 (proposal MG24079-1). Heike Rudzik, Institute of Chemical Technology, and Sebastian Geisler, Institute of Mineralogy, Crystallography and Material Science, both Leipzig University, are acknowledged for ICP-OES and XRD measurements, respectively. Thanks are also due to Tanya Wolff, Max-Planck Institute Magdeburg for the assistance and support with H2-TPR studies and to Markus Ikert, Max Planck Institute Magdeburg, for assistance and support with the catalytic experiments. We acknowledge discussion of the results with Jan-Dierk Grunwaldt in the frame of the SPP2080 project by the DFG. The authors Ronny T. Zimmermann and Jens Bremer are also associated with the International Max Planck Research School (IMPRS) for Advanced Methods in Process and Systems Engineering, Magdeburg, Germany. The author Ken Luca Abel is also associated with the graduate school “Leipzig School of Natural Sciences—Building with Molecules and Nano-objects” (BuildMoNa).

Conflicts of Interest

The authors declare no conflict of interest.

References

  1. Rönsch, S.; Schneider, J.; Matthischke, S.; Schlüter, M.; Götz, M.; Lefebvre, J.; Prabhakaran, P.; Bajohr, S. Review on methanation—From fundamentals to current projects. Fuel 2016, 166, 276–296. [Google Scholar] [CrossRef]
  2. Frontera, P.; Macario, A.; Ferraro, M.; Antonucci, P. Supported Catalysts for CO2 Methanation. Catalysts 2017, 7, 59. [Google Scholar] [CrossRef]
  3. Gao, J.; Liu, Q.; Gu, F.; Liu, B.; Zhong, Z.; Su, F. Recent advances in methanation catalysts for the production of synthetic natural gas. RSC Adv. 2015, 5, 22759–22776. [Google Scholar] [CrossRef]
  4. Schlereth, D.; Hinrichsen, O. A fixed-bed reactor modeling study on the methanation of CO2. Chem. Eng. Res. Des. 2014, 92, 702–712. [Google Scholar] [CrossRef]
  5. Ghaib, K.; Ben-Fares, F.-Z. Power-to-Methane. Renew. Sustain. Energy Rev. 2018, 81, 433–446. [Google Scholar] [CrossRef]
  6. Zangouei, M.; Moghaddam, A.Z.; Arasteh, M. The influence of nickel loading on reducibility of NiO/Al2O3 catalysts synthesized by sol-gel method. Chem. Eng. Res. Bull. 2010, 14. [Google Scholar] [CrossRef] [Green Version]
  7. Li, D.; Li, Y.; Liu, X.; Guo, Y.; Pao, C.-W.; Chen, J.-L.; Hu, Y.; Wang, Y. NiAl2O4 Spinel Supported Pt Catalyst: High Performance and Origin in Aqueous-Phase Reforming of Methanol. ACS Catal. 2019, 9, 9671–9682. [Google Scholar] [CrossRef]
  8. Srisawad, N.; Chaitree, W.; Mekasuwandumrong, O.; Shotipruk, A.; Jongsomjit, B.; Panpranot, J. CO2 hydrogenation over Co/Al2O3 catalysts prepared via a solid-state reaction of fine gibbsite and cobalt precursors. React. Kinet. Mech. Cat. 2012, 107, 179–188. [Google Scholar] [CrossRef]
  9. Kim, Y.; Kwon, S.; Song, Y.; Na, K. Catalytic CO2 hydrogenation using mesoporous bimetallic spinel oxides as active heterogeneous base catalysts with long lifetime. J. CO2 Util. 2020, 36, 145–152. [Google Scholar] [CrossRef]
  10. Kiš, E.; Marinkovic-Neducin, R.; Lomic, G.; Boskovic, G.; Obadovic, D.Z.; Kiurski, J.; Putanov, P. Structural and textural properties of the NiO-AI2O3 catalyst. Polyhedron 1998, 17, 27–34. [Google Scholar]
  11. Sengupta, S.; Ray, K.; Deo, G. Effects of modifying Ni/Al2O3 catalyst with cobalt on the reforming of CH4 with CO2 and cracking of CH4 reactions. Int. J. Hydrogen Energy 2014, 39, 11462–11472. [Google Scholar] [CrossRef]
  12. Daroughegi, R.; Meshkani, F.; Rezaei, M. Enhanced activity of CO2 methanation over mesoporous nanocrystalline Ni–Al2O3 catalysts prepared by ultrasound-assisted co-precipitation method. Int. J. Hydrog. Energy 2017, 42, 15115–15125. [Google Scholar] [CrossRef]
  13. Moghaddam, S.V.; Rezaei, M.; Meshkani, F. Surfactant-Free Sol–Gel Synthesis Method for the Preparation of Mesoporous High Surface Area NiO–Al2O3 Nanopowder and Its Application in Catalytic CO2 Methanation. Energy Technol. 2020, 8, 1900778. [Google Scholar] [CrossRef]
  14. Salhi, N.; Boulahouache, A.; Petit, C.; Kiennemann, A.; Rabia, C. Steam reforming of methane to syngas over NiAl2O4 spinel catalysts. Int. J. Hydrog. Energy 2011, 36, 11433–11439. [Google Scholar] [CrossRef]
  15. Herwig, J.; Titus, J.; Kullmann, J.; Wilde, N.; Hahn, T.; Gläser, R.; Enke, D. Hierarchically Structured Porous Spinels via an Epoxide-Mediated Sol–Gel Process Accompanied by Polymerization-Induced Phase Separation. ACS Omega 2018, 3, 1201–1212. [Google Scholar] [CrossRef]
  16. Rahmani, S.; Rezaei, M.; Meshkani, F. Preparation of highly active nickel catalysts supported on mesoporous nanocrystalline γ-Al2O3 for CO2 methanation. J. Ind. Eng. Chem. 2014, 20, 1346–1352. [Google Scholar] [CrossRef]
  17. Lin, J.; Ma, C.; Luo, J.; Kong, X.; Xu, Y.; Ma, G.; Wang, J.; Zhang, C.; Li, Z.; Ding, M. Preparation of Ni based mesoporous Al2O3 catalyst with enhanced CO2 methanation performance. RSC Adv. 2019, 9, 8684–8694. [Google Scholar] [CrossRef] [Green Version]
  18. Tokudome, Y.; Fujita, K.; Nakanishi, K.; Miura, K.; Hirao, K. Synthesis of Monolithic Al2O3 with Well-Defined Macropores and Mesostructured Skeletons via the Sol−Gel Process Accompanied by Phase Separation. Chem. Mater. 2007, 19, 3393–3398. [Google Scholar] [CrossRef]
  19. Macedo, H.P.; Medeiros, R.L.; Ilsemann, J.; Melo, D.M.; Rezwan, K.; Wilhelm, M. Nickel-containing hybrid ceramics derived from polysiloxanes with hierarchical porosity for CO2 methanation. Microporous Mesoporous Mater. 2019, 278, 156–166. [Google Scholar] [CrossRef]
  20. Xiong, Q.; Baychev, T.G.; Jivkov, A.P. Review of pore network modelling of porous media: Experimental characterisations, network constructions and applications to reactive transport. J. Contam. Hydol. 2016, 192, 101–117. [Google Scholar] [CrossRef]
  21. Friedrich, H.; de Jongh, P.E.; Verkleij, A.J.; de Jong, K.P. Electron tomography for heterogeneous catalysts and related nanostructured materials. Chem. Rev. 2009, 109, 1613–1629. [Google Scholar] [CrossRef] [PubMed]
  22. Tariq, F.; Haswell, R.; Lee, P.D.; McComb, D.W. Characterization of hierarchical pore structures in ceramics using multiscale tomography. Acta Mater. 2011, 59, 2109–2120. [Google Scholar] [CrossRef]
  23. Andersson, L.; Jones, A.C.; Knackstedt, M.A.; Bergström, L. Three-dimensional structure analysis by X-ray micro-computed tomography of macroporous alumina templated with expandable microspheres. J. Eur. Ceram. 2010, 30, 2547–2554. [Google Scholar] [CrossRef]
  24. Shanti, N.O.; Chan, V.W.; Stock, S.R.; de Carlo, F.; Thornton, K.; Faber, K.T. X-ray micro-computed tomography and tortuosity calculations of percolating pore networks. Acta Mater. 2014, 71, 126–135. [Google Scholar] [CrossRef]
  25. Stoeckel, D.; Kübel, C.; Hormann, K.; Höltzel, A.; Smarsly, B.M.; Tallarek, U. Morphological analysis of disordered macroporous-mesoporous solids based on physical reconstruction by nanoscale tomography. Langmuir 2014, 30, 9022–9027. [Google Scholar] [CrossRef] [PubMed]
  26. Reich, S.-J.; Svidrytski, A.; Höltzel, A.; Florek, J.; Kleitz, F.; Wang, W.; Kübel, C.; Hlushkou, D.; Tallarek, U. Hindered Diffusion in Ordered Mesoporous Silicas: Insights from Pore-Scale Simulations in Physical Reconstructions of SBA-15 and KIT-6 Silica. J. Phys. Chem. C 2018, 122, 12350–12361. [Google Scholar] [CrossRef]
  27. Reising, A.E.; Schlabach, S.; Baranau, V.; Stoeckel, D.; Tallarek, U. Analysis of packing microstructure and wall effects in a narrow-bore ultrahigh pressure liquid chromatography column using focused ion-beam scanning electron microscopy. J. Chromatogr. A 2017, 1513, 172–182. [Google Scholar] [CrossRef]
  28. Becher, J.; Sheppard, T.L.; Fam, Y.; Baier, S.; Wang, W.; Di Wang Kulkarni, S.; Keller, T.F.; Lyubomirskiy, M.; Brueckner, D.; Kahnt, M.; et al. Mapping the Pore Architecture of Structured Catalyst Monoliths from Nanometer to Centimeter Scale with Electron and X-ray Tomographies. J. Phys. Chem. C 2019, 123, 25197–25208. [Google Scholar] [CrossRef]
  29. Dierolf, M.; Menzel, A.; Thibault, P.; Schneider, P.; Kewish, C.M.; Wepf, R.; Bunk, O.; Pfeiffer, F. Ptychographic X-ray computed tomography at the nanoscale. Nature 2010, 467, 436–439. [Google Scholar] [CrossRef]
  30. Holler, M.; Diaz, A.; Guizar-Sicairos, M.; Karvinen, P.; Färm, E.; Härkönen, E.; Ritala, M.; Menzel, A.; Raabe, J.; Bunk, O. X-ray ptychographic computed tomography at 16 nm isotropic 3D resolution. Sci. Rep. 2014, 4, 3857. [Google Scholar] [CrossRef] [Green Version]
  31. Novák, V.; Dudák, M.; Kočí, P.; Marek, M. Understanding the gas transport in porous catalyst layers by using digital reconstruction techniques. Curr. Opin. Chem. Eng. 2015, 9, 16–26. [Google Scholar] [CrossRef]
  32. Wefers, K.M.; Misra, C. Oxides and Hydroxides of Aluminum, 19th ed.; Alcoa Laboratories: Pittsburgh, PA, USA, 1987. [Google Scholar]
  33. Zhou, R.S.; Snyder, R.L. Structures and transformation mechanisms of the η, γ and θ transition aluminas. Acta Crystallogr. B Struct. Sci. Cryst. 1991, 47, 617–630. [Google Scholar] [CrossRef]
  34. Smith, S.J.; Amin, S.; Woodfield, B.F.; Boerio-Goates, J.; Campbell, B.J. Phase progression of γ-Al2O3 nanoparticles synthesized in a solvent-deficient environment. Inorg. Chem. 2013, 52, 4411–4423. [Google Scholar] [CrossRef] [PubMed]
  35. Levin, I.; Brandon, D. Metastable Alumina Polymorphs: Crystal Structures and Transition Sequences. J. Am. Ceram. Soc. 1998, 81, 1995–2012. [Google Scholar] [CrossRef]
  36. O’Neill, H.S.C.; Dollase, W.A.; Ross, C.R., II. Temperature dependence of the cation distribution in nickel aluminate (NiAl2O4) spinel: A powder XRD study. Phys. Chem. Minerals 1991, 18, 302–319. [Google Scholar] [CrossRef]
  37. López-Fonseca, R.; Jiménez-González, C.; de Rivas, B.; Gutiérrez-Ortiz, J.I. Partial oxidation of methane to syngas on bulk NiAl2O4 catalyst. Comparison with alumina supported nickel, platinum and rhodium catalysts. Appl. Catal. A 2012, 437–438, 53–62. [Google Scholar] [CrossRef]
  38. Kim, P.; Kim, Y.; Kim, H.; Song, I.K.; Yi, J. Synthesis and characterization of mesoporous alumina with nickel incorporated for use in the partial oxidation of methane into synthesis gas. Appl. Catal. A 2004, 272, 157–166. [Google Scholar] [CrossRef]
  39. Scheffer, B.; Heijeinga, J.J.; Moulijn, J.A. An electron spectroscopy and x-ray diffraction study of nickel oxide/alumina and nickel-oxide-tungsten trioxide/alumina catalysts. J. Phys. Chem. 1987, 91, 4752–4759. [Google Scholar] [CrossRef]
  40. Li, C.; Chen, Y.-W. Temperature-programmed-reduction studies of nickel oxide/alumina catalysts: Effects of the preparation method. Thermochim. Acta 1995, 256, 457–465. [Google Scholar] [CrossRef]
  41. Xu, X.; Li, L.; Yu, F.; Peng, H.; Fang, X.; Wang, X. Mesoporous high surface area NiO synthesized with soft templates: Remarkable for catalytic CH4 deep oxidation. Mol. Catal. 2017, 441, 81–91. [Google Scholar] [CrossRef]
  42. Titus, J.; Kullmann, J.; Hill, J.; Enke, D.; Wilde, N.; Gläser, R. Preprints of the DGMK-Conference „Synthesis Gas Chemistry“; Deutsche Wissenschaftliche Gesellschaft für Erdöl, Erdgas und Kohle e.V.: Hamburg, Germany, 2015; p. 215. ISBN 978-3-941721-56-2. [Google Scholar]
  43. Miao, B.; Ma, S.S.K.; Wang, X.; Su, H.; Chan, S.H. Catalysis mechanisms of CO2 and CO methanation. Catal. Sci. Technol. 2016, 6, 4048–4058. [Google Scholar] [CrossRef]
  44. Winter, L.R.; Chen, R.; Chen, X.; Chang, K.; Liu, Z.; Senanayake, S.D.; Ebrahim, A.M.; Chen, J.G. Elucidating the roles of metallic Ni and oxygen vacancies in CO2 hydrogenation over Ni/CeO2 using isotope exchange and in situ measurements. Appl. Catal. B 2019, 245, 360–366. [Google Scholar] [CrossRef]
  45. Martínez, J.; Hernández, E.; Alfaro, S.; López Medina, R.; Valverde Aguilar, G.; Albiter, E.; Valenzuela, M. High Selectivity and Stability of Nickel Catalysts for CO2 Methanation. Catalysts 2019, 9, 24. [Google Scholar] [CrossRef] [Green Version]
  46. Odstrčil, M.; Holler, M.; Raabe, J.; Guizar-Sicairos, M. Alignment methods for nanotomography with deep subpixel accuracy. Opt. Express 2019, 27, 36637–36652. [Google Scholar] [CrossRef] [PubMed] [Green Version]
  47. Fam, Y.; Sheppard, T.L.; Diaz, A.; Scherer, T.; Holler, M.; Wang, W.; Di Wang Brenner, P.; Wittstock, A.; Grunwaldt, J.-D. Correlative Multiscale 3D Imaging of a Hierarchical Nanoporous Gold Catalyst by Electron, Ion and X-ray Nanotomography. ChemCatChem 2018, 10, 2858–2867. [Google Scholar] [CrossRef] [Green Version]
  48. Thommes, M.; Kaneko, K.; Neimark, A.V.; Olivier, J.P.; Rodriguez-Reinoso, F.; Rouquerol, J.; Sing, K.S. Physisorption of gases, with special reference to the evaluation of surface area and pore size distribution (IUPAC Technical Report). Pure Appl. Chem. 2015, 87, 1051–1069. [Google Scholar] [CrossRef] [Green Version]
  49. Ma, Y.; Liu, J.; Chu, M.; Yue, J.; Cui, Y.; Xu, G. Cooperation Between Active Metal and Basic Support in Ni-Based Catalyst for Low-Temperature CO2 Methanation. Catal. Lett. 2020, 150, 1418–1426. [Google Scholar] [CrossRef]
  50. Conner, W.C.; Christensen, S.; Topsøe, H.; Ferrero, M.; Pullen, A. The Estimation of Pore-network Dimensions and Structure: Analysis of Sorption and Comparison with Porosimetry. Stud. Surf. Sci. Catal. 1994, 87, 151–163. [Google Scholar] [CrossRef]
  51. Rijfkogel, L.S.; Ghanbarian, B.; Hu, Q.; Liu, H.-H. Clarifying pore diameter, pore width, and their relationship through pressure measurements: A critical study. Mar. Pet. Geol. 2019, 107, 142–148. [Google Scholar] [CrossRef]
  52. Diamond, S. Mercury porosimetry: An inappropriate method for the measurement of pore size distributions in cement-based materials. Cem. Concr. Res. 2000, 30, 1517–1525. [Google Scholar] [CrossRef]
  53. Alford, N.M.; Rahman, A.A. An assesment of porosity and pore sizes in hardened cement pastes. J. Mater. Sci. 1981, 16, 3105–3114. [Google Scholar] [CrossRef]
  54. Seong, H.; Choi, S.; Matusik, K.E.; Kastengren, A.L.; Powell, C.F. 3D pore analysis of gasoline particulate filters using X-ray tomography: Impact of coating and ash loading. J. Mater. Sci. 2019, 54, 6053–6065. [Google Scholar] [CrossRef]
  55. Washburn, E.W. The Dynamics of Capillary Flow. Phys. Rev. 1921, 17, 273–283. [Google Scholar] [CrossRef]
  56. Coelho, A.A.; Bruker, A.X.S. TOPAS and TOPAS-Academic an optimization program integrating computer algebra and crystallographic objects written in C++. J. Appl. Cryst. 2018, 51, 210–218. [Google Scholar] [CrossRef] [Green Version]
  57. Rietveld, H.M. Line profiles of neutron powder-diffraction peaks for structure refinement. Acta Crystallogr. 1967, 22, 151–152. [Google Scholar] [CrossRef]
  58. Rietveld, H.M. A profile refinement method for nuclear and magnetic structures. J. Appl. Cryst. 1969, 2, 65–71. [Google Scholar] [CrossRef]
  59. Brunauer, S.; Emmett, P.H.; Teller, E. Adsorption in Gases in Multimolecular Layers. J. Am. Chem. Soc. 1938, 60, 309–319. [Google Scholar] [CrossRef]
  60. Barrett, E.P.; Joyner, L.G.; Halenda, P.P. The Determination of Pore Volume and Area Distributions in Porous Substances. J. Am. Chem. Soc. 1951, 73, 373–380. [Google Scholar] [CrossRef]
  61. Kremer, J.R.; Mastronarde, D.N.; McIntosh, J.R. Computer visualization of three-dimensional image data using IMOD. J. Struct. Biol. 1996, 116, 71–76. [Google Scholar] [CrossRef] [Green Version]
  62. Gilbert, P. Iterative Methods fo the Three-dimensional Reconstruction of an Object from Projections. J. Theor. Biol. 1972, 36, 105–107. [Google Scholar] [CrossRef]
  63. Schindelin, J.; Arganda-Carreras, I.; Frise, E.; Kaynig, V.; Longair, M.; Pietzsch, T.; Preibisch, S.; Rueden, C.; Saalfeld, S.; Schmid, B.; et al. Fiji: An open-source platform for biological-image analysis. Nat. Methods 2012, 9, 676–682. [Google Scholar] [CrossRef] [PubMed] [Green Version]
  64. Batenburg, K.J.; Bals, S.; Sijbers, J.; Kübel, C.; Midgley, P.A.; Hernandez, J.C.; Kaiser, U.; Encina, E.R.; Coronado, E.A.; van Tendeloo, G. 3D imaging of nanomaterials by discrete tomography. Ultramicroscopy 2009, 109, 730–740. [Google Scholar] [CrossRef] [PubMed]
  65. Messaoudii, C.; Boudier, T.; Sanchez Sorzano, C.O.; Marco, S. TomoJ: Tomography software for three-dimensional reconstruction in transmission electron microscopy. BMC Bioinform. 2007, 8, 288. [Google Scholar] [CrossRef] [PubMed] [Green Version]
  66. Holler, M.; Raabe, J.; Wepf, R.; Shahmoradian, S.H.; Diaz, A.; Sarafimov, B.; Lachat, T.; Walther, H.; Vitins, M. OMNY PIN-A versatile sample holder for tomographic measurements at room and cryogenic temperatures. Rev. Sci. Instrum. 2017, 88, 113701. [Google Scholar] [CrossRef] [PubMed]
  67. Rau, C.; Wagner, U.; Pešić, Z. The Imaging and Coherence Beamline I13 at Diamond. AIP Conf. Proc. 2011, 132, 132–135. [Google Scholar] [CrossRef]
  68. Batey, D.; Cipiccia, S.; Shi, X.; Williams, S.; Wanelik, K.; Wilson, A.; Pérez-Tamarit, S.; Cimavilla, P.; Ródriguez-Pérez, M.A.; Rau, C. Coherence Branch at I13, DLS: The Multiscale, Multimodal, Ptycho-tomographic End Station. Microsc. Microanal. 2018, 24, 42–43. [Google Scholar] [CrossRef] [Green Version]
  69. Batey, D. Ptychographic Imaging of Mixed States. Ph.D. Thesis, University of Sheffield, Sheffield, UK, 2014. [Google Scholar]
Figure 1. Rietveld refinements of powder X-ray diffraction (PXRD) of Ni/Al2O3-h: (a) fixed Al occupancies of the Al2O3 phase according the literature model; (b) refined Al occupancies of the Al2O3 phase; (c) representation of the Al2O3 structure based on the Rietveld refinement with refined Al occupancies for Ni/Al2O3-h. O (red), octahedral Al1 (blue), tetrahedral Al2 (orange); Al3 position is not shown for enhanced visibility of the octahedral and tetrahedral sites.
Catalysts 10 01471 g001
Figure 2. Diffuse reflectance ultraviolet-visible (DRUV/vis) spectra of a physical mixture (PM) of NiO and γ-Al2O3 (PM, in black), H2-temperature programmed reduction (TPR)-reduced Ni/Al2O3-h (TPR-red., in red) and Ni/Al2O3-h after calcination (in blue).
Catalysts 10 01471 g002
Figure 3. (a) H2-TPR curves of Ni/Al2O3-h and a physical mixture of NiO and Al2O3Ni = 16.3 wt.%); (b) photographs of Ni/Al2O3-h prior to (blue) and after reduction by H2-TPR (black).
Catalysts 10 01471 g003
Figure 4. CO2 conversion (a) and selectivity for CH4 (b) in the methanation of CO2 over the reference catalyst SPP2080-IMRC and Ni/Al2O3-h, reduced at 923 K or 1123 K after 7–13 h on stream at different reaction temperatures (TR). The volume ratio of reactive gases was V ˙ H 2 / V ˙ C O 2 = 4/1.
Catalysts 10 01471 g004
Figure 5. (a) A 3D volume rendering of the PXCT of a Ni/Al2O3-h particle along the x-axis together with a slice thorough the xz-plane and the same slice with separated pores. (b) ET1 and (c) ET2: 3D volume rendering of the DART-reconstructed tomograms along the x-axis together with a slice of the xy-plane, and the same slice with individually labelled pores. The material label is denoted in blue or white, the pore label is shown in orange, and the individually separated pores are illustrated in 8-bit color coding. The position of the slices within the volume is indicated by the green arrow. The different length scales of PXCT and ET are illustrated by the black box in (a).
Catalysts 10 01471 g005
Figure 6. Sum of individual porosities ε (grey) depending on deq as obtained from image analysis of the three different tomograms (a) ET1, (b) ET2, and (c) PXCT of the Ni/Al2O3-h catalysts together with the normalized cumulative distribution function of the porosity εc,n (orange) and a fitted Gaussian distribution function (blue).
Catalysts 10 01471 g006
Figure 7. N2 sorption isotherms (a) and Barrett–Joyner–Halenda (BJH) pore width distribution (b) of Ni/Al2O3-h and Ni/Al2O3-m.
Catalysts 10 01471 g007
Figure 8. Pore width distribution (solid lines) and cumulative specific pore volume (dashed lines) of Ni/Al2O3-h and Ni/Al2O3-m, determined by Hg porosimetry.
Catalysts 10 01471 g008
Figure 9. Arrhenius plots of effective and intrinsic reaction rates as well as catalyst effectiveness factor η based on pore network properties given in Table 3 for a catalyst pellet of 2.5 mm diameter. (a) Ni/Al2O3-h (tomography), (b) Ni/Al2O3-h (Hg porosimetry), and (c) Ni/Al2O3-m (Hg porosimetry). All plots were calculated at psurf,CO2 = 2 bar, psurf,H2 = 8 bar, and psurf,H2O = psurf,CH4 = 0 bar.
Catalysts 10 01471 g009
Table 1. Results obtained from the quantitative pore analysis based on image analysis of the Ni/Al2O3-h catalyst. Rounded total material volume Vs,tot, total pore volume Vp,tot, porosity of the measured tomograms εtomo, weighted mean pore diameter deq,w, and fitted mean pore diameter deq,f for the ET1, ET2, and PXCT.
TomogramET1ET2PXCT
Vs,tot/µm328,898.3 × 10−622,374.8 × 10−61952.39
Vp,tot/µm325,402.1 × 10−616,795.3 × 10−61684.09
εtomo/%46.842.946.3
deq,w/nm37.4 ± 1.229.2 ± 1.32545 ± 23
deq,f/nm36.227.92522
Table 2. Specific surface area (ABET) and pore volume (VP) from N2 sorption, specific pore mesopore volume (VP,meso), specific total pore volume (VP,tot), mesopore width (wP,meso), macropore width (wP,macro), mesoporosity (εm) and macroporosity (εM), skeletal density (ρ), and total porosity (εtot) from He pycnometry, and mean mesopore diameter (deq,meso), mean macropore diameter (deq,macro), and porosity information from tomography analysis for calcined Ni/Al2O3-h and Ni/Al2O3-m.
Ni/Al2O3-hNi/Al2O3-m
N2 sorption
ABET/m2 g−199108
VP/cm3 g−10.310.37
wP/nm8.310.3
Hg porosimetry
VP,meso/cm3 g−10.260.33
VP,tot/cm3 g−10.880.35
wP,meso/nm10.311.2
wP,macro/nm1012-
εm/%23.055.8
εM/%55.03.4
He pycnometry
ρ/g cm−34.0284.144
εtot/%78.059.1
Tomography
deq,meso/nm33.3 ± 4.1-
deq,macro/nm2545 ± 23-
εm/%24.1-
εM/%46.3-
εtot/%70.4-
Table 3. Pore network data based on tomography and Hg porosimetry measurements as well as calculated effective diffusion coefficients of CO2 of a stoichiometric mixture ( x H 2 / x CO 2 = 4 : 1 ) at 600 K and 10 bar.
SampleData Set ε M / % d M / n m ε m / % d m / n m D CO 2 , e f f / m 2 s
Ni/Al2O3-hTomography46.3254524.133.35.89∙10−6
Ni/Al2O3-hHg porosimetry55.0101223.010.306.67∙10−6
Ni/Al2O3-mHg porosimetryn.a. an.a.55.811.25.74∙10−7
a not applicable.
Publisher’s Note: MDPI stays neutral with regard to jurisdictional claims in published maps and institutional affiliations.

