1. Introduction
The increase in the world population has caused a progressive decline of fossil fuels. This fact has led to the quest of alternative sources, which can provide both energy and chemicals. A large variety of energy sources are now available to be used synergistically and responsibly to supply the world’s population, although most of them are only useful for obtaining energy. Among them, biomass is the only source that allows the production of both energy and chemicals, in such a way that it is the unique source that could widely replace conventional fossil feedstocks [
1].
Biomass is worldwide distributed, which together its high availability, could favor the energy self-sufficiency of countries, but it must be sustainable, without competing with the food supply. In this sense, lignocellulosic biomass is attracting the interest of the scientific community, as it can be obtained from low-cost agricultural wastes [
2,
3]. Lignocellulose is mainly formed by cellulose (40–50%), hemicellulose (20–35%), and lignin (15–25%), which can be easily fractionated through physical and chemical treatments [
4,
5]. In the case of hemicellulose, the hemicellulose fibers embedded in the cell walls of plants are extracted by using alkaline hydroperoxide [
6,
7], obtaining xylans as the main products [
4,
5,
6,
7]. Then, xylans can be hydrolyzed in their respective monomers by a mild acid treatment, giving rise mainly to xylose [
8], which in turn, can be dehydrated through acid catalysis to obtain furfural (FUR) [
8].
After bioethanol, FUR is the second most produced chemical in the sugar platform [
8]. The high interest of this building block molecule is ascribed to its chemical structure (an aldehyde group linked to a furan ring with α-β unsaturations), which confers it high reactivity for undergoing a large spectrum of chemical reactions [
8]. Thus, it has been reported that FUR can react through hydrogenation, decarbonylation, alkylation, condensation, oxidation, or opening-ring reactions to form many valuable products [
9,
10]. Focusing on the oxidation reactions, it is well known that FUR can suffer a Cannizzaro process giving rise to furfuryl alcohol (FOL) and furoic acid (FURAc), through homogeneous catalysis with NaOH; however, the yield of this reaction is only limited to 50% [
11,
12]. The direct oxidation of FUR to furoic acid requires strong oxidants such as chlorite, permanganate, or chromate species [
13,
14], in such a way the reaction medium is highly toxic to health and the environment. Taking into account the environmental awareness of recent decades, the scientific community is developing more environmentally friendly catalysts. In this sense, the use of noble metals (Au, Pt, Pd, Ru) has emerged as a sustainable alternative for FUR oxidation processes [
12]. These catalysts are prone to fast deactivation due to the strong interaction between the furoate intermediates and the active phase, although this deactivation can be minimized by the addition of a base into the reaction medium [
15].
The reaction medium plays a key role in determining the selectivity pattern. Thus, the oxidation of FUR leads to furoic acid in aqueous medium [
12], whereas the use of short-chain alcohols, such as methanol, favors the oxidative esterification, obtaining methyl furoate as product [
12], when Au-based catalysts are used [
16,
17,
18,
19]. The use of longer-chain alcohols with H in the C
α position causes a competitive reaction between the oxidative esterification and oxidative condensation [
20,
21,
22], although oxidative condensation is mainly favored [
12]. The influence of several experimental parameters has been evaluated, and it has been found that ethanol and propanol are the most reactive to carry out the oxidative condensation process [
23]. In the same way, the strength of the base also exerts an important role, since strong bases also favor oxidative condensation [
21], although the basicity must be modulated because side reactions may appear due to uncontrolled condensation, thus decreasing the yield [
17]. In the oxidative condensation of FUR, the most widely used catalysts have been based on Au [
20,
21,
22,
23], although other noble metals, such as Pt [
24,
25] or Pd [
26] dispersed on different metal oxides have also been studied. However, recently, much interest is being paid to the development of non-noble and abundant-metal-based catalysts, since noble metals are quite expensive and scarce. In this sense, Cu [
27] and Fe complexes [
28], as well as CuO/CeO
2 [
29] and Co
xO
y-based catalysts [
23], have shown activity in the oxidative condensation of FUR, although more severe conditions are needed. This catalytic process gives rise to furan-2-acrolein (F2A), where the increase in the hydrocarbon chain is an appropriate strategy to diminish the volatility of liquid fuels, which can be obtained after subsequent hydrogenation of F2A [
30,
31]. In addition, F2A is used as an intermediate in the synthesis of drugs and in the fragrance industry due to its pleasant smell [
32].
Taking into account that oxidative condensation of FUR using Pd-based catalysts has hardly been studied in the literature, the aim of the present work was to evaluate the catalytic activity of Pd-based catalysts in oxidative condensation. Moreover, it is also intended to evaluate the influence of the support on the catalytic performance, taking into account the amount of acid and basic centers, as well as their strength. Furthermore, the effect of Pd loading and the reaction time will also be studied.
2. Characterization of Catalysts
Before evaluating the catalytic behavior of Pd-based catalysts in FUR oxidation reactions, these samples were characterized by different physico-chemical techniques in order to get insights into structural, textural and acidic properties.
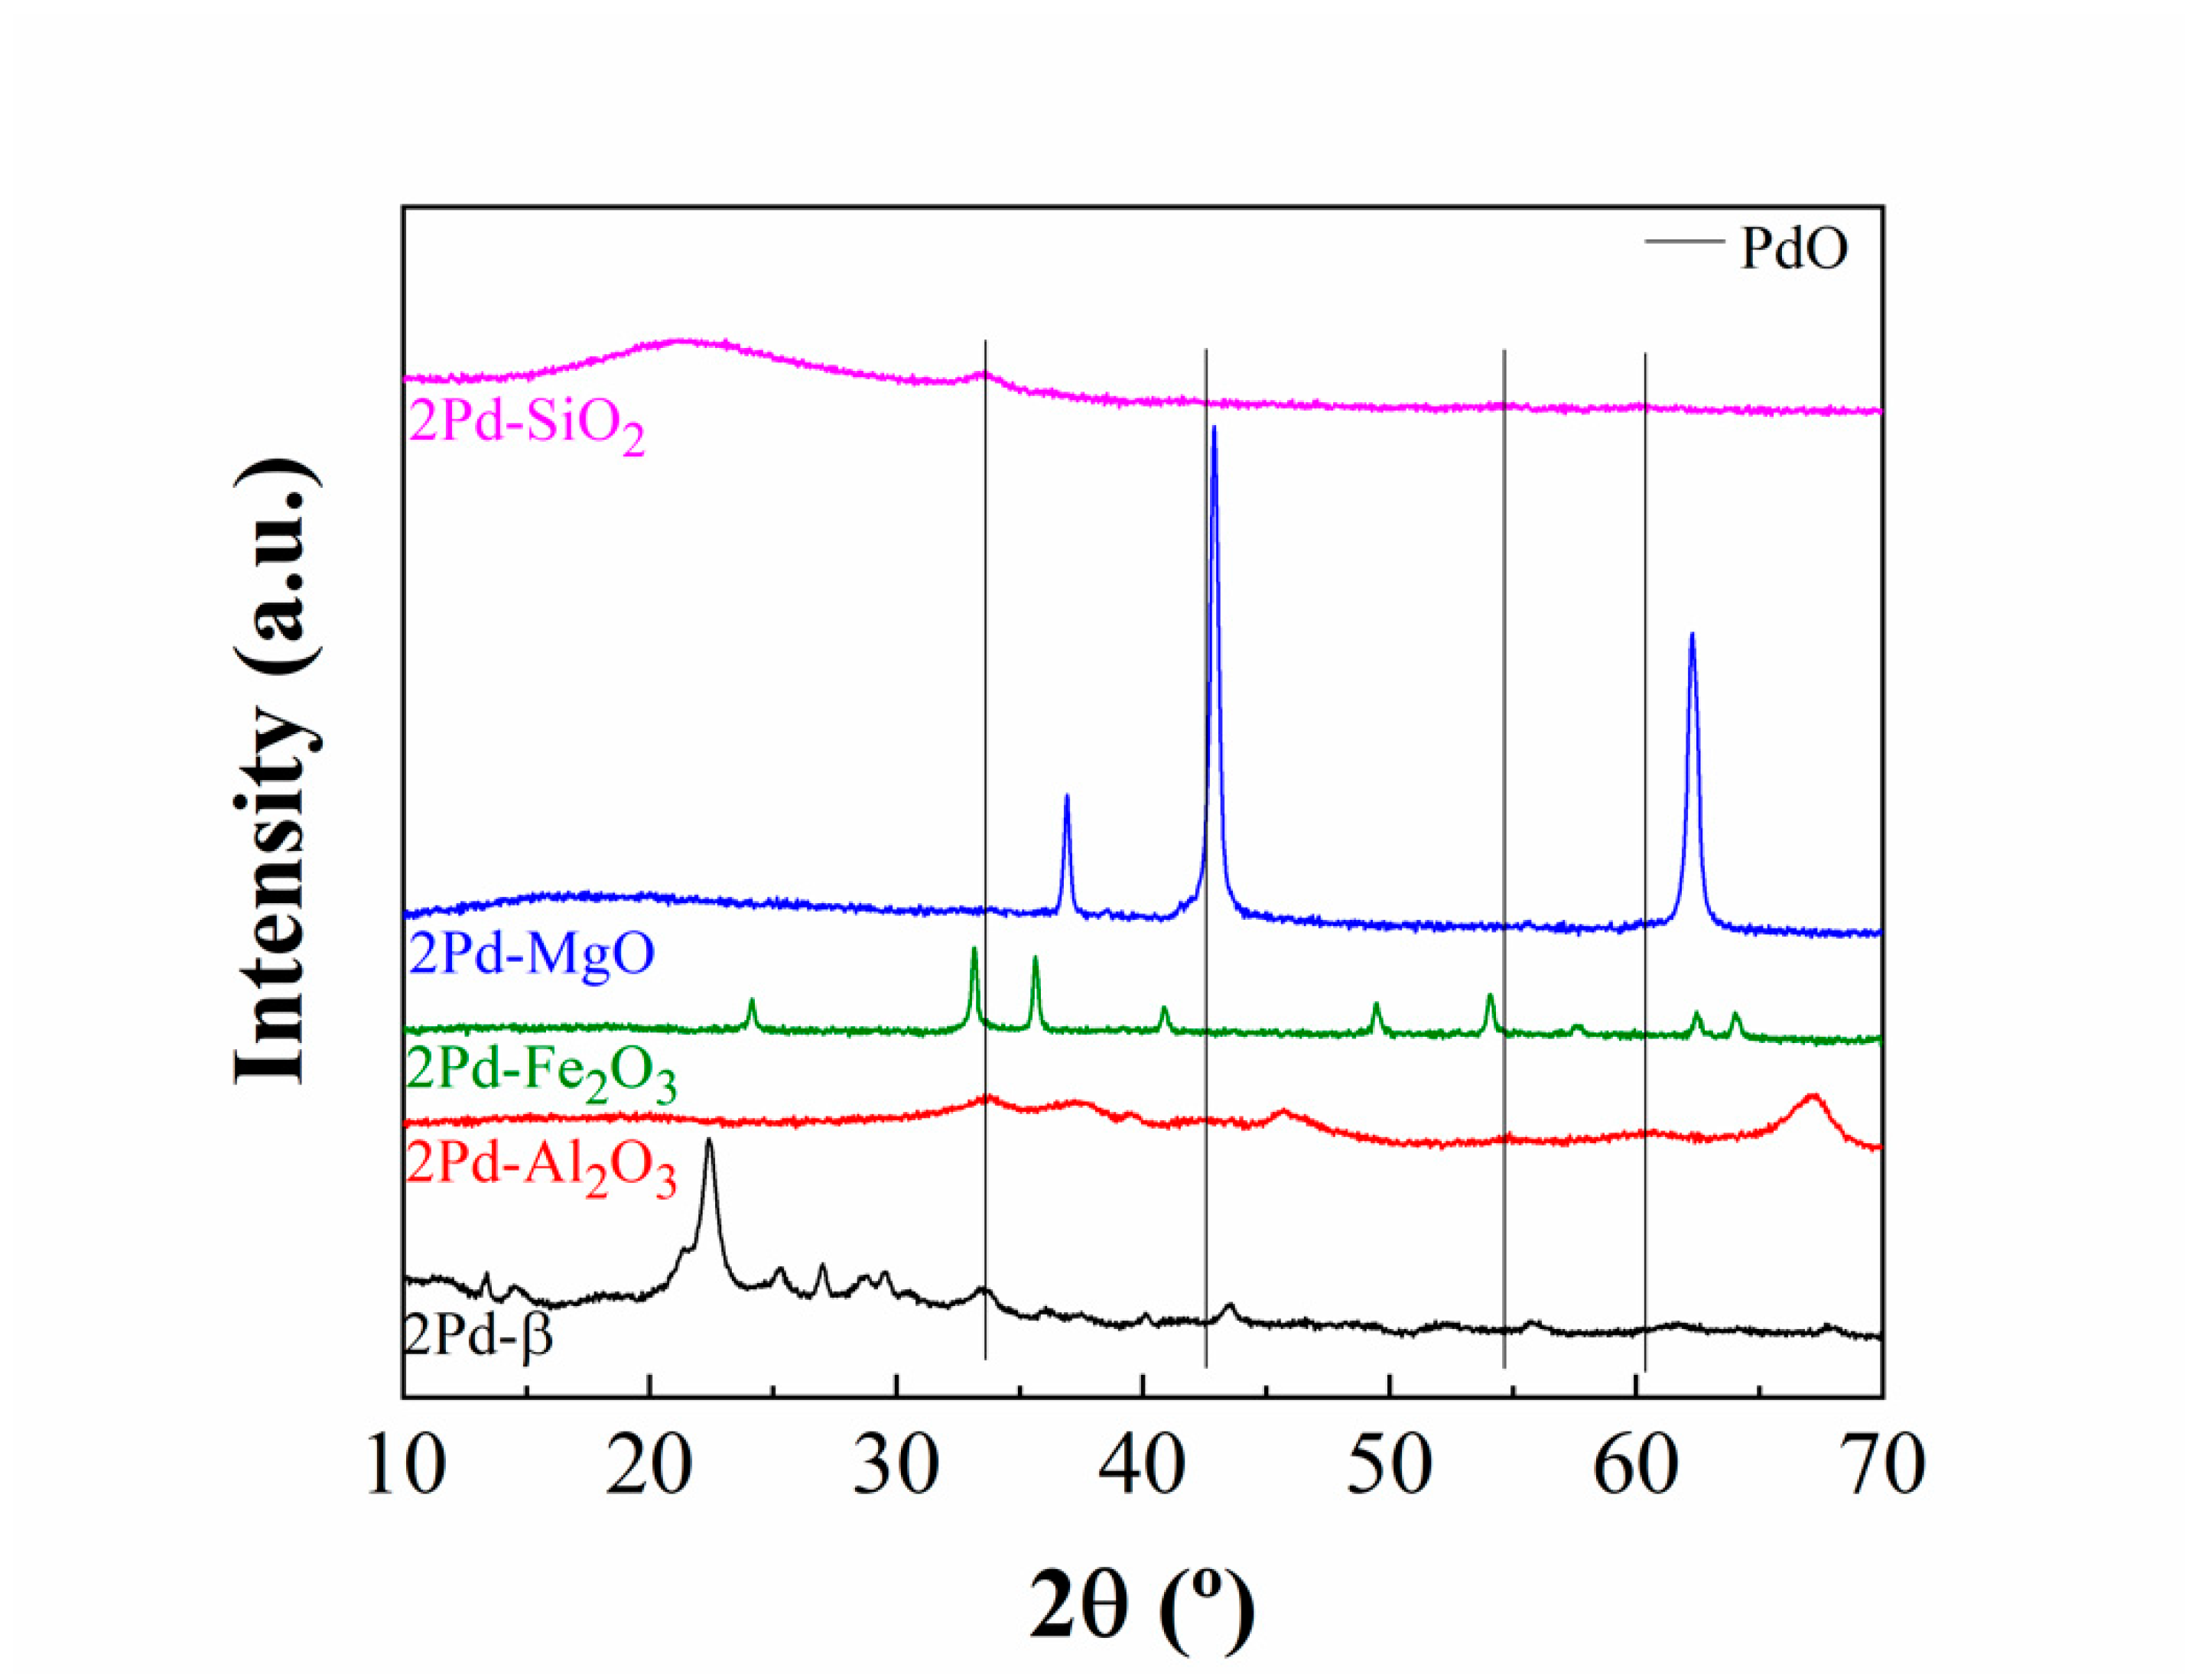
The analysis of crystalline phases present in the Pd-based catalysts was studied by X-ray diffraction (
Figure 1). Since the catalysts possess a low Pd loading, which renders it difficult to observe the corresponding diffraction peaks, only the characterization data of catalysts with the highest Pd content, i.e., 2 wt.%, will be shown.
The diffractogram of 2Pd-β shows a large number of peaks of variable intensity. Among them, the most intense peaks appear at 2θ (°) = 21.4, 22.4, 25.3, 27.1, 28.7, 29.5, and 32.6, which are typical of this microporous aluminosilicate (PDF: 00-048-0074). In the case of 2Pd-Al2O3, the diffraction peaks are broader and less intense. These diffraction peaks are located at 2θ (°) = 37.4, 39.6, 45.8, 60.3, and 67.4, which are ascribed to the existence of γ-Al2O3 (PDF: 00-001-1303). The diffraction profile of 2Pd-Fe2O3 exhibits well-defined and narrower diffraction peaks, located at 2θ (°) = 24.2, 33.1, 35.7, 40.9, 49.4, 54.1, 57.6, 62.5, and 64.1, associated to Fe2O3 crystals of α-hematite (PDF: 01-089-2810). Similarly, 2Pd-MgO also displays well-defined diffraction peaks located at 2θ (°) = 37.0, 42.9, and 62.2, corresponding to MgO crystals with a periclase structure. Finally, 2Pd-SiO2 shows a broad band, whose maximum is located at 2θ (°) = 21.6, characteristic of amorphous silica.
Considering the low Pd loading (2 wt.%), diffraction peaks attributed to Pd species were hardly detected. Thus, it is only noticeable the presence of a small diffraction peak at 2θ (°) = 33.8, which can be assigned to PdO (PDF: 00-048-0074), difficult to distinguish in the case of 2Pd-MgO and 2Pd-Fe2O3 due to the high crystallinity of these supports.
The average crystal size of metal oxides, used as supports, was determined by the Williamson–Hall equation [
33]. Different sizes can be observed, from 7 nm for Al
2O
3 to 35 and 50 nm for MgO and Fe
2O
3, respectively. In the case of β-zeolite, the determination of the crystal size is very complex, since the diffraction pattern depends on the Si/Al molar ratio, while silica has an amorphous structure.
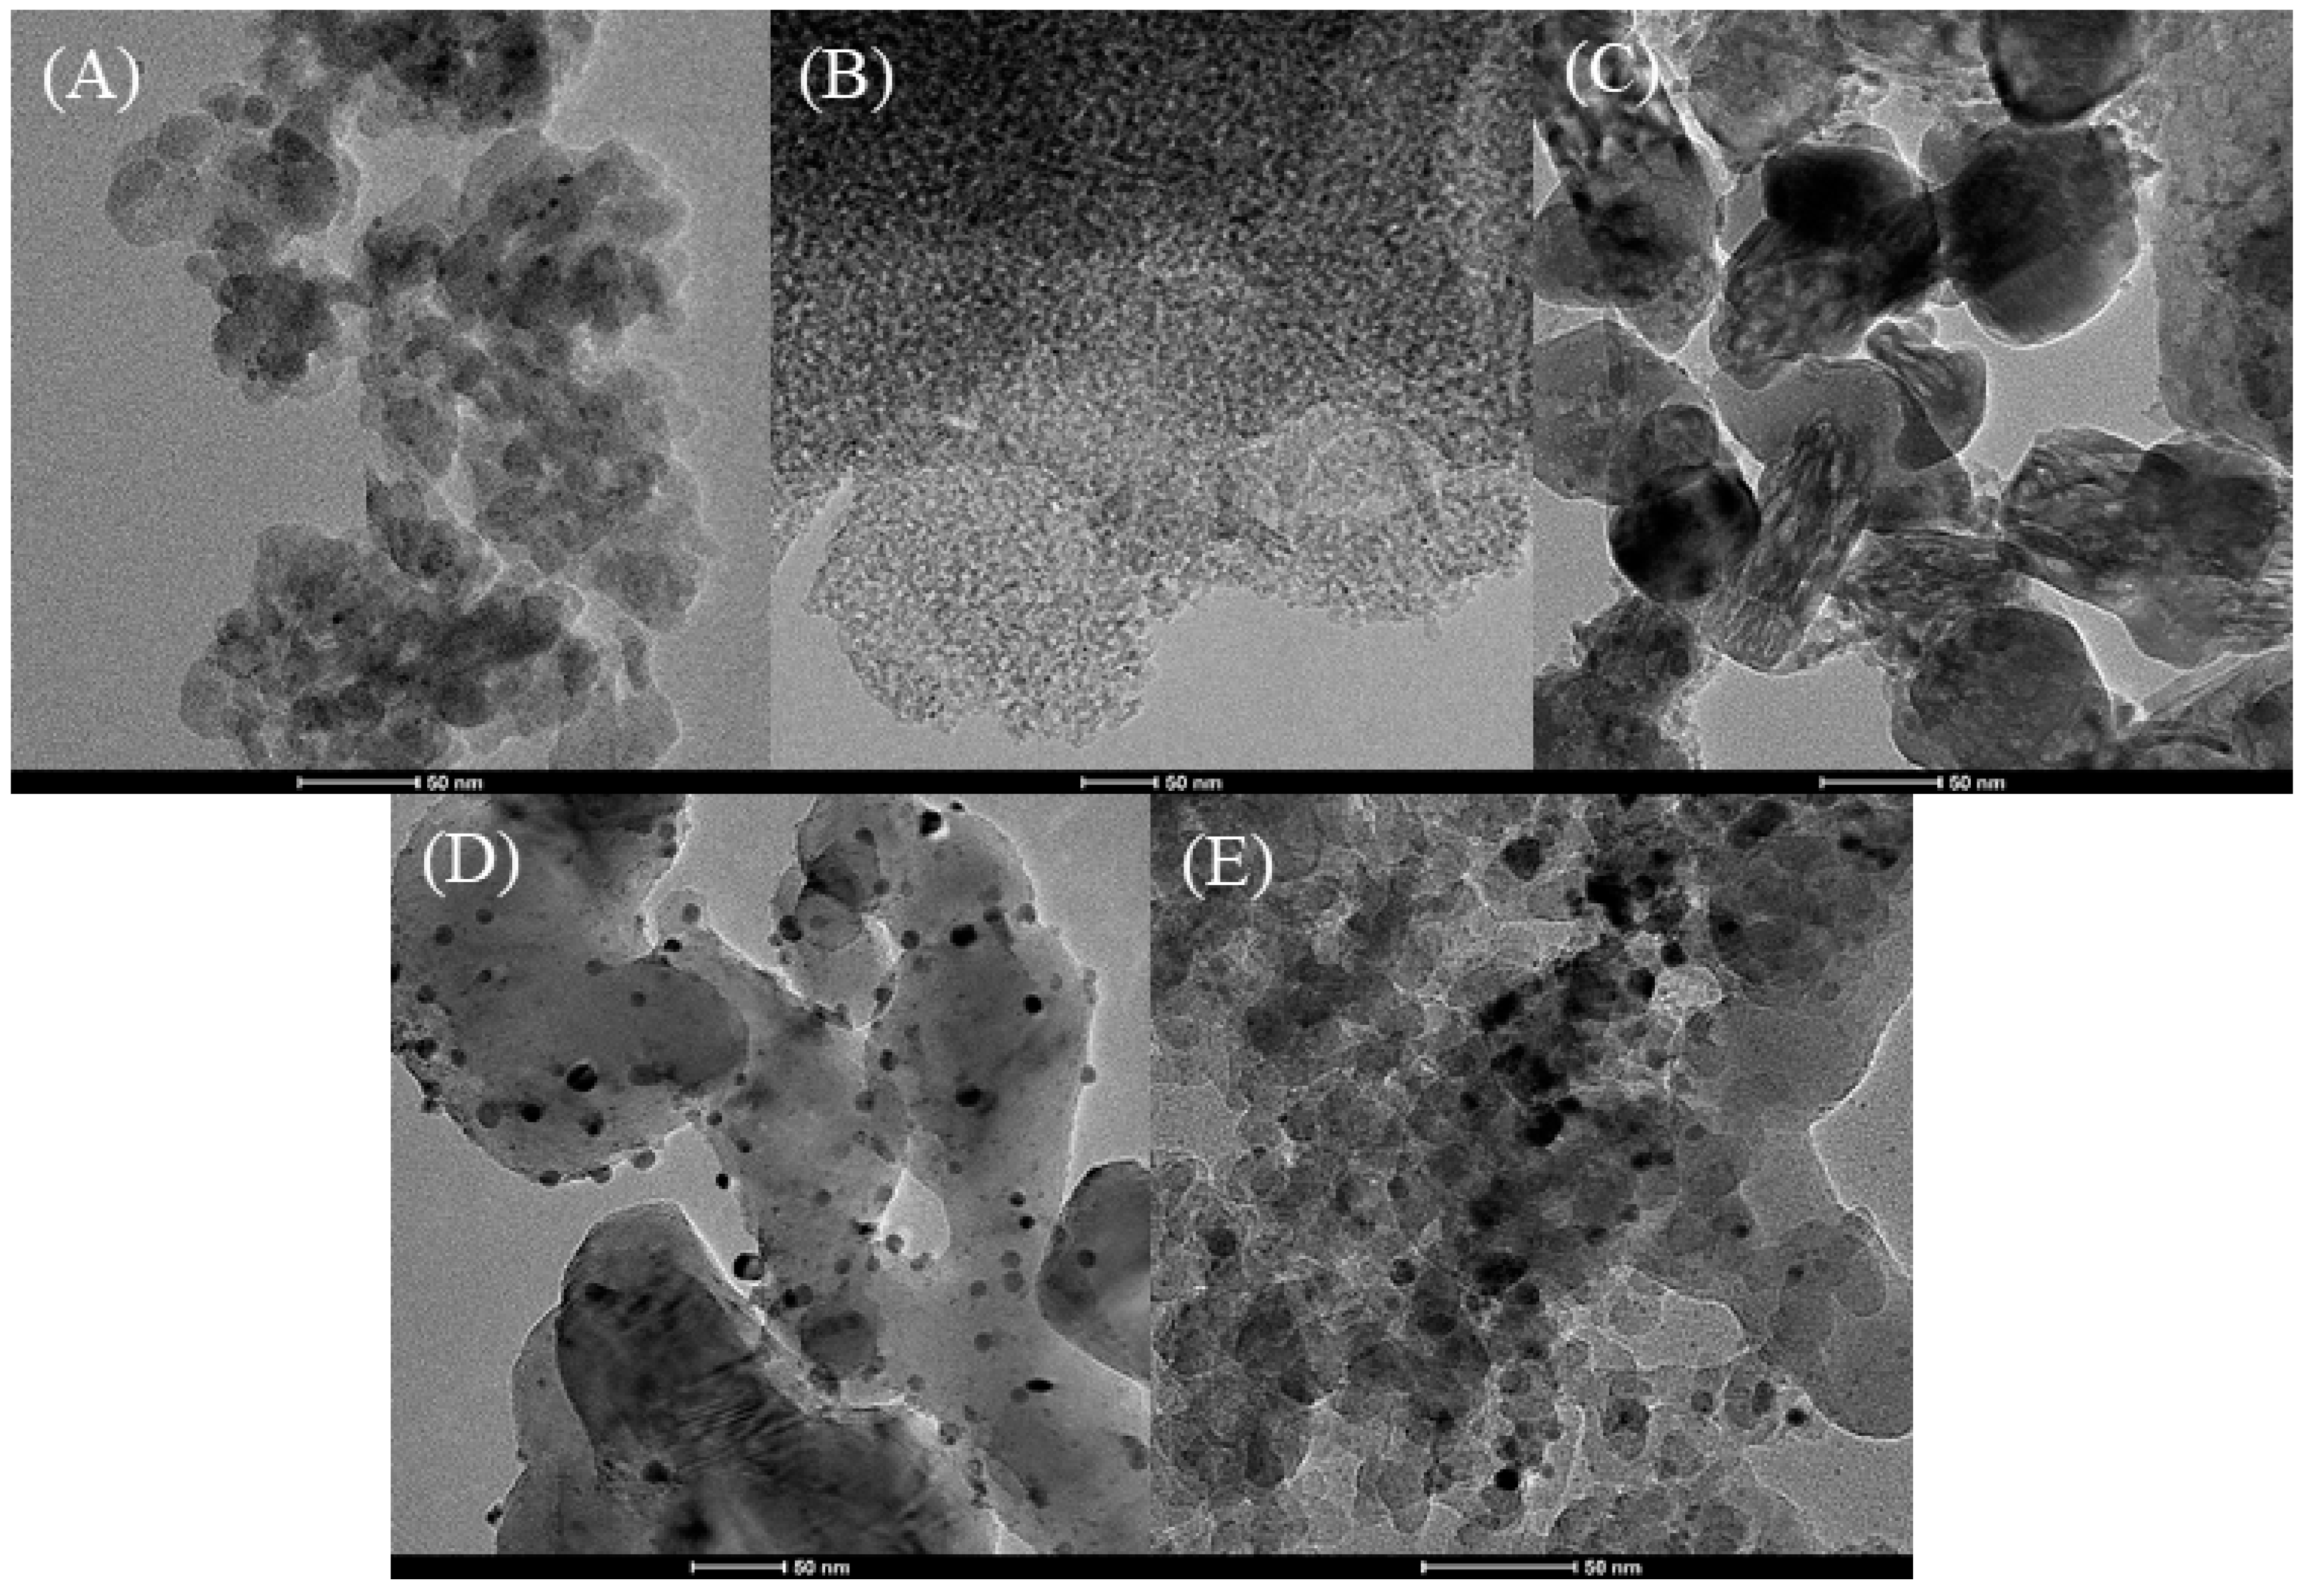
The morphology of Pd-based catalysts was evaluated by transmission electron microscopy (TEM) (
Figure 2). From these micrographs, the particle sizes of supports corroborated the XRD data, and homogeneous distributions of PdO particles smaller than 15 nm were observed in all cases.
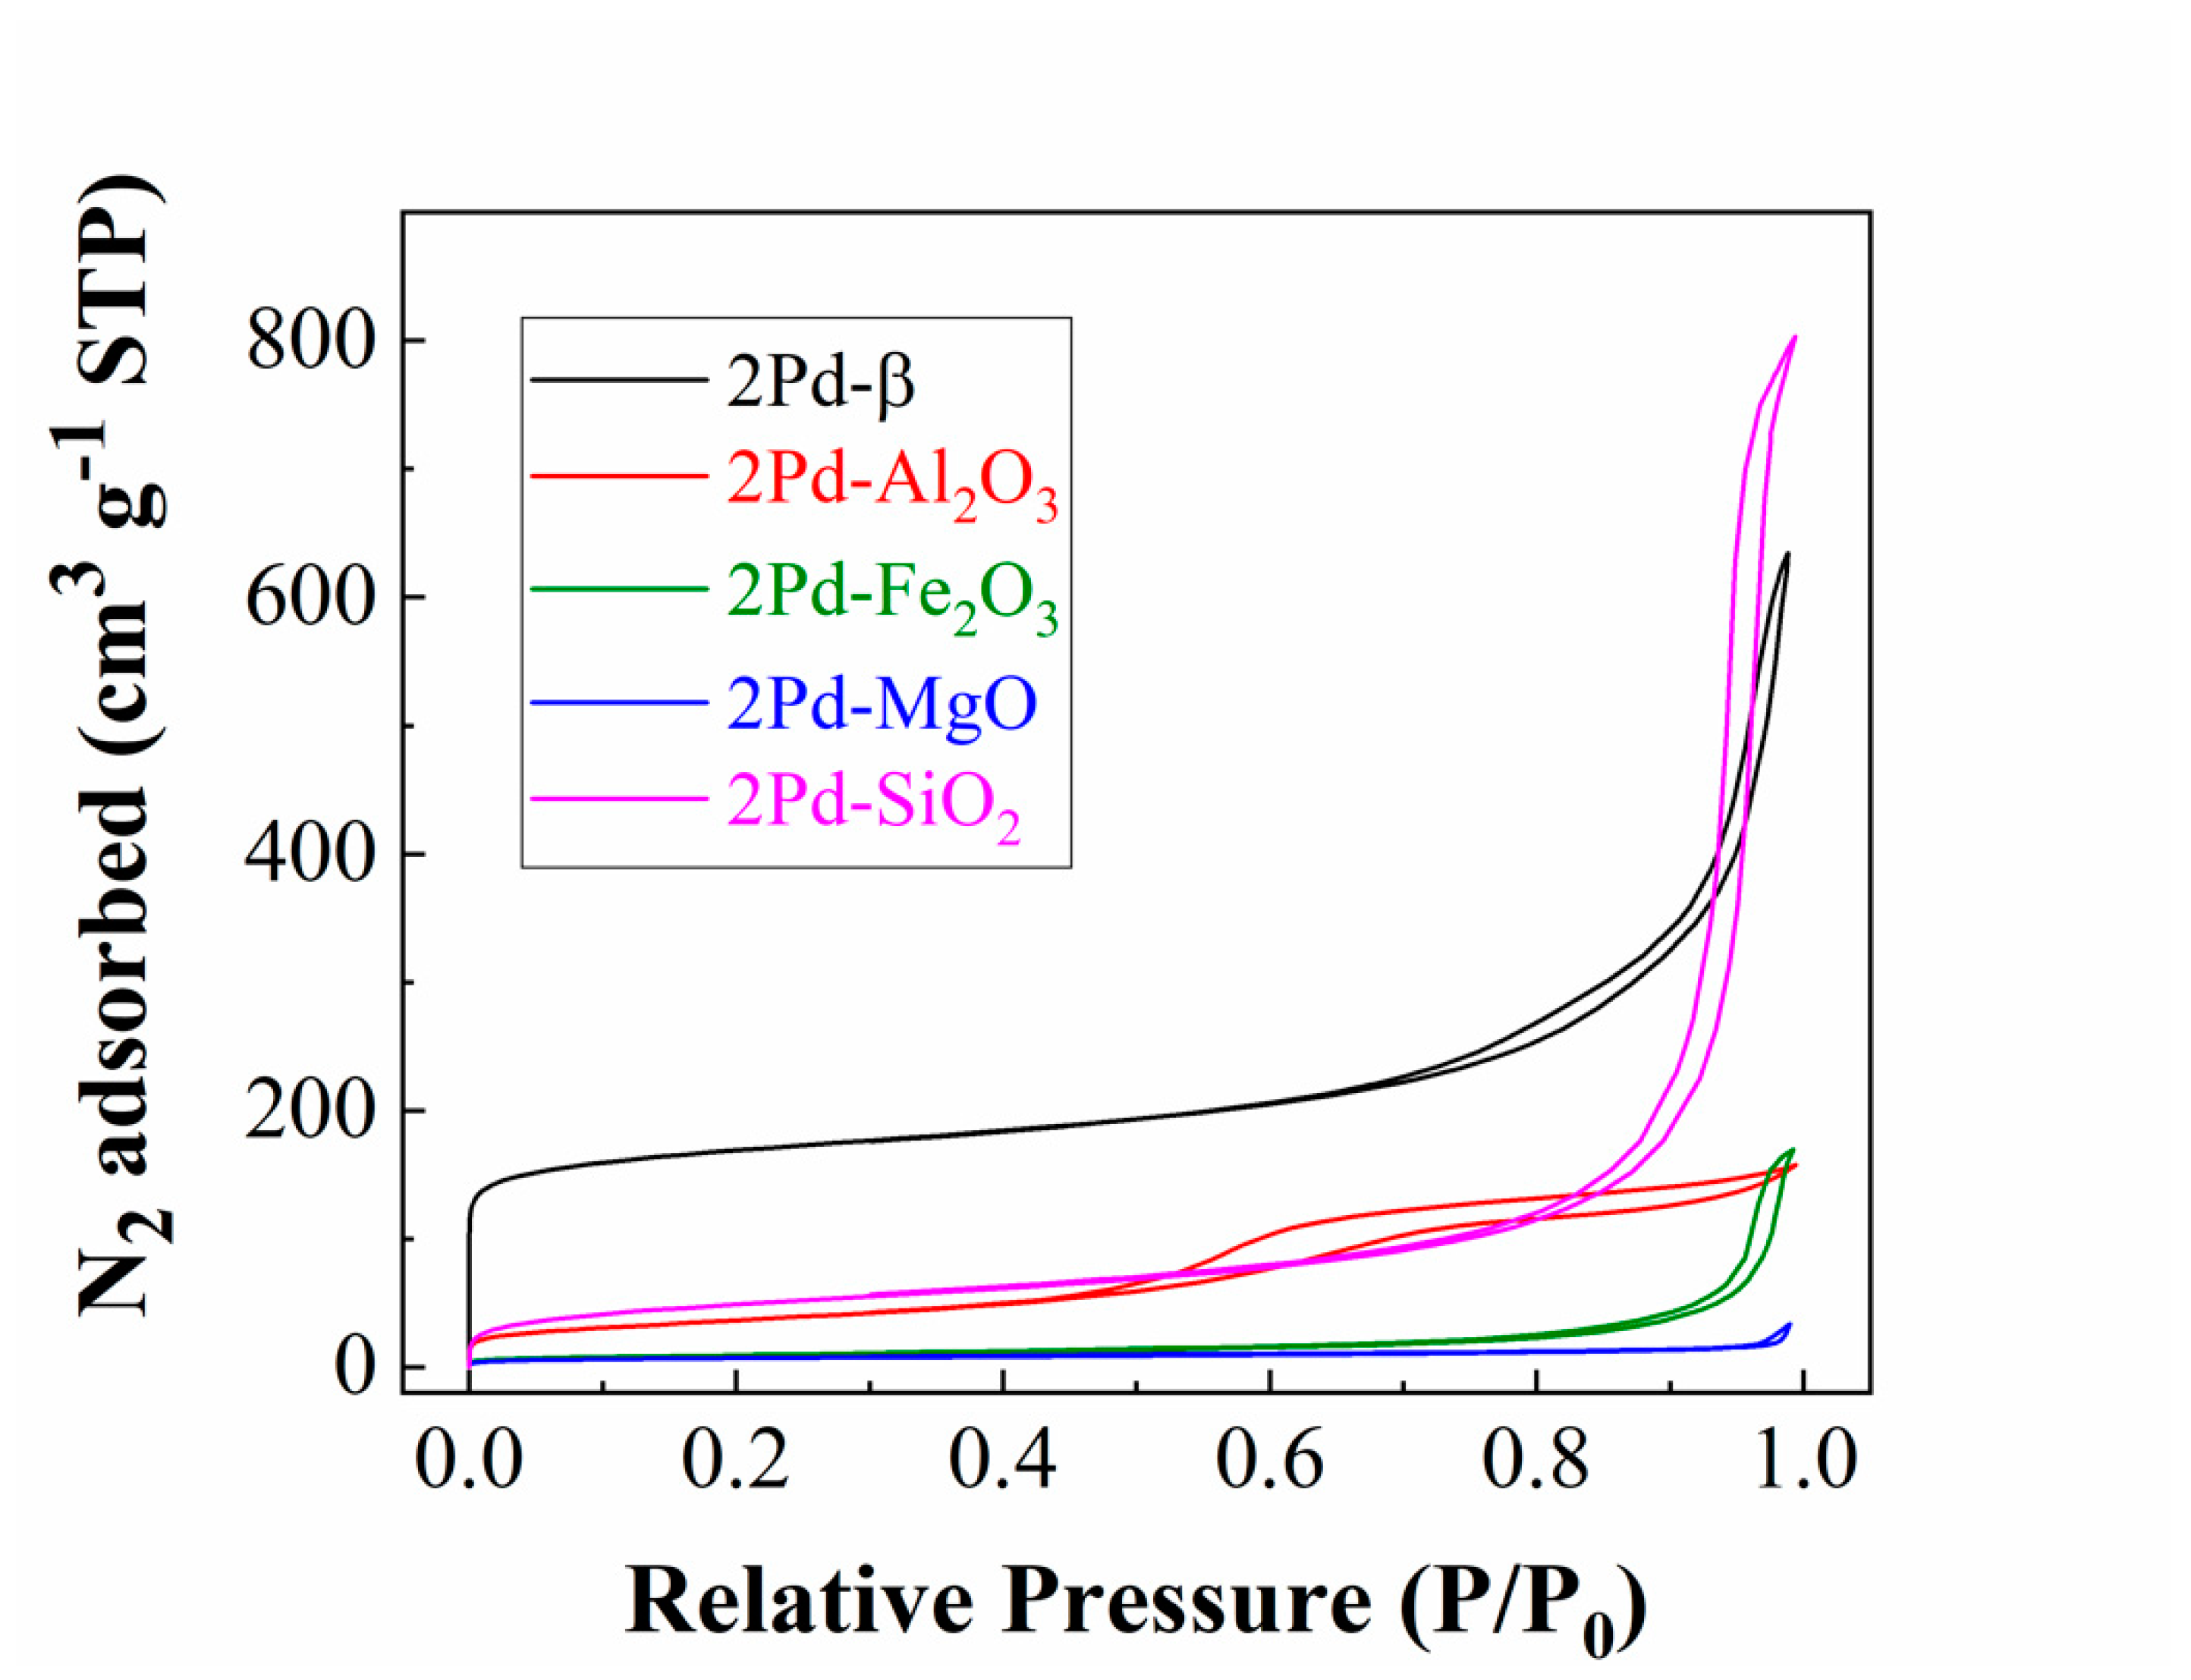
The textural properties were determined from N
2 adsorption–desorption isotherms at −196 °C. The shape of isotherms (
Figure 3) is very different, depending on the type of support. Thus, according to the International Union of Pure and Applied Chemistry (IUPAC) classification, the isotherm of 2Pd-SiO
2 can be considered as Type II [
34], associated to macroporous materials with an important N
2 adsorption at high relative pressure due to interparticle voids between adjacent SiO
2 particles. The catalysts 2Pd-MgO and 2Pd-Fe
2O
3 also exhibit Type II isotherms. The low N
2 adsorption at low relative pressures indicates the absence of micropores. These data seem to be in agreement with the presence of bigger crystals of MgO and Fe
2O
3 in comparison to other supports (
Figure 1 and
Figure 2). The adsorption in the 2Pd-Fe
2O
3 at high relative pressure suggests the presence of some macroporosity. 2Pd-β is mainly microporous, as inferred from the raise of adsorption at low relative pressure. In the case of 2Pd-Al
2O
3, the profile can be fitted as Type IV (a) [
34], which is typical of mesoporous materials, where the presence of hysteresis loops suggests the presence of pores wider than 4 nm.
The analysis of the hysteresis loops (
Figure 3) reveals that 2Pd-β, 2Pd-Fe
2O
3, and 2Pd-SiO
2 catalysts show a Type H3 loop [
34], which is given by non-rigid aggregates of plate-like particles. In the case of the 2Pd-Al
2O
3, the loop can be adjusted to H2 (b) [
34], being associated with pore blocking, but the size distribution of neck widths is large.
The specific surface area was determined by using the Brunauer–Emmett–Teller equation (S
BET) [
35] (
Table 1). As expected due to its microporous character, 2Pd-β displays the highest S
BET (774 m
2 g
−1), mainly ascribed to its high microporosity, as inferred from the
t-plot data [
36] (587 m
2 g
−1). The catalysts 2Pd-SiO
2 and 2Pd-Al
2O
3 have intermediate S
BET values (177 and 132 m
2 g
−1, respectively), while the microporosity is very similar in both cases, although much lower than that shown by 2Pd-β. The catalysts 2Pd-MgO and 2Pd-Fe
2O
3 exhibit the poorest textural properties, with the lowest S
BET values and microporosity, as a consequence of the formation of bigger MgO or Fe
2O
3 particles, which gives rise to lower interparticle voids.
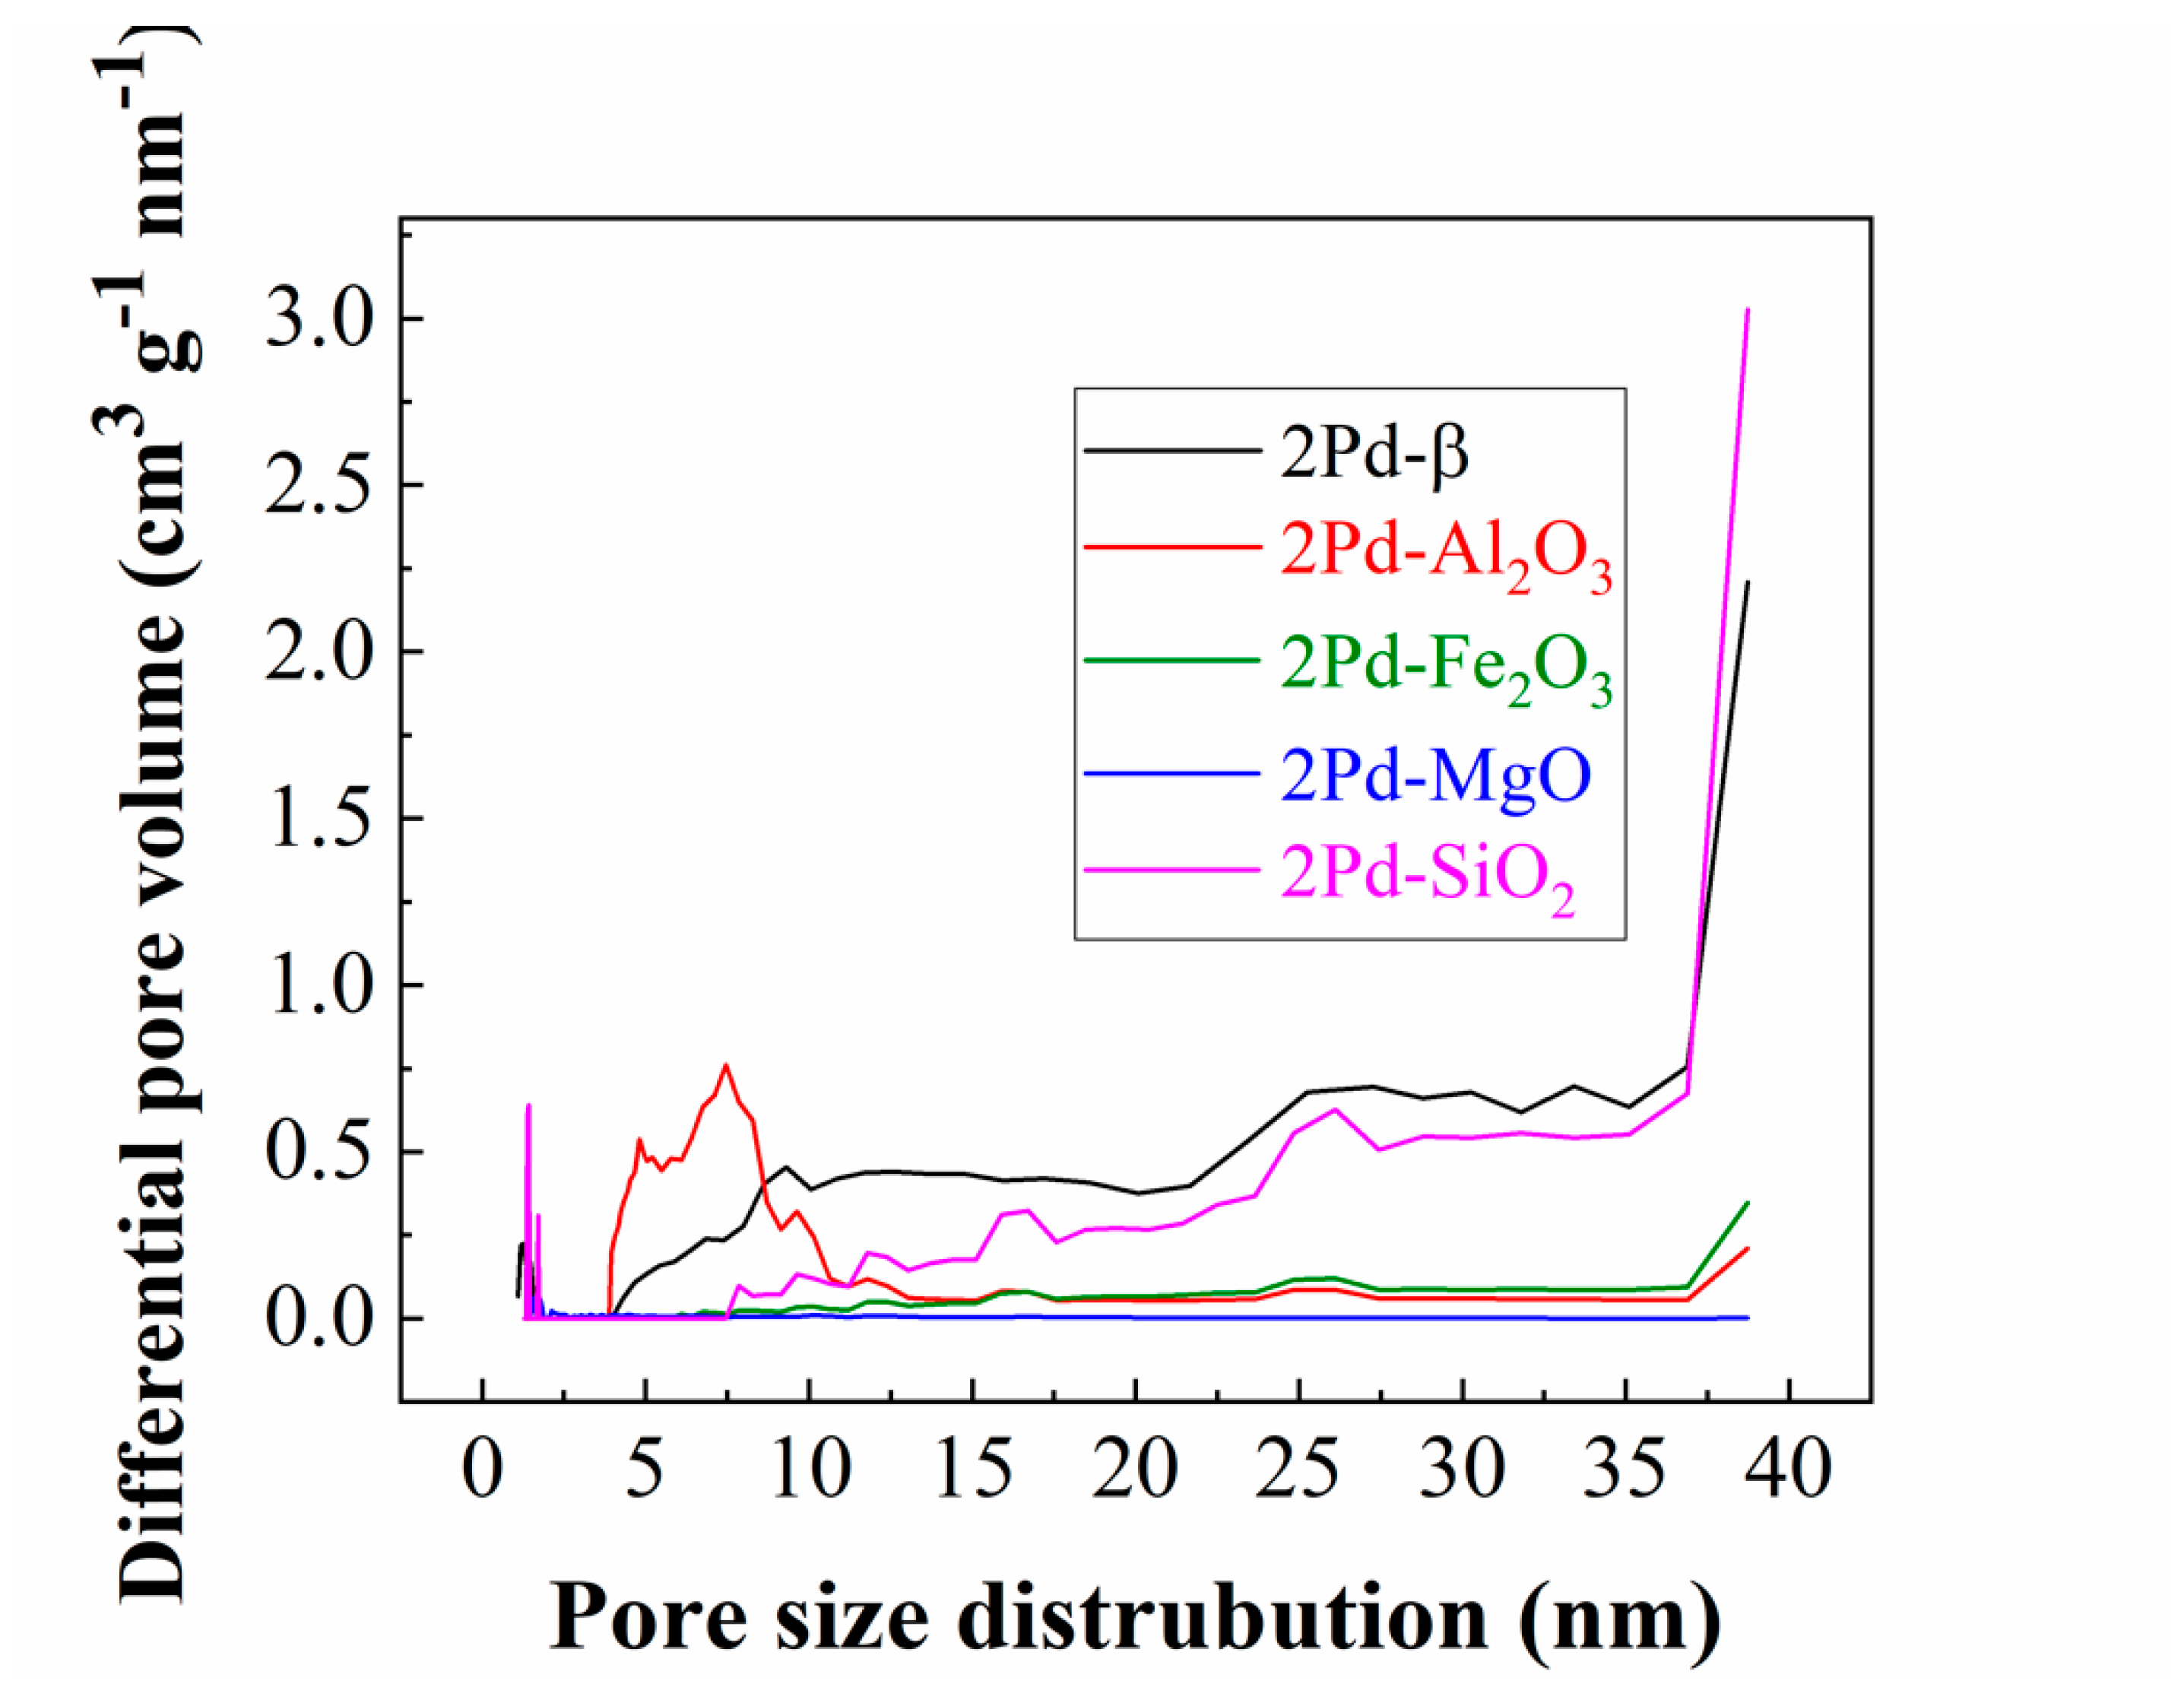
The pore size distributions, compiled in
Figure 4, were estimated by the density functional theory (DFT) [
37]. As expected, 2Pd-β displays microporous, while the catalysts with the largest pore sizes are both 2Pd-β and 2Pd-SiO
2. It is also noteworthy that the catalyst with the narrowest pore size distribution is 2Pd-Al
2O
3, with a pore diameter between 3.6 and 11.0 nm.
Once textural properties were determined, the quantification of the total amount of acid and basic sites was accomplished. The estimation of acid sites from NH
3-TPD analysis (
Figure 5A and
Table 2) reveals that the catalyst with the best textural properties, 2Pd-β, also displays the highest amount of acid sites (455 μmol g
−1), as expected, whereas the 2Pd-SiO
2 catalyst exhibited the lowest acidity values (25 μmol g
−1), even lower than that shown by a basic support like MgO. In this latter case, its acidity can be associated to structural defects in the metal oxide network.
The total amount of basic sites was determined from CO
2-TPD (
Figure 5B and
Table 2). Generally, the total amount of basic sites is less than that shown for acid sites ones. From CO
2-TPD profiles, it can be observed how, in spite of its poor textural properties, 2Pd-MgO reaches the highest amount of basic sites (221 μmol g
−1). In the case of 2Pd-Al
2O
3 and 2Pd-β, the amount of basic sites are 104 and 85 μmol g
−1, respectively. The lowest amount of basic sites was found for 2Pd-SiO
2 and 2Pd-Fe
2O
3 catalysts.
The surface chemical analysis of catalysts was performed by X-ray photoelectron spectroscopy (XPS), and the data are shown in
Table 3. The electronic charge effects were corrected by using adventitious carbon at 284.8 eV as reference [
38]. Together with this adventitious carbon peak, C 1s core level spectra also display another contribution at 288–289 eV for 2Pd-Al
2O
3, 2Pd-Fe
2O
3, and 2Pd-MgO. This contribution is ascribed to the presence of carbonate species, since basic sites present in basic or amphoteric metal oxides tend to react with atmospheric carbon dioxide to form the corresponding metal carbonates. However, crystalline metal carbonates were not observed in the XRD patterns, pointing out that carbonation only takes place on the catalyst surface.
The analysis of the O 1s core level spectra showed a main contribution at 529.4–532.8 eV, attributed to oxide species. Catalysts prepared with less acidic supports (Pd-Fe2O3 and Pd-MgO) presented another contribution located at higher binding energy (531.8–531.9 eV), which is ascribed to both hydroxide and carbonate species, according to the C 1s core level data, previously noted.
The analysis of the Si 2p, Al 2p, Fe 2p, and Mg 2p core level spectra leads to single contributions in each region, which are attributed to their respective oxide species [
38]. Finally, the study of the Pd 3d core level spectra revealed the existence of a band located at 336.7 eV (
Figure 6) [
38], being ascribed to Pd as PdO, confirming XRD data (
Figure 1). In this sense, it is noteworthy that those catalysts whose surface Pd content is lower (2Pd-Al
2O
3, 2Pd-β, and 2Pd-SiO
2) are those where the main diffraction peak of PdO was detected. This fact would imply that the dispersion of PdO in these three catalysts must be worse than in 2Pd-MgO and 2Pd-Fe
2O
3 catalysts.
Regarding the Pd/M (M = Si, Al, Mg, Fe) atomic ratio (
Table 3), the highest values are found for 2Pd-Fe
2O
3 and 2Pd-MgO, thus indicating that Pd dispersion is better on these two supports, and hence, more Pd species are available. In the case of 2Pd-β, its higher specific surface area, and mainly its microporous character (
Table 1), together with the lower Pd loading, could make the detection of Pd by XPS difficult, since Pd nanoparticles would be located in the inner of zeolite particles. It must be taken into account that this surface technique only allows us to analyze a depth of 2–3 nm.
3. Catalytic Results
After the physico-chemical characterization of Pd-based catalysts, these were tested in FUR oxidation using H
2O
2 as oxidant and ethanol, which simultaneously acts as solvent and reagent (
Figure 7).
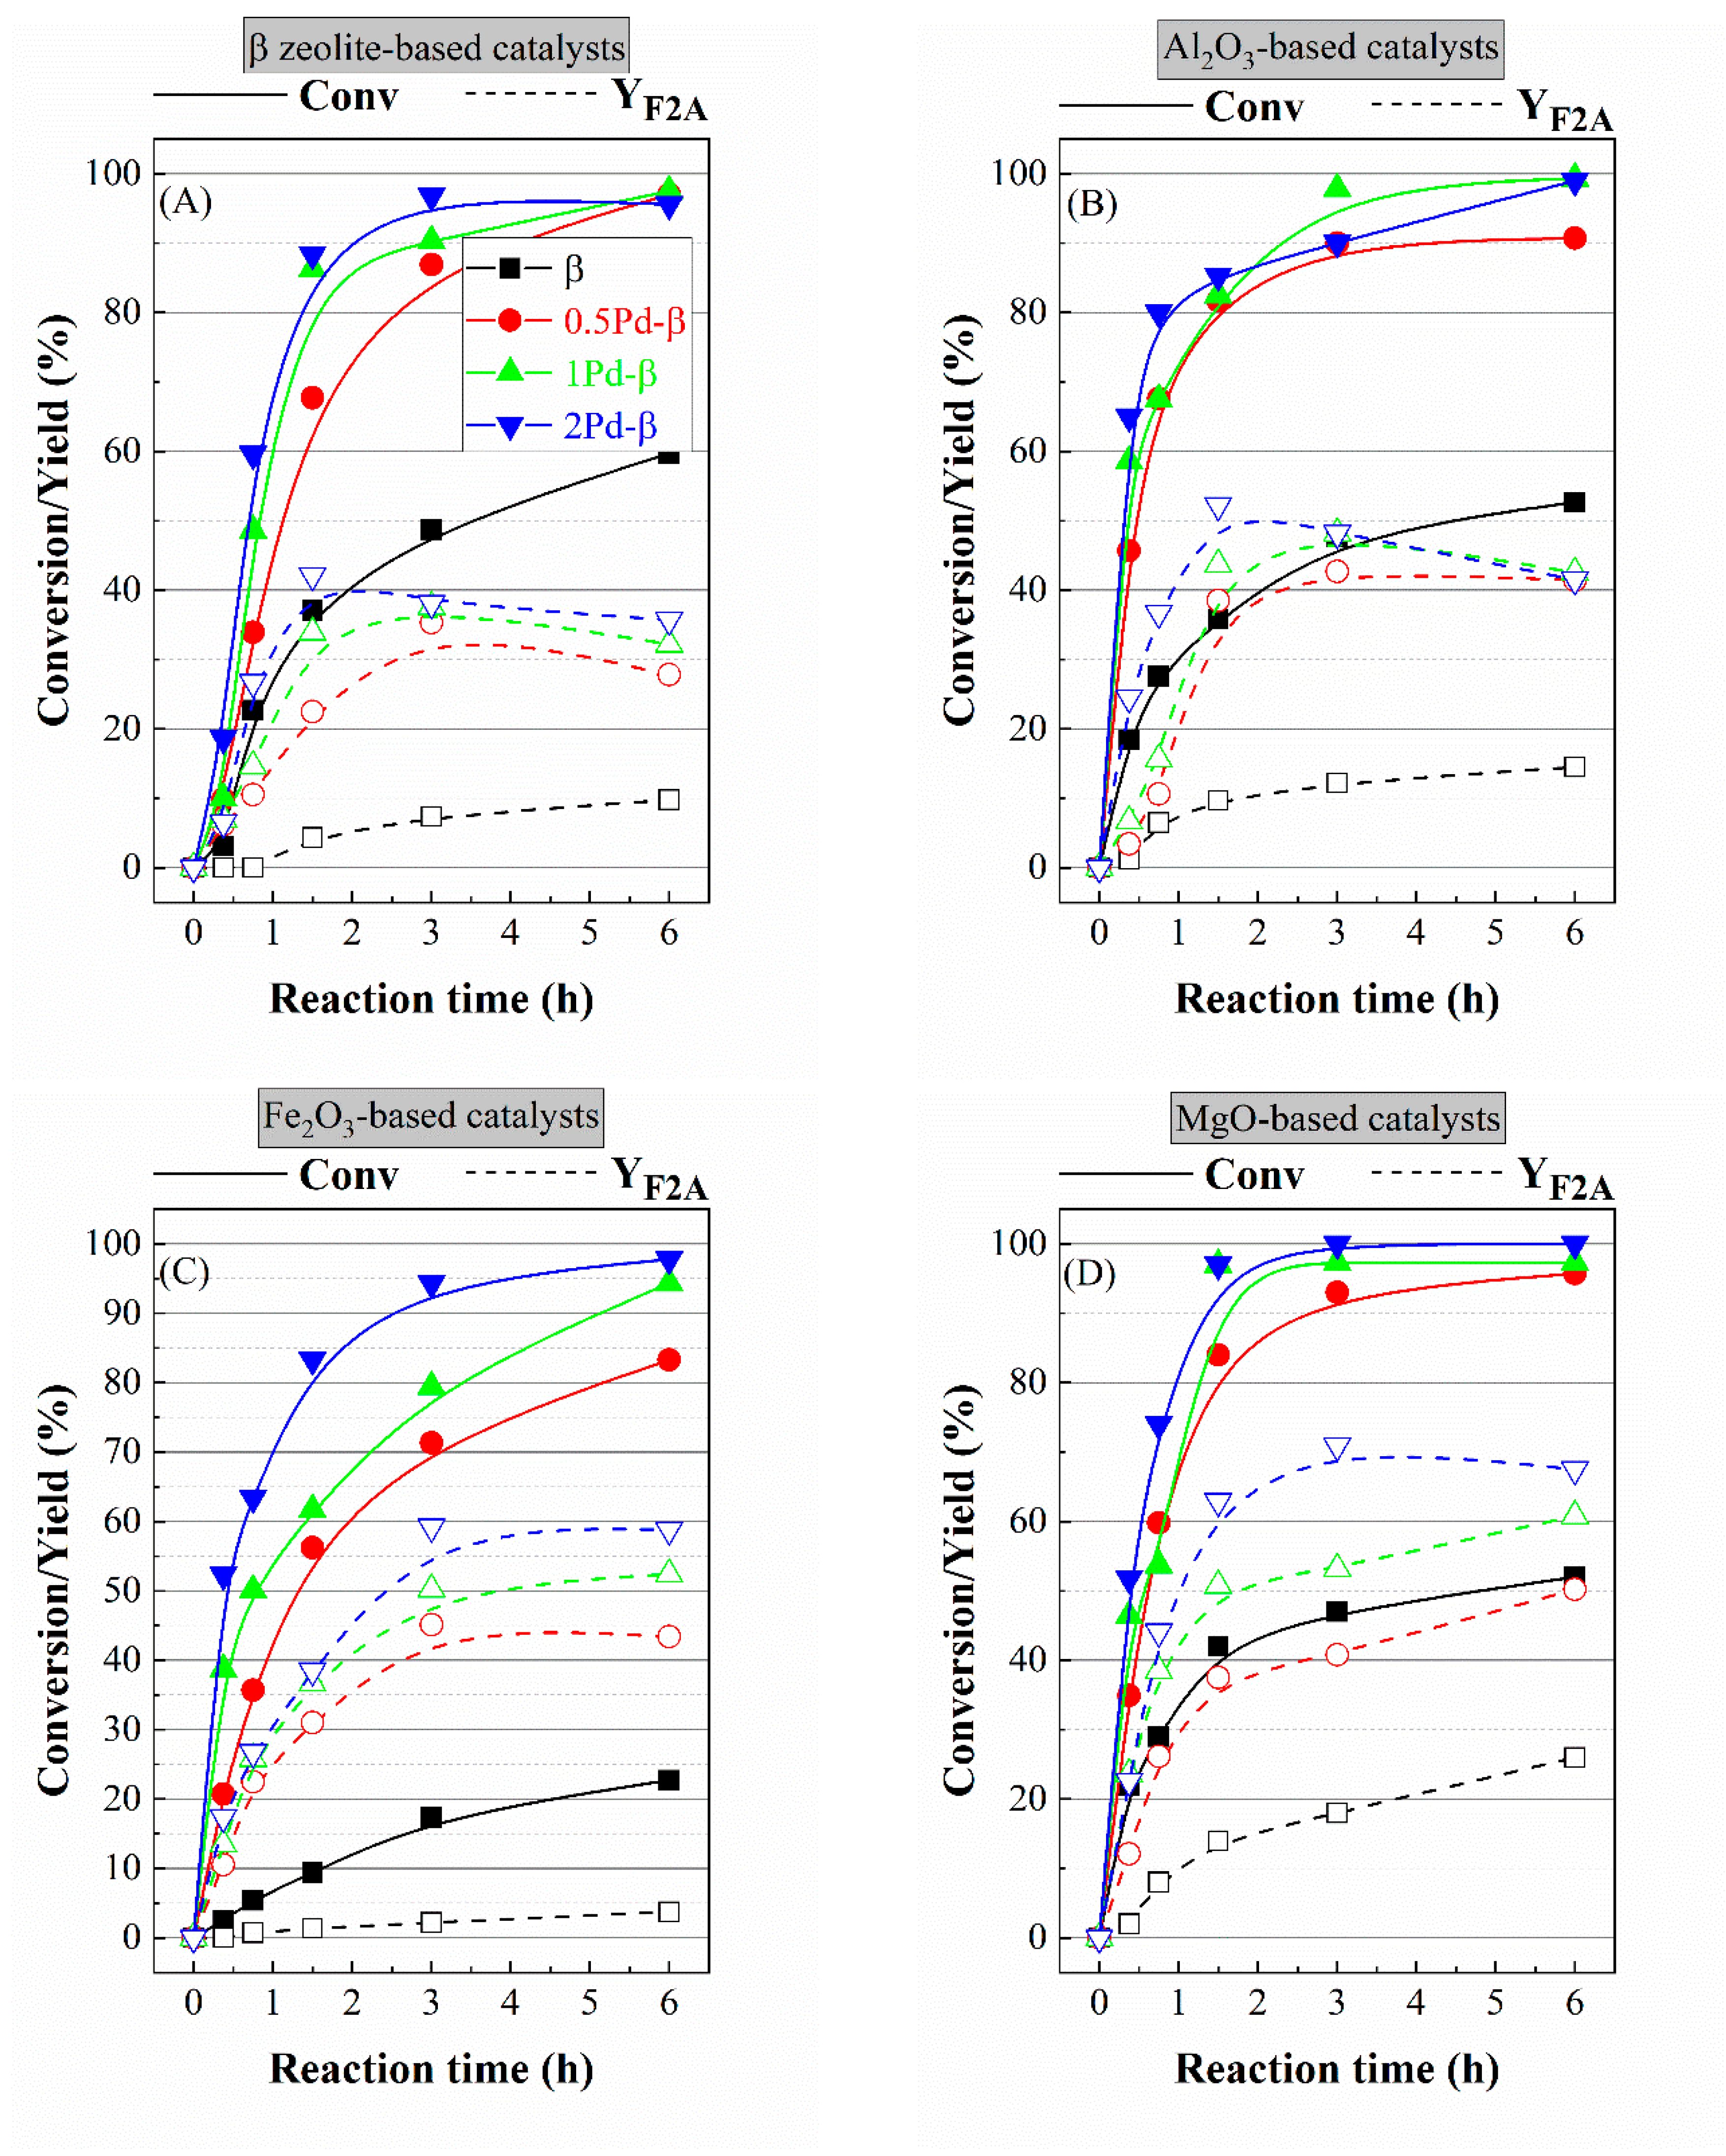
The catalytic study of Pd-based catalysts supported on β-zeolite reveals that FUR conversion rises with the Pd loading, reaching almost full conversion after 3 h of reaction with the highest loading (2 wt%). It is striking that the F2A yield is much lower than FUR conversion in all cases. Thus, the catalytic results show that the yield towards F2A reaches a maximum value of 42% for 2Pd-β after 1.5 h of reaction. Moreover, zeolite-supported catalysts suffer a decrease in F2A yield at longer reaction times. This fact is attributed to FUR is highly reactive in an oxidizing medium, leading to the formation of soluble and insoluble polymers and humins, as a consequence of polymerization processes. It must be taken into account that FUR molecule presents a carbonyl group and unsaturations in α-β position that confer its great reactivity, and these functional groups are also present in F2A molecule. These data are in agreement with others reported in the literature for the oxidation of furfural in aqueous H
2O
2, catalyzed by titanium silicalite, to maleic acid, with carbon balances of about 50–60% for all catalysts [
39,
40]. In addition, these authors also pointed out that the poor carbon balances could be ascribed to the adsorption of FUR over the internal and external surface of zeolite, or the formation of undetectable products. In the present work, the decay of the F2A observed at longer reaction time (> 3 h) is accompanied by the formation of small proportion of 2,2′-difuryl methane (DFM), although its yield is below 8%, as was reported by Fang et al. using Au/NiO catalysts [
41]. The formation of DFM agrees with previous findings about Pd-based catalysts as active in several organic synthesis, such as oxidation and C–C coupling [
42,
43]. Considering that the amount of DFM is approximately similar to the amount of F2A lost after 1.5 h of reaction, it can be expected that F2A is not very prone to generate carbonaceous residues, as easily as it takes place in the case of FUR. The high amount of non-detected products and the decay of the F2A yield with Pd-β could be ascribed to its textural properties, since both FUR and reaction products can be retained in the micropores of β-zeolite, and its higher acidity could also favor side reactions.
In the case of Pd-Al2O3, a similar trend to that of Pd-β was observed, reaching almost full FUR conversion after 6 h. In spite of displaying a lower PdO dispersion than that observed in Pd-β, the samples supported on Al2O3 attain a higher conversion and F2A yield values at shorter reaction times. In the same way, the carbon balances also improve slightly in comparison to catalysts supported on zeolite. This fact could be ascribed to the textural properties of the support, since the catalysts supported on Al2O3 show higher meso- and macroporosity, which means easier access of the FUR molecules and subsequent desorption of reaction products. Similarly to Pd-β catalysts, the decrease in the F2A at longer reaction times is accompanied by the formation of DFM as a consequence of a coupling reaction between two molecules of F2A.
For Pd-Fe
2O
3, the increase in FUR conversion with the reaction time is more gradual than those observed with catalysts supported on β-zeolite and Al
2O
3. In addition, it is also noteworthy that the carbon balance improves, even more than with previous catalysts. With regard to the detected products, F2A is the only product, attaining a maximum yield of 59% at a longer reaction time, whereas the formation of DFM was not observed. The catalysts that give rise to the formation of DFM are those with the highest acid values (2Pd-Al
2O
3 and 2Pd-β,
Table 2). This fact would demonstrate that the coupling reaction between two F2A molecules exhibits slower kinetic and requires the participation of acidic sites on the support. However, the catalysts supported on Fe
2O
3 reached high F2A yields. From these data, it can be inferred that the use of supports with high acidity are not suitable to obtain F2A, since these catalysts tend to form a higher proportion of carbonaceous deposits, as well as favor side reactions such as C–C coupling [
41].
Concerning the catalytic performance of the Pd-MgO catalysts, the FUR conversion also increased very fast at shorter reaction times, similar to that observed for Pd-Al2O3, with almost full FUR conversion after only 1.5 h of reaction. It deserves to be noted that the carbon balance improved notably in comparison to the other catalysts, mainly those catalysts that displayed a higher proportion of acid centers (Pd-β and Pd-Al2O3). The 2Pd-MgO catalyst also allowed us to attain the highest F2A yield: 70% after 3 h of reaction. On the other hand, the absence of DFM with Pd-MgO catalysts, similar to Pd-Fe2O3, is also noticeable, confirming that C–C coupling reactions are favored using acidic supports. On the other hand, the presence of a higher amount of basic sites seems to show beneficial effects on the catalytic behavior, probably due to this catalyst providing additional basic sites (together with Na2CO3) in the reaction. If the textural properties are considered, the catalytic behavior of Pd-MgO is even more remarkable, since the specific surface area is lower than those shown for other catalysts, thus demonstrating the key role of basicity. However, the amount of Pd detected by XPS is the highest for the 2Pd-MgO catalyst.
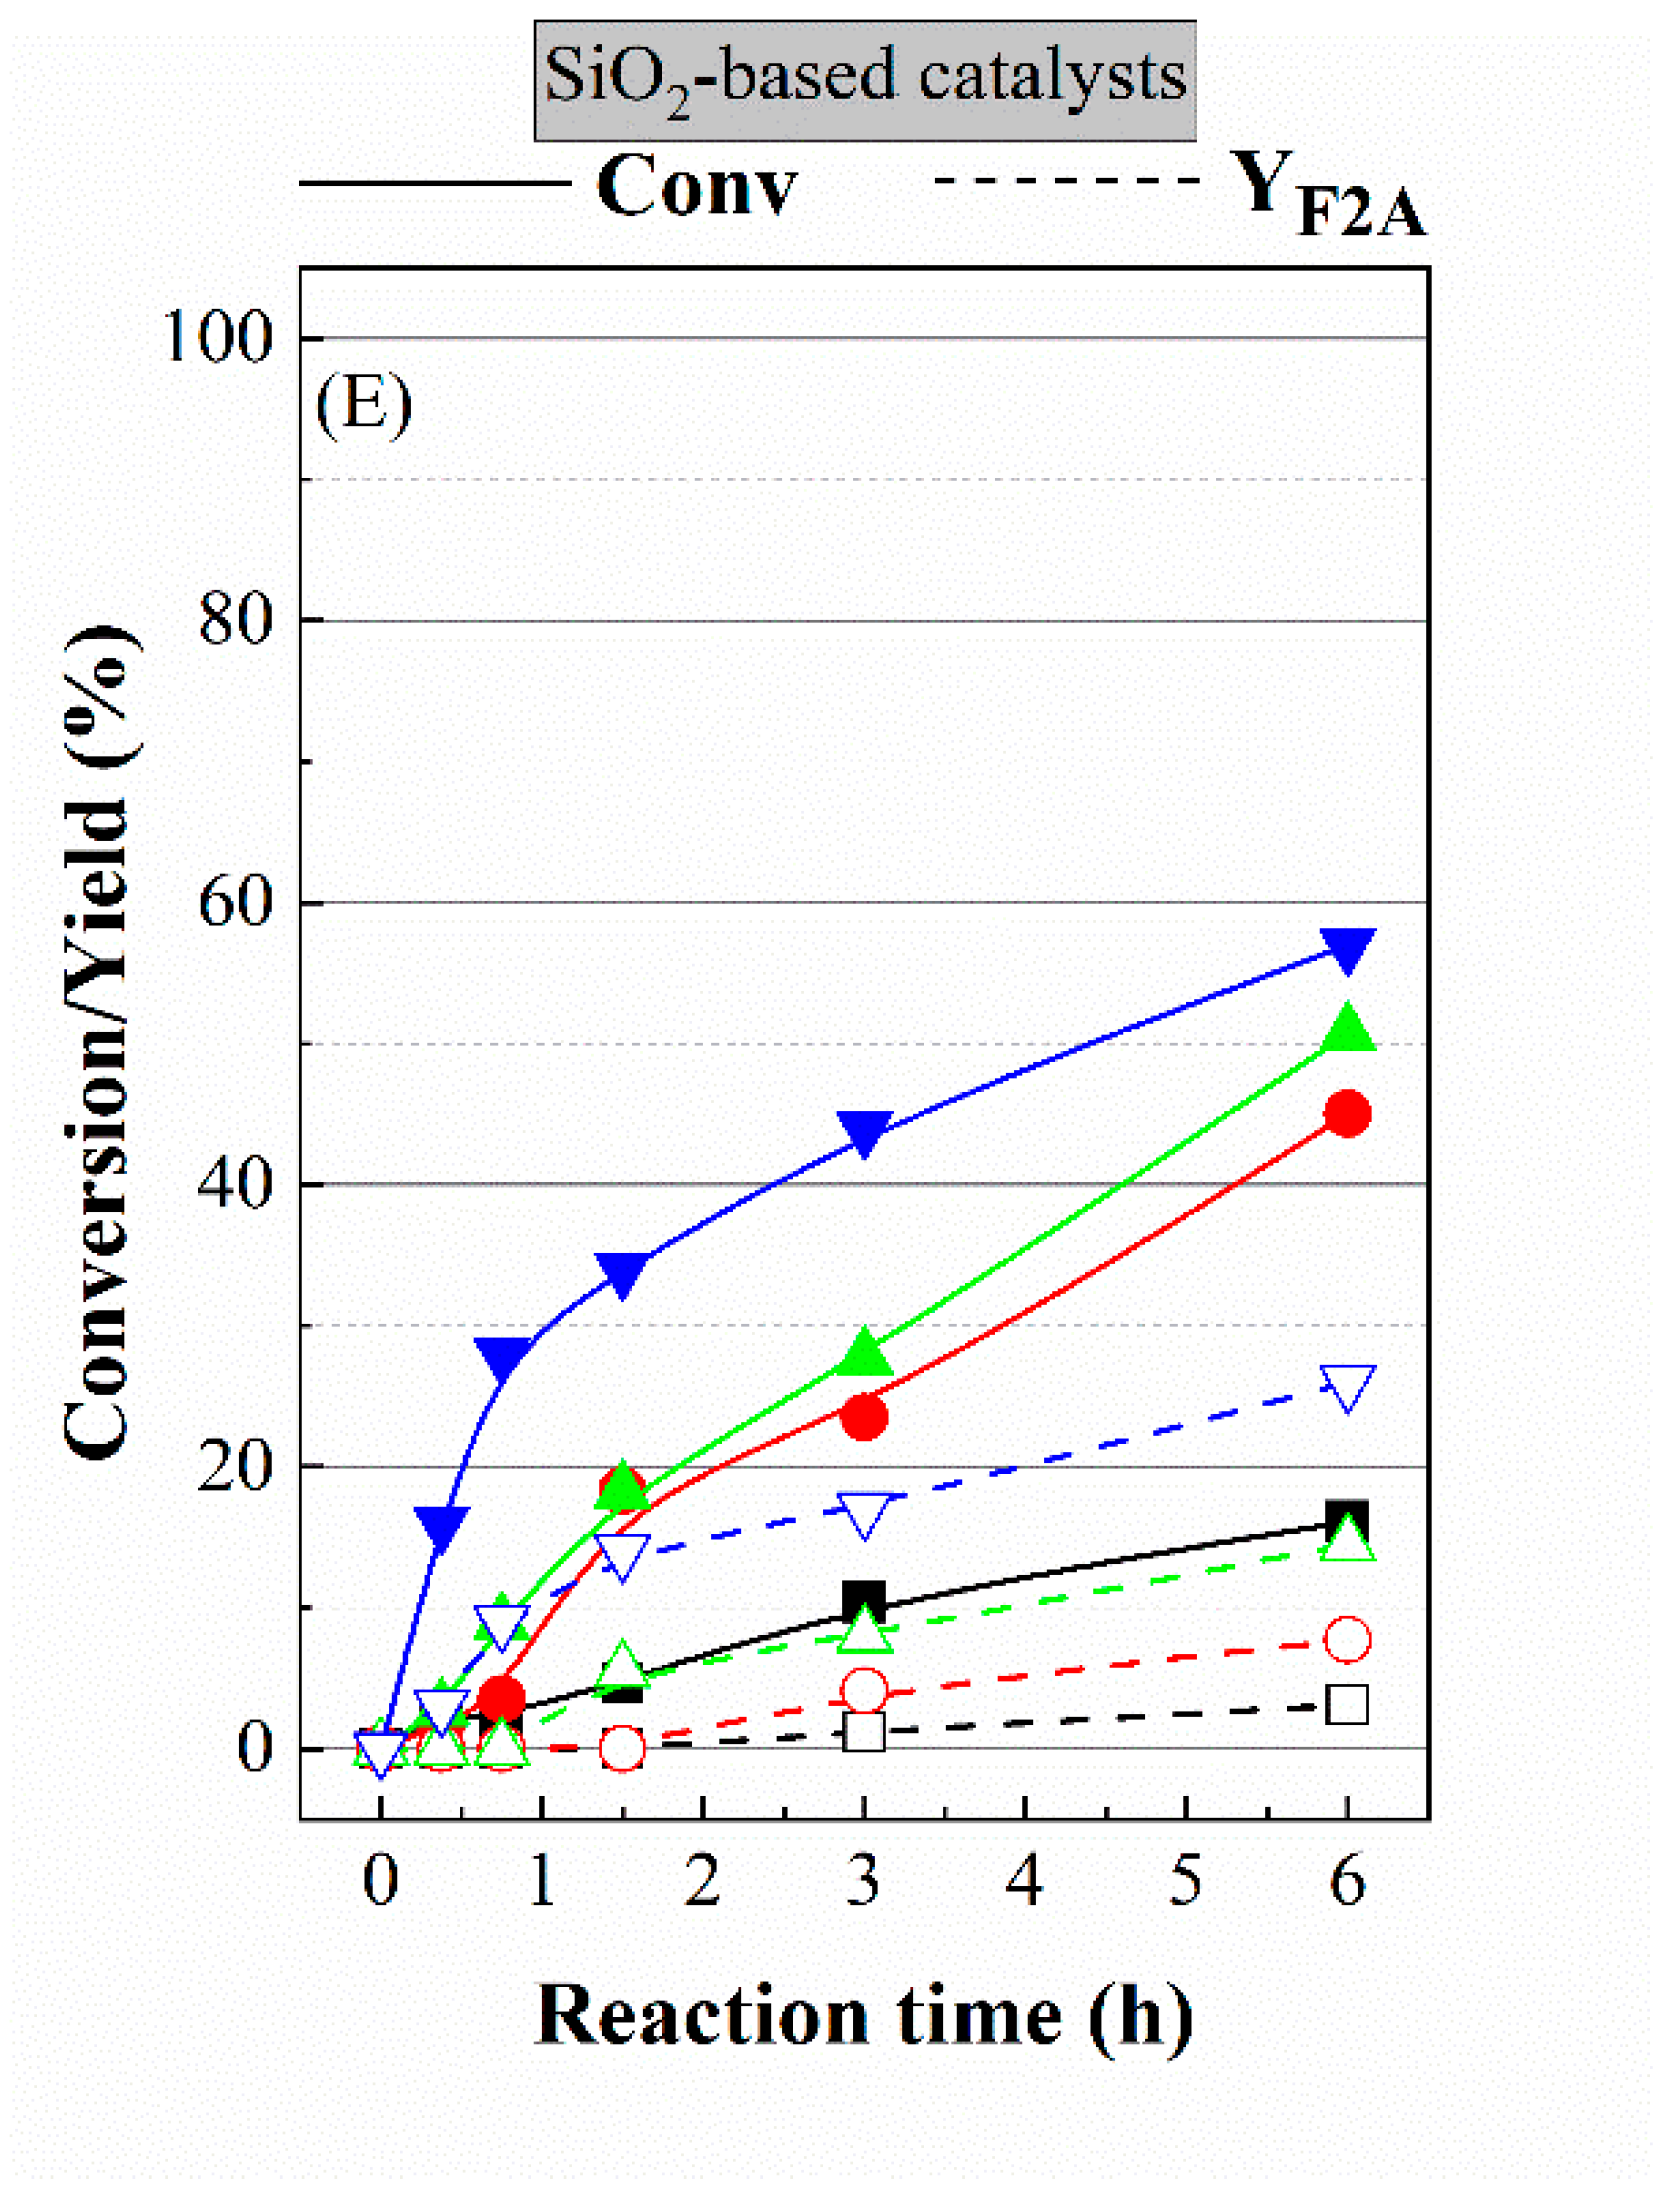
Finally, Pd supported on SiO2 catalysts were also evaluated. Similarly, FUR conversion increases with the Pd content, although the activity is the lowest of all series of catalysts. Again, the main product is F2A, although the yield is more limited due to the poorest activity, reaching a F2A yield of 25% for 2Pd-SiO2 after 6 h of reaction at 170 °C. Therefore, the presence of both acid and basic sites should be playing an important role in the condensation reaction. In the case of basic supports, mainly MgO, the catalytic results are very interesting, since it can act as a heterogeneous basic catalyst that can have a synergistic effect with Na2CO3.
Several possible routes have been proposed in the oxidative condensation of FUR [
20,
21,
22]. According to the obtained products, the most reliable route involved is, firstly, the oxidation of ethanol to acetaldehyde by H
2O
2, and the subsequent base subtraction of an H from C
α position of the acetaldehyde, occurring an aldol condensation reaction, giving rise to F2A as product. The absence of furoic acid among the reaction products discarded the direct oxidation of FUR, while the absence of furfuryl alcohol (FOL) ruled out a catalytic transfer hydrogenation (CTH) process, or the Cannizzaro reaction. In fact, when FOL was fed instead of FUR, no F2A was detected, although its concentration slightly decreased, probably due to polymerization of FOL. Then, F2A is undergone to coupling reaction to form DFM, although longer reaction times and an acid support are required.
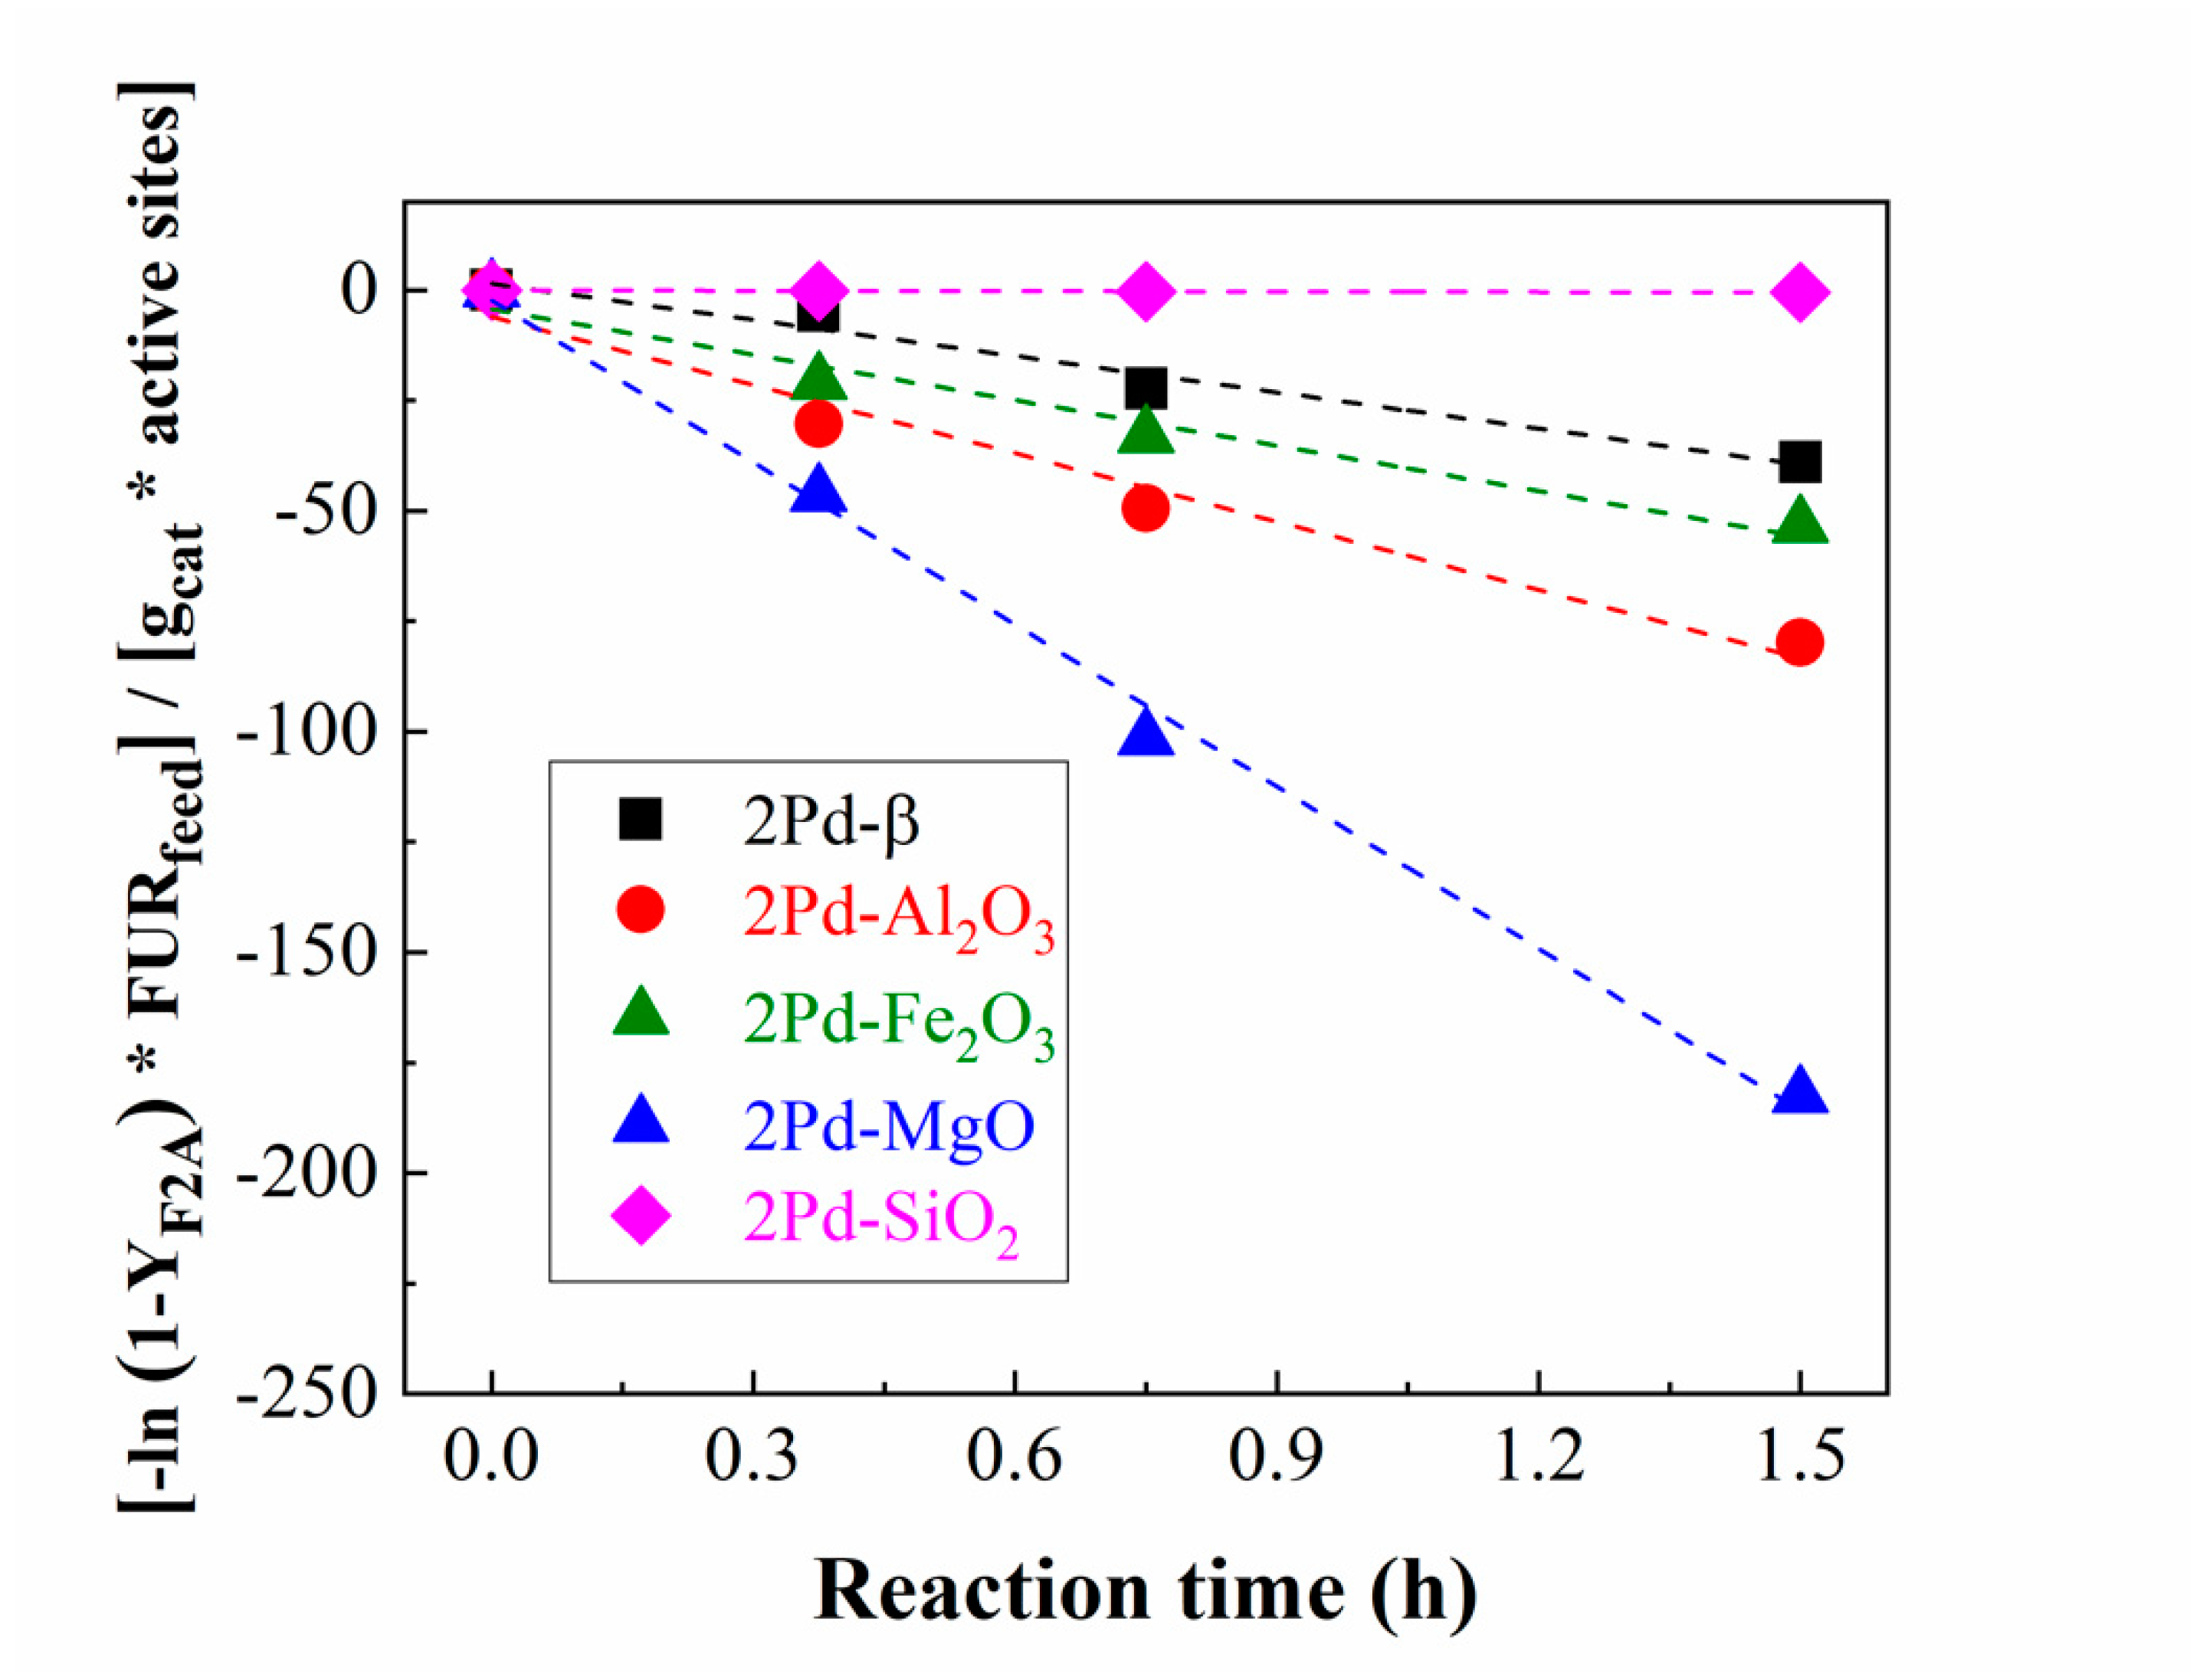
In order to evaluate the efficiency of the Pd-based catalyst, the next study was focused on the analysis of the amount of F2A obtained per gram of catalyst and active site (productivity). This study was carried out assuming that the oxidative condensation and oxidative esterification are considered as pseudo-first-order kinetics [
44,
45]. In addition, short reaction times, which implies low FUR conversion and the formation of F2A as only product, were chosen so that the logarithmic scale fit was linear (
Figure 8). From the obtained data, it can be inferred that 2Pd-MgO is the catalyst that produces the highest amount of F2A per gram and per active phase. Next, catalysts with an acid character such as 2Pd-Al
2O
3 and 2Pd-Fe
2O
3 also present active sites in the oxidative condensation of FUR to F2A, although their activity seems to be a bit far from that obtained by the 2Pd-MgO catalyst. With regard to the 2Pd-β, the activity of the active sites of this acidic catalyst is even lower, probably due to this support being very microporous, as previously noted. The poorest behavior was observed for 2Pd-SiO
2, since F2A productivity can be considered as negligible in comparison to other catalysts.
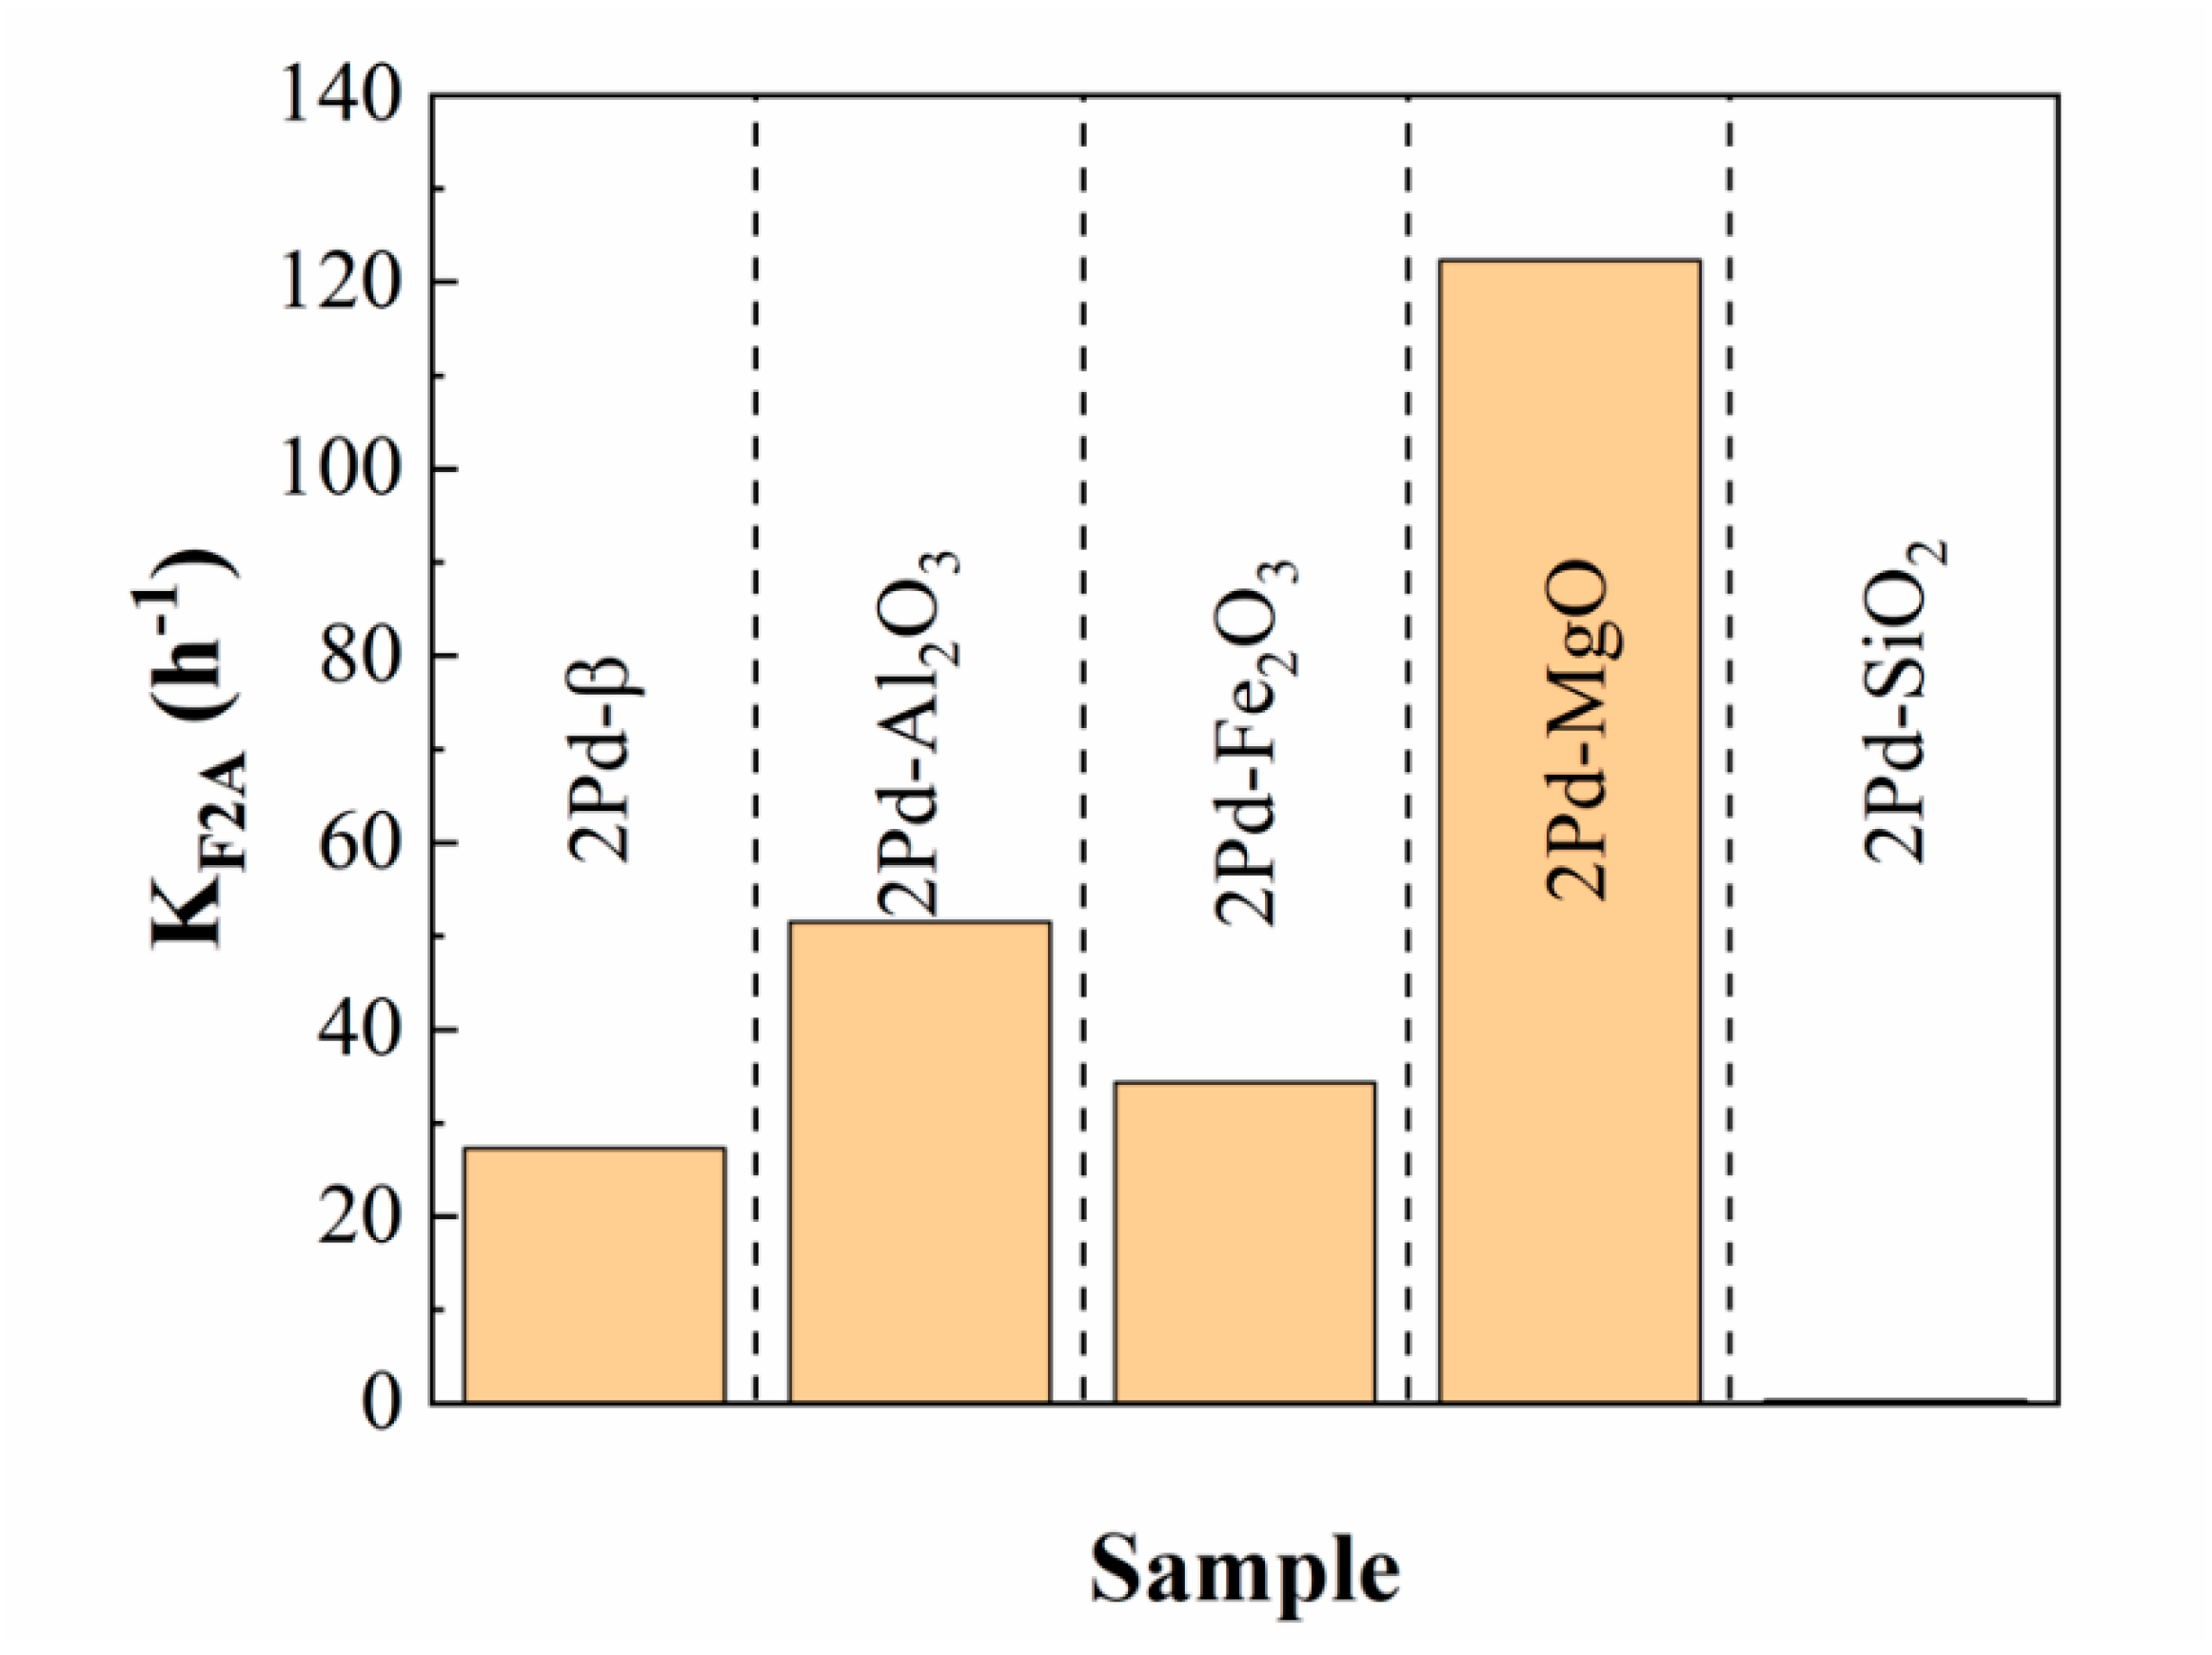
From the analysis of the slope of F2A productivity, it is possible to establish a kinetic constant of F2A formation, denoted as k
F2A (
Figure 9). These data reveal the highest k
F2A (122 h
−1) for 2Pd-MgO, while, in the opposite case, 2Pd-SiO
2 displays k
F2A close to zero.
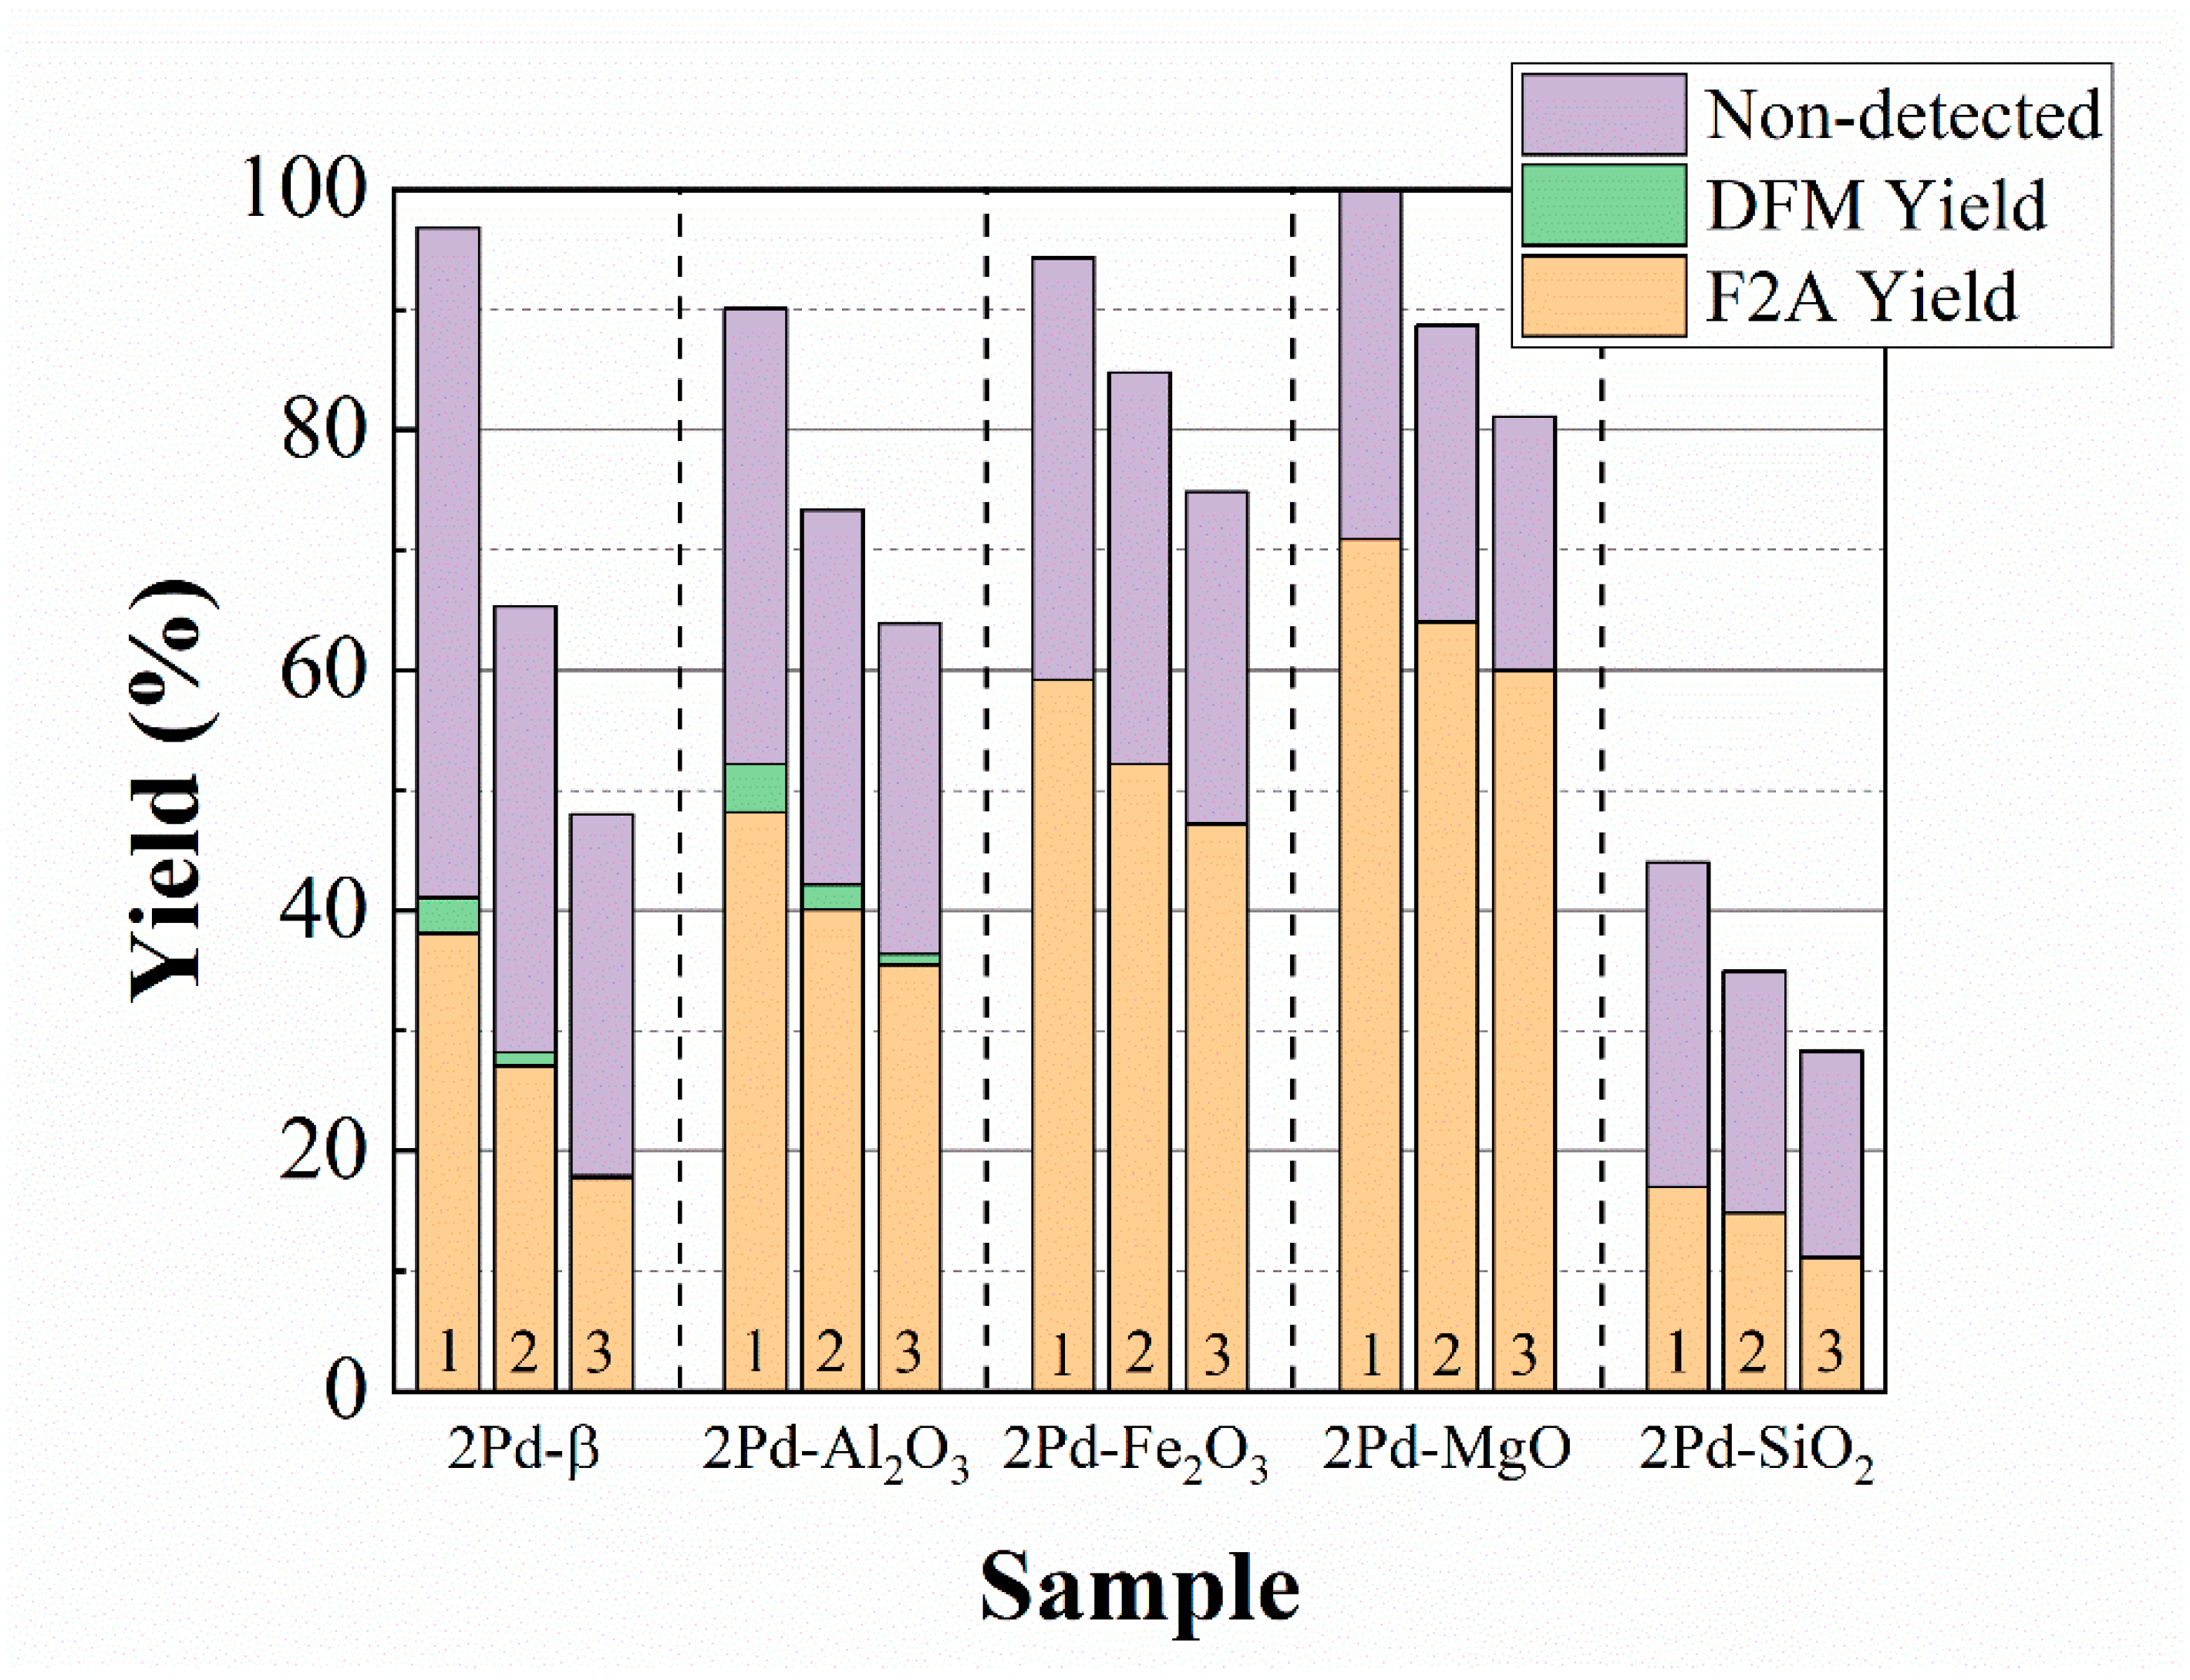
As Pd-based catalysts are quite expensive, the goal must be the development of catalytic systems that have low Pd content and, in turn, are reusable to extend their life cycles to obtain economically sustainable and competitive catalysts. Thus, the following study was focused on the catalyst evaluation during several reaction cycles. Between each cycle, the catalyst was washed with water and dried at 80 °C to be able to eliminate the excess Na
2CO
3 existing in the reaction medium. The catalytic results, compiled in
Figure 10, show how the FUR conversion decreases after each run in all cases. This decay is more pronounced in the case of the 2Pd-β catalyst, where the conversion decreased from 97 to 47% after only three cycles. This decrease also takes place in other catalyst such as 2Pd-Al
2O
3 and 2Pd-Fe
2O
3 although it was more gradual, reaching conversions of 64 and 75%, respectively, after three cycles. The less prone catalyst to suffer deactivation was 2Pd-MgO, since the FUR conversion only diminishes from 100 to 81% after three cycles. In the case of 2Pd-SiO
2, in spite of this catalyst displays lower conversion values, FUR conversion follows the same pattern to that observed for the other catalysts, diminishing from 44 to 28%. With regard to the obtained products, it can be observed a high amount of non-detected products in all cases, although it seems that the proportion of undetected products, as well as the deactivation degree, are related to the amount of acid sites. Thus, the 2Pd-β catalyst is the most prone to suffer deactivation as a consequence of the high proportion of non-detected products, which must adsorb on the catalyst surface, in such a way that the active sites are partially blocked, diminishing the amount of available Pd sites. The decrease in catalytic activity could also be ascribed to the leaching of Pd species. However, the amount of Pd in the reaction medium was quantified by ICP-MS for the catalyst with stronger deactivation (2Pd-β), being negligible, with only 0.0009% of leached Pd species.
The analysis of reaction products shows that F2A is the only detected product in the case of 2Pd-MgO, 2Pd-SiO2, and 2Pd-Fe2O3, while it was the main product for 2Pd-β and 2Pd-Al2O3. F2A yield follows the same trend to that observed for FUR conversion in all catalysts. F2A yield in the most active catalyst (2Pd-MgO) decreases from 71 and 60% (170 °C and 3 h) after three cycles. In the case of the catalysts with higher acidity, a more pronounced decay of the F2A with the reusing is observed. In addition, these catalysts with higher acidity also show the presence of small proportions of DFM, coming from C–C coupling reaction of F2A, although this product tends to disappear after several runs.
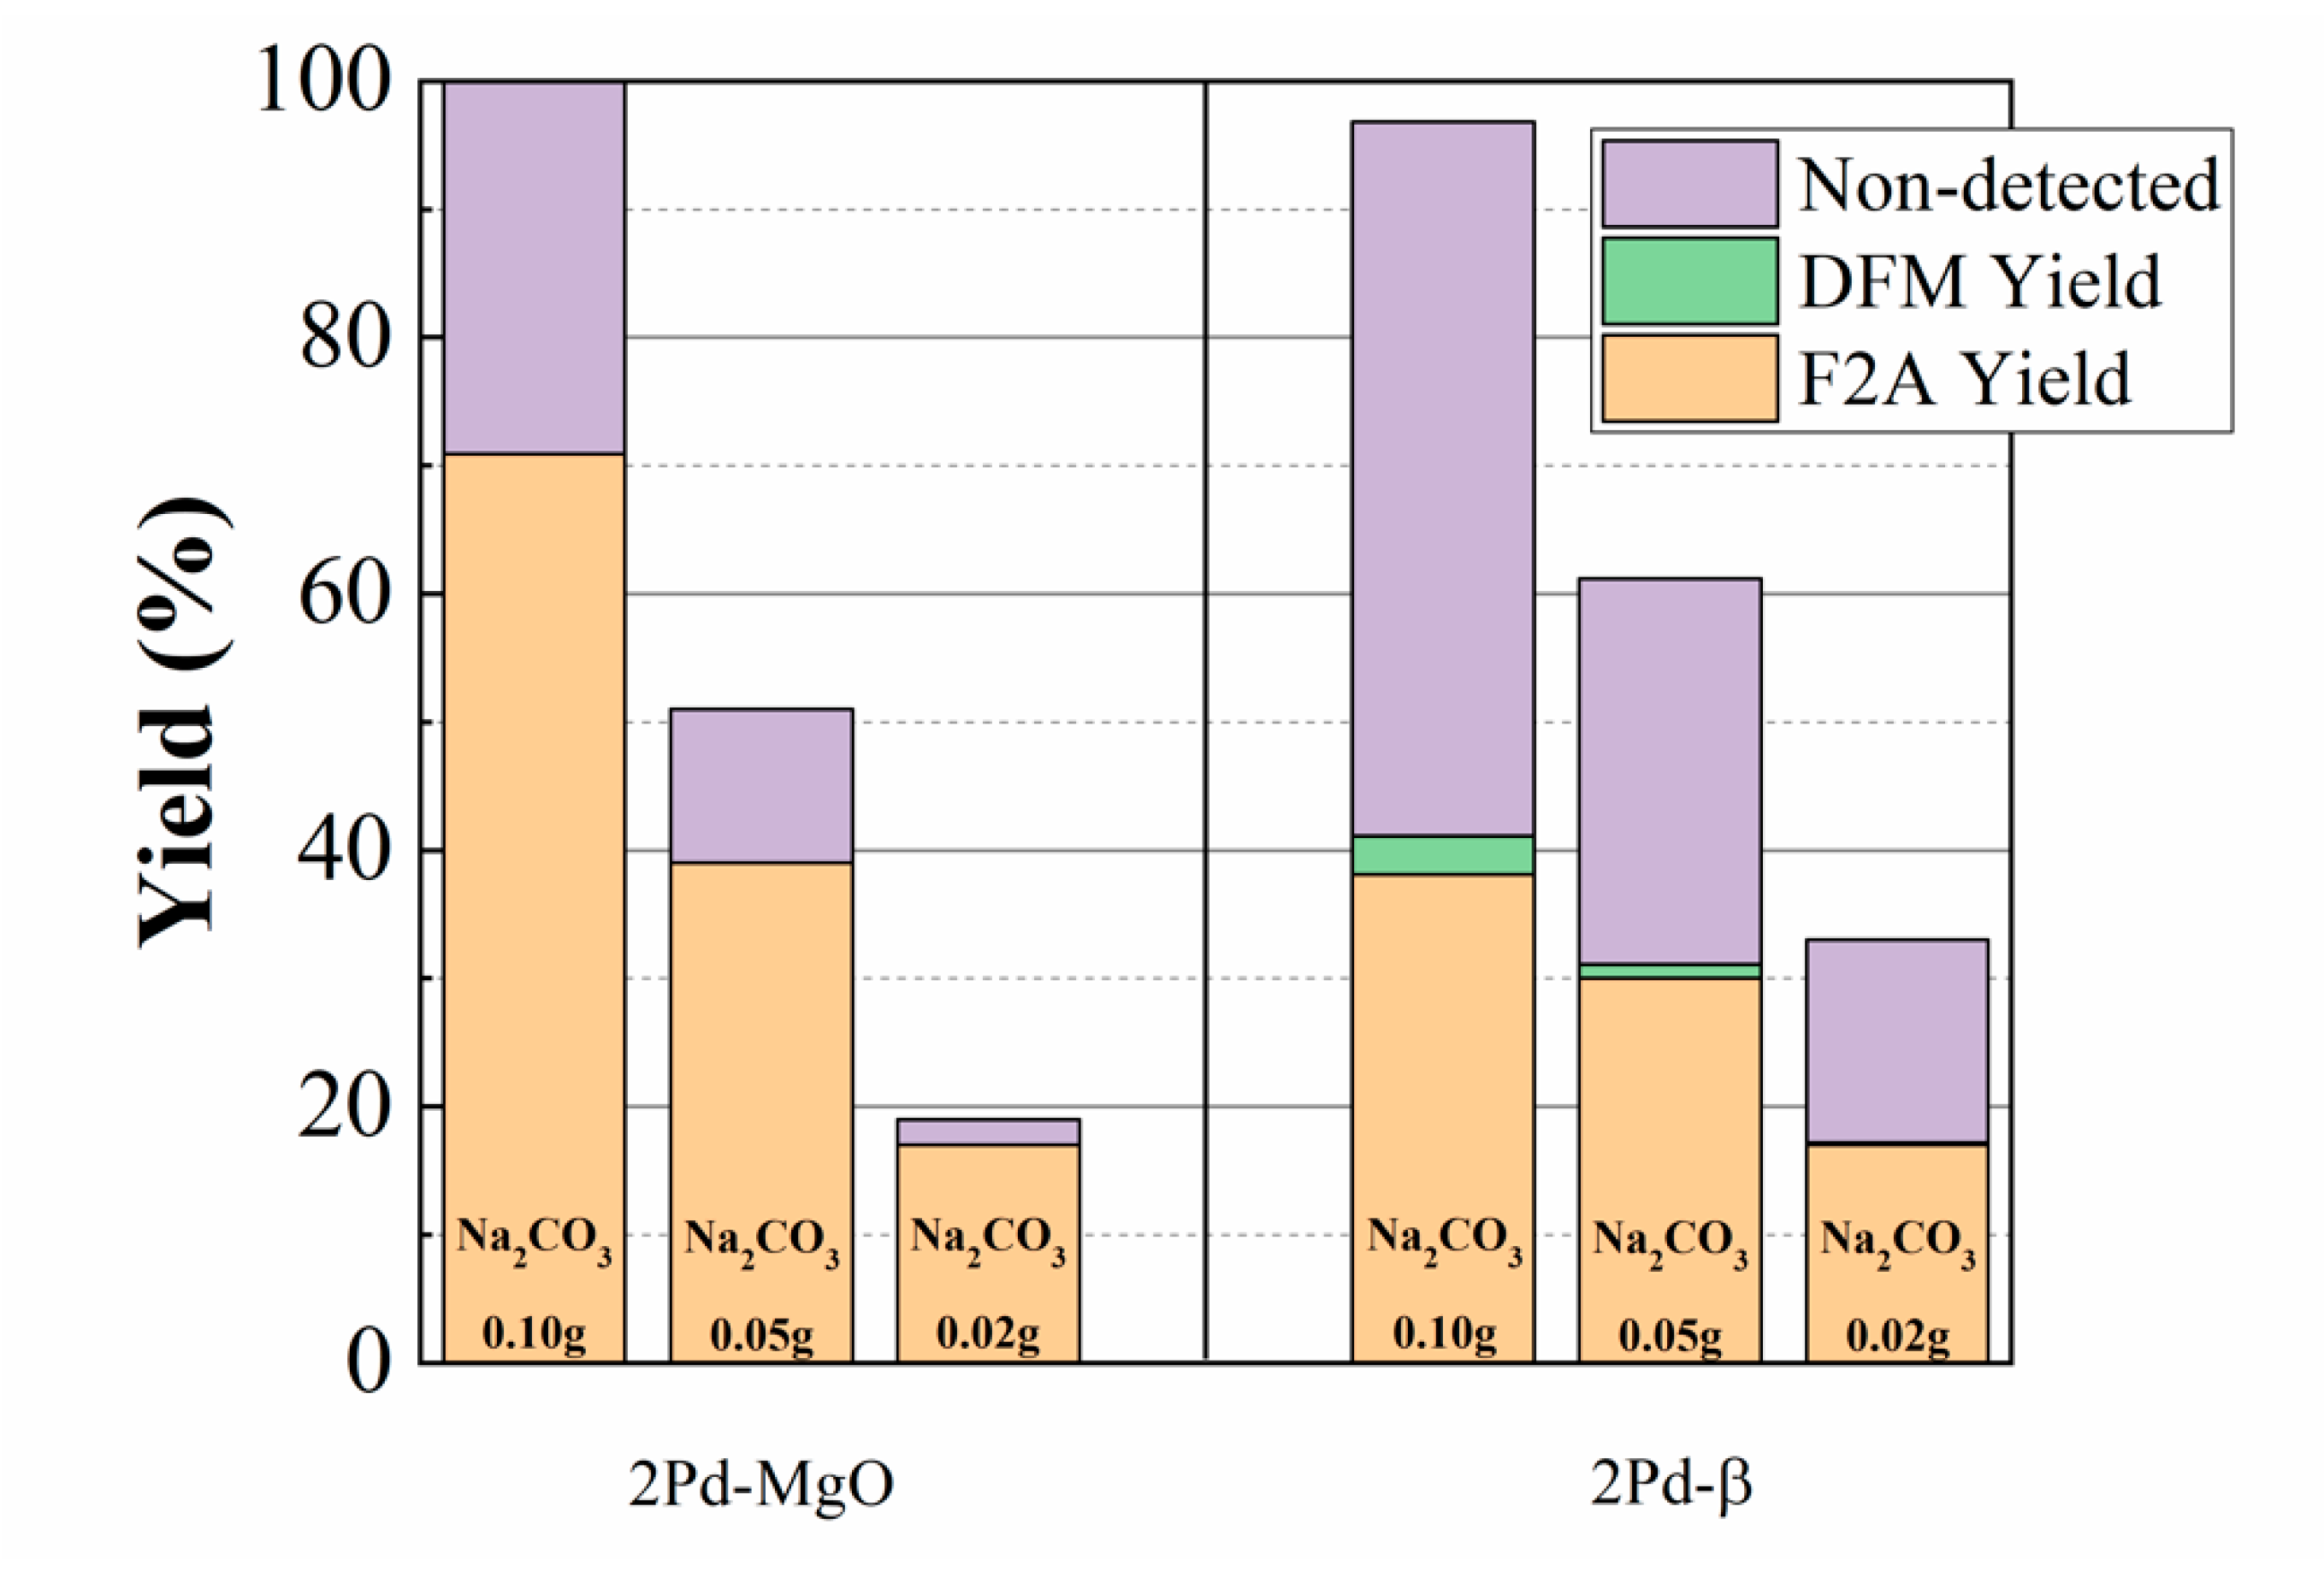
The effect of the Na
2CO
3 addition was also evaluated (
Figure 11), and an important decrease in the yield of target product (F2A) was observed. Moreover, the trend concerning the influence of the acid-base properties of the support was also confirmed. The diminishing of non-detected products with a lower amount of added base is also noteworthy. Thus, for example, with 0.02 g of Na
2CO
3, the use of an acid support, such as β-zeolite, resulted in a yield of F2A similar to that achieved with MgO, but with a higher proportion of non-detected products. In the absence of catalyst, neither F2A nor DFM were produced, although furfural polymerization could take place, as would be inferred from a furfural conversion of 45%.
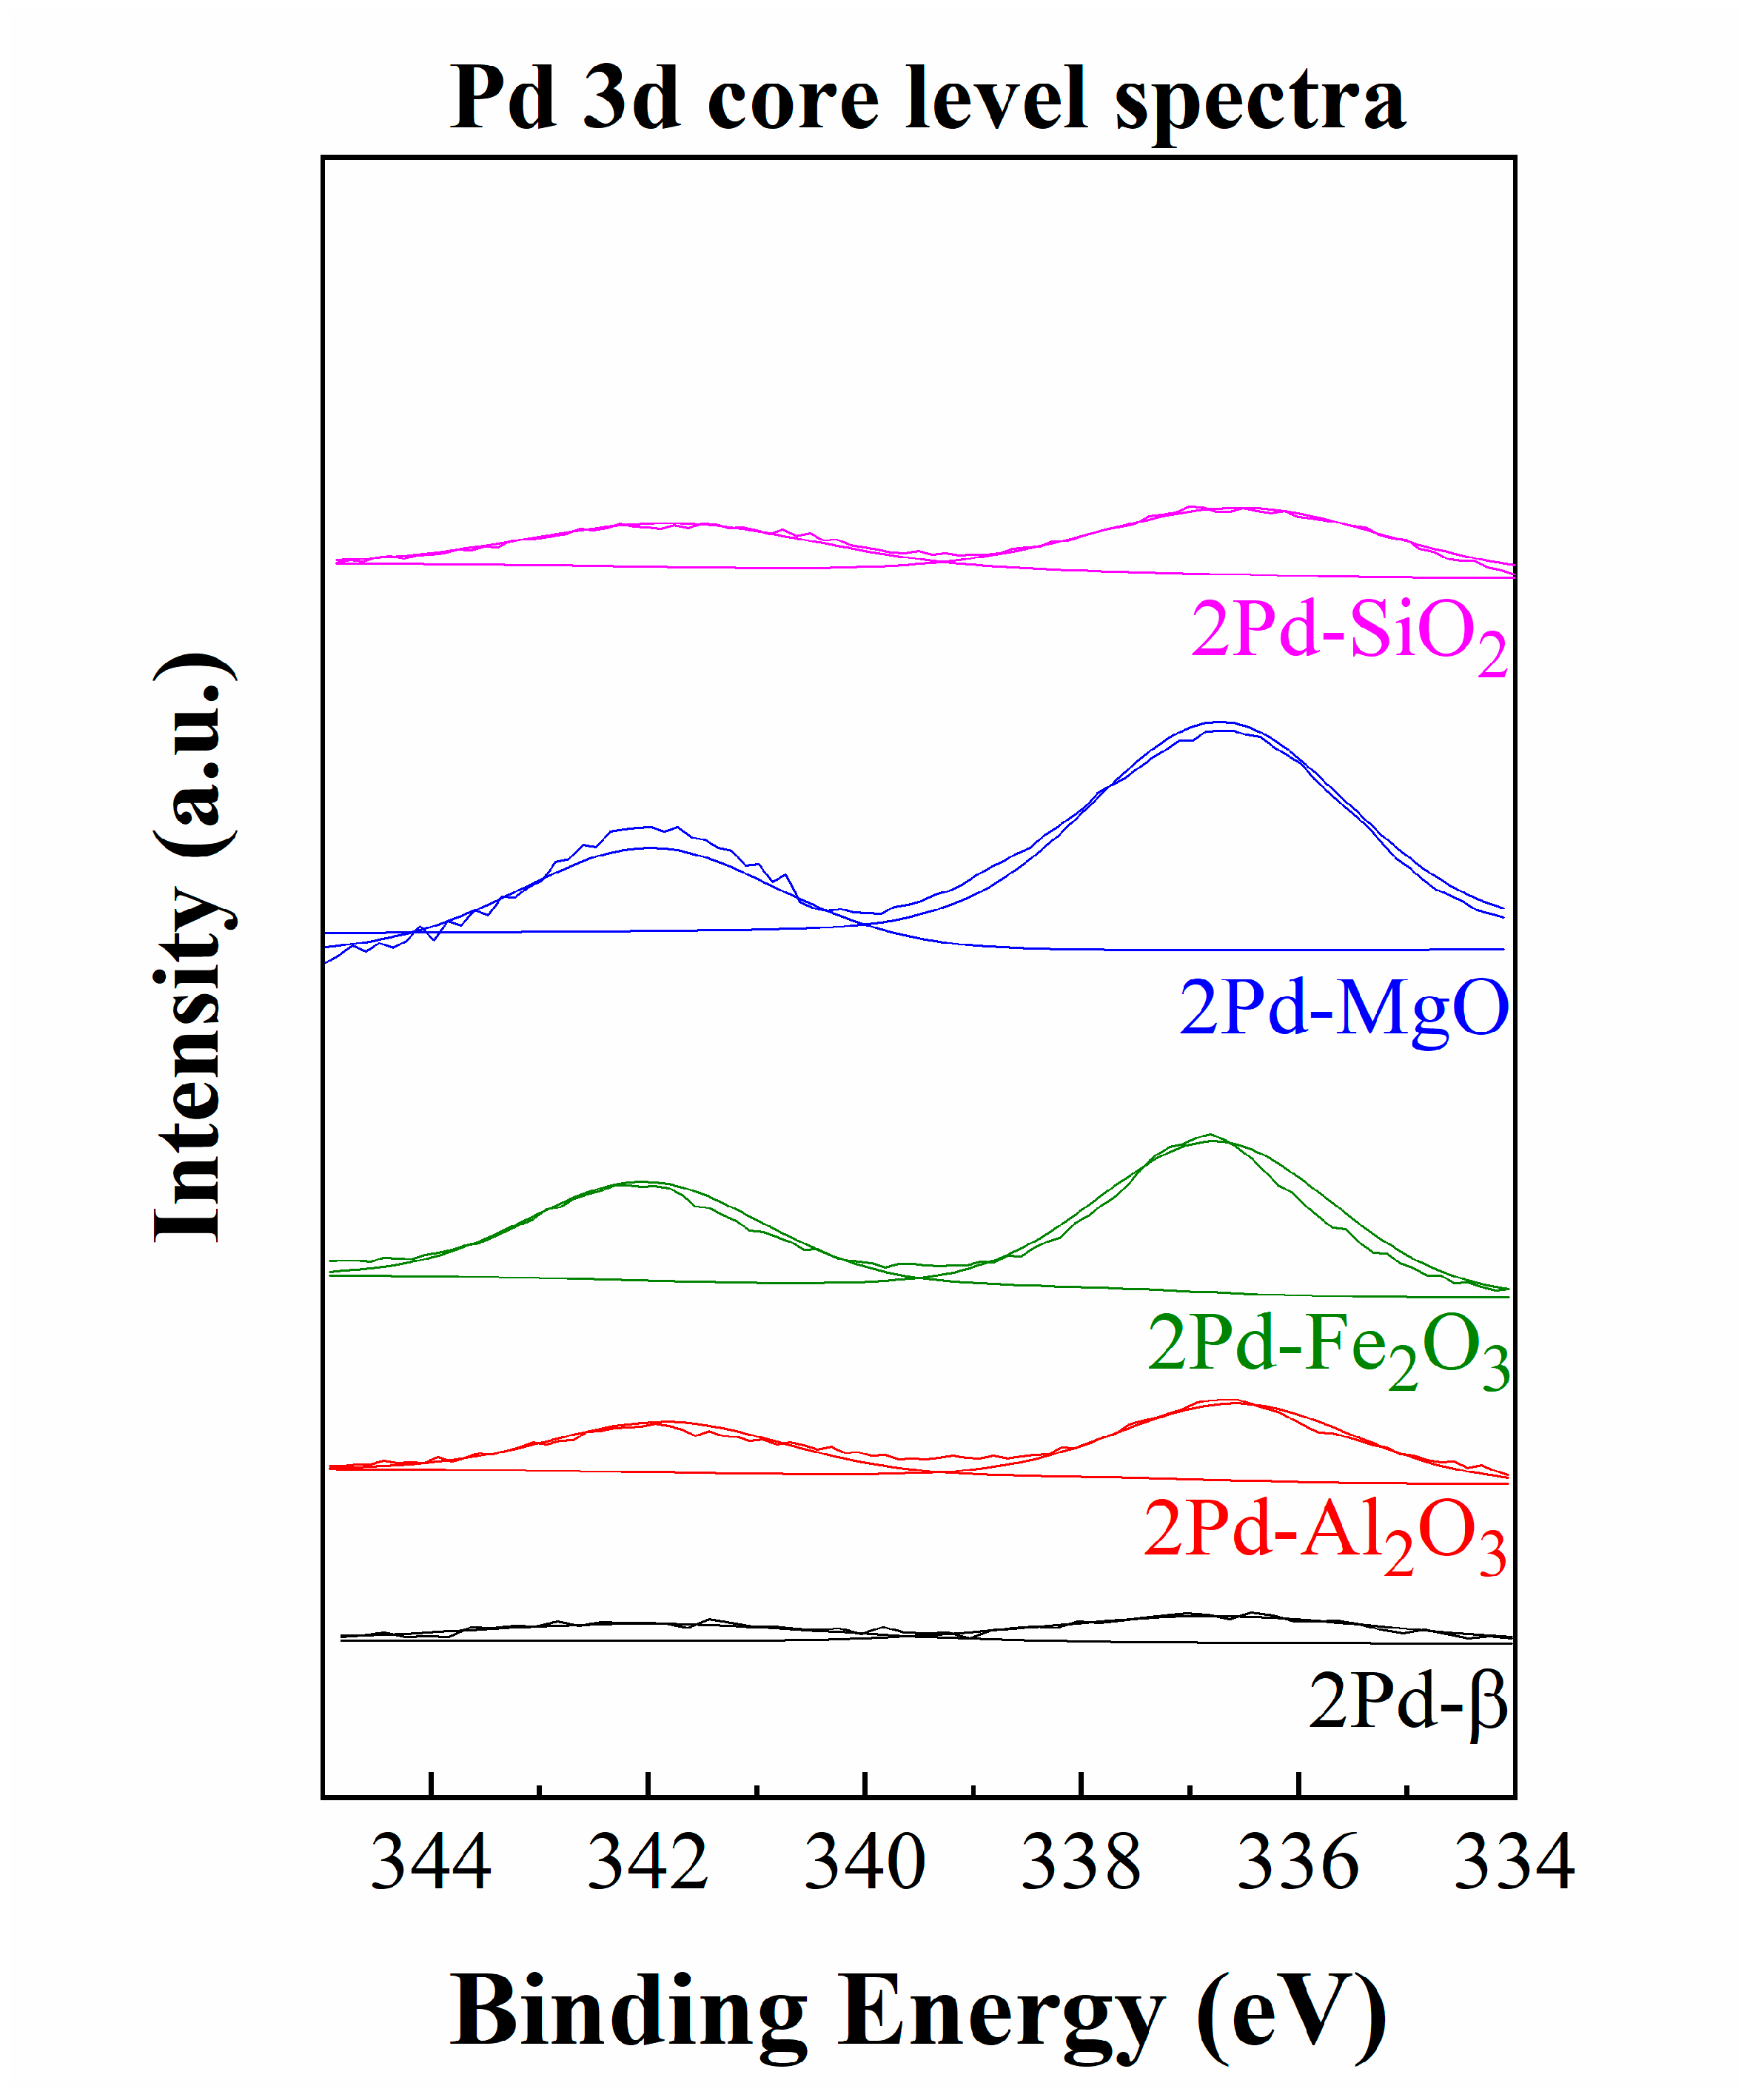
In order to study the evolution of the active phase during the oxidative condensation of FUR, catalysts were collected after 3 h of reaction at 170 °C and analyzed by XPS (
Table 4,
Figure 12 and
Figure 13). In all cases, an increase in surface C content is observed. In fact, a correlation between the surface carbon deposition and deactivation after several reaction cycles seems to exist (
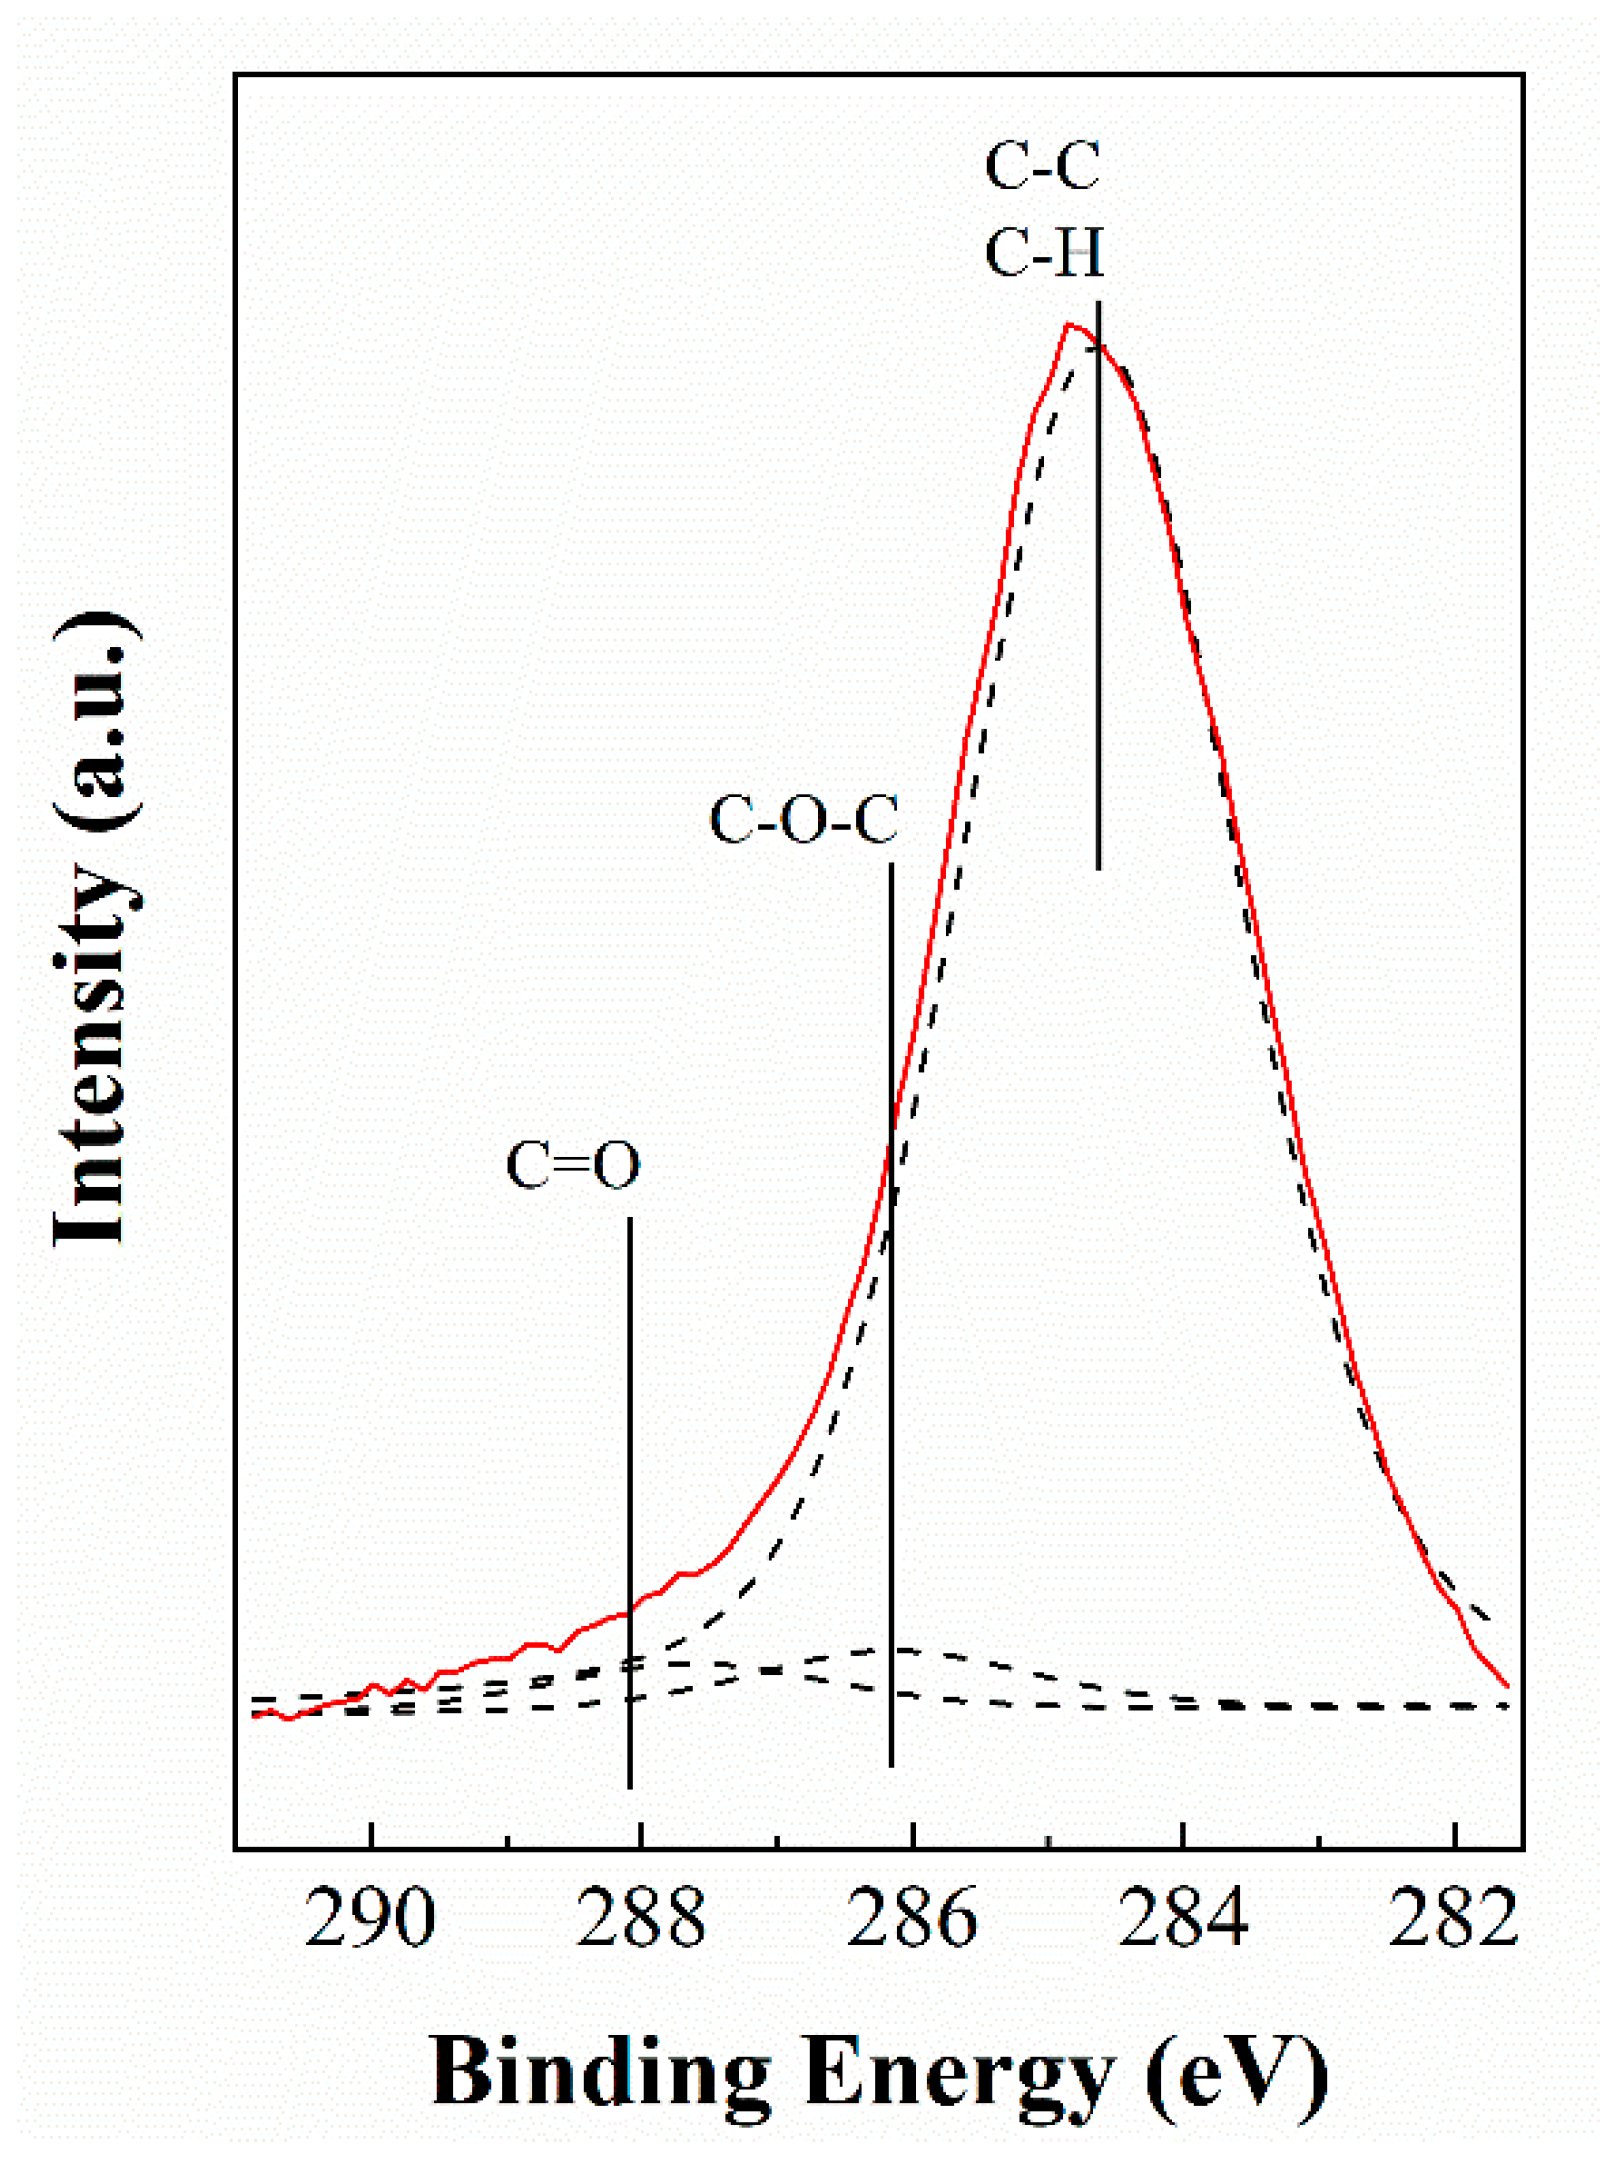
Figure 12). Moreover, the C 1s region is composed by a main band located at 284.8 eV, which is assigned to C–C and C–H bonds, and other much less intense contributions are located at 286.2 and 287.8 eV, due to –C–O–C– and –C=O, respectively [
46,
47]. This could point out the deposition of FUR, as well as some products obtained from the FUR polymerization due to the presence of an oxidizing reaction medium. With regards to the other core level spectra (Si 2p, Al 2p, Mg 2p, and Fe 2p), these remained unchanged after the reaction, confirming that the supports are stable under these experimental conditions. However, the atomic concentrations are lower than those observed for the catalysts before the reaction, as a consequence of the formation of carbonaceous deposits on the catalyst surface.
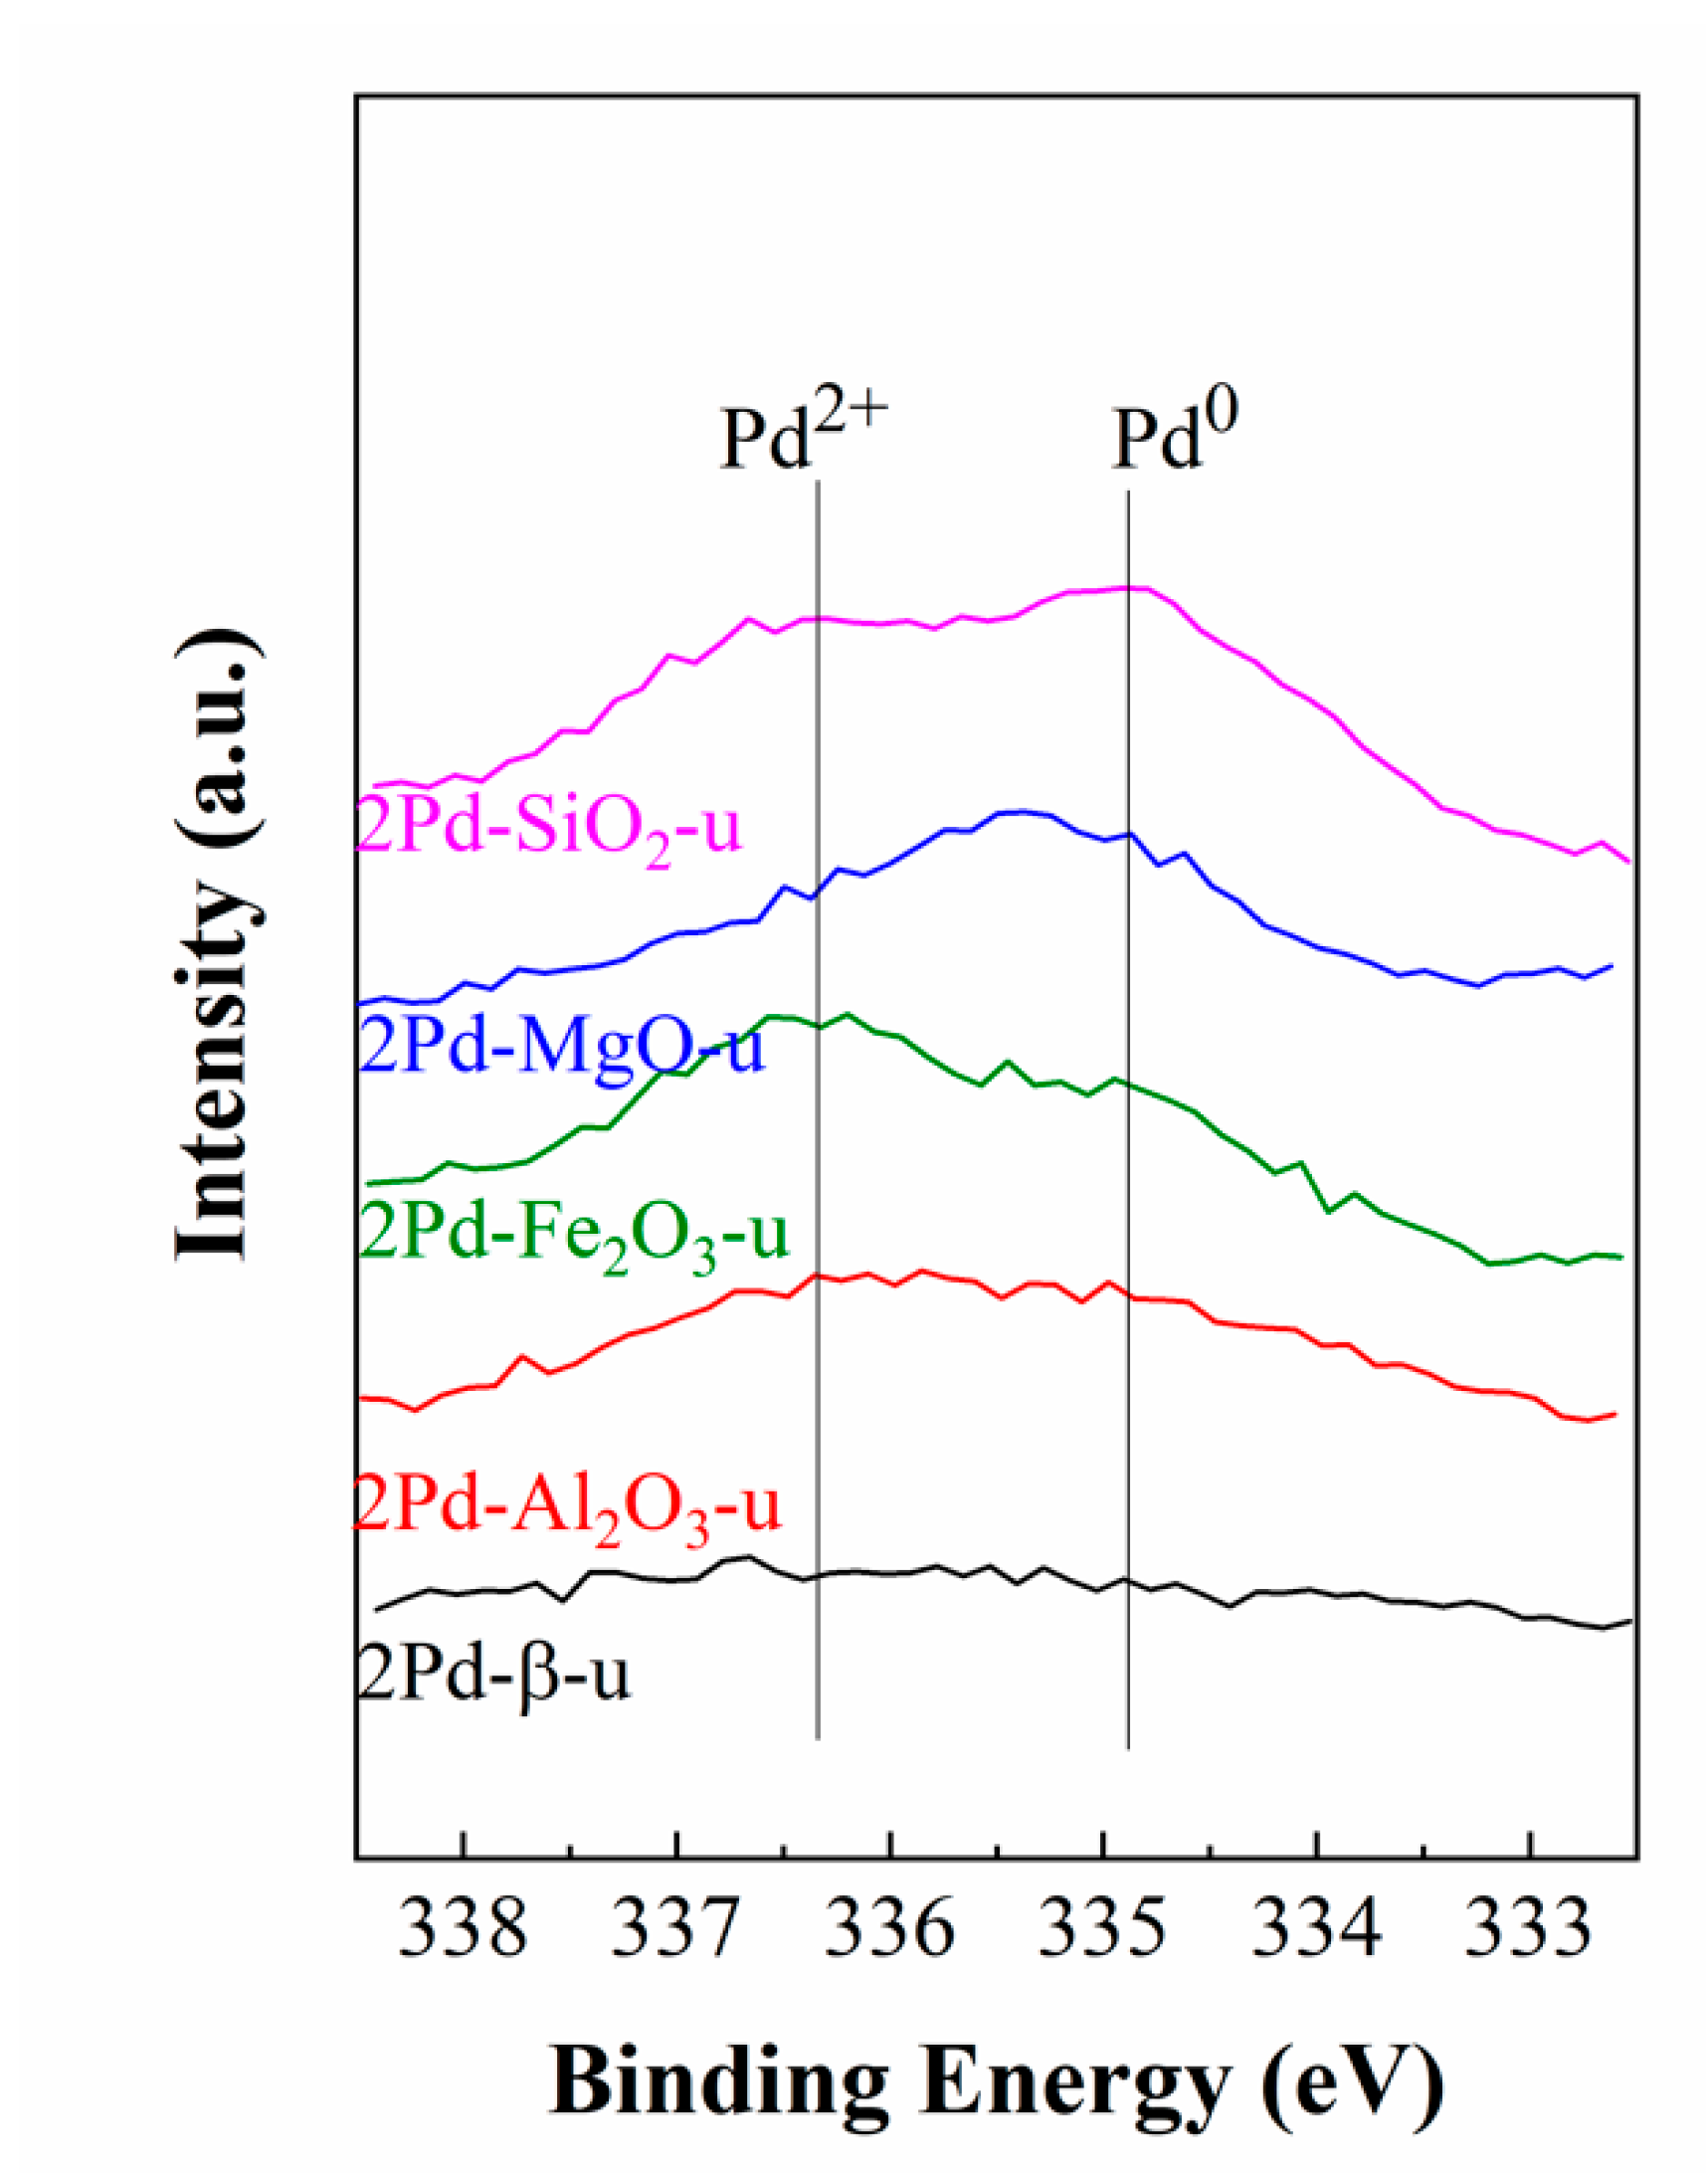
The Pd 3d core level spectra (
Figure 13) suffer modifications in comparison to those obtained before the reaction, since the presence of Pd
0 and Pd
2+ can be observed. In this sense, it is difficult to elucidate the phenomena involved in this process, since, on the one hand, the reaction medium is oxidant. This fact should allow the Pd
2+ to remain oxidized. On the other hand, the solvent/reagent used in the reaction is ethanol, and it is well-known that alcohols are used as reducing agents to reduce transition metals (M
x+ → M
0). In addition, the X-ray irradiation of the XPS can also cause the photo-reduction in the Pd
2+ species, although, in any case, this last suggestion must be ruled out because no photo-reduction phenomena were observed in the catalysts before the oxidative condensation reaction. Therefore, the only explanation for the presence of Pd(0) would be the reduction due to the alcohol. Moreover, the decrease in surface Pd content can be explained by the deposition of carbonaceous species on the catalyst surface.
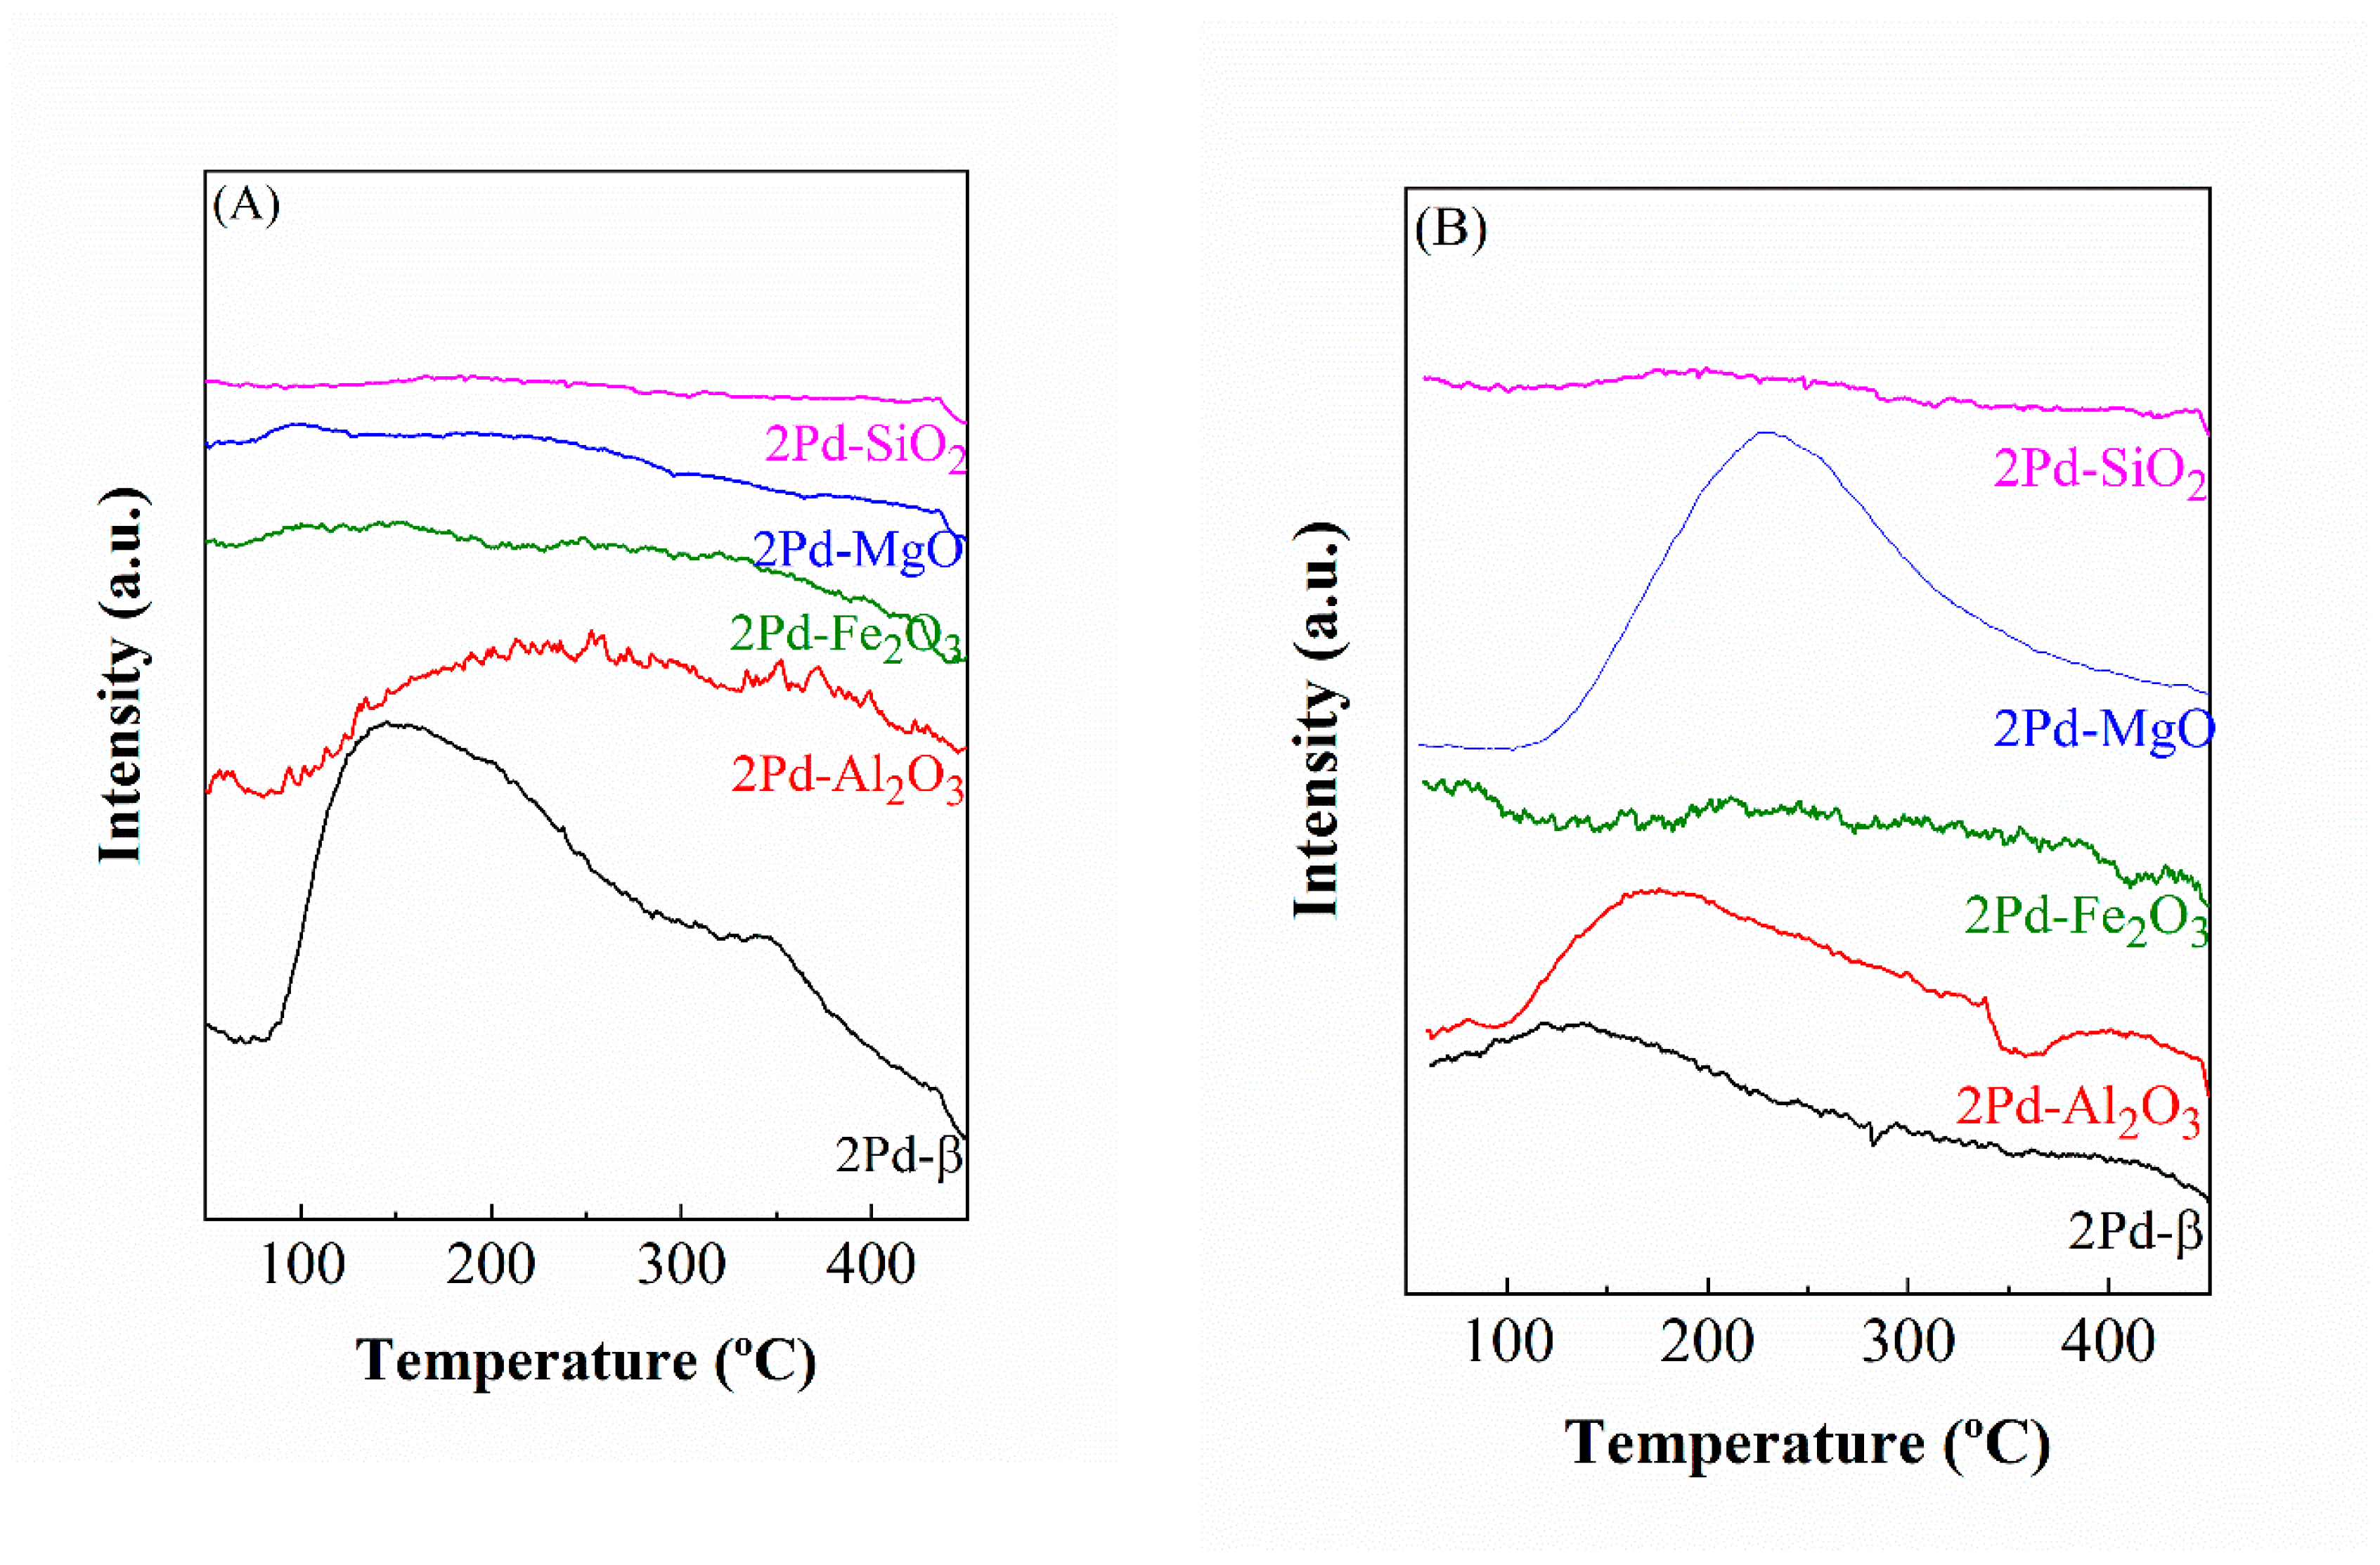
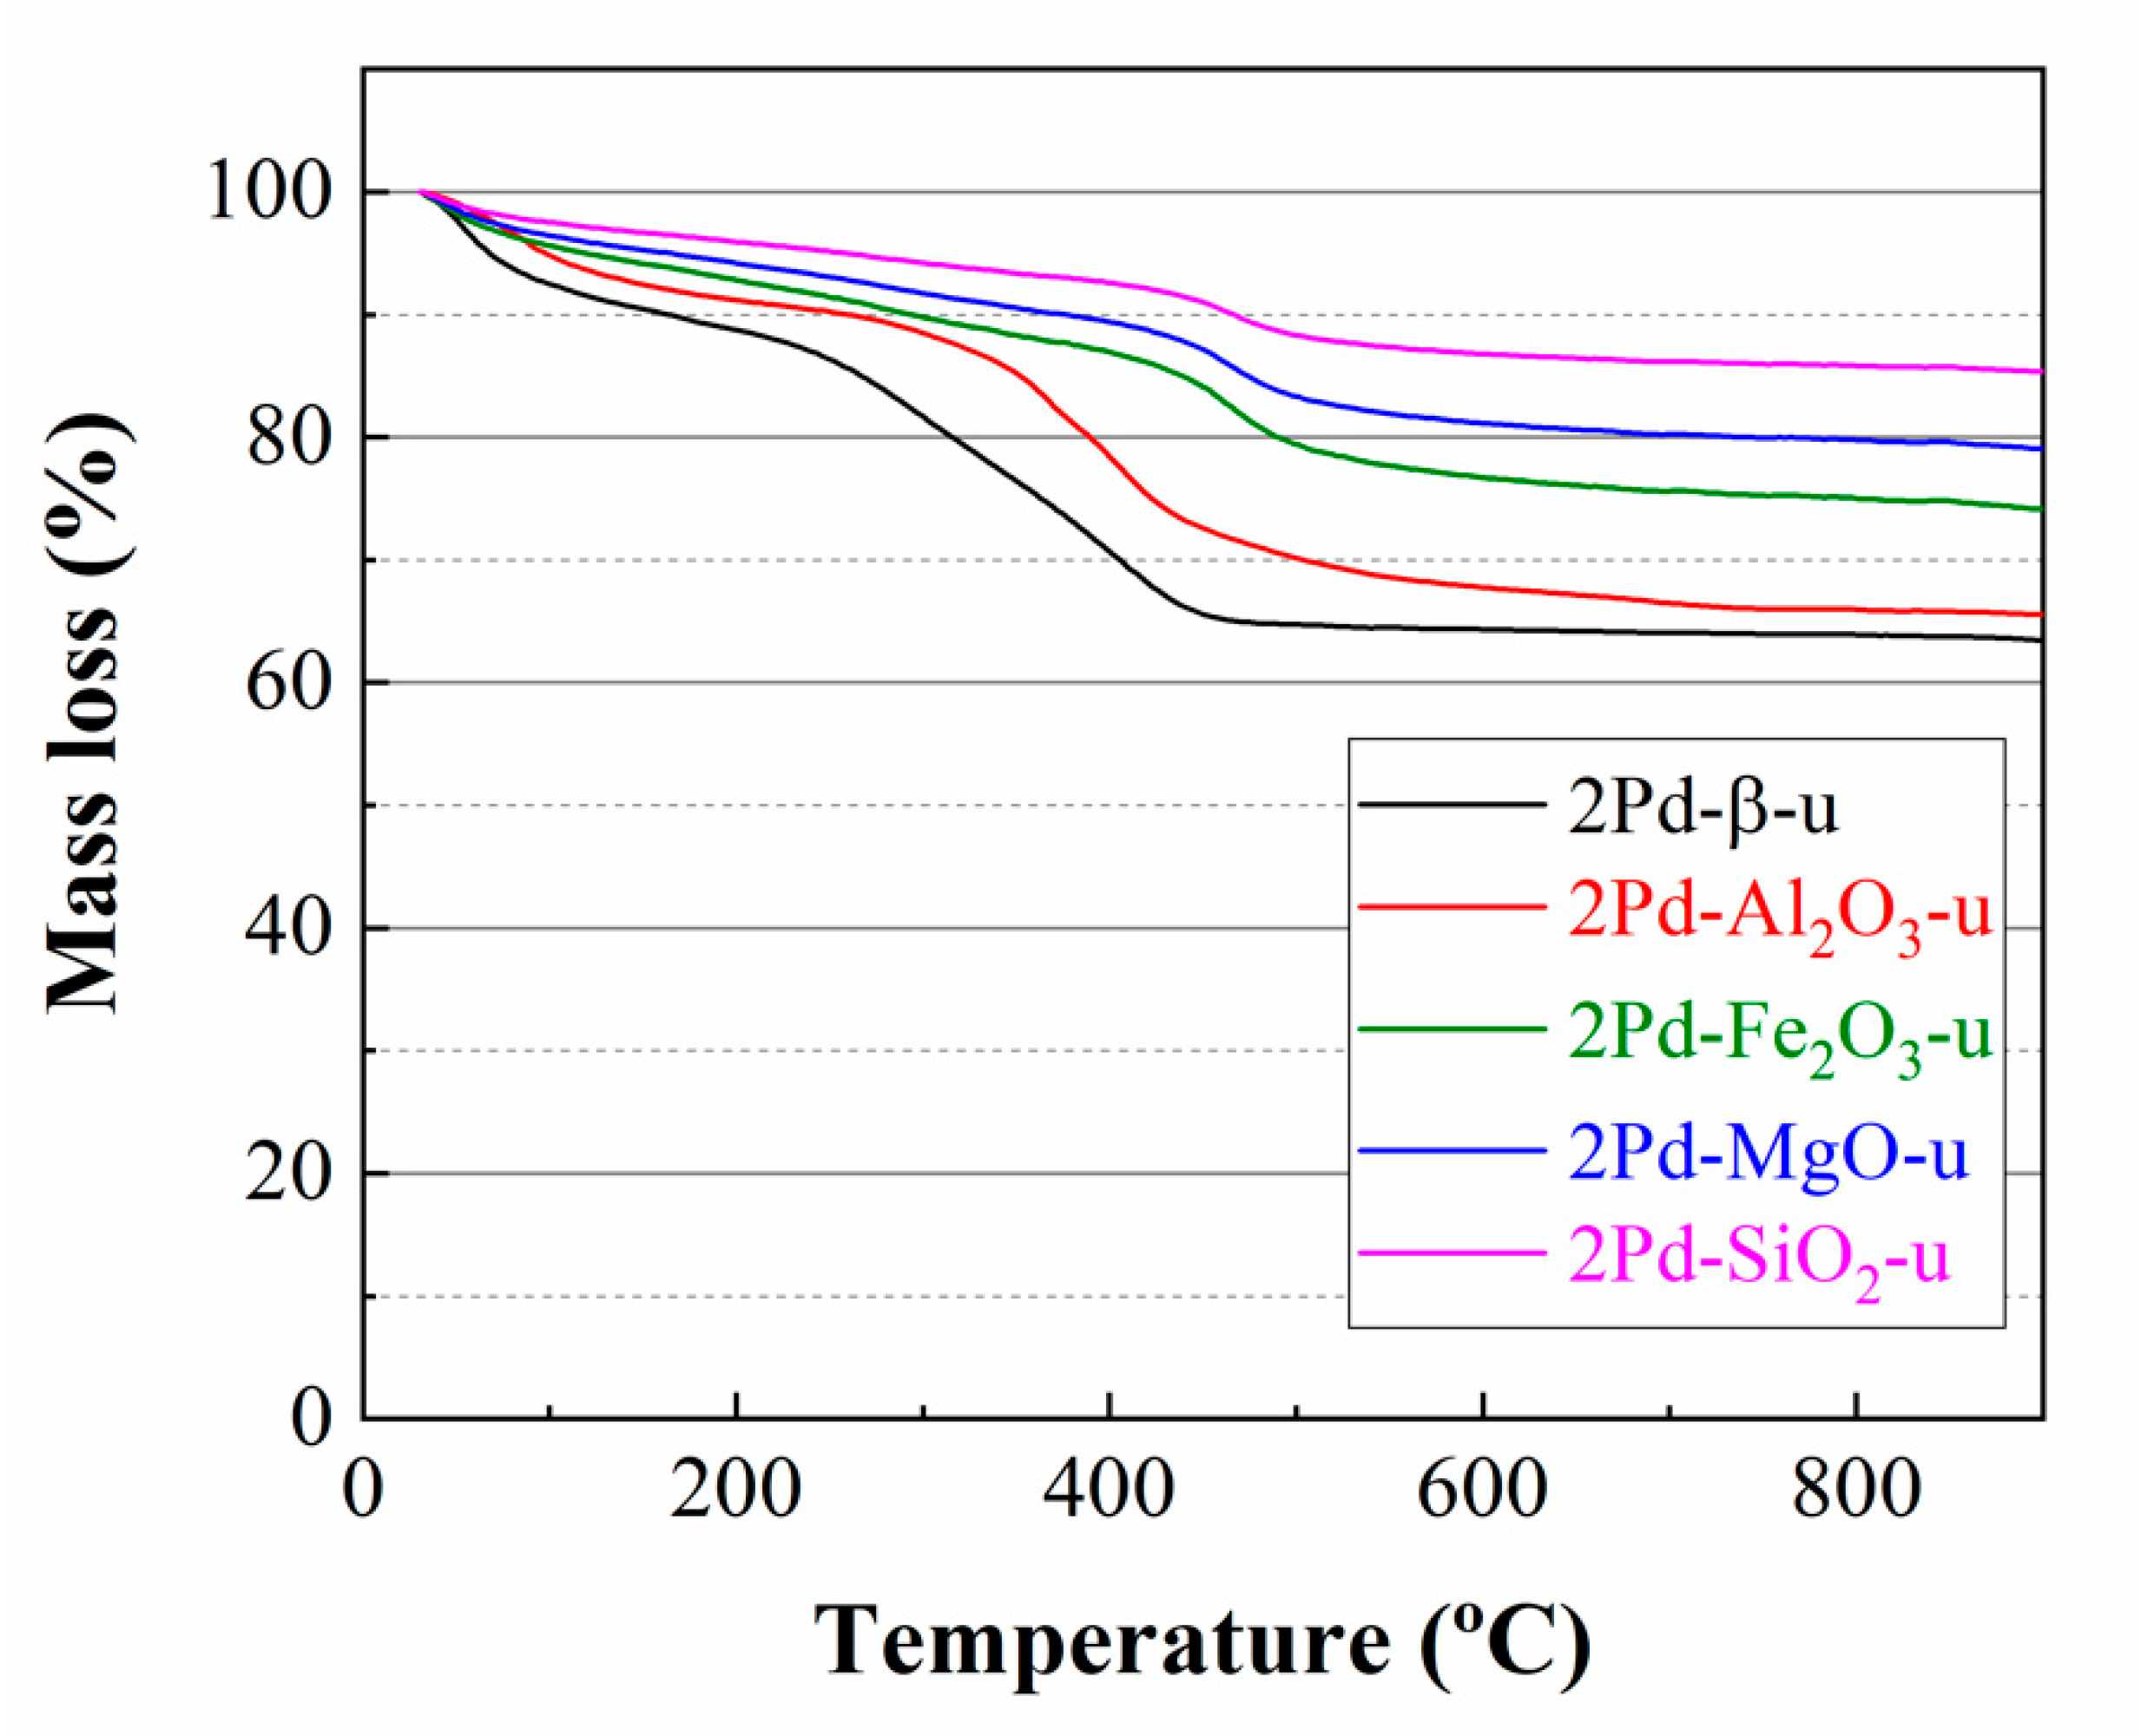
The carbon content of used Pd-based catalysts was also analyzed by thermogravimetric (TG) analysis (
Figure 14). In all cases, a broad band between 250 °C and 450 °C can be observed, which could be ascribed to the overlapping of the desorption of chemisorbed FUR [
48] and the combustion of the carbonaceous deposits [
46]. Thermogravimetric (TG) measurements of the used catalysts follow the same trend to that observed by XPS (
Table 4), where the catalysts with higher proportion of mass loss also are those with higher proportion of C content on their surface. In the same way, the mass loss is also directly related to the amount acid sites, as a consequence of the stronger interaction with the FUR molecules, as well as the formation of carbonaceous species.
4. Materials and Methods
4.1. Synthesis of the Catalysts
Pd-based catalysts were synthesized from PdCl2 (Pressure Chemical CO., Smallman St., Pittsburgh, PA, USA), which was dissolved in HCl (VWR, Fontenay sous Bois, France) to obtain a solution of H2PdCl4 0.01 M. Then, this acid was used to incorporate Pd species on several supports, such as SiO2, Al2O3, MgO, Fe2O3, and β-H-zeolite with a SiO2/Al2O3 molar ratio of 25, by incipient wetness impregnation, incorporating a Pd content ranging between 0.5 and 2 wt.% for all supports. SiO2 (Sigma-Aldrich, Saint Louis, MO, USA), Al2O3 (VWR, West Chester, PA, USA), and MgO (Sigma-Aldrich, Saint Louis, MO, USA) were employed without previous treatment; however, β-H-zeolite was synthesized from its NH4 form (β-NH4+-zeolite) by calcination at 400 °C with a rate of 2 °C min−1. In the case of Fe2O3, this support was synthesized from a solution of FeCl3 (0.2M) (Sigma-Aldrich, Saint Louis, MO, USA), where Fe3+ species have been precipitated by increasing the pH with a 0.5 M NaOH aqueous solution. Then, the obtained solid was filtered, dried overnight at 80 °C, and calcined at 400 °C with a rate of 2 °C min−1 for 2 h.
After incipient wetness impregnation, the catalysts were dried at 80 °C overnight and calcined at 400 °C with a ramp of 2 °C min−1, maintaining this temperature for 2 h. Catalysts were labeled as xPd support, where x is the weight percentage of Pd incorporated to each support.
4.2. Characterization of the Catalysts
The crystallinity of the Pd-based catalysts was determined by X-ray diffraction by using a PANalytical X’Pert PRO diffractometer (Bruker, Rheinstetten, Germany), using the Cu Kα (1.5406 Å) radiation and a germanium monochromator, over a 2θ range with Bragg–Brentano geometry. Average crystallite size and lattice strain values were determined by using the Williamson–Hall equation: B·cosθ = (K·λ/D) + (2·ε·sinθ), where θ is the Bragg angle, B is the full width at half maximum (FWHM) of the XRD peak, K is the Scherrer constant, λ is the wavelength of the X-ray, and ε the lattice strain [
33].
The morphology of the catalysts was evaluated by transmission electronic microscopy (TEM), using a Philips CCM 200 Supertwin DX4 high-resolution (Thermo Fisher Scientific, Waltham, MA, USA). Microanalysis was performed with an EDX Super-X system, with 4 X-ray detectors and an X-FEG beam.
The textural properties of the Pd-based catalysts were determined from their N
2 adsorption–desorption isotherms at −196 °C with an ASAP 2020 model of Micromeritics Inc. (Micrometrics, Norcross, GA, USA). Prior to N
2 adsorption, the sample was outgassed at 200 °C overnight. Specific surface areas were obtained by using the Brunauer–Emmett–Teller (BET) equation, with a cross-section of 16.2 Å
2 for the N
2 molecule [
35]. Pore size distribution profiles were deduced from the density functional theory model (DFT) [
37], and total pore volume from N
2 adsorbed at P/P
0 = 0.996.
The chemical composition on the catalyst surface, including the oxidation state of Pd species, was determined by X-ray photoelectron spectroscopy (XPS). A Physical Electronics PHI5700 spectrometer (Physical Electronics, Eden Prairie, MN, USA), with non-monochromatic Mg Kα radiation (300 W, 15 kV and 1253.6 eV) with a multichannel detector, was employed. Spectra were recorded in the constant pass energy mode, at 39.35 eV using a 720 μm diameter analysis area. Charge referencing was measured against adventitious carbon (C 1 s at 284.8 eV). Acquisition and data analysis were performed with a PHI ACCESS ESCA-V6.0F software package (Eden Prairie, Minnesota, MN, USA), subtracting a Shirley-type background from signals. Gaussian–Lorentzian curves were used for fitting recorded spectra to more accurately determine the binding energies of the different element core levels.
As Pd-based catalysts have been synthesized using a wide variety of supports, the total amount of acid and basic sites was also determined. Thus, thermo-programmed desorption of ammonia (NH3-TPD) was carried out to determinate the total amount of acid sites. For each experiment, 0.08 g of catalyst was placed in a quartz reactor. Prior to the analysis, the sample was cleaned using a He flow of 40 mL·min−1 from room temperature to 400 °C with a heating rate of 10 °C·min−1. Then, the catalyst was cooled until 100 °C under the same He flow, and once the temperature is stabilized at 100 °C, the catalyst was saturated with NH3 for 5 min and later physisorbed NH3 was removed under He flow. NH3 desorption was performed by heating the sample from 100 to 400 °C, with a rate of 10 °C·min−1, registering the signal using a Shimadzu GC-14B instrument (Shimadzu, Kioto, Japan) equipped with a thermal conductivity detector (TCD). In the case of the amount of basic sites, the quantification was carried out by thermoprogrammed desorption of CO2 (CO2-TPD). In each analysis, 0.03 g of catalyst was pretreated under a He flow (40 mL min−1) at 400 °C, maintaining this temperature for 15 min (10 °C·min−1). Later, the sample was cooled to 100 °C and a pure CO2 stream, with a flow of 60 mL min−1, was introduced into the quartz reactor for 30 min. Finally, the amount of CO2 evolved was analyzed using signal using a Shimadzu GC-14B instrument equipped with a thermal conductivity detector (TCD) between 100 and 600 °C with a rate of 10 °C·min−1 under He flow.
Pd leached along the reaction was determined by ICP-MS on Perkin Elmer spectrophotometer (NexION 300D, Waltham, MA, USA), after digestion of samples in an Anton Paar device (Multiwave 3000, Graz, Austria) by using HNO3, HCl and HF.
The TG-DSC data were registered with a Mettler-Toledo (TGA/DSC-1) instrument (Columbus, OH, USA), equipped with a MX5 microbalance, by varying the temperature from room temperature to 900 °C, at a heating rate of 5 °C min−1, under an air flow. Samples were put in open platinum crucibles.
4.3. Catalytic Reaction
The oxidation reaction was performed in glass pressure reactors with thread bushing (Ace, 15 mL) in a temperature-controlled aluminum block under magnetic stirring. In each experiment, 0.05 g of catalyst was mixed with 6 mL of ethanol as alcohol, 0.10 g of base (Na
2CO
3), 0.5 mL of H
2O
2 as oxidant, and 0.02 mL of o-xylene as internal standard. Once the reactions finished, the reactors were removed from the aluminum block and submerged in cool water to stop the catalytic process. Reaction products were microfiltered and analyzed by gas chromatography (Shimadzu GC model 14A, Shimadzu, Kioto, Japan), equipped with a flame ionization detector and a TBR-14 capillary column. FUR conversion, selectivity, and yield were calculated as follows (Equations (1)–(3)):

 ,
, 


