
The Art of Sharing Resources: How to Distribute Water during a Drought Period
Abstract
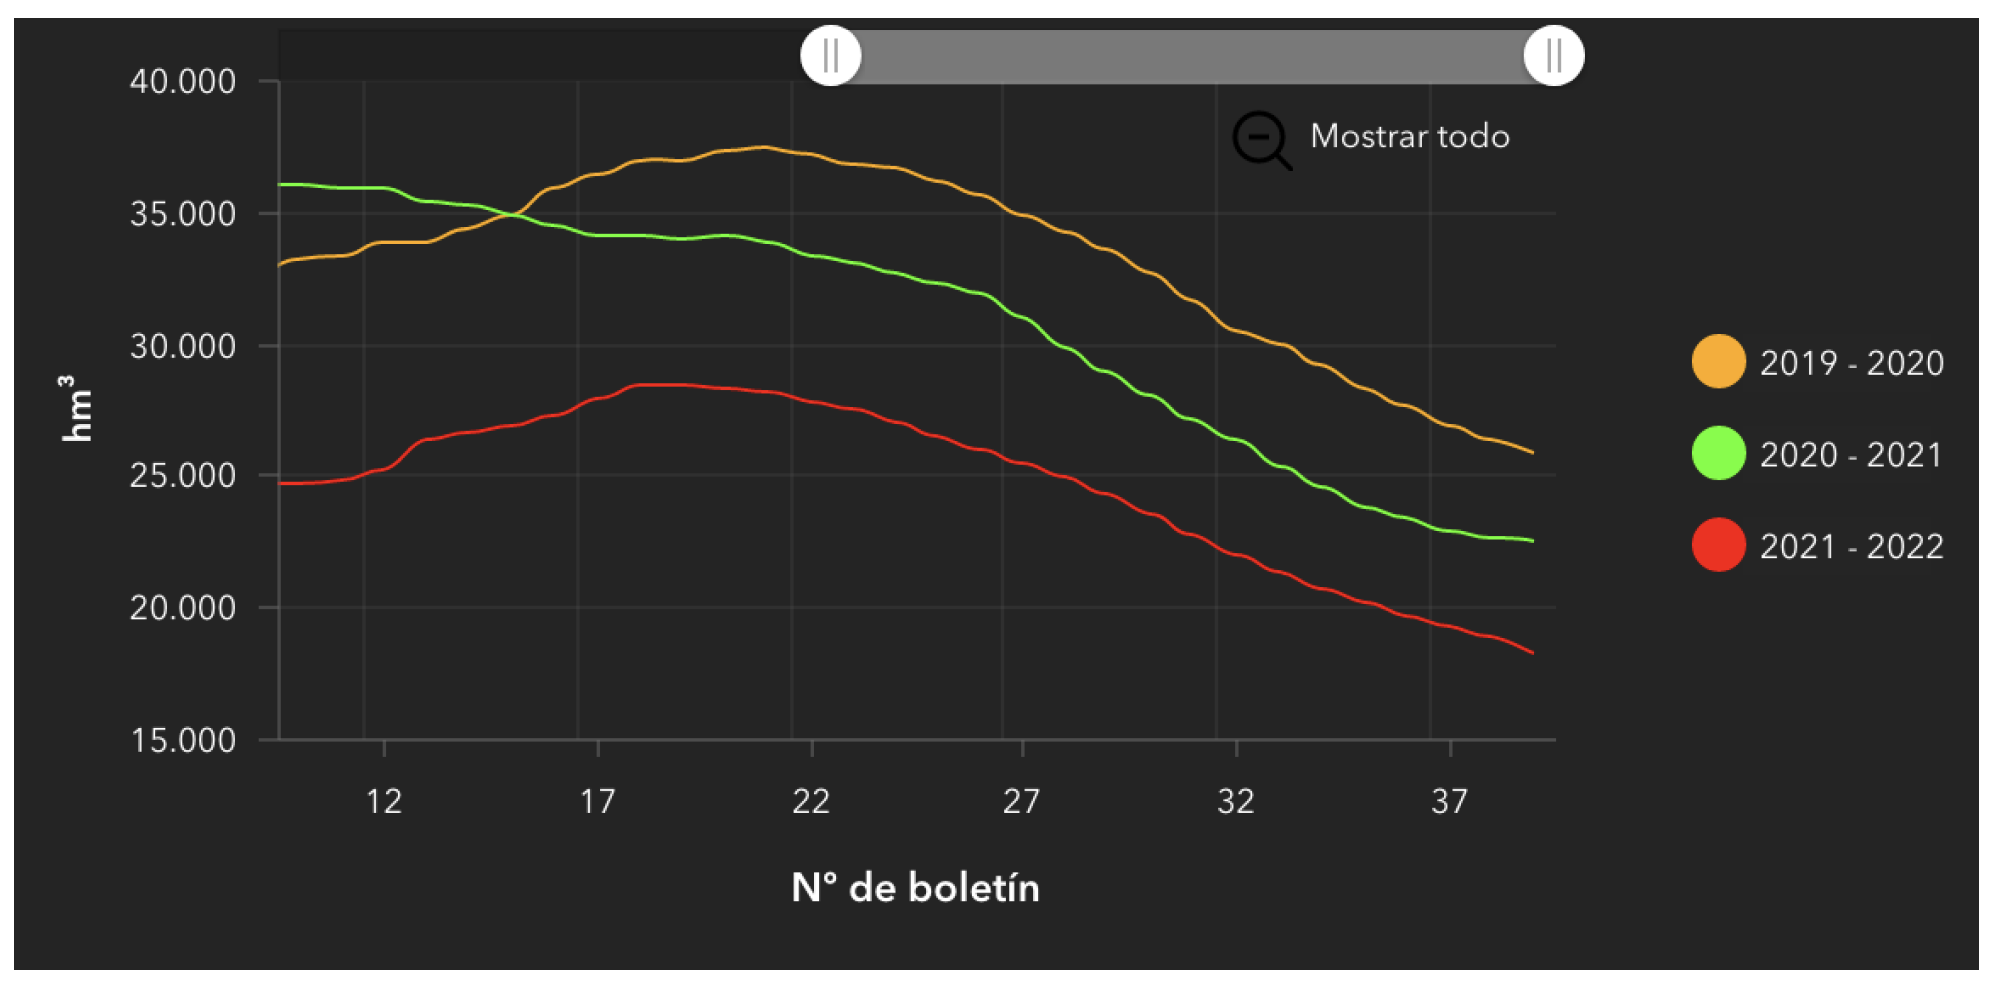
:1. Introduction
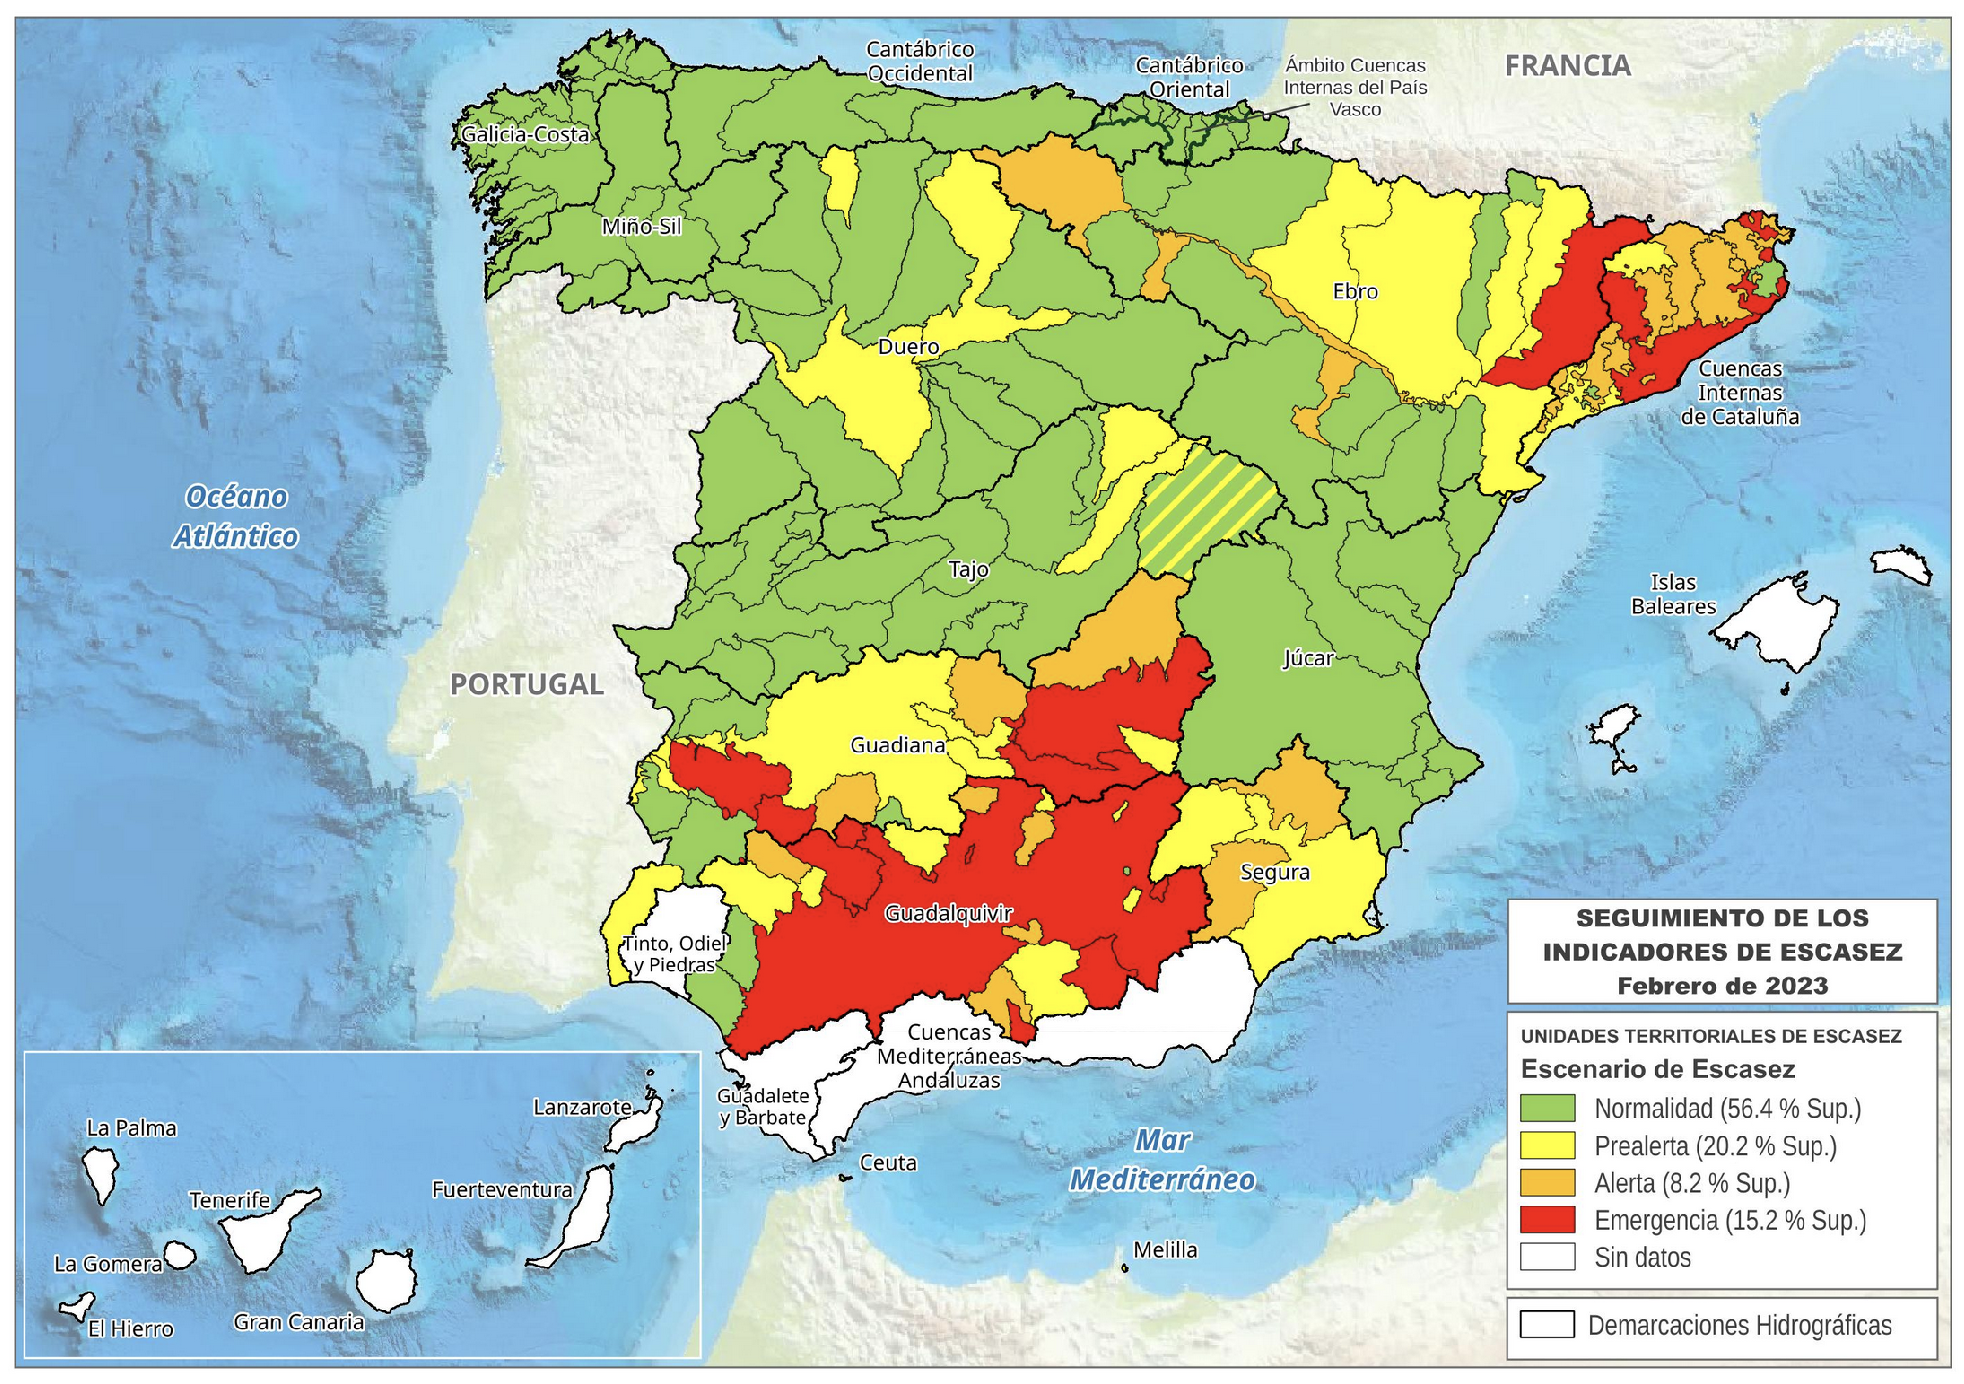
- Normal.
- Pre-alert.
- Alert.
- Emergency.
- Monitoring and controlling measures at all levels.
- Management measures that are considered from the alert level and higher (temporary agreements, specific changes in some concessions, the drafting of a royal decree on a drought, etc.).
- With respect to the alert or emergency levels, restriction measures can be established, such as reducing the irrigation allocation and prioritizing human consumption.
Related Literature
2. Conflicting Claims Problems
- (i)
- (non-negativity and claim-boundedness).
- (ii)
- (efficiency).
The Socially Accepted Properties: Axiomatic Analysis

| Properties/Rules | P | T | |||
|---|---|---|---|---|---|
| Equal treatment of equals | Yes | Yes | Yes | Yes | Yes |
| Anonymity | Yes | Yes | Yes | Yes | Yes |
| Order preservation | Yes | Yes | Yes | Yes | Yes |
| Resource monotonicity | Yes | Yes | Yes | Yes | Yes |
| Reasonable lower bounds on awards | No | Yes | No | Yes | Yes |
| Composition down | Yes | Yes | Yes | No | Yes |
| Claims truncation invariance | No | Yes | No | Yes | No |
| Claim monotonicity | Yes | Yes | Yes | Yes | Yes |
3. The Distribution of Riudecanyes Reservoir Water as a Conflicting Claims Problem
4. Results
4.1. Coefficient of Variation
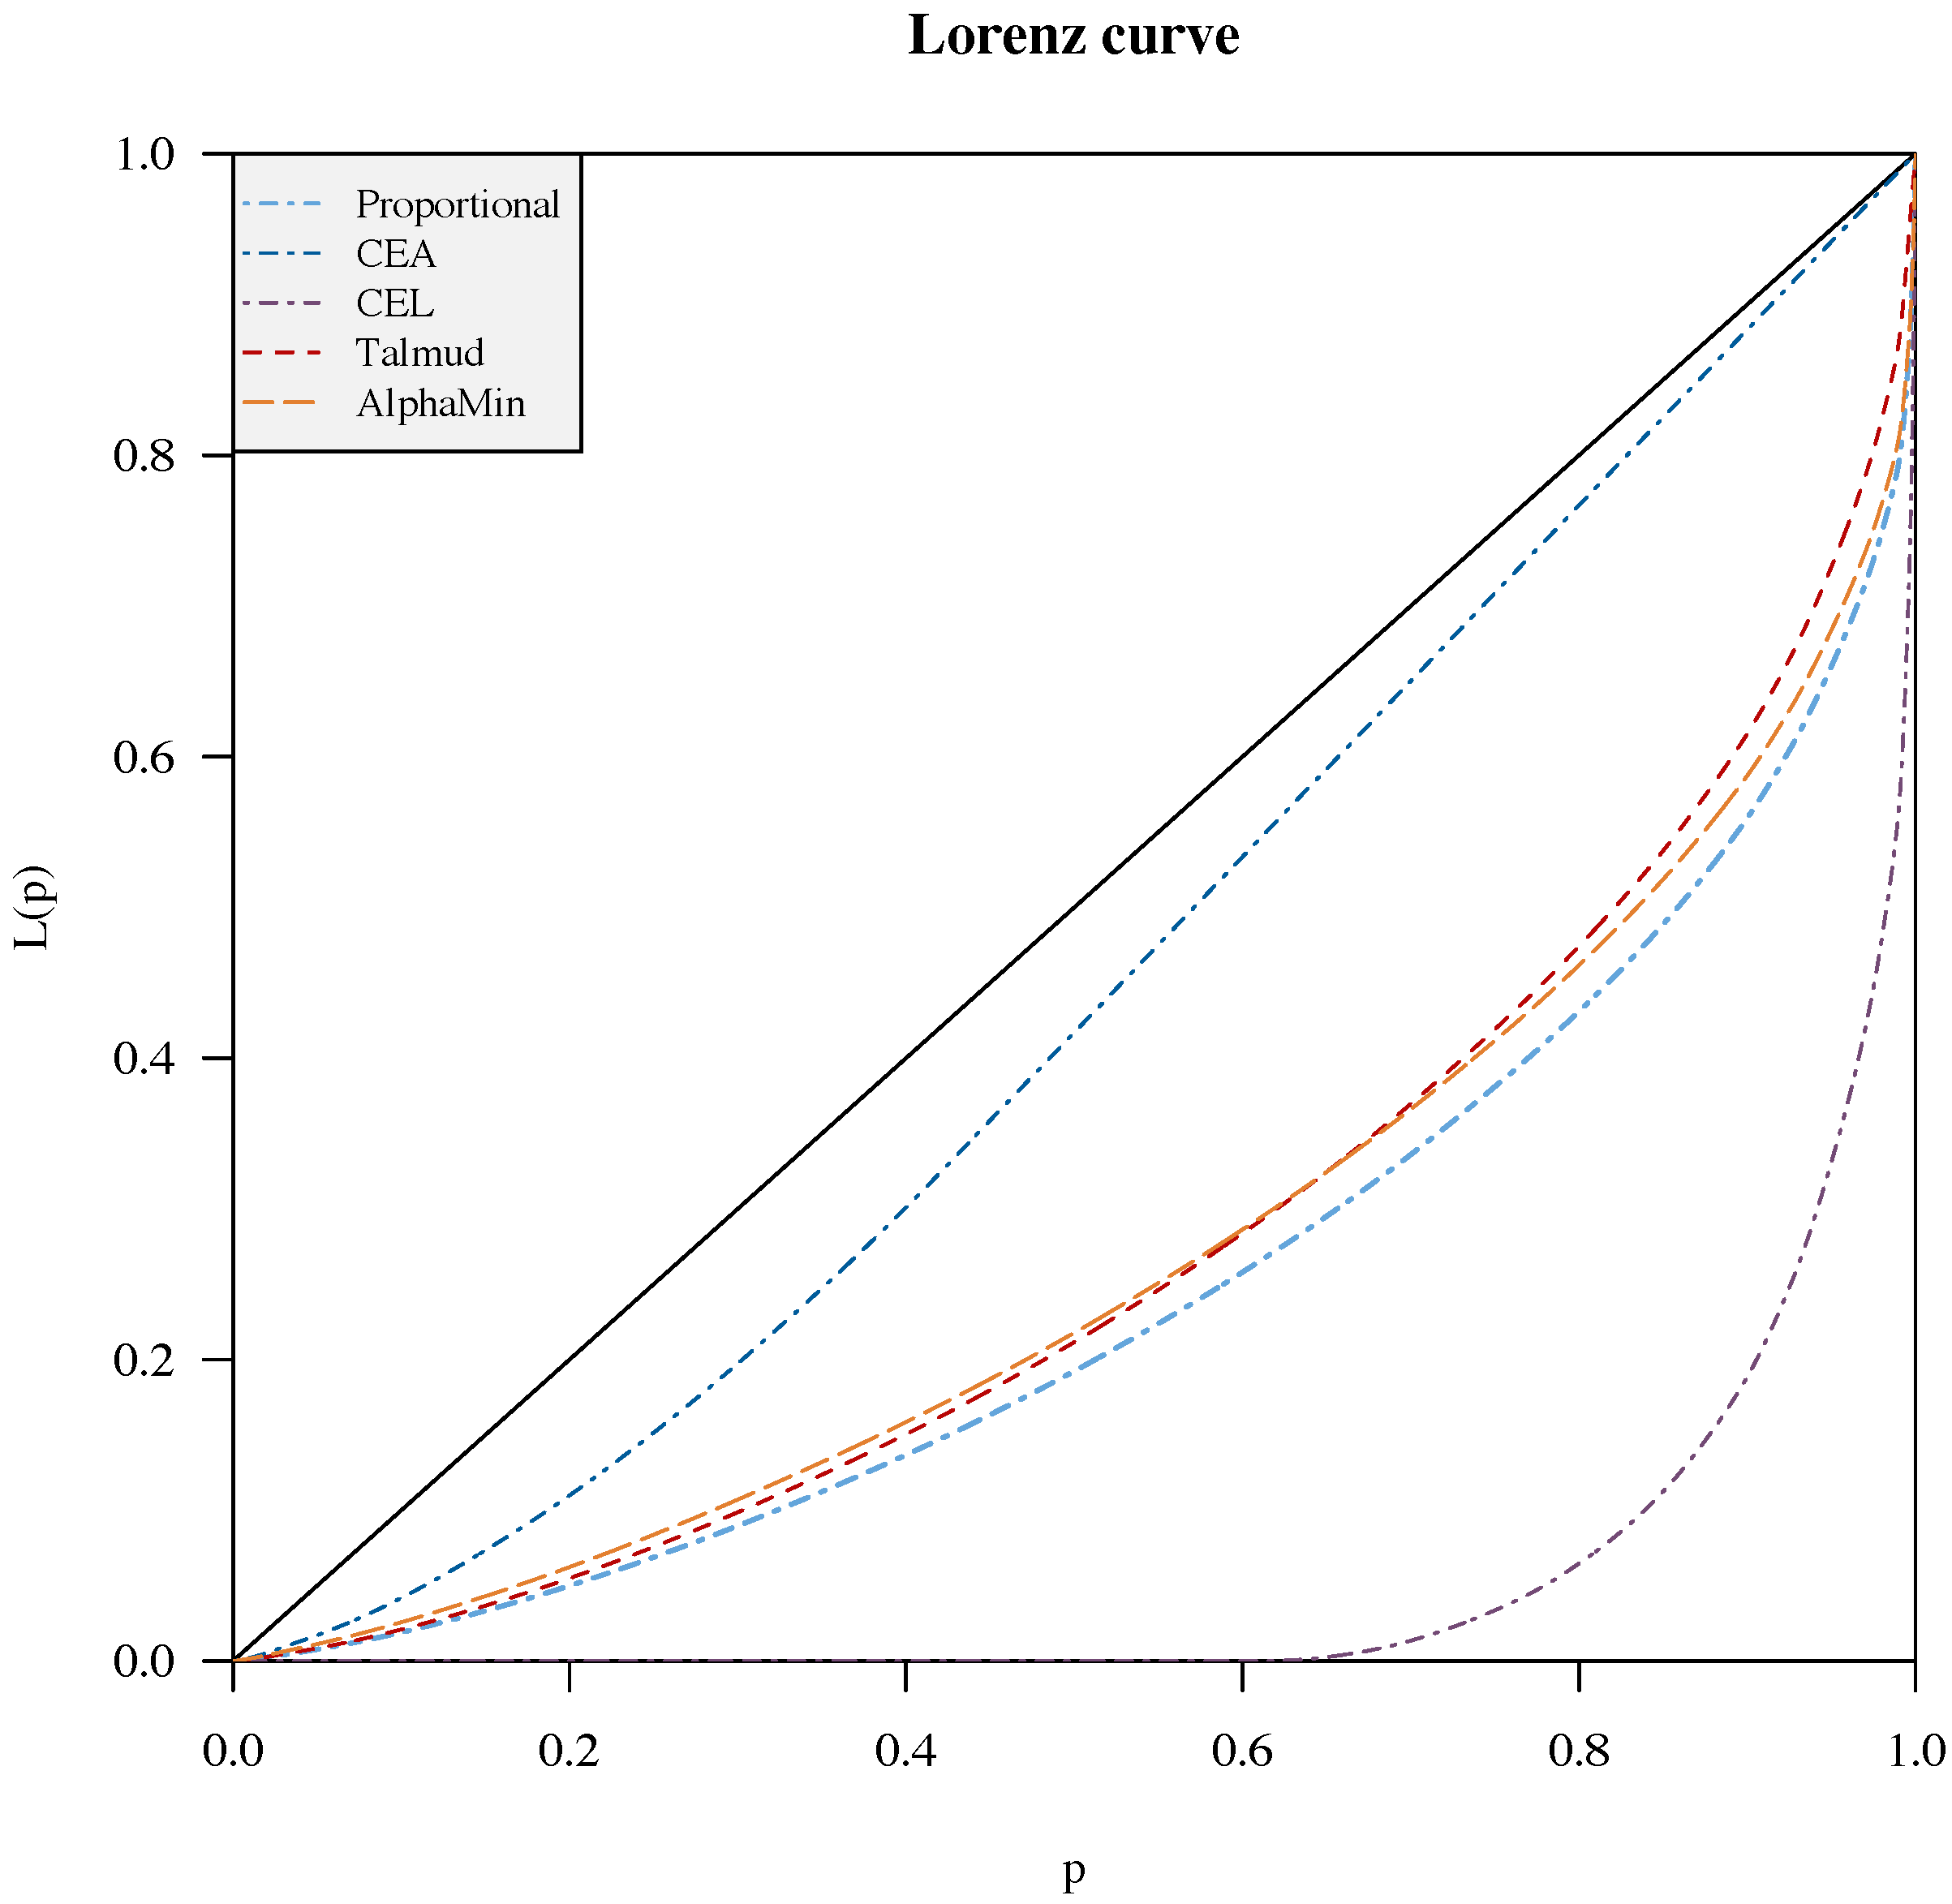
4.2. Inequality Measure: Gini Index
5. Conclusions
Author Contributions
Funding
Acknowledgments
Conflicts of Interest
Appendix A
| Claim | Freq | CEA | CEL | Prop | Talmud | Claim | Freq | CEA | CEL | Prop | Talmud | ||
|---|---|---|---|---|---|---|---|---|---|---|---|---|---|
| 8 | 1 | 8.0 | 0.0 | 3.6 | 8.0 | 4.0 | 45 | 7 | 45.0 | 0.0 | 20.5 | 23.4 | 22.5 |
| 10 | 1 | 10.0 | 0.0 | 4.5 | 8.8 | 5.0 | 46 | 18 | 46.0 | 0.0 | 20.9 | 23.8 | 23.0 |
| 11 | 3 | 11.0 | 0.0 | 5.0 | 9.3 | 5.5 | 47 | 6 | 47.0 | 0.0 | 21.4 | 24.3 | 23.5 |
| 12 | 3 | 12.0 | 0.0 | 5.5 | 9.7 | 6.0 | 48 | 13 | 48.0 | 0.0 | 21.8 | 24.7 | 24.0 |
| 13 | 1 | 13.0 | 0.0 | 5.9 | 10.1 | 6.5 | 49 | 9 | 49.0 | 0.0 | 22.3 | 25.1 | 24.5 |
| 14 | 5 | 14.0 | 0.0 | 6.4 | 10.5 | 7.0 | 50 | 27 | 50.0 | 0.0 | 22.7 | 25.5 | 25.0 |
| 15 | 1 | 15.0 | 0.0 | 6.8 | 10.9 | 7.5 | 51 | 10 | 51.0 | 0.0 | 23.2 | 25.9 | 25.5 |
| 16 | 2 | 16.0 | 0.0 | 7.3 | 11.3 | 8.0 | 52 | 16 | 52.0 | 0.0 | 23.6 | 26.3 | 26.0 |
| 17 | 2 | 17.0 | 0.0 | 7.7 | 11.8 | 8.5 | 53 | 6 | 53.0 | 0.0 | 24.1 | 26.8 | 26.5 |
| 18 | 1 | 18.0 | 0.0 | 8.2 | 12.2 | 9.0 | 54 | 20 | 54.0 | 0.0 | 24.5 | 27.2 | 27.0 |
| 19 | 2 | 19.0 | 0.0 | 8.6 | 12.6 | 9.5 | 55 | 15 | 55.0 | 0.0 | 25.0 | 27.6 | 27.5 |
| 20 | 4 | 20.0 | 0.0 | 9.1 | 13.0 | 10.0 | 56 | 25 | 56.0 | 0.0 | 25.5 | 28.0 | 28.0 |
| 21 | 3 | 21.0 | 0.0 | 9.5 | 13.4 | 10.5 | 57 | 9 | 57.0 | 0.0 | 25.9 | 28.4 | 28.5 |
| 22 | 33 | 22.0 | 0.0 | 10.0 | 13.8 | 11.0 | 58 | 24 | 58.0 | 0.0 | 26.4 | 28.8 | 29.0 |
| 23 | 7 | 23.0 | 0.0 | 10.5 | 14.3 | 11.5 | 59 | 7 | 59.0 | 0.0 | 26.8 | 29.3 | 29.5 |
| 24 | 9 | 24.0 | 0.0 | 10.9 | 14.7 | 12.0 | 60 | 19 | 60.0 | 0.0 | 27.3 | 29.7 | 30.0 |
| 25 | 5 | 25.0 | 0.0 | 11.4 | 15.1 | 12.5 | 61 | 9 | 61.0 | 0.0 | 27.7 | 30.1 | 30.5 |
| 26 | 12 | 26.0 | 0.0 | 11.8 | 15.5 | 13.0 | 62 | 16 | 62.0 | 0.0 | 28.2 | 30.5 | 31.0 |
| 27 | 4 | 27.0 | 0.0 | 12.3 | 15.9 | 13.5 | 63 | 11 | 63.0 | 0.0 | 28.6 | 30.9 | 31.5 |
| 28 | 6 | 28.0 | 0.0 | 12.7 | 16.3 | 14.0 | 64 | 14 | 64.0 | 0.0 | 29.1 | 31.3 | 32.0 |
| 29 | 6 | 29.0 | 0.0 | 13.2 | 16.8 | 14.5 | 65 | 5 | 65.0 | 0.0 | 29.5 | 31.8 | 32.5 |
| 30 | 10 | 30.0 | 0.0 | 13.6 | 17.2 | 15.0 | 66 | 18 | 65.7 | 0.0 | 30.0 | 32.2 | 33.0 |
| 31 | 4 | 31.0 | 0.0 | 14.1 | 17.6 | 15.5 | 67 | 5 | 65.7 | 0.0 | 30.5 | 32.6 | 33.5 |
| 32 | 13 | 32.0 | 0.0 | 14.5 | 18.0 | 16.0 | 68 | 20 | 65.7 | 0.0 | 30.9 | 33.0 | 34.0 |
| 33 | 9 | 33.0 | 0.0 | 15.0 | 18.4 | 16.5 | 69 | 4 | 65.7 | 0.0 | 31.4 | 33.4 | 34.5 |
| 34 | 12 | 34.0 | 0.0 | 15.5 | 18.8 | 17.0 | 70 | 16 | 65.7 | 0.0 | 31.8 | 33.8 | 35.0 |
| 35 | 6 | 35.0 | 0.0 | 15.9 | 19.3 | 17.5 | 71 | 10 | 65.7 | 0.0 | 32.3 | 34.3 | 35.5 |
| 36 | 15 | 36.0 | 0.0 | 16.4 | 19.7 | 18.0 | 72 | 19 | 65.7 | 0.0 | 32.7 | 34.7 | 36.0 |
| 37 | 8 | 37.0 | 0.0 | 16.8 | 20.1 | 18.5 | 73 | 7 | 65.7 | 0.0 | 33.2 | 35.1 | 36.5 |
| 38 | 19 | 38.0 | 0.0 | 17.3 | 20.5 | 19.0 | 74 | 14 | 65.7 | 0.0 | 33.6 | 35.5 | 37.0 |
| 39 | 13 | 39.0 | 0.0 | 17.7 | 20.9 | 19.5 | 75 | 5 | 65.7 | 0.0 | 34.1 | 35.9 | 37.5 |
| 40 | 14 | 40.0 | 0.0 | 18.2 | 21.3 | 20.0 | 76 | 7 | 65.7 | 0.0 | 34.5 | 36.4 | 38.0 |
| 41 | 8 | 41.0 | 0.0 | 18.6 | 21.8 | 20.5 | 77 | 8 | 65.7 | 0.0 | 35.0 | 36.8 | 38.5 |
| 42 | 14 | 42.0 | 0.0 | 19.1 | 22.2 | 21.0 | 78 | 24 | 65.7 | 0.0 | 35.5 | 37.2 | 39.0 |
| 43 | 5 | 43.0 | 0.0 | 19.5 | 22.6 | 21.5 | 79 | 4 | 65.7 | 0.0 | 35.9 | 37.6 | 39.5 |
| 44 | 19 | 44.0 | 0.0 | 20.0 | 23.0 | 22.0 | 80 | 13 | 65.7 | 0.0 | 36.4 | 38.0 | 40.0 |
| Claim | Freq | CEA | CEL | Prop | Talmud | Claim | Freq | CEA | CEL | Prop | Talmud | ||
|---|---|---|---|---|---|---|---|---|---|---|---|---|---|
| 81 | 5 | 65.7 | 0.0 | 36.8 | 38.4 | 40.5 | 117 | 2 | 65.7 | 27.9 | 53.2 | 53.4 | 58.5 |
| 82 | 15 | 65.7 | 0.0 | 37.3 | 38.9 | 41.0 | 118 | 9 | 65.7 | 28.9 | 53.6 | 53.9 | 59.0 |
| 83 | 4 | 65.7 | 0.0 | 37.7 | 39.3 | 41.5 | 120 | 8 | 65.7 | 30.9 | 54.5 | 54.7 | 60.0 |
| 84 | 20 | 65.7 | 0.0 | 38.2 | 39.7 | 42.0 | 121 | 2 | 65.7 | 31.9 | 55.0 | 55.1 | 60.5 |
| 85 | 2 | 65.7 | 0.0 | 38.6 | 40.1 | 42.5 | 122 | 6 | 65.7 | 32.9 | 55.5 | 55.5 | 61.0 |
| 86 | 13 | 65.7 | 0.0 | 39.1 | 40.5 | 43.0 | 123 | 1 | 65.7 | 33.9 | 55.9 | 55.9 | 61.5 |
| 87 | 7 | 65.7 | 0.0 | 39.5 | 40.9 | 43.5 | 124 | 6 | 65.7 | 34.9 | 56.4 | 56.4 | 62.0 |
| 88 | 15 | 65.7 | 0.0 | 40.0 | 41.4 | 44.0 | 125 | 2 | 65.7 | 35.9 | 56.8 | 56.8 | 62.5 |
| 89 | 6 | 65.7 | 0.0 | 40.5 | 41.8 | 44.5 | 126 | 5 | 65.7 | 36.9 | 57.3 | 57.2 | 63.0 |
| 90 | 13 | 65.7 | 0.9 | 40.9 | 42.2 | 45.0 | 127 | 4 | 65.7 | 37.9 | 57.7 | 57.6 | 63.5 |
| 91 | 4 | 65.7 | 1.9 | 41.4 | 42.6 | 45.5 | 128 | 3 | 65.7 | 38.9 | 58.2 | 58.0 | 64.0 |
| 92 | 12 | 65.7 | 2.9 | 41.8 | 43.0 | 46.0 | 129 | 1 | 65.7 | 39.9 | 58.6 | 58.4 | 64.5 |
| 93 | 3 | 65.7 | 3.9 | 42.3 | 43.4 | 46.5 | 130 | 5 | 65.7 | 40.9 | 59.1 | 58.9 | 65.0 |
| 94 | 8 | 65.7 | 4.9 | 42.7 | 43.9 | 47.0 | 131 | 1 | 65.7 | 41.9 | 59.5 | 59.3 | 65.5 |
| 95 | 2 | 65.7 | 5.9 | 43.2 | 44.3 | 47.5 | 132 | 14 | 65.7 | 42.9 | 60.0 | 59.7 | 66.0 |
| 96 | 16 | 65.7 | 6.9 | 43.6 | 44.7 | 48.0 | 133 | 1 | 65.7 | 43.9 | 60.5 | 60.1 | 66.5 |
| 97 | 3 | 65.7 | 7.9 | 44.1 | 45.1 | 48.5 | 134 | 5 | 65.7 | 44.9 | 60.9 | 60.5 | 67.0 |
| 98 | 12 | 65.7 | 8.9 | 44.5 | 45.5 | 49.0 | 136 | 6 | 65.7 | 46.9 | 61.8 | 61.4 | 68.0 |
| 99 | 4 | 65.7 | 9.9 | 45.0 | 45.9 | 49.5 | 137 | 3 | 65.7 | 47.9 | 62.3 | 61.8 | 68.5 |
| 100 | 9 | 65.7 | 10.9 | 45.5 | 46.4 | 50.0 | 138 | 4 | 65.7 | 48.9 | 62.7 | 62.2 | 69.0 |
| 101 | 2 | 65.7 | 11.9 | 45.9 | 46.8 | 50.5 | 140 | 5 | 65.7 | 50.9 | 63.6 | 63.0 | 70.0 |
| 102 | 12 | 65.7 | 12.9 | 46.4 | 47.2 | 51.0 | 141 | 2 | 65.7 | 51.9 | 64.1 | 63.5 | 70.5 |
| 103 | 1 | 65.7 | 13.9 | 46.8 | 47.6 | 51.5 | 142 | 4 | 65.7 | 52.9 | 64.5 | 63.9 | 71.0 |
| 104 | 10 | 65.7 | 14.9 | 47.3 | 48.0 | 52.0 | 143 | 1 | 65.7 | 53.9 | 65.0 | 64.3 | 71.5 |
| 105 | 3 | 65.7 | 15.9 | 47.7 | 48.4 | 52.5 | 144 | 5 | 65.7 | 54.9 | 65.5 | 64.7 | 72.0 |
| 106 | 6 | 65.7 | 16.9 | 48.2 | 48.9 | 53.0 | 145 | 2 | 65.7 | 55.9 | 65.9 | 65.1 | 72.5 |
| 107 | 3 | 65.7 | 17.9 | 48.6 | 49.3 | 53.5 | 146 | 3 | 65.7 | 56.9 | 66.4 | 65.5 | 73.0 |
| 108 | 12 | 65.7 | 18.9 | 49.1 | 49.7 | 54.0 | 147 | 4 | 65.7 | 57.9 | 66.8 | 66.0 | 73.5 |
| 109 | 2 | 65.7 | 19.9 | 49.5 | 50.1 | 54.5 | 148 | 2 | 65.7 | 58.9 | 67.3 | 66.4 | 74.0 |
| 110 | 13 | 65.7 | 20.9 | 50.0 | 50.5 | 55.0 | 150 | 3 | 65.7 | 60.9 | 68.2 | 67.2 | 75.0 |
| 111 | 2 | 65.7 | 21.9 | 50.5 | 50.9 | 55.5 | 152 | 7 | 65.7 | 62.9 | 69.1 | 68.0 | 76.0 |
| 112 | 11 | 65.7 | 22.9 | 50.9 | 51.4 | 56.0 | 154 | 3 | 65.7 | 64.9 | 70.0 | 68.9 | 77.0 |
| 113 | 3 | 65.7 | 23.9 | 51.4 | 51.8 | 56.5 | 155 | 2 | 65.7 | 65.9 | 70.5 | 69.3 | 77.5 |
| 114 | 13 | 65.7 | 24.9 | 51.8 | 52.2 | 57.0 | 156 | 3 | 65.7 | 66.9 | 70.9 | 69.7 | 78.0 |
| 115 | 3 | 65.7 | 25.9 | 52.3 | 52.6 | 57.5 | 157 | 1 | 65.7 | 67.9 | 71.4 | 70.1 | 78.5 |
| 116 | 12 | 65.7 | 26.9 | 52.7 | 53.0 | 58.0 | 158 | 4 | 65.7 | 68.9 | 71.8 | 70.5 | 79.0 |
| Claim | Freq | CEA | CEL | Prop | Talmud | Claim | Freq | CEA | CEL | Prop | Talmud | ||
|---|---|---|---|---|---|---|---|---|---|---|---|---|---|
| 160 | 2 | 65.7 | 70.9 | 72.7 | 71.4 | 80.0 | 221 | 1 | 65.7 | 131.9 | 100.5 | 96.8 | 110.5 |
| 162 | 3 | 65.7 | 72.9 | 73.6 | 72.2 | 81.0 | 224 | 1 | 65.7 | 134.9 | 101.8 | 98.1 | 112.0 |
| 164 | 2 | 65.7 | 74.9 | 74.5 | 73.0 | 82.0 | 225 | 3 | 65.7 | 135.9 | 102.3 | 98.5 | 112.5 |
| 165 | 1 | 65.7 | 75.9 | 75.0 | 73.5 | 82.5 | 227 | 2 | 65.7 | 137.9 | 103.2 | 99.3 | 113.5 |
| 166 | 3 | 65.7 | 76.9 | 75.5 | 73.9 | 83.0 | 228 | 1 | 65.7 | 138.9 | 103.6 | 99.7 | 114.0 |
| 167 | 1 | 65.7 | 77.9 | 75.9 | 74.3 | 83.5 | 230 | 1 | 65.7 | 140.9 | 104.5 | 100.6 | 115.0 |
| 168 | 6 | 65.7 | 78.9 | 76.4 | 74.7 | 84.0 | 232 | 1 | 65.7 | 142.9 | 105.5 | 101.4 | 116.0 |
| 169 | 1 | 65.7 | 79.9 | 76.8 | 75.1 | 84.5 | 234 | 2 | 65.7 | 144.9 | 106.4 | 102.2 | 117.0 |
| 170 | 2 | 65.7 | 80.9 | 77.3 | 75.5 | 85.0 | 238 | 1 | 65.7 | 148.9 | 108.2 | 103.9 | 119.0 |
| 171 | 2 | 65.7 | 81.9 | 77.7 | 76.0 | 85.5 | 240 | 7 | 65.7 | 150.9 | 109.1 | 104.7 | 120.0 |
| 172 | 3 | 65.7 | 82.9 | 78.2 | 76.4 | 86.0 | 241 | 2 | 65.7 | 151.9 | 109.5 | 105.1 | 120.5 |
| 173 | 1 | 65.7 | 83.9 | 78.6 | 76.8 | 86.5 | 242 | 1 | 65.7 | 152.9 | 110.0 | 105.6 | 121.0 |
| 174 | 4 | 65.7 | 84.9 | 79.1 | 77.2 | 87.0 | 243 | 1 | 65.7 | 153.9 | 110.5 | 106.0 | 121.5 |
| 176 | 3 | 65.7 | 86.9 | 80.0 | 78.0 | 88.0 | 256 | 1 | 65.7 | 166.9 | 116.4 | 111.4 | 128.0 |
| 178 | 4 | 65.7 | 88.9 | 80.9 | 78.9 | 89.0 | 258 | 1 | 65.7 | 168.9 | 117.3 | 112.2 | 129.0 |
| 179 | 1 | 65.7 | 89.9 | 81.4 | 79.3 | 89.5 | 260 | 1 | 65.7 | 170.9 | 118.2 | 113.1 | 130.0 |
| 180 | 2 | 65.7 | 90.9 | 81.8 | 79.7 | 90.0 | 262 | 2 | 65.7 | 172.9 | 119.1 | 113.9 | 131.0 |
| 181 | 1 | 65.7 | 91.9 | 82.3 | 80.1 | 90.5 | 264 | 2 | 65.7 | 174.9 | 120.0 | 114.7 | 132.0 |
| 182 | 1 | 65.7 | 92.9 | 82.7 | 80.5 | 91.0 | 270 | 2 | 65.7 | 180.9 | 122.7 | 117.2 | 135.0 |
| 184 | 1 | 65.7 | 94.9 | 83.6 | 81.4 | 92.0 | 274 | 2 | 65.7 | 184.9 | 124.5 | 118.9 | 137.0 |
| 186 | 3 | 65.7 | 96.9 | 84.5 | 82.2 | 93.0 | 278 | 1 | 65.7 | 188.9 | 126.4 | 120.6 | 139.0 |
| 188 | 5 | 65.7 | 98.9 | 85.5 | 83.0 | 94.0 | 282 | 1 | 65.7 | 192.9 | 128.2 | 122.2 | 141.0 |
| 190 | 3 | 65.7 | 100.9 | 86.4 | 83.9 | 95.0 | 283 | 1 | 65.7 | 193.9 | 128.6 | 122.7 | 141.5 |
| 192 | 1 | 65.7 | 102.9 | 87.3 | 84.7 | 96.0 | 284 | 1 | 65.7 | 194.9 | 129.1 | 123.1 | 142.0 |
| 194 | 1 | 65.7 | 104.9 | 88.2 | 85.5 | 97.0 | 285 | 1 | 65.7 | 195.9 | 129.5 | 123.5 | 142.5 |
| 196 | 3 | 65.7 | 106.9 | 89.1 | 86.4 | 98.0 | 286 | 1 | 65.7 | 196.9 | 130.0 | 123.9 | 143.0 |
| 198 | 2 | 65.7 | 108.9 | 90.0 | 87.2 | 99.0 | 287 | 1 | 65.7 | 197.9 | 130.5 | 124.3 | 143.5 |
| 201 | 1 | 65.7 | 111.9 | 91.4 | 88.5 | 100.5 | 290 | 1 | 65.7 | 200.9 | 131.8 | 125.6 | 145.0 |
| 202 | 1 | 65.7 | 112.9 | 91.8 | 88.9 | 101.0 | 291 | 1 | 65.7 | 201.9 | 132.3 | 126.0 | 145.5 |
| 206 | 1 | 65.7 | 116.9 | 93.6 | 90.6 | 103.0 | 292 | 1 | 65.7 | 202.9 | 132.7 | 126.4 | 146.0 |
| 208 | 1 | 65.7 | 118.9 | 94.5 | 91.4 | 104.0 | 294 | 1 | 65.7 | 204.9 | 133.6 | 127.2 | 147.0 |
| 210 | 3 | 65.7 | 120.9 | 95.5 | 92.2 | 105.0 | 296 | 1 | 65.7 | 206.9 | 134.5 | 128.1 | 148.0 |
| 211 | 1 | 65.7 | 121.9 | 95.9 | 92.6 | 105.5 | 300 | 2 | 65.7 | 210.9 | 136.4 | 129.7 | 150.0 |
| 216 | 3 | 65.7 | 126.9 | 98.2 | 94.7 | 108.0 | 304 | 2 | 65.7 | 214.9 | 138.2 | 131.4 | 152.0 |
| 218 | 2 | 65.7 | 128.9 | 99.1 | 95.6 | 109.0 | 306 | 1 | 65.7 | 216.9 | 139.1 | 132.2 | 153.0 |
| 220 | 1 | 65.7 | 130.9 | 100.0 | 96.4 | 110.0 | 308 | 3 | 65.7 | 218.9 | 140.0 | 133.1 | 154.0 |
| Claim | Freq | CEA | CEL | Prop | Talmud | Claim | Freq | CEA | CEL | Prop | Talmud | ||
|---|---|---|---|---|---|---|---|---|---|---|---|---|---|
| 310 | 3 | 65.7 | 220.9 | 140.9 | 133.9 | 155.0 | 556 | 1 | 65.7 | 466.9 | 252.7 | 236.5 | 278.0 |
| 314 | 1 | 65.7 | 224.9 | 142.7 | 135.6 | 157.0 | 574 | 1 | 65.7 | 484.9 | 260.9 | 244.0 | 287.0 |
| 317 | 1 | 65.7 | 227.9 | 144.1 | 136.8 | 158.5 | 594 | 1 | 65.7 | 504.9 | 270.0 | 252.3 | 297.0 |
| 320 | 2 | 65.7 | 230.9 | 145.5 | 138.1 | 160.0 | 620 | 1 | 65.7 | 530.9 | 281.8 | 263.2 | 310.0 |
| 328 | 3 | 65.7 | 238.9 | 149.1 | 141.4 | 164.0 | 682 | 1 | 65.7 | 592.9 | 310.0 | 289.0 | 341.0 |
| 331 | 2 | 65.7 | 241.9 | 150.5 | 142.7 | 165.5 | 716 | 1 | 65.7 | 626.9 | 325.5 | 303.2 | 358.0 |
| 332 | 1 | 65.7 | 242.9 | 150.9 | 143.1 | 166.0 | 816 | 1 | 65.7 | 726.9 | 370.9 | 344.9 | 408.0 |
| 334 | 1 | 65.7 | 244.9 | 151.8 | 143.9 | 167.0 | 954 | 1 | 65.7 | 864.9 | 433.6 | 402.4 | 477.0 |
| 344 | 2 | 65.7 | 254.9 | 156.4 | 148.1 | 172.0 | 1200 | 1 | 65.7 | 1110.9 | 545.5 | 505.0 | 600.0 |
| 346 | 1 | 65.7 | 256.9 | 157.3 | 148.9 | 173.0 | 1394 | 1 | 65.7 | 1304.9 | 633.6 | 585.9 | 697.0 |
| 351 | 1 | 65.7 | 261.9 | 159.5 | 151.0 | 175.5 | 1406 | 1 | 65.7 | 1316.9 | 639.1 | 590.9 | 703.0 |
| 354 | 1 | 65.7 | 264.9 | 160.9 | 152.3 | 177.0 | 1680 | 1 | 65.7 | 1590.9 | 763.6 | 705.1 | 764.9 |
| 362 | 2 | 65.7 | 272.9 | 164.5 | 155.6 | 181.0 | 1848 | 2 | 65.7 | 1758.9 | 840.0 | 775.1 | 764.9 |
| 366 | 1 | 65.7 | 276.9 | 166.4 | 157.3 | 183.0 | 2016 | 1 | 65.7 | 1926.9 | 916.4 | 845.2 | 764.9 |
| 370 | 1 | 65.7 | 280.9 | 168.2 | 158.9 | 185.0 | 2594 | 1 | 65.7 | 2504.9 | 1179.1 | 1086.2 | 764.9 |
| 374 | 1 | 65.7 | 284.9 | 170.0 | 160.6 | 187.0 | 3440 | 1 | 65.7 | 3350.9 | 1563.6 | 1438.9 | 764.9 |
| 375 | 1 | 65.7 | 285.9 | 170.5 | 161.0 | 187.5 | 4029 | 1 | 65.7 | 3939.9 | 1831.4 | 1684.5 | 764.9 |
| 378 | 1 | 65.7 | 288.9 | 171.8 | 162.3 | 189.0 | 4414 | 1 | 65.7 | 4324.9 | 2006.3 | 1845.0 | 764.9 |
| 395 | 2 | 65.7 | 305.9 | 179.5 | 169.4 | 197.5 | 7200 | 1 | 65.7 | 7110.9 | 3272.7 | 3006.6 | 764.9 |
| 401 | 1 | 65.7 | 311.9 | 182.3 | 171.9 | 200.5 | |||||||
| 406 | 1 | 65.7 | 316.9 | 184.5 | 173.9 | 203.0 | |||||||
| 414 | 1 | 65.7 | 324.9 | 188.2 | 177.3 | 207.0 | |||||||
| 416 | 1 | 65.7 | 326.9 | 189.1 | 178.1 | 208.0 | |||||||
| 428 | 1 | 65.7 | 338.9 | 194.5 | 183.1 | 214.0 | |||||||
| 438 | 1 | 65.7 | 348.9 | 199.1 | 187.3 | 219.0 | |||||||
| 444 | 1 | 65.7 | 354.9 | 201.8 | 189.8 | 222.0 | |||||||
| 468 | 1 | 65.7 | 378.9 | 212.7 | 199.8 | 234.0 | |||||||
| 480 | 1 | 65.7 | 390.9 | 218.2 | 204.8 | 240.0 | |||||||
| 482 | 1 | 65.7 | 392.9 | 219.1 | 205.6 | 241.0 | |||||||
| 490 | 1 | 65.7 | 400.9 | 222.7 | 209.0 | 245.0 | |||||||
| 496 | 1 | 65.7 | 406.9 | 225.5 | 211.5 | 248.0 | |||||||
| 500 | 2 | 65.7 | 410.9 | 227.3 | 213.1 | 250.0 | |||||||
| 502 | 1 | 65.7 | 412.9 | 228.2 | 214.0 | 251.0 | |||||||
| 506 | 1 | 65.7 | 416.9 | 230.0 | 215.6 | 253.0 | |||||||
| 532 | 1 | 65.7 | 442.9 | 241.8 | 226.5 | 266.0 | |||||||
| 534 | 1 | 65.7 | 444.9 | 242.7 | 227.3 | 267.0 |
| 1 | Ministerio para la Transición Ecológica y el Reto Demográfico. |
| 2 | The cubic hectometer is a unit of volume equivalent to one million cubic meters. |
| 3 | For more detailed data, please refer to the claim corresponding to each farmer and the solutions to the proposed rules in Table A1, Table A2, Table A3 and Table A4 in the Appendix A. |
References
- Winpenny, J. Managing Water as an Economic Resource; Routledge: Oxfordshire, UK, 2005. [Google Scholar]
- O’Neill, B. A problem of rights arbitration from the Talmud. Math. Soc. Sci. 1982, 2, 345–371. [Google Scholar] [CrossRef]
- Pereira, L.S.; Oweis, T.; Zairi, A. Irrigation management under water scarcity. Agric. Water Manag. 2002, 57, 175–206. [Google Scholar] [CrossRef]
- Kahil, T.; Albiac, J.; Fischer, G.; Strokal, M.; Tramberend, S.; Greve, P.; Tang, T.; Burek, P.; Burtscher, R.; Wada, Y. A nexus modeling framework for assessing water scarcity solutions. Curr. Opin. Environ. Sustain. 2019, 40, 72–80. [Google Scholar] [CrossRef]
- Wang, Z.; Zhang, H.; Wang, Y.; Wang, Y.; Lei, L.; Liang, C.; Wang, Y. Deficit irrigation decision-making of indigowoad root based on a model coupling fuzzy theory and grey relational analysis. Agric. Water Manag. 2023, 275, 107983. [Google Scholar] [CrossRef]
- Kelly, T.; Foster, T.; Schultz, D.M. Assessing the value of adapting irrigation strategies within the season. Agric. Water Manag. 2023, 275, 107986. [Google Scholar] [CrossRef]
- Mulwa, F.; Li, Z.; Fangninou, F.F. Water scarcity in Kenya: Current status, challenges and future solutions. Open Access Libr. J. 2021, 8, e7096. [Google Scholar] [CrossRef]
- Al-Ansari, N.; Abbas, N.; Laue, J.; Knutsson, S. Water scarcity: Problems and possible solutions. J. Earth Sci. Geotech. Eng. 2021, 11, 243–312. [Google Scholar]
- Hiben, M.G.; Awoke, A.G.; Ashenafi, A.A. Estimation of Current Water Use over the Complex Topography of the Nile Basin Headwaters: The Case of Ghba Subbasin, Ethiopia. Adv. Civ. Eng. 2022, 2022, 7852100. [Google Scholar] [CrossRef]
- Giménez-Gómez, J.M.; Teixidó-Figueras, J.; Vilella, C. The global carbon budget: A conflicting claims problem. Clim. Chang. 2016, 136, 693–703. [Google Scholar] [CrossRef]
- Salekpay, F. The Allocation of Greenhouse Gas Emission in European Union through Applying the Claims Problems Approach. Games 2023, 14, 9. [Google Scholar] [CrossRef]
- Pulido, M.; Sánchez-Soriano, J.; Llorca, N. Game Theory Techniques for University Management. Ann. Oper. Res. 2002, 109, 129–142. [Google Scholar] [CrossRef]
- Solís-Baltodano, M.J.; Giménez-Gómez, J.M.; Peris, J.E. Distributing the European structural and investment funds from a conflicting claims approach [Verteilung der europäischen Struktur-und Investitionsfonds aus einem kollidierenden Forderung Ansatz]. Rev. Reg. Res. Jahrb. Reg. 2022, 42, 23–47. [Google Scholar] [CrossRef]
- Fragnelli, V.; Kiryluk-Dryjska, E. Rationing methods for allocating the European Union’s rural development funds in Poland. Econ. Politica 2019, 36, 295–322. [Google Scholar] [CrossRef]
- Kiryluk-Dryjska, E. Fair Division Approach for the European Union’s Structural Policy Budget Allocation: An Application Study. Group Decis. Negot. 2014, 23, 597–615. [Google Scholar] [CrossRef]
- Kiryluk-Dryjska, E. Application of a fair-division algorithm to EU rural development funds allocation in Poland. Intercathedra 2018, 34, 21–28. [Google Scholar]
- Iñarra, E.; Prellezo, R. Bankruptcy of Fishing Resources: The Northern European Anglerfish Fishery. Mar. Resour. Econ. 2008, 17, 291–307. [Google Scholar]
- Iñarra, E.; Skonhoft, A. Restoring a fish stock: A dynamic bankruptcy problem. Land Econ. 2008, 84, 327–339. [Google Scholar] [CrossRef]
- Kampas, A. Combining fairness and stability concerns for global commons: The case of East Atlantic and Mediterranean tuna. Ocean. Coast. Manag. 2015, 116, 414–422. [Google Scholar] [CrossRef]
- Solís-Baltodano, M.J.; Vilella, C.; Giménez-Gómez, J.M. The Catalan Health Budget: A Conflicting Claims Approach. Hacienda Pública Española 2019, 228, 35–53. [Google Scholar] [CrossRef]
- Gómez-Rúa, M. Sharing a polluted river through environmental taxes. SERIEs 2013, 4, 137–153. [Google Scholar] [CrossRef]
- Degefu, D.M.; He, W. Allocating water under bankruptcy scenario. Water Resour. Manag. 2016, 30, 3949–3964. [Google Scholar] [CrossRef]
- Qin, J.; Fu, X.; Peng, S.; Xu, Y.; Huang, J.; Huang, S. Asymmetric bargaining model for water resource allocation over transboundary rivers. Int. J. Environ. Res. Public Health 2019, 16, 1733. [Google Scholar] [CrossRef] [PubMed]
- Liu, D.; Ji, X.; Tang, J.; Li, H. A fuzzy cooperative game theoretic approach for multinational water resource spatiotemporal allocation. Eur. J. Oper. Res. 2020, 282, 1025–1037. [Google Scholar] [CrossRef]
- Li, D.; Zhao, J.; Govindaraju, R.S. Water benefits sharing under transboundary cooperation in the Lancang-Mekong River Basin. J. Hydrol. 2019, 577, 123989. [Google Scholar] [CrossRef]
- Thomson, W. Axiomatic and game-theoretic analysis of bankruptcy and taxation problems: A survey. Math. Soc. Sci. 2003, 45, 249–297. [Google Scholar] [CrossRef]
- Bosmans, K.; Lauwers, L. Lorenz comparisons of nine rules for the adjudication of conflicting claims. Int. J. Game Theory 2011, 40, 791–807. [Google Scholar] [CrossRef]
- Maimoindes, M. Book of Judgements; Touger, R.E., Translator; Moznaim Publishing Corporation: New York, NY, USA; Jerusalem, Israel, 2000. [Google Scholar]
- Aumann, R.J.; Maschler, M. Game theoretic analysis of a bankruptcy problem from the Talmud. J. Econ. Theory 1985, 36, 195–213. [Google Scholar] [CrossRef]
- Giménez-Gómez, J.M.; Peris, J.E. A proportional approach to claims problems with a guaranteed minimum. Eur. J. Oper. Res. 2014, 232, 109–116. [Google Scholar] [CrossRef]
- Moulin, H. Priority rules and other asymmetric rationing methods. Econometrica 2000, 68, 643–684. [Google Scholar] [CrossRef]
- Curiel, I.J.; Maschler, M.; Tijs, S.H. Bankruptcy games. Z. Oper. Res. 1987, 31, A143–A159. [Google Scholar] [CrossRef]
- Dagan, N.; Volij, O. The bankruptcy problem: A cooperative bargaining approach. Math. Soc. Sci. 1993, 26, 287–297. [Google Scholar] [CrossRef]
- Thomson, W. How to Divide When There Isn’t Enough; Cambridge University Press: Cambridge, UK, 2019; Volume 62. [Google Scholar]
- Sen, A. On Economic Inequality; Clarendon Press Oxford: Oxford, UK, 1973; p. 118. [Google Scholar]
- Gini, C. Measurement of inequality of incomes. Econ. J. 1921, 31, 124–126. [Google Scholar] [CrossRef]


| Claims | CEA | CEL | Proportional | Talmud | ||
|---|---|---|---|---|---|---|
| Minimum | 8 | 8 | 0 | 4 | 8 | 4 |
| 1Q | 50 | 50 | 0 | 23 | 26 | 25 |
| Median | 74 | 66 | 0 | 34 | 36 | 37 |
| 3Q | 116 | 66 | 27 | 53 | 53 | 58 |
| Maximum | 7200.00 | 65.73 | 7110.88 | 3272.70 | 3006.55 | 764.94 |
| Average | 124.01 | 56.37 | 56.37 | 56.37 | 56.37 | 56.37 |
| Std.Dev. | 308.81 | 14.25 | 303.98 | 140.37 | 128.75 | 79.37 |
| CV | 2.49 | 0.25 | 5.39 | 2.49 | 2.28 | 1.41 |
| Skewness | 11.507 | −1.396 | 12.106 | 11.507 | 11.507 | 6.350 |
| Gini Index | 0.12 | 0.90 | 0.51 | 0.47 | 0.46 |
| CEA | CEL | Prop | Talmud | ||
|---|---|---|---|---|---|
| Minimum | 0.009 | 0.000 | 0.455 | 0.418 | 0.106 |
| 1Q | 0.567 | 0.000 | 0.455 | 0.457 | 0.500 |
| Median | 0.888 | 0.000 | 0.455 | 0.480 | 0.500 |
| 3Q | 1.000 | 0.232 | 0.455 | 0.510 | 0.500 |
| Maximum | 1.000 | 0.988 | 0.455 | 1.000 | 0.500 |
| Average | 0.762 | 0.147 | 0.455 | 0.494 | 0.499 |
| Std.Dev. | 0.275 | 0.241 | 0.000 | 0.059 | 0.019 |
| CV | 0.361 | 1.633 | 0.000 | 0.120 | 0.039 |
| Skewness | −0.852 | 1.591 | 0.000 | 2.496 | −16.071 |
Disclaimer/Publisher’s Note: The statements, opinions and data contained in all publications are solely those of the individual author(s) and contributor(s) and not of MDPI and/or the editor(s). MDPI and/or the editor(s) disclaim responsibility for any injury to people or property resulting from any ideas, methods, instructions or products referred to in the content. |
© 2023 by the authors. Licensee MDPI, Basel, Switzerland. This article is an open access article distributed under the terms and conditions of the Creative Commons Attribution (CC BY) license (https://creativecommons.org/licenses/by/4.0/).
Share and Cite
Cano-Berlanga, S.; Solís-Baltodano, M.-J.; Vilella, C. The Art of Sharing Resources: How to Distribute Water during a Drought Period. Games 2023, 14, 59. https://doi.org/10.3390/g14050059
Cano-Berlanga S, Solís-Baltodano M-J, Vilella C. The Art of Sharing Resources: How to Distribute Water during a Drought Period. Games. 2023; 14(5):59. https://doi.org/10.3390/g14050059
Chicago/Turabian StyleCano-Berlanga, Sebastian, María-José Solís-Baltodano, and Cori Vilella. 2023. "The Art of Sharing Resources: How to Distribute Water during a Drought Period" Games 14, no. 5: 59. https://doi.org/10.3390/g14050059