
A Comparison of Different Sample Processing Protocols for MALDI Imaging Mass Spectrometry Analysis of Formalin-Fixed Multiple Myeloma Cells

 , ,
, ,
Abstract
:Simple Summary
Abstract
1. Introduction
2. Materials and Methods
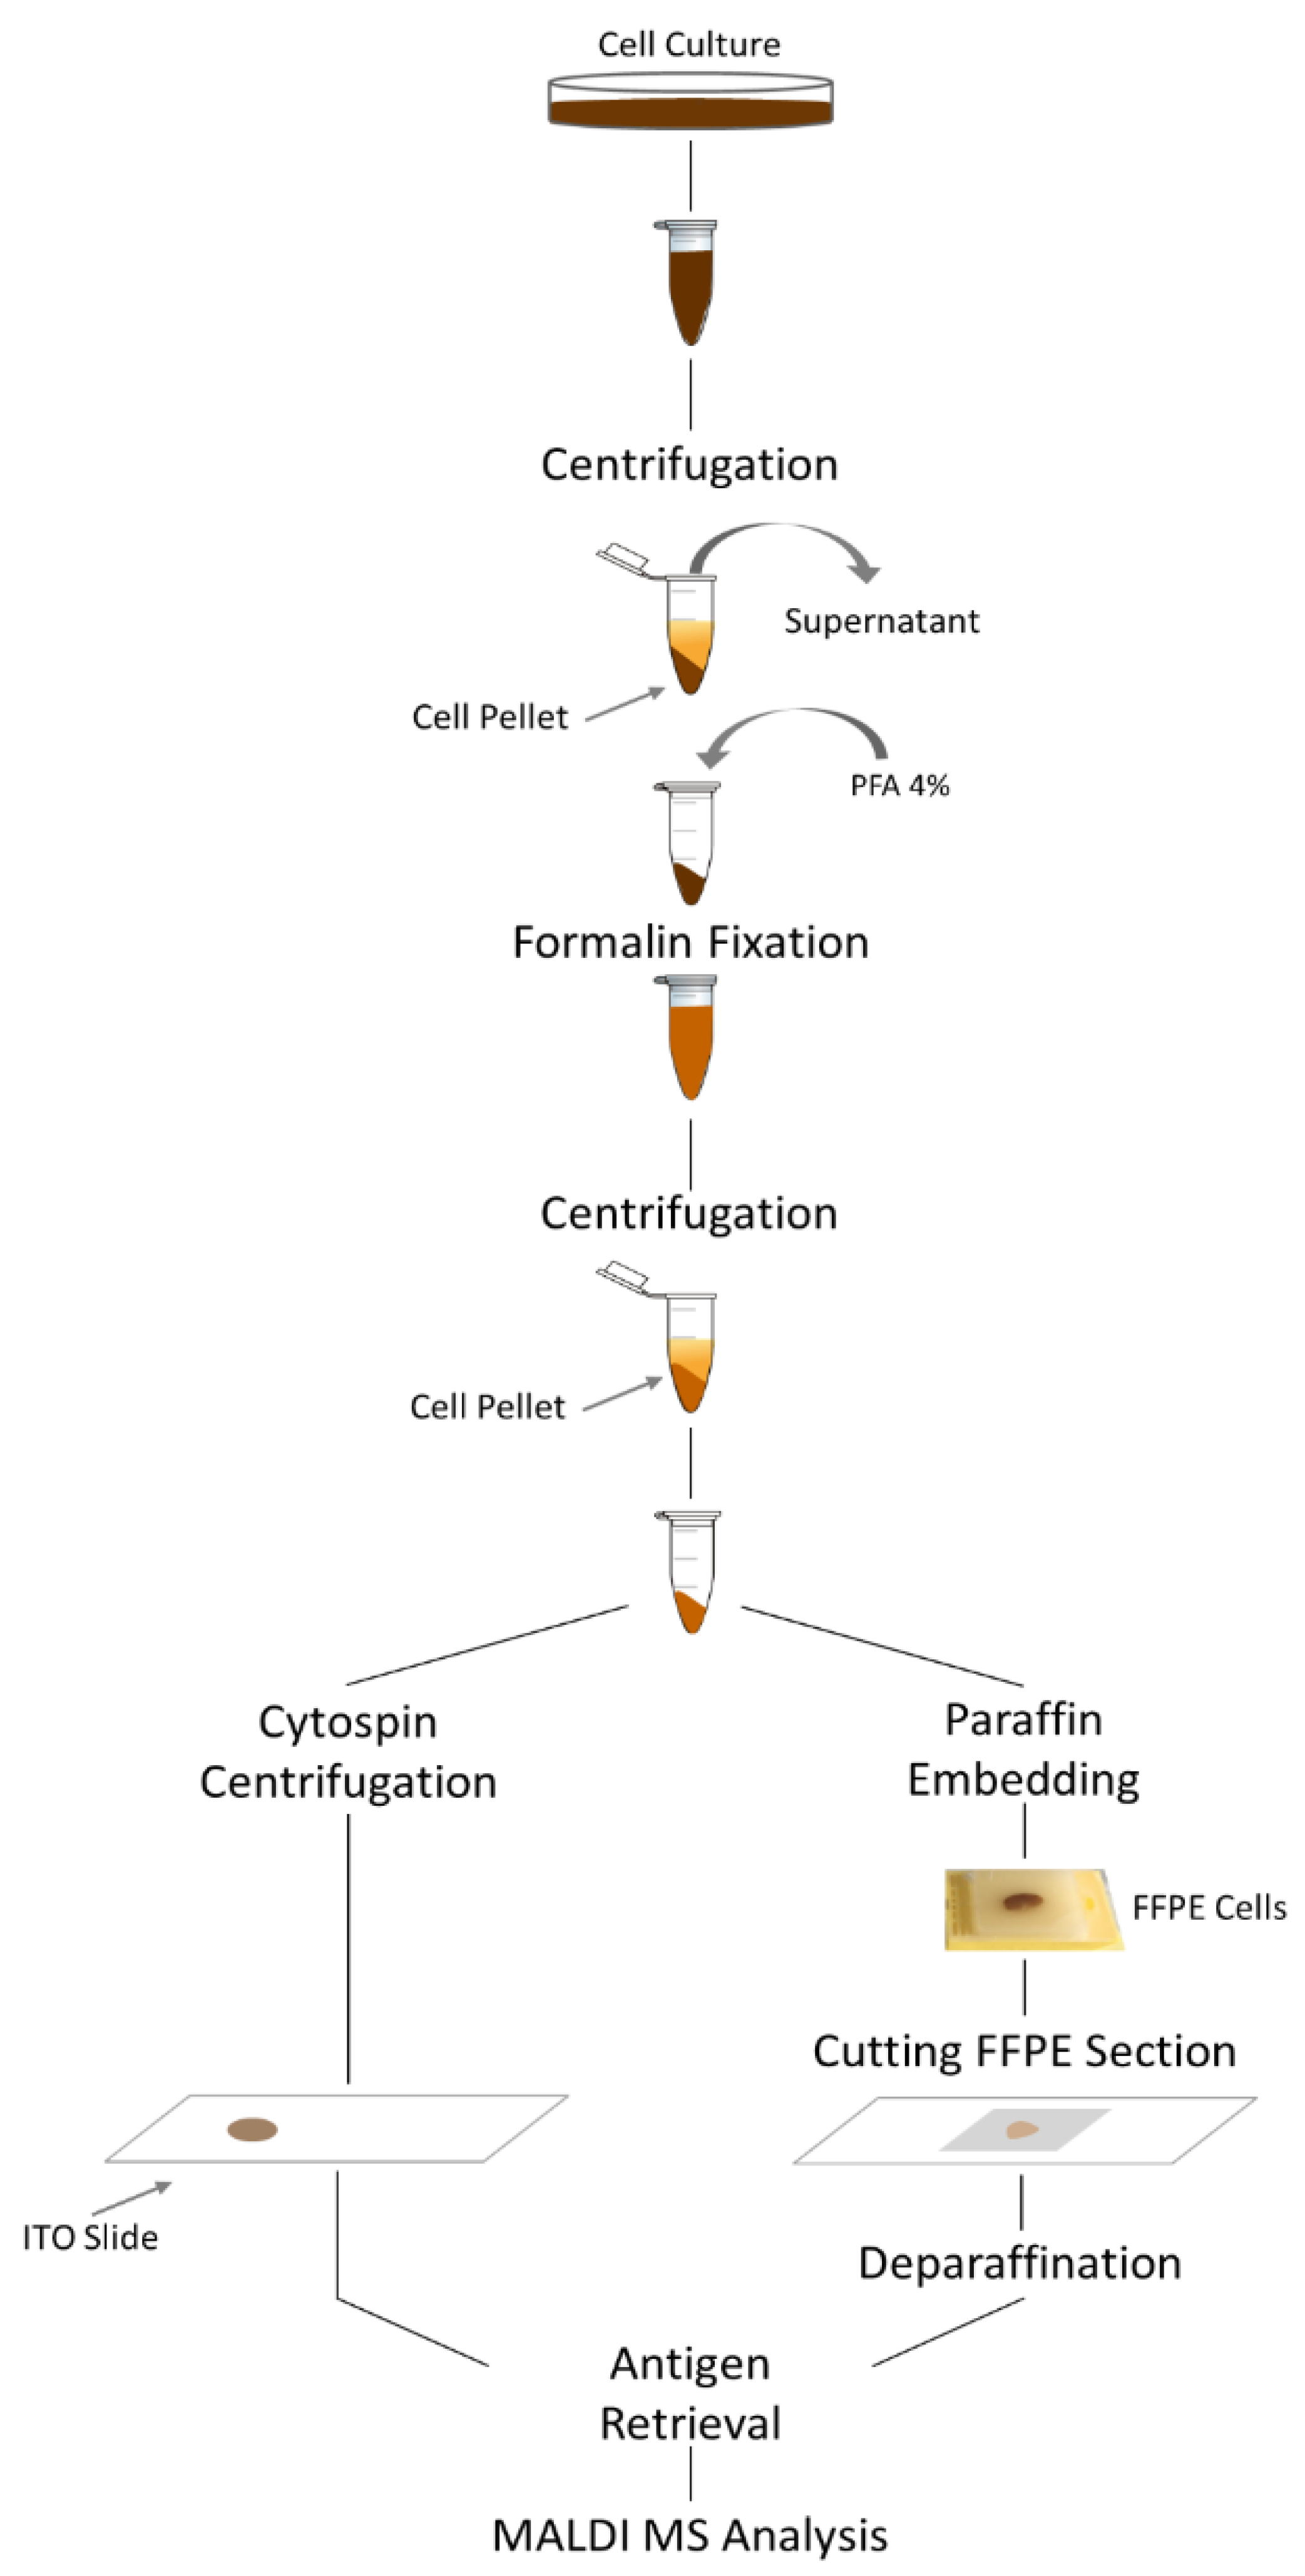
2.1. Cell Culture and Cell Fixation
2.2. Paraffin Embedding
2.3. FFPE Deparaffination and Antigen Retrieval
2.4. Cytocentrifugation
2.5. MALDI IMS Analysis
2.6. Data Analysis
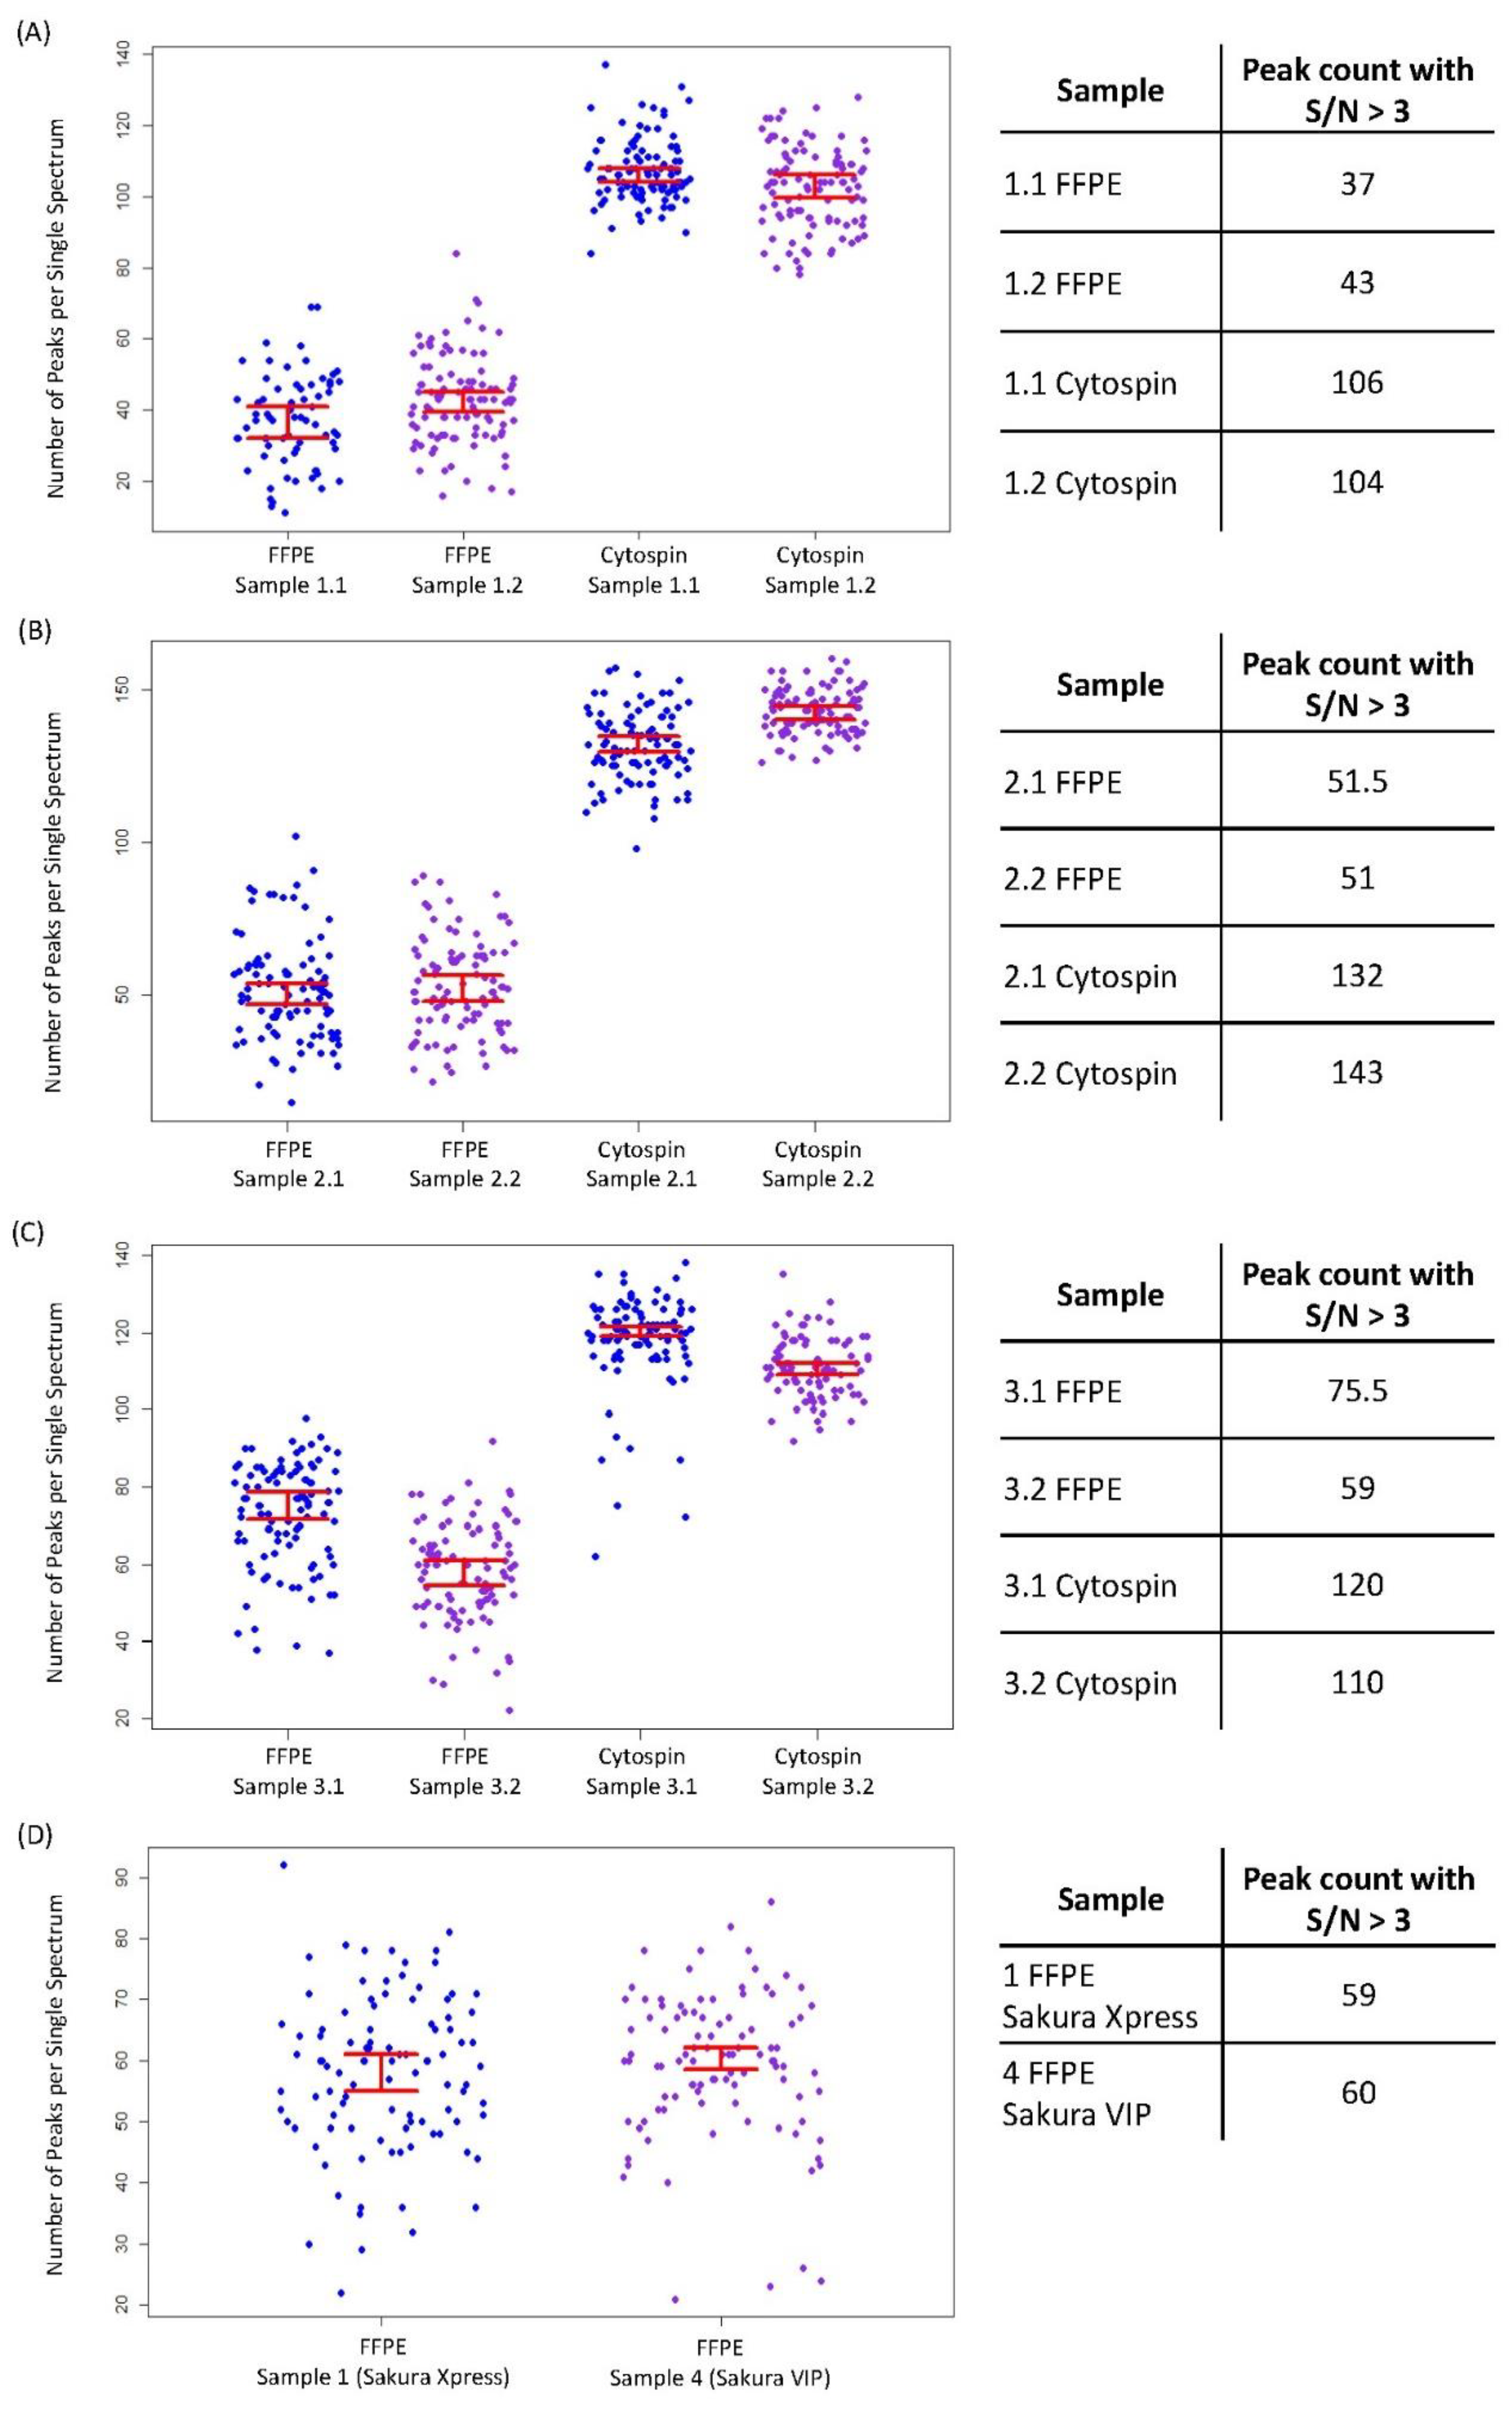
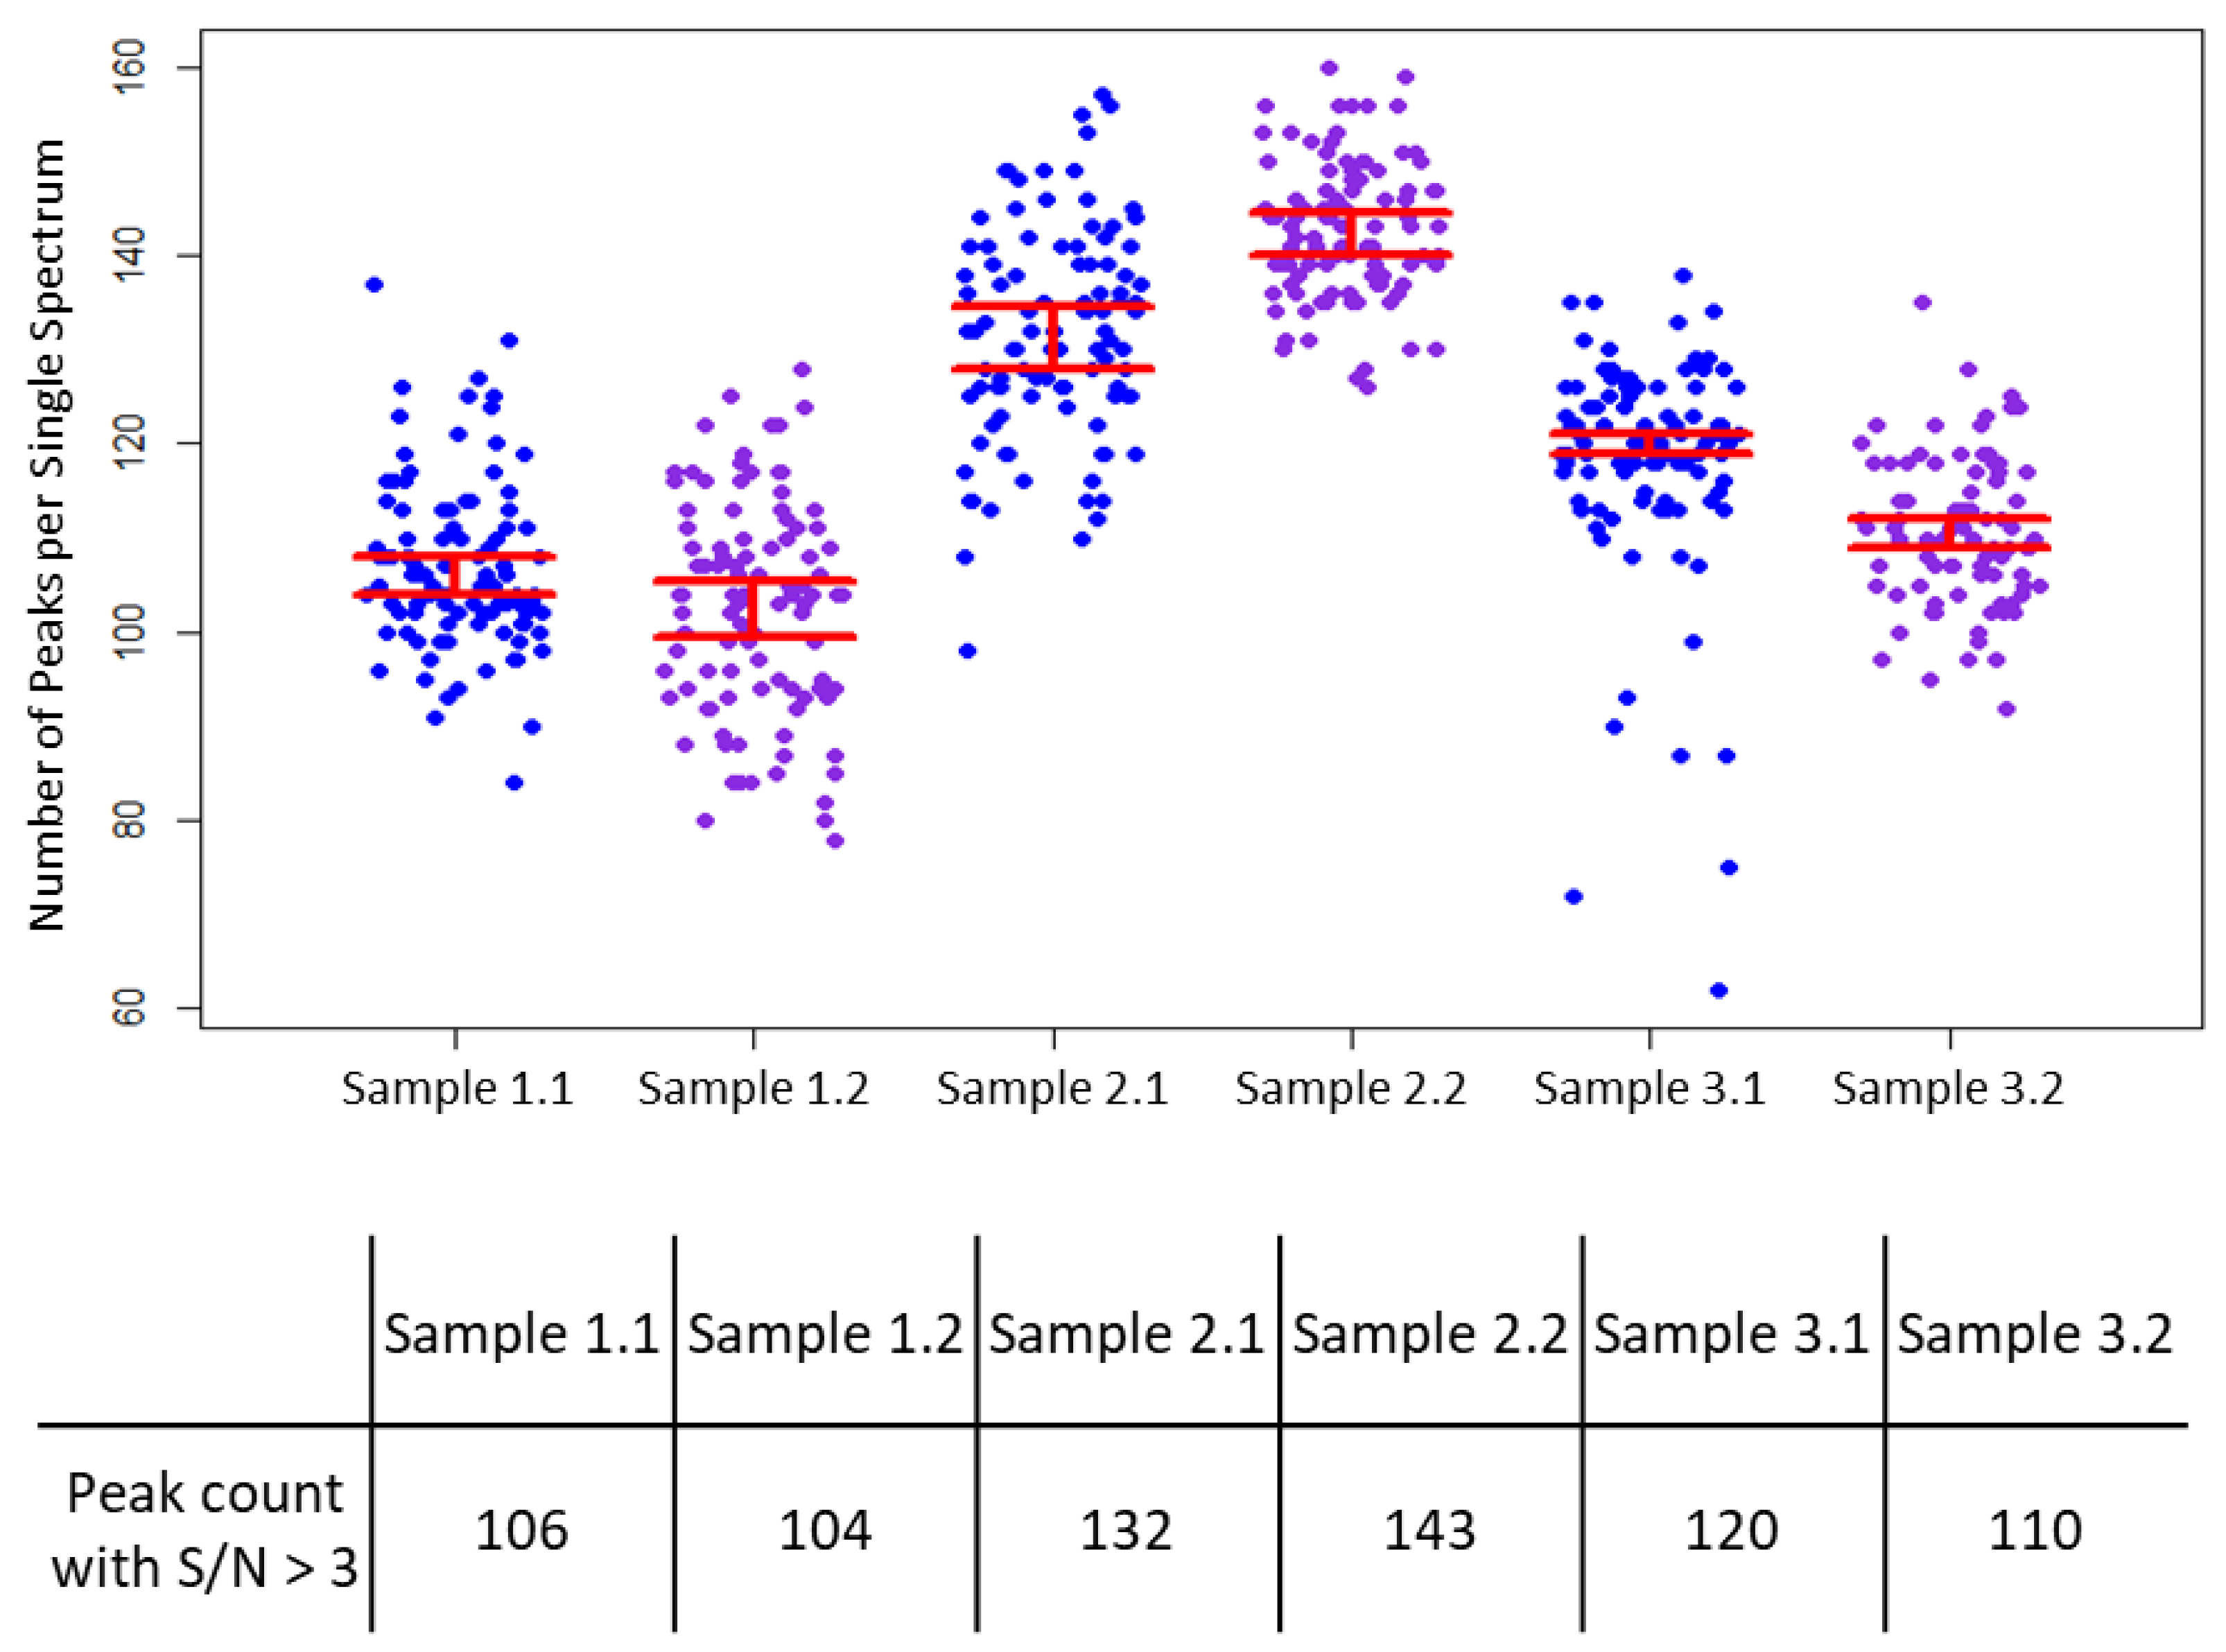
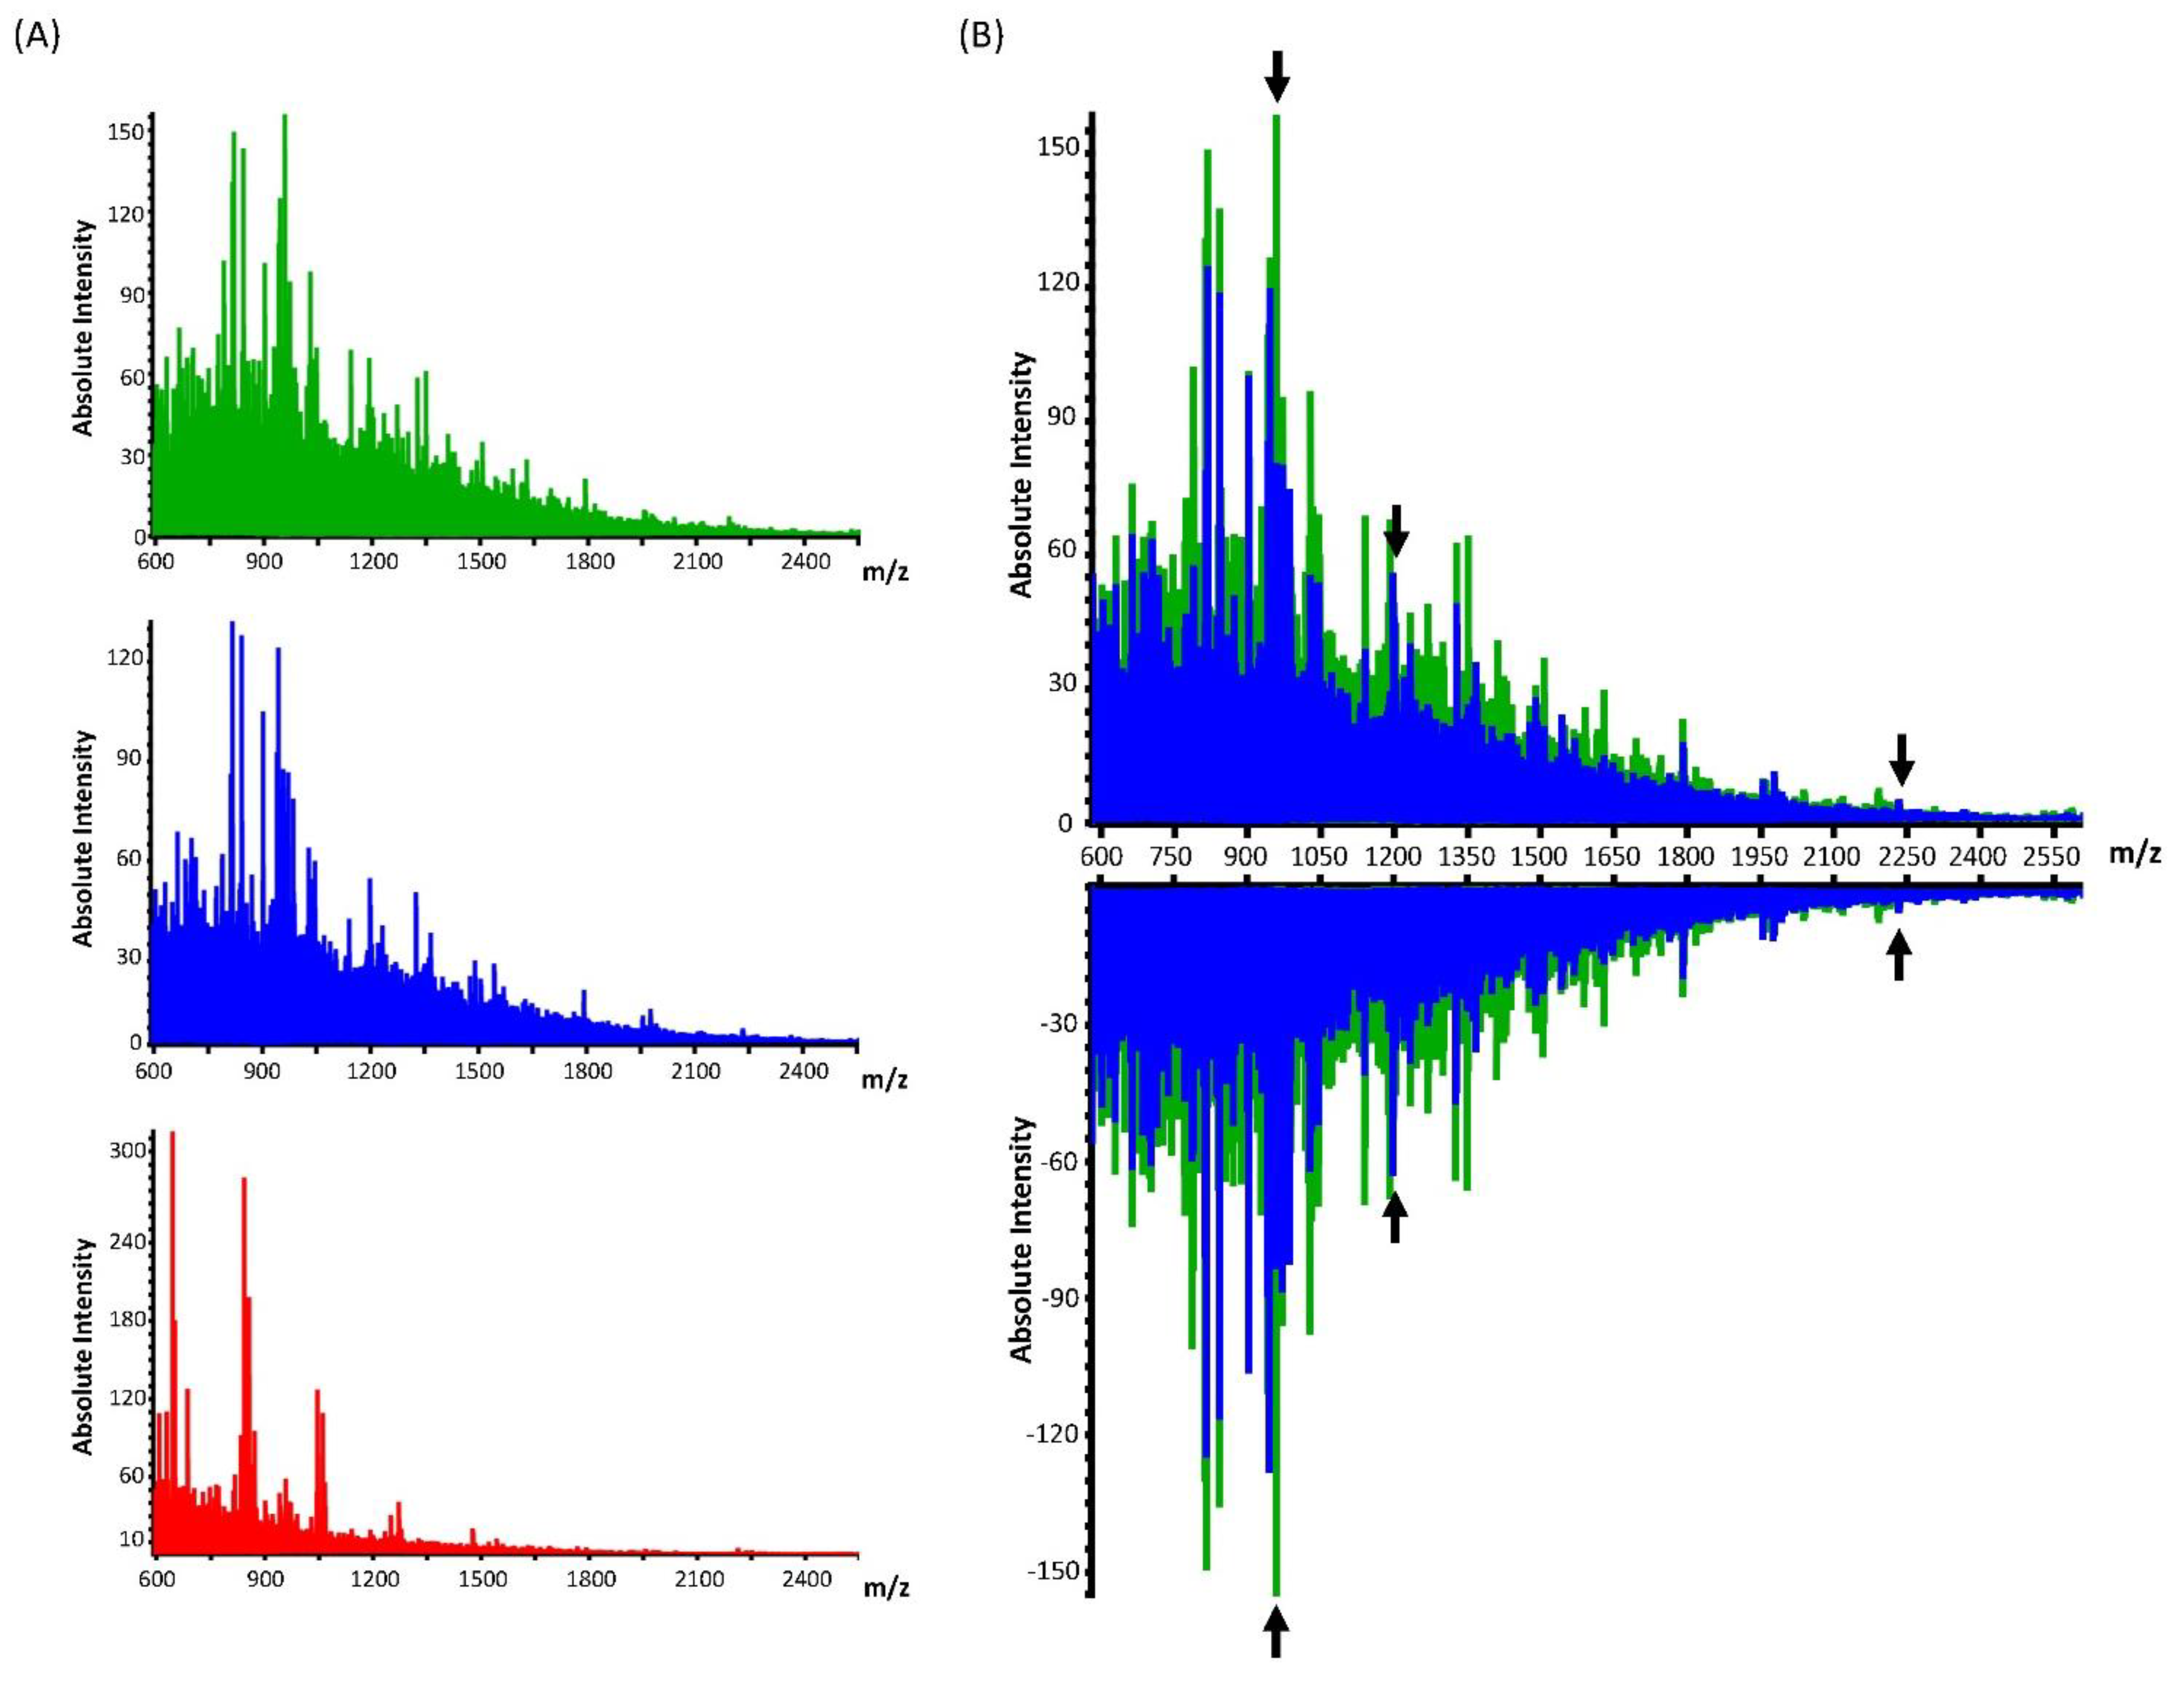
3. Results
4. Discussion
5. Conclusions
Supplementary Materials
Author Contributions
Funding
Institutional Review Board Statement
Informed Consent Statement
Data Availability Statement
Conflicts of Interest
References
- Fung, E.T.; Wright, G.L., Jr.; Dalmasso, E.A. Proteomic strategies for biomarker identification: Progress and challenges. Curr. Opin. Mol. Ther. 2000, 2, 643–650. [Google Scholar] [PubMed]
- Zhou, M.; Conrads, T.P.; Veenstra, T.D. Proteomics approaches to biomarker detection. Brief. Funct. Genom. Proteom. 2005, 4, 69–75. [Google Scholar] [CrossRef] [PubMed]
- McDonald, W.H.; Yates, J.R., 3rd. Shotgun proteomics and biomarker discovery. Dis. Markers 2002, 18, 99–105. [Google Scholar] [CrossRef]
- Longuespée, R.; Casadonte, R.; Schwamborn, K.; Reuss, D.; Kazdal, D.; Kriegsmann, K.; von Deimling, A.; Weichert, W.; Schirmacher, P.; Kriegsmann, J.; et al. Proteomics in pathology. Proteomics 2018, 18, 1700361. [Google Scholar] [CrossRef]
- Rubakhin, S.S.; Sweedler, J.V. Characterizing peptides in individual mammalian cells using mass spectrometry. Nat. Protoc. 2007, 2, 1987–1997. [Google Scholar] [CrossRef] [PubMed]
- Schwamborn, K.; Krieg, R.C.; Uhlig, S.; Ikenberg, H.; Wellmann, A. Maldi imaging as a specific diagnostic tool for routine cervical cytology specimens. Int. J. Mol. Med. 2011, 27, 417–421. [Google Scholar]
- Amann, J.M.; Chaurand, P.; Gonzalez, A.; Mobley, J.A.; Massion, P.P.; Carbone, D.P.; Caprioli, R.M. Selective profiling of proteins in lung cancer cells from fine-needle aspirates by matrix-assisted laser desorption ionization time-of-flight mass spectrometry. Clin. Cancer Res. 2006, 12, 5142–5150. [Google Scholar] [CrossRef]
- Wang, H.; Kachman, M.T.; Schwartz, D.R.; Cho, K.R.; Lubman, D.M. Comprehensive proteome analysis of ovarian cancers using liquid phase separation, mass mapping and tandem mass spectrometry: A strategy for identification of candidate cancer biomarkers. Proteomics 2004, 4, 2476–2495. [Google Scholar] [CrossRef]
- Hamler, R.L.; Zhu, K.; Buchanan, N.S.; Kreunin, P.; Kachman, M.T.; Miller, F.R.; Lubman, D.M. A two-dimensional liquid-phase separation method coupled with mass spectrometry for proteomic studies of breast cancer and biomarker identification. Proteomics 2004, 4, 562–577. [Google Scholar] [CrossRef]
- Li, H.; Tang, Z.; Zhu, H.; Ge, H.; Cui, S.; Jiang, W. Proteomic study of benign and malignant pleural effusion. J. Cancer Res. Clin. Oncol. 2016, 142, 1191–1200. [Google Scholar] [CrossRef]
- Gonçalves, J.P.L.; Bollwein, C.; Schwamborn, K. Mass spectrometry imaging spatial tissue analysis toward personalized medicine. Life 2022, 12, 1037. [Google Scholar] [CrossRef] [PubMed]
- Czétány, P.; Gitta, S.; Balló, A.; Sulc, A.; Máté, G.; Szántó, Á.; Márk, L. Application of mass spectrometry imaging in uro-oncology: Discovering potential biomarkers. Life 2022, 12, 366. [Google Scholar] [CrossRef] [PubMed]
- Caprioli, R.M.; Farmer, T.B.; Gile, J. Molecular imaging of biological samples: Localization of peptides and proteins using maldi-tof ms. Anal. Chem. 1997, 69, 4751–4760. [Google Scholar] [CrossRef]
- Walch, A.; Rauser, S.; Deininger, S.-O.; Höfler, H. Maldi imaging mass spectrometry for direct tissue analysis: A new frontier for molecular histology. Histochem. Cell Biol. 2008, 130, 421–434. [Google Scholar] [CrossRef]
- Kriegsmann, J.; Kriegsmann, M.; Kriegsmann, K.; Longuespée, R.; Deininger, S.O.; Casadonte, R. Maldi imaging for proteomic painting of heterogeneous tissue structures. Proteom. Clin. Appl. 2019, 13, e1800045. [Google Scholar] [CrossRef] [PubMed]
- McDonnell, L.A.; Angel, P.M.; Lou, S.; Drake, R.R. Mass spectrometry imaging in cancer research: Future perspectives. Adv. Cancer Res. 2017, 134, 283–290. [Google Scholar]
- Kriegsmann, J.; Kriegsmann, M.; Casadonte, R. Maldi tof imaging mass spectrometry in clinical pathology: A valuable tool for cancer diagnostics (review). Int. J. Oncol. 2015, 46, 893–906. [Google Scholar] [CrossRef]
- Chung, H.H.; Huang, P.; Chen, C.L.; Lee, C.; Hsu, C.C. Next-generation pathology practices with mass spectrometry imaging. Mass Spectrom. Rev. 2022, e21795. [Google Scholar] [CrossRef]
- Basu, S.S.; Agar, N.Y.R. Bringing matrix-assisted laser desorption/ionization mass spectrometry imaging to the clinics. Clin. Lab. Med. 2021, 41, 309–324. [Google Scholar] [CrossRef]
- Kazdal, D.; Longuespée, R.; Dietz, S.; Casadonte, R.; Schwamborn, K.; Volckmar, A.L.; Kriegsmann, J.; Kriegsmann, K.; Fresnais, M.; Stenzinger, A.; et al. Digital pcr after maldi-mass spectrometry imaging to combine proteomic mapping and identification of activating mutations in pulmonary adenocarcinoma. Proteom. Clin. Appl. 2019, 13, e1800034. [Google Scholar] [CrossRef]
- Kriegsmann, K.; Longuespée, R.; Hundemer, M.; Zgorzelski, C.; Casadonte, R.; Schwamborn, K.; Weichert, W.; Schirmacher, P.; Harms, A.; Kazdal, D.; et al. Combined immunohistochemistry after mass spectrometry imaging for superior spatial information. Proteom. Clin. Appl. 2019, 13, e1800035. [Google Scholar] [CrossRef] [PubMed]
- Hideshima, T.; Anderson, K.C. Signaling pathway mediating myeloma cell growth and survival. Cancers 2021, 13, 216. [Google Scholar] [CrossRef] [PubMed]
- Todoerti, K.; Gallo Cantafio, M.E.; Oliverio, M. Oleil hydroxytyrosol (htol) exerts anti-myeloma activity by antagonizing key survival pathways in malignant plasma cells. Int. J. Mol. Sci. 2021, 22, 11639. [Google Scholar] [CrossRef] [PubMed]
- Morelli, E.; Gullà, A.; Rocca, R.; Federico, C.; Raimondi, L.; Malvestiti, S.; Agosti, V.; Rossi, M.; Costa, G.; Giavaresi, G.; et al. The non-coding rna landscape of plasma cell dyscrasias. Cancers 2020, 12, 320. [Google Scholar] [CrossRef]
- Giles, H.V.; Wechalekar, A.; Pratt, G. The potential role of mass spectrometry for the identification and monitoring of patients with plasma cell disorders: Where are we now and which questions remain unanswered? Br. J. Haematol. 2022, 198, 641–653. [Google Scholar] [CrossRef]
- Hughes, C.S.; McConechy, M.K.; Cochrane, D.R.; Nazeran, T.; Karnezis, A.N.; Huntsman, D.G.; Morin, G.B. Quantitative profiling of single formalin fixed tumour sections: Proteomics for translational research. Sci. Rep. 2016, 6, 34949. [Google Scholar] [CrossRef]
- Slany, A.; Haudek-Prinz, V.; Meshcheryakova, A.; Bileck, A.; Lamm, W.; Zielinski, C.; Gerner, C.; Drach, J. Extracellular matrix remodeling by bone marrow fibroblast-like cells correlates with disease progression in multiple myeloma. J. Proteome Res. 2014, 13, 844–854. [Google Scholar] [CrossRef]
- Glavey, S.V.; Naba, A.; Manier, S.; Clauser, K.; Tahri, S.; Park, J.; Reagan, M.R.; Moschetta, M.; Mishima, Y.; Gambella, M.; et al. Proteomic characterization of human multiple myeloma bone marrow extracellular matrix. Leukemia 2017, 31, 2426–2434. [Google Scholar] [CrossRef]
- Zhang, H.T.; Tian, E.B.; Chen, Y.L.; Deng, H.T.; Wang, Q.T. Proteomic analysis for finding serum pathogenic factors and potential biomarkers in multiple myeloma. Chin. Med. J. 2015, 128, 1108–1113. [Google Scholar] [CrossRef] [PubMed]
- Späth, F.; Wibom, C.; Krop, E.J.M.; Santamaria, A.I.; Johansson, A.S.; Bergdahl, I.A.; Hultdin, J.; Vermeulen, R.; Melin, B. Immune marker changes and risk of multiple myeloma: A nested case-control study using repeated pre-diagnostic blood samples. Haematologica 2019, 104, 2456–2464. [Google Scholar] [CrossRef]
- Łuczak, M.; Kubicki, T.; Rzetelska, Z.; Szczepaniak, T.; Przybyłowicz-Chalecka, A.; Ratajczak, B.; Czerwińska-Rybak, J.; Nowicki, A.; Joks, M.; Jakubowiak, A.; et al. Comparative proteomic profiling of sera from patients with refractory multiple myeloma reveals potential biomarkers predicting response to bortezomib-based therapy. Pol. Arch. Intern. Med. 2017, 127, 392–400. [Google Scholar] [CrossRef] [PubMed]
- Mills, J.R.; Kohlhagen, M.C.; Dasari, S.; Vanderboom, P.M.; Kyle, R.A.; Katzmann, J.A.; Willrich, M.A.; Barnidge, D.R.; Dispenzieri, A.; Murray, D.L. Comprehensive assessment of m-proteins using nanobody enrichment coupled to maldi-tof mass spectrometry. Clin. Chem. 2016, 62, 1334–1344. [Google Scholar] [CrossRef] [PubMed] [Green Version]
- Murray, D.L.; Puig, N.; Kristinsson, S.; Usmani, S.Z.; Dispenzieri, A.; Bianchi, G.; Kumar, S.; Chng, W.J.; Hajek, R.; Paiva, B.; et al. Mass spectrometry for the evaluation of monoclonal proteins in multiple myeloma and related disorders: An international myeloma working group mass spectrometry committee report. Blood Cancer J. 2021, 11, 24. [Google Scholar] [CrossRef]
- Amodio, N.; Stamato, M.A.; Juli, G.; Morelli, E.; Fulciniti, M.; Manzoni, M.; Taiana, E.; Agnelli, L.; Cantafio, M.E.G.; Romeo, E.; et al. Drugging the lncrna malat1 via lna gapmer aso inhibits gene expression of proteasome subunits and triggers anti-multiple myeloma activity. Leukemia 2018, 32, 1948–1957. [Google Scholar] [CrossRef]
- Juli, G.; Oliverio, M. Anti-tumor activity and epigenetic impact of the polyphenol oleacein in multiple myeloma. Cancers 2019, 11, 990. [Google Scholar] [CrossRef] [PubMed]
- Boonstra, H.; Oosterhuis, J.W.; Oosterhuis, A.M.; Fleuren, G.J. Cervical tissue shrinkage by formaldehyde fixation, paraffin wax embedding, section cutting and mounting. Virchows Archiv. A Pathol. Anat. Histopathol. 1983, 402, 195–201. [Google Scholar] [CrossRef]
- Hobro, A.J.; Smith, N.I. An evaluation of fixation methods: Spatial and compositional cellular changes observed by raman imaging. Vib. Spectrosc. 2017, 91, 31–45. [Google Scholar] [CrossRef]
- Chiesa, G.; Kiriakov, S.; Khalil, A.S. Protein assembly systems in natural and synthetic biology. BMC Biol. 2020, 18, 35. [Google Scholar] [CrossRef] [PubMed]
- Molodenskiy, D.; Shirshin, E.; Tikhonova, T.; Gruzinov, A.; Peters, G.; Spinozzi, F. Thermally induced conformational changes and protein-protein interactions of bovine serum albumin in aqueous solution under different ph and ionic strengths as revealed by saxs measurements. Phys. Chem. Chem. Phys. 2017, 19, 17143–17155. [Google Scholar] [CrossRef]
- Kubicki, T.; Bednarek, K.; Kostrzewska-Poczekaj, M.; Luczak, M.; Lewandowski, K.; Gil, L.; Jarmuz-Szymczak, M.; Dytfeld, D. Bortezomib- and carfilzomib-resistant myeloma cells show increased activity of all three arms of the unfolded protein response. Am. J. Cancer Res. 2022, 12, 3280–3293. [Google Scholar]
- Zaal, E.A.; Wu, W.; Jansen, G.; Zweegman, S.; Cloos, J.; Berkers, C.R. Bortezomib resistance in multiple myeloma is associated with increased serine synthesis. Cancer Metab. 2017, 5, 7. [Google Scholar] [CrossRef] [PubMed] [Green Version]


| m/z | Avg. Intensity AMO BZB | Avg. Intensity AMO WT | AUC | Wilcoxon Rank Sum p-Value | Kruskal–Wallis p-Value | Log-Fold-Change |
|---|---|---|---|---|---|---|
| 502.2 | 1579.8 | 88.7 | 1.00 | 0 | 0 | 4.16 |
| 521.3 | 137.2 | 32.9 | 0.99 | 0 | 0 | 2.06 |
| 530.3 | 455.8 | 306.2 | 0.78 | 0 | 0 | 0.57 |
| 549.3 | 359.4 | 67.0 | 0.99 | 0 | 0 | 2.42 |
| 648.3 | 101.5 | 138.1 | 0.02 | 0 | 0 | −0.44 |
| 700.4 | 116.5 | 139.2 | 0.02 | 0 | 0 | −0.26 |
| 717.3 | 101.1 | 135.6 | 0.01 | 0 | 0 | −0.42 |
| 773.4 | 91.2 | 162.1 | 0.00 | 0 | 0 | −0.83 |
| 781.4 | 83.5 | 139.7 | 0.01 | 0 | 0 | −0.74 |
| 815.4 | 104.1 | 171.2 | 0.00 | 0 | 0 | −0.72 |
| 904.4 | 63.3 | 116.1 | 0.00 | 0 | 0 | −0.87 |
| 913.5 | 74.3 | 113.1 | 0.00 | 0 | 0 | −0.61 |
| 927.5 | 72.2 | 141.0 | 0.00 | 0 | 0 | −0.97 |
| 951.4 | 68.2 | 154.5 | 0.00 | 0 | 0 | −1.18 |
| 957.5 | 188.9 | 318.7 | 0.00 | 0 | 0 | −0.75 |
| 991.5 | 61.3 | 111.3 | 0.00 | 0 | 0 | −0.86 |
| 1018.5 | 71.6 | 120.9 | 0.00 | 0 | 0 | −0.76 |
| 1154.5 | 59.5 | 104.7 | 0.00 | 0 | 0 | −0.82 |
| 1198.6 | 157.6 | 110.5 | 0.88 | 0 | 0 | 0.51 |
| 1955.0 | 35.5 | 27.3 | 0.74 | 0 | 0 | 0.38 |
| 2189.9 | 8.3 | 18.1 | 0.01 | 0 | 0 | −1.13 |
| 2231.1 | 16.5 | 11.3 | 0.87 | 0 | 0 | 0.54 |
| 2232.1 | 17.6 | 11.9 | 0.90 | 0 | 0 | 0.56 |
| 2565.2 | 9.1 | 6.3 | 0.79 | 0 | 0 | 0.54 |
| 2585.3 | 8.2 | 10.0 | 0.23 | 2 × 10⁻¹⁴ | 2 × 10⁻¹⁴ | −0.28 |
| 2769.4 | 7.0 | 5.3 | 0.72 | 8 × 10⁻¹⁴ | 8 × 10⁻¹⁴ | 0.39 |
Disclaimer/Publisher’s Note: The statements, opinions and data contained in all publications are solely those of the individual author(s) and contributor(s) and not of MDPI and/or the editor(s). MDPI and/or the editor(s) disclaim responsibility for any injury to people or property resulting from any ideas, methods, instructions or products referred to in the content. |
© 2023 by the authors. Licensee MDPI, Basel, Switzerland. This article is an open access article distributed under the terms and conditions of the Creative Commons Attribution (CC BY) license (https://creativecommons.org/licenses/by/4.0/).
Share and Cite
Casadonte, R.; Kriegsmann, J.; Kriegsmann, M.; Kriegsmann, K.; Torcasio, R.; Gallo Cantafio, M.E.; Viglietto, G.; Amodio, N. A Comparison of Different Sample Processing Protocols for MALDI Imaging Mass Spectrometry Analysis of Formalin-Fixed Multiple Myeloma Cells. Cancers 2023, 15, 974. https://doi.org/10.3390/cancers15030974
Casadonte R, Kriegsmann J, Kriegsmann M, Kriegsmann K, Torcasio R, Gallo Cantafio ME, Viglietto G, Amodio N. A Comparison of Different Sample Processing Protocols for MALDI Imaging Mass Spectrometry Analysis of Formalin-Fixed Multiple Myeloma Cells. Cancers. 2023; 15(3):974. https://doi.org/10.3390/cancers15030974
Chicago/Turabian StyleCasadonte, Rita, Jörg Kriegsmann, Mark Kriegsmann, Katharina Kriegsmann, Roberta Torcasio, Maria Eugenia Gallo Cantafio, Giuseppe Viglietto, and Nicola Amodio. 2023. "A Comparison of Different Sample Processing Protocols for MALDI Imaging Mass Spectrometry Analysis of Formalin-Fixed Multiple Myeloma Cells" Cancers 15, no. 3: 974. https://doi.org/10.3390/cancers15030974