Article

Identification of a Novel Eight-Gene Risk Model for Predicting Survival in Glioblastoma: A Comprehensive Bioinformatic Analysis

by
Huy-Hoang Dang
1,
Hoang Dang Khoa Ta
2,3,
Truc Tran Thanh Nguyen
4,
Chih-Yang Wang
2,3,
Kuen-Haur Lee
2,3,5 and
Nguyen Quoc Khanh Le
6,7,8,9,*
1
International Ph.D. Program for Cell Therapy and Regeneration Medicine, College of Medicine, Taipei Medical University, Taipei 110, Taiwan
2
Ph.D. Program for Cancer Molecular Biology and Drug Discovery, College of Medical Science and Technology, Taipei Medical University and Academia Sinica, Taipei 110, Taiwan
3
Graduate Institute of Cancer Biology and Drug Discovery, College of Medical Science and Technology, Taipei Medical University, Taipei 110, Taiwan
4
Taiwan International Graduate Program in Interdisciplinary Neuroscience, National Taiwan University and Academia Sinica, Taipei 115, Taiwan
5
Cancer Center, Wan Fang Hospital, Taipei Medical University, Taipei 110, Taiwan
6
Professional Master Program in Artificial Intelligence in Medicine, College of Medicine, Taipei Medical University, Taipei 110, Taiwan
7
AIBioMed Research Group, Taipei Medical University, Taipei 110, Taiwan
8
Research Center for Artificial Intelligence in Medicine, Taipei Medical University, Taipei 110, Taiwan
9
Translational Imaging Research Center, Taipei Medical University Hospital, Taipei 110, Taiwan
*
Author to whom correspondence should be addressed.
Cancers 2023, 15(15), 3899; https://doi.org/10.3390/cancers15153899
Submission received: 8 June 2023 / Revised: 26 July 2023 / Accepted: 28 July 2023 / Published: 31 July 2023
(This article belongs to the Special Issue Bioinformatics in Cancer Diagnostics and Screening)

Abstract

:

Simple Summary

People with glioblastoma (GBM) universally have poor survival despite undergoing aggressive treatments. In this study, we aimed to determine genetic biomarkers of GBM that exhibit prognostic implications and examine their role in the tumor microenvironment. To this end, we performed differential gene expression analysis in three independent GBM datasets, followed by establishing a risk model for disease progression. Containing eight genes, this model demonstrated robustness in identifying patient subgroups with poor survival outcome in independent datasets.

Abstract

Glioblastoma (GBM) is one of the most progressive and prevalent cancers of the central nervous system. Identifying genetic markers is therefore crucial to predict prognosis and enhance treatment effectiveness in GBM. To this end, we obtained gene expression data of GBM from TCGA and GEO datasets and identified differentially expressed genes (DEGs), which were overlapped and used for survival analysis with univariate Cox regression. Next, the genes’ biological significance and potential as immunotherapy candidates were examined using functional enrichment and immune infiltration analysis. Eight prognostic-related DEGs in GBM were identified, namely CRNDE, NRXN3, POPDC3, PTPRN, PTPRN2, SLC46A2, TIMP1, and TNFSF9. The derived risk model showed robustness in identifying patient subgroups with significantly poorer overall survival, as well as those with distinct GBM molecular subtypes and MGMT status. Furthermore, several correlations between the expression of the prognostic genes and immune infiltration cells were discovered. Overall, we propose a survival-derived risk score that can provide prognostic significance and guide therapeutic strategies for patients with GBM.

1. Introduction

Glioblastoma (GBM) is one of the most common central nervous system cancers, accounting for nearly half of all malignant tumors [1]. The prognosis of GBM is especially poor, with median overall survival of only 16 months. Most patients relapse even after undergoing aggressive therapies, including surgical resection, radiation, and systemic therapy [2,3]. Ongoing and past clinical trials for recurrent GBM have used a wide range of novel treatments, from cytotoxic chemotherapeutic agents to immunotherapy and gene therapy [4]. However, the substantial heterogeneity of patients in these trials could arguably preclude the generalizability of the interventions, and a better understanding of the molecular features of GBM is needed [2].
Gene expression profiling is one of the most important tools in cancer research [5]. With the identification of patterns of genes expressed at the transcriptional level, it has been leveraged to discover novel prognostic markers and treatment targets. A number of gene expression profiling-derived models has been recently developed for GBM [6,7,8,9,10]. For example, Kawaguchi et al. used random survival forests, a machine learning algorithm, to develop a 25-gene signature that was consistently correlated with overall survival in GBM [8]. Similarly, Cao et al. obtained gene expression data of GBM patients from public datasets and found four significant overlapped differentially expressed genes (DEGs), which was further validated using cell cultures and Western blots of in-house GBM specimens [6]. More recently, Wen et al. built a seven-gene, hypoxia-based prognostic signature that showed high sensitivity and specificity in predicting overall survival and chemotherapeutic response in GBM patients [9].
While these models have been successful in assessing prognosis, their clinical application faces multiple challenges. Our study aims to extend their approach by developing a gene signature with implications in the prognosis of GBM, integrating multiple databases and analyses. We further examined its biological significance and signaling pathways, with the purpose of clarifying how the model can serve as a biomarker in the prognosis and progression of GBM.

2. Materials and Methods

2.1. Data Acquisition and Preprocessing

First, we obtained gene expression from GBM specimens from three publicly available datasets, the TCGA-GBM (The Cancer Genome Atlas) and the gene expression profiles GSE4290 and GSE68848, from the Gene Expression Omnibus (GEO) database [11,12,13,14]. The GSE4290 contained 81 samples of GBM and 23 samples from epilepsy patients as non-tumor samples, detected by the Affymetrix Human Genome U133 Plus 2.0 Array based on the GPL570 platform [14]. Data of astrocytoma and oligodendroglioma samples in GSE4290 were not included in this study. The GSE68848 expression profile contained 580 samples, including 228 GBM and 28 control tissues, detected by the same platform as GSE4290 [12]. Data for other disease types (oligodendroglioma, astrocytoma, mixed, unclassified and unknown) in GSE68848 were also not included in this study. We further included gene expression RNAseq data of normal brain frontal cortex samples (BA9) from the Genotype-Tissue Expression (GTEx) database. The characteristics of the included datasets are given in Table 1. For the TCGA-GBM data, we only included the data of participants with isocitrate dehydrogenase (IDH)-wildtype and omitted those of IDH-mutant patients. This was to accommodate the 2021 WHO classification of tumors of the central nervous system, which defined GBM as strictly IDH-wildtype [15]. IDH mutation status was not available in the GSE4290 and GSE68848 datasets.
Prior to conducting further analyses, we performed data preprocessing to ensure the quality and reliability of the gene expression profiles. This involved the application of principal component analysis (PCA) to identify and remove potential outliers in the datasets. PCA is a dimensionality reduction technique commonly used in gene expression analysis to identify patterns and variability within high-dimensional datasets [16]. Outliers could arise due to various factors such as technical artifacts or experimental variability. These outliers can have a significant impact on downstream analyses and may lead to erroneous interpretations. By performing PCA, we aimed to identify any extreme or deviant samples that might introduce noise or bias into subsequent analyses.

2.2. Analysis of Differentially Expressed Genes (DEGs)

To determine the molecular alterations associated with GBM, we performed a differential gene expression analysis. Specifically, genes expressed differentially between GBM and the control samples were identified, using the R package DESeq2 for TCGA-GBM versus GTEx, and the R package limma for two GEO datasets, GSE4290 and GSE68848 [17,18]. The limma package is a widely used tool in genomics research due to its robustness and flexibility in detecting DEGs. Genes were considered significant if they showed an absolute log fold change greater than 1, indicating a substantial change in expression levels, and an adjusted p-value less than 0.05, reflecting statistical significance after correcting for multiple testing. Then, we overlapped the DEGs lists from three comparisons to identify common genes for further exploration.

2.3. Functional Enrichment Analysis of the DEGs

Functional annotation and enrichment analysis are commonly used bioinformatic tools to help attribute biological information and significance to a group of genes. With the common DEGs determined, we performed Gene Ontology (GO) and Kyoto Encyclopedia of Genes and Genomes (KEGG) pathway enrichment analyses using the R package gProfiler to identify the DEGs pathways [19]. GO is the standardized vocabularies of genes and their products, consisting of three independent semantics: biological processes, cellular components, and molecular functions [20]. The Kyoto Encyclopedia of Genes and Genomes (KEGG) is a knowledge hub for gene function analysis, linking genes to higher-order functional information [21]. p < 0.05 was considered the statistically significant threshold.

2.4. Risk Score Construction and Validation

We next obtained survival data of GBM patients and used univariate Cox regression analysis on the 1934 DEGs. This was performed using the TCGA-GBM dataset with IDH-wildtype participants, as survival data were not available in GSE4290 and GSE68848. Genes significantly correlated with overall survival with p < 0.001 were selected. Next, we calculated the risk score for each participant as follows:
G e n e   E x p r e s s i o n     C o e f f i c i e n t
Participants were subsequently classified into the high- and low-risk group based on their risk score being higher or lower than the median cutoff value. To validate the predictive power of this prognostic model beyond the TCGA-GBM dataset, we applied Formula (1) for GBM patients from the Chinese Glioma Genome Atlas (CGGA) database and from the GEO dataset GSE43378 [8,22]. The GSE43378 dataset contains gene expression and survival data of 32 patients with GBM. Furthermore, using the R package timeROC, we tested the performance of the risk model as a marker for GBM over time in the TCGA-GBM dataset [23]. In contrast to the standard receiver operating characteristic (ROC) curve analysis which regards the marker value and disease status of a person as fixed for the whole study period, time-dependent ROC allows these variables to change over time, which better reflects conditions in real life [24].

2.5. Characterization of the Risk Model-Based Subgroups

We next investigated the relationship between the risk score and clinical characteristics, including MGMT status and between tumor-intrinsic gene expression subtypes of GBM [25]. MGMT encodes the enzyme O6-alkylguanine DNA alkyltransferase that is responsible for DNA repair following alkylating agent chemotherapy. As such, methylation of the MGMT promoter leads to loss of expression of the MGMT DNA repair protein, which predicts a benefit from chemotherapy and improved survival in GBM [26]. It is considered to be a highly recommended key molecular diagnostic test in GBM. Tumor-intrinsic subtypes of GBM included the proneural, classical, mesenchymal, and neural subtypes, which were previously identified from data of 200 GBM samples [27]. This classification model has since been used extensively to find distinct responses to treatment options and revised to ensure that all subtypes contain actual tumor cells [28].
We then predicted the upstream regulators (transcription factors, TFs) of the risk-related gene candidates using NetworkAnalyst (version 3.0, http://www.networkanalyst.ca, accessed on 24 June 2023) [29]. TF–gene interaction analysis was performed with the ChIP Enrichment Analysis (ChEA) database [30].
Next, we performed gene set variation analysis (GSVA) to compare metabolic signatures between the high and low risk groups. GSVA is a computational method that can estimate pathway and bioprocess activity scores from gene expression data [31]. Specifically, we employed the GSVA R package GSVA, implementing the single-sample gene set enrichment analysis (ssGSEA) method [31,32,33].

2.6. Relationship between the Prognostic Genes and Immune Infiltration in GBM

Finally, we performed immune cell infiltration analysis using the CIBERSORT and MCP-counter (Microenvironment cell populations-counter) methods. In the TCGA dataset, CIBERSORT was used to estimate the proportion of 22 immune cell types, and the correlation between the expression level of genes in the risk score and the abundance of the immune cells was calculated [34]. Similarly, MCP-counter enables the quantification of the absolute abundance of eight immune and two stromal cell populations in GBM tissues from transcriptomic data [35].

3. Results

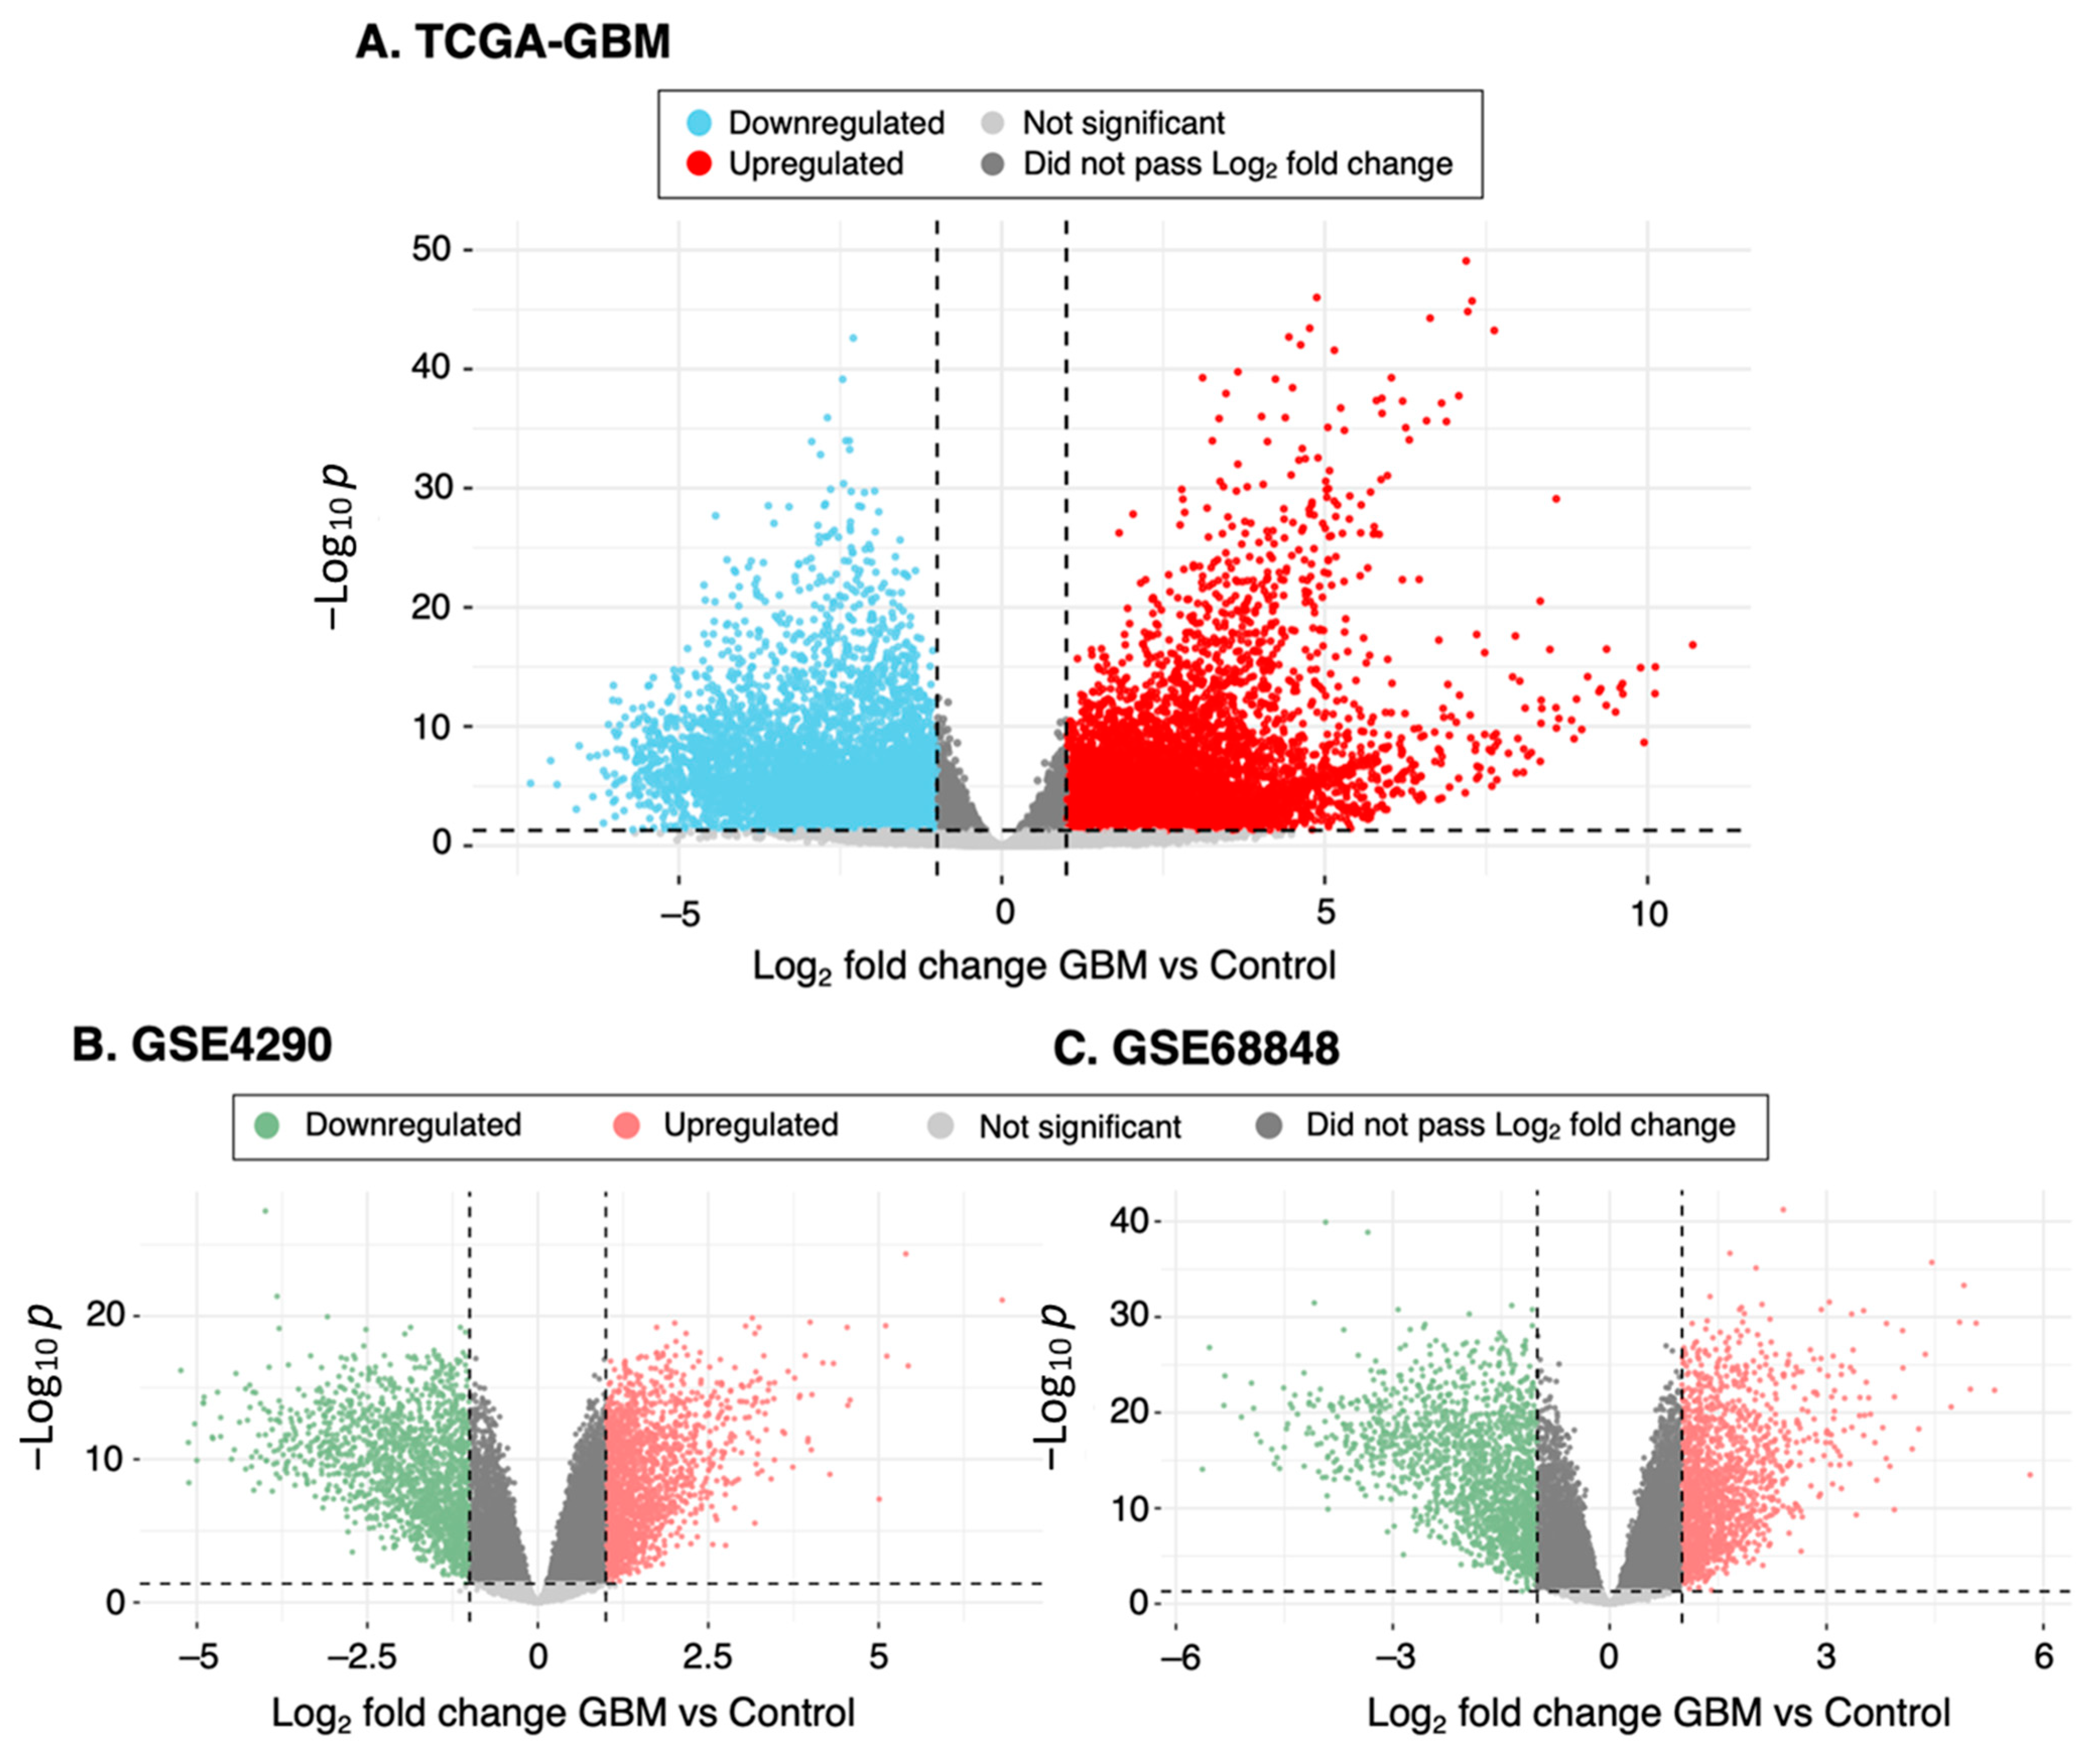
3.1. Identification of DEGs from GBM Datasets

Our study obtained microarray data of GBM and control specimens from four datasets: TCGA-GBM, GTEx, GSE4290 and GSE68848. Data preprocessing with PCA identified six potential outliers in the GSE4290 dataset, which were removed from subsequent analyses (Supplementary Material Figure S1). Using the cutoff criteria of absolute log fold change greater than 1 and adjusted p value less than 0.05, we identified 11,769 DEGs from TCGA-GBM versus GTEx, including 7121 upregulated and 4648 downregulated genes. GSE4290 had 3860 DEGs, with 2031 upregulated and 1829 downregulated ones. There were 3277 DEGs in GSE68848, including 1544 upregulated and 1733 downregulated genes. By overlapping these DEGs, we found 1934 genes that were significantly differentially expressed among the four datasets (Figure 1, Supplementary Table S1).

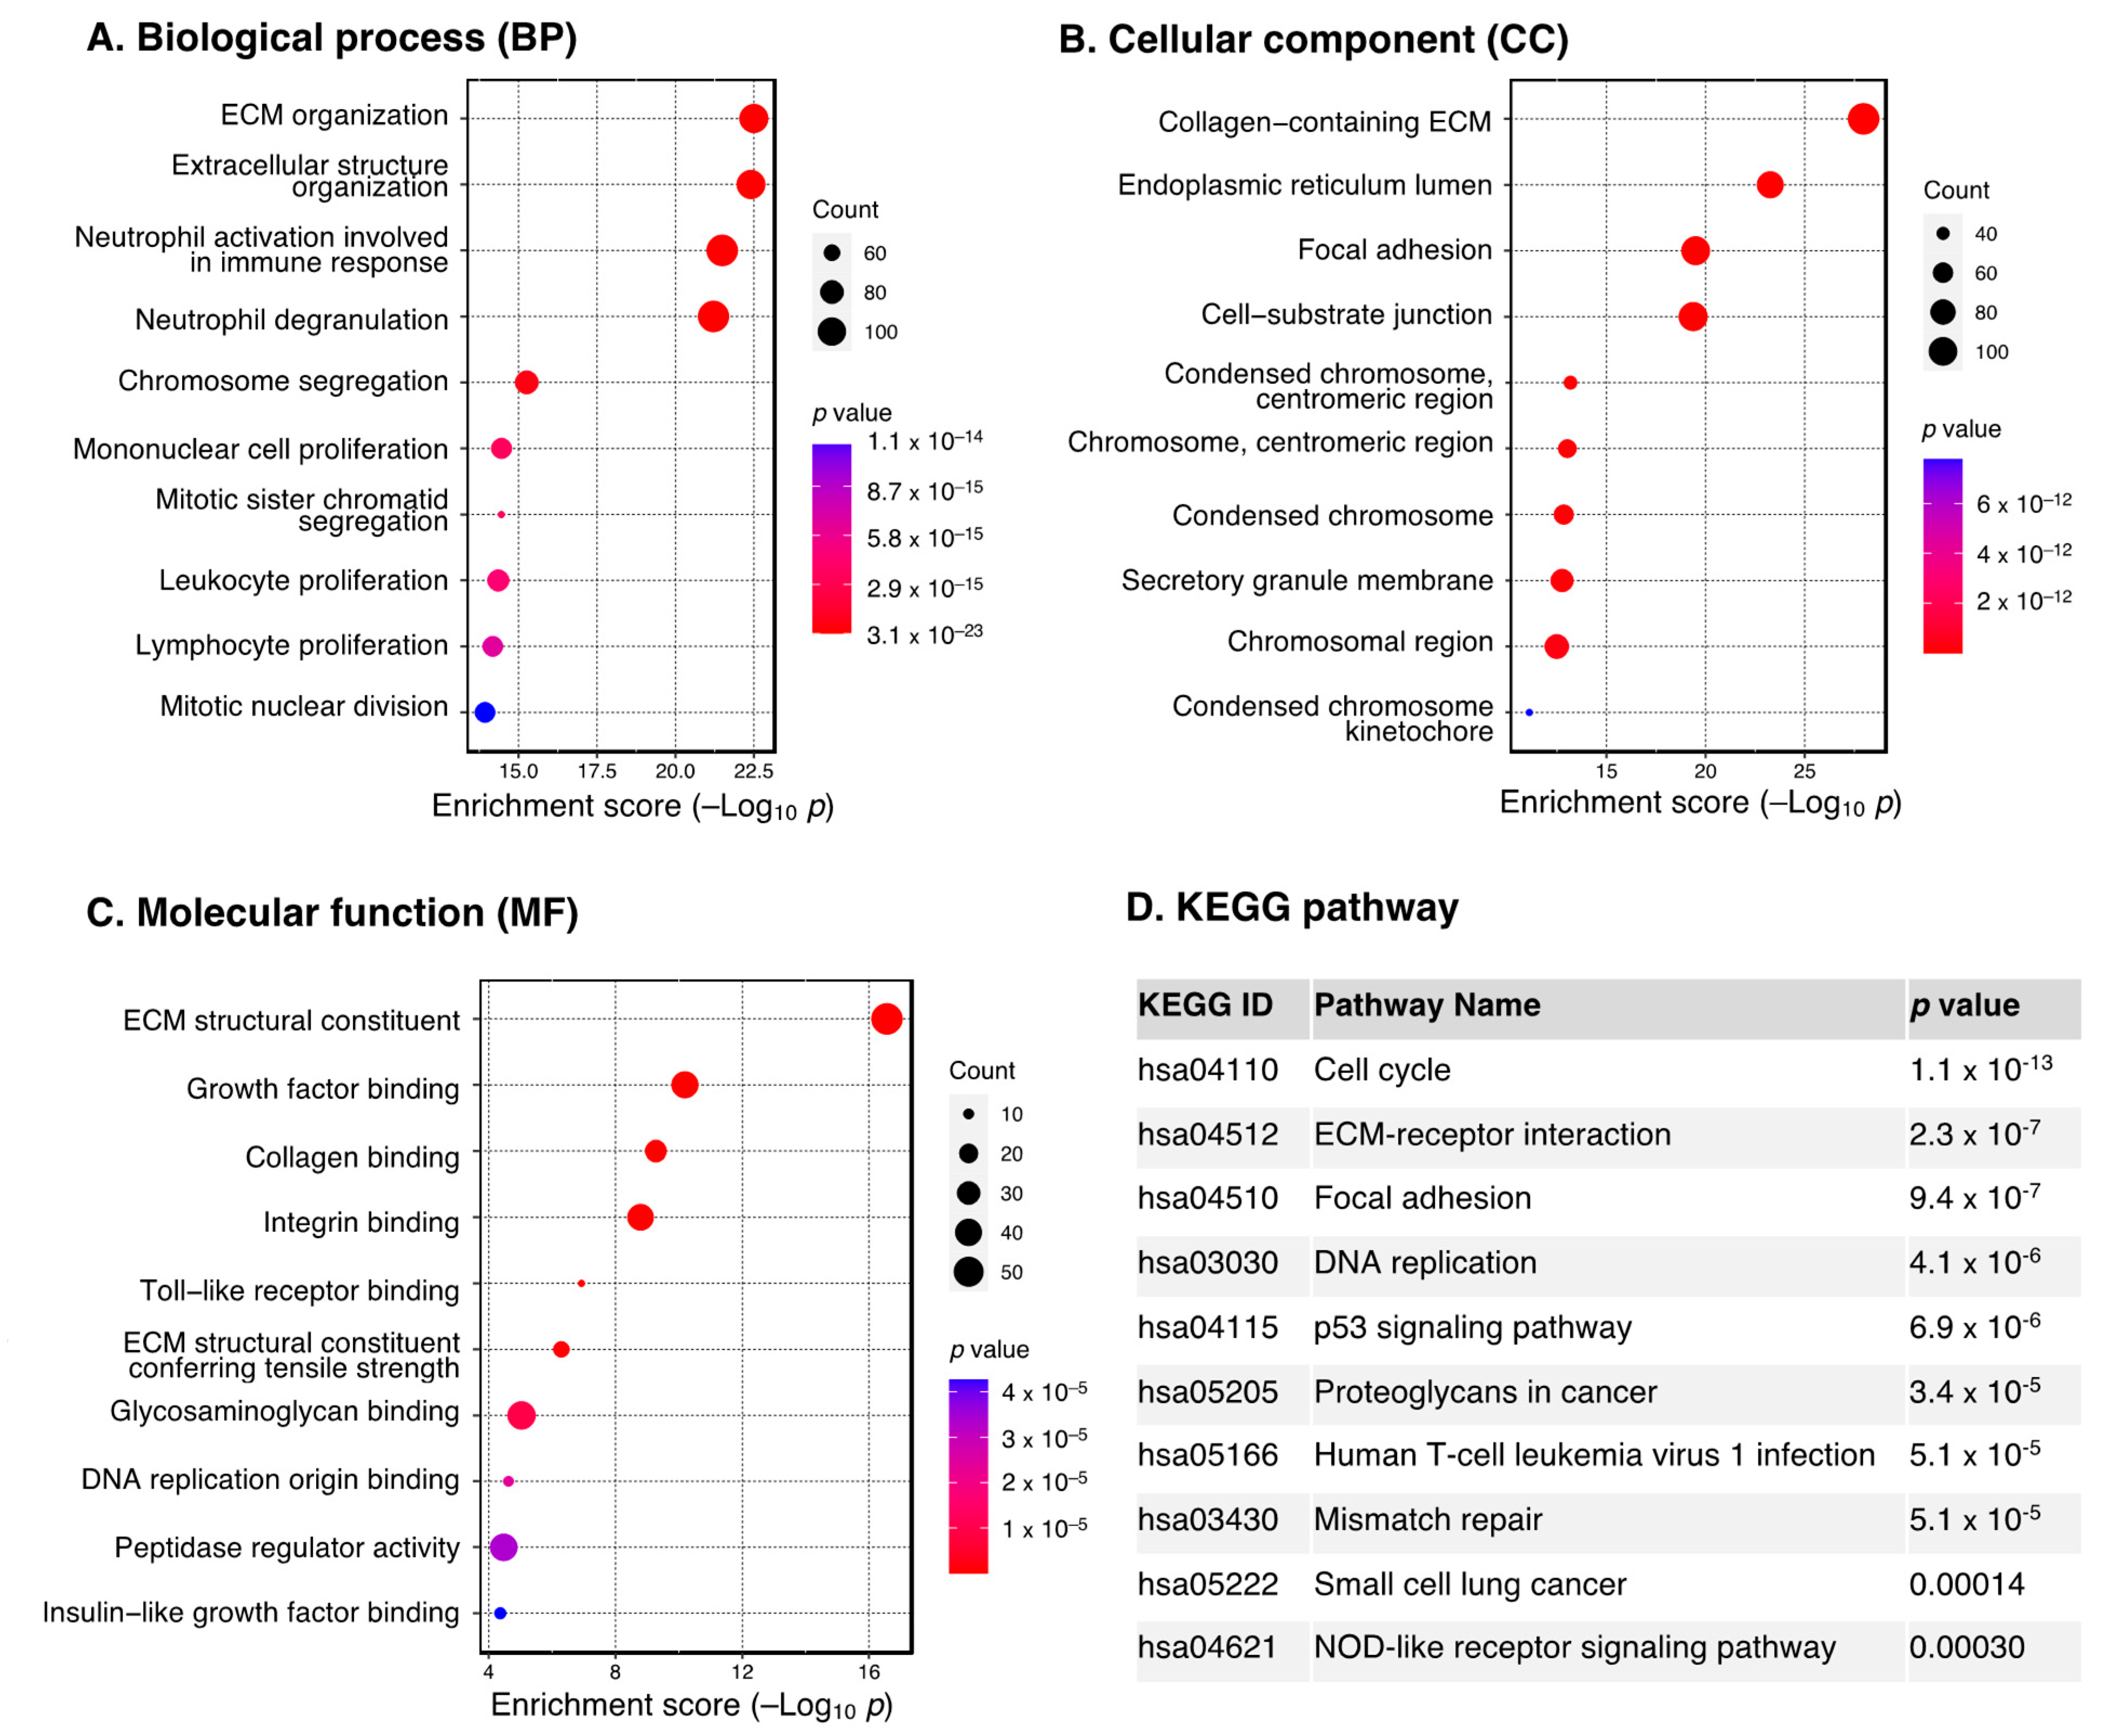
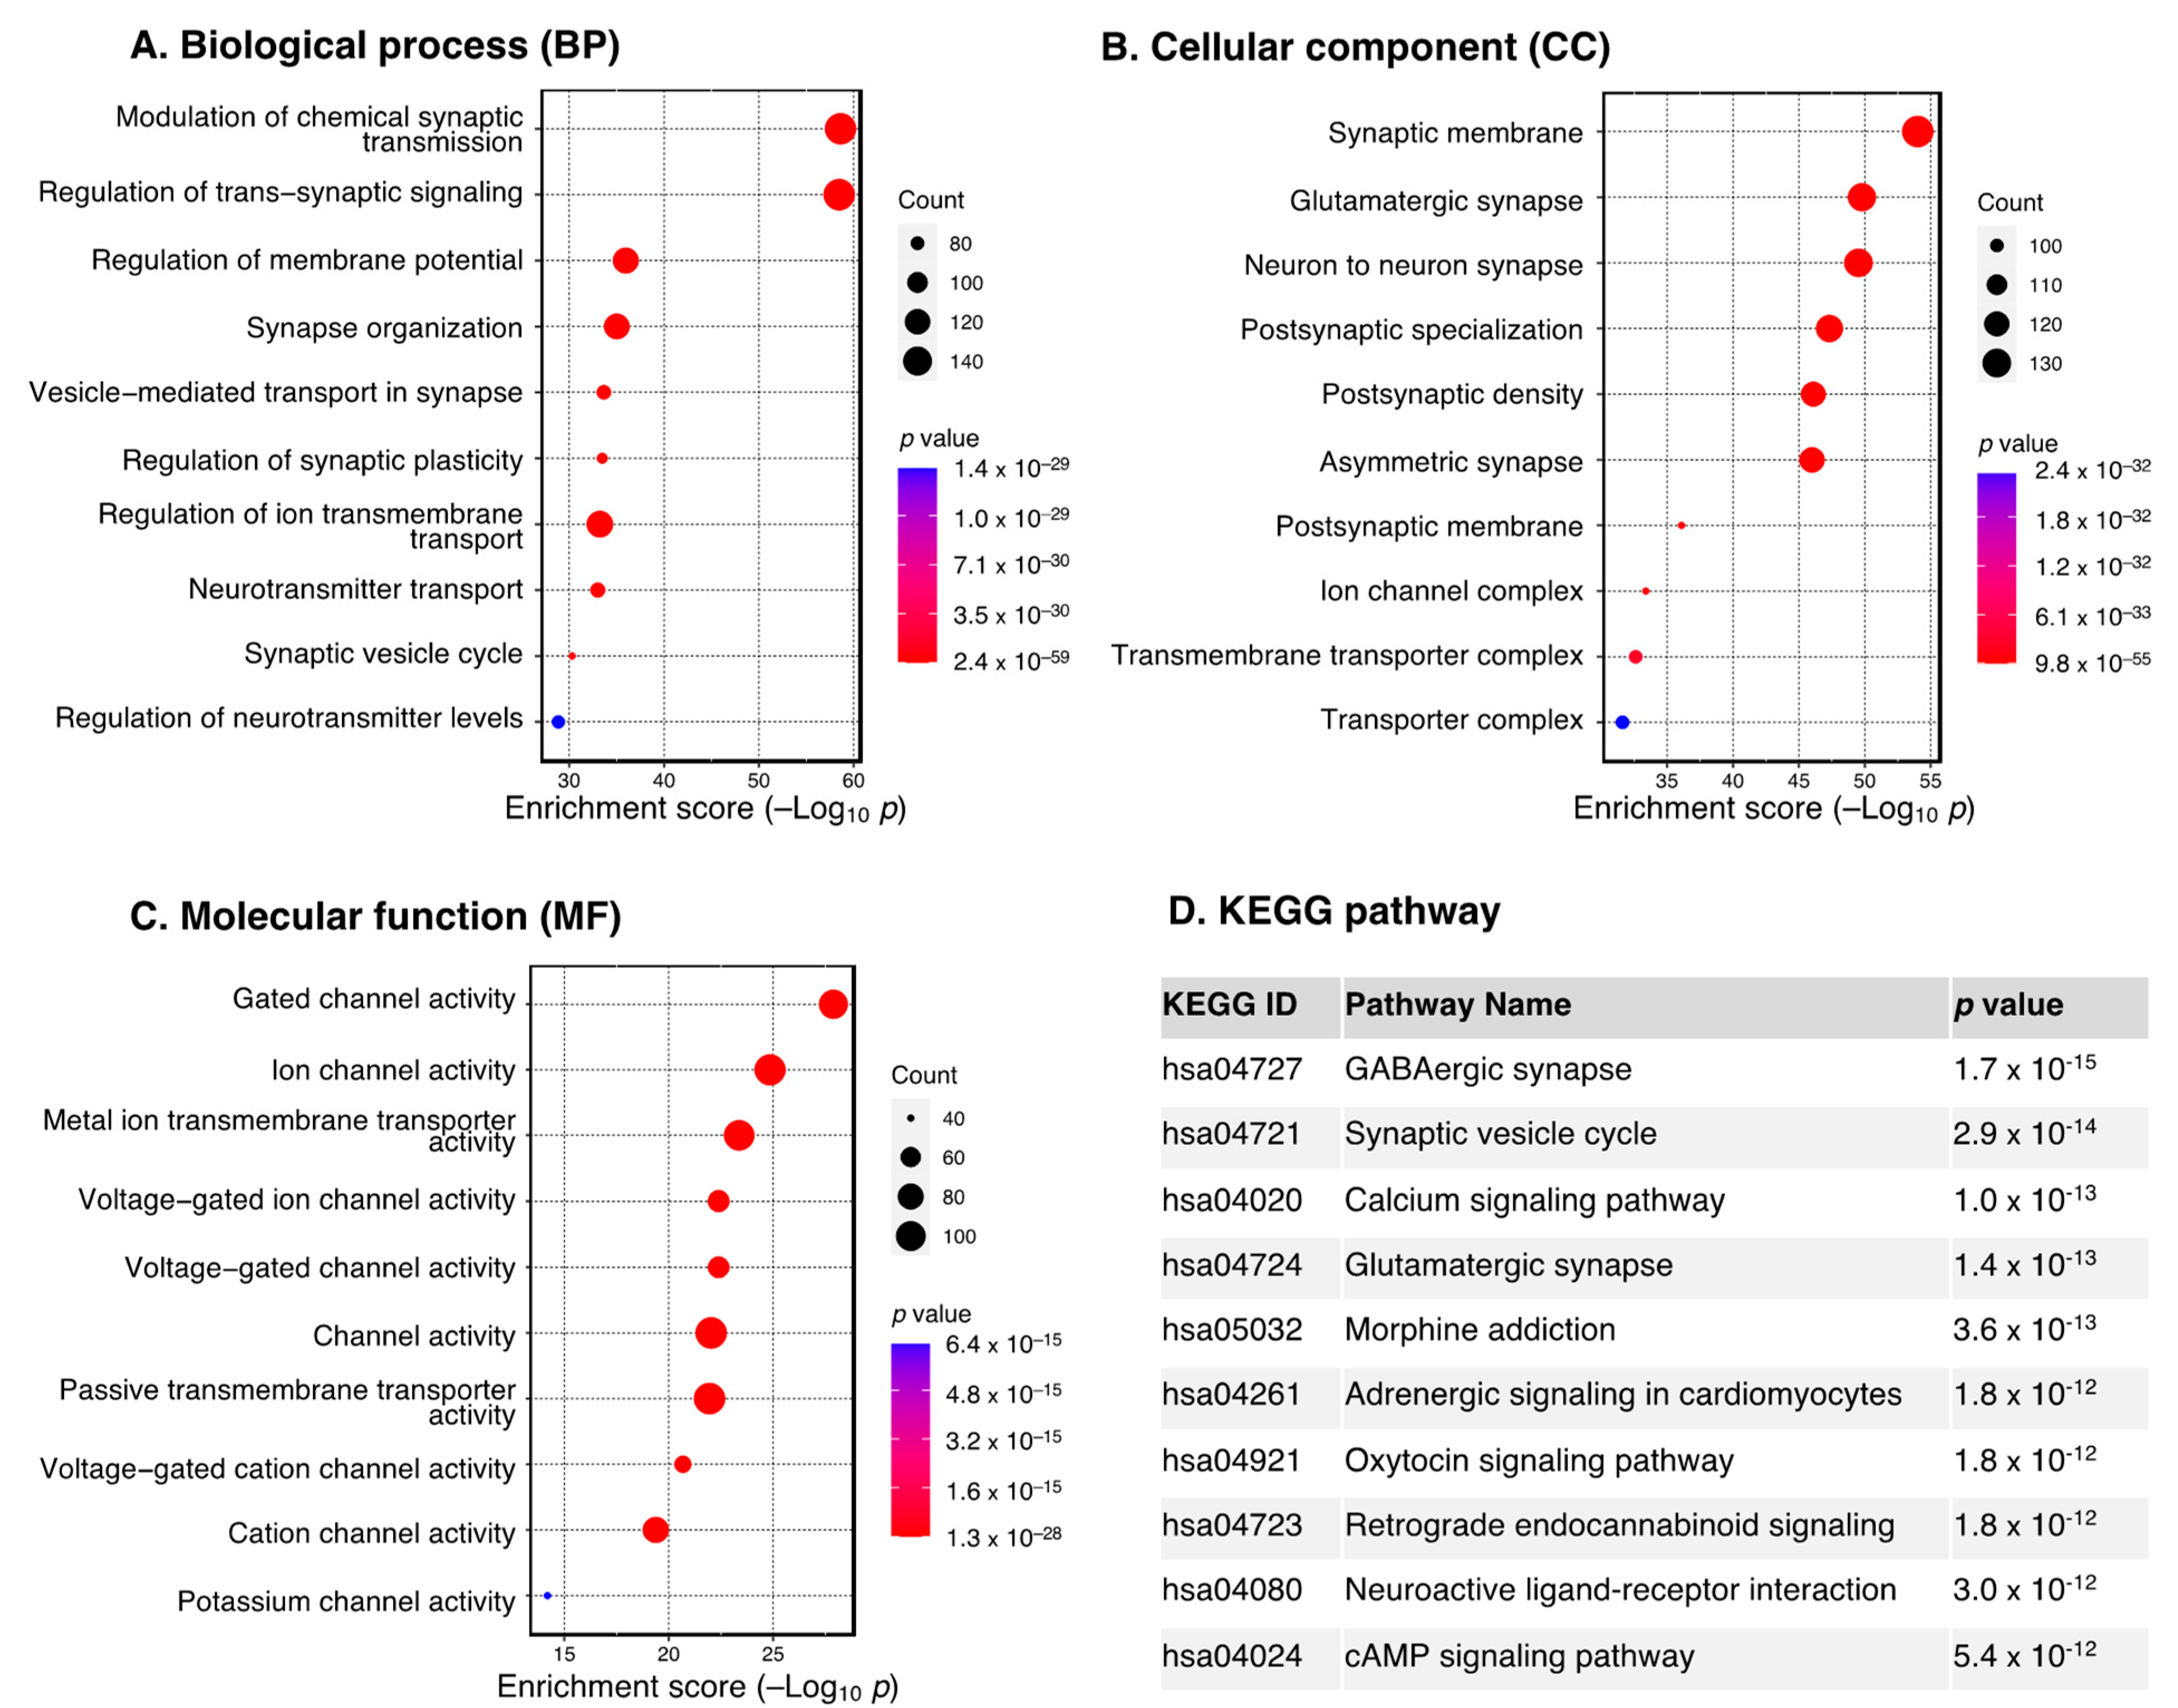
3.2. Functional Enrichment Analysis of DEGs

We performed GO enrichment analysis to explore the biological processes (BP), cellular components (CC), and molecular functions (MF) associated with the DEGs, separately for those that were consistently upregulated (939 DEGs) or downregulated across the three comparisons of DEG analysis (733 DEGs).
The ten most enriched GO terms for the upregulated DEGs are shown in Figure 2A–C. We found that they were mostly involved in the extracellular matrix (ECM), as evident from the most significant GO terms (BP: extracellular matrix and structure organization, CC: collagen-containing ECM, MF: ECM structural constituent). This is consistent with KEGG results, which showed extracellular matrix–receptor interaction as one of the most significantly enriched pathways (Figure 2D).
Downregulated DEGs, on the other hand, were mostly enriched in the regulation of synaptic structure and function, as seen from the GO terms (BP: modulation of chemical synaptic transmission, regulation of trans–synaptic signaling and synaptic plasticity; CC: synaptic membrane, glutamatergic synapse; MF: gated and ion channel activity) (Figure 3A–C). This is also in line with the KEGG results, which revealed GABAergic synapse, synaptic vesicle cycle, and calcium signaling pathway as the three most significant pathways (Figure 3D).

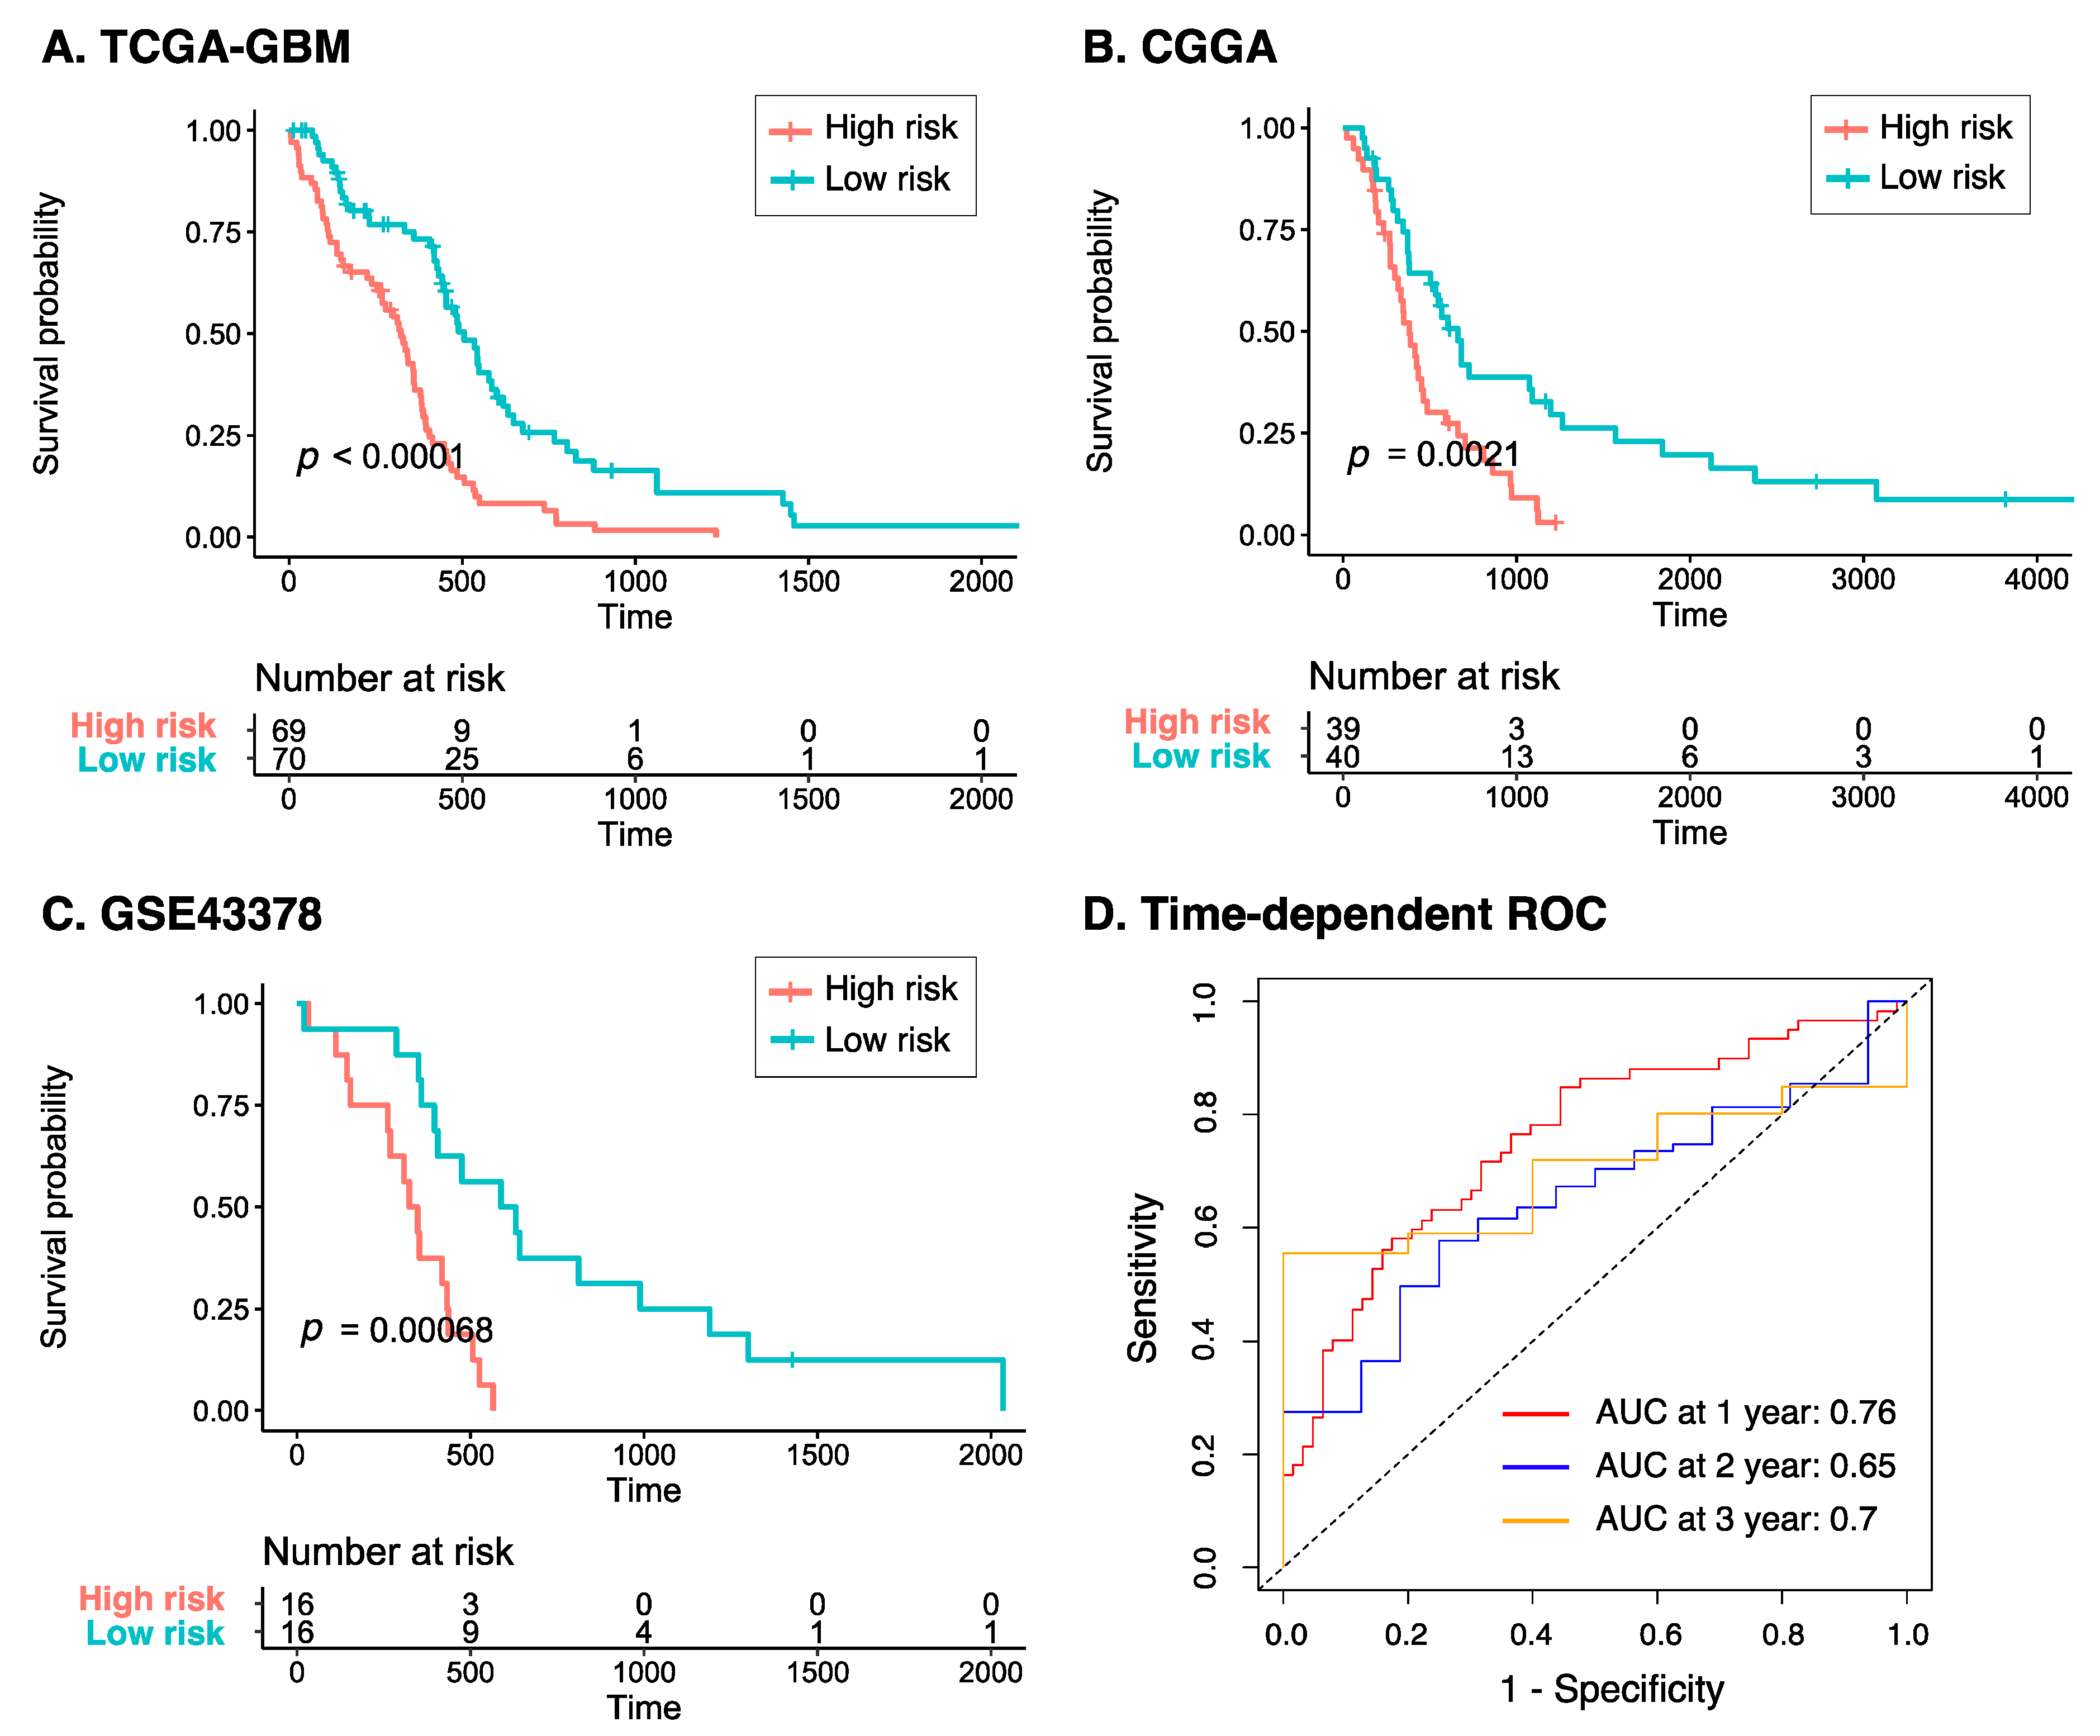
3.3. Identification of Prognosis-Related Genes and Construction of Risk Model

To investigate the prognostic value of the DEGs, we applied univariate Cox regression analysis using overall survival data from the TCGA-GBM dataset with a cutoff of a p-value less than 0.001. This results in eight genes, namely CRNDE, NRXN3, POPDC3, PTPRN, PTPRN2, SLC46A2, TIMP1, and TNFSF9 (Table 2). Statistical values of all 1934 DEGs are provided in Supplementary Table S2. Next, a risk score of disease progression for each patient was calculated using the gene expression and coefficient of the eight genes as the following formula:
Risk score = (0.00047 × CRNDE) + (0.00067 × NRXN3) + (0.00202 × POPDC3) + (0.00017 × PTPRN) + (0.00012 × PTPRN2) + (0.06594 × SLC46A2) + (9.03 × 10⁻⁶ × TIMP1) + (0.00361 × TNFSF9)
Patients were subsequently categorized into the high- and low-risk groups based on their risk score greater or less than the median value, respectively. As shown in Figure 4A, the Kaplan–Meier plot of the eight-gene risk model reveals that the high-risk group had significantly poorer overall survival compared to the low-risk group (p < 0.0001). To further validate the predictive value of the model, a similar analysis was performed on two independent datasets, CGGA and GSE43378, which interestingly showed consistent results with those from TCGA-GBM (p < 0.005 for all two datasets, Figure 4B,C). In addition, the time-dependent ROC curve of the risk model to predict 1-, 3-, and 5-year overall survival of GBM patients in TCGA-GBM is presented in Figure 4D. It can be seen from the reported area under the ROC (AUC) curve that the model performed increasingly better over the years, with 1-, 3-, and 5-year AUCs of 0.76, 0.65, and 0.7, respectively. This signifies that our eight-gene risk model could be a reliable tool to assess prognosis in GBM.

3.4. Characteristics of the Eight-Gene Risk Model

As our eight-gene risk model was able to prognostically classify patients with GBM, we next sought to examine its correlation with other clinical characteristics of GBM, including molecular subtypes and MGMT status. Figure 5A,B show that the risk score in MGMT-methylated GBM patients was significantly lower than that of MGMT-unmethylated patients in both the TCGA and CGGA datasets (p value 0.03 and 0.007, respectively), which is consistent with the fact that patients with MGMT-unmethylated tumors have poorer prognosis and are less responsive to standard therapies [36]. This suggests that while MGMT was not among the genes in our risk model, it could partly explain the model’s prognostic role. We further compared the risk score in different molecular subtypes of GBM, in which we excluded data for the neural subtype, as this subtype was found to have a high content of non-tumor cells [25,28]. Figure 5C shows that the risk score did not differ significantly between the proneural, mesenchymal and classical tumors, consistent with previous reports that there were no significant differences in survival outcome between these three subgroups [25].
Using NetworkAnalyst, we observed a TF–gene biomarker regulatory network including 143 interaction pairs among 7 seed genes (in red) and 86 TFs (in purple) (Supplementary Figure S2). Specifically, PTPRN2 was regulated by the most TFs (38 TFs), followed by NRXN3 and TNFSF9 (27 and 21 TFs, respectively).
Finally, we investigated the tumor-infiltrating immune cell profile of our risk model. Using the CIBERSORT method, we found that the expression of 4 out of the 22 immune cells was significantly different between the low- and high-risk groups, including the regulatory T cells, activated natural killer cells, activated dendritic cells, and neutrophils (Figure 6A). Remarkably, analysis of immune infiltration using the MCP-counter method showed that 9 out of 10 tissue-infiltrating immune and stromal cell populations were more abundant in the high-risk group (Figure 6B). Similarly, nearly all tumor microenvironment, tumor signature and epithelial–mesenchymal transition (EMT) signatures were significantly higher in the high-risk group than the low-risk group (Figure 6C–E). This suggests that our eight-gene prognostic signature is considerably correlated with measures of tumor immune infiltrates in GBM.

4. Discussion

GBM is the most prevalent and progressive brain malignancy. People with GBM reportedly have a median overall survival of only 16 months, despite undergoing an aggressive array of treatments, including surgery, radiotherapy and chemotherapy [2]. In this study, we performed differential gene expression analysis in three independent GBM datasets, followed by establishing a risk model for disease progression using clinical data obtained from the TCGA database. This risk model contained eight genes and was further validated in two other GBM datasets, which demonstrated its robustness in identifying patient subgroups with prognostic implications. Furthermore, significant differences in the risk score were also identified in patients with distinct GBM molecular subtypes and MGMT status.
Our study aims to determine prognostic markers of GBM, with the identification of DEGs followed by survival analysis. The concept of DEGs stems from the availability of the expression of mRNA transcripts, which allows the identification of genes that are significantly differentially expressed across two or more conditions—in this context, GBM and normal controls. It is one of the most common steps in analyzing microarray and RNA-seq data [37]. However, critics have argued that while DEGs can help to serve as clinical biomarkers or obtain mechanistic insights into diseases, they do not necessarily represent causes between gene expression and phenotypes, and rather could be consequences or simply correlations [38]. There are a few approaches to circumvent this issue. For instance, baseline characteristics of participants, such as age, sex, and treatment status, are known to be a significant source of variations in differential expression testing [38,39]. Incorporating them into the DEG analytical workflow was unfortunately not possible in our study due to the lack of clinical data in the GEO datasets. Alternatively, one could start with a hypothesis about a gene or set of genes of interest, e.g., whether they are related to a pathway known to drive cancers, as was performed in our previous publications [40,41].
Our risk model was constructed based on eight genes which have been individually revealed to play a wide range of roles in the development and prognosis of GBM. CRNDE (colorectal neoplasia differentially expressed), whose transcripts were categorized as long non-coding RNAs, was significantly overexpressed in glioma tissues compared to control brain tissues [42,43]. Zhao et al. further reported that knockdown of CRNDE improves sensitivity to temozolomide, a first-line chemotherapy treatment for GBM, by regulating autophagy [44]. NRXN3 (neurexins 3) belongs to the Neurexins family, which are neuronal cell surface proteins, and play roles in cell adhesion and recognition [45]. It was shown to be downregulated in gliomas and inhibited the invasion and migration of tumor cells [46]. NRXN3 expression is directly regulated by Forkhead box Q1, a member of the Fox transcription factor family that regulates the cell cycle, leading to promotion proliferation and the migration of GBM cells in vitro [45]. PTPRN (tyrosine phosphatase receptor type N) is highly expressed in endocrine cells and neuroendocrine neurons, including the pituitary, amygdala and hypothalamus. Wang et al. demonstrated that PTPRN overexpression promoted the migration and proliferation of glioma cells via activating the PI3K/AKT pathway, an intracellular signaling pathway known for regulating the cell cycle.
TIMP1 (tissue inhibitor of matrix metalloproteinase 1) was shown to be correlated with cancer progression, specifically in GBM, and is significantly overexpressed in tumor-infiltrating lymphocytes [47]. As its name suggests, TIMP1 protein could inhibit the proteolytic activity of matrix metalloproteinases, which are endopeptidases that degrade the extracellular matrix, thus explaining its role in metastasis [48]. TNFRSF9 (tumor necrosis factor receptor superfamily member 9, also known as CD137) is a costimulatory transmembrane protein expressed on leukocytes that stimulates B cell antibody secretion and T-cell proliferation [49]. Thus, its role as a possible immunotherapy option for GBM has been explored, with Blank et al. reporting a novel TNFRSF9-positive reactive astrocytic phenotype in human gliomas [50]. In another study, TNFRSF9 was included in three immune-related genes’ signatures that could serve as independent prognostic factors for GBM patients [51]. The role of the remaining genes in the risk model, POPDC3 (Popeye Domain Containing 3), PTPRN2 (Protein Tyrosine Phosphatase Receptor Type N2), and SLC46A2 (Solute Carrier Family 46 Member 2,) in GBM remains largely unknown, though each has been found to be potential biomarkers in other types of cancer [52,53].
The main limitation of this study is that data were largely procured from online databases. Part of the DEG analysis was performed using microarray data from GEO datasets, which are known to be inferior in the quality of transcriptome profiling compared to RNA-Seq data [54]. Nonetheless, the important steps in our analytical pipeline, specifically the DEG analysis and inquiry of prognostic implications of the model, were constructed using multiple independent datasets, hoping to offset the likelihood of false discoveries. Importantly, the preliminary nature of the findings encourages further experimental validations to confirm them. One other relevant implication is to consider the application of public databases in light of the latest WHO classification of tumors of the central nervous system in 2021. The entity that was previously IDH-mutant GBM is now referred to as IDH-mutant astrocytoma WHO grade 4, owing to the discovery of the significance of IDH mutations in the prognosis of diffuse gliomas [15]. Specifically, IDH-mutant tumors have a better prognosis than that of IDH-wildtype tumors, across all histologic grades [55]. Understandably, IDH status is not available in all GEO datasets of GBM patients, and thus the derived analysis would unavoidably include a subset of participants with its mutations. While it would take time for datasets collected after the 2021 WHO classification to include only those with IDH-wildtype status as GBM and be increasingly available, for the current study we strived to include data of only IDH-wildtype GBM patients where applicable.

5. Conclusions

Our study proposed a prognosis-derived risk score that can have prognostic implications for patients with GBM, which was validated in three independent datasets. The findings could possibly shed light on future treatment strategies for this progressive disease.

Supplementary Materials

The following supporting information can be downloaded at: https://www.mdpi.com/article/10.3390/cancers15153899/s1, Figure S1: PCA results of the GSE4290 dataset, Figure S2. Network analysis of the eight-gene signature, Table S1: Full list of DEGs from comparison between GBM and control samples, Table S2: Results of Cox regression analysis on 1934 DEGs.

Author Contributions

Conceptualization, H.-H.D., H.D.K.T. and N.Q.K.L.; methodology, H.-H.D. and H.D.K.T.; software, H.D.K.T. and C.-Y.W.; validation, H.D.K.T., C.-Y.W. and N.Q.K.L.; formal analysis, H.-H.D. and H.D.K.T.; investigation, H.-H.D.; resources, H.D.K.T., C.-Y.W. and K.-H.L.; data curation, C.-Y.W. and K.-H.L.; writing—original draft preparation, H.-H.D., H.D.K.T. and T.T.T.N.; writing—review and editing, H.D.K.T., T.T.T.N. and N.Q.K.L.; visualization, H.-H.D., H.D.K.T., T.T.T.N. and N.Q.K.L.; supervision, C.-Y.W., K.-H.L. and N.Q.K.L.; funding acquisition, N.Q.K.L. All authors have read and agreed to the published version of the manuscript.

Funding

This research was partly supported by the Taiwan Higher Education Sprout Project by the Ministry of Education (DP2-TMU-112-A-12).

Institutional Review Board Statement

Ethical review and approval were waived for this study because all data were derived from the public databases.

Informed Consent Statement

Patient consent was waived because all data were derived from the public databases.

Data Availability Statement

Publicly available datasets were analyzed in this study and can be found at: https://www.cancer.gov/tcga, https://www.ncbi.nlm.nih.gov/geo/, http://www.cgga.org.cn/, https://gtexportal.org/ (accessed on 1 July 2023). Data generated by the authors are shown in this paper or in the Supplementary Material. Further data are available upon request from the corresponding author if they were not shown elsewhere.

Conflicts of Interest

The authors declare no conflict of interest.

References

  1. Ostrom, Q.T.; Cioffi, G.; Waite, K.; Kruchko, C.; Barnholtz-Sloan, J.S. CBTRUS Statistical Report: Primary Brain and Other Central Nervous System Tumors Diagnosed in the United States in 2014–2018. Neuro-Oncol. 2021, 23, iii1–iii105. [Google Scholar] [CrossRef]
  2. Birzu, C.; French, P.; Caccese, M.; Cerretti, G.; Idbaih, A.; Zagonel, V.; Lombardi, G. Recurrent Glioblastoma: From Molecular Landscape to New Treatment Perspectives. Cancers 2020, 13, 47. [Google Scholar] [CrossRef] [PubMed]
  3. Stupp, R.; Taillibert, S.; Kanner, A.; Read, W.; Steinberg, D.M.; Lhermitte, B.; Toms, S.; Idbaih, A.; Ahluwalia, M.S.; Fink, K.; et al. Effect of Tumor-Treating Fields Plus Maintenance Temozolomide vs. Maintenance Temozolomide Alone on Survival in Patients with Glioblastoma: A Randomized Clinical Trial. JAMA 2017, 318, 2306–2316. [Google Scholar] [CrossRef] [PubMed] [Green Version]
  4. Wen, P.Y.; Weller, M.; Lee, E.Q.; Alexander, B.M.; Barnholtz-Sloan, J.S.; Barthel, F.P.; Batchelor, T.T.; Bindra, R.S.; Chang, S.M.; Chiocca, E.A.; et al. Glioblastoma in Adults: A Society for Neuro-Oncology (SNO) and European Society of Neuro-Oncology (EANO) Consensus Review on Current Management and Future Directions. Neuro-Oncology 2020, 22, 1073–1113. [Google Scholar] [CrossRef] [PubMed]
  5. Cloughesy, T.F.; Cavenee, W.K.; Mischel, P.S. Glioblastoma: From Molecular Pathology to Targeted Treatment. Annu. Rev. Pathol. Mech. Dis. 2014, 9, 1–25. [Google Scholar] [CrossRef] [PubMed] [Green Version]
  6. Cao, M.; Cai, J.; Yuan, Y.; Shi, Y.; Wu, H.; Liu, Q.; Yao, Y.; Chen, L.; Dang, W.; Zhang, X.; et al. A Four-Gene Signature-Derived Risk Score for Glioblastoma: Prospects for Prognostic and Response Predictive Analyses. Cancer Biol. Med. 2019, 16, 595–605. [Google Scholar] [CrossRef] [PubMed]
  7. Yu, Z.; Du, M.; Lu, L. A Novel 16-Genes Signature Scoring System as Prognostic Model to Evaluate Survival Risk in Patients with Glioblastoma. Biomedicines 2022, 10, 317. [Google Scholar] [CrossRef]
  8. Kawaguchi, A.; Yajima, N.; Tsuchiya, N.; Homma, J.; Sano, M.; Natsumeda, M.; Takahashi, H.; Fujii, Y.; Kakuma, T.; Yamanaka, R. Gene Expression Signature-Based Prognostic Risk Score in Patients with Glioblastoma. Cancer Sci. 2013, 104, 1205–1210. [Google Scholar] [CrossRef]
  9. Wen, Y.-D.; Zhu, X.-S.; Li, D.-J.; Zhao, Q.; Cheng, Q.; Peng, Y. Proteomics-Based Prognostic Signature and Nomogram Construction of Hypoxia Microenvironment on Deteriorating Glioblastoma (GBM) Pathogenesis. Sci. Rep. 2021, 11, 17170. [Google Scholar] [CrossRef]
  10. Lei, C.; Chen, W.; Wang, Y.; Zhao, B.; Liu, P.; Kong, Z.; Liu, D.; Dai, C.; Wang, Y.; Wang, Y.; et al. Prognostic Prediction Model for Glioblastoma: A Metabolic Gene Signature and Independent External Validation. J. Cancer 2021, 12, 3796–3808. [Google Scholar] [CrossRef]
  11. Liu, J.; Lichtenberg, T.; Hoadley, K.A.; Poisson, L.M.; Lazar, A.J.; Cherniack, A.D.; Kovatich, A.J.; Benz, C.C.; Levine, D.A.; Lee, A.V.; et al. An Integrated TCGA Pan-Cancer Clinical Data Resource to Drive High-Quality Survival Outcome Analytics. Cell 2018, 173, 400–416.e11. [Google Scholar] [CrossRef] [Green Version]
  12. Madhavan, S.; Zenklusen, J.-C.; Kotliarov, Y.; Sahni, H.; Fine, H.A.; Buetow, K. Rembrandt: Helping Personalized Medicine Become a Reality through Integrative Translational Research. Mol. Cancer Res. 2009, 7, 157–167. [Google Scholar] [CrossRef] [PubMed] [Green Version]
  13. Brennan, C.W.; Verhaak, R.G.W.; McKenna, A.; Campos, B.; Noushmehr, H.; Salama, S.R.; Zheng, S.; Chakravarty, D.; Sanborn, J.Z.; Berman, S.H.; et al. The Somatic Genomic Landscape of Glioblastoma. Cell 2013, 155, 462–477. [Google Scholar] [CrossRef]
  14. Sun, L.; Hui, A.-M.; Su, Q.; Vortmeyer, A.; Kotliarov, Y.; Pastorino, S.; Passaniti, A.; Menon, J.; Walling, J.; Bailey, R.; et al. Neuronal and Glioma-Derived Stem Cell Factor Induces Angiogenesis within the Brain. Cancer Cell 2006, 9, 287–300. [Google Scholar] [CrossRef] [Green Version]
  15. Louis, D.N.; Perry, A.; Wesseling, P.; Brat, D.J.; Cree, I.A.; Figarella-Branger, D.; Hawkins, C.; Ng, H.K.; Pfister, S.M.; Reifenberger, G.; et al. The 2021 WHO Classification of Tumors of the Central Nervous System: A Summary. Neuro-Oncology 2021, 23, 1231–1251. [Google Scholar] [CrossRef]
  16. Ringnér, M. What Is Principal Component Analysis? Nat. Biotechnol. 2008, 26, 303–304. [Google Scholar] [CrossRef] [PubMed]
  17. Ritchie, M.E.; Phipson, B.; Wu, D.; Hu, Y.; Law, C.W.; Shi, W.; Smyth, G.K. Limma Powers Differential Expression Analyses for RNA-Sequencing and Microarray Studies. Nucleic Acids Res. 2015, 43, e47. [Google Scholar] [CrossRef] [PubMed] [Green Version]
  18. Love, M.I.; Huber, W.; Anders, S. Moderated Estimation of Fold Change and Dispersion for RNA-Seq Data with DESeq2. Genome Biol. 2014, 15, 550. [Google Scholar] [CrossRef] [Green Version]
  19. Raudvere, U.; Kolberg, L.; Kuzmin, I.; Arak, T.; Adler, P.; Peterson, H.; Vilo, J. G:Profiler: A Web Server for Functional Enrichment Analysis and Conversions of Gene Lists (2019 Update). Nucleic Acids Res. 2019, 47, W191–W198. [Google Scholar] [CrossRef] [Green Version]
  20. Hill, D.P.; Smith, B.; McAndrews-Hill, M.S.; Blake, J.A. Gene Ontology Annotations: What They Mean and Where They Come From. BMC Bioinform. 2008, 9, S2. [Google Scholar] [CrossRef] [Green Version]
  21. Kanehisa, M.; Goto, S. KEGG: Kyoto Encyclopedia of Genes and Genomes. Nucleic Acids Res. 2000, 28, 27–30. [Google Scholar] [CrossRef] [PubMed]
  22. Zhao, Z.; Zhang, K.-N.; Wang, Q.; Li, G.; Zeng, F.; Zhang, Y.; Wu, F.; Chai, R.; Wang, Z.; Zhang, C.; et al. Chinese Glioma Genome Atlas (CGGA): A Comprehensive Resource with Functional Genomic Data from Chinese Glioma Patients. Genom. Proteom. Bioinform. 2021, 19, 1–12. [Google Scholar] [CrossRef] [PubMed]
  23. Blanche, P.; Dartigues, J.-F.; Jacqmin-Gadda, H. Estimating and Comparing Time-Dependent Areas under Receiver Operating Characteristic Curves for Censored Event Times with Competing Risks. Stat. Med. 2013, 32, 5381–5397. [Google Scholar] [CrossRef] [PubMed]
  24. Kamarudin, A.N.; Cox, T.; Kolamunnage-Dona, R. Time-Dependent ROC Curve Analysis in Medical Research: Current Methods and Applications. BMC Med. Res. Methodol. 2017, 17, 53. [Google Scholar] [CrossRef] [PubMed] [Green Version]
  25. Wang, Q.; Hu, B.; Hu, X.; Kim, H.; Squatrito, M.; Scarpace, L.; deCarvalho, A.C.; Lyu, S.; Li, P.; Li, Y.; et al. Tumor Evolution of Glioma-Intrinsic Gene Expression Subtypes Associates with Immunological Changes in the Microenvironment. Cancer Cell 2017, 32, 42–56.e6. [Google Scholar] [CrossRef] [PubMed] [Green Version]
  26. Butler, M.; Pongor, L.; Su, Y.-T.; Xi, L.; Raffeld, M.; Quezado, M.; Trepel, J.; Aldape, K.; Pommier, Y.; Wu, J. MGMT Status as a Clinical Biomarker in Glioblastoma. Trends Cancer 2020, 6, 380–391. [Google Scholar] [CrossRef]
  27. Verhaak, R.G.W.; Hoadley, K.A.; Purdom, E.; Wang, V.; Qi, Y.; Wilkerson, M.D.; Miller, C.R.; Ding, L.; Golub, T.; Mesirov, J.P.; et al. Integrated Genomic Analysis Identifies Clinically Relevant Subtypes of Glioblastoma Characterized by Abnormalities in PDGFRA, IDH1, EGFR, and NF1. Cancer Cell 2010, 17, 98–110. [Google Scholar] [CrossRef] [Green Version]
  28. Madurga, R.; García-Romero, N.; Jiménez, B.; Collazo, A.; Pérez-Rodríguez, F.; Hernández-Laín, A.; Fernández-Carballal, C.; Prat-Acín, R.; Zanin, M.; Menasalvas, E.; et al. Normal Tissue Content Impact on the GBM Molecular Classification. Brief. Bioinform. 2021, 22, bbaa129. [Google Scholar] [CrossRef]
  29. Zhou, G.; Soufan, O.; Ewald, J.; Hancock, R.E.W.; Basu, N.; Xia, J. NetworkAnalyst 3.0: A Visual Analytics Platform for Comprehensive Gene Expression Profiling and Meta-Analysis. Nucleic Acids Res. 2019, 47, W234–W241. [Google Scholar] [CrossRef] [Green Version]
  30. Lachmann, A.; Xu, H.; Krishnan, J.; Berger, S.I.; Mazloom, A.R.; Ma’ayan, A. ChEA: Transcription Factor Regulation Inferred from Integrating Genome-Wide ChIP-X Experiments. Bioinformatics 2010, 26, 2438–2444. [Google Scholar] [CrossRef] [Green Version]
  31. Hänzelmann, S.; Castelo, R.; Guinney, J. GSVA: Gene Set Variation Analysis for Microarray and RNA-Seq Data. BMC Bioinform. 2013, 14, 7. [Google Scholar] [CrossRef] [PubMed] [Green Version]
  32. Barbie, D.A.; Tamayo, P.; Boehm, J.S.; Kim, S.Y.; Moody, S.E.; Dunn, I.F.; Schinzel, A.C.; Sandy, P.; Meylan, E.; Scholl, C.; et al. Systematic RNA Interference Reveals That Oncogenic KRAS-Driven Cancers Require TBK1. Nature 2009, 462, 108–112. [Google Scholar] [CrossRef] [Green Version]
  33. Subramanian, A.; Tamayo, P.; Mootha, V.K.; Mukherjee, S.; Ebert, B.L.; Gillette, M.A.; Paulovich, A.; Pomeroy, S.L.; Golub, T.R.; Lander, E.S.; et al. Gene Set Enrichment Analysis: A Knowledge-Based Approach for Interpreting Genome-Wide Expression Profiles. Proc. Natl. Acad. Sci. USA 2005, 102, 15545–15550. [Google Scholar] [CrossRef]
  34. Chen, B.; Khodadoust, M.S.; Liu, C.L.; Newman, A.M.; Alizadeh, A.A. Profiling Tumor Infiltrating Immune Cells with CIBERSORT. Methods Mol. Biol. 2018, 1711, 243–259. [Google Scholar] [CrossRef]
  35. Becht, E.; Giraldo, N.A.; Lacroix, L.; Buttard, B.; Elarouci, N.; Petitprez, F.; Selves, J.; Laurent-Puig, P.; Sautès-Fridman, C.; Fridman, W.H.; et al. Estimating the Population Abundance of Tissue-Infiltrating Immune and Stromal Cell Populations Using Gene Expression. Genome Biol. 2016, 17, 218. [Google Scholar] [CrossRef] [PubMed]
  36. Stupp, R.; Hegi, M.E.; Mason, W.P.; van den Bent, M.J.; Taphoorn, M.J.B.; Janzer, R.C.; Ludwin, S.K.; Allgeier, A.; Fisher, B.; Belanger, K.; et al. Effects of Radiotherapy with Concomitant and Adjuvant Temozolomide versus Radiotherapy Alone on Survival in Glioblastoma in a Randomised Phase III Study: 5-Year Analysis of the EORTC-NCIC Trial. Lancet Oncol. 2009, 10, 459–466. [Google Scholar] [CrossRef] [PubMed]
  37. McDermaid, A.; Monier, B.; Zhao, J.; Liu, B.; Ma, Q. Interpretation of Differential Gene Expression Results of RNA-Seq Data: Review and Integration. Brief. Bioinform. 2019, 20, 2044–2054. [Google Scholar] [CrossRef] [PubMed] [Green Version]
  38. Porcu, E.; Sadler, M.C.; Lepik, K.; Auwerx, C.; Wood, A.R.; Weihs, A.; Sleiman, M.S.B.; Ribeiro, D.M.; Bandinelli, S.; Tanaka, T.; et al. Differentially Expressed Genes Reflect Disease-Induced Rather than Disease-Causing Changes in the Transcriptome. Nat. Commun. 2021, 12, 5647. [Google Scholar] [CrossRef] [PubMed]
  39. Brooks, L.R.K.; Mias, G.I. Data-Driven Analysis of Age, Sex, and Tissue Effects on Gene Expression Variability in Alzheimer’s Disease. Front. Neurosci. 2019, 13, 392. [Google Scholar] [CrossRef] [Green Version]
  40. Dang, H.H.; Ta, H.D.K.; Nguyen, T.T.T.; Anuraga, G.; Wang, C.-Y.; Lee, K.-H.; Le, N.Q.K. Prospective Role and Immunotherapeutic Targets of Sideroflexin Protein Family in Lung Adenocarcinoma: Evidence from Bioinformatics Validation. Funct. Integr. Genom. 2022, 22, 1057–1072. [Google Scholar] [CrossRef]
  41. Dang, H.-H.; Ta, H.D.K.; Nguyen, T.T.T.; Anuraga, G.; Wang, C.-Y.; Lee, K.-H.; Le, N.Q.K. Identifying GPSM Family Members as Potential Biomarkers in Breast Cancer: A Comprehensive Bioinformatics Analysis. Biomedicines 2021, 9, 1144. [Google Scholar] [CrossRef] [PubMed]
  42. Wang, Y.; Wang, Y.; Li, J.; Zhang, Y.; Yin, H.; Han, B. CRNDE, a Long-Noncoding RNA, Promotes Glioma Cell Growth and Invasion through MTOR Signaling. Cancer Lett. 2015, 367, 122–128. [Google Scholar] [CrossRef]
  43. Jing, S.-Y.; Lu, Y.-Y.; Yang, J.-K.; Deng, W.-Y.; Zhou, Q.; Jiao, B.-H. Expression of Long Non-Coding RNA CRNDE in Glioma and Its Correlation with Tumor Progression and Patient Survival. Eur. Rev. Med. Pharmacol. Sci. 2016, 20, 3992–3996. [Google Scholar]
  44. Zhao, Z.; Liu, M.; Long, W.; Yuan, J.; Li, H.; Zhang, C.; Tang, G.; Jiang, W.; Yuan, X.; Wu, M.; et al. Knockdown LncRNA CRNDE Enhances Temozolomide Chemosensitivity by Regulating Autophagy in Glioblastoma. Cancer Cell Int. 2021, 21, 456. [Google Scholar] [CrossRef]
  45. Sun, H.-T.; Cheng, S.-X.; Tu, Y.; Li, X.-H.; Zhang, S. FoxQ1 Promotes Glioma Cells Proliferation and Migration by Regulating NRXN3 Expression. PLoS ONE 2013, 8, e55693. [Google Scholar] [CrossRef] [PubMed]
  46. Liu, L.; Zhang, P.; Dong, X.; Li, H.; Li, S.; Cheng, S.; Yuan, J.; Yang, X.; Qian, Z.; Dong, J. Circ_0001367 Inhibits Glioma Proliferation, Migration and Invasion by Sponging MiR-431 and Thus Regulating NRXN3. Cell Death Dis. 2021, 12, 536. [Google Scholar] [CrossRef]
  47. Liu, L.; Yang, S.; Lin, K.; Yu, X.; Meng, J.; Ma, C.; Wu, Z.; Hao, Y.; Chen, N.; Ge, Q.; et al. Sp1 Induced Gene TIMP1 Is Related to Immune Cell Infiltration in Glioblastoma. Sci. Rep. 2022, 12, 11181. [Google Scholar] [CrossRef]
  48. Song, G.; Xu, S.; Zhang, H.; Wang, Y.; Xiao, C.; Jiang, T.; Wu, L.; Zhang, T.; Sun, X.; Zhong, L.; et al. TIMP1 Is a Prognostic Marker for the Progression and Metastasis of Colon Cancer through FAK-PI3K/AKT and MAPK Pathway. J. Exp. Clin. Cancer Res. 2016, 35, 148. [Google Scholar] [CrossRef] [PubMed] [Green Version]
  49. Toker, A.; Ohashi, P.S. Chapter Five—Expression of Costimulatory and Inhibitory Receptors in FoxP3+ Regulatory T Cells within the Tumor Microenvironment: Implications for Combination Immunotherapy Approaches. In Advances in Cancer Research; Tew, K.D., Fisher, P.B., Eds.; Academic Press: Cambridge, MA, USA, 2019; Volume 144, pp. 193–261. [Google Scholar]
  50. Blank, A.-E.; Baumgarten, P.; Zeiner, P.; Zachskorn, C.; Löffler, C.; Schittenhelm, J.; Czupalla, C.J.; Capper, D.; Plate, K.H.; Harter, P.N.; et al. Tumour Necrosis Factor Receptor Superfamily Member 9 (TNFRSF9) Is up-Regulated in Reactive Astrocytes in Human Gliomas. Neuropathol. Appl. Neurobiol. 2015, 41, e56–e67. [Google Scholar] [CrossRef]
  51. Yu, Z.; Yang, H.; Song, K.; Fu, P.; Shen, J.; Xu, M.; Xu, H. Construction of an Immune-Related Gene Signature for the Prognosis and Diagnosis of Glioblastoma Multiforme. Front. Oncol. 2022, 12, 938679. [Google Scholar] [CrossRef]
  52. Rana, P.; Thai, P.; Dinh, T.; Ghosh, P. Relevant and Non-Redundant Feature Selection for Cancer Classification and Subtype Detection. Cancers 2021, 13, 4297. [Google Scholar] [CrossRef] [PubMed]
  53. Amunjela, J.N.; Swan, A.H.; Brand, T. The Role of the Popeye Domain Containing Gene Family in Organ Homeostasis. Cells 2019, 8, 1594. [Google Scholar] [CrossRef] [PubMed] [Green Version]
  54. Zhao, S.; Fung-Leung, W.-P.; Bittner, A.; Ngo, K.; Liu, X. Comparison of RNA-Seq and Microarray in Transcriptome Profiling of Activated T Cells. PLoS ONE 2014, 9, e78644. [Google Scholar] [CrossRef] [PubMed]
  55. Hartmann, C.; Hentschel, B.; Simon, M.; Westphal, M.; Schackert, G.; Tonn, J.C.; Loeffler, M.; Reifenberger, G.; Pietsch, T.; von Deimling, A.; et al. Long-Term Survival in Primary Glioblastoma with versus without Isocitrate Dehydrogenase Mutations. Clin. Cancer Res. 2013, 19, 5146–5157. [Google Scholar] [CrossRef] [Green Version]
Figure 1. Summary of the DEGs. Volcano plot showing differential expression analysis of genes between GBM and control samples in (A) TCGA-GBM versus GTEx, (B) GSE4290 and (C) GSE68848. Red and blue (or green) points indicate genes with significantly increased or decreased expression, respectively, in GBM specimens compared to controls. The Log2-fold differences between GBM and controls are plotted on the horizontal axis, while the −Log10 p-value differences are plotted on the vertical axis. The horizontal dashed line represents the significance threshold (p value < 0.05 after correcting for multiple comparisons).
Cancers 15 03899 g001
Figure 2. GO and KEGG pathway enrichment analysis of the upregulated DEGs. Dot plot of enriched GO terms: (A) biological processes, (B) cellular components and (C) molecular functions. GO processes are ordered according to the enrichment score. Dot size represents the number of genes in the significant gene list associated with the GO term. Dot color represents the adjusted p values. (D) Pathway enrichment analysis in the KEGG database. Pathways significantly enriched by DEGs are ordered by adjusted p values. Abbreviations: DEGs, differentially expressed genes; ECM, extracellular matrix; GO, Gene Ontology; KEGG, Kyoto Encyclopedia of Genes and Genomes.
Cancers 15 03899 g002
Figure 3. GO and KEGG pathway enrichment analysis of the downregulated DEGs. Dot plot of enriched GO terms: (A) biological processes, (B) cellular components and (C) molecular functions. GO processes are ordered according to the enrichment score. Dot size represents the number of genes in the significant gene list associated with the GO term. Dot color represents the adjusted p values. (D) Pathway enrichment analysis in the KEGG database. Pathways significantly enriched by DEGs are ordered by adjusted p values. Abbreviations: DEGs, differentially expressed genes; GO, Gene Ontology; KEGG, Kyoto Encyclopedia of Genes and Genomes.
Cancers 15 03899 g003
Figure 4. Prognostic risk score of GBM across three datasets. Kaplan–Meier plots of the eight-gene risk model for overall survival in the (A) TCGA-GBM, (B) CGGA, and (C) GSE43378 cohorts. (D) Time-dependent ROC curve analyses of the risk model at 1-, 3-, and 5-year overall survival in TCGA-GBM. Abbreviations: CGGA, Chinese Glioma Genome Atlas; ROC, receiver operating characteristic.
Cancers 15 03899 g004
Figure 5. Clinical characteristics of the eight-gene risk model. Comparison of risk score level between MGMT-methylated and MGMT-unmethylated in (A) TCGA-GBM and (B) CGGA-GBM, and between (C) proneural, mesenchymal, and classical molecular subtypes. p values were obtained using the Wilcoxon test. Abbreviations: MGMT, O6-methylguanine DNA methyltransferase.
Cancers 15 03899 g005
Figure 6. Immune infiltration of the prognostic risk score model in TCGA-GBM. Infiltration levels of immune cells between the high- and low-risk groups using the (A) CIBERSORT or (B) MCP-counter method. Comparison of measures of (C) the tumor immune microenvironment, (D) the tumor signature and (E) EMT between the high- and low-risk groups. Immune cells which had significantly different signature scores between the two risk groups are colored in blue. p values were obtained using the Wilcoxon test. Abbreviations: EMT, epithelial–mesenchymal transition; GPAGs, good-prognosis angiogenesis genes; MCP-counter, microenvironment cell populations-counter; MDSC, myeloid-derived suppressor cells; NK, natural killer; ns, not significant; Pan-F-TBRS, Pan-fibroblast TGF-β response signature; PPAGs, poor-prognosis angiogenesis genes; TAM, tumor-associated macrophages.
Cancers 15 03899 g006
Table 1. Characteristics of the included datasets for model construction.
DatasetSample SizeClinical InformationPlatformApplication
TCGA-GBM142 GBMFemale 50 (35.2%)
Age 61.6 ± 11.9 (range 24–89)
IlluminaDifferential expression analysis, risk score construction
GTEx (BA9)209 normal frontal cortex samplesFemale 56 (26.8%)
Age group 60–70 (57.4%), 50–59 (30.1%), 40–49 (8.1%), 30–39 (2%), 20–29 (2.4%)
Illumina TruSeqDifferential expression analysis
GSE429081 GBM vs. 23 non-tumor (epilepsy)Not availableAffymetrix HG-U133Plus2Differential expression analysis
GSE68848228 GBM vs. 28 non-tumorNot availableAffymetrix HG-U133Plus2Differential expression analysis
CGGA79 GBMNot applicableNot applicableRisk score validation
GSE4337832 GBMNot applicable Not applicable Risk score validation
Table 2. Univariate Cox regression analysis of DEGs with overall survival in the TCGA-GBM dataset.
GeneCoefficientHazard Ratio95% Confidence Intervalp Value
CRNDE0.000471.000471.00021–1.0007390.0004
NRXN30.000671.000671.000294–1.0010640.0005
POPDC30.002021.002021.000876–1.0031720.0005
PTPRN0.000171.000171.000106–1.0002468.8 × 10−7
PTPRN20.000121.000121.000054–1.0002050.0007
SLC46A20.065941.068161.037777–1.0985492.1 × 10−5
TIMP19.03 × 10−61.0000091.000004–1.0000140.0004
TNFSF90.003611.003621.001559–1.0056910.0005
Disclaimer/Publisher’s Note: The statements, opinions and data contained in all publications are solely those of the individual author(s) and contributor(s) and not of MDPI and/or the editor(s). MDPI and/or the editor(s) disclaim responsibility for any injury to people or property resulting from any ideas, methods, instructions or products referred to in the content.

