Article

Pan-Cancer Analysis Identifies Tumor Cell Surface Targets for CAR-T Cell Therapies and Antibody Drug Conjugates

1
State Key Laboratory of Biocontrol, School of Life Sciences, Sun Yat-Sen University, Guangzhou 510275, China
2
Institute of Hepatology, Shenzhen Third People’s Hospital, The Second Affiliated Hospital, School of Medicine, Southern University of Science and Technology, Shenzhen 518055, China
3
Department of Gynaecology and Obstetrics, Shenzhen University General Hospital, Shenzhen 518055, China
4
School of Chemistry and Chemical Engineering, Southeast University, Nanjing 211189, China
5
Department of Immunology, Key Laboratory of Human Functional Genomics of Jiangsu Province, Gusu School, Nanjing Medical University, Nanjing 211166, China
6
CAS Key Laboratory of Quantitative Engineering Biology, Shenzhen Institute of Synthetic Biology, Shenzhen Institute of Advanced Technology, Chinese Academy of Sciences, Shenzhen 518055, China
7
College of Medical Sciences, Qingdao Binhai University, Qingdao 266555, China
8
Shenzhen Key Laboratory of Pathogen and Immunity, National Clinical Research Center for Infectious Disease, State Key Discipline of Infectious Disease, Shenzhen Third People’s Hospital, Second Hospital Affiliated to Southern University of Science and Technology, Shenzhen 518112, China
9
Department of Clinical Oncology, Li Ka Shing Faculty of Medicine, University of Hong Kong, Pokfulam, Hong Kong SAR 999077, China
*
Authors to whom correspondence should be addressed.
These authors contributed equally to this work.
Cancers 2022, 14(22), 5674; https://doi.org/10.3390/cancers14225674
Submission received: 16 October 2022 / Revised: 11 November 2022 / Accepted: 15 November 2022 / Published: 18 November 2022
(This article belongs to the Collection Application of Bioinformatics in Cancers)

Abstract

:

Simple Summary

Identification of tumor cell surface targets is vital for chimeric antigen receptor-T cell (CAR-T) therapies and antibody drug conjugates (ADCs). This study utilized the Cancer Genome Atlas (TCGA) database to perform a series of conditional screenings of tumor-specific surface proteins. Accordingly, we found a tumor tissue-specific gene set associated with the survival of cancer patients. Furthermore, these tumor-specific surface proteins can function to render the ability of tumor cells to metastasize. Correlation analysis revealed that these overexpressed membrane proteins were positively correlated, which suggests they maybe potential dual-drug targets. Our findings reveal the significance of tumor cell surface targets in CAR-T- and ADC-related drug development.

Abstract

Tumor cells can be recognized through tumor surface antigens by immune cells and antibodies, which therefore can be used as drug targets for chimeric antigen receptor-T (CAR-T) therapies and antibody drug conjugates (ADCs). In this study, we aimed to identify novel tumor-specific antigens as targets for more effective and safer CAR-T cell therapies and ADCs. Here, we performed differential expression analysis of pan-cancer data obtained from the Cancer Genome Atlas (TCGA), and then performed a series of conditional screenings including Cox regression analysis, Pearson correlation analysis, and risk-score calculation to find tumor-specific cell membrane genes. A tumor tissue-specific and highly expressed gene set containing 3919 genes from 17 cancer types was obtained. Moreover, the prognostic roles of these genes and the functions of these highly expressed membrane proteins were assessed. Notably, 427, 584, 431 and 578 genes were identified as risk factors for LIHC, KIRC, UCEC, and KIRP, respectively. Functional enrichment analysis indicated that these tumor-specific surface proteins might confer tumor cells the ability to invade and metastasize. Furthermore, correlation analysis displayed that most overexpressed membrane proteins were positively correlated to each other. In addition, 371 target membrane protein-coding genes were sifted out by excluding proteins expressed in normal tissues. Apart from the identification of well-validated genes such as GPC3, MSLN and EGFR in the literature, we further confirmed the differential protein expression of 23 proteins: ADD2, DEF6, DOK3, ENO2, FMNL1, MICALL2, PARVG, PSTPIP1, FERMT1, PLEK2, CD109, GNG4, MAPT, OSBPL3, PLXNA1, ROBO1, SLC16A3, SLC26A6, SRGAP2, and TMEM65 in four types of tumors. In summary, our findings reveal novel tumor-specific antigens, which could be potentially used for next-generation CAR-T cell therapies and ADC discovery.

1. Introduction

Cancer is the second leading cause of death all over the world with 9.96 million deaths every year [1]. Although tumor cells can be recognized and eliminated by immune surveillance, the immune system may lose efficacy due to the immune suppressive environment induced by tumor cells by altered gene expression, such as mutations and copy number variations [2,3]. The specific proteins encoded by these altered genes expressed on the surface of the tumor cells can shield the tumor cells to evade immune system clearance [4,5]. On the other hand, these tumor specific membrane proteins can be used as drug targets for cancer immunotherapy [6,7], which reactivates the anti-tumor immune response to eradicate tumors.
Nowadays, cancer immunotherapies. such as immune checkpoint blocking therapy (ICB) have been introduced into multiple lines of cancer treatment with great success [8]. Recently, two targeted immune-related therapeutic approaches based on tumor surface antigens (TSAs) have emerged in the cancer immunotherapy research field. The first approach use the antibody drug conjugates (ADCs), a drug class represented by attaching 3–8 molecules of a potent cytotoxic agent to a monoclonal antibody, which targets specific TSAs [9]. The second approach is the chimeric antigen receptor-T (CAR-T) cell therapy [10]. During the T cell engineering process, the expanded T lymphocytes are modified to recognize specific tumor-associated antigens and then transferred back into the cancer patients to eradicate the tumor cells [11]. Current CAR-T therapies mainly focus on CD19 [12], CD20 [13], BCMA [14], MUC1 [15], GD2 [16], CSPG4 [17], HER2 [18], EGFR [19], FAP [20] etc., and have achieved great success in pre-clinical assays or clinical applications. However, there are still many limitations in current TSA-based immunotherapies for tumors, particularly solid tumors [21]. It is mostly due to the lack of specific TSAs (unlike the scenarios in hematologic malignancies, which have specific and well-validated TSAs) [22,23] or heterogenous TSA expression in solid tumors [24,25]. Another major challenge of TSA-based immunotherapies is the “on-target, off-tumor toxicity” effects [26]. Thus, it is quite crucial to identify specific TSAs that are abundantly expressed in tumor cells and less or not expressed in normal tissue cells, to limit the potential toxic and adverse effects.
Here, we exploited the publicly available Cancer Genome Atlas (TCGA) databases to identify specific TSAs in various cancer types. Firstly, we identified highly expressed genes present on the tumor cell surface. Secondly, we performed a survival analysis to select genes that were significantly associated with survival outcomes in cancer patients. In addition, we analyzed the function and correlation of these genes and the prognostic value of the correlated genes with survival rates of cancer patients. To sum up, our work identified specific TSAs that might serve as useful targets for CAR-T cell therapies, ADCs, or co-targeting strategies for the treatment of solid tumors.

2. Materials and Methods

2.1. Data Source

2.1.1. TCGA

Gene expression of 17 types of tumor samples were collected from TCGA on the University of California Santa Cruz (UCSC) Xena website (https://xenabrowser.net/ (accessed on 1 September 2020)) in fragments per kilobase million (FPKM) (See Table 1 for detailed sample numbers). Human membrane protein information was obtained from the databases: Membranome (https://membranome.org/ (accessed on 1 September 2020)) [27,28] and Uniprot (https://www.uniprot.org/ (accessed on 1 September 2020)) [29]. Human immune cell biomarkers were obtained from the database: CellMarker, and the membrane proteins on the immune cells were excluded [30]. The RNA expression data of 54 human normal tissues were obtained from the GTEx (Genotype–Tissue Expression) project data set (V8 release) [31].

2.1.2. CPTAC (Clinical Proteomic Tumor Analysis Consortium)

The protein expression abundance data of a total of 7 types of cancer tissues were obtained from the CPTAC database. The detailed cancer types and sample numbers are shown in Table 1.

2.2. Differential Expression Analysis

2.2.1. TCGA

A rank-sum test was used to analyze the differential expression of membrane protein-coding genes between tumor and normal samples. A threshold of Log2FoldChange (Log2FC) was greater than 1.00 and the adjusted p value was less than 0.01.

2.2.2. CPTAC

Taking into account the missing values of protein abundance in the CPTAC data, we first deleted genes whose expression was missing in more than 10% of samples of the tumor (i.e., if there are 100 samples for tumor A, and the expression of gene 1 is missing in more than 10 samples, we deleted the gene), and then filtered the missing values through the K-nearest neighbor method (k = 10). Finally, the relative normalized protein expression abundance profiles of 7 cancers were obtained. Since the protein abundance levels were normalized and log transformed, the difference in the expression abundance was calculated as the abundance in the tumor tissue minus the abundance in the normal tissue via the rank-sum test.

2.3. Enrichment Analysis

A hypergeometric test was used to analyze the enrichment relationship between high-expression and high-risk membrane protein-coding genes in the tumor tissues according to the ten cancer hallmarks [32].

2.4. Survival Analysis

2.4.1. Log-Rank Test

The tumor patients were divided into a high-expression group and a low-expression group by the mean value of membrane protein expression. A log-rank test was used to compare the survival rates of these two groups of patients using the R package “Survfit” [33].

2.4.2. Multivariate/Univariate Cox Regression

Multivariate Cox regression was used to analyze the impact of membrane protein pairwise combinations on the survival rates of the cancer patients. Hazard ratios (HR) of each membrane protein based on the expression levels of the protein in the sample and the prognostic information of the patient were analyzed through univariate cox regression. Among them, the genes with HR > 1.00 were considered to be poor prognostic factors for the cancer patients.

2.5. Risk-Score System Establishment

Each gene score was constructed as the selected gene expression level (exp) multiplied by its regression coefficient (β) obtained from the univariate Cox regression model. Each patient’s prognostic risk-score was calculated as the sum of two gene scores; the formula is as follows [34,35]:
R i s k   s c o r e = e x p g e n e 1 β g e n e 1 + e x p g e n e 2 β g e n e 2
Based on this formula, the risk-score of each sample was calculated (Table S2). According to the median risk-score, the patients were divided into a high-risk or low-risk group. The prognostic differences of these two groups were calculated by a log-rank test.

2.6. Correlation Analysis

We analyzed the correlation between every two membrane proteins by Pearson correlation. The visualization process was depicted using the R package “corrplot”.

3. Results

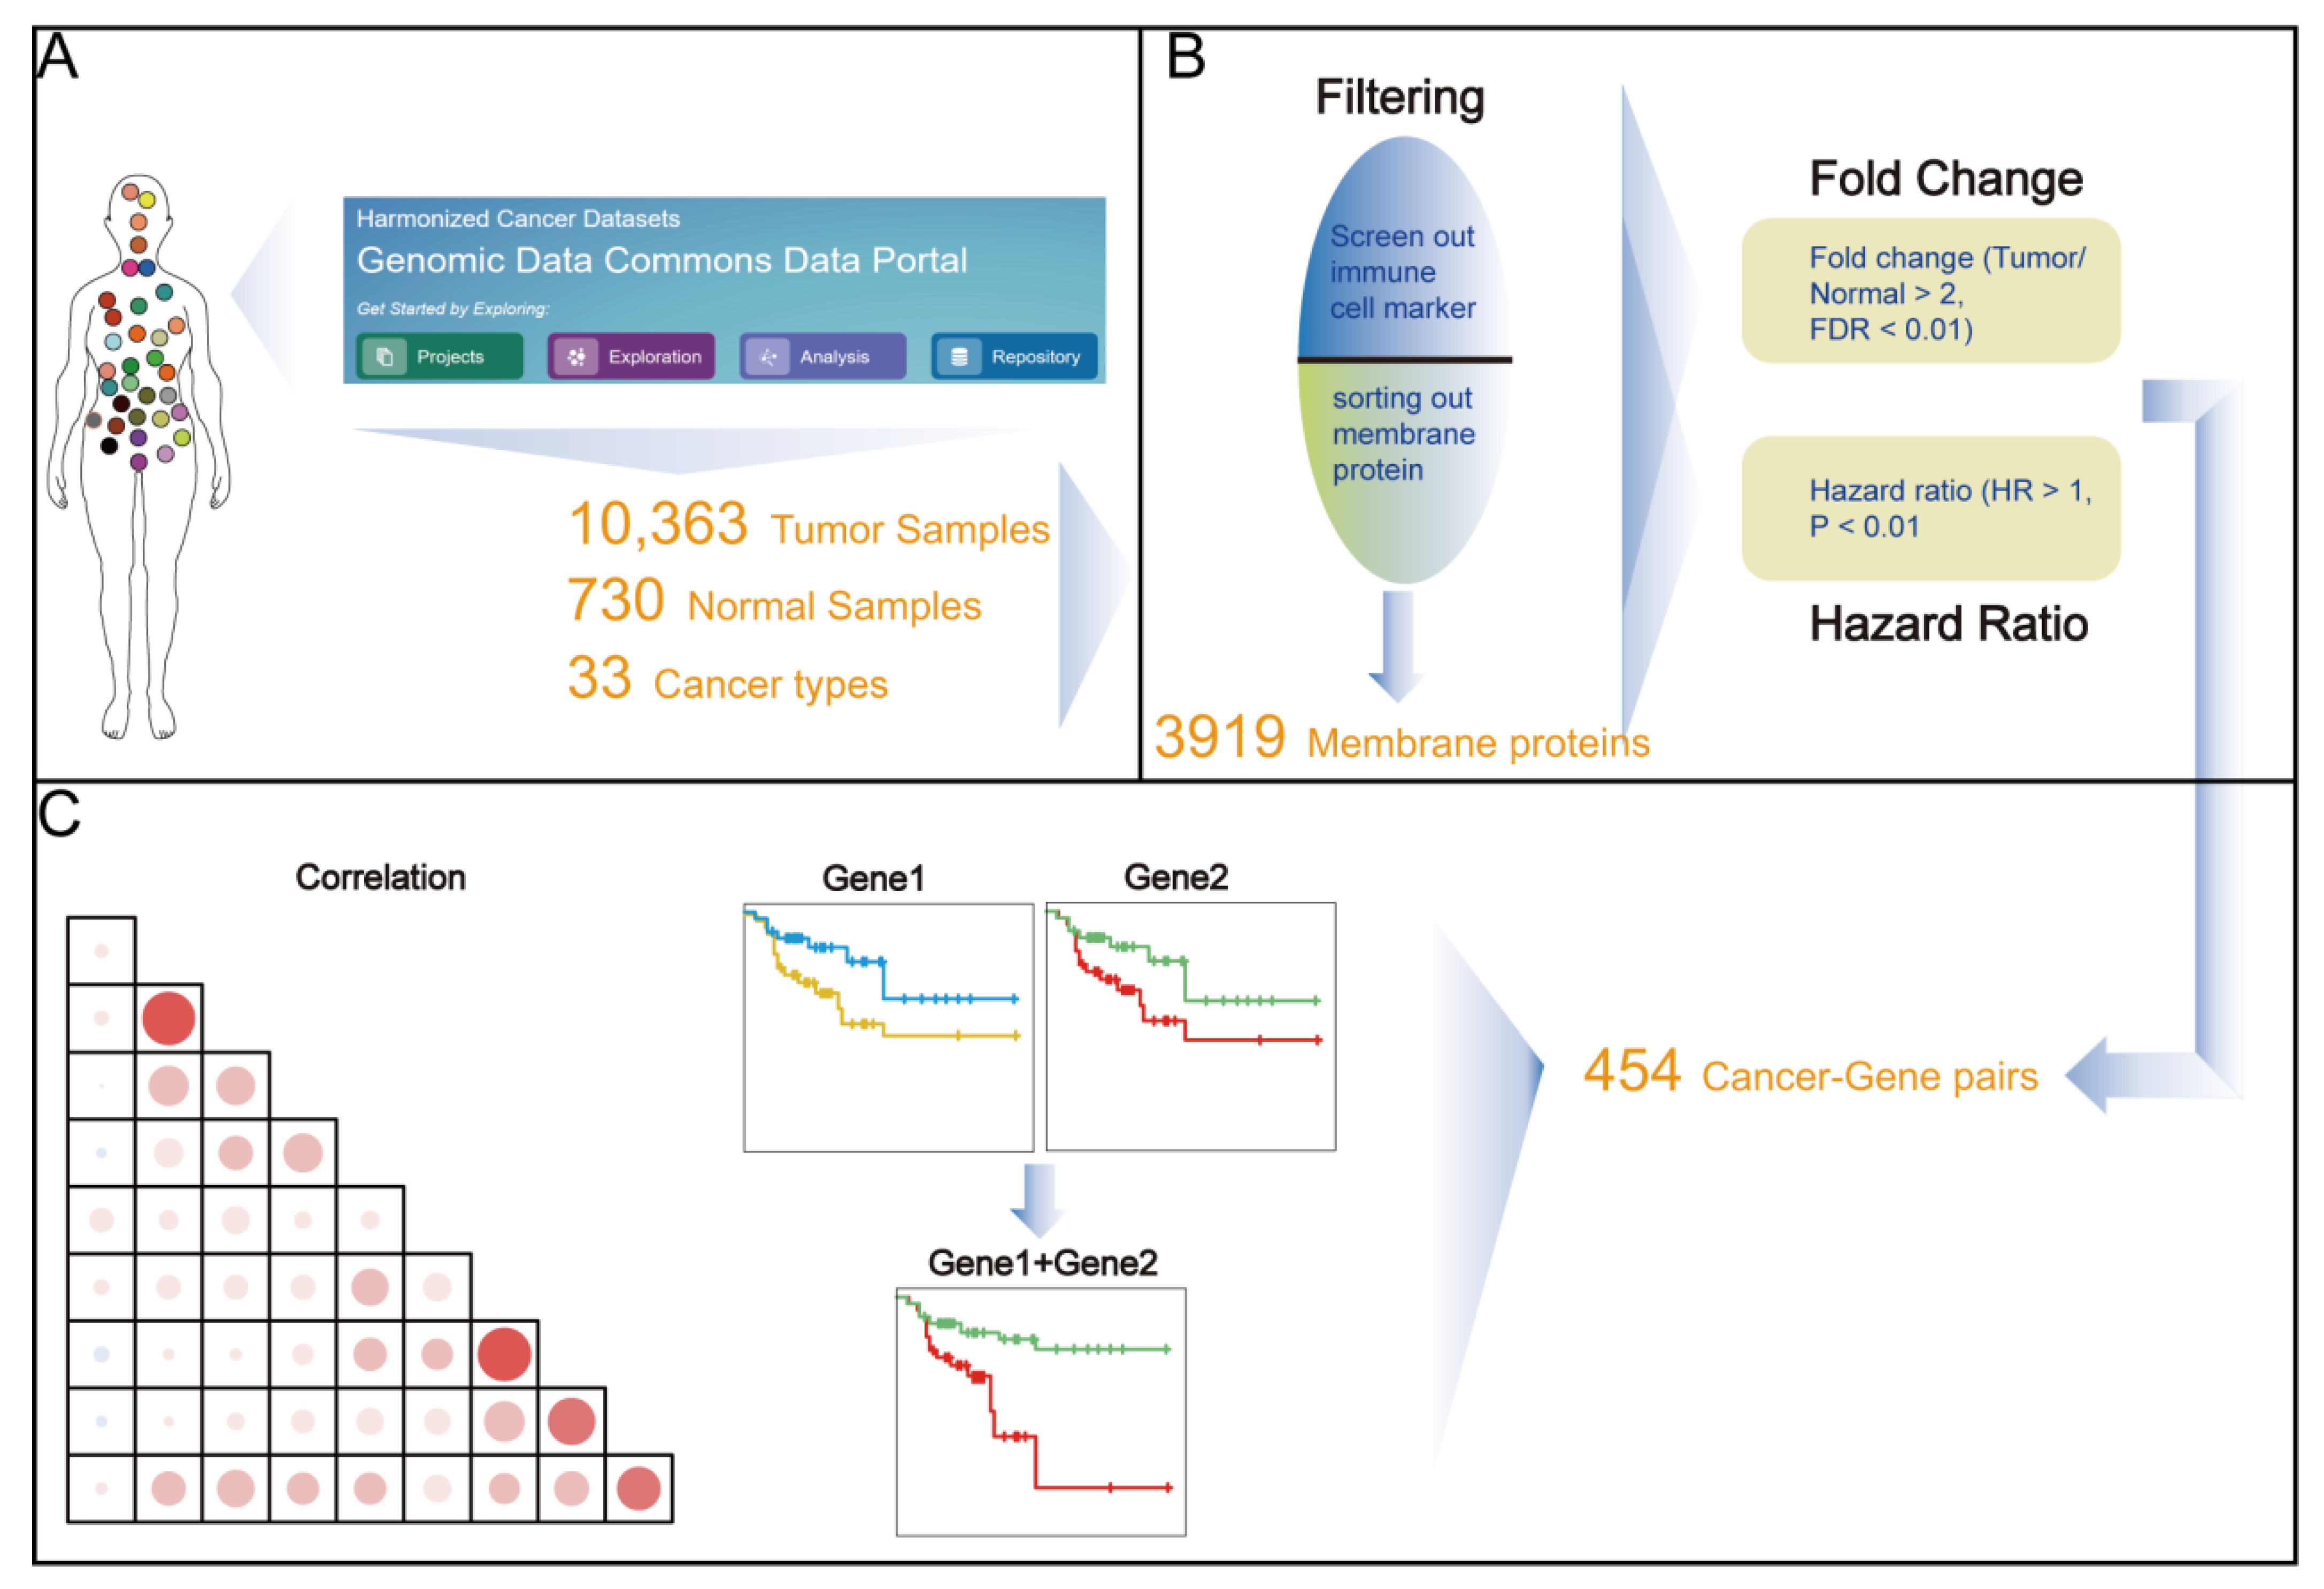
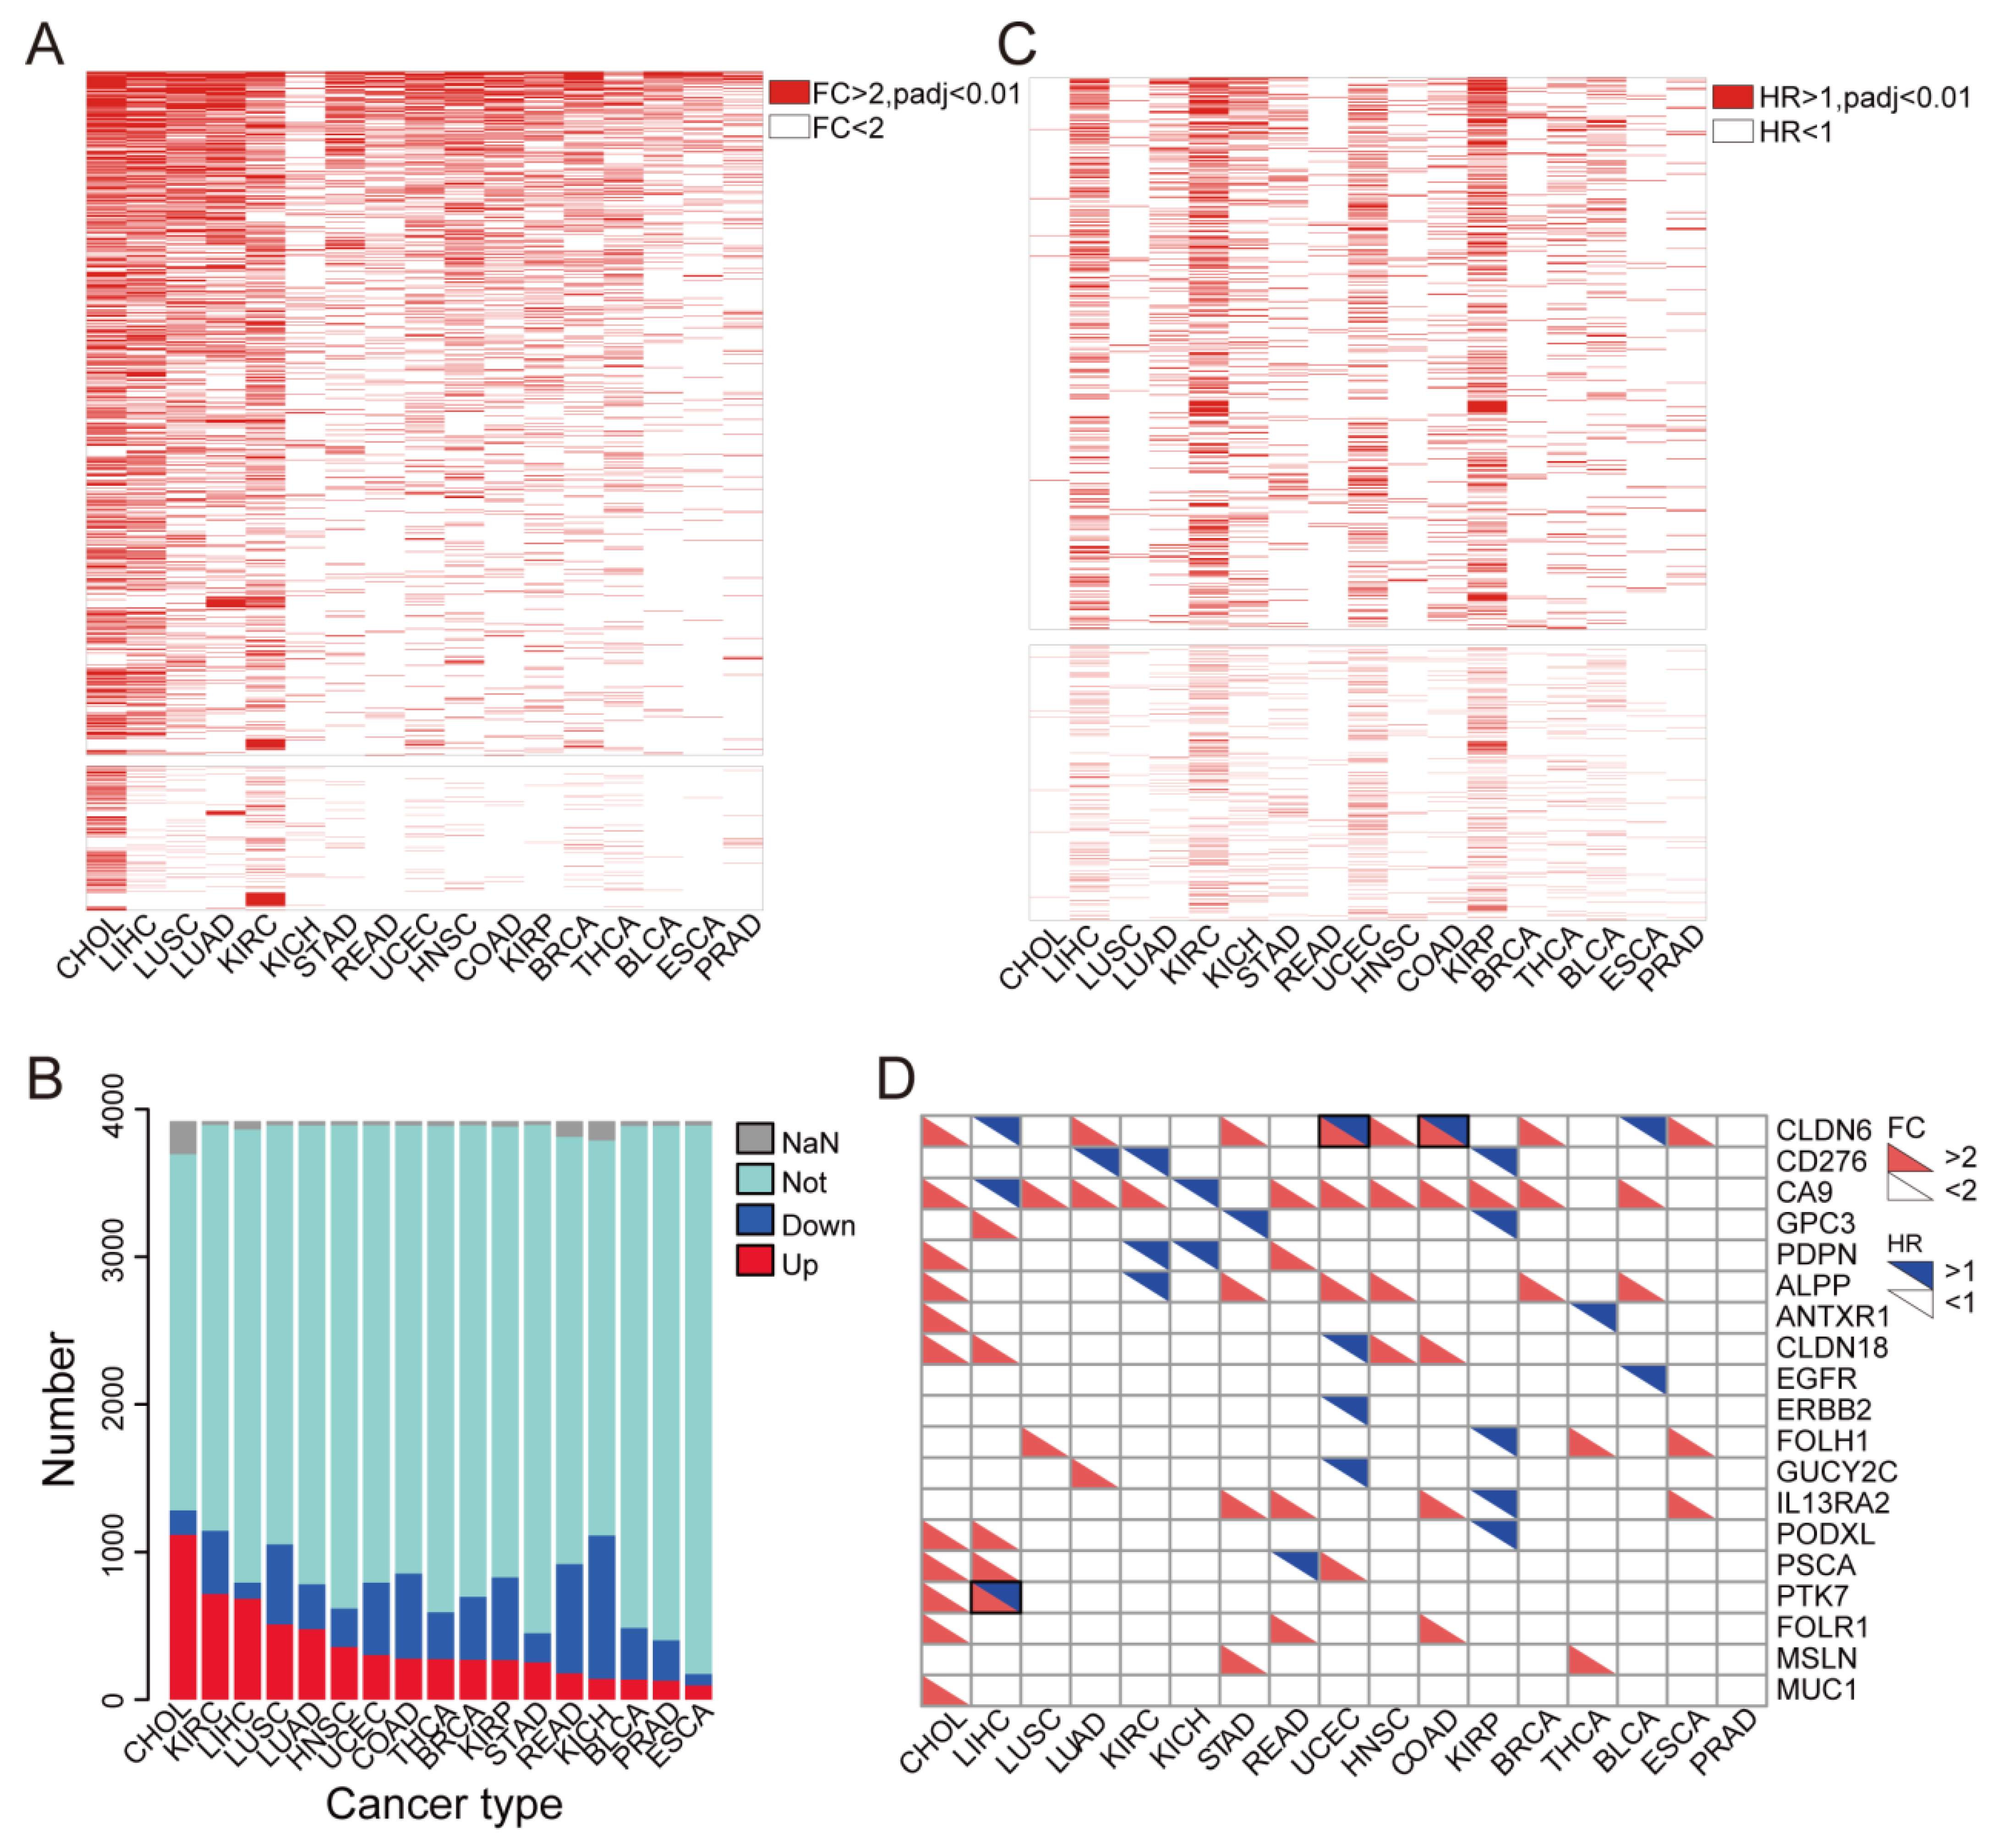
3.1. Identification of Up-Regulated Tumor Cell Membrane Proteins

To analyze the TSAs in tumor tissues, we first identified the membrane protein-coding genes with up-regulated expression levels through a series of pan-cancer screenings. Firstly, the expression profiles of mRNA were obtained from the TCGA database by excluding the data from the cancer types with less than three normal controls (Figure 1A). Secondly, we further selected the tumor cell membrane-coding genes by intersecting the filtered immune cell markers genes and the cell membrane protein-coding genes (Figure 1B). Finally, we examined the potential utility of these membrane genes as drug targets (Figure 1C).
In the first step of the analysis, we found that 3919 membrane proteins were differentially expressed in most tumor samples, compared with their corresponding adjacent normal tissues (Figure 2A and Figure S1). Specifically, we found that the number of up-regulated membrane proteins was larger than that of the down-regulated genes in the 17 cancer types, such as cholangiocarcinoma (CHOL) (up vs. down: 1117:166), stomach adenocarcinoma (STAD) (up vs. down: 252:198), head and neck squamous cell carcinoma (HNSC) (up vs. down: 357:261), kidney renal clear cell carcinoma (KIRC) (up vs. down: 717:427), liver hepatocellular carcinoma (LIHC) (up vs. down: 684:109), lung adenocarcinoma (LUAD) (up vs. down: 478:304) and esophageal carcinoma (ESCA) (up vs. down: 96:78) (Figure 2B and Figure S1). We further illustrated a heatmap to demonstrate the up-regulated membrane proteins in tumor tissues (Figure 2A). Furthermore, a volcano plot shows the differential expression of these target membrane protein-coding genes, which are listed in Table 2.

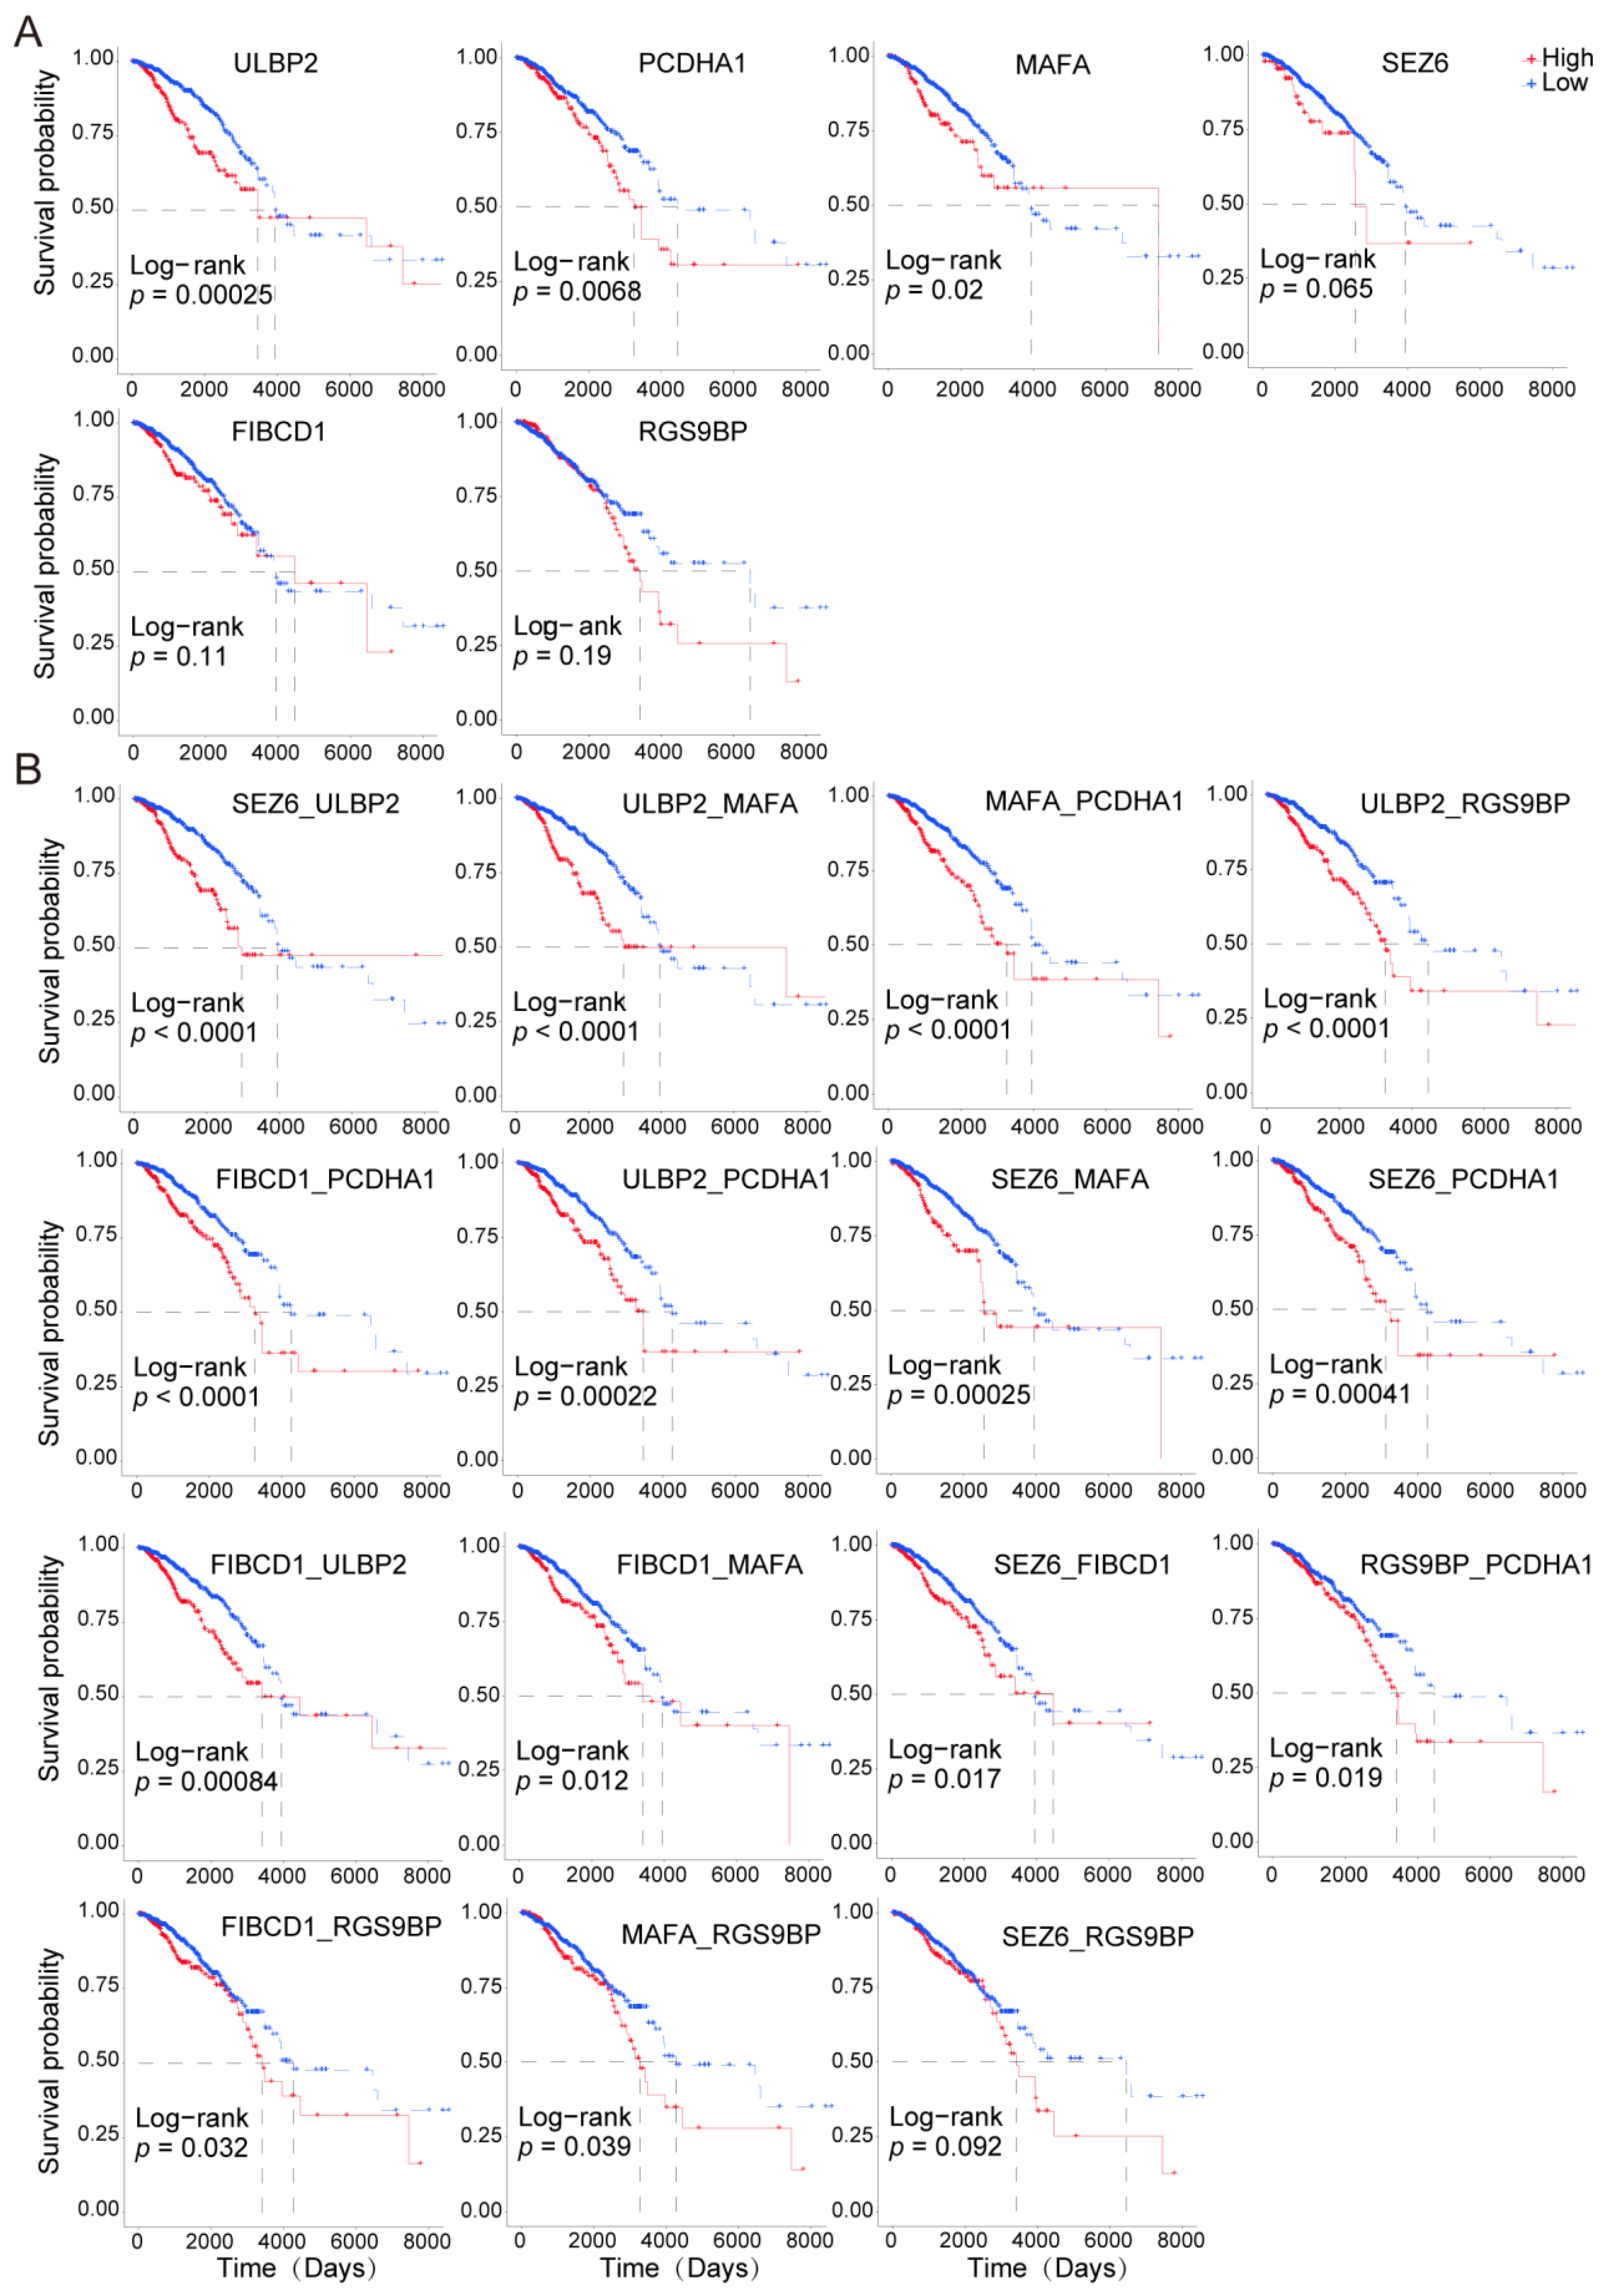
3.2. Most Highly Expressed Membrane Protein-Coding Genes Could Serve as Risk Factors for Cancer Patients

To further explore the impact of these highly expressed membrane proteins of the tumor tissues on the prognosis of the tumor patients, Cox risk regression analysis of these genes was applied to the patients from TCGA (Table S1). Additionally, we found that most of these membrane proteins were risk factors for tumors. To be specific, 427, 584, 431 and 578 genes were identified as risk factors for LIHC, KIRC, UCEC (uterine corpus endometrial carcinoma), and kidney renal papillary cell carcinoma (KIRP), respectively (Figure 2C). The detailed prognostic values of the membrane proteins have been summarized for further verification in Table S1. To confirm the reliability of the previous analysis, we searched for whether these target proteins are currently used in TSA-based therapy with solid evidence and found that most membrane proteins we identified were consistent with the published data (Table 3). Furthermore, these tumor cell membrane proteins were either highly expressed in tumors or prognostic risk factors for tumor patients. Furthermore, some of them have been proven to be drug targets in solid tumors, such as GPC3 in liver cancer [36], MSLN in gastric cancer, and EGFR in glioma (Figure 2D).

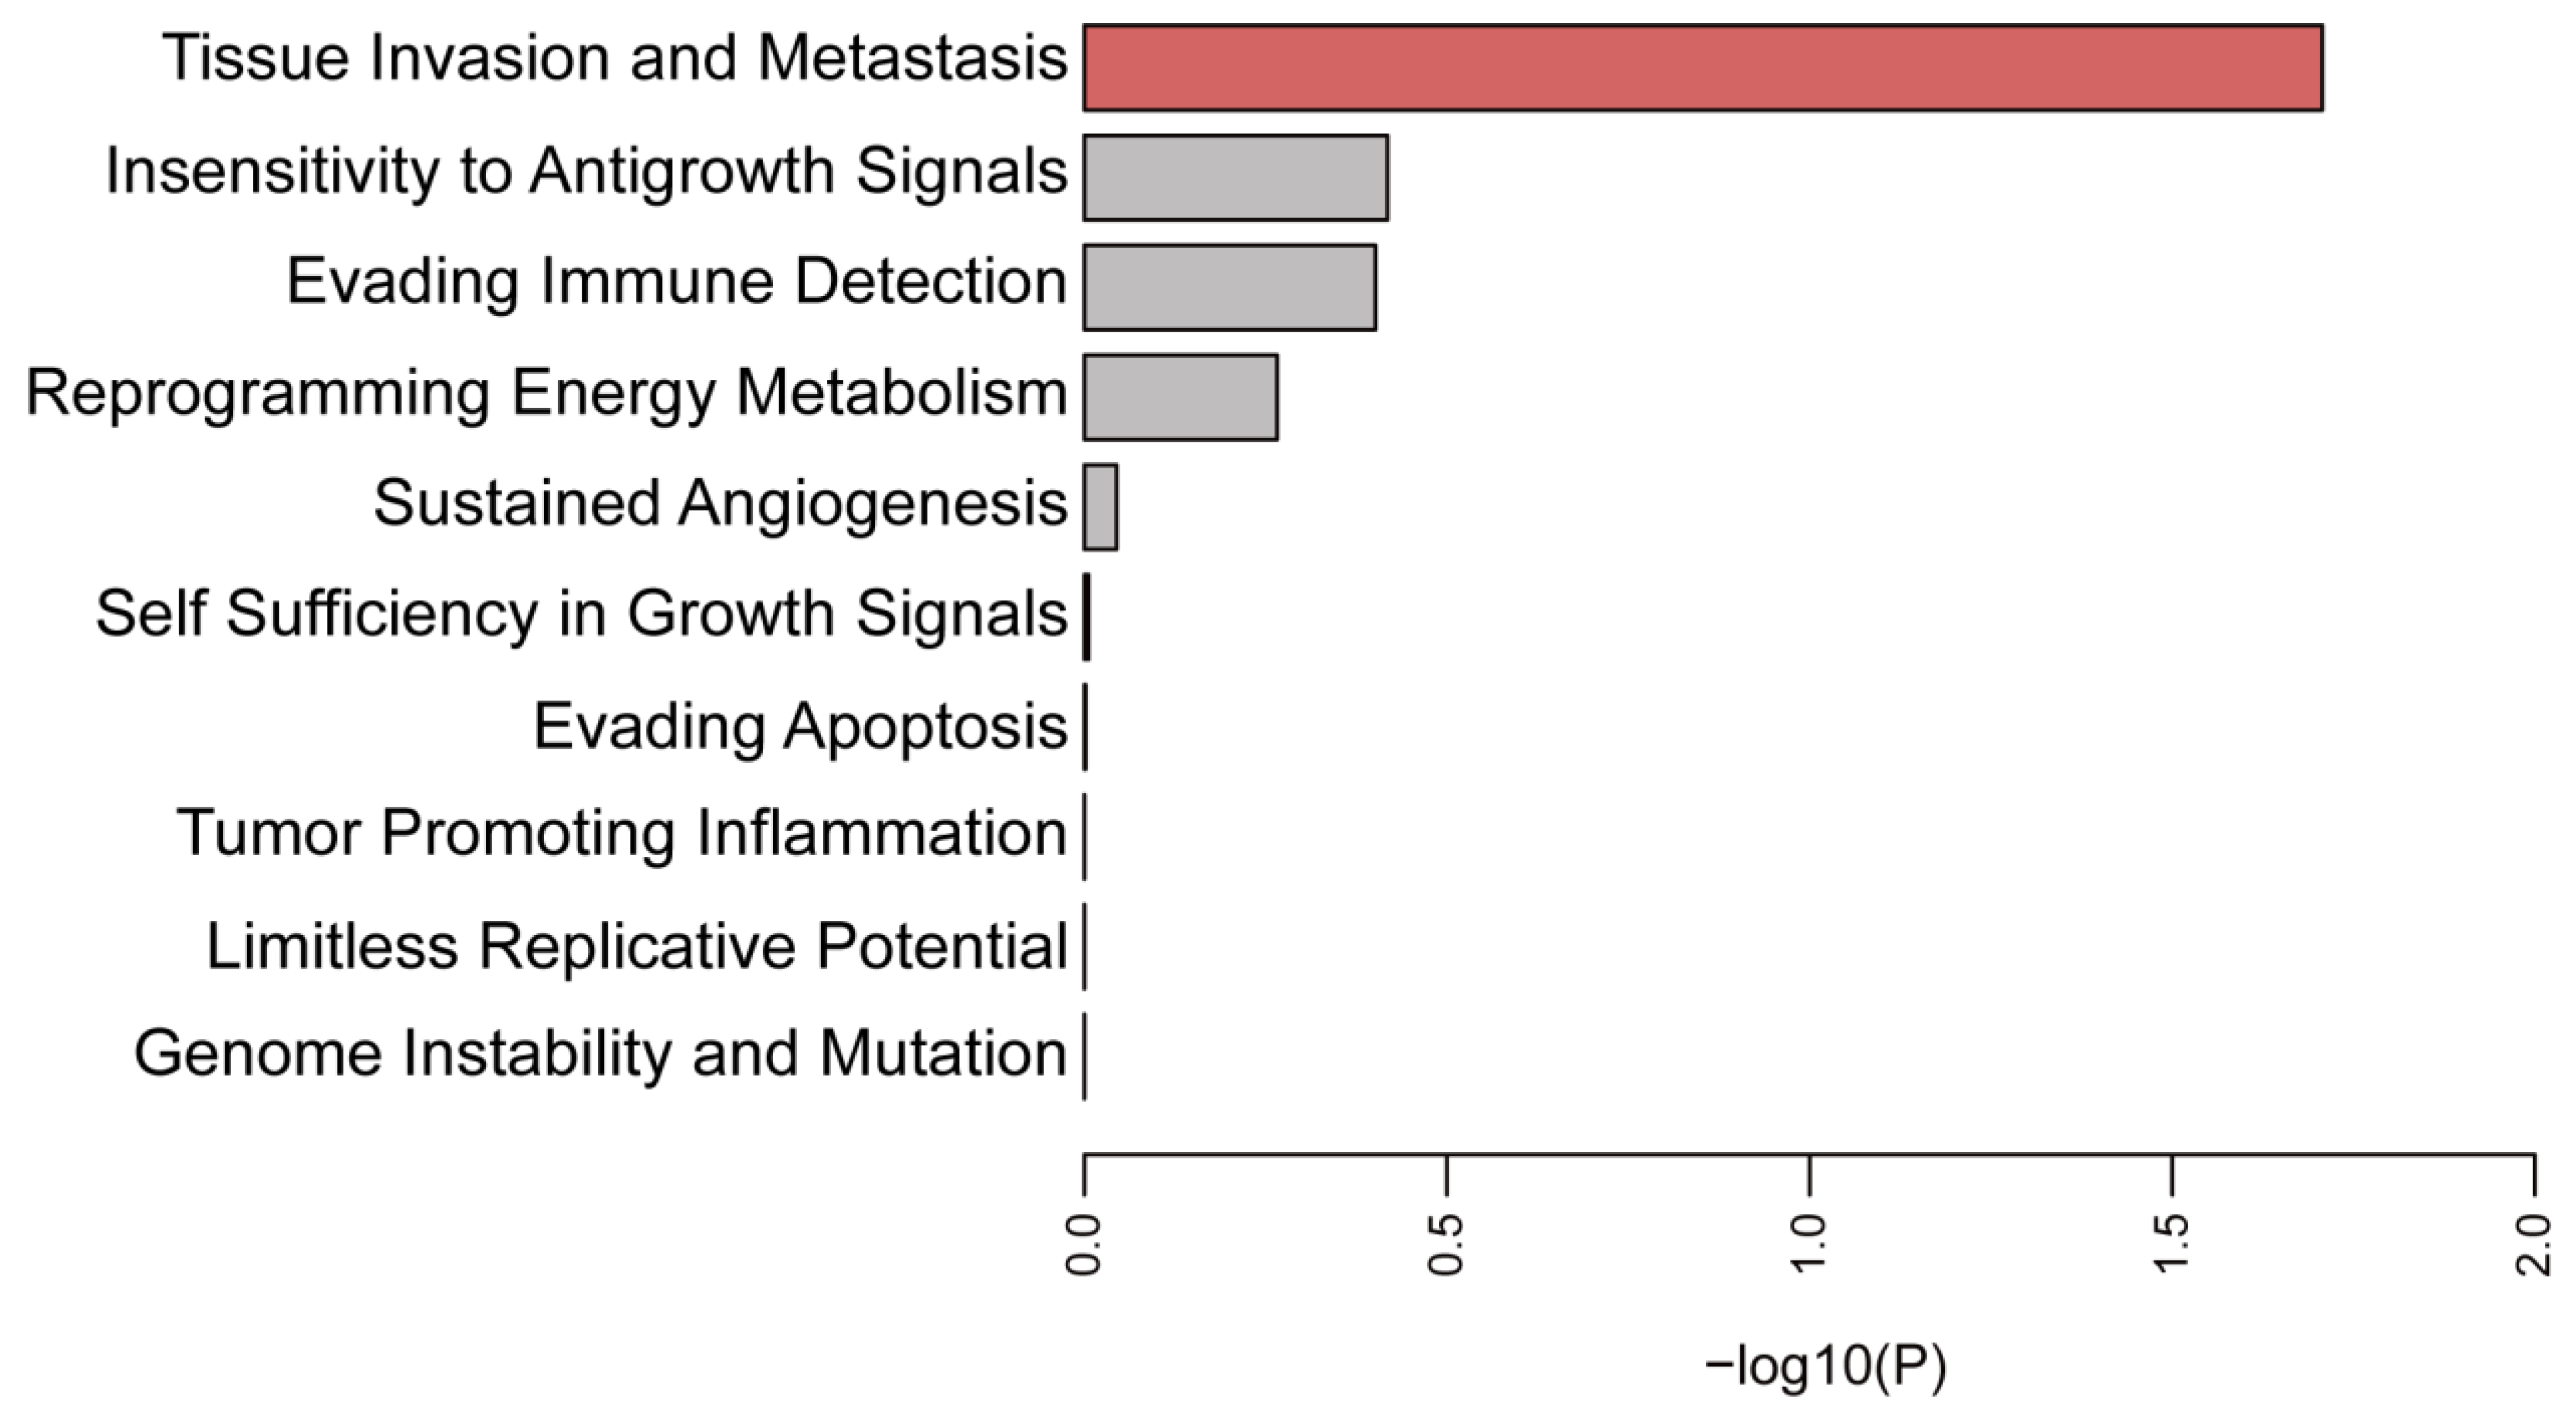
3.3. Function Enrichment Analysis of the Selected Membrane Proteins

To gain deeper insight into the potential functions of these selected membrane proteins, we comprehensively analyzed their functions according to the ten cancer hallmarks, such as invasion and metastasis, etc. [59]. Membrane proteins with higher expression used for functional enrichment analysis are detailed in Table 2. Hypergeometric analysis of these genes demonstrated that they were mainly involved in the invasion and metastasis of the tumor cells (Figure 3).

3.4. Paired Membrane Proteins Displayed More Precise Prognostic Value

To further investigate the combinatorial effects of these genes on the survival of the cancer patients, we established a risk scoring system using a formula containing the gene expression levels and the regression coefficients from the univariate Cox regression model (Table S2). We found that the combined analysis of these genes displayed greater accuracy in predicting the prognostic outcomes of the cancer patients (Table S1 and Figure 4A,B). For example, the prognostic risk stratification power was improved by the following combination of groups, such as SEZ6 and ULBP1, ULBP2 and MAFA, and PCDHD1 and MAFA, compared with the results when the genes were individually analyzed.

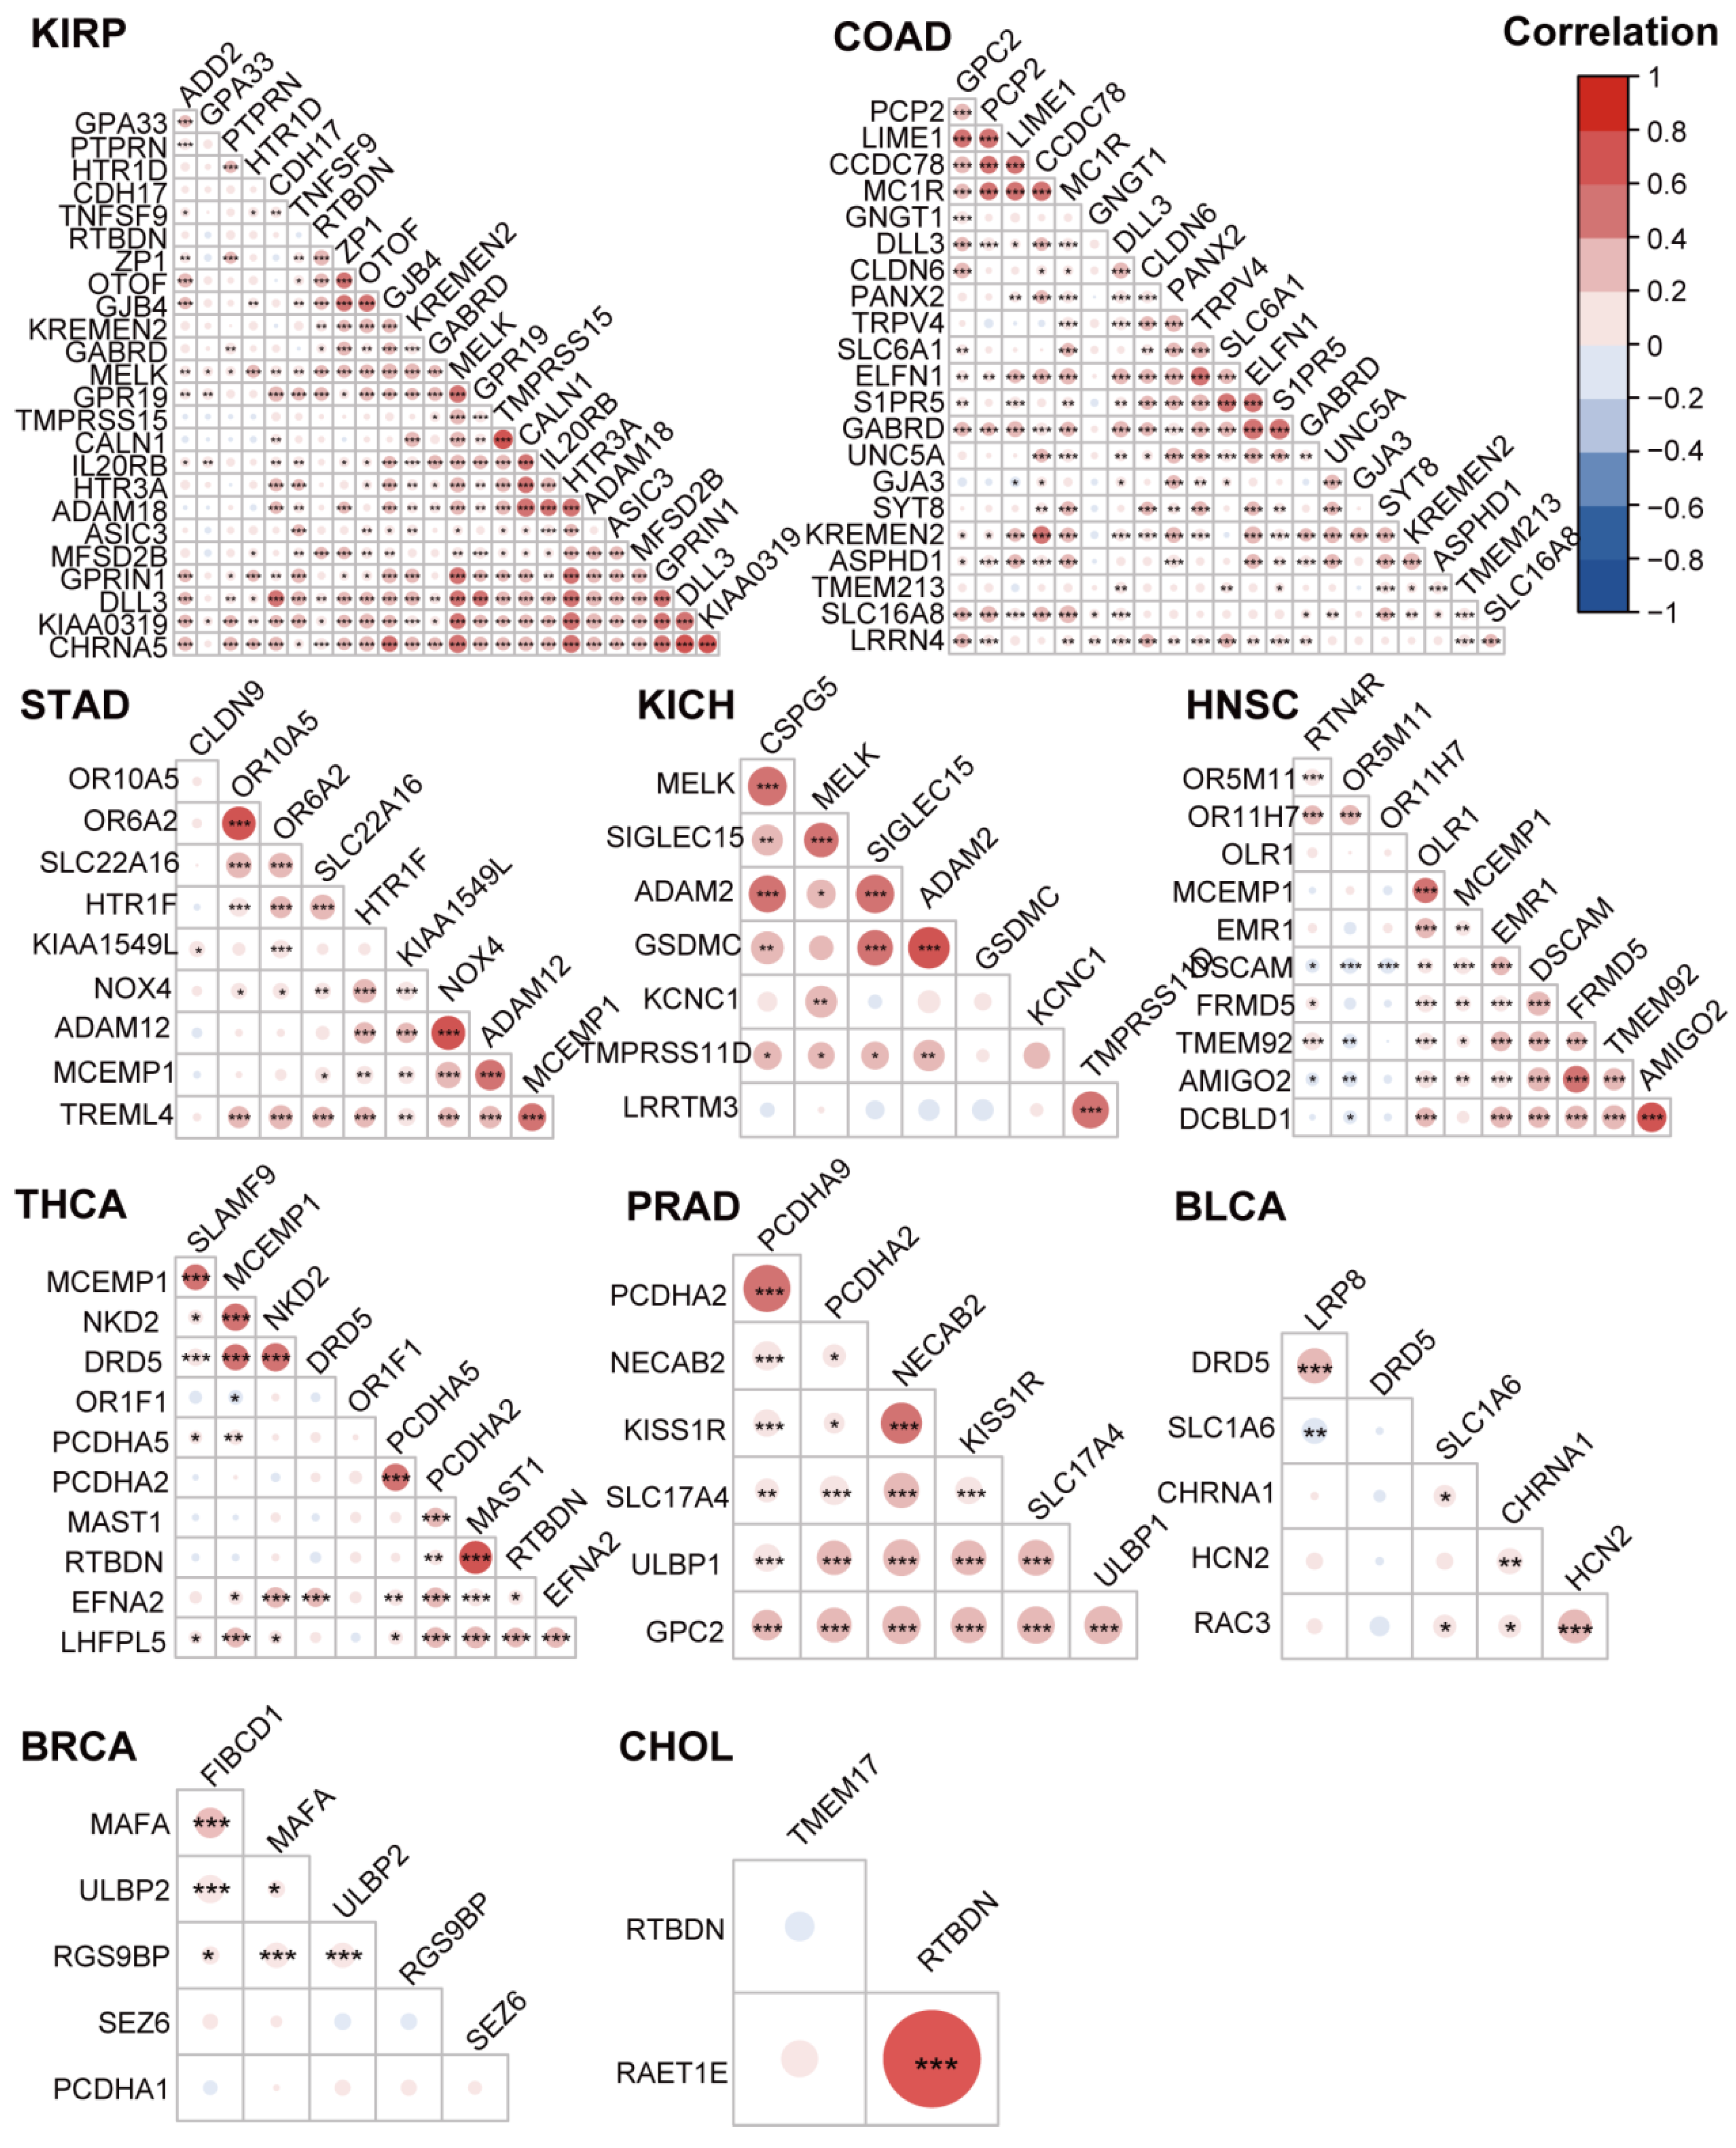
3.5. The Highly Expressed Cell Surface Proteins of the Tumor Tissues were Highly Correlated

To investigate whether these membrane proteins were correlated, we calculated the association among the membrane proteins in the 17 tumor types through a Pearson’s correlation test. As shown in Figure 5 and Figure S2, the membrane proteins identified previously were significantly positively correlated with most membrane proteins in every tumor type (Figure 5 and Figure S2).

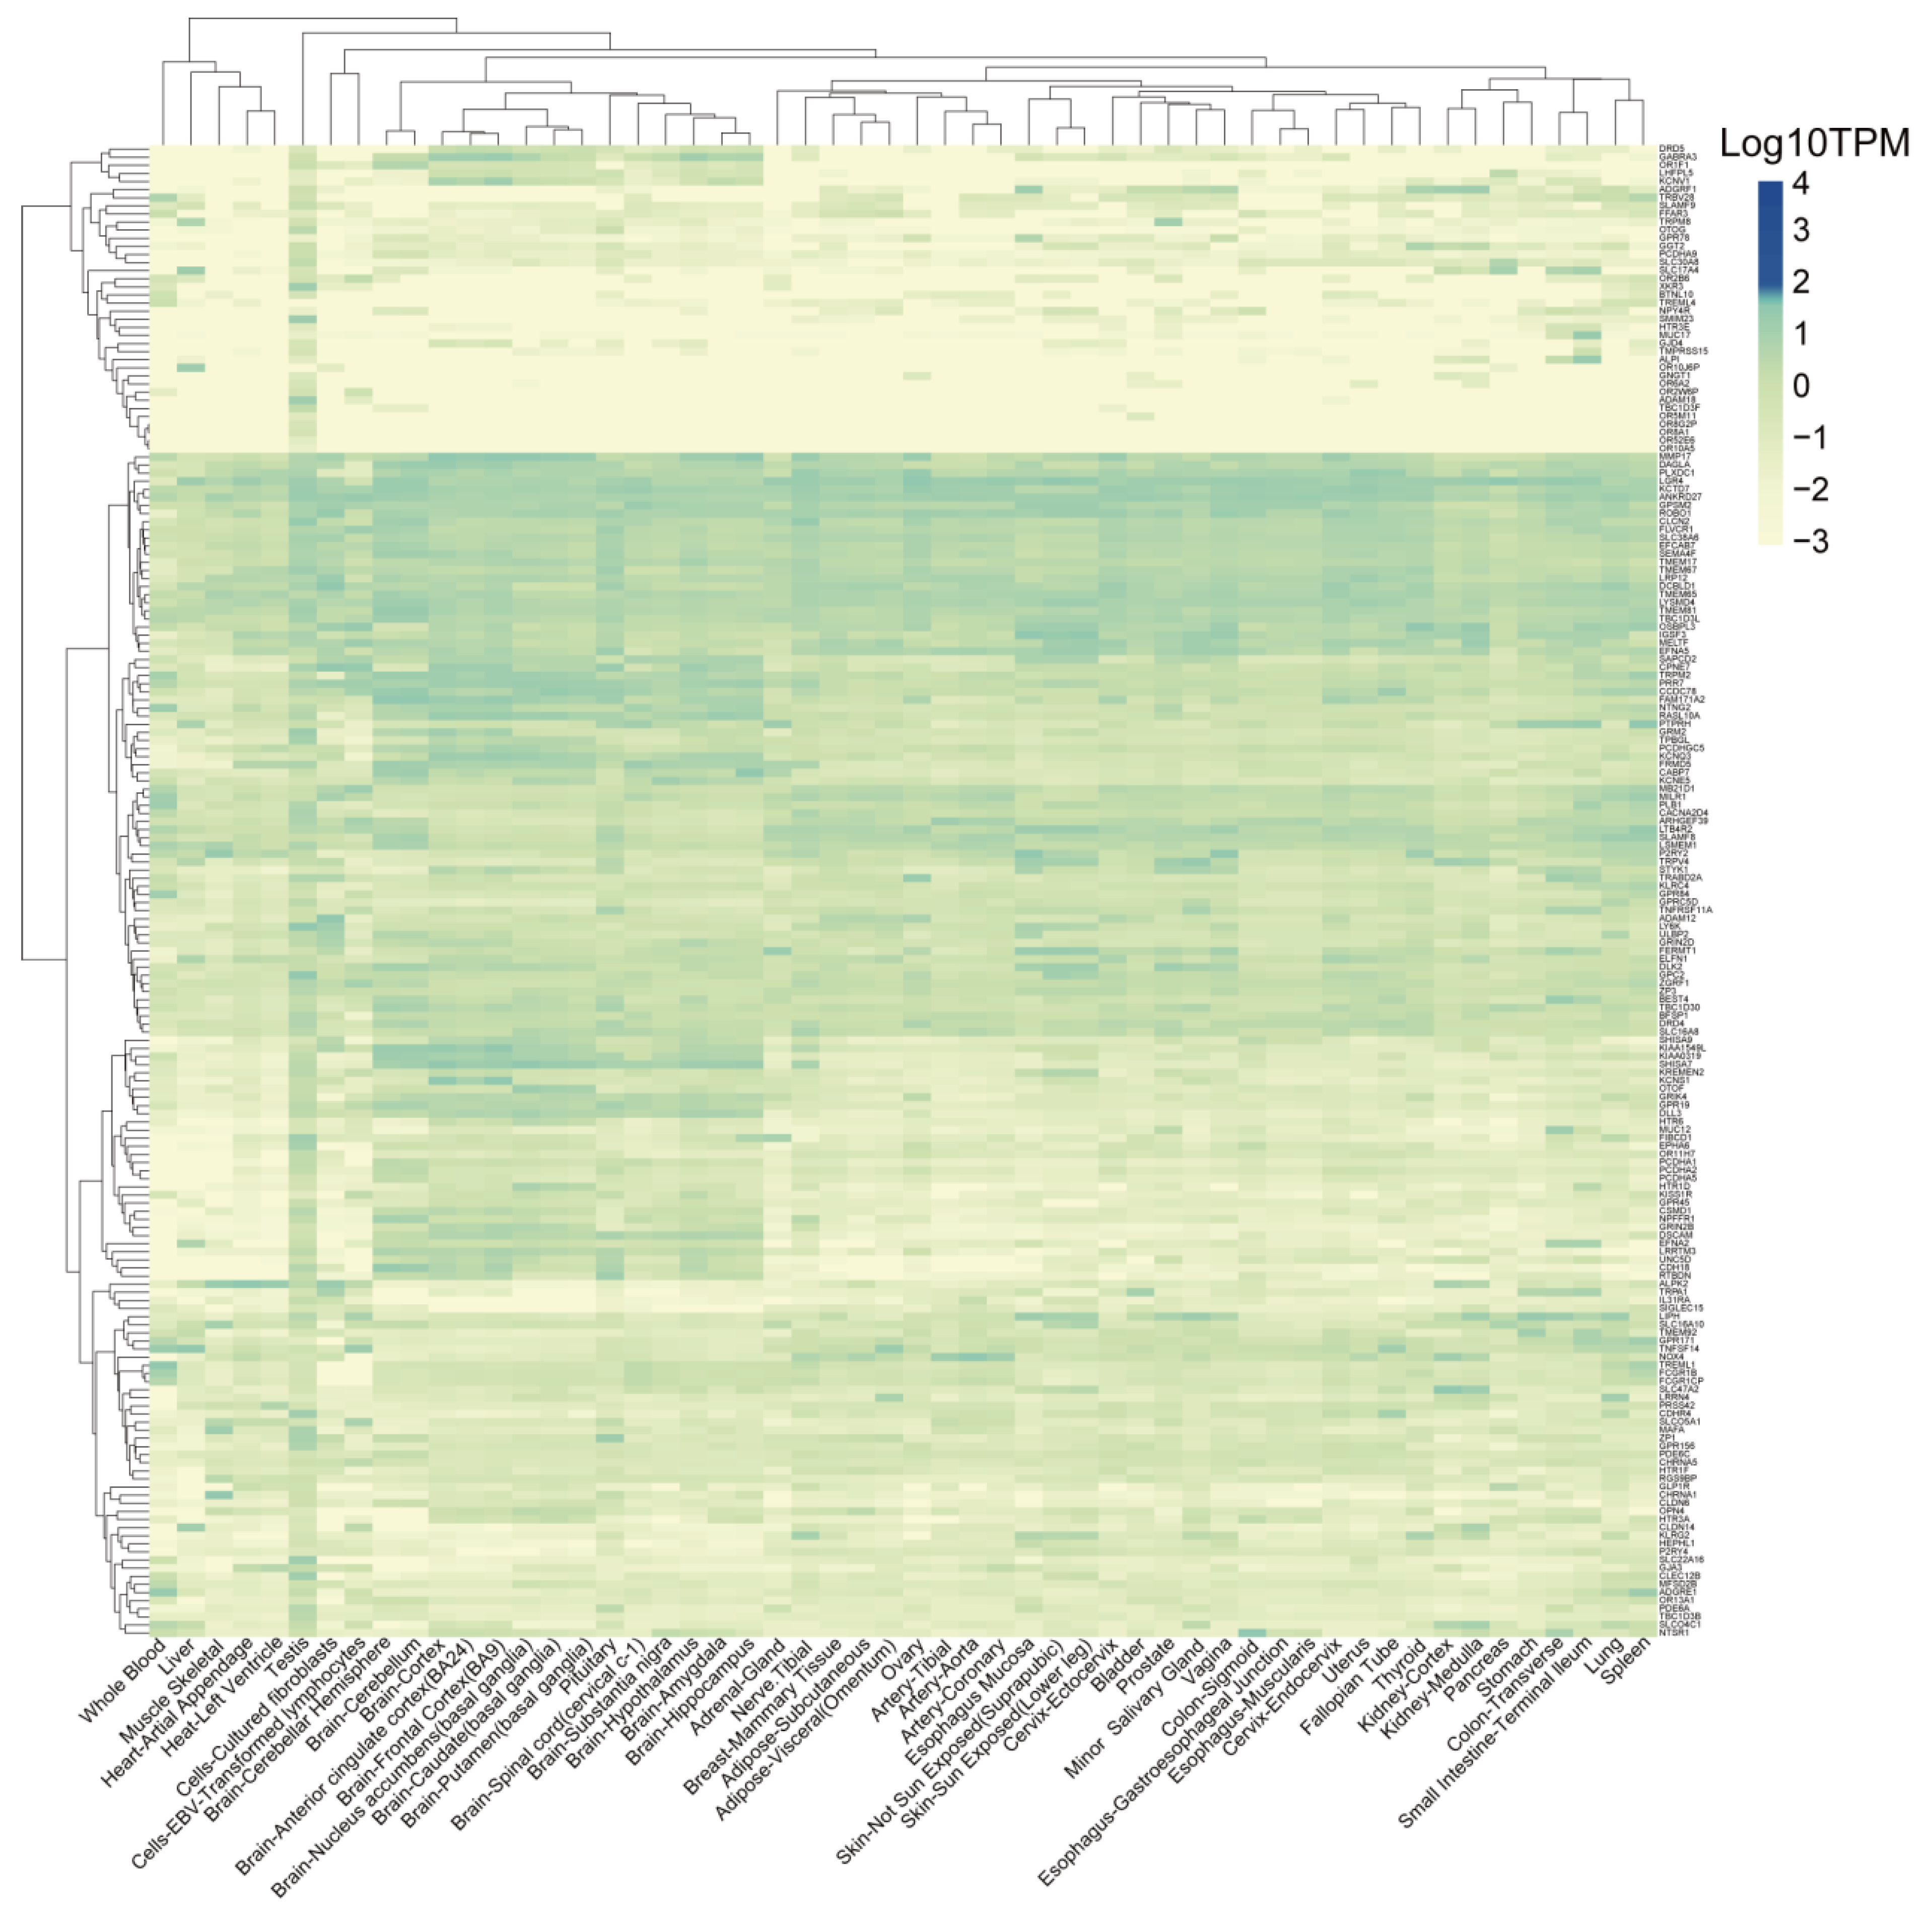
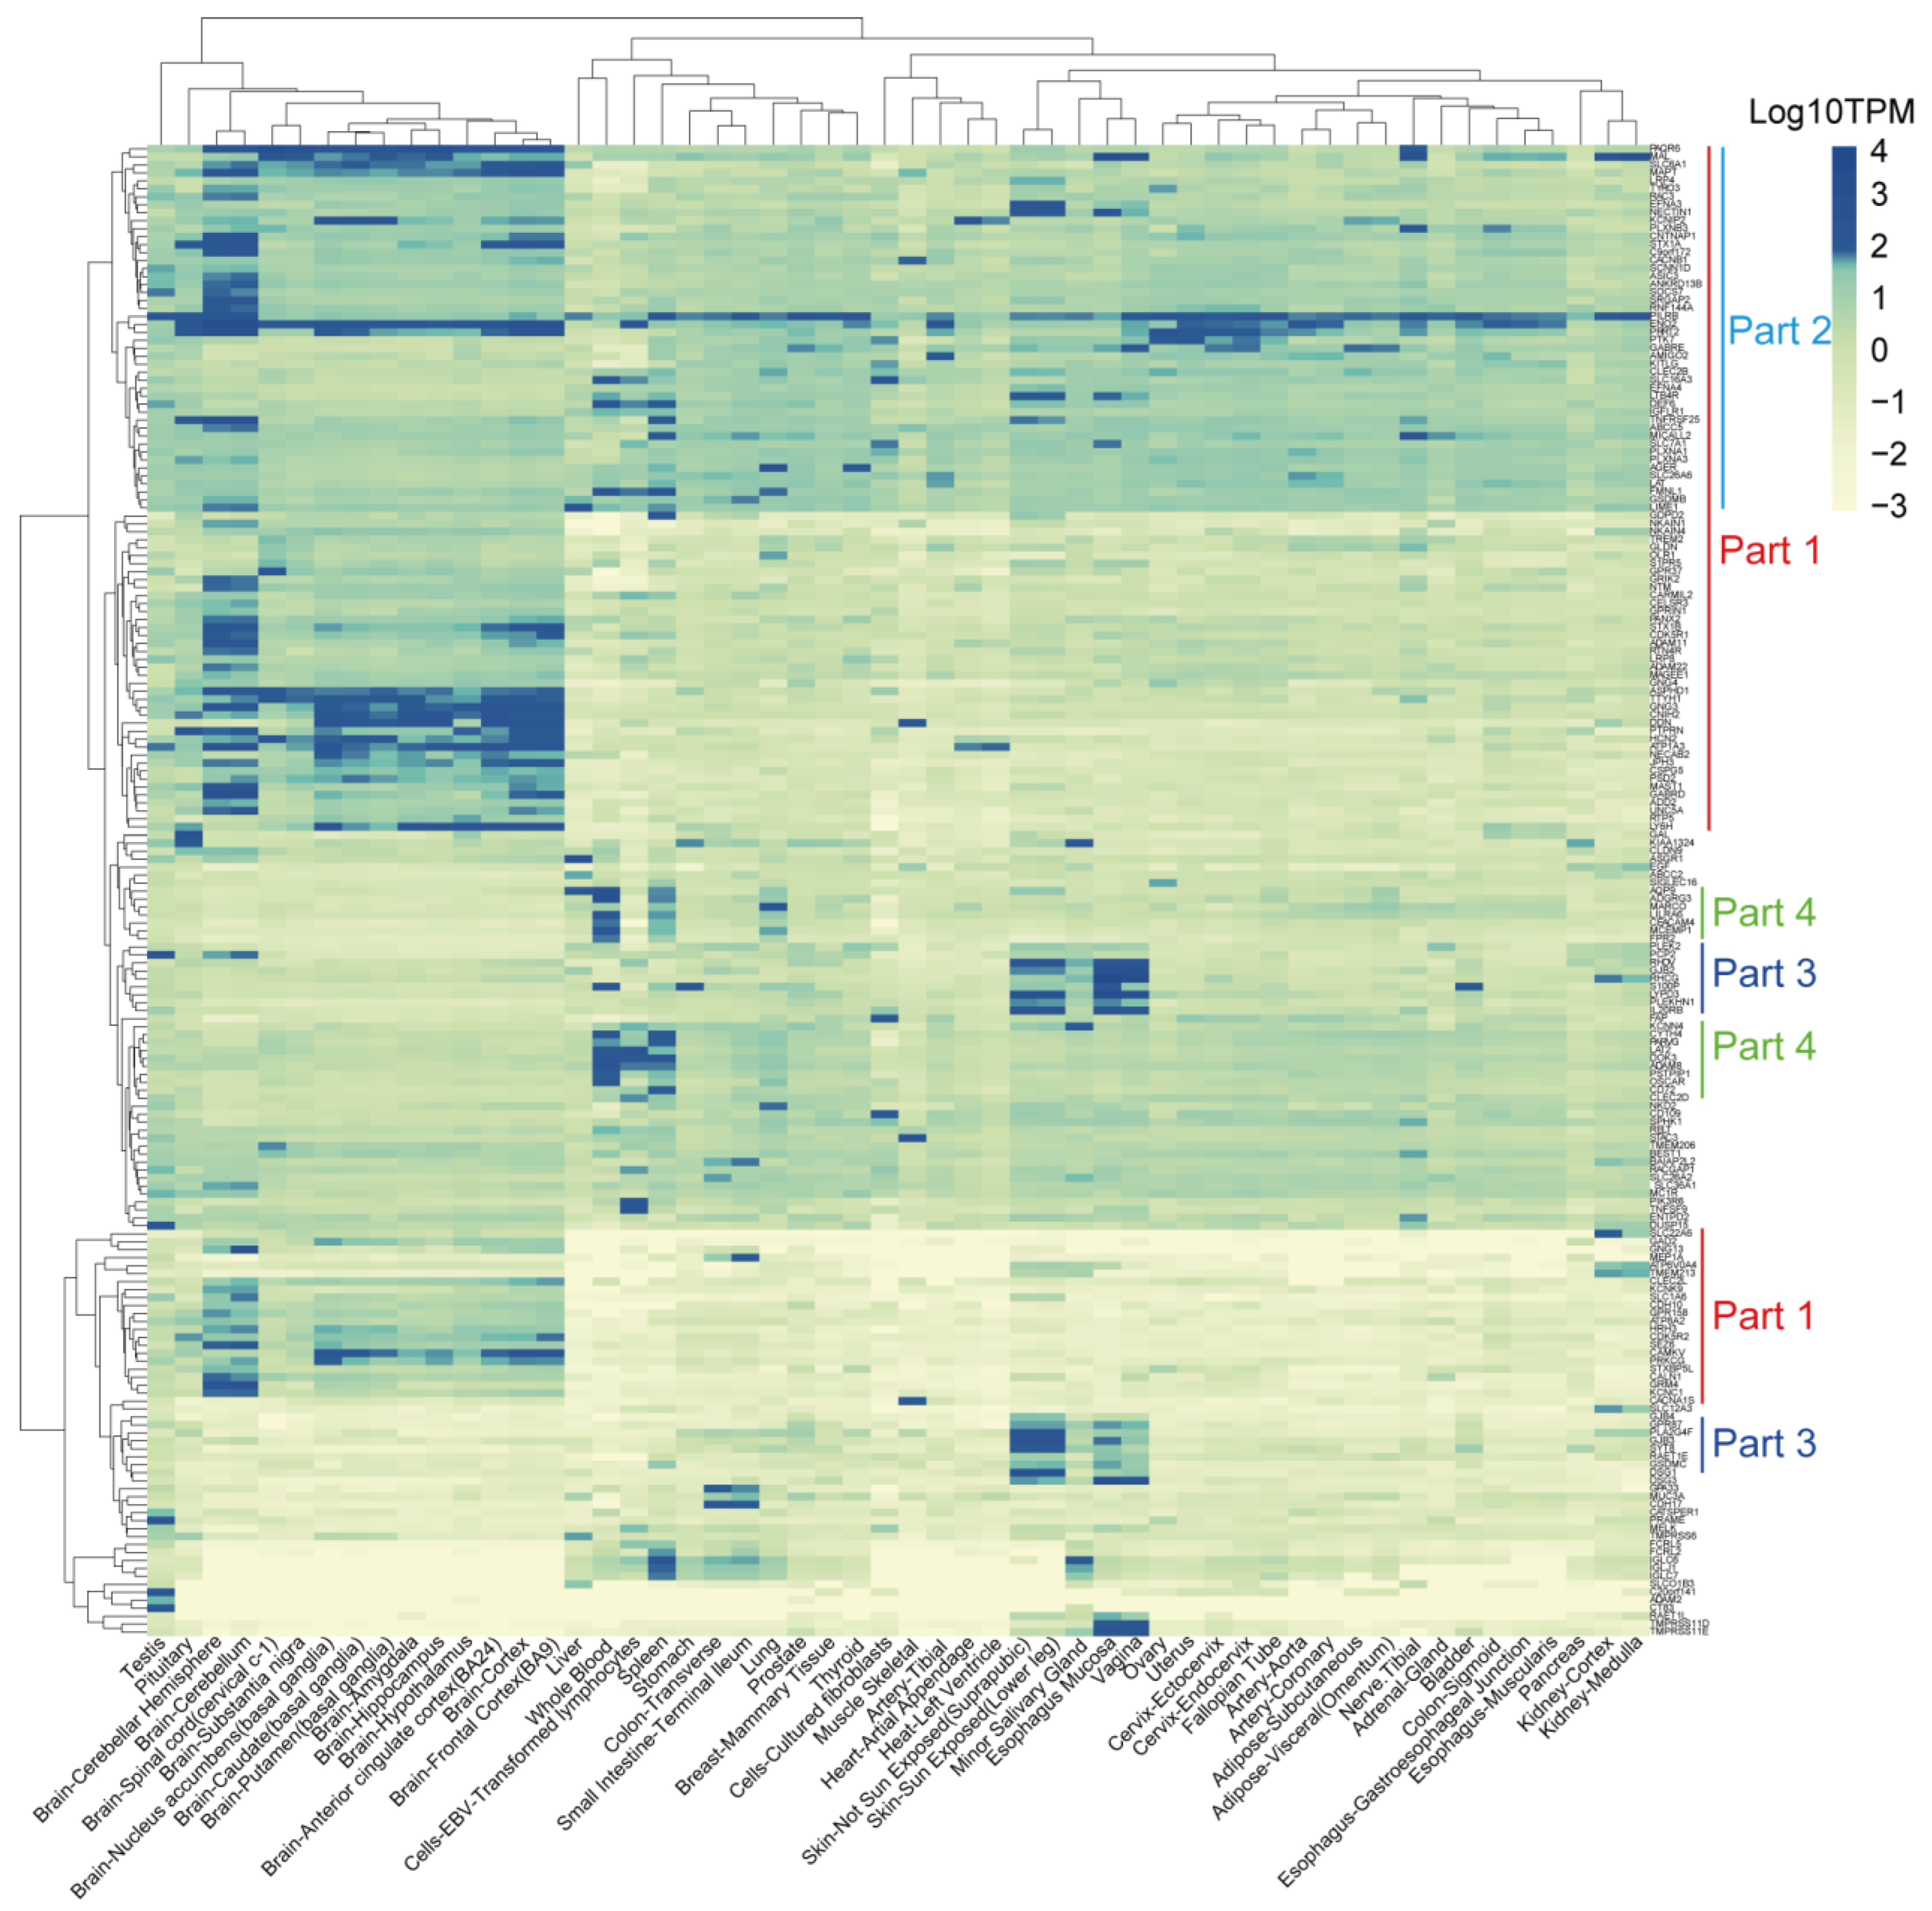
3.6. Identification of TSAs That Are Expressed Less in Normal Tissues

To further investigate the potential “on-target, off-tumor toxicity” effect of these proteins, we obtained the expression levels of the 371 target membrane protein-coding genes (See Table 2 for details) from 54 normal human tissues from the GTEx database. The cumulative distribution analysis demonstrated that the TPM expression levels of most genes were logarithmically distributed between −2 and 1.60 (Figure S3). We defined the genes with expression levels greater than or equal to 1.60 as high-expression genes, while genes with expression levels less than 1.60 as low-expression genes. According to this threshold, the genes were divided into two categories (Figure S3). Our results indicated that 184 genes were expressed less in these tissues (Figure 6) and the other 187 genes, which were specifically and highly expressed in some normal tissues (Figure 7). The genes in part one were relatively highly expressed in all brain tissues, while the genes in part two were widely expressed in all tissues. The genes in part three were mainly expressed in the human epidermis, mucous membranes, and glands. The genes in part four were highly expressed in blood cells, lymphocytes, and the spleen (Figure 7).

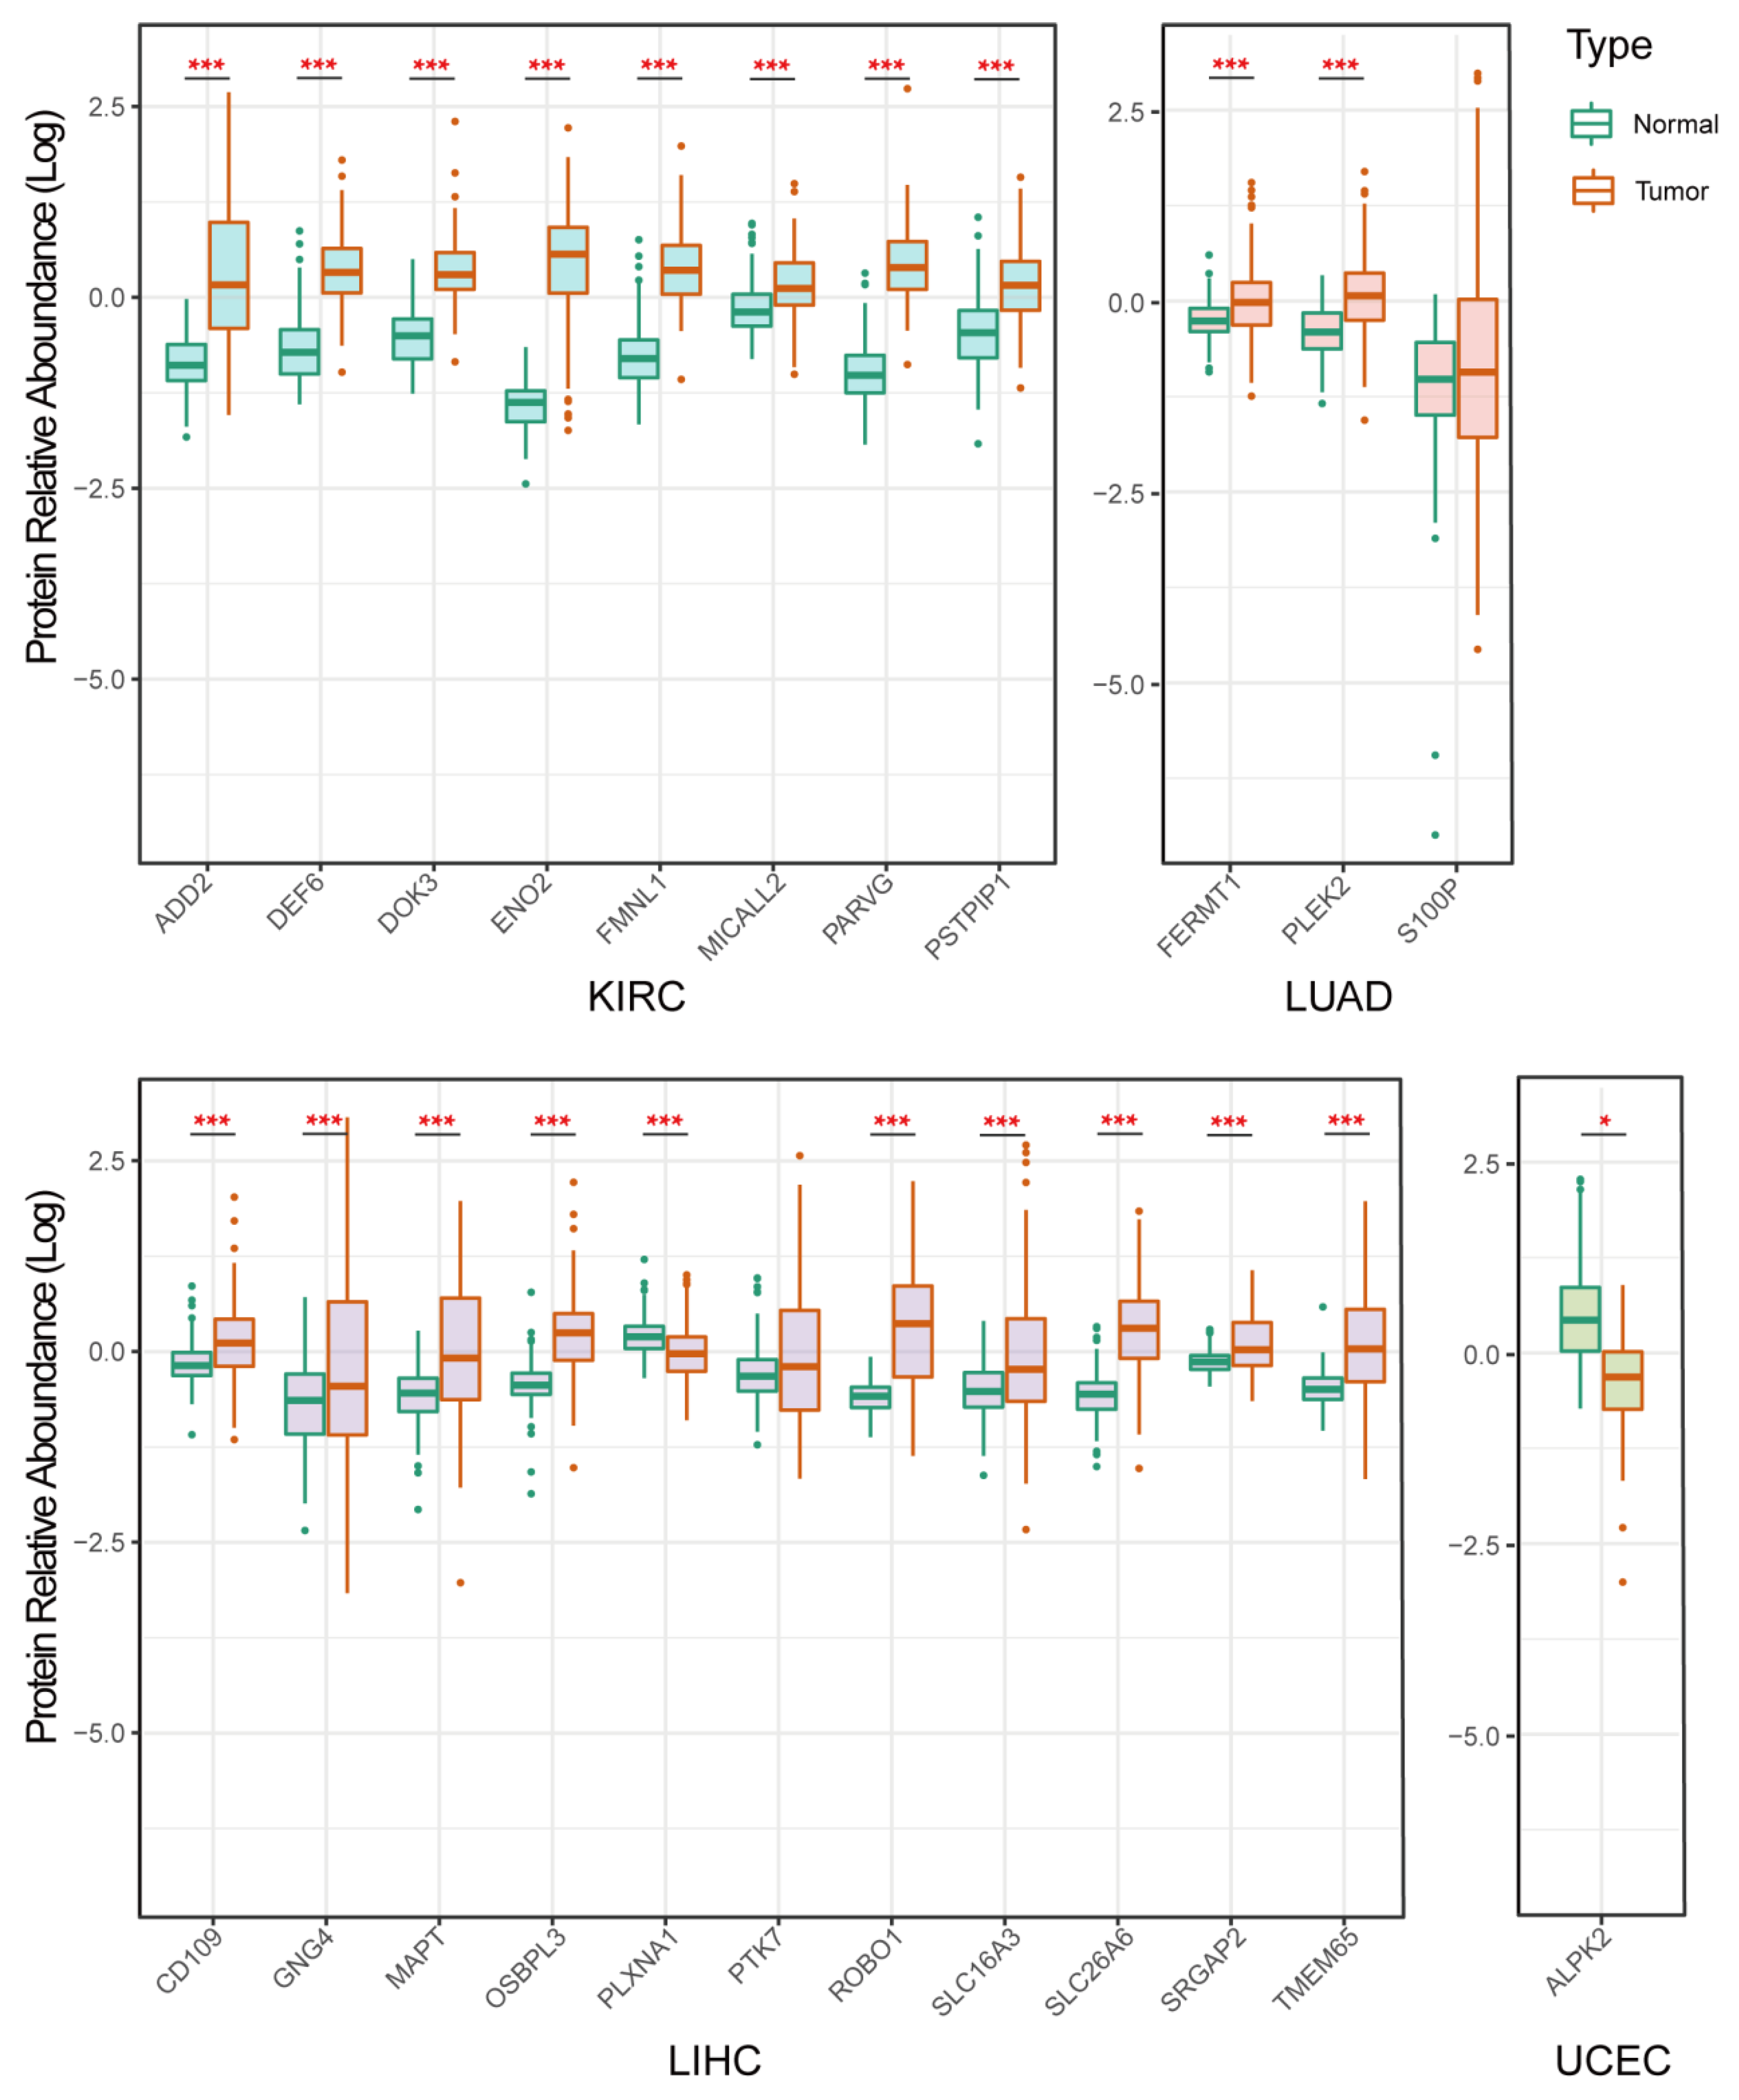
3.7. Validation of Protein Expression of the Selected Genes

To further validate our above findings, we checked the protein expression levels of the obtained genes from the CPTAC tumor protein database (CPTAC, Clinical Proteomic Tumor Analysis Consortium). We identified the expression levels of 23 proteins in four types of tumors (To be specific, KIRC: 8 proteins, LUAD: 3 proteins, LIHC: 11 proteins, UCEC: 1 protein) (Figure 8). It was found that eight proteins (ADD2, DEF6, DOK3, ENO2, FMNL1, MICALL2, PARVG, and PSTPIP1) in KIRC cancer were more highly expressed in tumor tissues (100%), compared with normal tissues. The expression of two proteins (FERMT1, and PLEK2) in LUAD cancer were higher in tumor tissues (66.6%) than in normal tissues. The expression of nine proteins (CD109, GNG4, MAPT, OSBPL3, PLXNA1, ROBO1, SLC16A3, SLC26A6, SRGAP2, and TMEM65) in LIHC cancer were higher in tumor tissues (81.82%) than in normal tissues (Figure 8).

4. Discussion

The identification of antigens specifically expressed on the surface of tumor cells is vital for the design of adoptive T cell therapy and ADCs. Our study found that there were various highly expressed membrane proteins in a variety of tumor types (17 cancer types), which were also significantly associated with the survival rate of patients. These findings expand the recent document that identified 200 genes as breast cancer subtype-specific targets by differential expression analysis of RNA-seq data from TCGA [60].
In our discovery, 184 genes were lowly expressed in normal tissues, which further supports the advantage of our strategy in identifying potential targets. Some of them were proved to be successful targets with significant curative effects on some malignant hematological tumors, such as anti-CD19 CAR-T therapy for the treatment of chronic lymphocytic leukemia [61], and anti-CTL019 CAR-T therapy for the treatment of relapsed and refractory B-cell acute lymphoblastic leukemia [62]. In addition, CD66c, CD318, TSPAN8, and CLA were identified as candidate targets for CAR-T therapy in a pancreatic tumor patient-derived xenograft model [63].
Our enrichment analysis identified the relationship of these highly expressed surface proteins and the human immune status, which has a great advantage over the findings from Schreiner et al. Although they could predict the surface antigens of several hematological tumors which may be more applicable across cancer types, they did not exclude the potential adverse effects on immune cells, which may dampen the efficacy of the targets discovery [64]. For example, although the CAR-T therapy targeting CD276 was applied for the treatment of tumors [65], it may cause the death of dendritic cells since CD276 is also expressed in dendritic cells [66]. In addition, our screening methods also excluded CD66c, which was screened out by Schäfer D et al, because of its expression in granulocytes [67]. Furthermore, we excluded the use of the CAR-T target of gliomas: CD70 [68], which can consistently activate T cells and lead to T cell dysfunction [69]. The expression of DLL3 on the tumor tissues of patients with invasive breast cancer can promote the infiltration of immune cells, including plasma cells, CD8 T cells, CD44 memory-activated cells, macrophages, and T regulatory cells [70]. Amir et al., demonstrated that MUC-1 was a target for MUC1-positive cancer cells [58]. Stephen et al. developed an engineered CAR-T cells targeting the HER2+ glioma cells, which also improved disease control in patients with glioma [48]. In sum, our target membrane proteins are ubiquitously lowly expressed in normal tissues. Therefore, it may reduce the immune-associated adverse events during the application of CAR-T or ADCs in cancer treatment [71].
Correlation analysis further demonstrated that the surface proteins with poor prognosis were significantly correlated with each other, which suggests that the effects of the surface proteins on tumor progression may not work independently but coordinate with each other. In general, the paired target membrane proteins could be good potential candidates for dual-target CAR-T therapy and ADCs with fewer side effects [72].
Since the selected surface protein-coding genes were closely associated with each other, we speculated that the selected surface proteins could share a similar transcription pattern. When choosing specific types of surface proteins as drug targets, the off-targets side effects may be prevented by controlling the activation of engineered T cells using integrated multi-input signals [3,73]. Bispecific CAR-T cells targeting PD-L1 and MUC16 have an enhanced killing effect on ovarian cancer cells and significantly prolong the survival time of tumor-bearing mice [74]. CAR-T cells with CEA and MSLN as dual targets can accurately locate the tumor site and have higher toxicity to pancreatic malignancy [75]. Consistently, we found the surface proteins that can be used to design bispecific CAR-T cells or ADCs targeting common solid tumors through big data analysis.
In spite of the limited data in the protein database, we still validated the protein expression levels of some of the selected genes. These results make it more convincing that the identified tumor surface protein genes may be potential targets for CAR-T cell therapies and ADCs. Further integration of proteomic information may boost the discovery of TSAs because the post-modification of proteins such as glycosylation, and lipidation, have also been identified as a source of tumor surface antigens by liquid chromatography–mass spectrometry [76,77].

5. Conclusions

In sum, our study revealed some potential tumor-specific surface proteins for the rational design of TSA-based immunotherapies. These findings might pave the way for a comprehensive and efficient approach to construct novel CAR-T cells and ADCs in pre-clinical animal studies and clinical practice by utilizing tumor-specific surface proteins as multi-target binding sites.

Supplementary Materials

The following supporting information can be downloaded at: https://www.mdpi.com/article/10.3390/cancers14225674/s1, Figure S1: Analysis of the differential expression of membrane protein-coding genes; Figure S2: Pearson correlation analysis of the significantly high-expression and high-risk membrane protein-coding genes in some tumor tissues in TCGA; Figure S3: Cumulative distribution of the expression of 371 candidate membrane proteins. The red dashed line was determined to separate the differential expression patterns of these genes; Table S1: The information on the results of HR, FC, Correlation and Prognosis of individual or paired genes; Table S2: Patients’ risk scores calculated for gene pairs based on the risk score system.

Author Contributions

X.L., J.Z. and W.Z. conducted major analytical work. W.Y. and L.Z. provided meaningful methodological suggestions. H.L. and L.L. provided ideas and designed experiments. W.-W.C. and J.W. made critical edits in the manuscript. All authors have read and agreed to the published version of the manuscript.

Funding

The research was supported by the National Key R&D Program of China (2019YFA0906100 and 2020YFA0804100) and the National Natural Science Foundation of China (32170919 and 92042305). Shenzhen Institute of Synthetic Biology Scientific Research Program (JCHZ20210003). Shenzhen Science and Technology Program (KQTD20210811090115019).

Institutional Review Board Statement

Not applicable.

Informed Consent Statement

Not applicable.

Data Availability Statement

The data sets analyzed during the current study are available from the UCSC Xena website: https://xenabrowser.net/ (accessed on 1 September 2020), Membranome database: https://membran-ome.org/ (accessed on 1 September 2020) and Uniprot database: https://www.uniprot.org/ (accessed on 1 September 2020). Human immune cell biomarkers can be obtained from the CellMarker database: http://biocc.hrbmu. edu.cn/CellMarker/ (accessed on 1 September 2020) and human normal tissues expression data can be collected from the GTEx database: http://gtexportal.org/ (accessed on 1 September 2020).

Acknowledgments

We thank Qiyuan Li for his assistance and bioinformatics support in this research.

Conflicts of Interest

The authors declare no competing interest.

References

  1. Tomeh, M.A.; Hadianamrei, R.; Zhao, X. A Review of Curcumin and Its Derivatives as Anticancer Agents. Int. J. Mol. Sci. 2019, 20, 1033. [Google Scholar] [CrossRef] [PubMed] [Green Version]
  2. Dunn, G.P.; Old, L.J.; Schreiber, R.D. The three Es of cancer immunoediting. Annu. Rev. Immunol. 2004, 22, 329–360. [Google Scholar] [CrossRef] [PubMed]
  3. Li, H.; van der Leun, A.M.; Yofe, I.; Lubling, Y.; Gelbard-Solodkin, D.; van Akkooi, A.C.J.; van den Braber, M.; Rozeman, E.A.; Haanen, J.; Blank, C.U.; et al. Dysfunctional CD8 T Cells Form a Proliferative, Dynamically Regulated Compartment within Human Melanoma. Cell 2019, 176, 775–789.e18. [Google Scholar] [CrossRef]
  4. Feng, M.; Jiang, W.; Kim, B.Y.S.; Zhang, C.C.; Fu, Y.X.; Weissman, I.L. Phagocytosis checkpoints as new targets for cancer immunotherapy. Nat. Rev. Cancer 2019, 19, 568–586. [Google Scholar] [CrossRef] [PubMed]
  5. Chao, M.P.; Weissman, I.L.; Majeti, R. The CD47-SIRPα pathway in cancer immune evasion and potential therapeutic implications. Curr. Opin. Immunol. 2012, 24, 225–232. [Google Scholar] [CrossRef] [Green Version]
  6. Urabe, F.; Kosaka, N.; Ito, K.; Kimura, T.; Egawa, S.; Ochiya, T. Extracellular vesicles as biomarkers and therapeutic targets for cancer. Am. J. Physiol. Cell Physiol. 2020, 318, C29–C39. [Google Scholar] [CrossRef]
  7. Li, H.; Ye, C.; Ji, G.; Han, J. Determinants of public T cell responses. Cell Res. 2012, 22, 33–42. [Google Scholar] [CrossRef]
  8. Paijens, S.T.; Vledder, A.; de Bruyn, M.; Nijman, H.W. Tumor-infiltrating lymphocytes in the immunotherapy era. Cell. Mol. Immunol. 2021, 18, 842–859. [Google Scholar] [CrossRef]
  9. Thomas, A.; Teicher, B.A.; Hassan, R. Antibody-drug conjugates for cancer therapy. Lancet Oncol. 2016, 17, e254–e262. [Google Scholar] [CrossRef]
  10. Nguyen, A.; Johanning, G.; Shi, Y. Emerging Novel Combined CAR-T Cell Therapies. Cancers 2022, 14, 1403. [Google Scholar] [CrossRef]
  11. Ellis, G.I.; Sheppard, N.C.; Riley, J.L. Genetic engineering of T cells for immunotherapy. Nat. Rev. Genet. 2021, 22, 427–447. [Google Scholar] [CrossRef]
  12. Turtle, C.J.; Hanafi, L.A.; Berger, C.; Gooley, T.A.; Cherian, S.; Hudecek, M.; Sommermeyer, D.; Melville, K.; Pender, B.; Budiarto, T.M.; et al. CD19 CAR-T cells of defined CD4+:CD8+ composition in adult B cell ALL patients. J. Clin. Investig. 2016, 126, 2123–2138. [Google Scholar] [CrossRef] [PubMed] [Green Version]
  13. Zhang, W.Y.; Wang, Y.; Guo, Y.L.; Dai, H.R.; Yang, Q.M.; Zhang, Y.J.; Zhang, Y.; Chen, M.X.; Wang, C.M.; Feng, K.C.; et al. Treatment of CD20-directed Chimeric Antigen Receptor-modified T cells in patients with relapsed or refractory B-cell non-Hodgkin lymphoma: An early phase IIa trial report. Signal Transduct. Target. Ther. 2016, 1, 16002. [Google Scholar] [CrossRef] [PubMed] [Green Version]
  14. Xu, J.; Wang, Q.; Xu, H.; Gu, C.; Jiang, L.; Wang, J.; Wang, D.; Xu, B.; Mao, X.; Wang, J.; et al. Anti-BCMA CAR-T cells for treatment of plasma cell dyscrasia: Case report on POEMS syndrome and multiple myeloma. J. Hematol. Oncol. 2018, 11, 128. [Google Scholar] [CrossRef] [Green Version]
  15. Wilkie, S.; van Schalkwyk, M.C.; Hobbs, S.; Davies, D.M.; van der Stegen, S.J.; Pereira, A.C.; Burbridge, S.E.; Box, C.; Eccles, S.A.; Maher, J. Dual targeting of ErbB2 and MUC1 in breast cancer using chimeric antigen receptors engineered to provide complementary signaling. J. Clin. Immunol. 2012, 32, 1059–1070. [Google Scholar] [CrossRef] [PubMed]
  16. Mount, C.W.; Majzner, R.G.; Sundaresh, S.; Arnold, E.P.; Kadapakkam, M.; Haile, S.; Labanieh, L.; Hulleman, E.; Woo, P.J.; Rietberg, S.P.; et al. Potent antitumor efficacy of anti-GD2 CAR T cells in H3-K27M(+) diffuse midline gliomas. Nat. Med. 2018, 24, 572–579. [Google Scholar] [CrossRef] [PubMed]
  17. Harrer, D.C.; Dörrie, J.; Schaft, N. CSPG4 as Target for CAR-T-Cell Therapy of Various Tumor Entities-Merits and Challenges. Int. J. Mol. Sci. 2019, 20, 5942. [Google Scholar] [CrossRef] [PubMed] [Green Version]
  18. Morgan, R.A.; Yang, J.C.; Kitano, M.; Dudley, M.E.; Laurencot, C.M.; Rosenberg, S.A. Case report of a serious adverse event following the administration of T cells transduced with a chimeric antigen receptor recognizing ERBB2. Mol. Ther. J. Am. Soc. Gene Ther. 2010, 18, 843–851. [Google Scholar] [CrossRef]
  19. Feng, K.; Guo, Y.; Dai, H.; Wang, Y.; Li, X.; Jia, H.; Han, W. Chimeric antigen receptor-modified T cells for the immunotherapy of patients with EGFR-expressing advanced relapsed/refractory non-small cell lung cancer. Sci. China Life Sci. 2016, 59, 468–479. [Google Scholar] [CrossRef] [Green Version]
  20. Lo, A.; Wang, L.S.; Scholler, J.; Monslow, J.; Avery, D.; Newick, K.; O’Brien, S.; Evans, R.A.; Bajor, D.J.; Clendenin, C.; et al. Tumor-Promoting Desmoplasia Is Disrupted by Depleting FAP-Expressing Stromal Cells. Cancer Res. 2015, 75, 2800–2810. [Google Scholar] [CrossRef]
  21. Schubert, M.L.; Schmitt, M.; Wang, L.; Ramos, C.A.; Jordan, K.; Müller-Tidow, C.; Dreger, P. Side-effect management of chimeric antigen receptor (CAR) T-cell therapy. Ann. Oncol. Off. J. Eur. Soc. Med. Oncol. 2021, 32, 34–48. [Google Scholar] [CrossRef] [PubMed]
  22. Wang, H.; Kaur, G.; Sankin, A.I.; Chen, F.; Guan, F.; Zang, X. Immune checkpoint blockade and CAR-T cell therapy in hematologic malignancies. J. Hematol. Oncol. 2019, 12, 59. [Google Scholar] [CrossRef]
  23. Boyiadzis, M.M.; Dhodapkar, M.V.; Brentjens, R.J.; Kochenderfer, J.N.; Neelapu, S.S.; Maus, M.V.; Porter, D.L.; Maloney, D.G.; Grupp, S.A.; Mackall, C.L.; et al. Chimeric antigen receptor (CAR) T therapies for the treatment of hematologic malignancies: Clinical perspective and significance. J. Immunother. Cancer 2018, 6, 137. [Google Scholar] [CrossRef] [PubMed] [Green Version]
  24. Miliotou, A.N.; Papadopoulou, L.C. CAR T-cell Therapy: A New Era in Cancer Immunotherapy. Curr. Pharm. Biotechnol. 2018, 19, 5–18. [Google Scholar] [CrossRef] [PubMed]
  25. Beck, A.; Goetsch, L.; Dumontet, C.; Corvaïa, N. Strategies and challenges for the next generation of antibody-drug conjugates. Nat. Rev. Drug Discov. 2017, 16, 315–337. [Google Scholar] [CrossRef]
  26. Autio, K.A.; Boni, V.; Humphrey, R.W.; Naing, A. Probody Therapeutics: An Emerging Class of Therapies Designed to Enhance On-Target Effects with Reduced Off-Tumor Toxicity for Use in Immuno-Oncology. Clin. Cancer Res. 2020, 26, 984–989. [Google Scholar] [CrossRef] [Green Version]
  27. Lomize, A.L.; Lomize, M.A.; Krolicki, S.R.; Pogozheva, I.D. Membranome: A database for proteome-wide analysis of single-pass membrane proteins. Nucleic Acids Res. 2017, 45, D250–D255. [Google Scholar] [CrossRef] [Green Version]
  28. Lomize, A.L.; Hage, J.M.; Pogozheva, I.D. Membranome 2.0: Database for proteome-wide profiling of bitopic proteins and their dimers. Bioinformatics 2018, 34, 1061–1062. [Google Scholar] [CrossRef] [Green Version]
  29. UniProt: The universal protein knowledgebase in 2021. Nucleic Acids Res. 2021, 49, D480–D489. [CrossRef]
  30. Zhang, X.; Lan, Y.; Xu, J.; Quan, F.; Zhao, E.; Deng, C.; Luo, T.; Xu, L.; Liao, G.; Yan, M.; et al. CellMarker: A manually curated resource of cell markers in human and mouse. Nucleic Acids Res. 2019, 47, D721–D728. [Google Scholar] [CrossRef]
  31. GTEx Consortium. Human genomics. The Genotype-Tissue Expression (GTEx) pilot analysis: Multitissue gene regulation in humans. Science 2015, 348, 648–660. [Google Scholar] [CrossRef] [PubMed] [Green Version]
  32. Hanahan, D.; Weinberg, R.A. Hallmarks of cancer: The next generation. Cell 2011, 144, 646–674. [Google Scholar] [CrossRef] [PubMed] [Green Version]
  33. Shakur, A.H.; Huang, S.; Qian, X.; Chang, X. SURVFIT: Doubly sparse rule learning for survival data. J. Biomed. Inform. 2021, 117, 103691. [Google Scholar] [CrossRef] [PubMed]
  34. Huang, R.; Li, Z.; Zhu, X.; Yan, P.; Song, D.; Yin, H.; Hu, P.; Lin, R.; Wu, S.; Meng, T.; et al. Collagen Type III Alpha 1 chain regulated by GATA-Binding Protein 6 affects Type II IFN response and propanoate metabolism in the recurrence of lower grade glioma. J. Cell. Mol. Med. 2020, 24, 10803–10815. [Google Scholar] [CrossRef]
  35. Ouyang, Z.; Li, G.; Zhu, H.; Wang, J.; Qi, T.; Qu, Q.; Tu, C.; Qu, J.; Lu, Q. Construction of a Five-Super-Enhancer-Associated-Genes Prognostic Model for Osteosarcoma Patients. Front. Cell Dev. Biol. 2020, 8, 598660. [Google Scholar] [CrossRef]
  36. Li, J.; Xiang, L.; Wang, Q.; Ma, X.; Chen, X.; Zhu, Y.; Yang, Y.; Huang, L.; He, H.; Xu, L.; et al. Highly Potent Immunotoxins Targeting the Membrane-distal N-lobe of GPC3 for Immunotherapy of Hepatocellular Carcinoma. J. Cancer 2022, 13, 1370–1384. [Google Scholar] [CrossRef]
  37. Reinhard, K.; Rengstl, B.; Oehm, P.; Michel, K.; Billmeier, A.; Hayduk, N.; Klein, O.; Kuna, K.; Ouchan, Y.; Wöll, S.; et al. An RNA vaccine drives expansion and efficacy of claudin-CAR-T cells against solid tumors. Science 2020, 367, 446–453. [Google Scholar] [CrossRef]
  38. Tang, X.; Liu, F.; Liu, Z.; Cao, Y.; Zhang, Z.; Wang, Y.; Huang, J.; Fan, S.; Zhao, S.; Chen, Y.; et al. Bioactivity and safety of B7-H3-targeted chimeric antigen receptor T cells against anaplastic meningioma. Clin. Transl. Immunol. 2020, 9, e1137. [Google Scholar] [CrossRef]
  39. Lamers, C.H.; Sleijfer, S.; van Steenbergen, S.; van Elzakker, P.; van Krimpen, B.; Groot, C.; Vulto, A.; den Bakker, M.; Oosterwijk, E.; Debets, R.; et al. Treatment of metastatic renal cell carcinoma with CAIX CAR-engineered T cells: Clinical evaluation and management of on-target toxicity. Mol. Ther. J. Am. Soc. Gene Ther. 2013, 21, 904–912. [Google Scholar] [CrossRef]
  40. Wu, X.; Luo, H.; Shi, B.; Di, S.; Sun, R.; Su, J.; Liu, Y.; Li, H.; Jiang, H.; Li, Z. Combined Antitumor Effects of Sorafenib and GPC3-CAR T Cells in Mouse Models of Hepatocellular Carcinoma. Mol. Ther. J. Am. Soc. Gene Ther. 2019, 27, 1483–1494. [Google Scholar] [CrossRef]
  41. Shi, D.; Shi, Y.; Kaseb, A.O.; Qi, X.; Zhang, Y.; Chi, J.; Lu, Q.; Gao, H.; Jiang, H.; Wang, H.; et al. Chimeric Antigen Receptor-Glypican-3 T-Cell Therapy for Advanced Hepatocellular Carcinoma: Results of Phase I Trials. Clin. Cancer Res. Off. J. Am. Assoc. Cancer Res. 2020, 26, 3979–3989. [Google Scholar] [CrossRef] [PubMed]
  42. Shiina, S.; Ohno, M.; Ohka, F.; Kuramitsu, S.; Yamamichi, A.; Kato, A.; Motomura, K.; Tanahashi, K.; Yamamoto, T.; Watanabe, R.; et al. CAR T Cells Targeting Podoplanin Reduce Orthotopic Glioblastomas in Mouse Brains. Cancer Immunol. Res. 2016, 4, 259–268. [Google Scholar] [CrossRef] [PubMed] [Green Version]
  43. Li, X.; Berahovich, R.; Zhou, H.; Liu, X.; Li, F.; Xu, S.; Wei, Y.; Ouaret, D.; Bodmer, W.; Wu, L.; et al. PLAP -CAR T cells mediate high specific cytotoxicity against colon cancer cells. Front. Biosci. 2020, 25, 1765–1786. [Google Scholar] [CrossRef]
  44. Byrd, T.T.; Fousek, K.; Pignata, A.; Szot, C.; Samaha, H.; Seaman, S.; Dobrolecki, L.; Salsman, V.S.; Oo, H.Z.; Bielamowicz, K.; et al. TEM8/ANTXR1-Specific CAR T Cells as a Targeted Therapy for Triple-Negative Breast Cancer. Cancer Res. 2018, 78, 489–500. [Google Scholar] [CrossRef] [PubMed] [Green Version]
  45. Jiang, H.; Shi, Z.; Wang, P.; Wang, C.; Yang, L.; Du, G.; Zhang, H.; Shi, B.; Jia, J.; Li, Q.; et al. Claudin18.2-Specific Chimeric Antigen Receptor Engineered T Cells for the Treatment of Gastric Cancer. J. Natl. Cancer Inst. 2019, 111, 409–418. [Google Scholar] [CrossRef] [PubMed]
  46. Goff, S.L.; Morgan, R.A.; Yang, J.C.; Sherry, R.M.; Robbins, P.F.; Restifo, N.P.; Feldman, S.A.; Lu, Y.C.; Lu, L.; Zheng, Z.; et al. Pilot Trial of Adoptive Transfer of Chimeric Antigen Receptor-transduced T Cells Targeting EGFRvIII in Patients With Glioblastoma. J. Immunother. 2019, 42, 126–135. [Google Scholar] [CrossRef]
  47. Liu, Y.; Guo, Y.; Wu, Z.; Feng, K.; Tong, C.; Wang, Y.; Dai, H.; Shi, F.; Yang, Q.; Han, W. Anti-EGFR chimeric antigen receptor-modified T cells in metastatic pancreatic carcinoma: A phase I clinical trial. Cytotherapy 2020, 22, 573–580. [Google Scholar] [CrossRef]
  48. Ahmed, N.; Brawley, V.; Hegde, M.; Bielamowicz, K.; Kalra, M.; Landi, D.; Robertson, C.; Gray, T.L.; Diouf, O.; Wakefield, A.; et al. HER2-Specific Chimeric Antigen Receptor-Modified Virus-Specific T Cells for Progressive Glioblastoma: A Phase 1 Dose-Escalation Trial. JAMA Oncol. 2017, 3, 1094–1101. [Google Scholar] [CrossRef]
  49. Kloss, C.C.; Lee, J.; Zhang, A.; Chen, F.; Melenhorst, J.J.; Lacey, S.F.; Maus, M.V.; Fraietta, J.A.; Zhao, Y.; June, C.H. Dominant-Negative TGF-β Receptor Enhances PSMA-Targeted Human CAR T Cell Proliferation And Augments Prostate Cancer Eradication. Mol. Ther. J. Am. Soc. Gene Ther. 2018, 26, 1855–1866. [Google Scholar] [CrossRef] [Green Version]
  50. Magee, M.S.; Kraft, C.L.; Abraham, T.S.; Baybutt, T.R.; Marszalowicz, G.P.; Li, P.; Waldman, S.A.; Snook, A.E. GUCY2C-directed CAR-T cells oppose colorectal cancer metastases without autoimmunity. Oncoimmunology 2016, 5, e1227897. [Google Scholar] [CrossRef]
  51. Sharma, P.; Debinski, W. Receptor-Targeted Glial Brain Tumor Therapies. Int. J. Mol. Sci. 2018, 19, 3326. [Google Scholar] [CrossRef] [PubMed] [Green Version]
  52. Kaneko, M.K.; Ohishi, T.; Kawada, M.; Kato, Y. A cancer-specific anti-podocalyxin monoclonal antibody (60-mG(2a)-f) exerts antitumor effects in mouse xenograft models of pancreatic carcinoma. Biochem. Biophys. Rep. 2020, 24, 100826. [Google Scholar] [CrossRef] [PubMed]
  53. Priceman, S.J.; Gerdts, E.A.; Tilakawardane, D.; Kennewick, K.T.; Murad, J.P.; Park, A.K.; Jeang, B.; Yamaguchi, Y.; Yang, X.; Urak, R.; et al. Co-stimulatory signaling determines tumor antigen sensitivity and persistence of CAR T cells targeting PSCA+ metastatic prostate cancer. Oncoimmunology 2018, 7, e1380764. [Google Scholar] [CrossRef]
  54. Jie, Y.; Liu, G.; Feng, L.; Li, Y.; E, M.; Wu, L.; Li, Y.; Rong, G.; Li, Y.; Wei, H.; et al. PTK7-Targeting CAR T-Cells for the Treatment of Lung Cancer and Other Malignancies. Front. Immunol. 2021, 12, 665970. [Google Scholar] [CrossRef] [PubMed]
  55. Ao, X.; Yang, Y.; Li, W.; Tan, Y.; Guo, W.; Ao, L.; He, X.; Wu, X.; Xia, J.; Xu, X.; et al. Anti-αFR CAR-engineered NK-92 Cells Display Potent Cytotoxicity Against αFR-positive Ovarian Cancer. J. Immunother. 2019, 42, 284–296. [Google Scholar] [CrossRef] [PubMed]
  56. Lv, J.; Zhao, R.; Wu, D.; Zheng, D.; Wu, Z.; Shi, J.; Wei, X.; Wu, Q.; Long, Y.; Lin, S.; et al. Mesothelin is a target of chimeric antigen receptor T cells for treating gastric cancer. J. Hematol. Oncol. 2019, 12, 18. [Google Scholar] [CrossRef] [PubMed] [Green Version]
  57. Beatty, G.L.; O’Hara, M.H.; Lacey, S.F.; Torigian, D.A.; Nazimuddin, F.; Chen, F.; Kulikovskaya, I.M.; Soulen, M.C.; McGarvey, M.; Nelson, A.M.; et al. Activity of Mesothelin-Specific Chimeric Antigen Receptor T Cells Against Pancreatic Carcinoma Metastases in a Phase 1 Trial. Gastroenterology 2018, 155, 29–32. [Google Scholar] [CrossRef]
  58. Rajabzadeh, A.; Rahbarizadeh, F.; Ahmadvand, D.; Kabir Salmani, M.; Hamidieh, A.A. A VHH-Based Anti-MUC1 Chimeric Antigen Receptor for Specific Retargeting of Human Primary T Cells to MUC1-Positive Cancer Cells. Cell J. 2021, 22, 502–513. [Google Scholar] [CrossRef]
  59. Zhou, J.; Li, X.; Zhang, M.; Gong, J.; Li, Q.; Shan, B.; Wang, T.; Zhang, L.; Zheng, T.; Li, X. The aberrant expression of rhythm genes affects the genome instability and regulates the cancer immunity in pan-cancer. Cancer Med. 2020, 9, 1818–1829. [Google Scholar] [CrossRef]
  60. Schettini, F.; Barbao, P.; Brasó-Maristany, F.; Galván, P.; Martínez, D.; Paré, L.; De Placido, S.; Prat, A.; Guedan, S. Identification of cell surface targets for CAR-T cell therapies and antibody-drug conjugates in breast cancer. ESMO Open 2021, 6, 100102. [Google Scholar] [CrossRef]
  61. Fraietta, J.A.; Lacey, S.F.; Orlando, E.J.; Pruteanu-Malinici, I.; Gohil, M.; Lundh, S.; Boesteanu, A.C.; Wang, Y.; O’Connor, R.S.; Hwang, W.T.; et al. Determinants of response and resistance to CD19 chimeric antigen receptor (CAR) T cell therapy of chronic lymphocytic leukemia. Nat. Med. 2018, 24, 563–571. [Google Scholar] [CrossRef]
  62. Vairy, S.; Garcia, J.L.; Teira, P.; Bittencourt, H. CTL019 (tisagenlecleucel): CAR-T therapy for relapsed and refractory B-cell acute lymphoblastic leukemia. Drug Des. Dev. Ther. 2018, 12, 3885–3898. [Google Scholar] [CrossRef] [PubMed] [Green Version]
  63. Schäfer, D.; Tomiuk, S.; Küster, L.N.; Rawashdeh, W.A.; Henze, J.; Tischler-Höhle, G.; Agorku, D.J.; Brauner, J.; Linnartz, C.; Lock, D.; et al. Identification of CD318, TSPAN8 and CD66c as target candidates for CAR T cell based immunotherapy of pancreatic adenocarcinoma. Nat. Commun. 2021, 12, 1453. [Google Scholar] [CrossRef] [PubMed]
  64. Schreiner, P.; Velasquez, M.P.; Gottschalk, S.; Zhang, J.; Fan, Y. Unifying heterogeneous expression data to predict targets for CAR-T cell therapy. Oncoimmunology 2021, 10, 2000109. [Google Scholar] [CrossRef] [PubMed]
  65. Theruvath, J.; Sotillo, E.; Mount, C.W.; Graef, C.M.; Delaidelli, A.; Heitzeneder, S.; Labanieh, L.; Dhingra, S.; Leruste, A.; Majzner, R.G.; et al. Locoregionally administered B7-H3-targeted CAR T cells for treatment of atypical teratoid/rhabdoid tumors. Nat. Med. 2020, 26, 712–719. [Google Scholar] [CrossRef] [PubMed]
  66. Zhang, G.; Dong, Q.; Xu, Y.; Yu, G.; Zhang, X. B7-H3: Another molecule marker for Mo-DCs? Cell. Mol. Immunol. 2005, 2, 307–311. [Google Scholar]
  67. Nair, K.S.; Zingde, S.M. Adhesion of neutrophils to fibronectin: Role of the cd66 antigens. Cell. Immunol. 2001, 208, 96–106. [Google Scholar] [CrossRef] [PubMed]
  68. Jin, L.; Ge, H.; Long, Y.; Yang, C.; Chang, Y.E.; Mu, L.; Sayour, E.J.; De Leon, G.; Wang, Q.J.; Yang, J.C.; et al. CD70, a novel target of CAR T-cell therapy for gliomas. Neuro-Oncology 2018, 20, 55–65. [Google Scholar] [CrossRef] [Green Version]
  69. Lantto, R.; Nasi, A.; Sammicheli, S.; Amu, S.; Fievez, V.; Moutschen, M.; Pensieroso, S.; Hejdeman, B.; Chiodi, F.; Rethi, B. Increased extrafollicular expression of the B-cell stimulatory molecule CD70 in HIV-1-infected individuals. AIDS 2015, 29, 1757–1766. [Google Scholar] [CrossRef] [Green Version]
  70. Yuan, C.; Chang, K.; Xu, C.; Li, Q.; Du, Z. High expression of DLL3 is associated with a poor prognosis and immune infiltration in invasive breast cancer patients. Transl. Oncol. 2021, 14, 101080. [Google Scholar] [CrossRef]
  71. Ding, Z.C.; Habtetsion, T.; Cao, Y.; Li, T.; Liu, C.; Kuczma, M.; Chen, T.; Hao, Z.; Bryan, L.; Munn, D.H.; et al. Adjuvant IL-7 potentiates adoptive T cell therapy by amplifying and sustaining polyfunctional antitumor CD4+ T cells. Sci. Rep. 2017, 7, 12168. [Google Scholar] [CrossRef] [PubMed]
  72. Zhang, X.; Cheng, C.; Sun, W.; Wang, H. Engineering T Cells Using CRISPR/Cas9 for Cancer Therapy. Methods Mol. Biol. 2020, 2115, 419–433. [Google Scholar] [CrossRef] [PubMed]
  73. Sau, S.; Alsaab, H.O.; Bhise, K.; Alzhrani, R.; Nabil, G.; Iyer, A.K. Multifunctional nanoparticles for cancer immunotherapy: A groundbreaking approach for reprogramming malfunctioned tumor environment. J. Control. Release Off. J. Control. Release Soc. 2018, 274, 24–34. [Google Scholar] [CrossRef] [PubMed]
  74. Li, T.; Wang, J. Therapeutic effect of dual CAR-T targeting PDL1 and MUC16 antigens on ovarian cancer cells in mice. BMC Cancer 2020, 20, 678. [Google Scholar] [CrossRef] [PubMed]
  75. Zhang, E.; Yang, P.; Gu, J.; Wu, H.; Chi, X.; Liu, C.; Wang, Y.; Xue, J.; Qi, W.; Sun, Q.; et al. Recombination of a dual-CAR-modified T lymphocyte to accurately eliminate pancreatic malignancy. J. Hematol. Oncol. 2018, 11, 102. [Google Scholar] [CrossRef] [Green Version]
  76. DeLucia, D.C.; Lee, J.K. Identification of Cell Surface Targets for CAR T Cell Immunotherapy. Methods Mol. Biol. 2020, 2097, 45–54. [Google Scholar] [CrossRef]
  77. Kuhlmann, L.; Cummins, E.; Samudio, I.; Kislinger, T. Cell-surface proteomics for the identification of novel therapeutic targets in cancer. Expert Rev. Proteom. 2018, 15, 259–275. [Google Scholar] [CrossRef]
Figure 1. A brief illustration of the core workflow. (A) The expression profiles of mRNA were obtained from the TCGA database. (B) Thresholds were set to screen the expression profile of membrane proteins (C) Visual analysis was used to evaluate the potential functions of the target genes.
Cancers 14 05674 g001
Figure 2. Tumor-specific high-expression and high-risk surface proteins in TCGA tumor tissues. (A) Heatmap plot displays the differential expression analysis of the tumor tissue-specific highly expressed membrane proteins. A FC > 2, and the adjusted p value less than 0.01 is considered statistically significant. (B) Membrane proteins displayed poor prognosis in cancer patients. A HR > 1, and the adjusted p value less than 0.01 was considered statistically significant. (C) Stacked bar blot showed the categories of 3919 membrane proteins: up-regulation (up), down-regulation (down), no change significance (not), and missing data (NaN). (D) The color block diagram shows the FC and HR of the target proteins, all colored squares are statistically significant.
Cancers 14 05674 g002
Figure 3. Enrichment analysis of significant high-expression and high-risk genes using the ten cancer hallmarks. The horizontal axis represents the logarithm of the p value, and the vertical axis represents the terms of the ten cancer hallmarks. p values less than 0.05 were considered statistically significant, indicated by the red color bar.
Cancers 14 05674 g003
Figure 4. Survival analysis of individual or paired specific high-expression and poor prognosis-associated membrane surface protein-coding genes in BRCA patients. (A). KM curves display the prognostic roles of the selected membrane protein-coding genes in cancer patients. (B). KM curves display the prognostic roles of the selected membrane protein-coding genes in cancer patients. The red lines indicate the high-expression group. The blue color lines indicate the low-expression group. High-expression and low-expression groups were divided by the mean value of the gene expression. p < 0.05 was considered significantly different.
Cancers 14 05674 g004
Figure 5. Correlation analysis of the membrane protein-coding genes in different tumor types. The bubble plot shows the Pearson correlation between the high-expression and high-risk membrane protein-coding genes for various cancers from Table 2. The red bubbles represent positive correlations. The blue bubbles represent negative correlations. * means p < 0.05, ** means p < 0.01, and *** means p < 0.001.
Cancers 14 05674 g005
Figure 6. Heatmap displays the expression levels of the low-expression genes in the 54 normal tissues from the GTEx database.
Cancers 14 05674 g006
Figure 7. Heatmap displays the expression levels of the highly expressed genes in some tissues of the 54 normal tissues from the GTEx database.
Cancers 14 05674 g007
Figure 8. Box plots showing the relative abundance of target membrane proteins in cancer and normal tissues in four tumor types. * means p < 0.05, and *** means p < 0.001.
Cancers 14 05674 g008
Table 1. The numbers of tumor and normal samples used in the study.
Cancer TypeAbbreviationTCGACPTAC
Tumor SampleNormal SampleTumor SampleNormal SamplePDC Study ID
Bladder urothelial carcinomaBLCA41119
Breast invasive carcinomaBRCA110411313318PDC000120
Colon adenocarcinomaCOAD4714195100PDC000116
CholangiocarcinomaCHOL369
Esophageal carcinomaESCA16211
Head and neck squamous cell carcinomaHNSC50244
Kidney chromophobeKICH6524
Kidney renal clear cell carcinomaKIRC5357211084PDC000127
Kidney renal papillary cell carcinomaKIRP28932
Liver hepatocellular carcinomaLIHC37450165165PDC000198
Lung adenocarcinomaLUAD52659113102PDC000153
Lung squamous cell carcinomaLUSC50149110104PDC000224
Prostate adenocarcinomaPRAD49952
Rectum adenocarcinomaREAD16710
Stomach adenocarcinomaSTAD37532
Thyroid carcinomaTHCA51058
Uterine corpus endometrial carcinomaUCEC5483510049PDC000125
Table 2. The surface proteins with high-expression and high-risk in various cancer types.
CancerHigh-Expressed and High-Risk Membrane Proteins in Pan-CancerTotal
BLCA CHRNA1, DRD5, HCN2, LRP8, RAC3, SLC1A6 6
BRCA FIBCD1, MAFA, PCDHA1, RGS9BP, SEZ6, ULBP2 6
CHOL RAET1E, RTBDN, TMEM17 3
COAD ASPHD1, CCDC78, CLDN6, DLL3, ELFN1, GABRD, GJA3, GNGT1, GPC2, KREMEN2, LIME1, LRRN4, MC1R, PANX2, PCP2, S1PR5, SLC16A8, SLC6A1, SYT8, TMEM213, TRPV4, UNC5A 22
ESCA OR2W6P 1
HNSCAMIGO2, DCBLD1, DSCAM, EMR1, FRMD5, MCEMP1, OLR1, OR11H7, OR5M11, RTN4R, TMEM9211
KICH ADAM2, CSPG5, GSDMC, KCNC1, LRRTM3, MELK, SIGLEC15, TMPRSS11D 8
KIRC ADAM11, ADAM12, ADAM8, ADD2, AGER, AQP9, ARHGEF39, ASGR1, ASIC3, ATP1A3, BEST1, BEST4, BTNL10, C20orf141, C9orf172, CABP7, CACNA2D4, CACNB1, CATSPER1, CCDC78, CD72, CDHR4, CDK5R2, CEACAM4, CELSR3, CLEC12B, CLEC2B, CLEC2D, CNIH2, CNTNAP1, CPNE7, CYTH4, DEF6, DLK2, DOK3, DRD4, EFNA3, EMR1, ENO2, FAP, FCGR1B, FCGR1C, FCRL2, FCRL5, FFAR3, FMNL1, FPR2,GABRE, GAD2, GGT2, GNG13, GPC2, GPR171, GPR19, GPR45, GPR84, GPR97, GPRIN1, GRIK4, GRIN2D, GRM2, GRM4, GSDMB, IGFLR1, IGLC6, IGLC7, IGLJ1, IL20RB, IL31RA, JPH3, KCNIP2, KCNN4, KIAA1324, KLRC4, KREMEN2, LAT, LAT2, LILRA6, LSMEM1, LTB4R, LTB4R2, LY6H, MARCO, MB21D1, MC1R, MCEMP1, MELK, MICALL2, MILR1, MMP17, MUC12, MUC3A, NPFFR1, NPY4R, NTM, NTNG2, OPN4, OR11H7, OR13A1, OR2B6, OSCAR, OTOF, PAQR6, PARVG, PCDHGC5, PDE6C, PIK3R6, PILRB, PLB1, PLEKHN1, PLXDC1, PLXNB3, PRAME, PRKCG, PRR7, PRRT2, PSD2, PSTPIP1, PTPRN, RASL10A, RELT, RLTPR, RTP5, SCNN1D, SIGLEC16, SLAMF8, SLAMF9, SLC16A8, SLCO5A1, SMIM23, SPHK1, STAC3, STX1B, TBC1D3B, TBC1D3F, TBC1D3L, TMPRSS6, TNFRSF25, TNFSF14, TPBGL, TRABD2A, TRBV28, TREML1, TRPM2, TRPM8, TTYH1, ZGRF1, ZP1 148
KIRP ADAM18, ADD2, ASIC3, CALN1, CDH17, CHRNA5, DLL3, GABRD, GJB4, GPA33, GPR19, GPRIN1, HTR1D, HTR3A, IL20RB, KIAA0319, KREMEN2, MELK, MFSD2B, OTOF, PTPRN, RTBDN, TMPRSS15, TNFSF9, ZP1 25
LIHC ABCC5, ADAM22, ANKRD13B, ANKRD27, ARHGEF39, ATP8A2, BAIAP2L2, BFSP1, CACNA1S, CD109, CDH10, CDK5R1, CHRNA5, CLCN2, CLEC2L, CNTNAP1, CSMD1, CSPG5, CT83, DAGLA, DDN, DUSP15, EFCAB7, EFNA3, EFNA4, EFNA5EGF, ENTPD2, EPHA6, FAM171A2, FIBCD1, FLVCR1, GABRA3, GDPD2, GJD4, GLDN, GLP1R, GNG4, GNGT1, GPR156, GPRC5D, GPRIN1, GPSM2, GRIN2D, GRM4, GSDMC, IGSF3, KCNE5, KCNQ3, KCTD7, KISS1R, KITLG, LRP12, LRP4, LRP8, LYSMD4, MAGEE1, MAPT, MELK, MEP1A, OR52E6, OR8A1, OR8G3P, OSBPL3, P2RY4, PDE6A, PIK3R6, PLXNA1, PLXNA3, PRR7, PRSS42, PTK7, PTPRN, PVRL1, RACGAP1, RAET1E, RNF144A, ROBO1, SAPCD2, SEMA4F, SHISA7, SLC16A3, SLC22A6, SLC26A2, SLC26A6, SLC30A8, SLC36A1, SLC38A6, SLC47A2, SLC7A1, SOCS7, SRGAP2, STX1A, STXBP5L, TBC1D30, TMEM206, TMEM213, TMEM65, TMEM67, TMEM81, TNFRSF11A, TREM2, TYRO3, XKR3, ZP3 105
LUAD ABCC2, ALPI, BAIAP2L2, C20orf141, CDH17, CDK5R1, CLDN14, DSG3, ENTPD2, FERMT1, GDPD2, GJA3, GJB2, GJB3, GJB4, GPR37, GPR78, GPR87, GPRIN1, GRIK2, HCN2, HTR1D, IL20RB, KCNV1, KIAA1549L, LGR4, LY6K, LYPD3, MELK, MFI2, OR10J6P, OR1F1, PLEK2, PTPRH, RAET1L, RHCG, RHOV, S100P, SAPCD2, SLCO1B3, STYK1, TMPRSS11E, TRPA1, UNC5D 44
PRADGPC2, KISS1R, NECAB2, PCDHA2, PCDHA9, SLC17A46
READATP6V0A41
STAD ADAM12, CLDN9, HTR1F, KIAA1549L, MCEMP1, NOX4, OR10A5, OR6A2, SLC22A16, TREML4 10
THCA DRD5, EFNA2, LHFPL5, MAST1, MCEMP1, NKD2, OR1F1, PCDHA2, PCDHA5, RTBDN, SLAMF9 11
UCEC ADAM18, ALPK2, ATP1A3, CABP7, CAMKV, CDH18, CDK5R2, CELSR3, CLDN6, CLDN9, DLL3, DSG1, GAL, GNG3, GPR110, GPR158, GPR19, GRIN2B, HEPHL1, HRH3, HTR3A, HTR3E, HTR6, KCNK9, KCNQ3, KCNS1, KIAA1549L, KLRG2, LIPH, MAFA, MAL, MAST1, MEP1A, MUC17, MUC3A, NKAIN1, NKAIN4, NTSR1, OTOG, P2RY2, PLA2G4F, PTPRN, RAC3, SHISA9, SLC12A3, SLC16A10, SLCO4C1 47
Table 3. Targets that have been reported for CAR-T therapy in solid tumors.
Protein NameCancer TypeReference
CLDN6Testicular, ovarian, uterine and lung adenocarcinoma[37]
CD276Anaplastic meningioma[38]
CA9Metastatic Renal Cell Carcinoma[39]
GPC3Hepatocellular Carcinoma[40,41]
PDPNGlioblastomas[42]
ALPPColorectal cancer[43]
ANTXR1Triple-negative breast cancer[44]
CLDN18Gastric cancer[45]
EGFRGlioblastoma, Pancreatic carcinoma[46,47]
HER2Glioblastoma[48]
FOLH1Prostate cancer[49]
GUCY2CColorectal cancer[50]
IL13RA2Glioblastoma[51]
PODXLPancreatic carcinoma[52]
PSCAProstate cancer[53]
PTK7Lung cancer[54]
FOLR1Ovarian Cancer[55]
MSLNGastric cancer, Pancreatic Carcinoma[56,57]
MUC1MUC1-positive cancer cells[58]
Publisher’s Note: MDPI stays neutral with regard to jurisdictional claims in published maps and institutional affiliations.

