
Combination of a Novel Fusion Protein CD3εζ28 and Bispecific T Cell Engager Enhances the Persistance and Anti-Cancer Effects of T Cells
 , and
, and 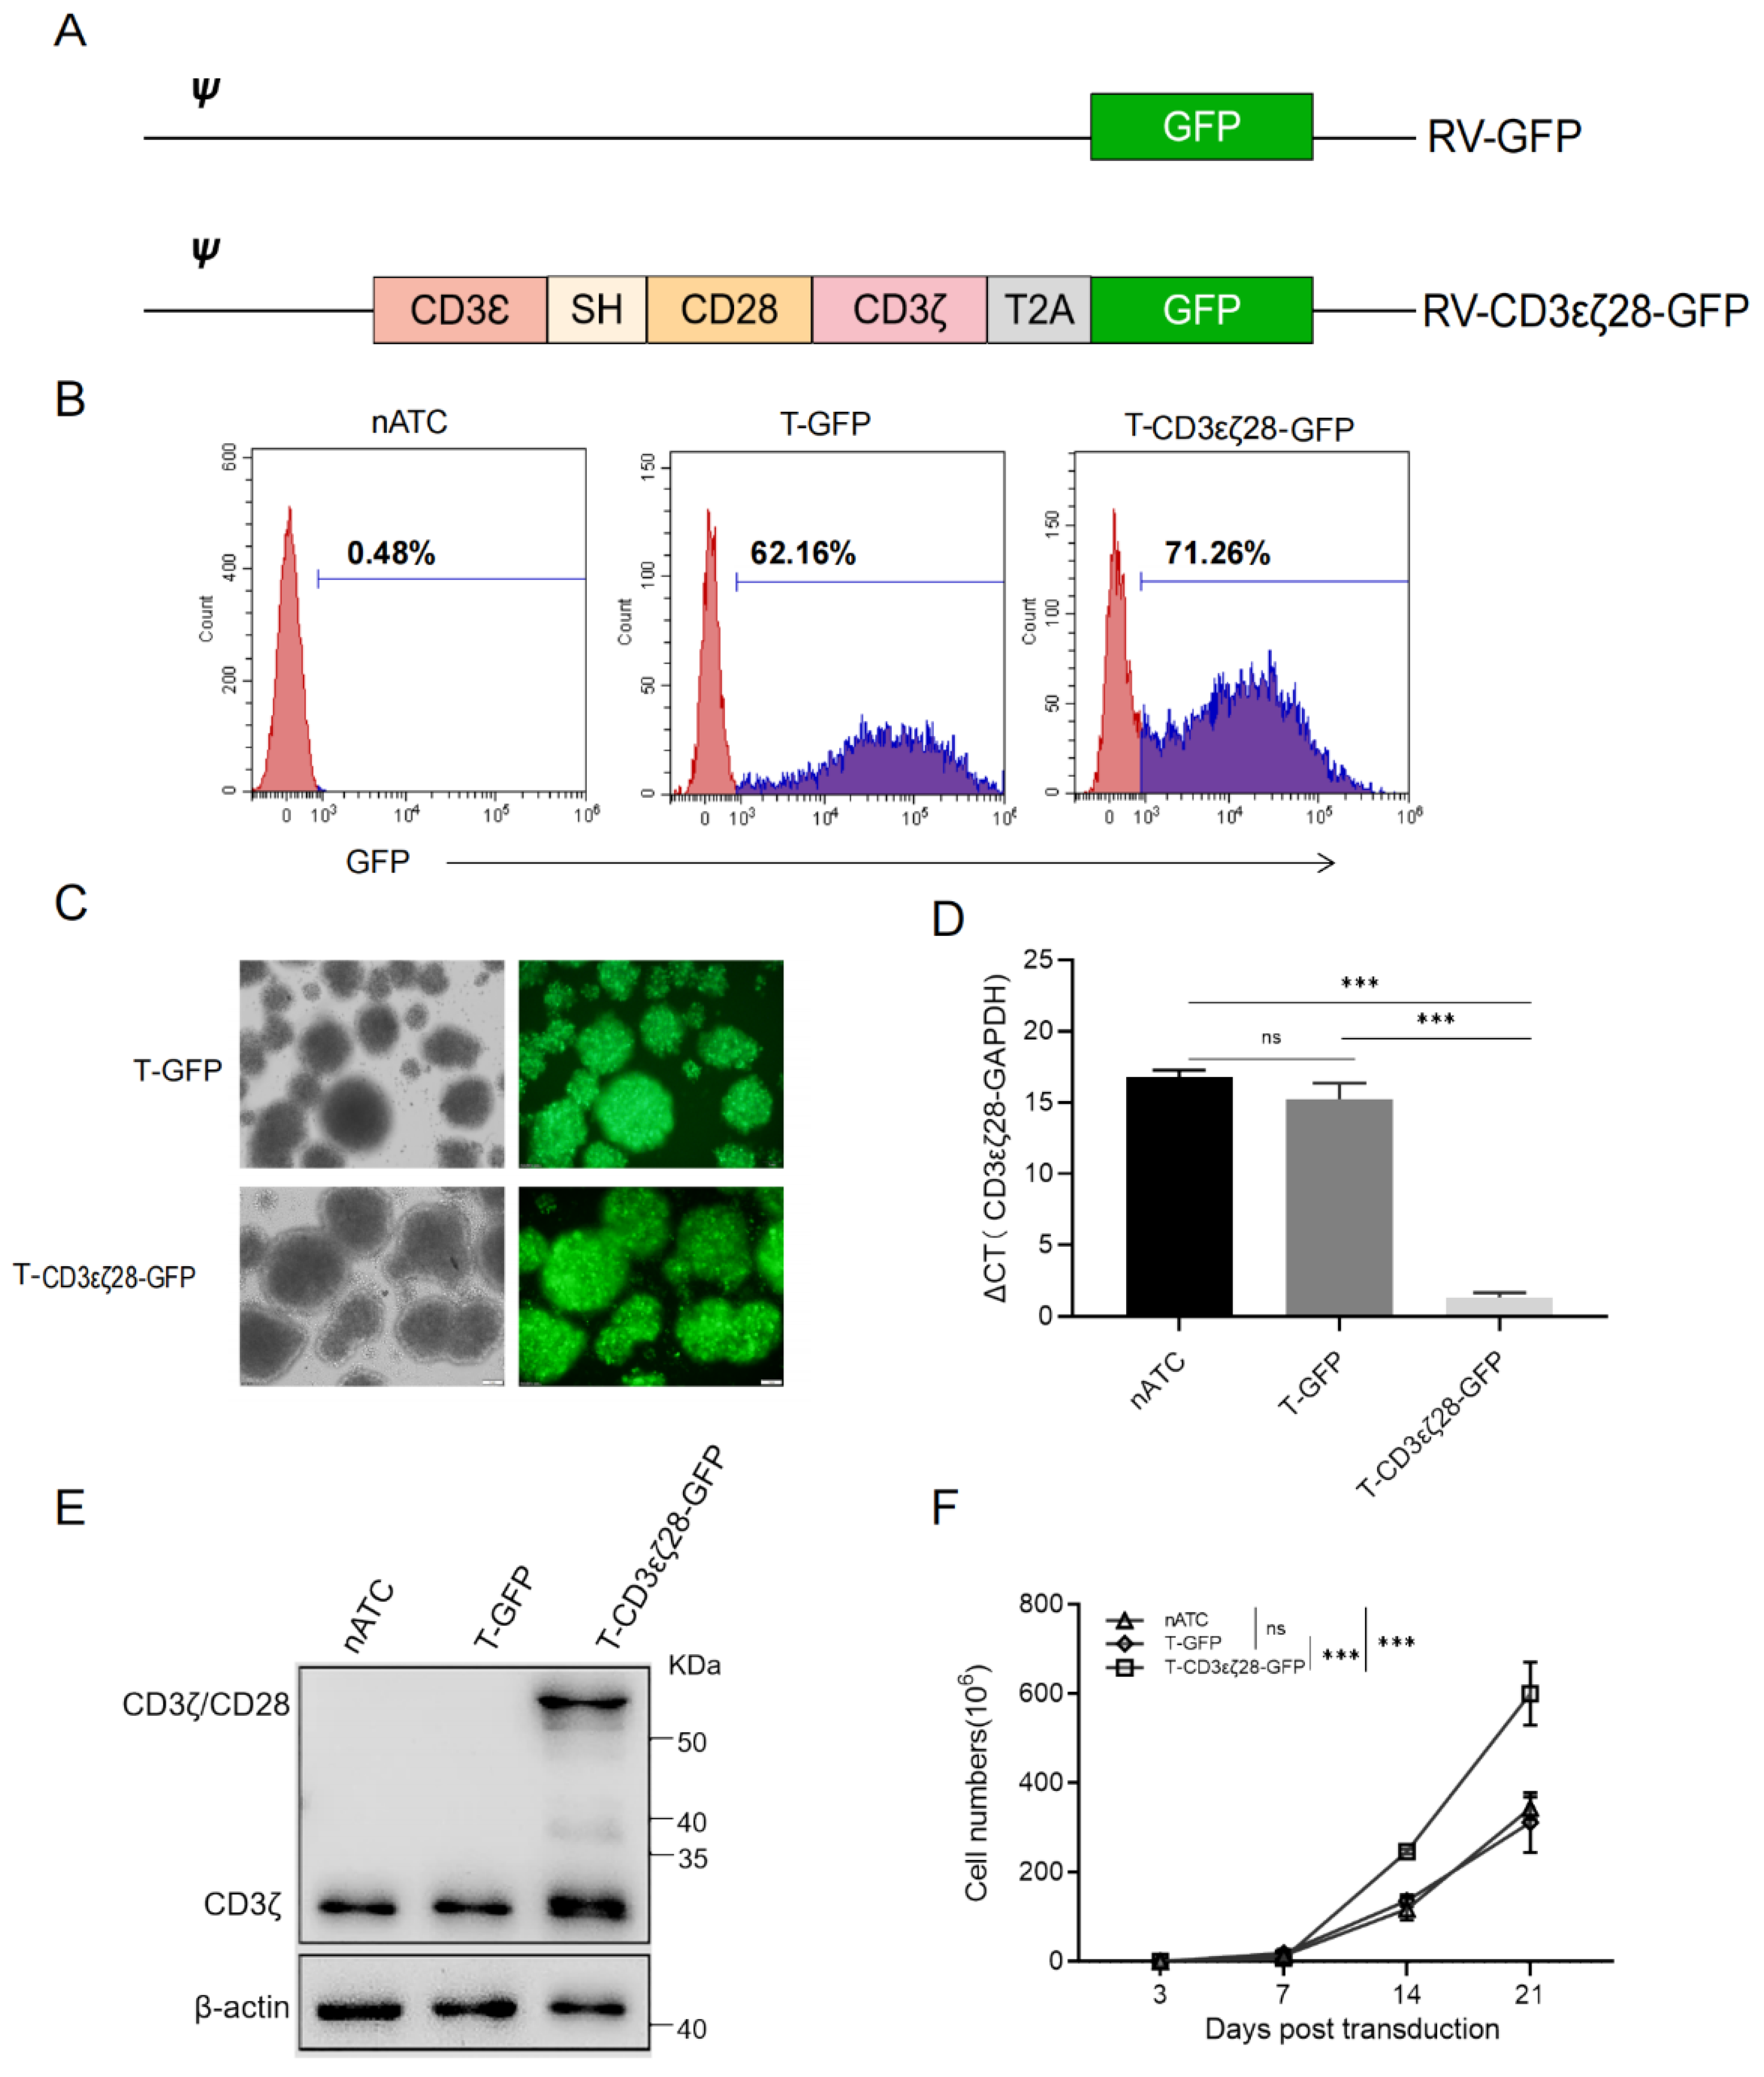
Abstract
:Simple Summary
Abstract
1. Introduction
2. Materials and Methods
2.1. Cell Lines
2.2. BiTE Generation
2.3. Construction of Retroviral Vectors
2.4. T Cell Stimulation
2.5. Generation of Modified T Cells
2.6. Flow Cytometry
2.7. Enzyme-Linked Immunosorbent Assay (ELISA)
2.8. Cytotoxicity Assay
2.9. Xenograft Model
2.10. Immunohistochemistry (IHC) Staining
2.11. Statistical Analysis
3. Results
3.1. Generation of T Cells Expressing CD3εζ28
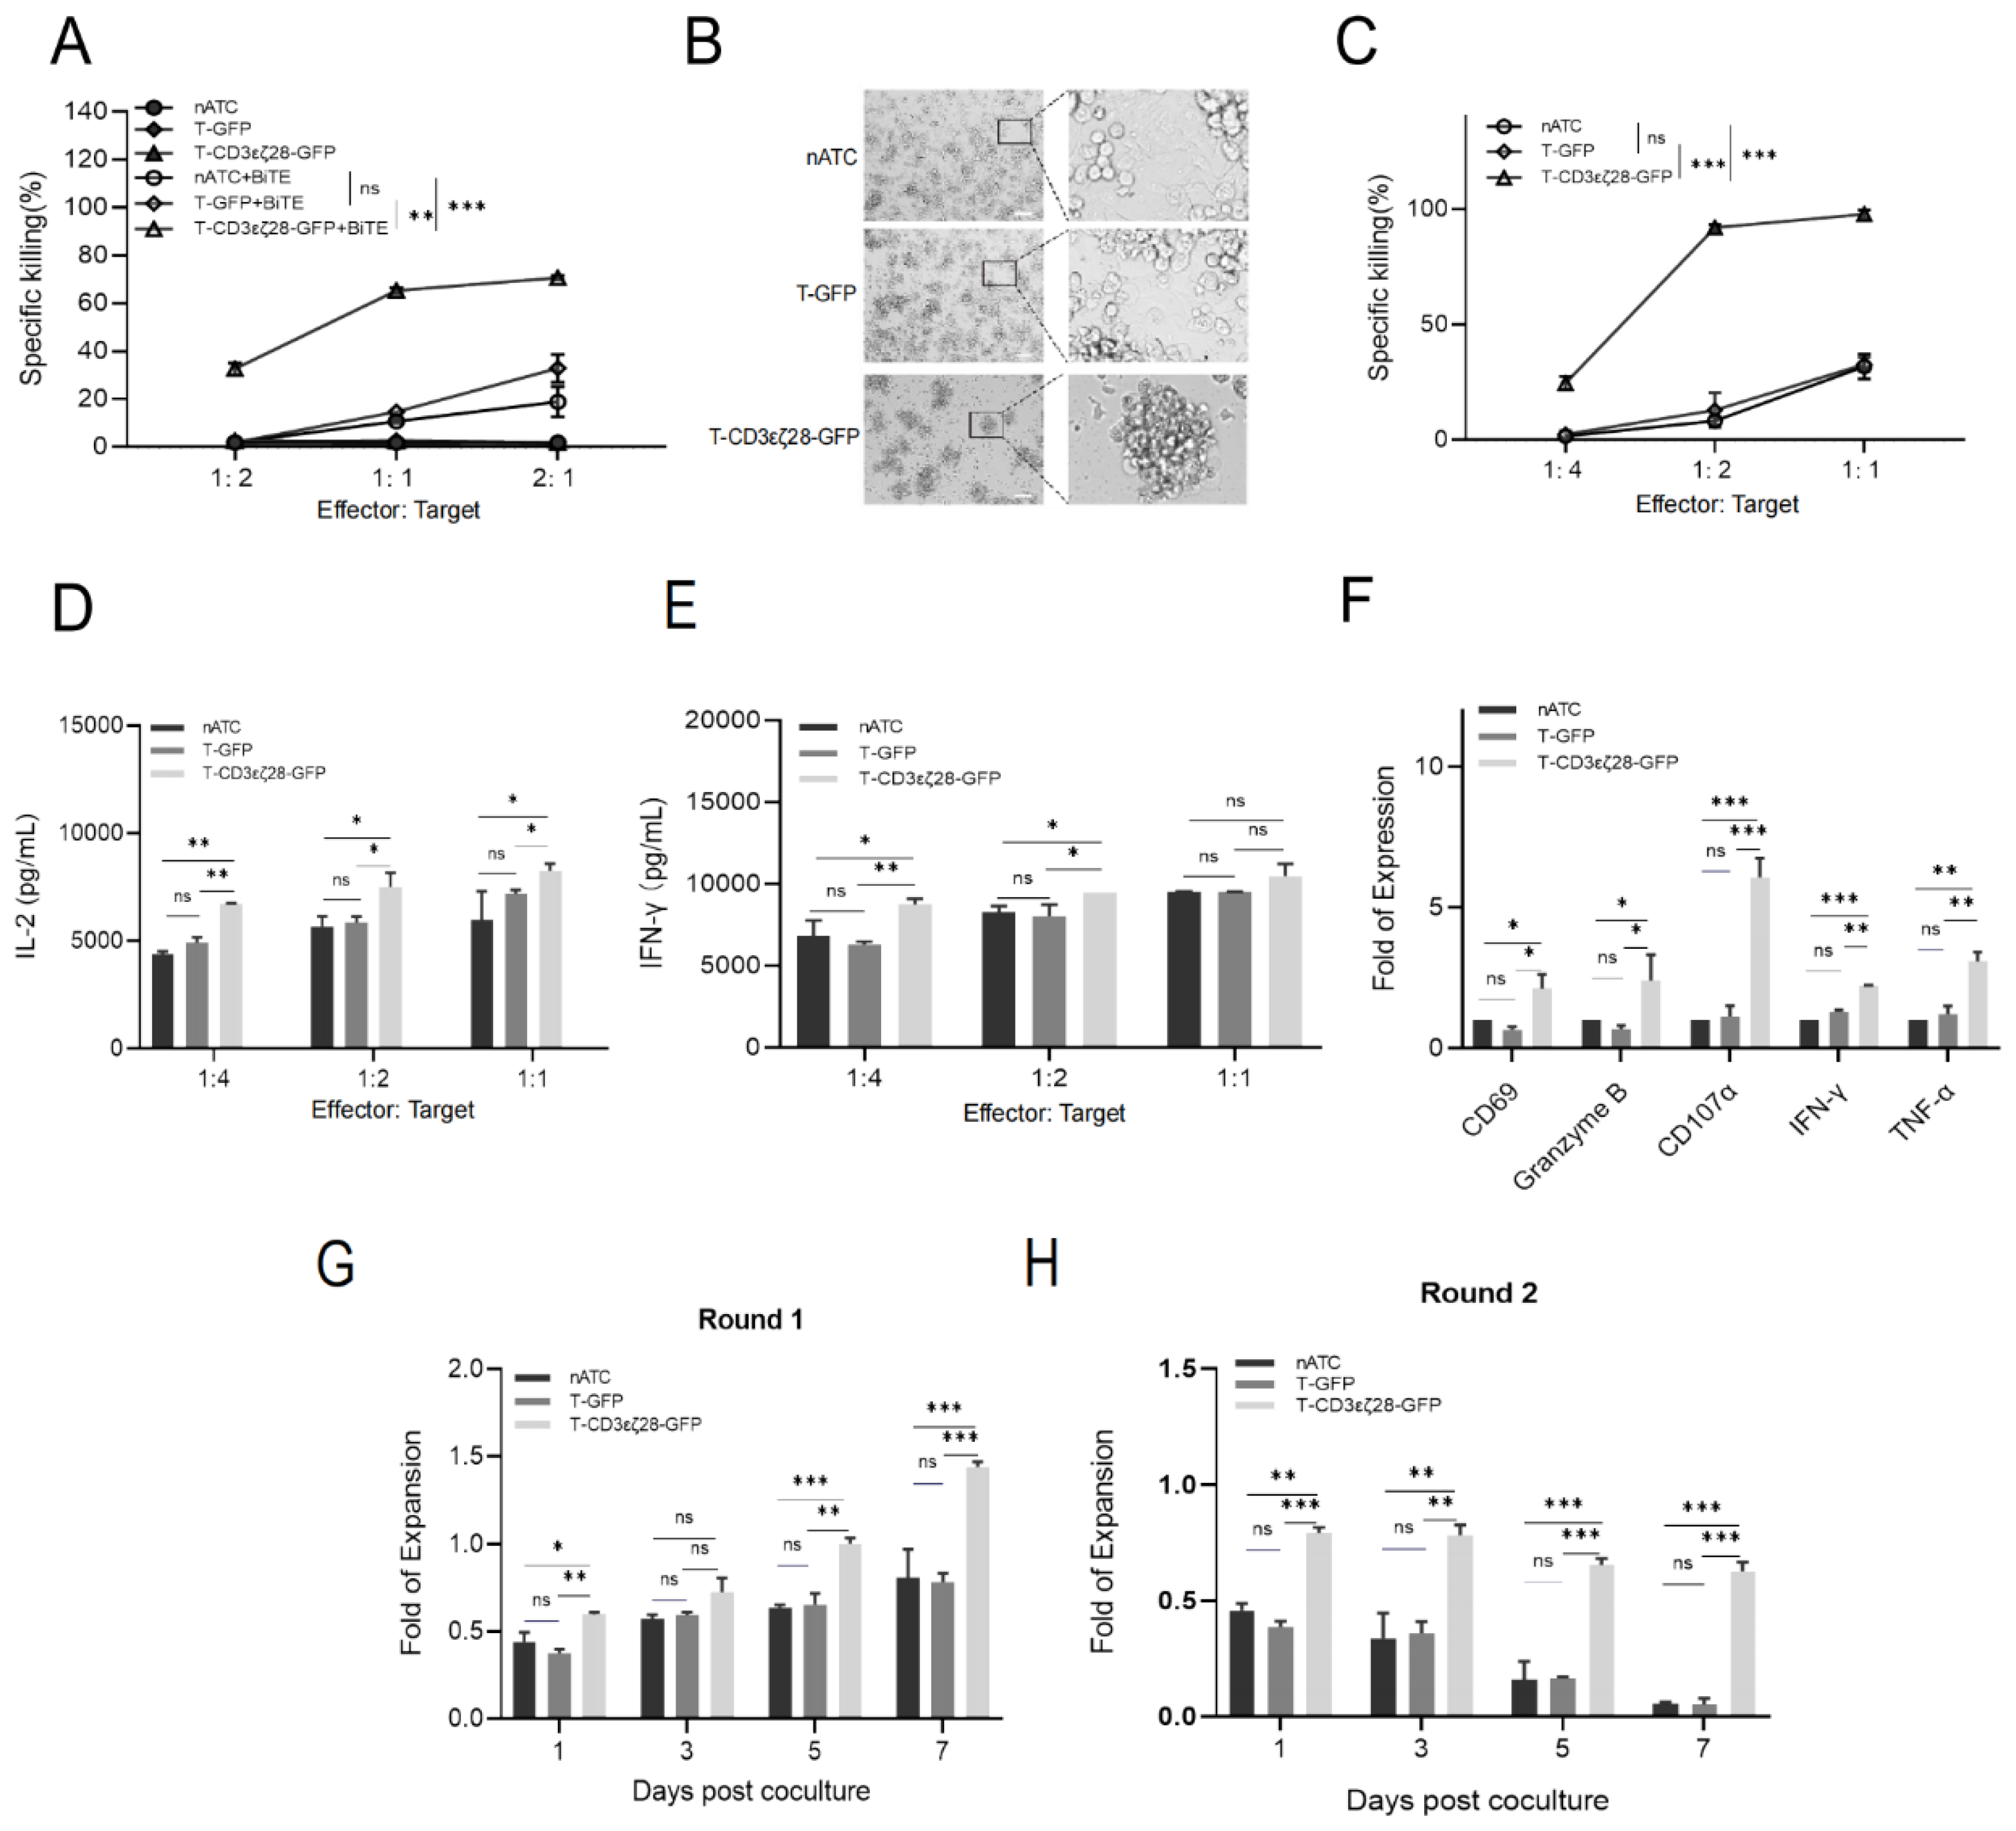
3.2. Combining T-CD3εζ28-GFP with BiTEs Exhibited Synergistic Killing Effects on Tumor Cells
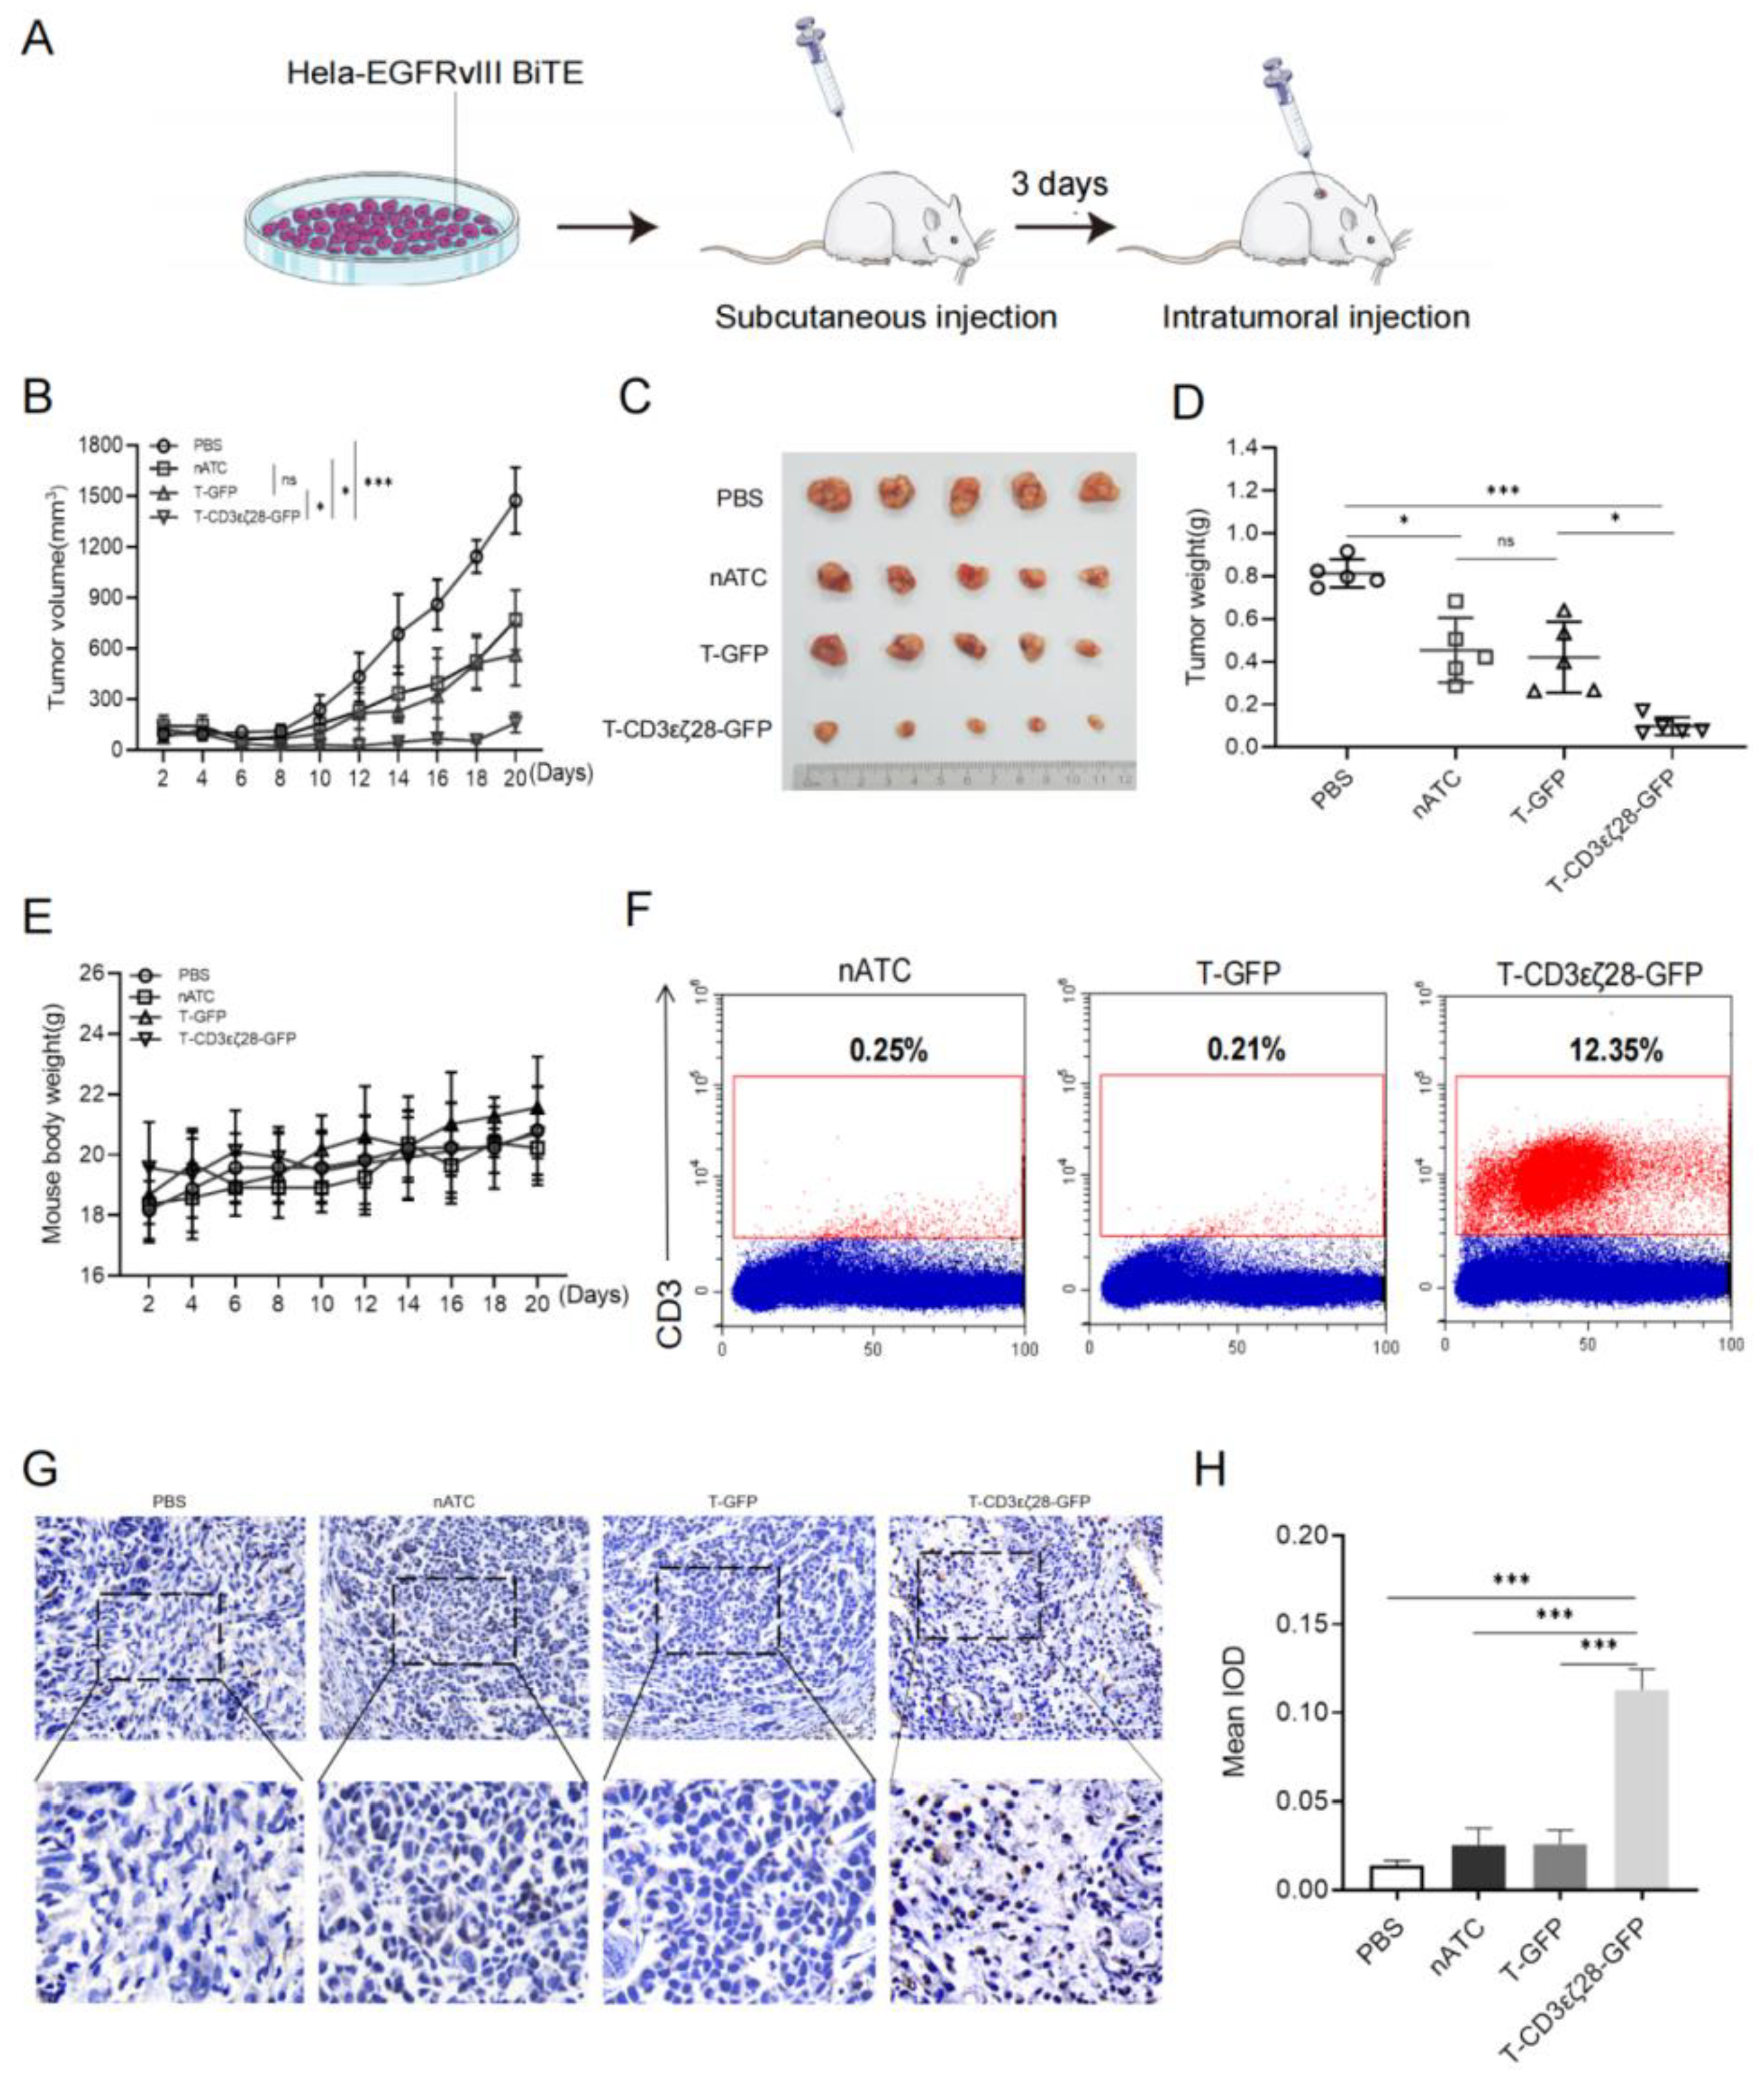
3.3. T-CD3εζ28-GFP Cells Showed Enhanced Anti-Tumor Activity in HeLa-EGFRvIII-BiTE Xenograft Tumor Model
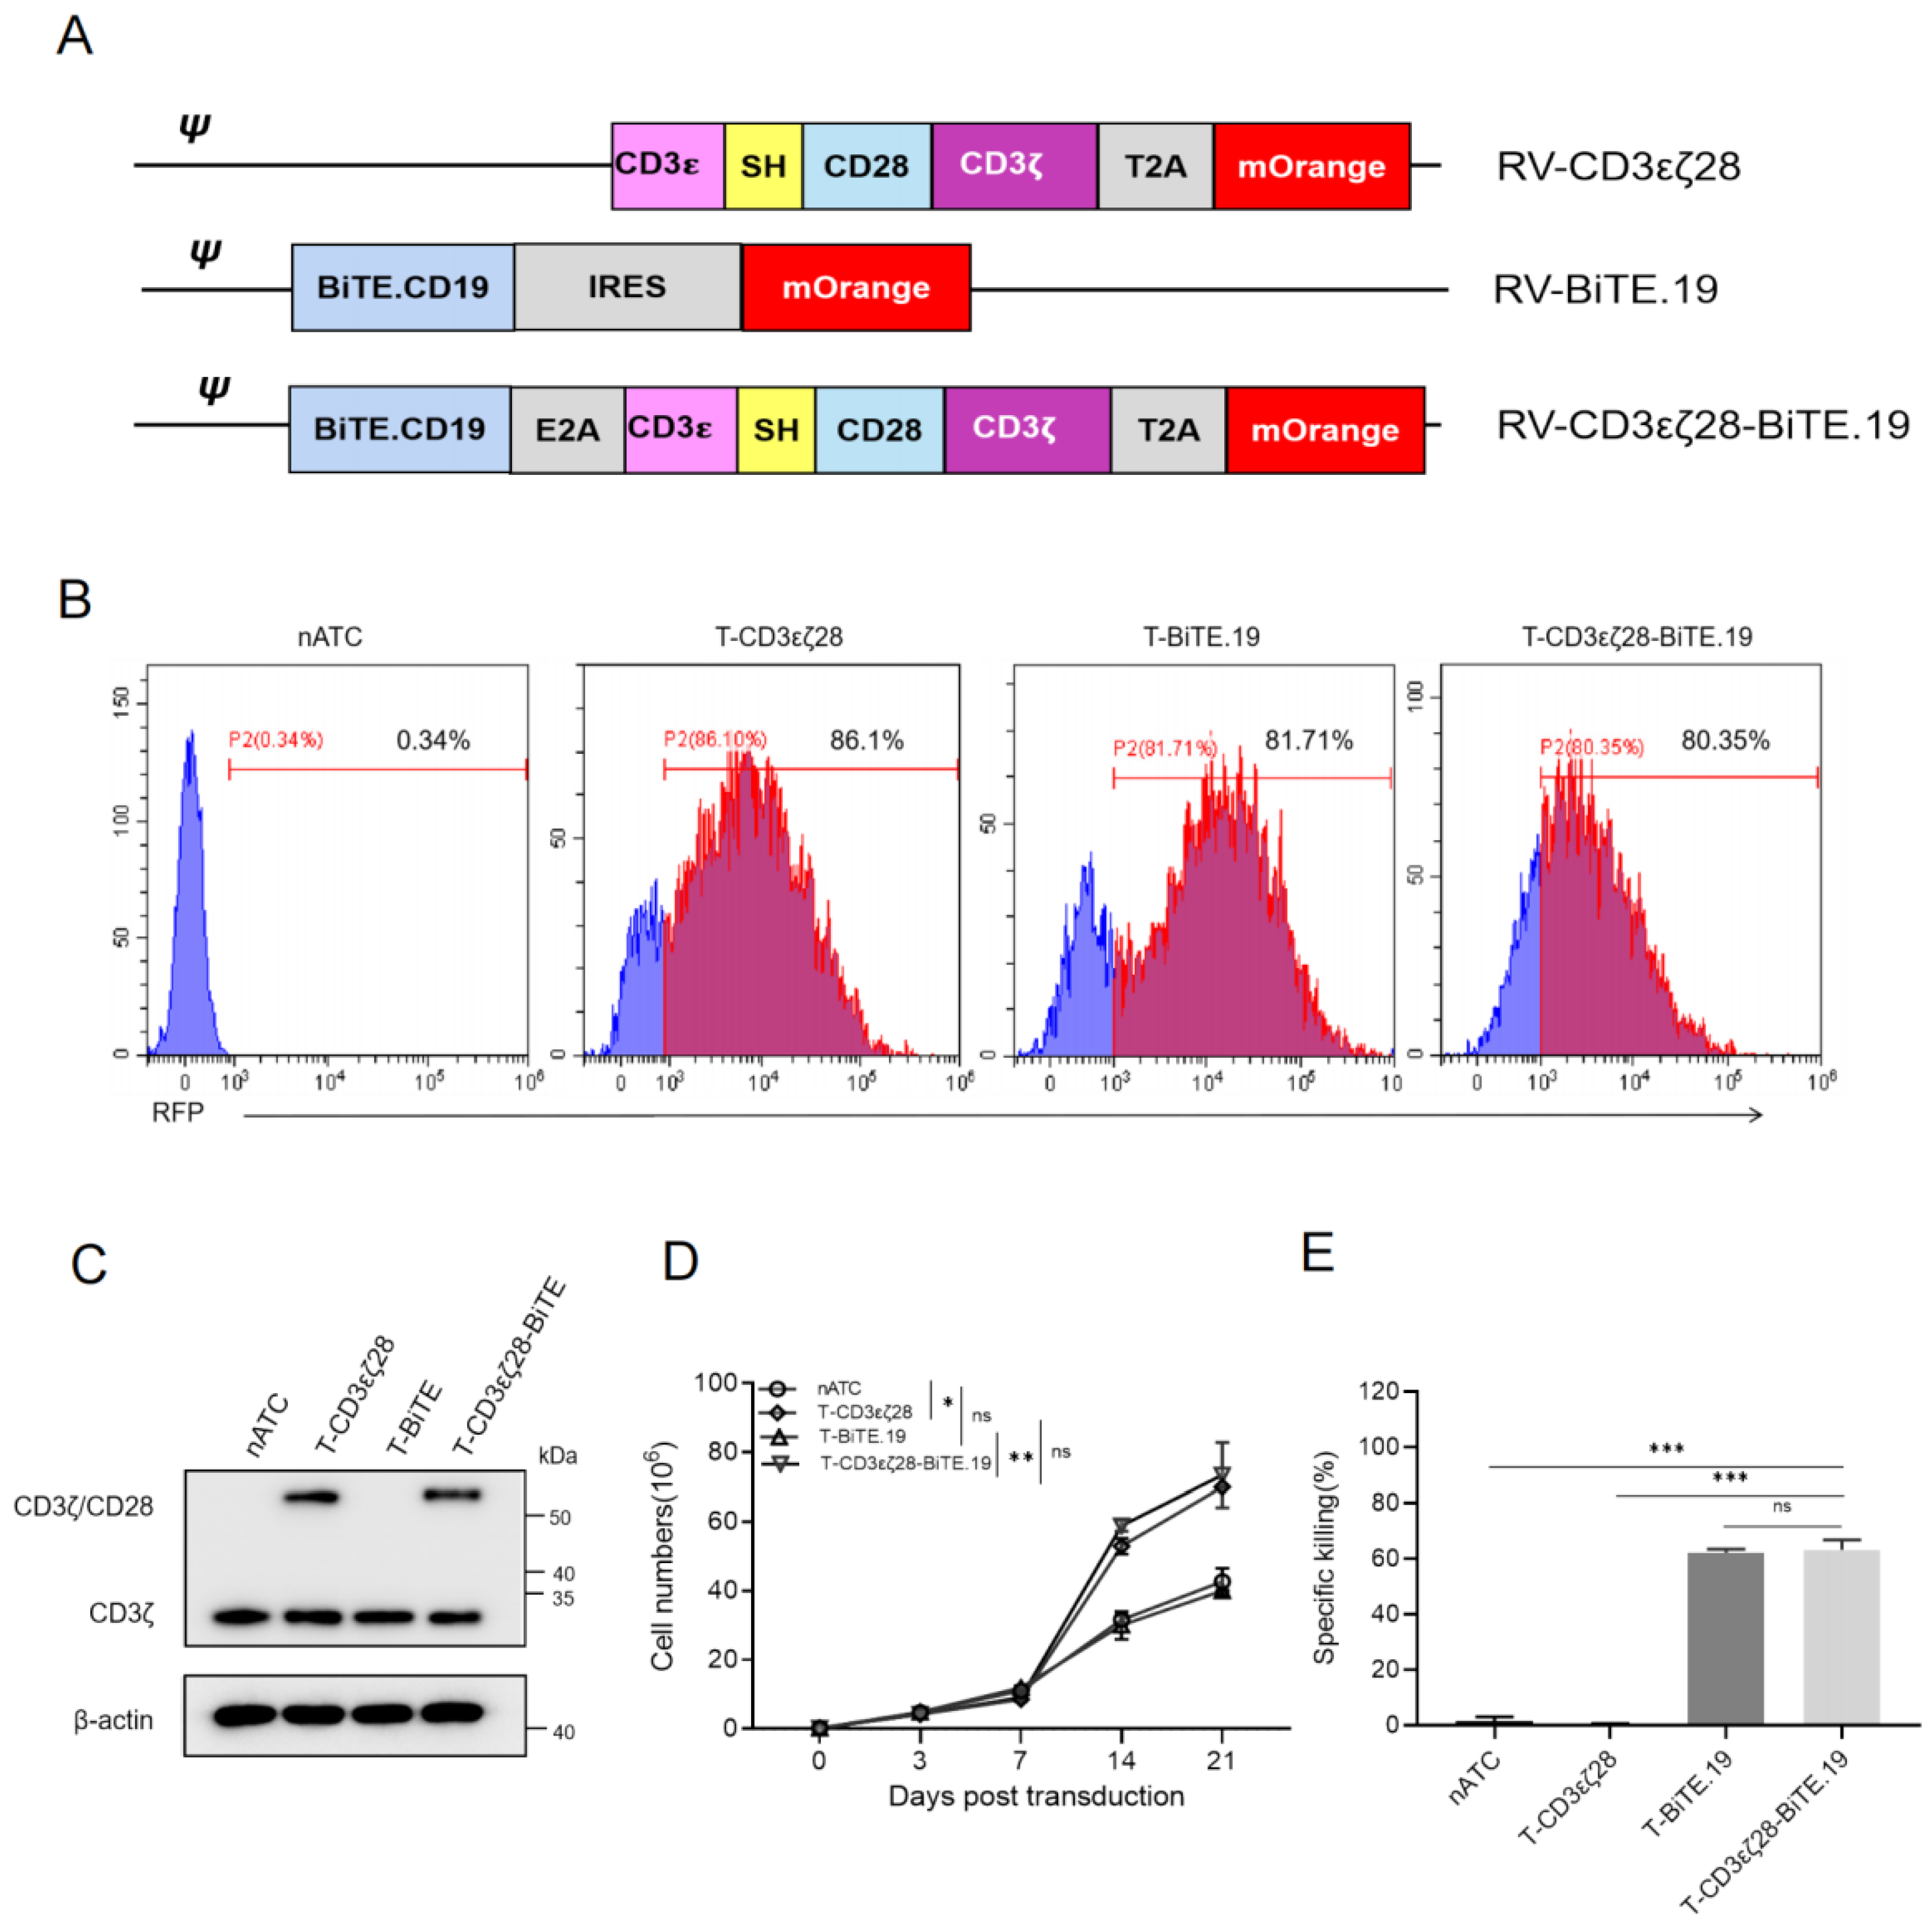
3.4. Generation of T-CD3εζ28 Cells Expressing Autocrine BiTEs
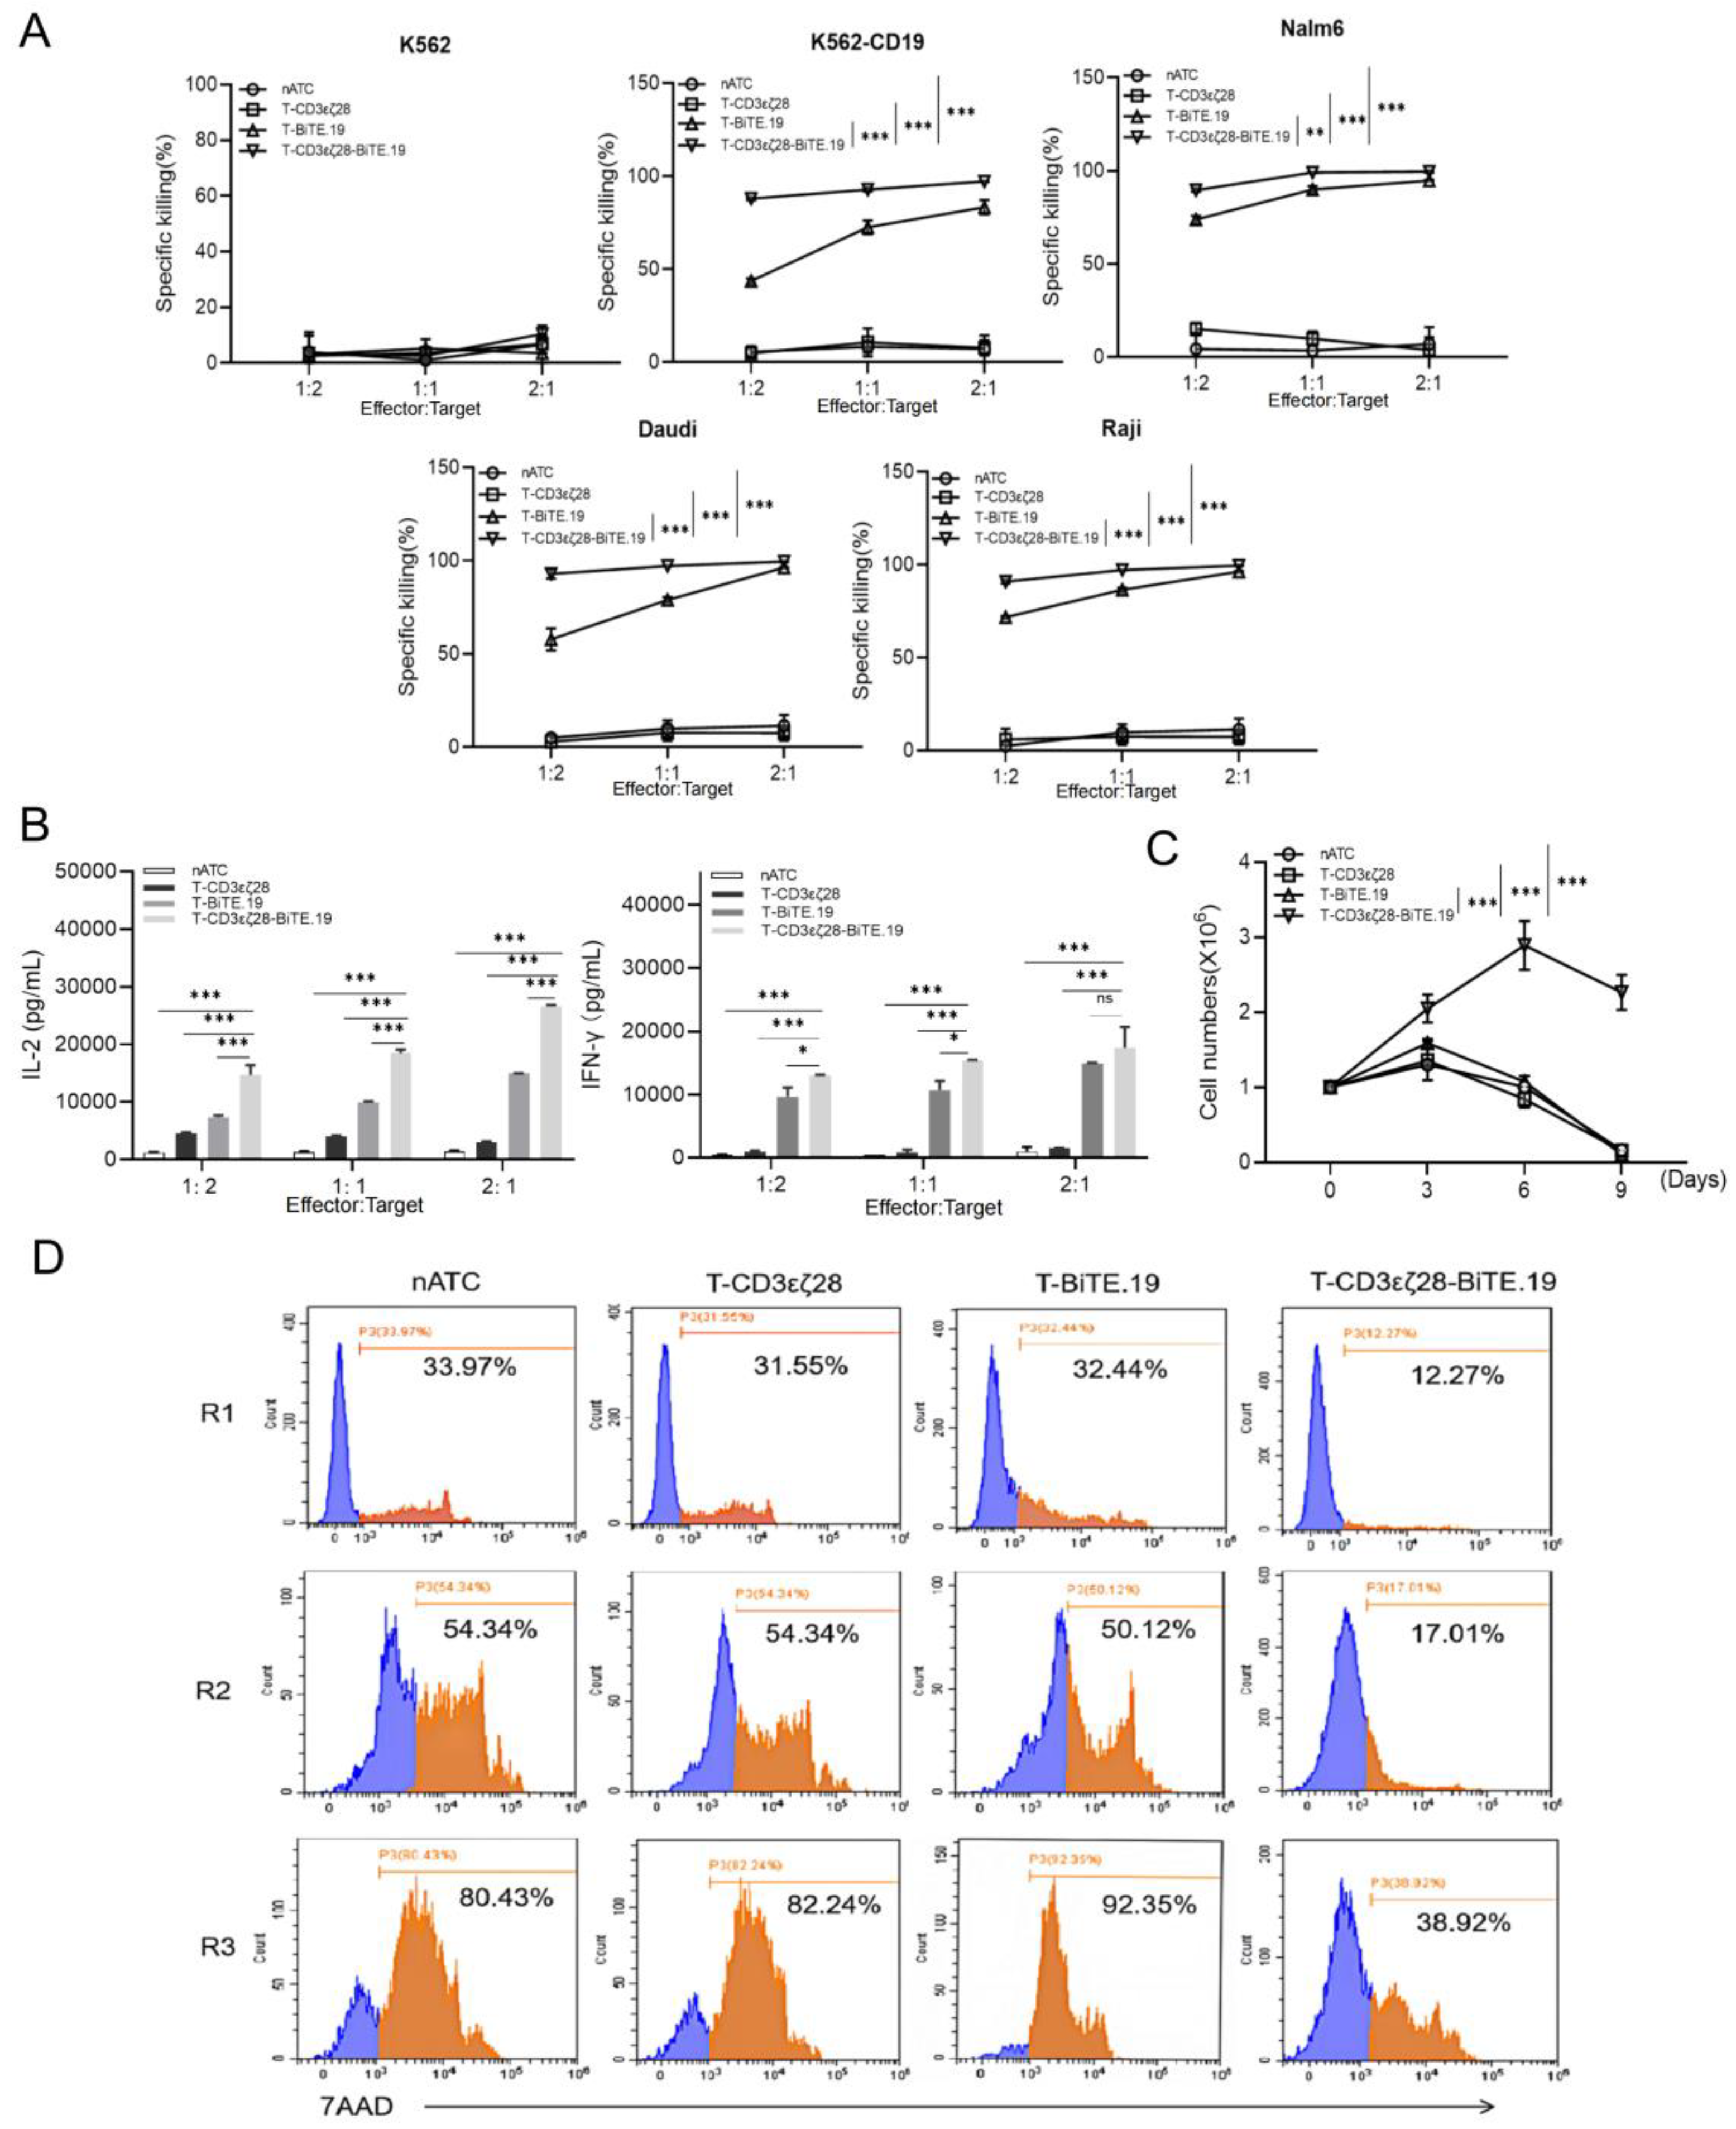
3.5. T-CD3εζ28-BiTE.19 Cells Exhibited Superior Killing Effects on Cancer Cells
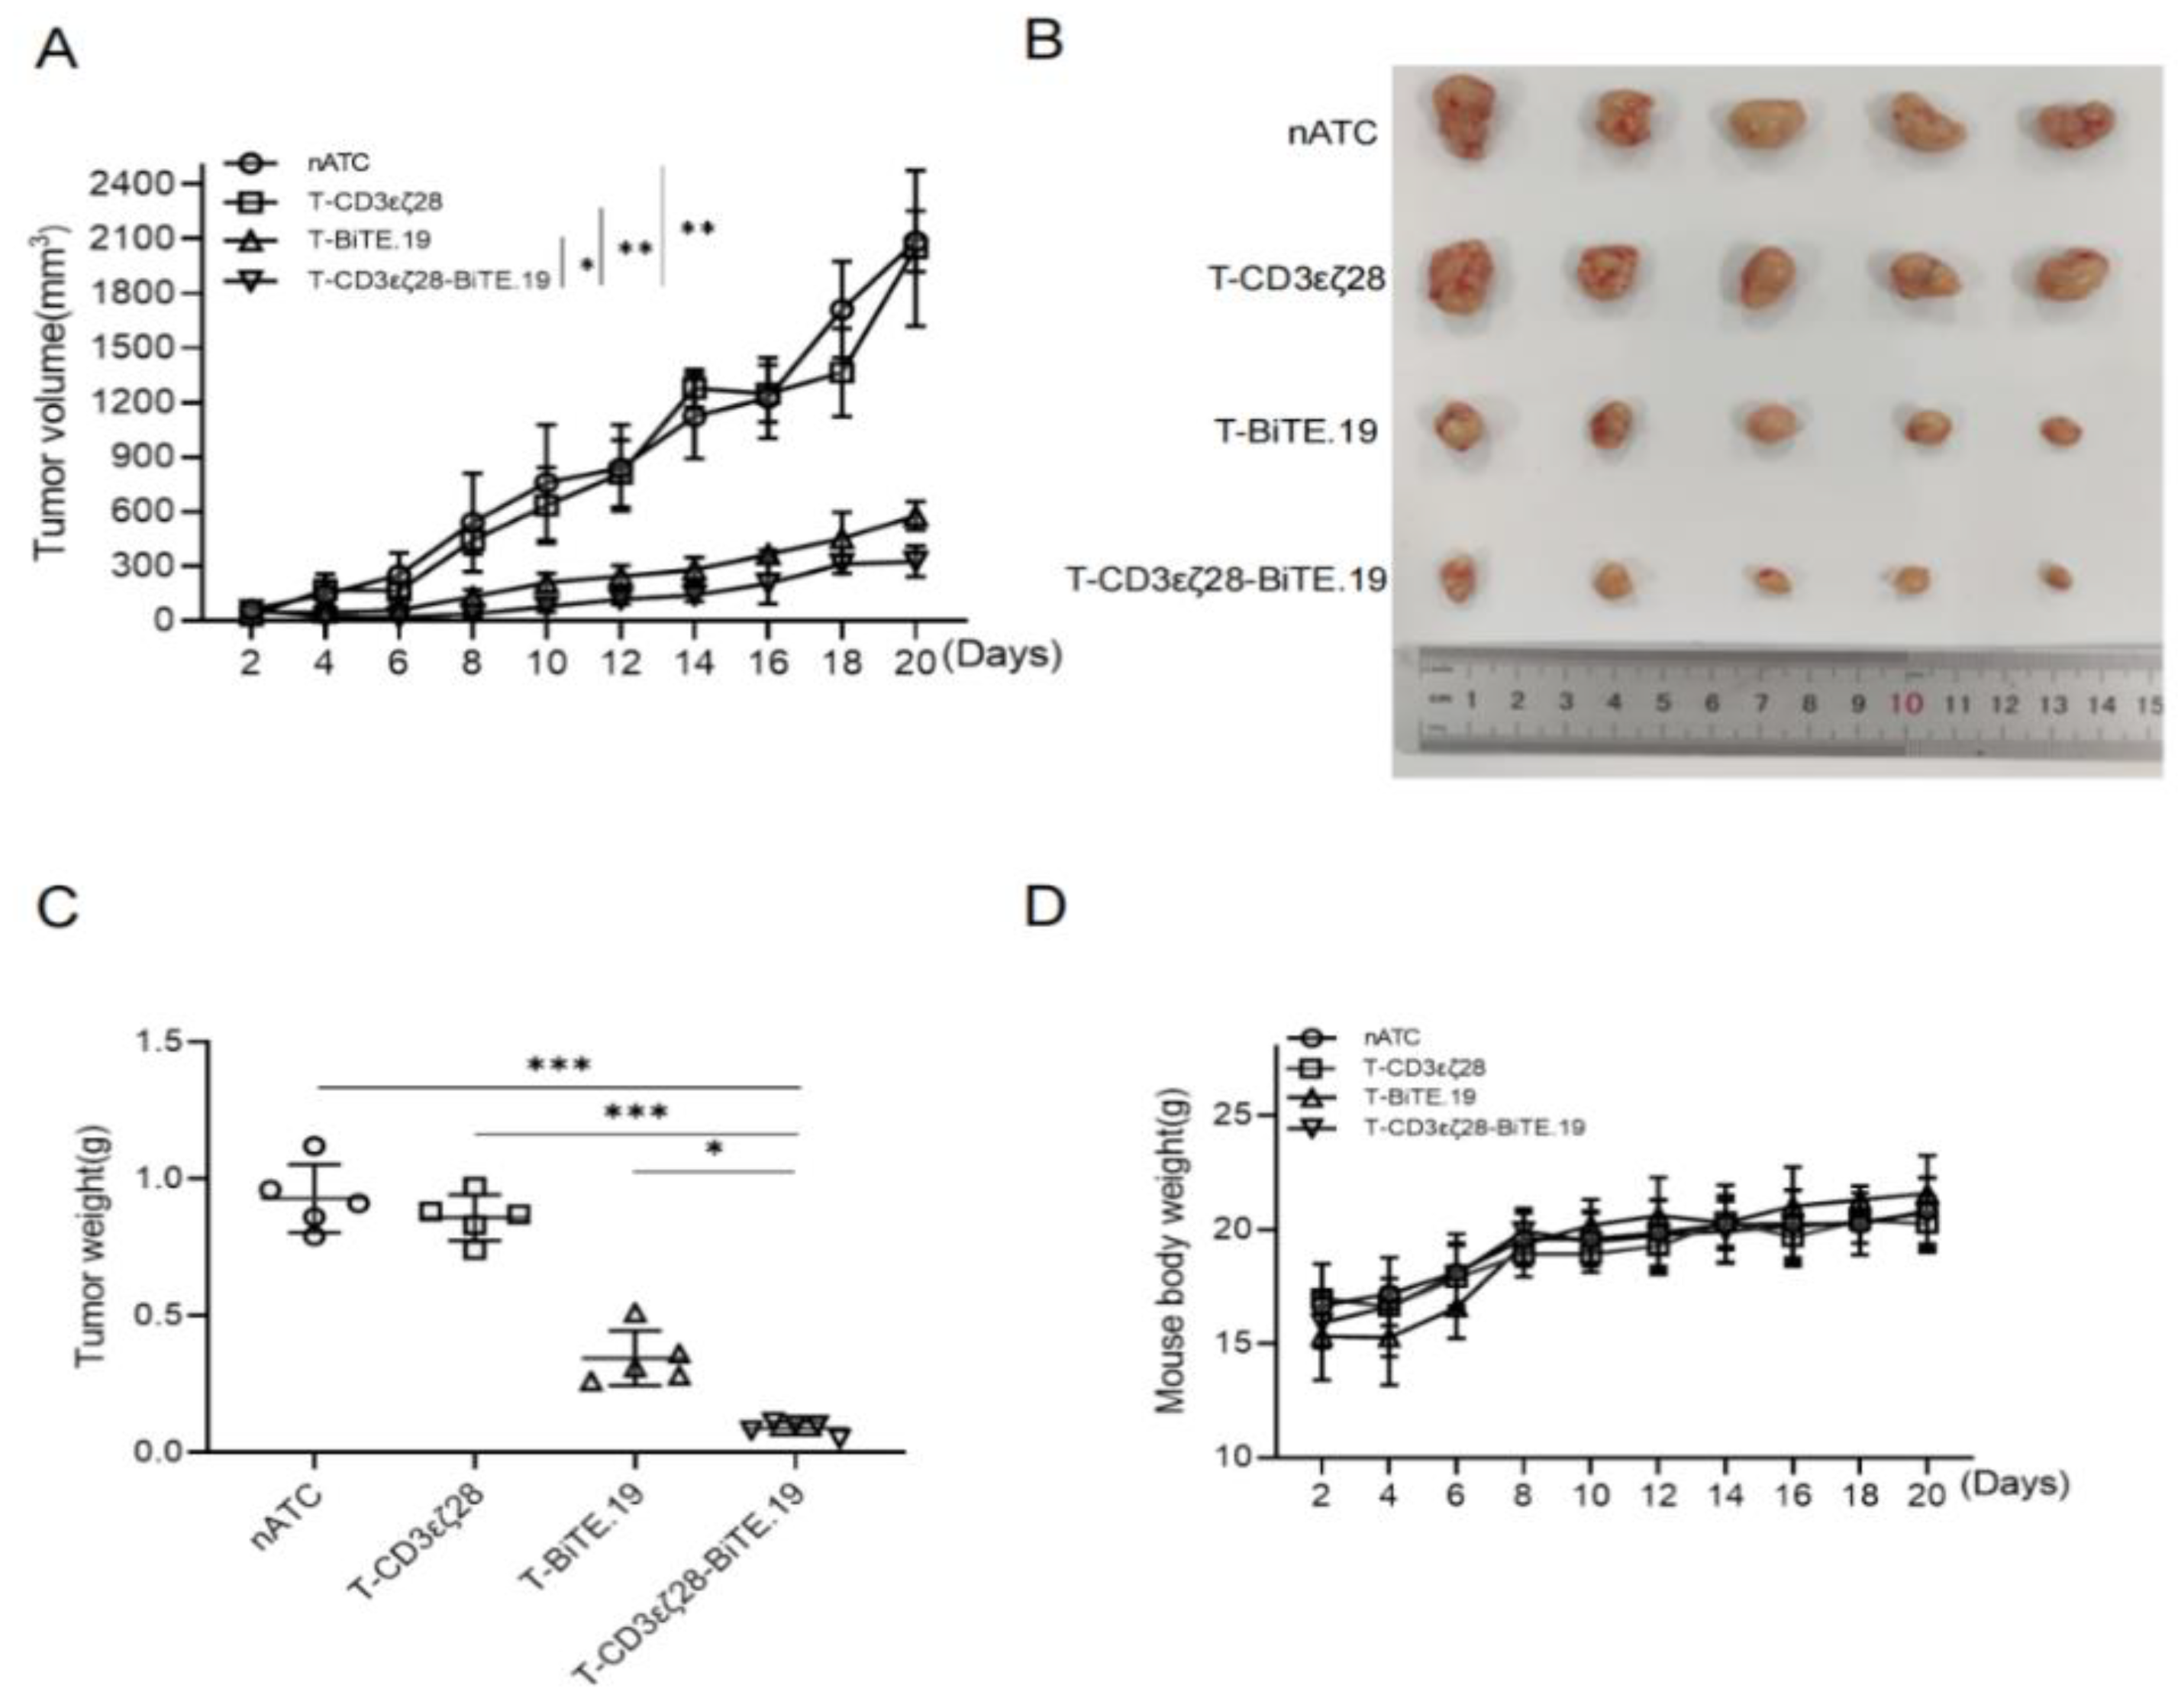
3.6. T-CD3εζ28-BiTE.19 Cells Showed Enhanced Anti-Tumor Activity in Xenograft Tumor Model
4. Discussion
5. Conclusions
Supplementary Materials
Author Contributions
Funding
Institutional Review Board Statement
Informed Consent Statement
Data Availability Statement
Conflicts of Interest
References
- Kishton, R.J.; Sukumar, M.; Restifo, N.P. Metabolic Regulation of T Cell Longevity and Function in Tumor Immunotherapy. Cell Metab. 2017, 26, 94–109. [Google Scholar] [CrossRef] [PubMed] [Green Version]
- Maciolek, J.A.; Pasternak, J.A.; Wilson, H.L. Metabolism of activated T lymphocytes. Curr. Opin. Immunol. 2014, 27, 60–74. [Google Scholar] [CrossRef]
- Kuhns, M.S.; Davis, M.M.; Garcia, K.C. Deconstructing the Form and Function of the TCR/CD3 Complex. Immunity 2006, 24, 133–139. [Google Scholar] [CrossRef] [PubMed] [Green Version]
- Maher, J.; Brentjens, R.J.; Gunset, G.; Rivière, I.; Sadelain, M. Human T-lymphocyte cytotoxicity and proliferation directed by a single chimeric TCRζ/CD28 receptor. Nat. Biotechnol. 2002, 20, 70–75. [Google Scholar] [CrossRef] [PubMed]
- Olguín-Contreras, L.F.; Mendler, A.N.; Popowicz, G.; Hu, B.; Noessner, E. Double Strike Approach for Tumor Attack: Engineering T Cells Using a CD40L:CD28 Chimeric Co-Stimulatory Switch Protein for Enhanced Tumor Targeting in Adoptive Cell Therapy. Front. Immunol. 2021, 12, 750478. [Google Scholar] [CrossRef] [PubMed]
- Ross, S.L.; Sherman, M.; McElroy, P.L.; Lofgren, J.A.; Moody, G.; Baeuerle, P.A.; Coxon, A.; Arvedson, T. Bispecific T cell engager (BiTE®) antibody constructs can mediate bystander tumor cell killing. PLoS ONE 2017, 12, e0183390. [Google Scholar] [CrossRef] [Green Version]
- de Miguel, M.; Umana, P.; de Morais, A.L.G.; Moreno, V.; Calvo, E. T-cell–engaging Therapy for Solid Tumors. Clin. Cancer Res. 2021, 27, 1595–1603. [Google Scholar] [CrossRef]
- Wu, W.; Zhou, Q.; Masubuchi, T.; Shi, X.; Li, H.; Xu, X.; Huang, M.; Meng, L.; He, X.; Zhu, H.; et al. Multiple Signaling Roles of CD3ε and Its Application in CAR-T Cell Therapy. Cell 2020, 182, 855–871.e23. [Google Scholar] [CrossRef]
- Liu, Y.; He, Y.; Zhang, J.; Jiang, L.; Liu, S.; Zheng, D. Tyrosine Mutation in CD3ε–ITAM Blocked T Lymphocyte Apoptosis Mediated by CD3ε. Immunol. Investig. 2003, 32, 59–70. [Google Scholar] [CrossRef] [PubMed]
- Correnti, C.E.; Laszlo, G.S.; De Van Der Schueren, W.J.; Godwin, C.D.; Bandaranayake, A.; Busch, M.A.; Gudgeon, C.J.; Bates, O.M.; Olson, J.M.; Mehlin, C.; et al. Simultaneous multiple interaction T-cell engaging (SMITE) bispecific antibodies overcome bispecific T-cell engager (BiTE) resistance via CD28 co-stimulation. Leukemia 2018, 32, 1239–1243. [Google Scholar] [CrossRef]
- Velasquez, M.P.; Szoor, A.; Vaidya, A.; Thakkar, A.; Nguyen, P.; Wu, M.-F.; Liu, H.; Gottschalk, S. CD28 and 41BB Costimulation Enhances the Effector Function of CD19-Specific Engager T Cells. Cancer Immunol. Res. 2017, 5, 860–870. [Google Scholar] [CrossRef] [PubMed] [Green Version]
- Rutkowska, A.; Stoczyńska-Fidelus, E.; Janik, K.; Włodarczyk, A.; Rieske, P. EGFRvIII: An Oncogene with Ambiguous Role. J. Oncol. 2019, 2019, 1–20. [Google Scholar] [CrossRef] [PubMed] [Green Version]
- Choi, B.D.; Yu, X.; Castano, A.P.; Bouffard, A.A.; Schmidts, A.; Larson, R.C.; Bailey, S.R.; Boroughs, A.C.; Frigault, M.J.; Leick, M.B.; et al. CAR-T cells secreting BiTEs circumvent antigen escape without detectable toxicity. Nat. Biotechnol. 2019, 37, 1049–1058. [Google Scholar] [CrossRef]
- Thistlethwaite, F.C.; Gilham, D.E.; Guest, R.D.; Rothwell, D.G.; Pillai, M.; Burt, D.J.; Byatte, A.J.; Kirillova, N.; Valle, J.W.; Sharma, S.K.; et al. The clinical efficacy of first-generation carcinoembryonic antigen (CEACAM5)-specific CAR T cells is limited by poor persistence and transient pre-conditioning-dependent respiratory toxicity. Cancer Immunol. Immunother. 2017, 66, 1425–1436. [Google Scholar] [CrossRef] [Green Version]
- Nair, R.; Westin, J. CAR T-Cells. Adv. Exp. Med. Biol. 2020, 1244, 215–233. [Google Scholar] [CrossRef]
- Shen, L.; Xiao, Y.; Tian, J.; Lu, Z. Remodeling metabolic fitness: Strategies for improving the efficacy of chimeric antigen receptor T cell therapy. Cancer Lett. 2022, 529, 139–152. [Google Scholar] [CrossRef]
- Alabanza, L.M.; Xiong, Y.; Vu, B.; Webster, B.; Wu, D.; Hu, P.; Zhu, Z.; Dropulic, B.; Dash, P.; Schneider, D. Armored BCMA CAR T Cells Eliminate Multiple Myeloma and Are Resistant to the Suppressive Effects of TGF-β. Front. Immunol. 2022, 13. [Google Scholar] [CrossRef]
- Adachi, K.; Kano, Y.; Nagai, T.; Okuyama, N.; Sakoda, Y.; Tamada, K. IL-7 and CCL19 expression in CAR-T cells improves immune cell infiltration and CAR-T cell survival in the tumor. Nat. Biotechnol. 2018, 36, 346–351. [Google Scholar] [CrossRef]
- Shum, T.; Kruse, R.L.; Rooney, C.M. Strategies for enhancing adoptive T-cell immunotherapy against solid tumors using engineered cytokine signaling and other modalities. Expert Opin. Biol. Ther. 2018, 18, 653–664. [Google Scholar] [CrossRef]
- Singh, A.P.; Zheng, X.; Lin-Schmidt, X.; Chen, W.; Carpenter, T.J.; Zong, A.; Wang, W.; Heald, D.L. Development of a quantitative relationship between CAR-affinity, antigen abundance, tumor cell depletion and CAR-T cell expansion using a multiscale systems PK-PD model. mAbs 2020, 12, 1688616. [Google Scholar] [CrossRef] [PubMed]
- Cherkassky, L.; Morello, A.; Villena-Vargas, J.; Feng, Y.; Dimitrov, D.S.; Jones, D.R.; Sadelain, M.; Adusumilli, P.S. Human CAR T cells with cell-intrinsic PD-1 checkpoint blockade resist tumor-mediated inhibition. J. Clin. Investig. 2016, 126, 3130–3144. [Google Scholar] [CrossRef] [PubMed]


Publisher’s Note: MDPI stays neutral with regard to jurisdictional claims in published maps and institutional affiliations. |
© 2022 by the authors. Licensee MDPI, Basel, Switzerland. This article is an open access article distributed under the terms and conditions of the Creative Commons Attribution (CC BY) license (https://creativecommons.org/licenses/by/4.0/).
Share and Cite
Yu, F.; Gao, Y.; Wu, Y.; Dai, A.; Wang, X.; Zhang, X.; Liu, G.; Xu, Q.; Chen, D. Combination of a Novel Fusion Protein CD3εζ28 and Bispecific T Cell Engager Enhances the Persistance and Anti-Cancer Effects of T Cells. Cancers 2022, 14, 4947. https://doi.org/10.3390/cancers14194947
Yu F, Gao Y, Wu Y, Dai A, Wang X, Zhang X, Liu G, Xu Q, Chen D. Combination of a Novel Fusion Protein CD3εζ28 and Bispecific T Cell Engager Enhances the Persistance and Anti-Cancer Effects of T Cells. Cancers. 2022; 14(19):4947. https://doi.org/10.3390/cancers14194947
Chicago/Turabian StyleYu, Feng, Yang Gao, Yan Wu, Anran Dai, Xiaoyan Wang, Xiangzhi Zhang, Guodong Liu, Qinggang Xu, and Dongfeng Chen. 2022. "Combination of a Novel Fusion Protein CD3εζ28 and Bispecific T Cell Engager Enhances the Persistance and Anti-Cancer Effects of T Cells" Cancers 14, no. 19: 4947. https://doi.org/10.3390/cancers14194947