Next Article in Journal
Non-Hematologic Toxicity of Bortezomib in Multiple Myeloma: The Neuromuscular and Cardiovascular Adverse Effects
Next Article in Special Issue
Applications of Genome-Wide Screening and Systems Biology Approaches in Drug Repositioning
Previous Article in Journal
Latest Development in Multiple Myeloma
Previous Article in Special Issue
Comprehensive Cohort Analysis of Mutational Spectrum in Early Onset Breast Cancer Patients
 
 
Correction published on 27 January 2021, see Cancers 2021, 13(3), 478.
Article

CeRNA Network Analysis Representing Characteristics of Different Tumor Environments Based on 1p/19q Codeletion in Oligodendrogliomas

1
Department of Biomedical Science, College of Life Science, CHA University, Seongnam 13488, Korea
2
Department of Neurosurgery, Bundang CHA Medical Center, CHA University School of Medicine, Seongnam 13496, Korea
*
Authors to whom correspondence should be addressed.
These authors contributed equally as Co-First authors.
These authors contributed equally as Co-Last authors.
Cancers 2020, 12(9), 2543; https://doi.org/10.3390/cancers12092543
Submission received: 1 August 2020 / Revised: 29 August 2020 / Accepted: 4 September 2020 / Published: 7 September 2020
(This article belongs to the Collection Application of Bioinformatics in Cancers)

Abstract

:

Simple Summary

Oligodendroglioma (OD) is a subtype of glioma occurring in the central nervous system. The 1p/19q codeletion is a prognostic marker of OD with an isocitrate dehydrogenase (IDH) mutation and is associated with a clinically favorable overall survival (OS). The long non-coding RNAs (lncRNAs) protects the mRNA from degradation by binding with the same miRNA by acting as a competitive endogenous RNA (ceRNA). Recently, although there is an increasing interest in lncRNAs on glioma studies, however, studies regarding their effects on OD and the 1p/19q codeletion remain limited. In our study, we performed in silico analyses using low-grade gliomas from datasets obtained from The Cancer Genome Atlas to investigate the effects of ceRNA with 1p/19q codeletion on ODs. We constructed 16 coding RNA–miRNA–lncRNA networks and the ceRNA network participated in ion channel activity, insulin secretion, and collagen network and extracellular matrix (ECM) changes. In conclusion, our results can provide insights into the possibility in the different tumor microenvironments and OS following 1p/19q codeletion through changes in the ceRNA network.

Abstract

Oligodendroglioma (OD) is a subtype of glioma occurring in the central nervous system. The 1p/19q codeletion is a prognostic marker of OD with an isocitrate dehydrogenase (IDH) mutation and is associated with a clinically favorable overall survival (OS); however, the exact underlying mechanism remains unclear. Long non-coding RNAs (lncRNAs) have recently been suggested to regulate carcinogenesis and prognosis in cancer patients. Here, we performed in silico analyses using low-grade gliomas from datasets obtained from The Cancer Genome Atlas to investigate the effects of ceRNA with 1p/19q codeletion on ODs. Thus, we selected modules of differentially expressed genes that were closely related to 1p/19q codeletion traits using weighted gene co-expression network analysis and constructed 16 coding RNA–miRNA–lncRNA networks. The ceRNA network participated in ion channel activity, insulin secretion, and collagen network and extracellular matrix (ECM) changes. In conclusion, ceRNAs with a 1p/19q codeletion can create different tumor microenvironments via potassium ion channels and ECM composition changes; furthermore, differences in OS may occur. Moreover, if extrapolated to gliomas, our results can provide insights into the consequences of identical gene expression, indicating the possibility of tracking different biological processes in different subtypes of glioma.

1. Introduction

Gliomas are the most frequently occurring tumors in the central nervous system [1,2]. Oligodendrogliomas (OD), a subtype of gliomas, account for <10% of all primary gliomas [3,4]. In 2016, the World Health Organization (WHO) established a new classification system for central nervous system tumors by adding newer genetic molecular markers to existing histopathological characteristics. IDH1 and IDH2 (collectively referred to as IDH hereafter), which encode isocitrate dehydrogenase and cause mutations and 1p/19q codeletion, were included as characteristic prognostic markers of ODs [5]. Although the 1p/19q codeletion is a prognostic marker of ODs with IDH1/2 mutations [6,7], 30–40% of all ODs are not codeleted at 1p/19q and have a worse prognosis [8,9,10]. Hence, the 1p/19q codeletion is reportedly associated with diagnosis, prognosis, and clinically favorable overall survival (OS) in glioma; however, the exact underlying mechanism remains unclear [3,11,12,13,14,15,16].
With the development of high-throughput sequencing, the genomic functions of approximately 2% of the human genome have been identified [17,18,19], including those of long non-coding RNAs (lncRNAs) with pseudogenes [20]. However, most lncRNAs have not been identified based on their biological importance [21]. lncRNAs are regulatory RNA transcripts with a length >200 nucleotides [22] and have recently been reported to play various important roles in the regulation of transcription and translation as well as in epigenetic modification [19,23].
The miRNAs play roles as inhibitory regulators at the post-transcriptional level by binding their specific target site known as miRNA response element (MRE) [24]. The lncRNAs share MRE sequences with a coding gene, which protects the mRNA from degradation by binding with the same miRNA and also by acting as a competitive endogenous RNA (ceRNA) [20,25]. The epigenetic change of their expression has been related with various diseases. To be more specific, several oncologic studies have reported that lncRNAs, particularly ceRNAs play important roles in tumorigenesis and tumor progression [26,27,28]. The first report of the ceRNA in cancer is phosphatase and tensin homolog pseudogene 1 (PTENP1), a pseudogene of phosphatase and tensin homolog (PTEN), and it showed tumor suppressive effect by binding miRNAs such as miR-17, miR-19, and miR-21 which were ultimately targeting PTEN [29]. The tumor suppressive effects of PTEN in the ceRNA network have also been reported in conjunction with growth arrest-specific 5 (GAS5), Itchy E3 Ubiquitin Protein Ligase (Circ-ITCH), Fer-1-like protein 4 (FER1L4) [30,31,32]. On contrary, some noticeable studies also reported on the oncogenic effect of lncRNA such as KRAS proto-oncogene, GTPase pseudogene 1 (KRASP1), and H19 imprinted maternally expressed transcript (H19). KRASP1 affects tumor growth and development by competitive binding for shared miRNAs with KRAS proto-oncogene, GTPase (KRAS) [29]. H19 is mutually counter-regulated by tumor suppressor p53 [33].
In a glioma study, they report on the oncogenic role of maternally expressed 3 (MEG3) as a tumor suppressor lncRNA that is downregulated in gliomas [34] and nuclear paraspeckle assembly transcript 1 (NEAT1) on by competing for miR-let-7e and modulating the expression of signal transducer and activator of transcription 3 (STAT3) and NRAS proto-oncogene, GTPase (NRAS) [34,35]. The functions of lncRNAs as biomarkers and therapeutic targets in glioma are well reported [36,37,38]; Collectively, these findings showed that the interactions among lncRNAs, mRNA, and miRNA in ceRNA network implicate a potential role as tumor suppressive or oncogenic effects. However, data regarding their effects on OD and the 1p/19q codeletion remain limited. Hence, in this study, we identified 16 lncRNA–miRNA–mRNA networks in ODs with 1p/19q codeletion using The Cancer Genome Atlas (TCGA) database.

2. Materials and Methods

2.1. Processing Genomic and Clinical Profiles from TCGA Database

Gene expression quantification data of mRNA, lncRNA, pseudogene, and miRNA isoforms of low-grade gliomas (LGG), inclusive of OD, and the corresponding clinical profiles were downloaded, normalized, and processed within the TCGAbiolinks pipeline (version 2.15.3) in R software (version 3.5.2) [39].
We downloaded harmonized data from TCGA database as reference of hg38 (platform “Illumina HiSeq”) for 189 patients with OD who had IDH mutation information and selected 168 patients with IDH mutation. The function GDCprepare used with the options legacy = FALSE, datacategory = “Transcriptome Profiling”, datatype = “Gene Expression Quantification”, workflowtype = “HTSeq − Counts” for obtaining mRNA transcripts data. The function GDCprepare used with the options legacy = FALSE, datacategory = “Transcriptome Profiling”, datatype = “Isoform Expression Quantification” and workflowtype = “BCGSC miRNA Profiling” for obtaining miRNA transcripts data (reads per million mapped reads, RPM).
Then, we performed the pre-processing steps according to the TCGA’s workflow and standard pipeline as recommended in TCGAbiolinks [39,40]. We checked to possible outliers for mRNA transcript data using the TCGAanalyze_Preprocessing function with the options cor.cut = 0.6 (Correlation coefficient). Then, we normalized mRNA transcripts data using the TCGAanalyze_Normalization function to adjust for the GC contents effect and followed gene filtering steps using the TCGAanalyze_Filtering functions. The miRNA transcripts data was filtered by quantile using the TCGAanalyze_Filtering functions, and lowly expressed miRNA with less than overall average RPM 3 was filtered out and transformed into log2(RPM + 1). Moreover, all genes of both mRNA and miRNA for which the expression level in one patient was greater than one-third of the sum of total patients’ gene expression levels were excluded.
To classify non-coding RNAs, protein-coding gene, long non-coding gene, and pseudogene datasets were downloaded from the HUGO Gene Nomenclature Committee (HGNC) database. Furthermore, the data from the HGNC dataset were used to identify Ensembl IDs. miRBase accession numbers were converted to miRNA symbols using miRBaseConvertor (version 1.10.0), and miRNA expression levels were re-quantified for every miRNA symbol [41].

2.2. Analysis of Differentially Expressed Genes and Their Visualization

Differentially expressed genes (DEGs), including coding RNAs (DEcodingRNAs), non-coding RNAs (DEncRNAs) such as lncRNAs (DElncRNAs), pseudogenes (DEpseudogenes), and miRNAs (DEmiRNAs), were identified using the edgeR package provided in the TCGAbiolinks differential expression analysis (DEA) process. The filter criteria were |Log2 fold change| > 1 and p value of <0.05 using false discovery rate (FDR) correction; results were presented via heatmaps generated using the TCGAbiolinks package [32]. For better identification and analysis in terms of the distribution and chromosomal locations of DEGs, ShinyGO [42], and Genome Decoration Page (GDP, source: http://www.ncbi.nlm.nih.gov/genome/tools/gdp) [43] were used for visualizing the data. ShinyGO serves as a statistical analysis tool and identifies gene characteristics such as genotypes, GC content distribution, and chromosomal locations between query genes and background data. GDP is a visualization tool which shows distribution of query genes on the genome.

2.3. Weighted Gene Co-Expression Network Analysis

We calculated the similarity matrix (Sij) of expression between DEcodingRNAs and DE-ncRNAs using Pearson’s correlation coefficients. Next, for measuring contributions among genes and to transform the similarity matrix into an adjacency matrix (aij), the following formula was used:
a i j = | 0.5   × ( 1 + c o r ( i , j ) ) | β
The soft threshold statistical powers (β) of upregulated DEcodingRNAs and DEncRNAs and downregulated DEcodingRNAs and DEncRNAswere both set to 4. Accordingly, scale-free topology fit index and mean interconnectivity were measured and topological overlap matrix (TOM) was performed. Next, topological overlap dissimilarity measure (dissTOM) was assessed, and using the obtained value, a hierarchical clustering tree was constructed using the average hierarchical clustering method to group the DEcodingRNAs and DEncRNAs. A dynamic cut tree algorithm with minimum a module size of 15 and merging threshold over similarity of 0.7 (cutoff of 0.3) was used to generate the appropriate number of and densely interconnected modules between DEcodingRNAs and DEncRNAs. Next, the function of module eigengenes (MEs) was found to be represented as the first principal component of the expression matrix, and we could identify highly correlated modules with clinical traits using Pearson’s correlation tests using MEs in WGCNA [44]. We evaluated the profile of each module by comparing it to the correlation between the modules and the clinical traits of OD having an IDH mutation with a 1p/19q codeletion.

2.4. Construction of a CeRNA Network

We performed DEA and WGCNA to select candidate genes for the ceRNA network and obtained positively co-expressed DEcoding RNAs and DEncRNAs and negatively expressed DEmiRNAs in OD patients with IDH mutations and 1p/19q codeletions. Next, the following bioinformatics tools were used to predict the interactions among the selected DEcodingRNAs, DEncRNAs, and DEmiRNAs. RNAInter (https://www.rna-society.org/rnainter/) [45] is a platform containing comprehensive RNA-associated interactomes utilizing 35 integrated computationally predicted and experimentally validated databases, including TargetScan, miRcode, and miRanda. ENCORI (http://starbase.sysu.edu.cn/index.php; version 3.0) [46] and mirDIP 4.1 (http://ophid.utoronto.ca/mirDIP/) [47] provide integrated data of miRNA–target interactions from across diverse resources. Basically, we acquired both the prediction of DEncRNA–DEmiRNA interactions and DEcodingRNA–DEmiRNA interactions using these databases. Additionally, we used other databases for supplementary and validation purposes. DIANA-TarBase v8 (www.microrna.gr/tarbase) [48] and miRWalk (http://mirwalk.umm.uni-heidelberg.de/; version 3.0) [49] were used for DEcodingRNA–DEmiRNA interactions and the DIANA-LncBase v2 was used for DEncRNA–DEmiRNA interactions.

2.5. Evaluation and Visualization of CeRNA Network

We evaluated the ceRNA network using adjusted rand index (ARI) with DEcodingRNAs belonging to each ceRNA network and selected it as the final ceRNA network having a high concordance with traits of IDH mutations with 1p/19q codeletion. Finally, the ceRNA network with an ARI of over 0.6 was visualized using Cytoscape software 3.7.2 [50].

2.6. Gene Ontology and Pathway Enrichment Analysis

Gene ontology (GO) analyses—including those for biological processes, cellular components, and molecular functions—were performed using ShinyGO with an FDR of <0.05 [42]. The Kyoto Encyclopedia of Genes and Genomes (KEGG) and reactome pathway enrichment analyses were performed using ClueGO software with a Bonferroni step-down of <0.05 in Cytoscape [51]. The results of the enrichment analyses were visualized using ShinyGO and Cytoscape software.

2.7. Statistical Analysis for Validation of the CeRNA Network

Agglomerative unsupervised clustering using the ward method was performed for validating the ceRNA network, with an expression pattern of gene sets of DEcodingRNA belonging to each ceRNA network, and the results were compared with actual clinical data of patient subgroups using Python software (version 2.7; Python Software Foundation, Wilmington, DE, USA). The number of clusters (set on unsupervised clustering) was 2 for OD and 3 for low-grade glioma patients. We also compared the survival rate between the actual subgroup and clusters from unsupervised clustering using the Kaplan–Meier survival analysis. Furthermore, two-dimensional K-means clustering and survival rate were assessed to identify significant clinical effects of lncRNAs as ceRNA in R (version 3.5.2; R Foundation, Vienna, Austria) software and GEPIA [52].

3. Results

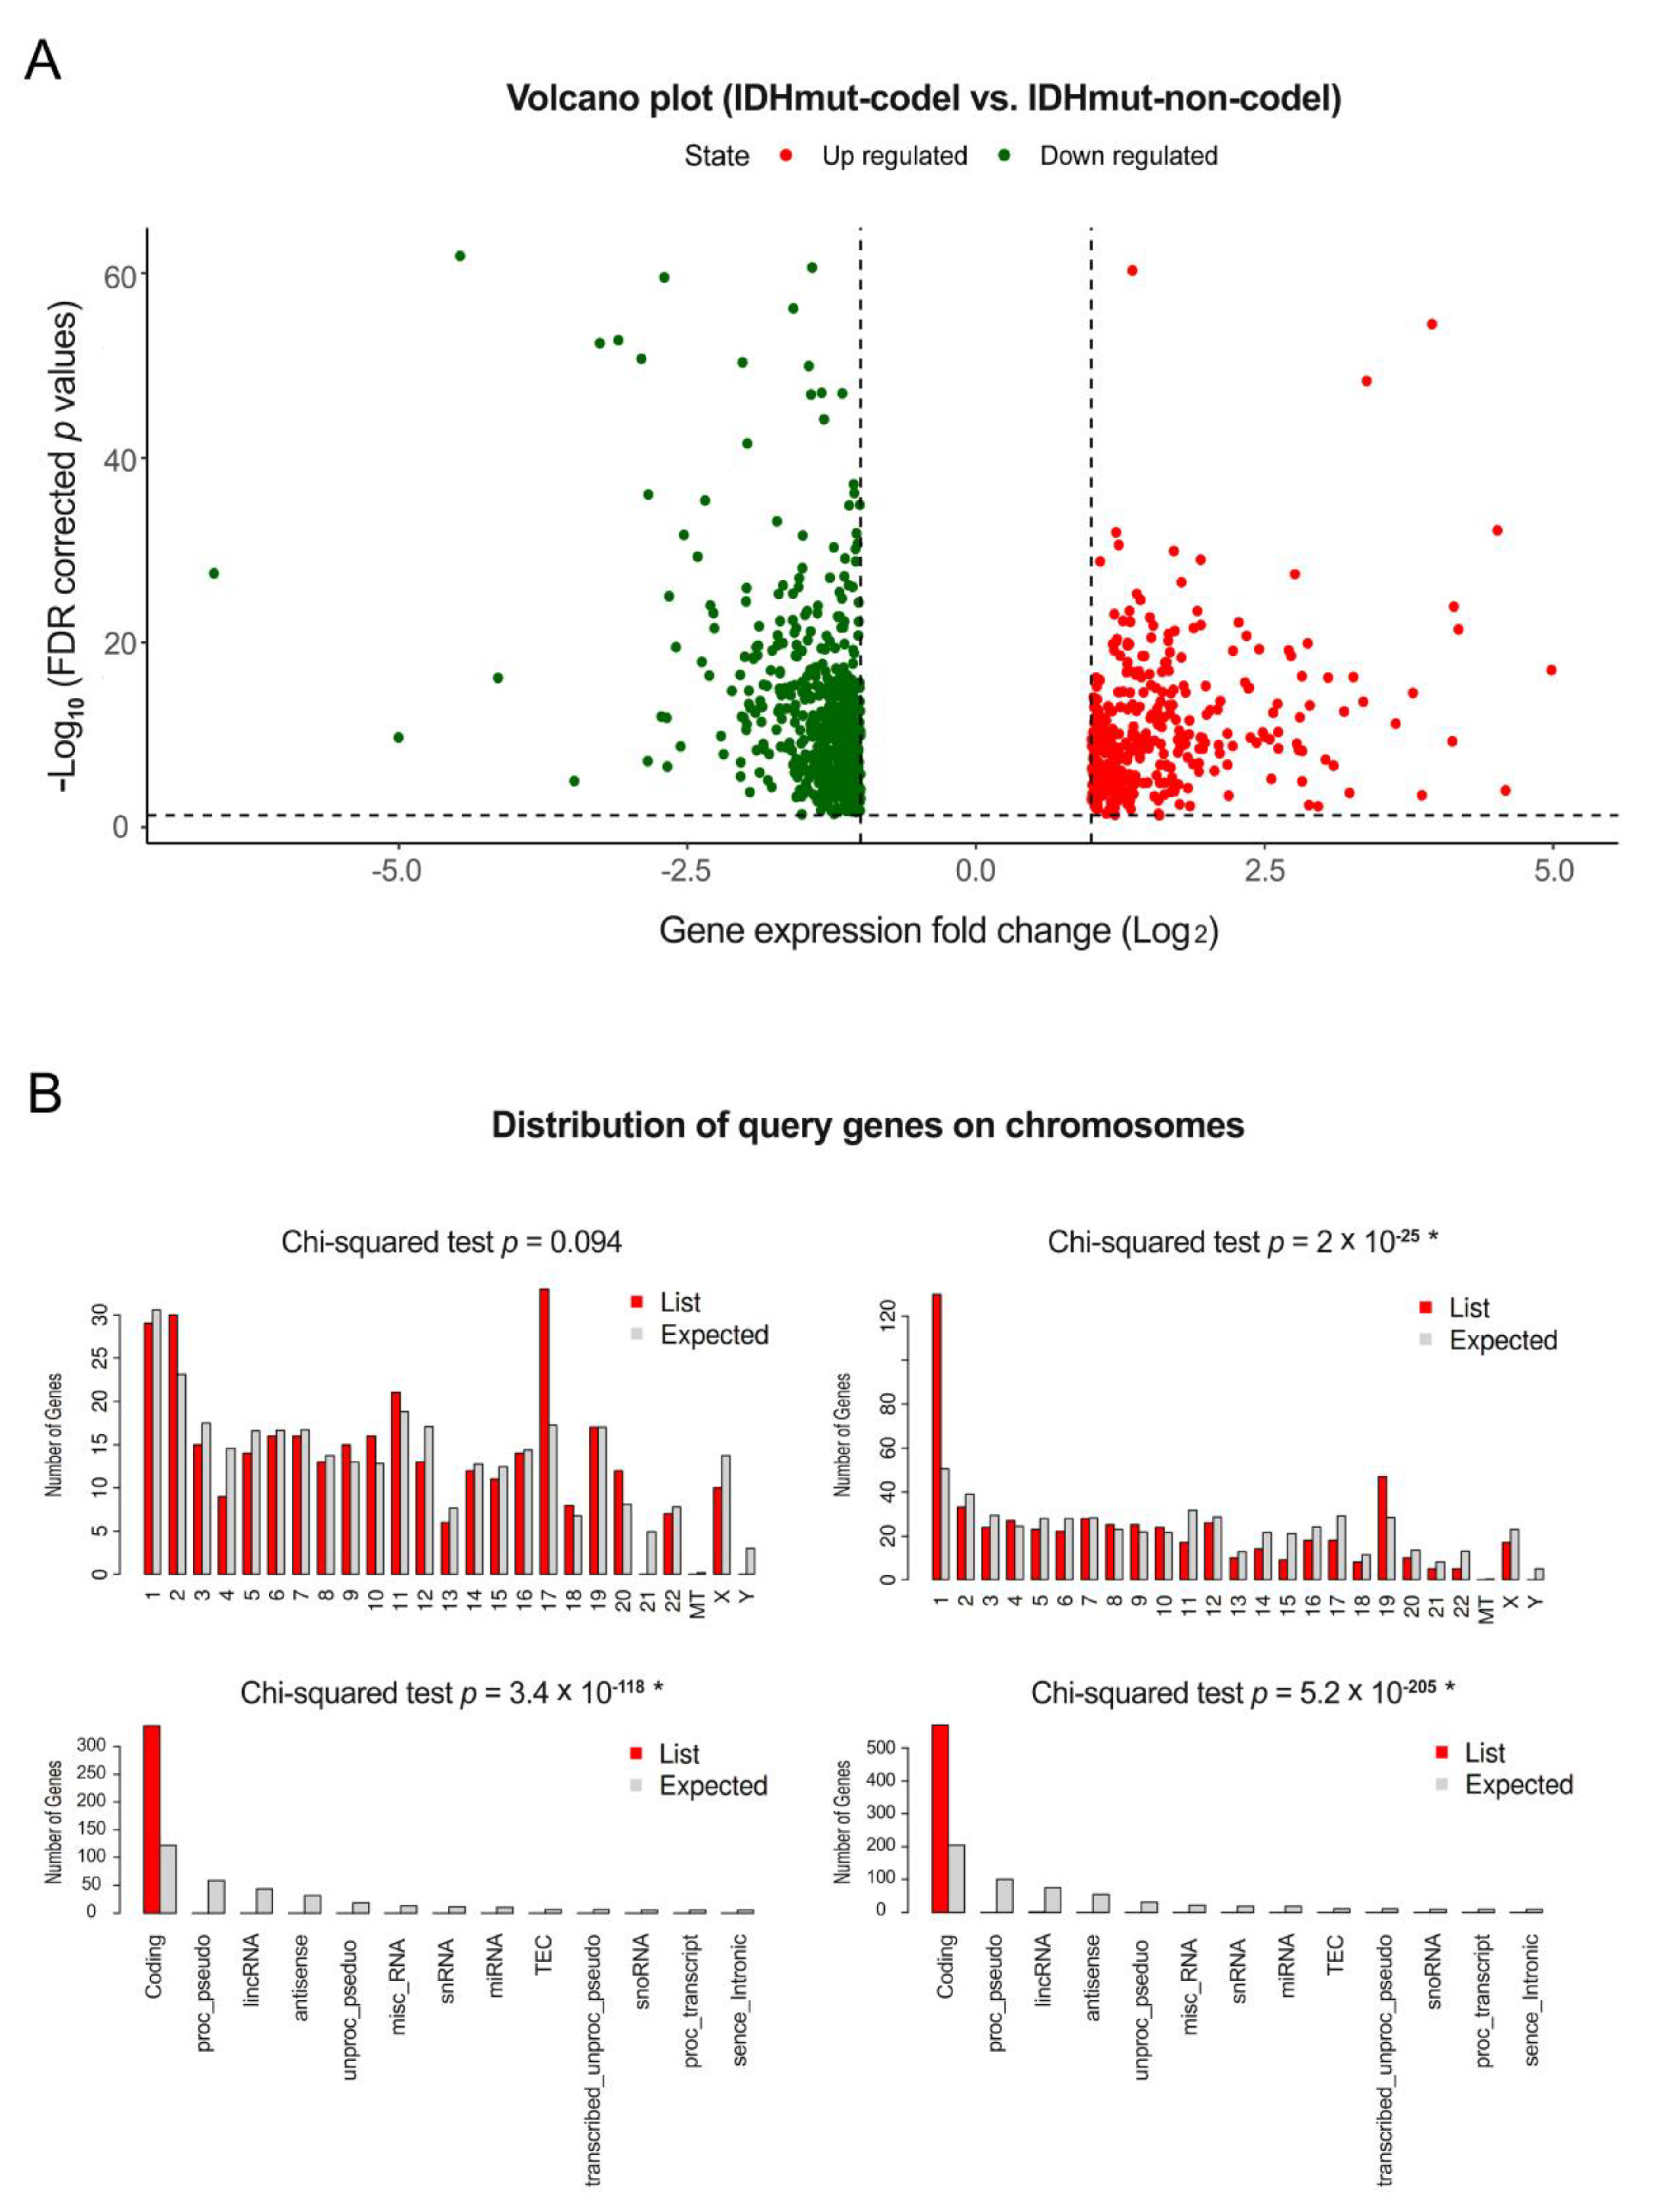
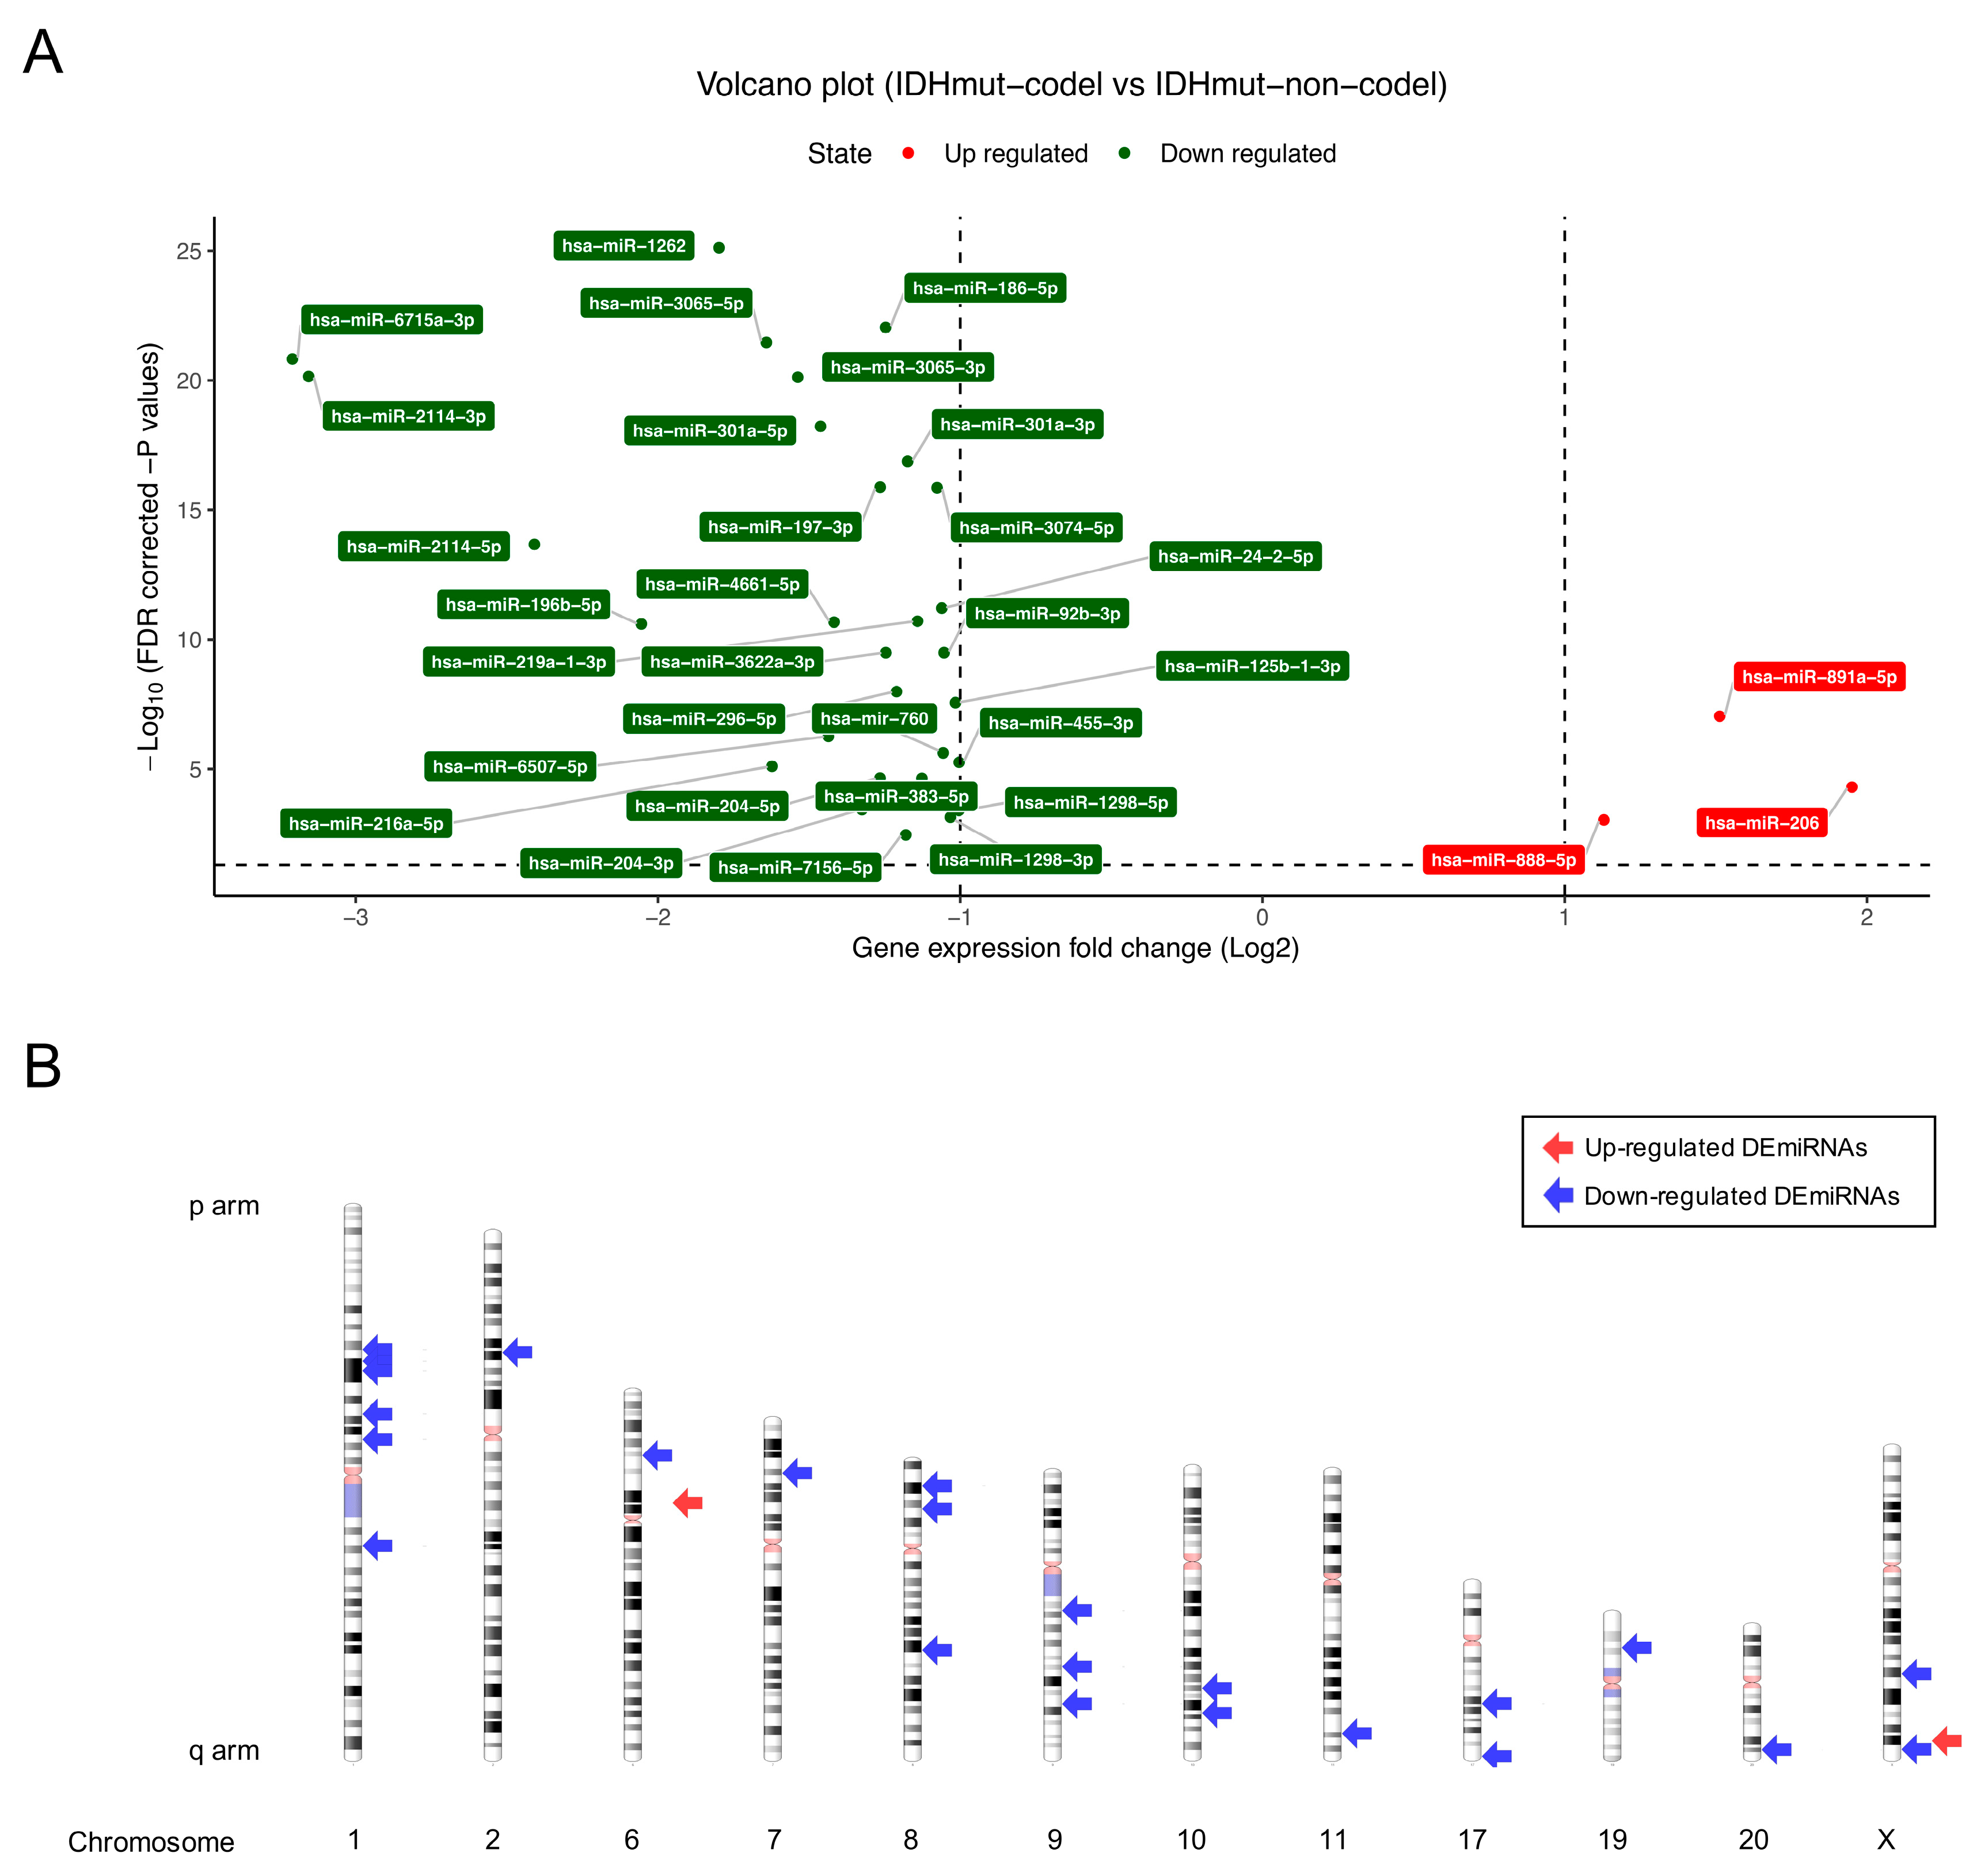
3.1. Differentially Expressed Gene Analysis of mRNAs, miRNAs, and ncRNAs

TCGA is the world’s largest cancer database and is supported by the National Cancer Institute (NCI) and the National Human Genome Research Institute (NHGRI). TCGA is a bounty of multi-omics data and clinical information, including genetic information for various cancers. In this study, the expression data of codingRNAs, ncRNAs, and miRNAs of a total of 168 OD patients from the TCGA lower grade glioma (LGG) database were analyzed. Most of these patients had IDH mutations, but only 127 patients had 1p/19q codeletions. We also performed differential expression analysis of codingRNAs, lncRNAs, and miRNAs according to fold change values and significance levels to identify the quantitative differences among genes. The distribution of DEcodingRNAs (Figure 1), DE lncRNAs, DEpseudogenes (Figure S1), and DEmiRNAs (Figure 2) was directly visualized using volcano plots and ideogram. There were 342 upregulated DEcodingRNAs and 573 downregulated DEcodingRNAs in IDH mutations with 1p/19q codeletions than in those with non-codeletions (Figure 1A). Next, we confirmed the types and positions of genes using ShinyGO. The types of all inputted DEcodingRNAs were codingRNAs, and downregulated codingRNAs were significantly distributed on chromosome 1 and 19 compared to the background data (Figure 1B). Although there was no statistically significant difference from the background data, many of the upregulated codingRNAs were relatively distributed on chromosome 17. Furthermore, 38 DElncRNAs and 7 DEpsuedogenes were upregulated, and many of these genes were relatively upregulated on chromosomes 6 and 17. Moreover, 42 DElncRNAs and 5 DEpseudogenes were downregulated and distributed on chromosomes 1 and 7 (Figure S1). We also detected 3 upregulated DEmiRNAs and 29 downregulated DEmiRNAs (Figure 2A). The upregulated miRNAs were distributed on chromosomes 6 and X. Many of the downregulated miRNAs were relatively distributed on chromosomes 1, 8, 9, 17, and X (Figure 2B). The upregulated DEmiRNAs of chromosome X (hsa-miR-888 and has-miR-891a) were located very closely together, therefore indicated by a single arrow in the Figure 2B. Downregulated DEmiRNAs which have 5p/3p pairs from same family (i.e., hsa-miR-204-5p/3p on chromosome 9, hsa-miR-301a-5p/3p, hsa-miR-3065-5p/3p on chromosome 17 and hsa-miR-1298-5p/3p, hsa-miR-2114-5p/3p on chromosome X) are also presented with single arrows in Figure 2B.

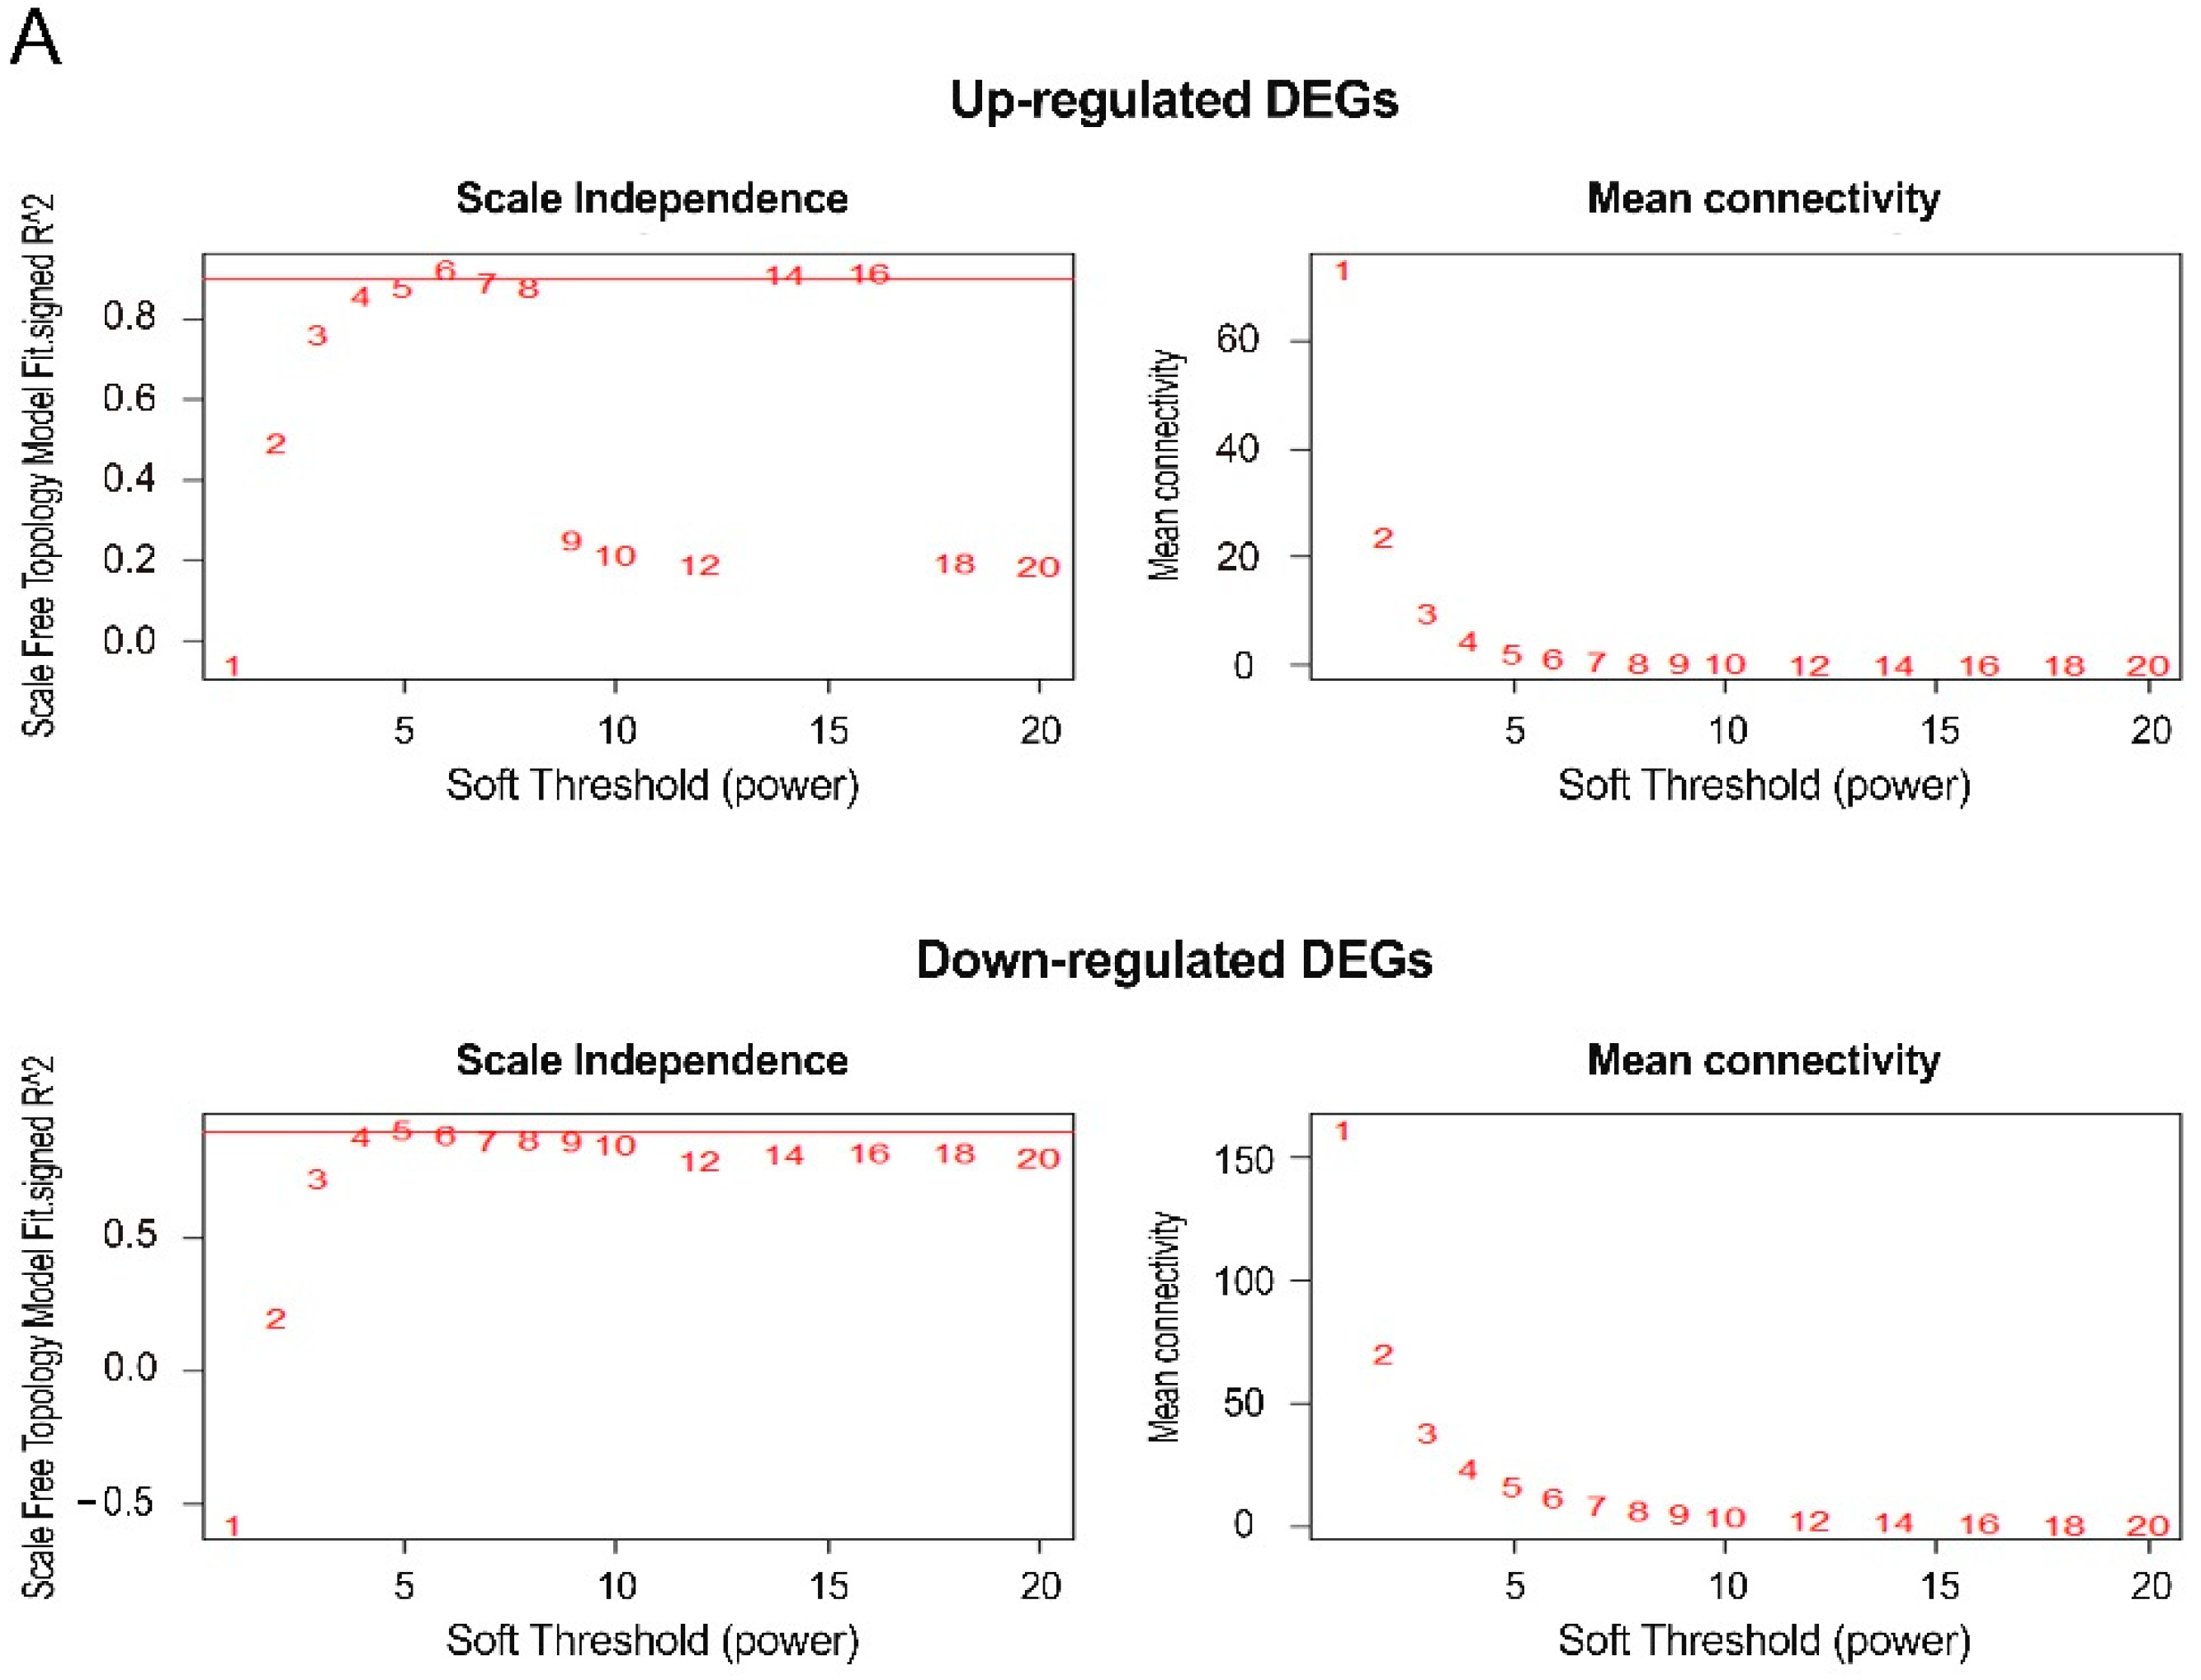
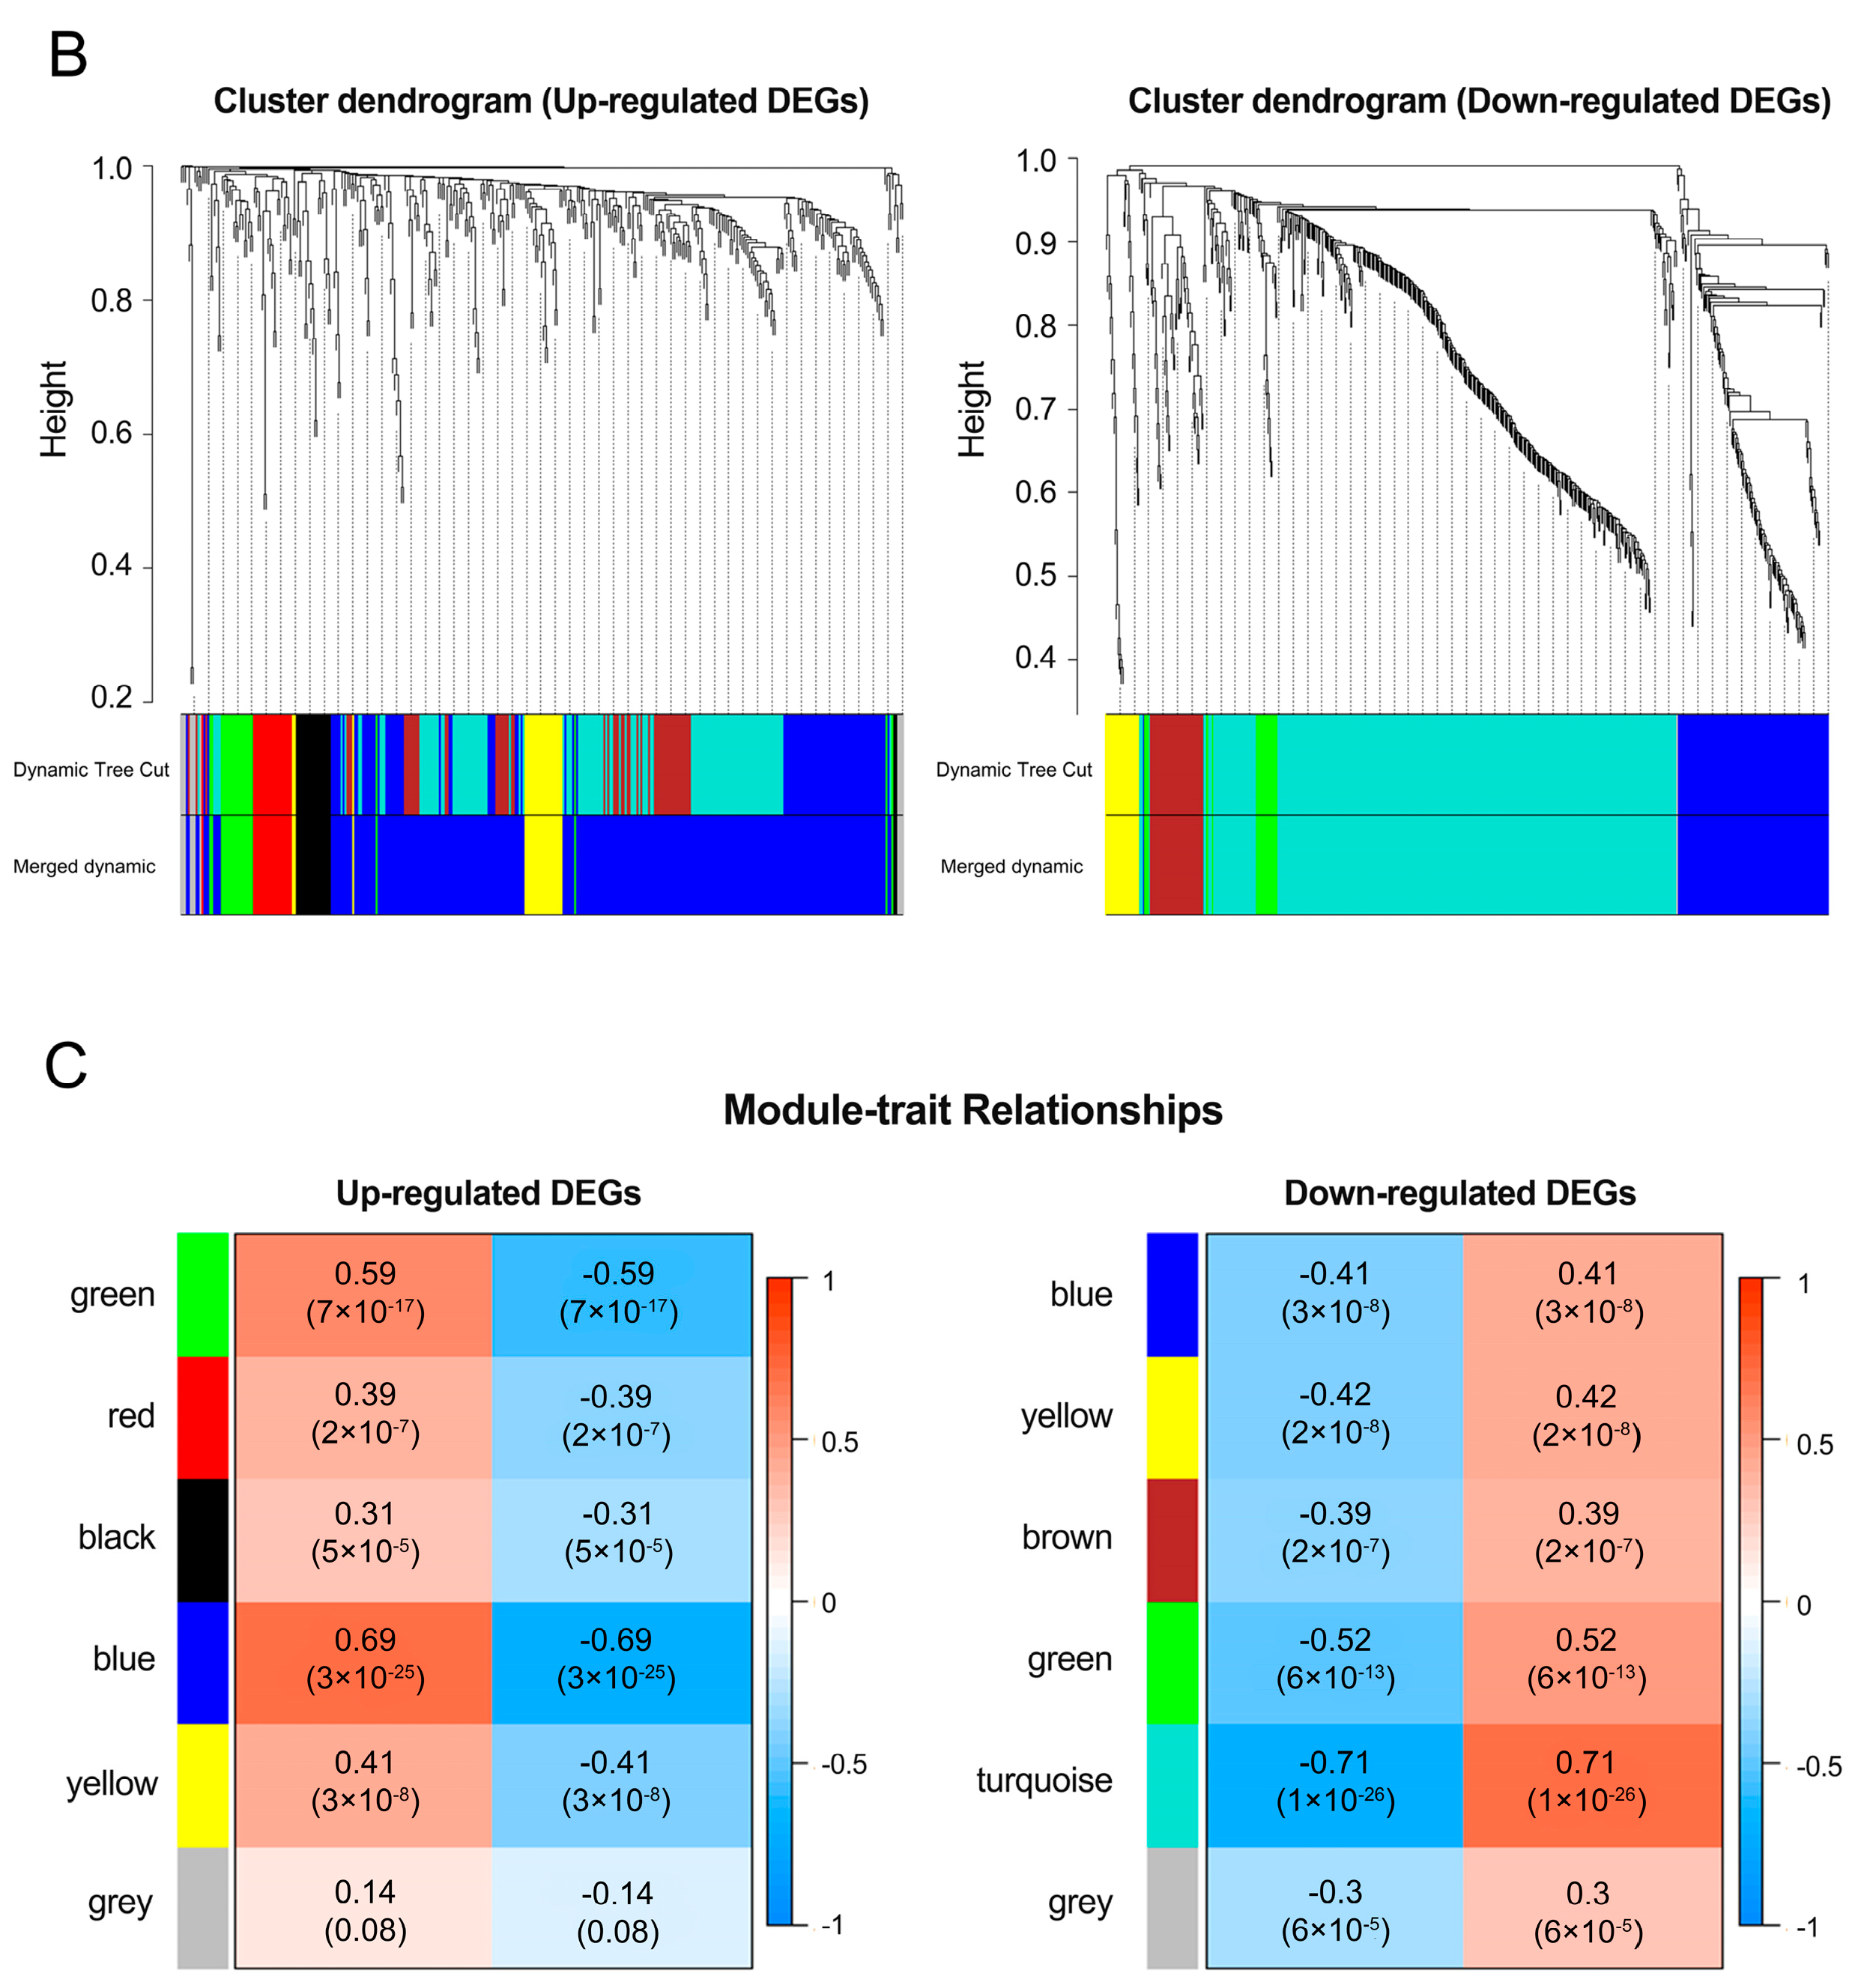
3.2. Analysis of a Weighted Co-Expression Network and Identification of Key Modules

For ncRNAs such as lncRNAs and pseudogenes to function as ceRNAs, coding RNAs within the ceRNA network is a potential regulatory target of ncRNAs, and the gene expressions of ncRNAs and coding RNAs are positively correlated. Weighted gene coexpression network analysis (WGCNA) can cluster highly correlated genes between DEcodingRNAs and DEncRNAs into the same module and identify significant candidate modules related to the clinical traits of cancer. We obtained a total of 915 DEcodingRNAs (342 upregulated and 573 downregulated) and 92 DEncRNAs (45 upregulated and 47 downregulated) from previous DEAs for constructing the coexpression network via WGCNA. In the first step of WGCNA, the soft-threshold power (β) from 1 to 20 was calculated considering scale independence and mean connectivity and was confirmed to be 4 in both network topology with upregulated and downregulated genes (Figure 3A). Next, we set 15 as the minimum module size and identified co-expression modules between DEcodingRNAs and DEncRNAs using dynamic cut tree. We also calculated the similarity and dissimilarity among modules to merge modules having extremely similar expression profiles. MEDissThres, the threshold for dissimilarity, was set as 0.3 and modules having high correlation >0.7 were merged into one (Figure S2). We finally obtained 6 modules each in the upregulated and downregulated co-expression network (Figure 3B) and assessed which modules correspond more with the clinical traits by evaluating the associations between the modules and clinical traits (Figure 3C). The results were that the blue module had the strongest positive relationship with the 1p/19q codeletion of IDH mutation in ODs, with a correlation value of 0.69 (left panel of Figure 3C); the turquoise module had the strongest negative relationship, with a value of −0.71 (right panel of Figure 3C).

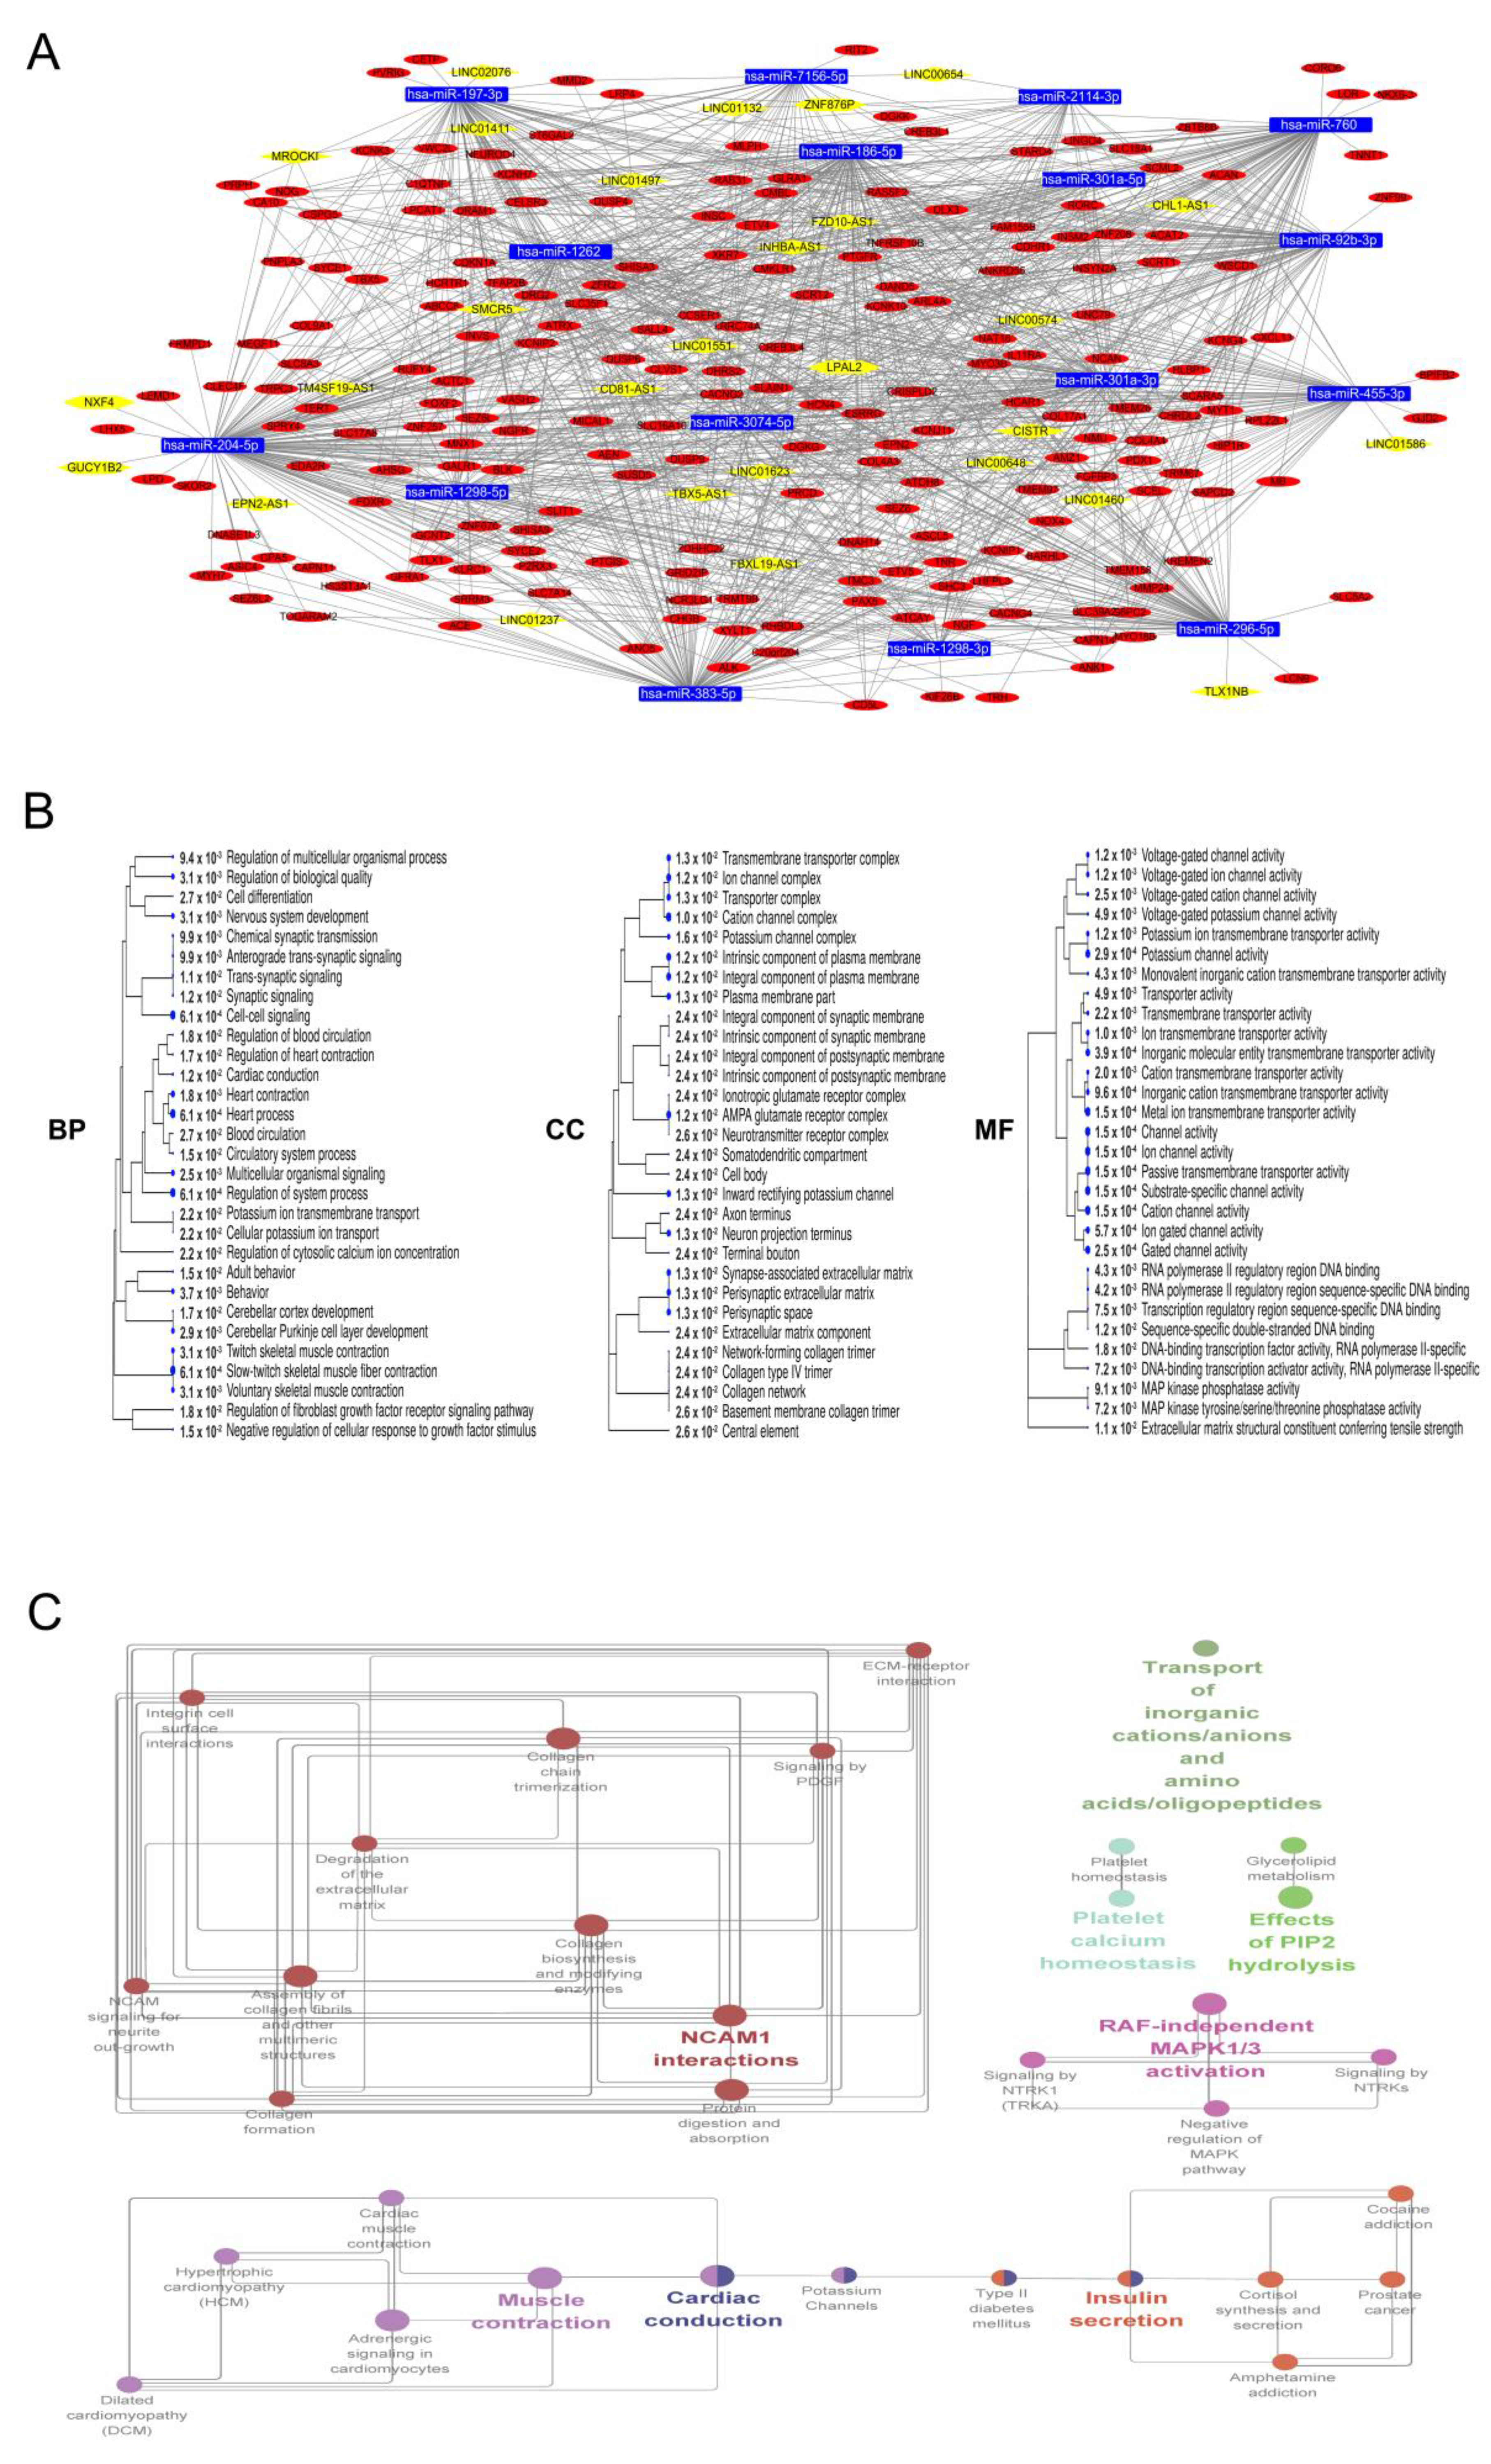
3.3. Construction of CeRNA Network and Prediction of Function in Oligodendroglioma

According to the ceRNA theory, ncRNAs competitively bind to miRNA response elements (MREs) of miRNA and act as positive regulators for the regulation of mRNA activity. Thus, we built 26 ceRNA networks such that DEmiRNAs matched with gene sets from the blue and turquoise modules. The target prediction of DEmiRNA was achieved using RNAInter, ENCORI (starBase v3.0), mirDIP, miRWalk, LncBase, and Tarbase. In the blue module, 24 downregulated DEmiRNAs interacted with 218 upregulated DEcodingRNAs, 24 upregulated DElncRNAs, and 4 upregulated DEpseudogenes. Furthermore, 2 upregulated DEmiRNAs were matched with 290 downregulated DEcodingRNAs, 6 downregulated DElncRNAs, and 2 downregulated DEpseudogenes from the turquoise module.
Next, we evaluated the ceRNA networks to select networks that better reflect clinical characteristics. Adjusted rand index (ARI) has been used as criterion to measure the similarity between two data partitions. An ARI value close to 1 indicates an almost perfect agreement, whereas a value of 0 indicates discordance between the partitions. Thus, we evaluated each gene set of DEcodingRNAs involved in 26 ceRNA networks using ARI; finally, 16 ceRNA networks having with an ARI of >0.6 remained from just the blue module, and these networks included 16 downregulated miRNAs, 209 upregulated codingRNAs, 24 lncRNAs, and 4 pseudogenes (Tables S1 and S2). We visualized these ceRNA networks using Cytoscape version 3.7.2 software (Figure 4A).
Subsequently, we performed Gene Ontology (GO) and KEGG analyses and the reactome pathway enrichment analysis using ShinyGo and ClueGO to clarify the potential functions of the ceRNA networks that may be involved in tumorigenesis and carcinogenesis (Figure 4B,C and Table S3).
The genes related to the ceRNA network were significantly enriched in nervous system development, cell-to-cell signaling, cell differentiation, neuron projection terminus, collagen network, MAP kinase phosphatase activity, DNA-binding transcription activator activity, and RNA polymerase II-specific processes (Figure 4B). Furthermore, enriched pathway terms were mainly associated with ECM–receptor interactions, RAF-independent MAPK1/3 activation, collagen biosynthesis and modifying enzymes, prostate cancer, platelet homeostasis, NCAM1 interactions, and signaling by NTRKs (Figure 4C). The results of the functional enrichment analyses suggested that these genes from the ceRNA network could participate in the tumorigenesis and development of OD with 1p/19q codeletion by regulating the related biological processes and key pathways.

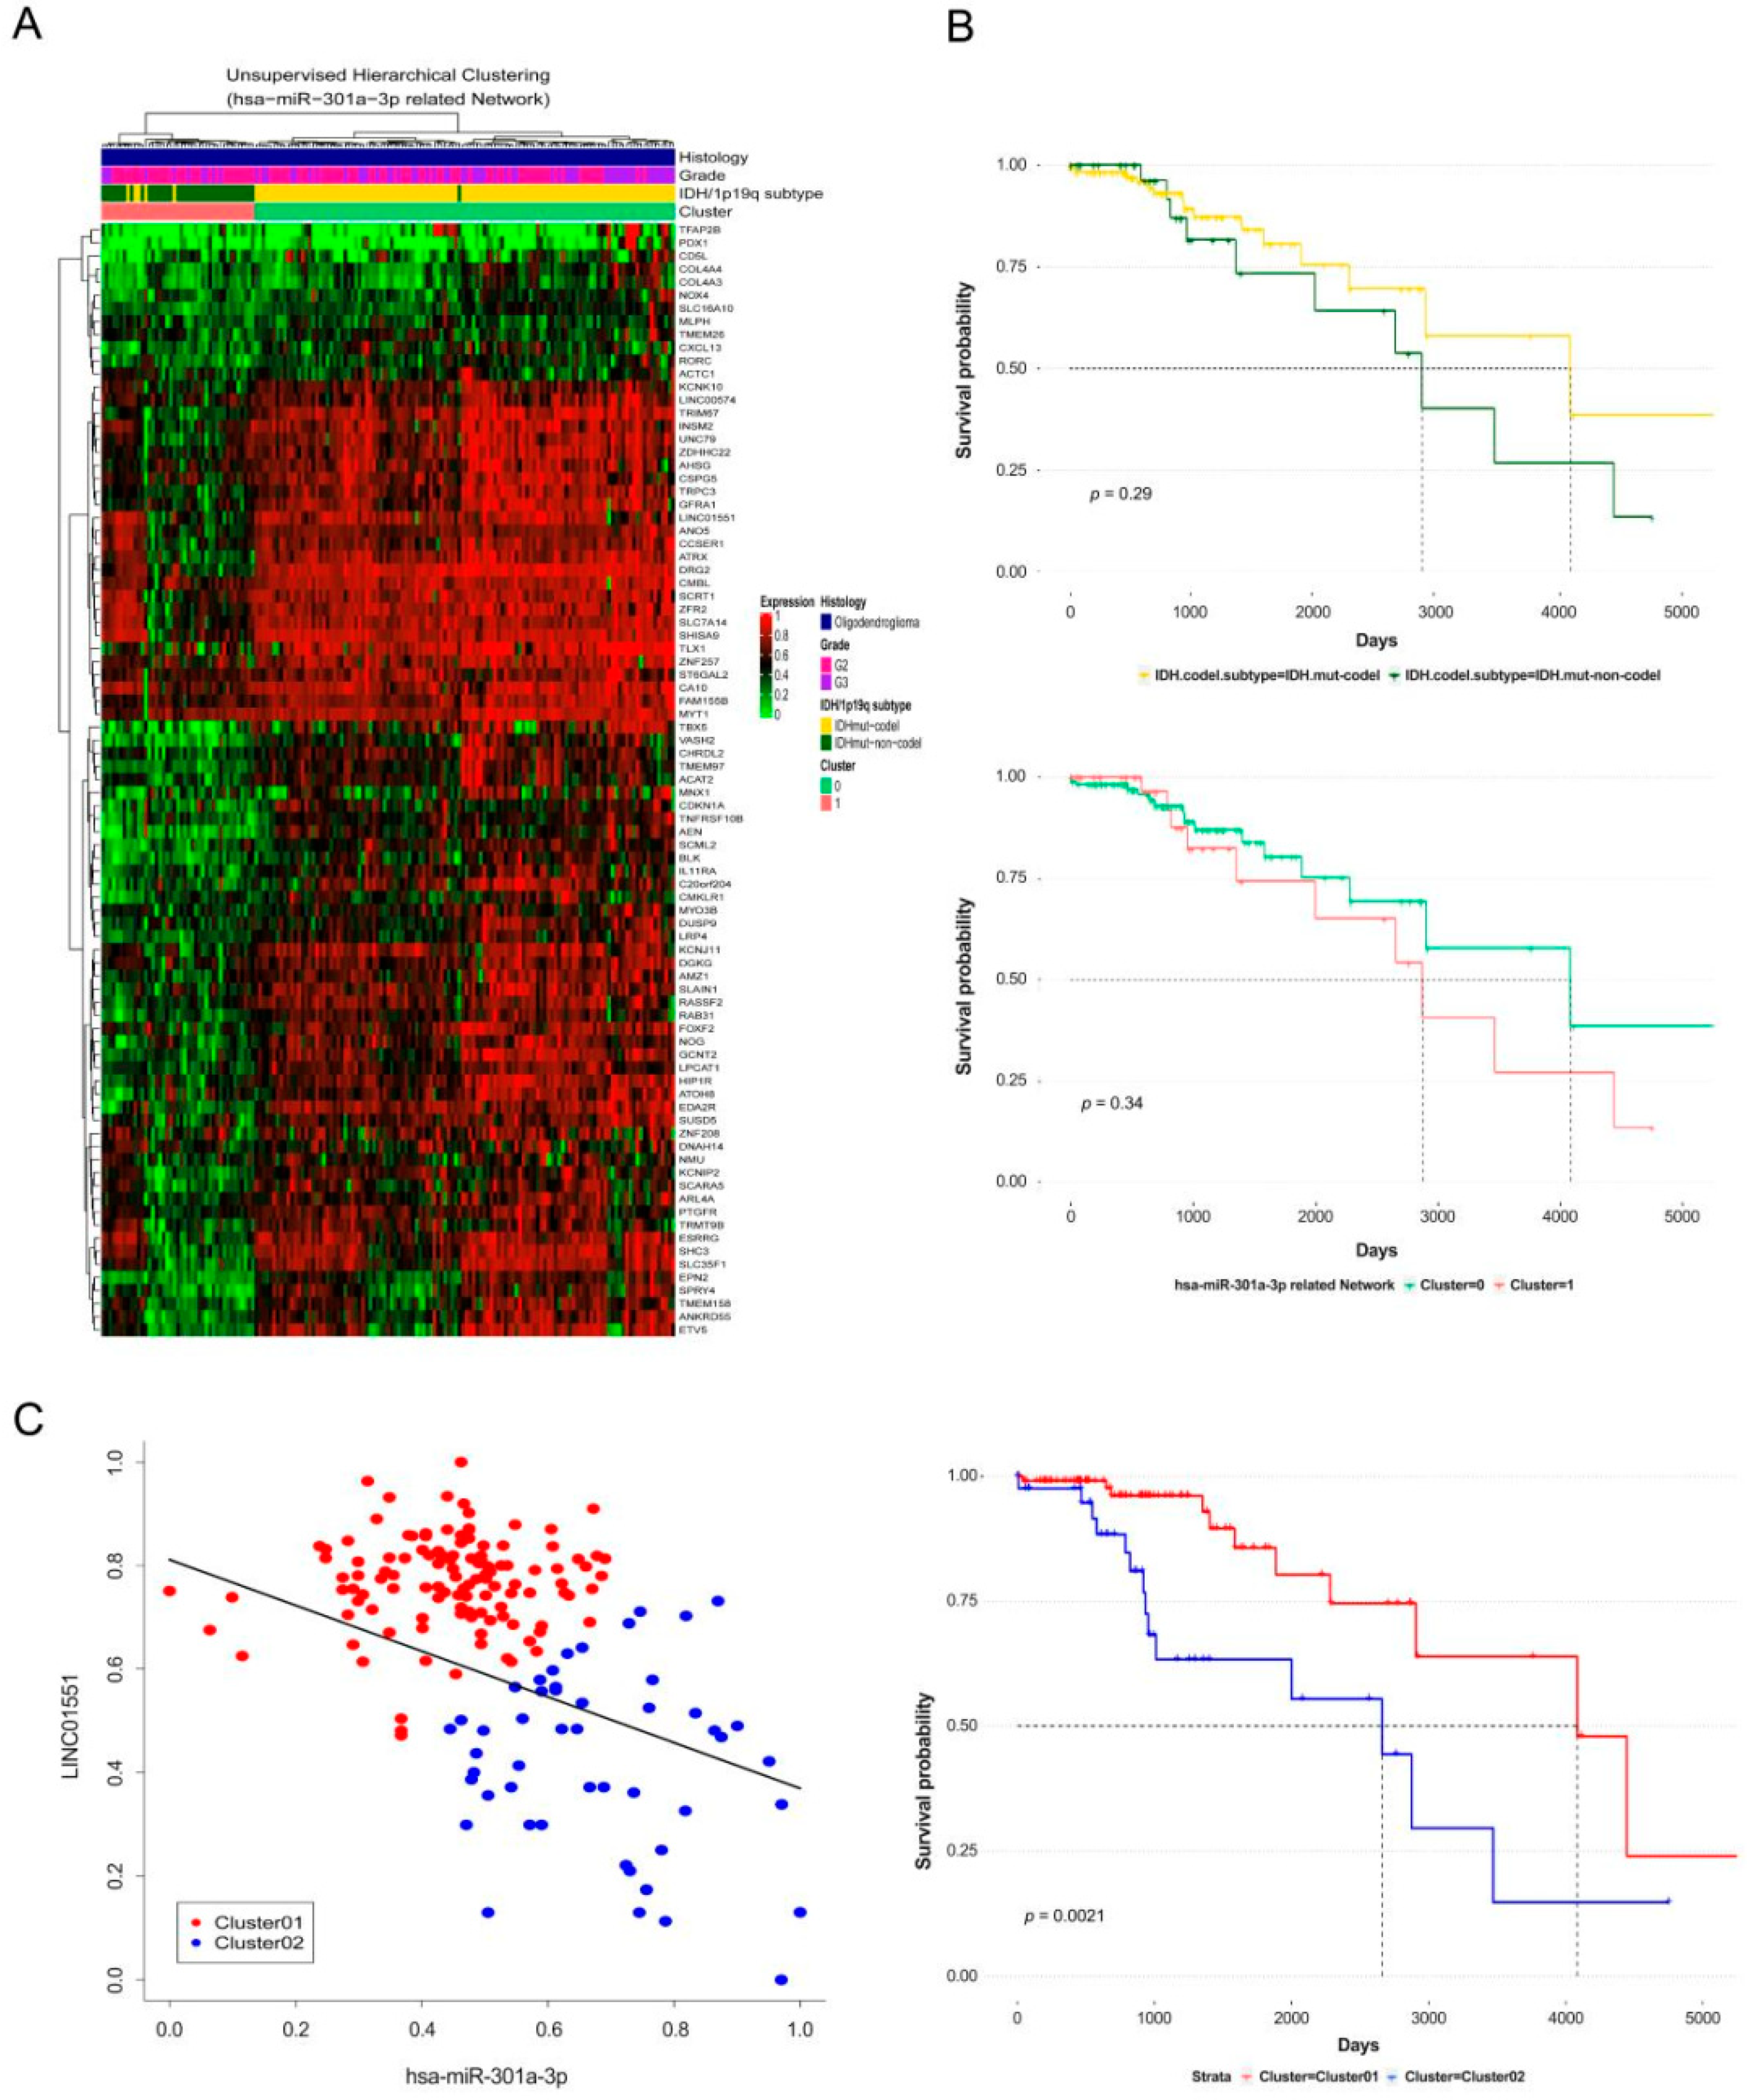
3.4. Extending the CeRNA Network to Lower Grade Gliomas and Verifying the Clinical Significance through Survival Analysis

Additionally, we assessed the ceRNA network using ARI in low glioma gliomas to determine the potential effects of ceRNA networks in other types of glioma cancers. The evaluation was based on 1p/19q codeletion, 1p/19q non-codeletion, and wildtype, and the results surprisingly confirmed that all ceRNA networks distinguish well between the 1p/19q codeletion and wildtype in lower grade gliomas (Table 1). This result indicates that the ceRNA network, according to the 1p/19q codeletion, distinguishes each subgroup well not only in OD but also in the entire lower grade glioma and that it has characteristics that can represent the biological differences among subgroups.
Next, we performed the OS analysis to confirm ceRNAs of clinical importance according to their expression levels in the ceRNA network. As the clinically important ceRNAs were expected to exhibit a strong negative relationship with target miRNAs, expected ceRNA levels were assessed for the correlation coefficient between miRNAs in each ceRNA network, and a value of less than −0.3 was selected. Subsequently, k-means were used to classify groups with high and low expression levels, and the OS of each group of patients in OD and lower grade glioma was compared (Table 2).
As a result, patients with IDH mutations in OD had different survivals according to the expression levels of lncRNA INHBA-AS1 and LINC01551. This is a clinically meaningful result considering that the 1p/19q codeletion group and the non-codeletion group were not statistically significantly divided in terms of the data of patients with OD with IDH mutation. In addition, in the data of patients extended to lower grade glioma, a higher number of non-coding RNAs in the ceRNA network showed a difference in OS rate according to the expression level (Table 2). In particular, the ceRNA network containing LINC01551 and hsa-miR-301a-3p similarly classified subgroups of 1p/19q from both OD and lower glioma including wildtype compared to the actual subgroup (Figure 5A,B and Figure S3A,B). In addition, the survival rate according to the expression level of LINC01551 was also significantly different in both OD and lower grade glioma patients (Figure 5C and Figure S3C).

4. Discussion

Based on the WHO classification and various research reports, the 1p/19q codeletion is used as a prognostic biomarker [53]. Some parts of genes related to the 1p/19q codeletion can promote tumor progression, but in many cases, this is a positive prognostic indicator not only for OD but also for glioma [8,11]. Recently, the functional studies on ncRNA, which are expected to play a role in ceRNA, are being conducted, and important roles of ncRNAs in various biological processes have been reported in studies related to tumorigenesis and metastasis [26,27,28]. In studies on gliomas, various studies on ncRNAs that are expected to play a role as ceRNAs, including lncRNA, are in progress, but no studies on 1p/19q have been reported. Therefore, a better understanding of the effect of 1p/19q codeletion on OD will be of great help to an improved understanding of treatment and cancer progression in OD as well as overall glioma.
Based on the ceRNA hypothesis, a total of 16 mRNA–lncRNA–miRNA networks reflecting 1p/19q codeletion characteristics were constructed, and 16 miRNAs, 209 mRNAs, and 28 ncRNAs were mapped in our study. The ceRNA network we discovered was evaluated using ARI, and the network is very similar to the classification of the actual subgroup indicated in the clinical data of the actual TCGA data and reflects its characteristics well (Table S1).
We performed the GO and KEGG/reactome pathway analyses to identify the biological processes and molecular functions of ncRNA in the ceRNA network and revealed features that can play a pivotal role in tumorigenesis (Figure 4B,C).
The results of the GO and pathway enrichment analyses were enriched in terms related to ion channel activity, insulin secretion, and MAP kinase phosphatase activity as well as extracellular matrix (ECM)-related terminologies such as ECM degradation, collagen network, etc.
Potassium ion channels are known as cancer hallmarks and play roles in the evasion of apoptosis, proliferation, and invasion by their potential to alter membrane polarization [54,55,56]. Two-pore domain (K2P) potassium channels enable the resting currents of potassium ions. KCNK1, KCNK3, and KCNK10 are substrate genes of the two-pore-domain (K2P) potassium channel family and are differentially distributed in the CNS and are known to be involved in neuronal functional maintenance and modulation [57,58]. In a related study, KCNK1, KCNK3, and KCNK10 were significantly downregulated in brain glioblastoma (GBM) [59]. In particular, the expression of KCNK1 was decreased more in cancers of the overall CNS—such as astrocytomas (AC), GBMs, ODs, medulloblastomas, and melanomas—than in the normal tissue. Additionally, ATP-sensitive potassium channels, which comprise pore-forming subunit (Kir6.2) and regulatory sulfonylurea receptors (SUR1), are known to control the glucose-stimulated release of insulin. In our research, several genes, such as ABCC8 and KCNJ11, related to insulin and diabetes and encoding Kir6.2 and SUR1 have also been found in the ceRNA network.
The repression of Kir6.2/SUR1 channels stimulates the release of insulin [60], and it has been reported that mutations and deficiencies of ABCC8 and KCNJ11 induce hyperinsulinism [61,62,63,64,65]. In various studies and clinical reports, the hypersecretion of insulin has been linked to the development of several types of cancer, including breast, colon, liver, and kidney cancers [66,67], and the survival rates through GEPIA in our research also confirmed that higher the expression levels of the two genes, the better is the survival rate (Figure S4A). These genes were relatively upregulated as per the results of our study, and these results suggest that potassium channels play important roles in the brain tumor microenvironments related to proliferation, apoptosis, and migration; this can be one of the survival advantages of the 1p/19q codeletion in gliomas.
The ECM is composed of diverse biochemical components including collagens and glycoproteins such as tenascins. The tumor microenvironment, including the ECM, is subject to changes in various biological conditions—including the structure, content, and distribution—during most of the cancer development duration and progression, unlike that in normal cells [68]. Tenascins are a family of multioligomeric glycoproteins that are primarily expressed in the CNS, and these are known as one of the ECM components participating in cell adhesion, migration, development, and proliferation. Tenascins normally exist in the hexameric form, such as tenascin-C (TNC), tenascin-X (TNX), and tenascin-W (TNW), or in the trimeric form, such as tenascin-R (TNR). TNC is overexpressed in malignant gliomas such as high grade astrocytomas and glioblastomas and promotes the invasion of malignant gliomas [69,70,71]. In contrast, TNR is highly expressed in normal oligodendrocytes, neurons, and non-invasive gliomas such as pilocytic astrocytic tumors, but its expression decreases in malignant astrocytoma [72]. Interestingly, the high expression of TNR gene has been observed in ODs with a high grade in this report, and the expression of TNR is upregulated in OD having a 1p/19q codeletion. Thus, we performed survival analysis using GEPIA and confirmed that the higher the expression level of TNR the better is the survival rate in OD patients (Figure S4A). Moreover, in a recent study, the expression of TNR was reported as a new prognostic marker for GBM using machine learning [73].
The invasion process of cancer involves the degradation of these ECM components by matrix metalloproteinases (MMP) as well [74]. MMP24 is a gene encoding matrix metalloproteinase-24 and has recently been reported to negatively regulate the aggressiveness of cancer cells in breast cancer as a target gene of yes-associated protein (YAP) [75].
In a previous study on glioma, the expression of MMP24 was high in brain tumors and was reportedly to related to tumor progression [76], but the available data for MMP24 in later study seemed to be contradictory [77]. The interpretation of our findings on MMP24 was also challenging. The expression of MMP24 was observed to be high in GBM and OD, similar to that reported in previous studies, but patients with a high level of MMP24 had better survival in OD (Figure S4A). For these reasons, further studies on MMP24 in glioma are needed.
In addition, SLC8A2, which is a member of the solute carrier family 8, is a tumor suppressor gene of GBM [78] and shows a difference in the survival rate, according to the expression level in OD of TCGA. SLC8A3 from our findings also exhibited the same pattern in expression and survival rate as SLC8A2 in OD of TCGA, but the related reports are still insufficient and further studies need to be conducted.
Kaplan–Meier survival analysis was performed to investigate the clinical characteristics in the ceRNA network we discovered. The k-means analysis was performed based on the gene set of the mRNA contained in the ceRNA to divide the unsupervised subgroups and then compare survival rates with actual subgroups. The results were confirmed to be similar to the survival rate according to the clinical information of actual TCGA OD patients with IDH mutations. Characteristically, the difference in survival rate among patients according to actual 1p/19q codeletion subtypes in the OD data of TCGA was not statistically significantly separated, but a difference of survival rate in the group as per the expression level of ceRNA was divided (Figure 5). The results indicate that the expression pattern of the gene depending on the 1p/19q codeletion is an important factor that greatly influences the survival and prognosis of patients with glioma. In addition, the Kaplan–Meier survival analysis was performed by classifying the expression level of ncRNA compared to that of miRNA into high and low expression groups (Figure 5C), and we found clinically important ncRNAs within the ceRNA network (Table 2). Based on these results, we wanted to extend the characteristics identified in OD to lower grade glioma and confirm valid results. The excavated ceRNA networks classified the subgroups of lower grade glioma to the correct level (Figure S3A,B) and showed a difference in the survival rate (Figure S3C), which have applicable potential to demonstrate a fairly similar pattern and biological influence derived from the 1p/19q codeletion in the development and progression of glioma (Figure S3). Additionally, we analyzed the clinical key roles of expected ncRNAs in the ceRNA network and confirmed diverse potentials, which highlighted few limitations of this study (Table 2). Although a previous report on hepatocellular carcinoma indicated that LINC01551 promotes tumorigenesis [79], the result of LINC01551 belonging to the ceRNA network related to hsa-miR-301a-3p was clinically positive in our study. Furthermore, the comparison results of gene expression among the subtype of lower grade glioma through GEPIA, the expression amount of LINC01551 in OD, was more similar to that of normal brain tissue than to that of other subtypes (Figure S5A). hsa-miR-301a-3p, which was downregulated in our study, promotes the invasion of glioma, and these results are supported by the findings of our previous research [80,81]. INHBA-AS1 had mostly negative reports in tumorigenesis [82], but the results were the same as those for LINC01551 in our study with OD with IDH mutations (Figure S5A).
In addition, in the results of an expanded study on lower grade glioma, more statistically significant genes were found. There were reports with findings consistent with those of ours on hsa-miR-1262, hsa-miR-455-3p, LPAL2 [83,84,85,86], and some reports even contradicted our findings on hsa-miR-204-5p and hsa-miR-197-3p [87,88]. Although related studies are still insufficient, the previous report about hsa-miR-186-5p in glioblastoma contradicted our findings [89]. Interestingly, the survival pattern of LINC01551 and INHBA-AS1 related to this miRNA also were different in astrocytoma (Figure 5C and Figure S5B). This compelled us to think about the possibility of producing different results for each cancer cell type, even subtypes. In our study, this means that the expression of the same gene may have different biological effects as per the cancer subtype.

5. Conclusions

Genes participating in the ceRNA network in OD can provide different tumor microenvironments via potassium ion channels and composition changes in ECM, and these may cause differences in survival due to the 1p/19q codeletion. Our study also demonstrates that subtypes of glioma have a high IDH mutation frequency and that these are known to improve survival and exhibit similar traits; however, different effects can be derived from the same gene, and this would result in survival differences in different subtypes such as ODs and astrocytomas. However, our study is based on in silico analysis with limited knowledge about the in vivo expressions and functions of many lncRNAs against endogenous mRNA. Thus, further vigorous studies are required to validate this finding with in vivo and in vitro experiments in the near future.

Supplementary Materials

The following are available online at https://www.mdpi.com/2072-6694/12/9/2543/s1, Figure S1: Volcano plot and distribution of gene on chromosomes for DEncRNAs between OD 1p/19q codeletion group and non-codeletion group, Figure S2: Dendrogram for merging modules by dynamic tree cut algorithm, Figure S3: Expanded evaluation of ceRNA network through by unsupervised clustering and comparing survival to actual LGG patients from TCGA database, Figure S4: Kaplan–Meier survival plot on ABCC8, KCNJ11, MMP24, TNR in OD patients, Figure S5: Compare to expression and survival rate on INHBA-AS1, LINC01151 per glioma subtypes, Table S1: ceRNA network evaluated by ARI using target coding genes, Table S2: Gene list from ceRNA network, Table S3: Results of GO and pathway analysis.

Author Contributions

J.W.A., Y.P., and J.L. contributed to the study conceptualization, study analysis; manuscript writing with the feedback from K.K.; J.W.A., and Y.P. processed genome data curation for public data base and performed bioinformatic analyses; S.J.K. assisted in visualization and genome data curation; S.J.H., K.G.C. contributed to clinical data interpretation; J.L. and K.K. supervised the entire project and approved the final manuscript submission. All authors have read and agreed to the published version of the manuscript.

Funding

Basic Science Research Program through the National Research Foundation of Korea (NRF), funded by the Korea Government (MSIT) (grant no. NRF-2018R1C1B5086460).

Acknowledgments

The authors thank National Research Foundation of Korea (NRF). The authors thank Sohyun Kim and Thomas J. Kwack for the review and editing of the manuscript.

Conflicts of Interest

The authors declare no conflict of interest.

References

  1. Song, X.; Zhang, N.; Han, P.; Moon, B.S.; Lai, R.K.; Wang, K.; Lu, W. Circular RNA profile in gliomas revealed by identification tool UROBORUS. Nucleic Acids Res. 2016, 44, e87. [Google Scholar] [CrossRef]
  2. Xu, Y.; Geng, R.; Yuan, F.; Sun, Q.; Liu, B.; Chen, Q. Identification of differentially expressed key genes between glioblastoma and low-grade glioma by bioinformatics analysis. PeerJ 2019, 7, e6560. [Google Scholar] [CrossRef]
  3. Wesseling, P.; van den Bent, M.; Perry, A. Oligodendroglioma: Pathology, molecular mechanisms and markers. Acta Neuropathol. 2015, 129, 809–827. [Google Scholar] [CrossRef] [Green Version]
  4. Ostrom, Q.T.; Cioffi, G.; Gittleman, H.; Patil, N.; Waite, K.; Kruchko, C.; Barnholtz-Sloan, J.S. CBTRUS statistical report: Primary brain and other central nervous system tumors diagnosed in the United States in 2012–2016. Neuro Oncol. 2019, 21, v1–v100. [Google Scholar] [CrossRef]
  5. Iuchi, T.; Sugiyama, T.; Ohira, M.; Kageyama, H.; Yokoi, S.; Sakaida, T.; Hasegawa, Y.; Setoguchi, T.; Itami, M. Clinical significance of the 2016 WHO classification in Japanese patients with gliomas. Brain Tumor Pathol. 2018, 35, 71–80. [Google Scholar] [CrossRef]
  6. Labussiere, M.; Idbaih, A.; Wang, X.W.; Marie, Y.; Boisselier, B.; Falet, C.; Paris, S.; Laffaire, J.; Carpentier, C.; Criniere, E.; et al. All the 1p19q codeleted gliomas are mutated on IDH1 or IDH2. Neurology 2010, 74, 1886–1890. [Google Scholar] [CrossRef]
  7. Azar, S.; Leventoux, N.; Ripoll, C.; Rigau, V.; Goze, C.; Lorcy, F.; Bauchet, L.; Duffau, H.; Guichet, P.O.; Rothhut, B.; et al. Cellular and molecular characterization of IDH1-mutated diffuse low grade gliomas reveals tumor heterogeneity and absence of EGFR/PDGFRalpha activation. Glia 2018, 66, 239–255. [Google Scholar] [CrossRef]
  8. Li, Y.X.; Shi, Z.; Aibaidula, A.; Chen, H.; Tang, Q.; Li, K.K.; Chung, N.Y.; Chan, D.T.; Poon, W.S.; Mao, Y.; et al. Not all 1p/19q non-codeleted oligodendroglial tumors are astrocytic. Oncotarget 2016, 7, 64615–64630. [Google Scholar] [CrossRef]
  9. Jenkins, R.B.; Blair, H.; Ballman, K.V.; Giannini, C.; Arusell, R.M.; Law, M.; Flynn, H.; Passe, S.; Felten, S.; Brown, P.D.; et al. A t(1;19)(q10;p10) mediates the combined deletions of 1p and 19q and predicts a better prognosis of patients with oligodendroglioma. Cancer Res. 2006, 66, 9852–9861. [Google Scholar] [CrossRef] [Green Version]
  10. Li, S.; Yan, C.; Huang, L.; Qiu, X.; Wang, Z.; Jiang, T. Molecular prognostic factors of anaplastic oligodendroglial tumors and its relationship: A single institutional review of 77 patients from China. Neuro Oncol. 2012, 14, 109–116. [Google Scholar] [CrossRef] [Green Version]
  11. Gladitz, J.; Klink, B.; Seifert, M. Network-based analysis of oligodendrogliomas predicts novel cancer gene candidates within the region of the 1p/19q co-deletion. Acta Neuropathol. Commun. 2018, 6, 49. [Google Scholar] [CrossRef] [PubMed] [Green Version]
  12. Cairncross, J.G.; Wang, M.; Jenkins, R.B.; Shaw, E.G.; Giannini, C.; Brachman, D.G.; Buckner, J.C.; Fink, K.L.; Souhami, L.; Laperriere, N.J.; et al. Benefit from procarbazine, lomustine, and vincristine in oligodendroglial tumors is associated with mutation of IDH. J. Clin. Oncol. 2014, 32, 783–790. [Google Scholar] [CrossRef] [PubMed] [Green Version]
  13. Clark, V.E.; Cahill, D.P. Extent of resection versus molecular classification: What matters when? Neurosurg. Clin. N. Am. 2019, 30, 95–101. [Google Scholar] [CrossRef]
  14. Dubbink, H.J.; Atmodimedjo, P.N.; Kros, J.M.; French, P.J.; Sanson, M.; Idbaih, A.; Wesseling, P.; Enting, R.; Spliet, W.; Tijssen, C.; et al. Molecular classification of anaplastic oligodendroglioma using next-generation sequencing: A report of the prospective randomized EORTC Brain Tumor Group 26951 phase III trial. Neuro Oncol. 2016, 18, 388–400. [Google Scholar] [CrossRef]
  15. Wijnenga, M.M.J.; French, P.J.; Dubbink, H.J.; Dinjens, W.N.M.; Atmodimedjo, P.N.; Kros, J.M.; Smits, M.; Gahrmann, R.; Rutten, G.J.; Verheul, J.B.; et al. The impact of surgery in molecularly defined low-grade glioma: An integrated clinical, radiological, and molecular analysis. Neuro Oncol. 2018, 20, 103–112. [Google Scholar] [CrossRef] [Green Version]
  16. Van der Voort, S.R.; Incekara, F.; Wijnenga, M.M.J.; Kapas, G.; Gardeniers, M.; Schouten, J.W.; Starmans, M.P.A.; Nandoe Tewarie, R.; Lycklama, G.J.; French, P.J.; et al. Predicting the 1p/19q codeletion status of presumed low-grade glioma with an externally validated machine learning algorithm. Clin. Cancer Res. 2019, 25, 7455–7462. [Google Scholar] [CrossRef] [Green Version]
  17. Djebali, S.; Davis, C.A.; Merkel, A.; Dobin, A.; Lassmann, T.; Mortazavi, A.; Tanzer, A.; Lagarde, J.; Lin, W.; Schlesinger, F.; et al. Landscape of transcription in human cells. Nature 2012, 489, 101–108. [Google Scholar] [CrossRef]
  18. Wang, C.J.; Zhu, C.C.; Xu, J.; Wang, M.; Zhao, W.Y.; Liu, Q.; Zhao, G.; Zhang, Z.Z. The lncRNA UCA1 promotes proliferation, migration, immune escape and inhibits apoptosis in gastric cancer by sponging anti-tumor miRNAs. Mol. Cancer 2019, 18, 115. [Google Scholar] [CrossRef] [Green Version]
  19. Balas, M.M.; Johnson, A.M. Exploring the mechanisms behind long noncoding RNAs and cancer. Noncoding RNA Res. 2018, 3, 108–117. [Google Scholar] [CrossRef]
  20. Hu, X.; Yang, L.; Mo, Y.Y. Role of pseudogenes in tumorigenesis. Cancers 2018, 10, 256. [Google Scholar] [CrossRef] [Green Version]
  21. Wright, M.W.; Bruford, E.A. Naming ‘junk’: Human non-protein coding RNA (ncRNA) gene nomenclature. Hum. Genom. 2011, 5, 90–98. [Google Scholar] [CrossRef] [Green Version]
  22. Iyer, M.K.; Niknafs, Y.S.; Malik, R.; Singhal, U.; Sahu, A.; Hosono, Y.; Barrette, T.R.; Prensner, J.R.; Evans, J.R.; Zhao, S.; et al. The landscape of long noncoding RNAs in the human transcriptome. Nat. Genet. 2015, 47, 199–208. [Google Scholar] [CrossRef]
  23. Jiang, M.C.; Ni, J.J.; Cui, W.Y.; Wang, B.Y.; Zhuo, W. Emerging roles of lncRNA in cancer and therapeutic opportunities. Am. J. Cancer Res. 2019, 9, 1354–1366. [Google Scholar]
  24. Bartel, D.P. MicroRNAs: Genomics, biogenesis, mechanism, and function. Cell 2004, 116, 281–297. [Google Scholar] [CrossRef] [Green Version]
  25. Tay, Y.; Rinn, J.; Pandolfi, P.P. The multilayered complexity of ceRNA crosstalk and competition. Nature 2014, 505, 344–352. [Google Scholar] [CrossRef] [Green Version]
  26. Liu, J.; Li, H.; Zheng, B.; Sun, L.; Yuan, Y.; Xing, C. Competitive endogenous RNA (ceRNA) regulation network of lncRNA-miRNA-mRNA in colorectal carcinogenesis. Dig. Dis. Sci. 2019, 64, 1868–1877. [Google Scholar] [CrossRef]
  27. Yao, Y.; Zhang, T.; Qi, L.; Zhou, C.; Wei, J.; Feng, F.; Liu, R.; Sun, C. Integrated analysis of co-expression and ceRNA network identifies five lncRNAs as prognostic markers for breast cancer. J. Cell Mol. Med. 2019, 23, 8410–8419. [Google Scholar] [CrossRef] [Green Version]
  28. Yang, R.; Xing, L.; Wang, M.; Chi, H.; Zhang, L.; Chen, J. Comprehensive analysis of differentially expressed profiles of lncRNAs/mRNAs and miRNAs with associated ceRNA networks in triple-negative breast cancer. Cell Physiol. Biochem. 2018, 50, 473–488. [Google Scholar] [CrossRef]
  29. Poliseno, L.; Salmena, L.; Zhang, J.; Carver, B.; Haveman, W.J.; Pandolfi, P.P. A coding-independent function of gene and pseudogene mRNAs regulates tumour biology. Nature 2010, 465, 1033–1038. [Google Scholar] [CrossRef] [Green Version]
  30. Guo, C.; Song, W.Q.; Sun, P.; Jin, L.; Dai, H.Y. LncRNA-GAS5 induces PTEN expression through inhibiting miR-103 in endometrial cancer cells. J. Biomed. Sci. 2015, 22, 100. [Google Scholar] [CrossRef] [Green Version]
  31. Yang, C.; Yuan, W.; Yang, X.; Li, P.; Wang, J.; Han, J.; Tao, J.; Li, P.; Yang, H.; Lv, Q.; et al. Circular RNA circ-ITCH inhibits bladder cancer progression by sponging miR-17/miR-224 and regulating p21, PTEN expression. Mol. Cancer 2018, 17, 19. [Google Scholar] [CrossRef] [Green Version]
  32. Qiao, Q.; Li, H. LncRNA FER1L4 suppresses cancer cell proliferation and cycle by regulating PTEN expression in endometrial carcinoma. Biochem. Biophys. Res. Commun. 2016, 478, 507–512. [Google Scholar] [CrossRef]
  33. Rinn, J.L.; Chang, H.Y. Genome regulation by long noncoding RNAs. Annu. Rev. Biochem. 2012, 81, 145–166. [Google Scholar] [CrossRef] [Green Version]
  34. Wang, P.; Ren, Z.; Sun, P. Overexpression of the long non-coding RNA MEG3 impairs in vitro glioma cell proliferation. J. Cell Biochem. 2012, 113, 1868–1874. [Google Scholar] [CrossRef]
  35. Gong, W.; Zheng, J.; Liu, X.; Ma, J.; Liu, Y.; Xue, Y. Knockdown of NEAT1 restrained the malignant progression of glioma stem cells by activating microRNA let-7e. Oncotarget 2016, 7, 62208–62223. [Google Scholar] [CrossRef] [Green Version]
  36. Ding, Y.; Wang, X.; Pan, J.; Ji, M.; Luo, Z.; Zhao, P.; Zhang, Y.; Wang, G. Aberrant expression of long non-coding RNAs (lncRNAs) is involved in brain glioma development. Arch. Med. Sci. 2020, 16, 177–188. [Google Scholar] [CrossRef]
  37. Liang, Q.; Li, X.; Guan, G.; Xu, X.; Chen, C.; Cheng, P.; Cheng, W.; Wu, A. Long non-coding RNA, HOTAIRM1, promotes glioma malignancy by forming a ceRNA network. Aging 2019, 11, 6805–6838. [Google Scholar] [CrossRef]
  38. Wu, Y.; Qian, Z. Long non-coding RNAs (lncRNAs) and microRNAs regulatory pathways in the tumorigenesis and pathogenesis of glioma. Discov. Med. 2019, 28, 129–138. [Google Scholar]
  39. Colaprico, A.; Silva, T.C.; Olsen, C.; Garofano, L.; Cava, C.; Garolini, D.; Sabedot, T.S.; Malta, T.M.; Pagnotta, S.M.; Castiglioni, I.; et al. TCGAbiolinks: An R/Bioconductor package for integrative analysis of TCGA data. Nucleic Acids Res. 2016, 44, e71. [Google Scholar] [CrossRef]
  40. Silva, T.C.; Colaprico, A.; Olsen, C.; D’Angelo, F.; Bontempi, G.; Ceccarelli, M.; Noushmehr, H. TCGA Workflow: Analyze cancer genomics and epigenomics data using Bioconductor packages. F1000Res 2016, 5, 1542. [Google Scholar] [CrossRef]
  41. Xu, T.; Su, N.; Liu, L.; Zhang, J.; Wang, H.; Zhang, W.; Gui, J.; Yu, K.; Li, J.; Le, T.D. miRBaseConverter: An R/Bioconductor package for converting and retrieving miRNA name, accession, sequence and family information in different versions of miRBase. BMC Bioinf. 2018, 19, 514. [Google Scholar] [CrossRef] [Green Version]
  42. Ge, S.X.; Jung, D.; Yao, R. ShinyGO: A graphical gene-set enrichment tool for animals and plants. Bioinformatics 2020, 36, 2628–2629. [Google Scholar] [CrossRef] [PubMed]
  43. Coordinators, N.R. Database resources of the national center for biotechnology information. Nucleic Acids Res. 2016, 44, D7–D19. [Google Scholar] [CrossRef] [Green Version]
  44. Langfelder, P.; Horvath, S. WGCNA: An R package for weighted correlation network analysis. BMC Bioinformatics 2008, 9, 559. [Google Scholar] [CrossRef] [PubMed] [Green Version]
  45. Lin, Y.; Liu, T.; Cui, T.; Wang, Z.; Zhang, Y.; Tan, P.; Huang, Y.; Yu, J.; Wang, D. RNAInter in 2020: RNA interactome repository with increased coverage and annotation. Nucleic Acids Res. 2020, 48, D189–D197. [Google Scholar] [CrossRef] [PubMed]
  46. Li, J.H.; Liu, S.; Zhou, H.; Qu, L.H.; Yang, J.H. starBase v2.0: Decoding miRNA-ceRNA, miRNA-ncRNA and protein-RNA interaction networks from large-scale CLIP-Seq data. Nucleic Acids Res. 2014, 42, D92–D97. [Google Scholar] [CrossRef] [PubMed] [Green Version]
  47. Tokar, T.; Pastrello, C.; Rossos, A.E.M.; Abovsky, M.; Hauschild, A.C.; Tsay, M.; Lu, R.; Jurisica, I. mirDIP 4.1-integrative database of human microRNA target predictions. Nucleic Acids Res. 2018, 46, D360–D370. [Google Scholar] [CrossRef]
  48. Karagkouni, D.; Paraskevopoulou, M.D.; Chatzopoulos, S.; Vlachos, I.S.; Tastsoglou, S.; Kanellos, I.; Papadimitriou, D.; Kavakiotis, I.; Maniou, S.; Skoufos, G.; et al. DIANA-TarBase v8: A decade-long collection of experimentally supported miRNA-gene interactions. Nucleic Acids Res. 2018, 46, D239–D245. [Google Scholar] [CrossRef] [PubMed] [Green Version]
  49. Sticht, C.; De La Torre, C.; Parveen, A.; Gretz, N. miRWalk: An online resource for prediction of microRNA binding sites. PLoS ONE 2018, 13, e0206239. [Google Scholar] [CrossRef]
  50. Shannon, P.; Markiel, A.; Ozier, O.; Baliga, N.S.; Wang, J.T.; Ramage, D.; Amin, N.; Schwikowski, B.; Ideker, T. Cytoscape: A software environment for integrated models of biomolecular interaction networks. Genome Res. 2003, 13, 2498–2504. [Google Scholar] [CrossRef]
  51. Bindea, G.; Mlecnik, B.; Hackl, H.; Charoentong, P.; Tosolini, M.; Kirilovsky, A.; Fridman, W.H.; Pages, F.; Trajanoski, Z.; Galon, J. ClueGO: A Cytoscape plug-in to decipher functionally grouped gene ontology and pathway annotation networks. Bioinformatics 2009, 25, 1091–1093. [Google Scholar] [CrossRef] [Green Version]
  52. Tang, Z.; Li, C.; Kang, B.; Gao, G.; Li, C.; Zhang, Z. GEPIA: A web server for cancer and normal gene expression profiling and interactive analyses. Nucleic Acids Res. 2017, 45, W98–W102. [Google Scholar] [CrossRef] [PubMed] [Green Version]
  53. Louis, D.N.; Perry, A.; Reifenberger, G.; von Deimling, A.; Figarella-Branger, D.; Cavenee, W.K.; Ohgaki, H.; Wiestler, O.D.; Kleihues, P.; Ellison, D.W. The 2016 World Health Organization classification of tumors of the central nervous system: A summary. Acta Neuropathol. 2016, 131, 803–820. [Google Scholar] [CrossRef] [PubMed] [Green Version]
  54. Pardo, L.A.; Stuhmer, W. The roles of K(+) channels in cancer. Nat. Rev. Cancer 2014, 14, 39–48. [Google Scholar] [CrossRef] [PubMed]
  55. Prevarskaya, N.; Skryma, R.; Shuba, Y. Ion channels in cancer: Are cancer hallmarks oncochannelopathies? Physiol. Rev. 2018, 98, 559–621. [Google Scholar] [CrossRef] [Green Version]
  56. Prevarskaya, N.; Skryma, R.; Shuba, Y. Ion channels and the hallmarks of cancer. Trends Mol. Med. 2010, 16, 107–121. [Google Scholar] [CrossRef]
  57. Talley, E.M.; Solorzano, G.; Lei, Q.; Kim, D.; Bayliss, D.A. Cns distribution of members of the two-pore-domain (KCNK) potassium channel family. J. Neurosci. 2001, 21, 7491–7505. [Google Scholar] [CrossRef]
  58. Kanjhan, R.; Pow, D.V.; Noakes, P.G.; Bellingham, M.C. The two-pore domain K+ channel TASK-1 is closely associated with brain barriers and meninges. J. Mol. Histol. 2010, 41, 315–323. [Google Scholar] [CrossRef]
  59. Williams, S.; Bateman, A.; O’Kelly, I. Altered expression of two-pore domain potassium (K2P) channels in cancer. PLoS ONE 2013, 8, e74589. [Google Scholar] [CrossRef]
  60. Hansen, J.B. Towards selective Kir6.2/SUR1 potassium channel openers, medicinal chemistry and therapeutic perspectives. Curr. Med. Chem. 2006, 13, 361–376. [Google Scholar] [CrossRef]
  61. De Franco, E.; Saint-Martin, C.; Brusgaard, K.; Knight Johnson, A.E.; Aguilar-Bryan, L.; Bowman, P.; Arnoux, J.B.; Larsen, A.R.; May, S.; Greeley, S.A.W.; et al. Update of variants identified in the pancreatic beta-cell KATP channel genes KCNJ11 and ABCC8 in individuals with congenital hyperinsulinism and diabetes. Hum. Mutat. 2020, 41, 884–905. [Google Scholar] [CrossRef] [PubMed] [Green Version]
  62. Guo, D.; Liu, H.; Ruzi, A.; Gao, G.; Nasir, A.; Liu, Y.; Yang, F.; Wu, F.; Xu, G.; Li, Y.X. Modeling congenital hyperinsulinism with ABCC8-deficient human embryonic stem cells generated by CRISPR/Cas9. Sci. Rep. 2017, 7, 3156. [Google Scholar] [CrossRef] [PubMed] [Green Version]
  63. Martin, G.M.; Sung, M.W.; Shyng, S.L. Pharmacological chaperones of ATP-sensitive potassium channels: Mechanistic insight from cryoEM structures. Mol. Cell Endocrinol. 2020, 502, 110667. [Google Scholar] [CrossRef] [PubMed]
  64. Unal, S.; Gonulal, D.; Ucakturk, A.; Siyah Bilgin, B.; Flanagan, S.E.; Gurbuz, F.; Tayfun, M.; Elmaogullari, S.; Arasli, A.; Demirel, F.; et al. A novel homozygous mutation in the KCNJ11 gene of a neonate with congenital hyperinsulinism and successful management with sirolimus. J. Clin. Res. Pediatr. Endocrinol. 2016, 8, 478–481. [Google Scholar] [CrossRef]
  65. Song, J.; Yang, Y.; Mauvais-Jarvis, F.; Wang, Y.P.; Niu, T. KCNJ11, ABCC8 and TCF7L2 polymorphisms and the response to sulfonylurea treatment in patients with type 2 diabetes: A bioinformatics assessment. BMC Med. Genet. 2017, 18, 64. [Google Scholar] [CrossRef]
  66. Poloz, Y.; Stambolic, V. Obesity and cancer, a case for insulin signaling. Cell Death Dis. 2015, 6, e2037. [Google Scholar] [CrossRef] [Green Version]
  67. Yu, H.; Rohan, T. Role of the insulin-like growth factor family in cancer development and progression. J. Natl. Cancer Inst. 2000, 92, 1472–1489. [Google Scholar] [CrossRef]
  68. Lu, P.; Takai, K.; Weaver, V.M.; Werb, Z. Extracellular matrix degradation and remodeling in development and disease. Cold Spring Harb. Perspect Biol. 2011, 3. [Google Scholar] [CrossRef]
  69. Leins, A.; Riva, P.; Lindstedt, R.; Davidoff, M.S.; Mehraein, P.; Weis, S. Expression of tenascin-C in various human brain tumors and its relevance for survival in patients with astrocytoma. Cancer 2003, 98, 2430–2439. [Google Scholar] [CrossRef]
  70. Xia, S.; Lal, B.; Tung, B.; Wang, S.; Goodwin, C.R.; Laterra, J. Tumor microenvironment tenascin-C promotes glioblastoma invasion and negatively regulates tumor proliferation. Neuro Oncol. 2016, 18, 507–517. [Google Scholar] [CrossRef] [Green Version]
  71. Sarkar, S.; Zemp, F.J.; Senger, D.; Robbins, S.M.; Yong, V.W. ADAM-9 is a novel mediator of tenascin-C-stimulated invasiveness of brain tumor-initiating cells. Neuro Oncol. 2015, 17, 1095–1105. [Google Scholar] [CrossRef] [PubMed] [Green Version]
  72. El Ayachi, I.; Baeza, N.; Fernandez, C.; Colin, C.; Scavarda, D.; Pesheva, P.; Figarella-Branger, D. KIAA0510, the 3′-untranslated region of the tenascin-R gene, and tenascin-R are overexpressed in pilocytic astrocytomas. Neuropathol. Appl. Neurobiol. 2010, 36, 399–410. [Google Scholar] [CrossRef] [PubMed]
  73. Wong, K.K.; Rostomily, R.; Wong, S.T.C. Prognostic gene discovery in glioblastoma patients using deep learning. Cancers 2019, 11, 53. [Google Scholar] [CrossRef] [PubMed] [Green Version]
  74. Sarkar, S.; Nuttall, R.K.; Liu, S.; Edwards, D.R.; Yong, V.W. Tenascin-C stimulates glioma cell invasion through matrix metalloproteinase-12. Cancer Res. 2006, 66, 11771–11780. [Google Scholar] [CrossRef] [Green Version]
  75. Sugimoto, W.; Itoh, K.; Hirata, H.; Abe, Y.; Torii, T.; Mitsui, Y.; Budirahardja, Y.; Tanaka, N.; Kawauchi, K. MMP24 as a target of YAP is a potential prognostic factor in cancer patients. Bioengineering 2020, 7, 18. [Google Scholar] [CrossRef] [Green Version]
  76. Llano, E.; Pendas, A.M.; Freije, J.P.; Nakano, A.; Knauper, V.; Murphy, G.; Lopez-Otin, C. Identification and characterization of human MT5-MMP, a new membrane-bound activator of progelatinase a overexpressed in brain tumors. Cancer Res. 1999, 59, 2570–2576. [Google Scholar]
  77. Hagemann, C.; Anacker, J.; Ernestus, R.I.; Vince, G.H. A complete compilation of matrix metalloproteinase expression in human malignant gliomas. World J. Clin. Oncol. 2012, 3, 67–79. [Google Scholar] [CrossRef]
  78. Qu, M.; Yu, J.; Liu, H.; Ren, Y.; Ma, C.; Bu, X.; Lan, Q. The candidate tumor suppressor gene SLC8A2 inhibits invasion, angiogenesis and growth of glioblastoma. Mol. Cells 2017, 40, 761–772. [Google Scholar] [CrossRef] [Green Version]
  79. Gao, J.; Yin, X.; Yu, X.; Dai, C.; Zhou, F. Long noncoding LINC01551 promotes hepatocellular carcinoma cell proliferation, migration, and invasion by acting as a competing endogenous RNA of microRNA-122-5p to regulate ADAM10 expression. J. Cell Biochem. 2019, 120, 16393–16407. [Google Scholar] [CrossRef]
  80. Yue, X.; Cao, D.; Lan, F.; Pan, Q.; Xia, T.; Yu, H. MiR-301a is activated by the Wnt/beta-catenin pathway and promotes glioma cell invasion by suppressing SEPT7. Neuro Oncol. 2016, 18, 1288–1296. [Google Scholar] [CrossRef] [Green Version]
  81. Zheng, J.Z.; Huang, Y.N.; Yao, L.; Liu, Y.R.; Liu, S.; Hu, X.; Liu, Z.B.; Shao, Z.M. Elevated miR-301a expression indicates a poor prognosis for breast cancer patients. Sci. Rep. 2018, 8, 2225. [Google Scholar] [CrossRef] [PubMed] [Green Version]
  82. Ma, W.Q.; Chen, J.; Fang, W.; Yang, X.Q.; Zhu, A.; Zhang, D.; Zhong, H.L.; Yang, B.; Luo, Z. LncRNA INHBA-AS1 promotes cell growth, migration, and invasion of oral squamous cell carcinoma by sponging miR-143-3p. Eur. Rev. Med. Pharmacol. Sci. 2020, 24, 1821–1828. [Google Scholar] [CrossRef] [PubMed]
  83. Xie, K.; Chen, M.; Zhu, M.; Wang, C.; Qin, N.; Liang, C.; Song, C.; Dai, J.; Jin, G.; Shen, H.; et al. A polymorphism in miR-1262 regulatory region confers the risk of lung cancer in Chinese population. Int. J. Cancer 2017, 141, 958–966. [Google Scholar] [CrossRef] [PubMed]
  84. Wang, W.; Mu, S.; Zhao, Q.; Xue, L.; Wang, S. Identification of differentially expressed microRNAs and the potential of microRNA-455-3p as a novel prognostic biomarker in glioma. Oncol. Lett. 2019, 18, 6150–6156. [Google Scholar] [CrossRef] [PubMed] [Green Version]
  85. Zhan, T.; Huang, X.; Tian, X.; Chen, X.; Ding, Y.; Luo, H.; Zhang, Y. Downregulation of microRNA-455-3p links to proliferation and drug resistance of pancreatic cancer cells via targeting TAZ. Mol. Ther. Nucleic Acids 2018, 10, 215–226. [Google Scholar] [CrossRef] [Green Version]
  86. Han, B.W.; Ye, H.; Wei, P.P.; He, B.; Han, C.; Chen, Z.H.; Chen, Y.Q.; Wang, W.T. Global identification and characterization of lncRNAs that control inflammation in malignant cholangiocytes. BMC Genom. 2018, 19, 735. [Google Scholar] [CrossRef]
  87. Li, T.; Pan, H.; Li, R. The dual regulatory role of miR-204 in cancer. Tumour Biol. 2016, 37, 11667–11677. [Google Scholar] [CrossRef] [Green Version]
  88. Ni, J.S.; Zheng, H.; Huang, Z.P.; Hong, Y.G.; Ou, Y.L.; Tao, Y.P.; Wang, M.C.; Wang, Z.G.; Yang, Y.; Zhou, W.P. MicroRNA-197-3p acts as a prognostic marker and inhibits cell invasion in hepatocellular carcinoma. Oncol. Lett. 2019, 17, 2317–2327. [Google Scholar] [CrossRef] [Green Version]
  89. Wang, F.; Jiang, H.; Wang, S.; Chen, B. Dual functional microRNA-186-5p targets both FGF2 and RelA to suppress tumorigenesis of glioblastoma multiforme. Cell Mol. Neurobiol. 2017, 37, 1433–1442. [Google Scholar] [CrossRef]
Figure 1. Volcano plots and distribution of genes on chromosomes for DEcodingRNAs between the OD 1p/19q codeletion group and the non-codeletion group. The volcano plot of DEcodingRNAs. The red dots represent significantly upregulated genes, the green dots represent significantly downregulated genes (|log2 FC| ≥ 1 and FDR < 0.05) (A). Histogram of input gene sets and distribution on chromosomes for upregulated DEcodingRNAs (left) and downregulated DEcodingRNAs (right) (B). * indicates significant p value.
Cancers 12 02543 g001
Figure 2. Volcano plot and distribution of genes on chromosomes for DEmiRNAs between OD 1p/19q codeletion group and non-codeletion group. The volcano plot of DEmiRNAs (A). The red dots represent significantly upregulated miRNAs in OD’s patients with 1p/19q codeletion, the green dots represent significantly downregulated miRNAs in OD’s patients with 1p/19q codeletion (|log2 FC| ≥ 1 and FDR < 0.05). The ideogram plot of DEmiRNAs (B). The red regions of chromosomes represent centromeres and the light blue regions represent highly condensed heterochromatin regions. Red arrows represent the distribution of upregulated DEmiRNAs and blue arrows represent the distribution of downregulated DEmiRNAs on the chromosomes.
Cancers 12 02543 g002
Figure 3. Clustering and module identification between DEcodingRNAs and DEncRNAs using WGCNA. Decision of soft-thresholding powers for scale-free topology (β) and mean connectivity (A). Hierarchical clustering dendrogram based on the dissimilarity between DEcodingRNAs and DEncRNAs. The first colored rows indicate modules with highly interconnected genes. The second colored rows indicate merged modules with high correlation (B). Module-trait relationships are calculated using correlations between module eigengene values and clinical traits. Modules were labeled using correlation coefficients and p values (C).
Cancers 12 02543 g003aCancers 12 02543 g003b
Figure 4. Construction and biological identification of the ceRNA network comprising upregulated DEcodingRNAs and DEncRNAs expected to be candidate targets of downregulated DEmiRNAs. The visualization of the ceRNA network. Blue rectangles indicate downregulated DEmiRNAs (A). Red circles and yellow rhombuses indicate upregulated DEcodingRNAs, upregulated DElncRNAs, and DEpseudogenes from the blue module. The results of GO analyses of DEcodingRNAs belonging to ceRNA network, include biological process (BP), cellular component (CC), and molecular function (MF) (B). Annotations of the KEGG and reactome pathway enrichment analysis (C).
Cancers 12 02543 g004
Figure 5. Evaluation of the ceRNA network through by unsupervised clustering and comparing survival to actual OD patients with IDH mutation. Heatmap for unsupervised analysis of DEcodingRNAs and DEncRNAs related to hsa-miR-301a-3p in ceRNA network (A). Kaplan–Meier plot for comparing the survival between actual oligodendroglioma patients with IDH mutation from TCGA database and unsupervised group (B). The yellow line indicates survival data for OD patients with 1p/19q codeletion and deep green line for OD patients with 1p/19q non-codeletion (Top). Olive green and coral pink line indicate groups from unsupervised clustering analysis with miR-301a-3p related ceRNA network (Bottom). Scatter plot for clustering group by K-means in OD patients with IDH mutation (C). Scatter plot resenting negative correlations between LINC01551 expected with ceRNA and related to miRNA in ceRNA network (left). Kaplan–Meier survival plot according to the expression levels of ceRNA and miRNA (right).
Cancers 12 02543 g005
Table 1. Comparison of oligodenroglioma and lower grade glioma using the adjusted rand index (ARI) evaluation of the ceRNA network.
NetworkSource miRNAsNo. of Target
Coding Genes
No. of Target
Non-Coding Genes
ARI
Oligodenroglioma (k * = 2)Lower Grade Glioma (k * = 3)
Network01hsa-miR-296-5p7860.9210.806
Network02hsa-miR-455-3p6810.8960.888
Network03hsa-miR-7609210.8960.789
Network04hsa-miR-1298-5p4340.8960.761
Network05hsa-miR-197-3p7850.8720.770
Network06hsa-miR-301a-5p2520.8720.728
Network07hsa-miR-12626220.8720.724
Network08hsa-miR-186-5p9990.8710.747
Network09hsa-miR-301a-3p8320.8470.834
Network10hsa-miR-383-5p9710.8240.714
Network11hsa-miR-2114-3p3020.8010.497
Network12hsa-miR-204-5p13870.8010.756
Network13hsa-miR-7156-5p3160.8000.594
Network14hsa-miR-92b-3p7640.7780.704
Network15hsa-miR-3074-5p3190.7780.637
Network16hsa-miR-1298-3p3020.6920.671
k *, The number of agglomerative clusters using the ARI.
Table 2. Kaplan–Meier survival analysis with miRNA and ceRNA having negative correlation coefficients of less than −0.3
SubtypemiRNA SymbolCeRNA SymbolFirst ClusterSecond ClusterpFDR
Median95% CI *No.Median95% CI *No.
ODhsa-miR-186-5pINHBA-AS140842907 to NA11326601011 to NA480.0020.023
hsa-miR-301a-3pLINC0155140842907 to NA11526601011 to NA460.0020.023
hsa-miR-186-5pZNF876P40842907 to NA10226601886 to NA590.0230.168
hsa-miR-186-5pTM4SF19-AS140842907 to NA10726601886 to NA540.0330.183
hsa-miR-186-5pFZD10-AS140842907 to NA8026601886 to NA810.0550.211
hsa-miR-204-5pNXF440842907 to NA9826601886 to NA630.0580.211
hsa-miR-301a-5pSMCR540842907 to NA9928751886 to NA620.1130.356
hsa-miR-186-5pLPAL240842907 to NA10426601886 to NA570.1500.366
hsa-miR-197-3pSMCR540842907 to NA9228752000 to NA690.1480.366
hsa-miR-197-3pCD81-AS140842907 to NA10726601886 to NA540.2350.518
hsa-miR-301a-5pFZD10-AS129072875 to NA8526601886 to NA760.2860.571
hsa-miR-186-5pLINC0146040842907 to NA9728752000 to NA640.3640.575
hsa-miR-197-3pLINC0207640842907 to NA9828752000 to NA630.3660.575
hsa-miR-760LPAL234702907 to NA7628752000 to NA850.3490.575
hsa-miR-204-5pTM4SF19-AS140844084 to NA8128752000 to NA800.4100.602
hsa-miR-204-5pEPN2-AS134702660 to NA8628752000 to NA750.4720.615
hsa-miR-204-5pSMCR540842660 to NA8628752000 to NA750.4790.615
hsa-miR-204-5pGUCY1B240842907 to NA10128751401 to NA600.5030.615
hsa-miR-92b-3pTBX5-AS140842660 to NA7129072282 to NA900.6200.717
hsa-miR-197-3pFZD10-AS134702907 to NA9528752000 to NA660.6940.763
hsa-miR-7156-5pMROCKI40841886 to NA6834702875 to NA930.8310.871
hsa-miR-204-5pMROCKI34702875 to NA8929072000 to NA720.9330.933
LGGhsa-miR-1262CISTR44454084 to NA21120001762 to 28752560.0000.000
hsa-miR-186-5pINHBA-AS140842907 to NA21322861933 to 44122540.0000.002
hsa-miR-3074-5pINHBA-AS140842875 to NA25422861915 to NA2130.0000.002
hsa-miR-186-5pLPAL240842907 to NA17424331933 to 44122930.0020.005
hsa-miR-186-5pZNF876P40842907 to NA17824331933 to 44122890.0060.012
hsa-miR-455-3pLINC0158640682907 to NA25122861915 to NA2160.0050.012
hsa-miR-186-5pLINC0146040842907 to NA18124331933 to 44122860.0140.026
hsa-miR-186-5pTM4SF19-AS140842907 to NA18624331933 to 44122810.0200.032
hsa-miR-204-5pGUCY1B234701891 to NA23029072286 to NA2370.0230.033
hsa-miR-301a-3pLINC0155140843470 to NA24922351915 to 39782180.0290.037
hsa-miR-204-5pNXF440842907 to NA21424331933 to 40682530.0720.085
hsa-miR-301a-5pFZD10-AS134702875 to NA21624331933 to NA2510.2030.220
hsa-miR-197-3pCD81-AS140682907 to NA20226601933 to 44452650.3990.399
CI *, Confidence interval; Bold, Significant p-value with FDR, Correlation coefficients of all results were less than −0.3.

