
Design Optimization Method for Large-Size Sidewall-Driven Micromixer to Generate Powerful Swirling Flow


Abstract
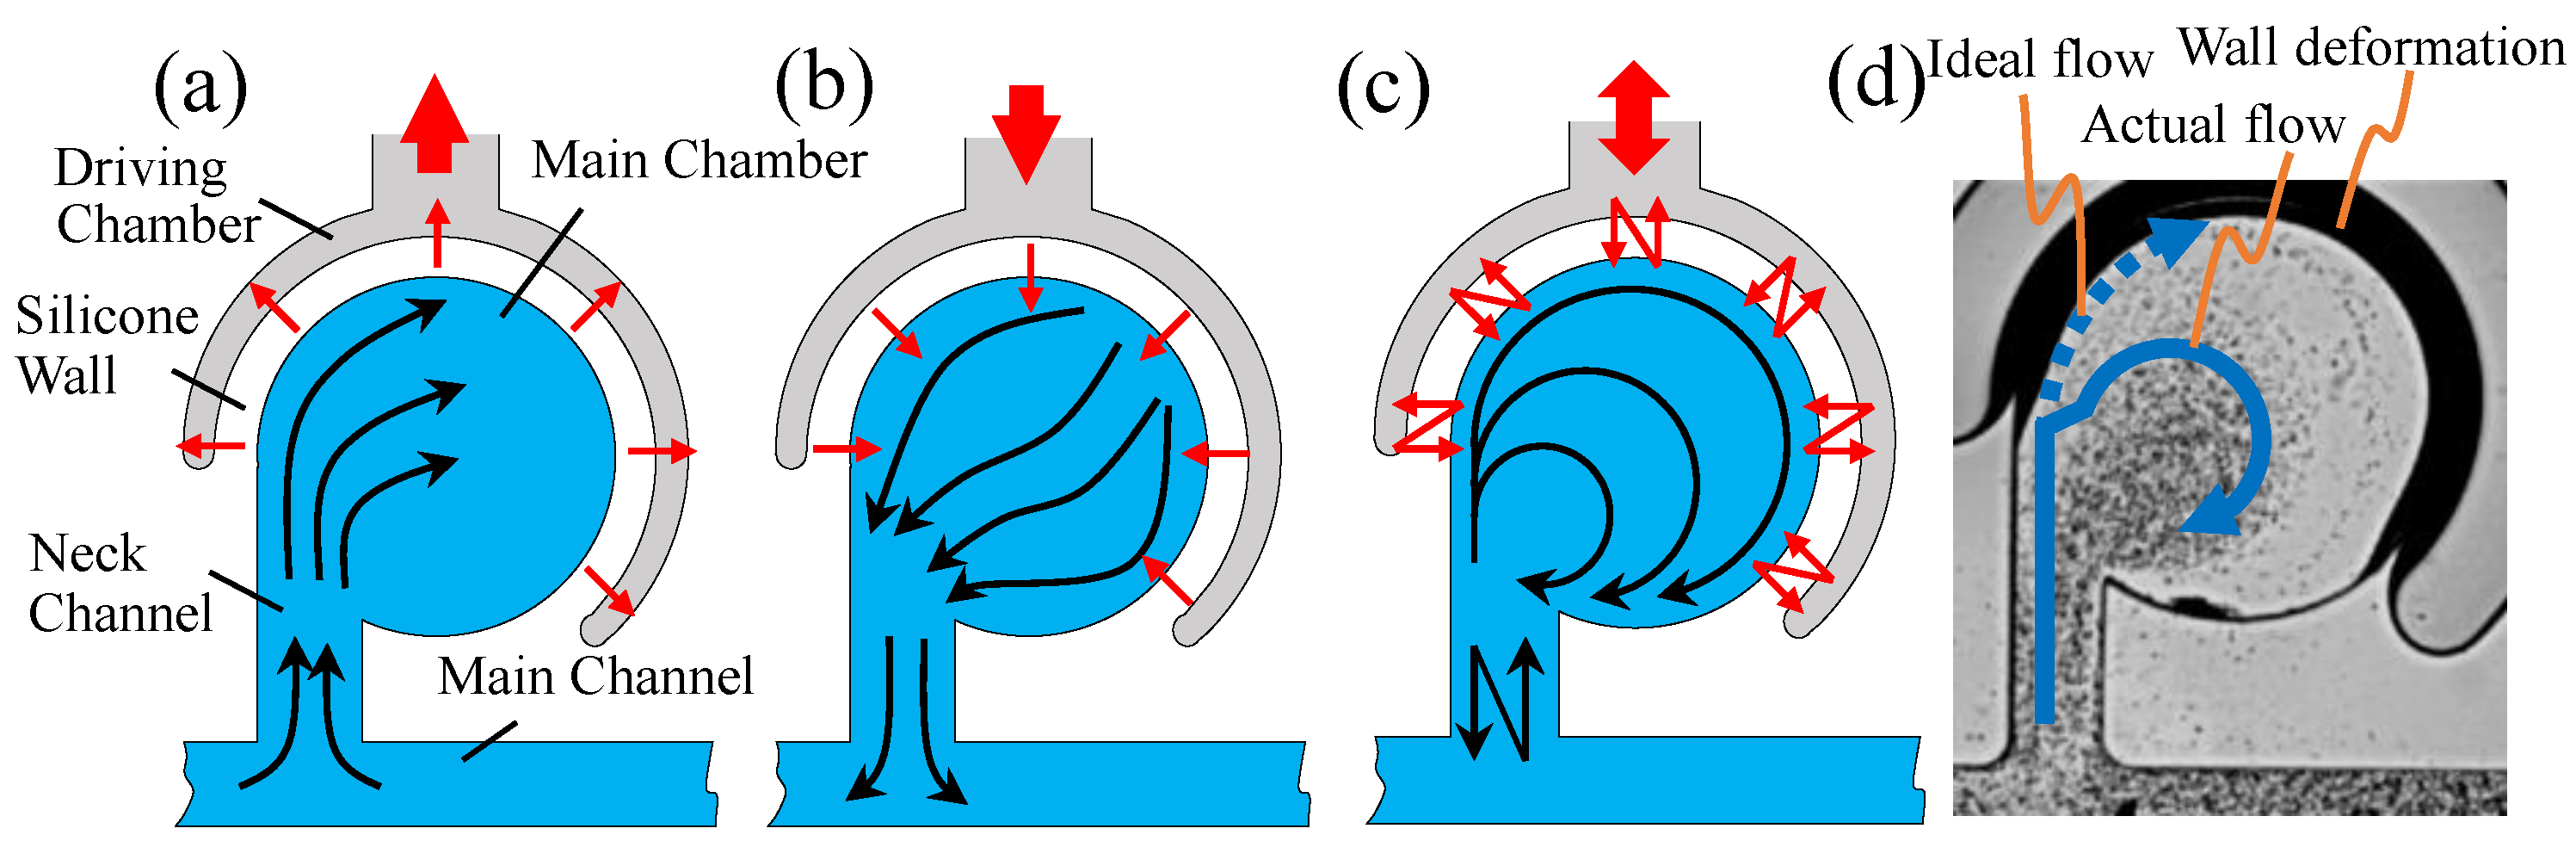
:1. Introduction
2. Materials and Methods
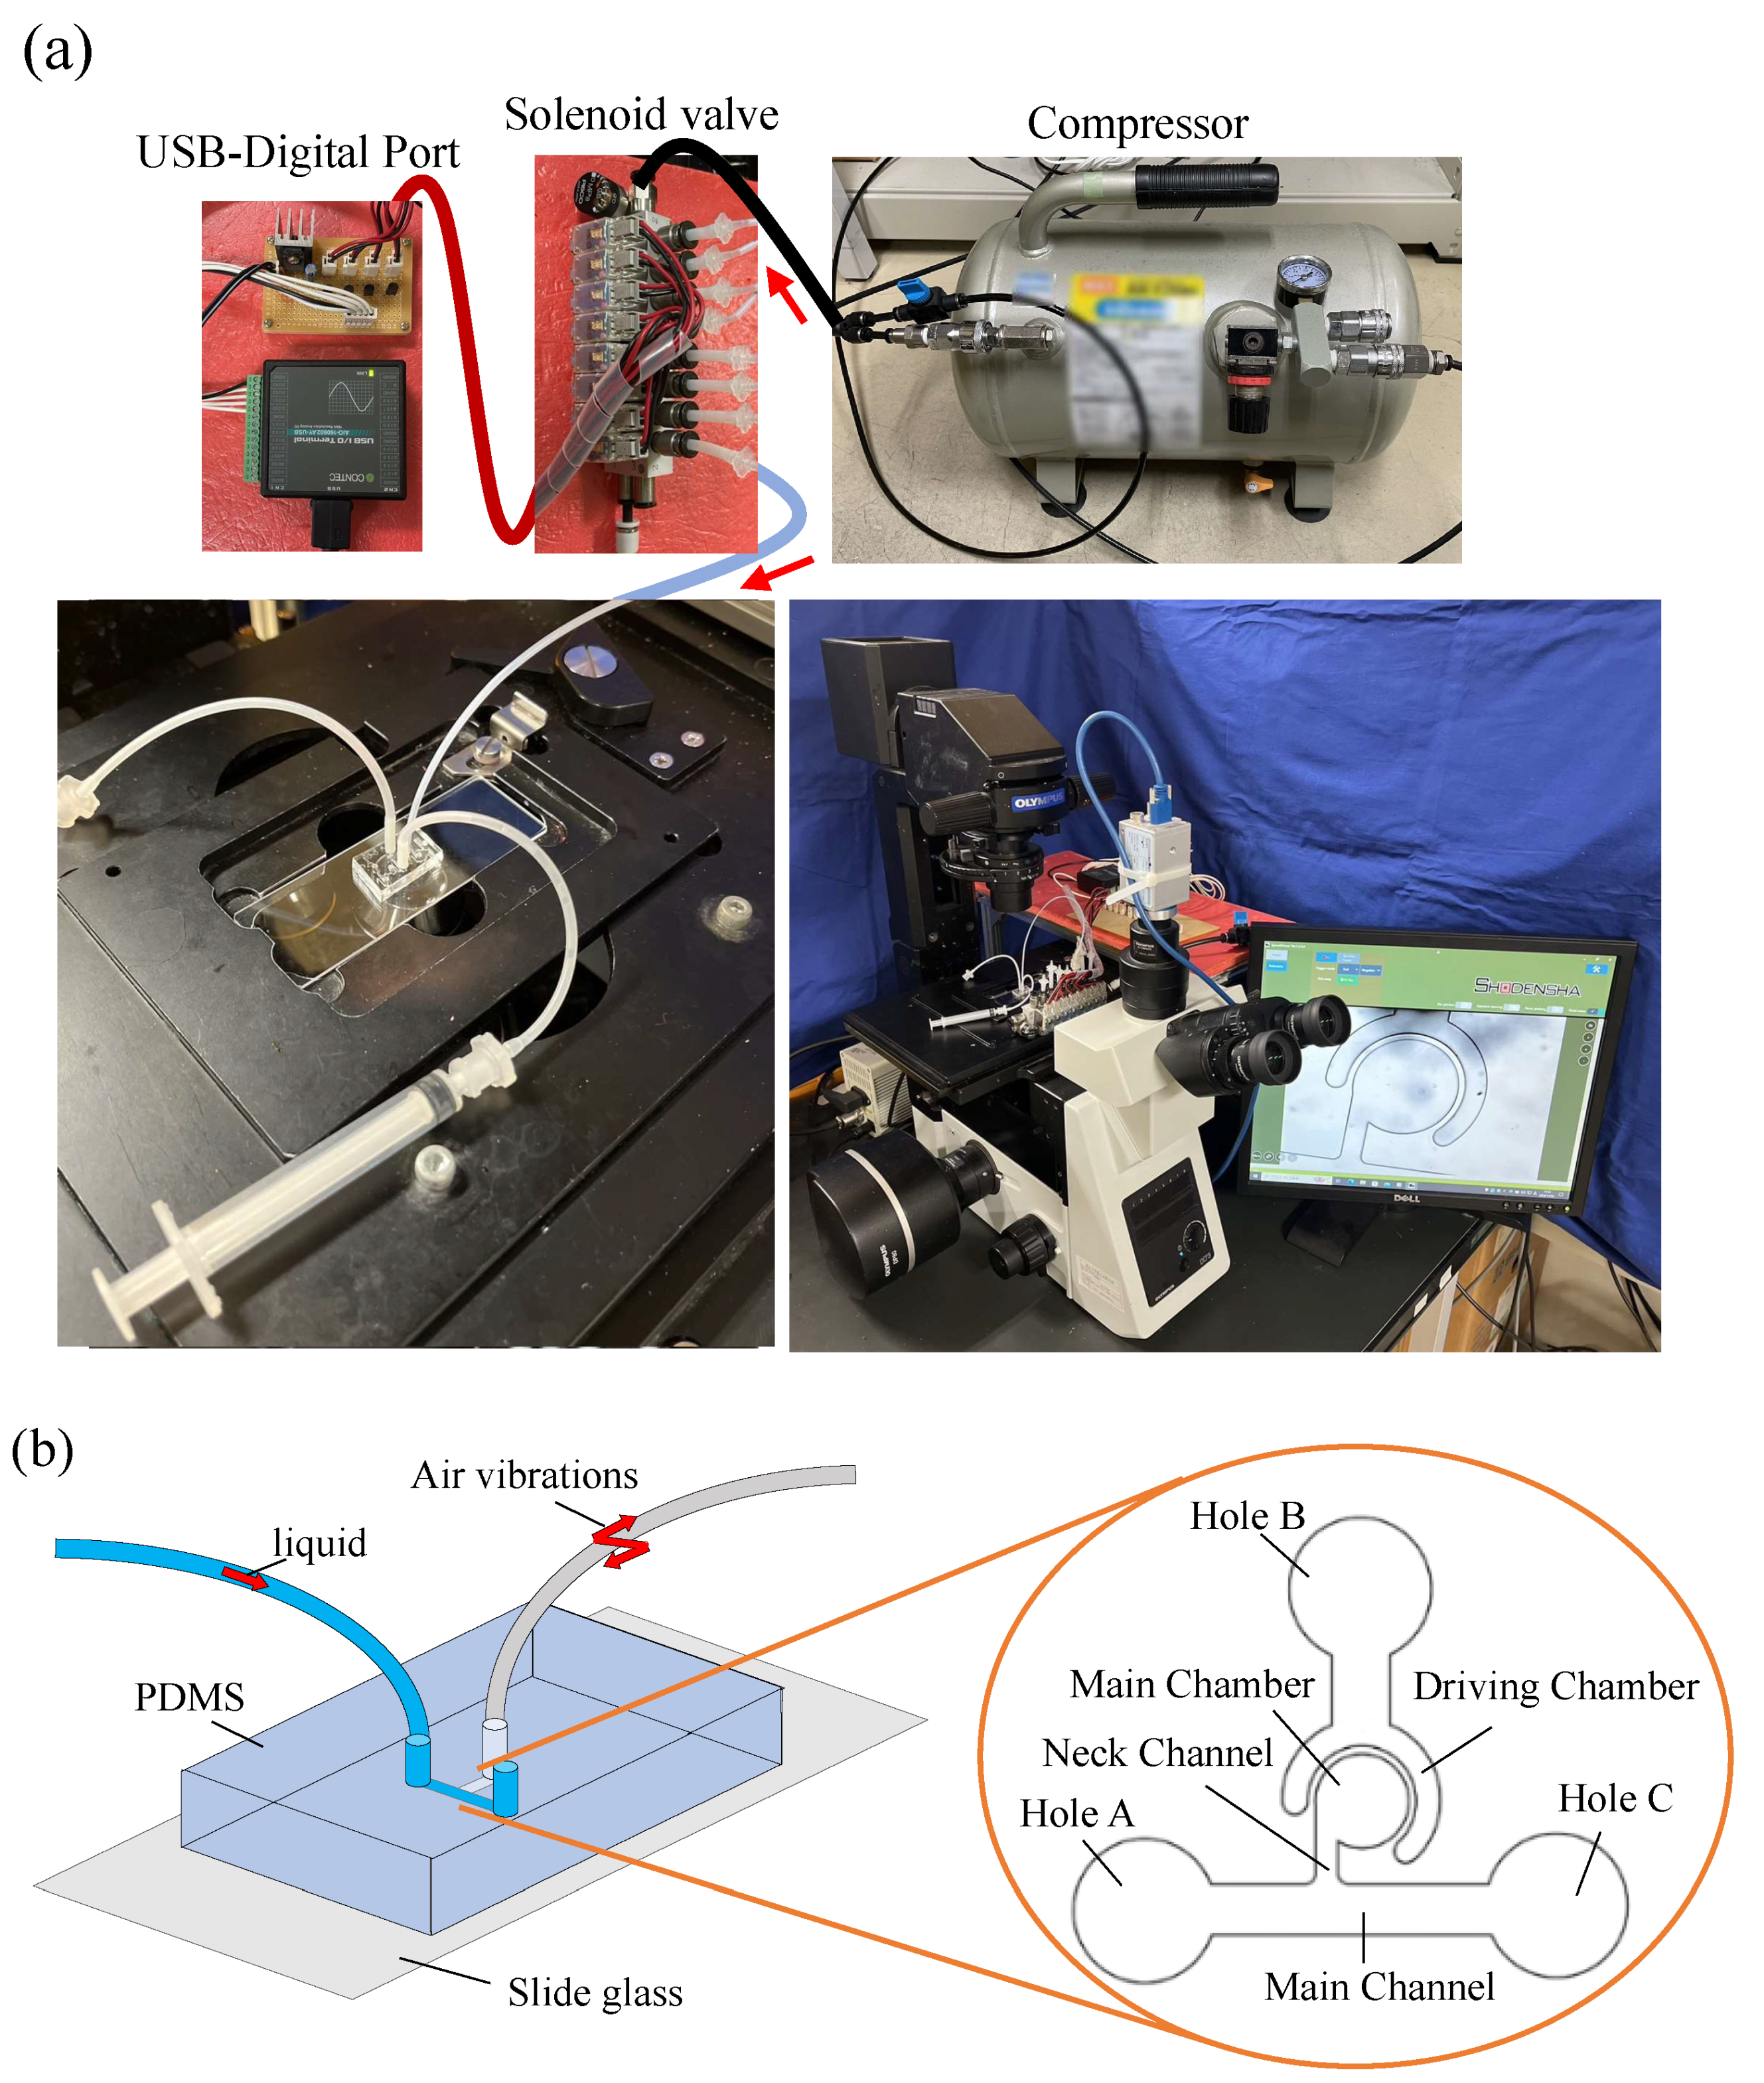
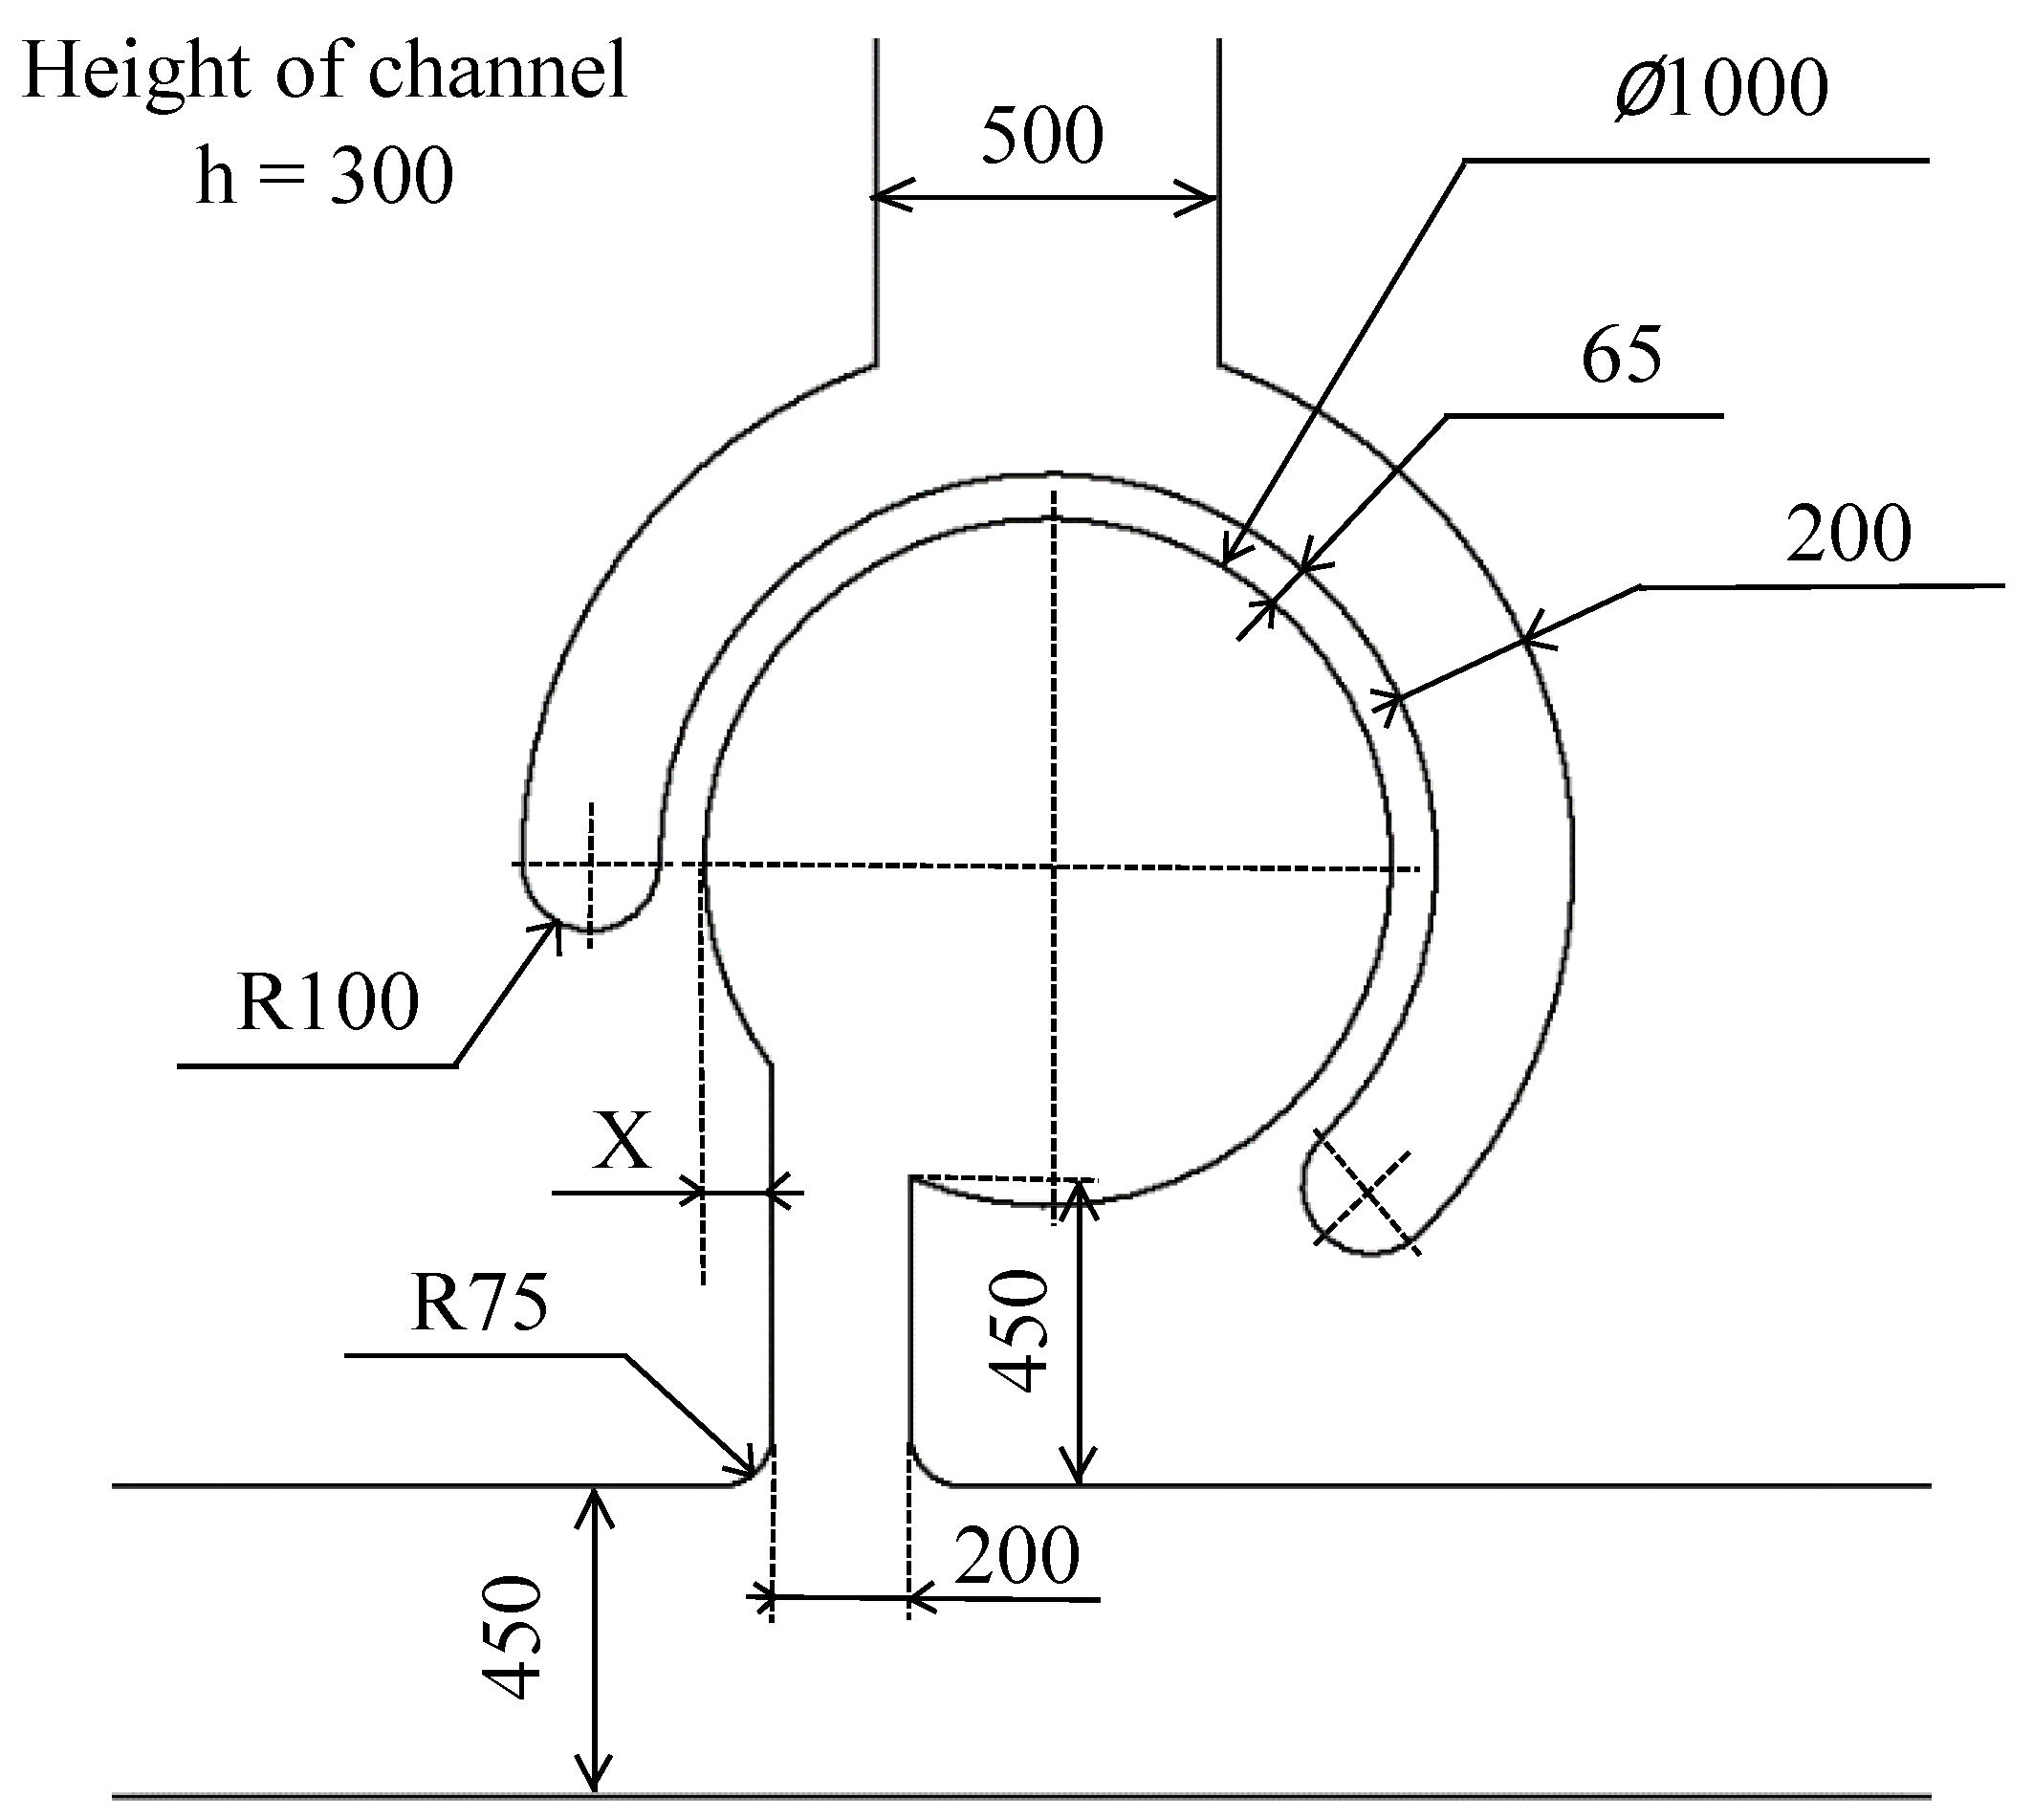
2.1. Fabrication Method for the Sidewall-Driven Micromixers
2.2. Experimental Setup
2.3. Experimental Procedure
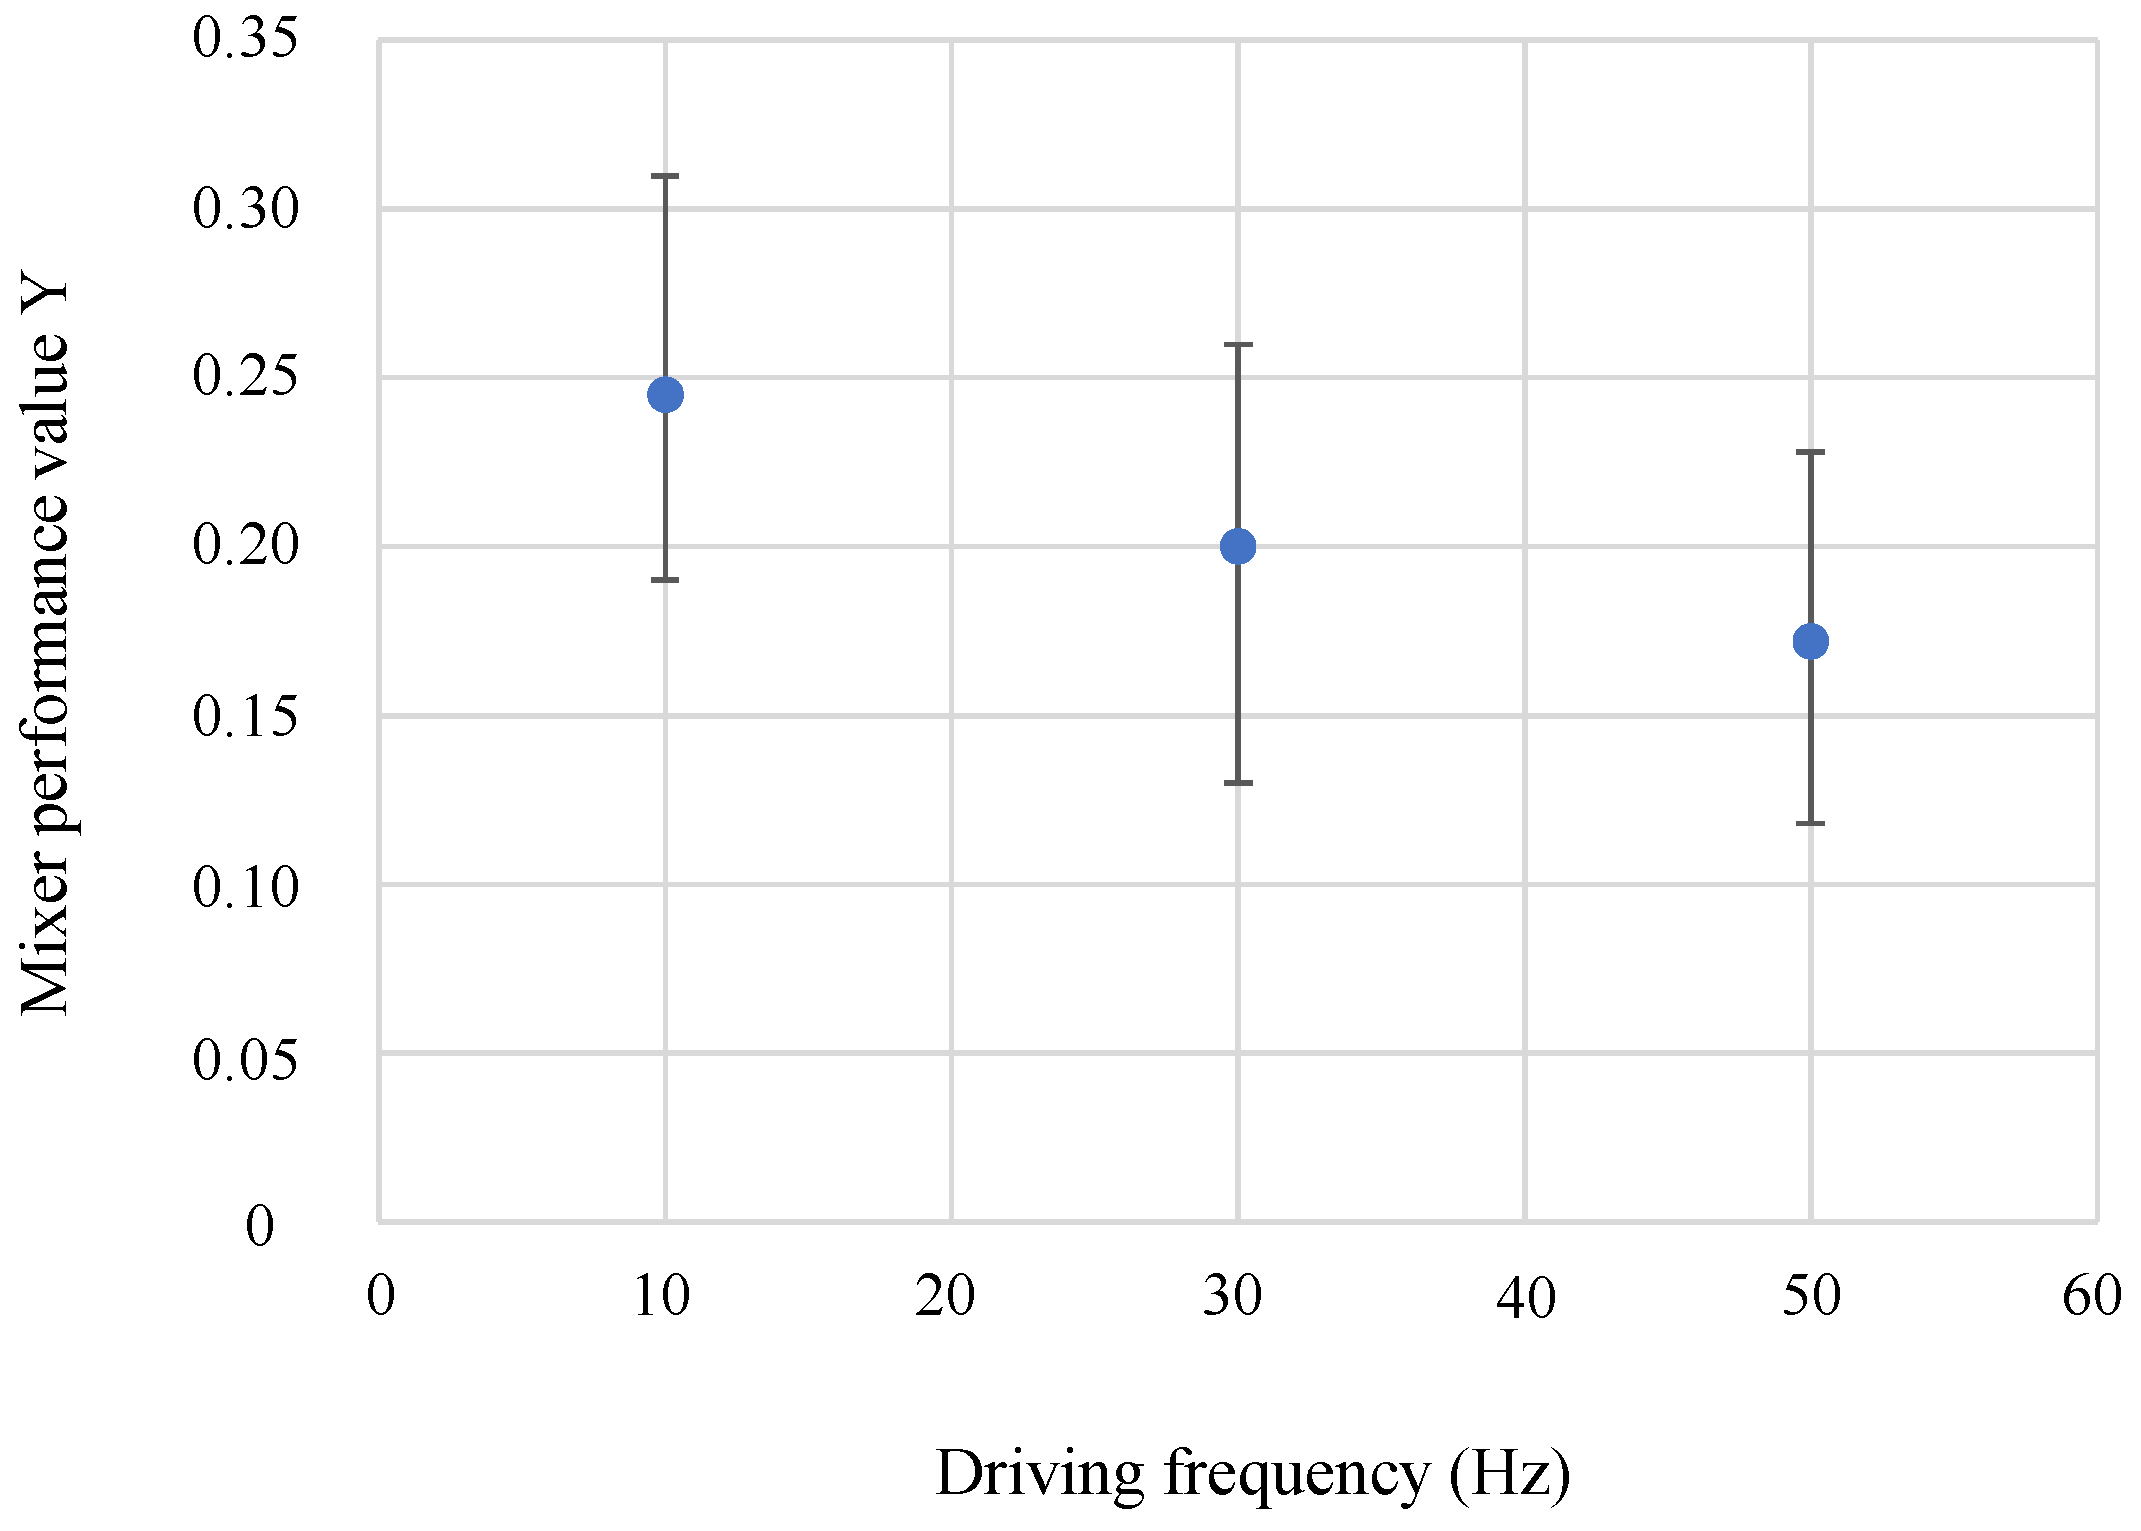
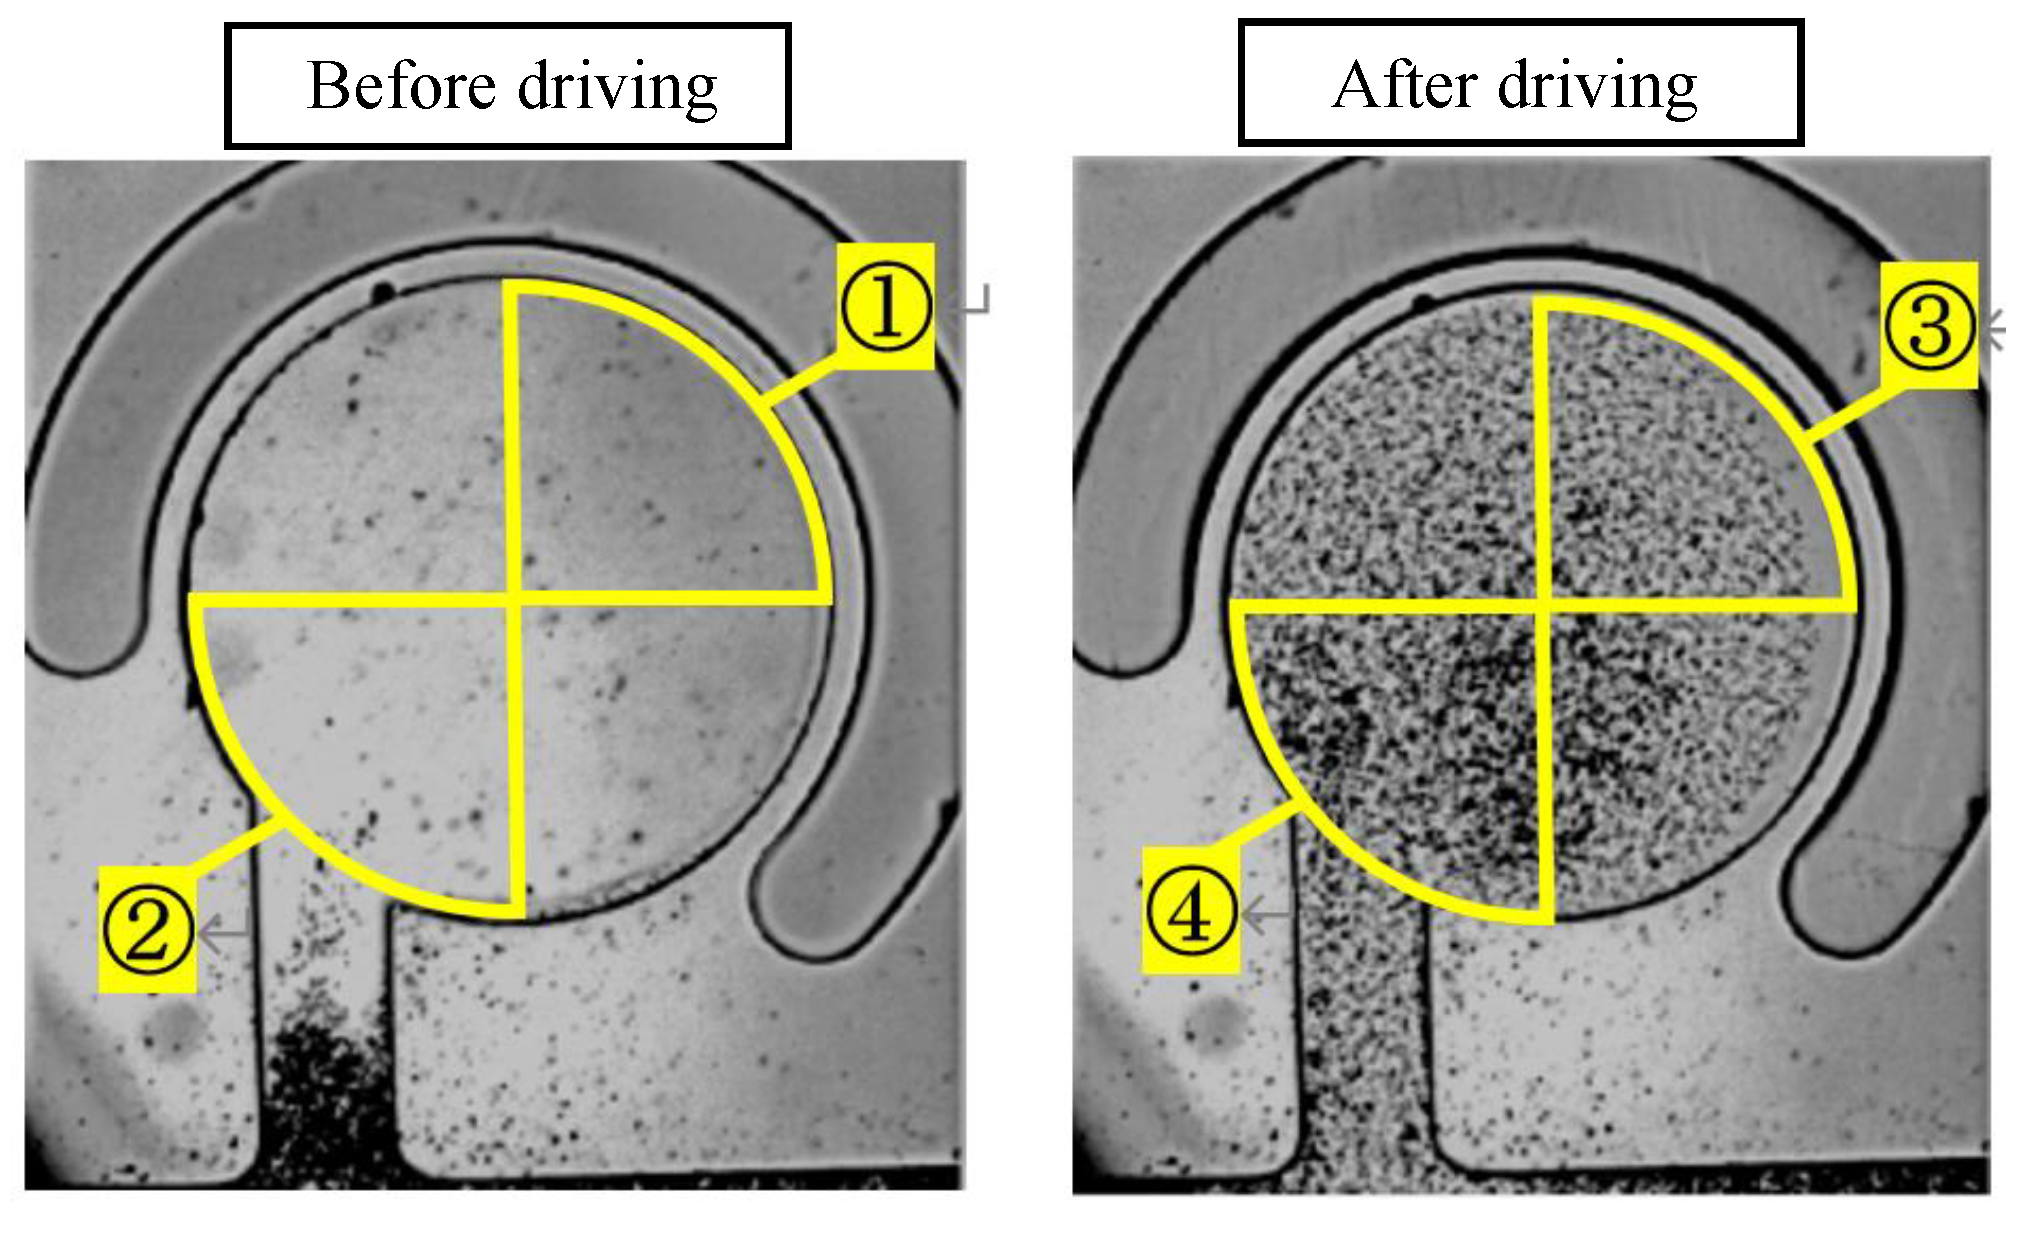
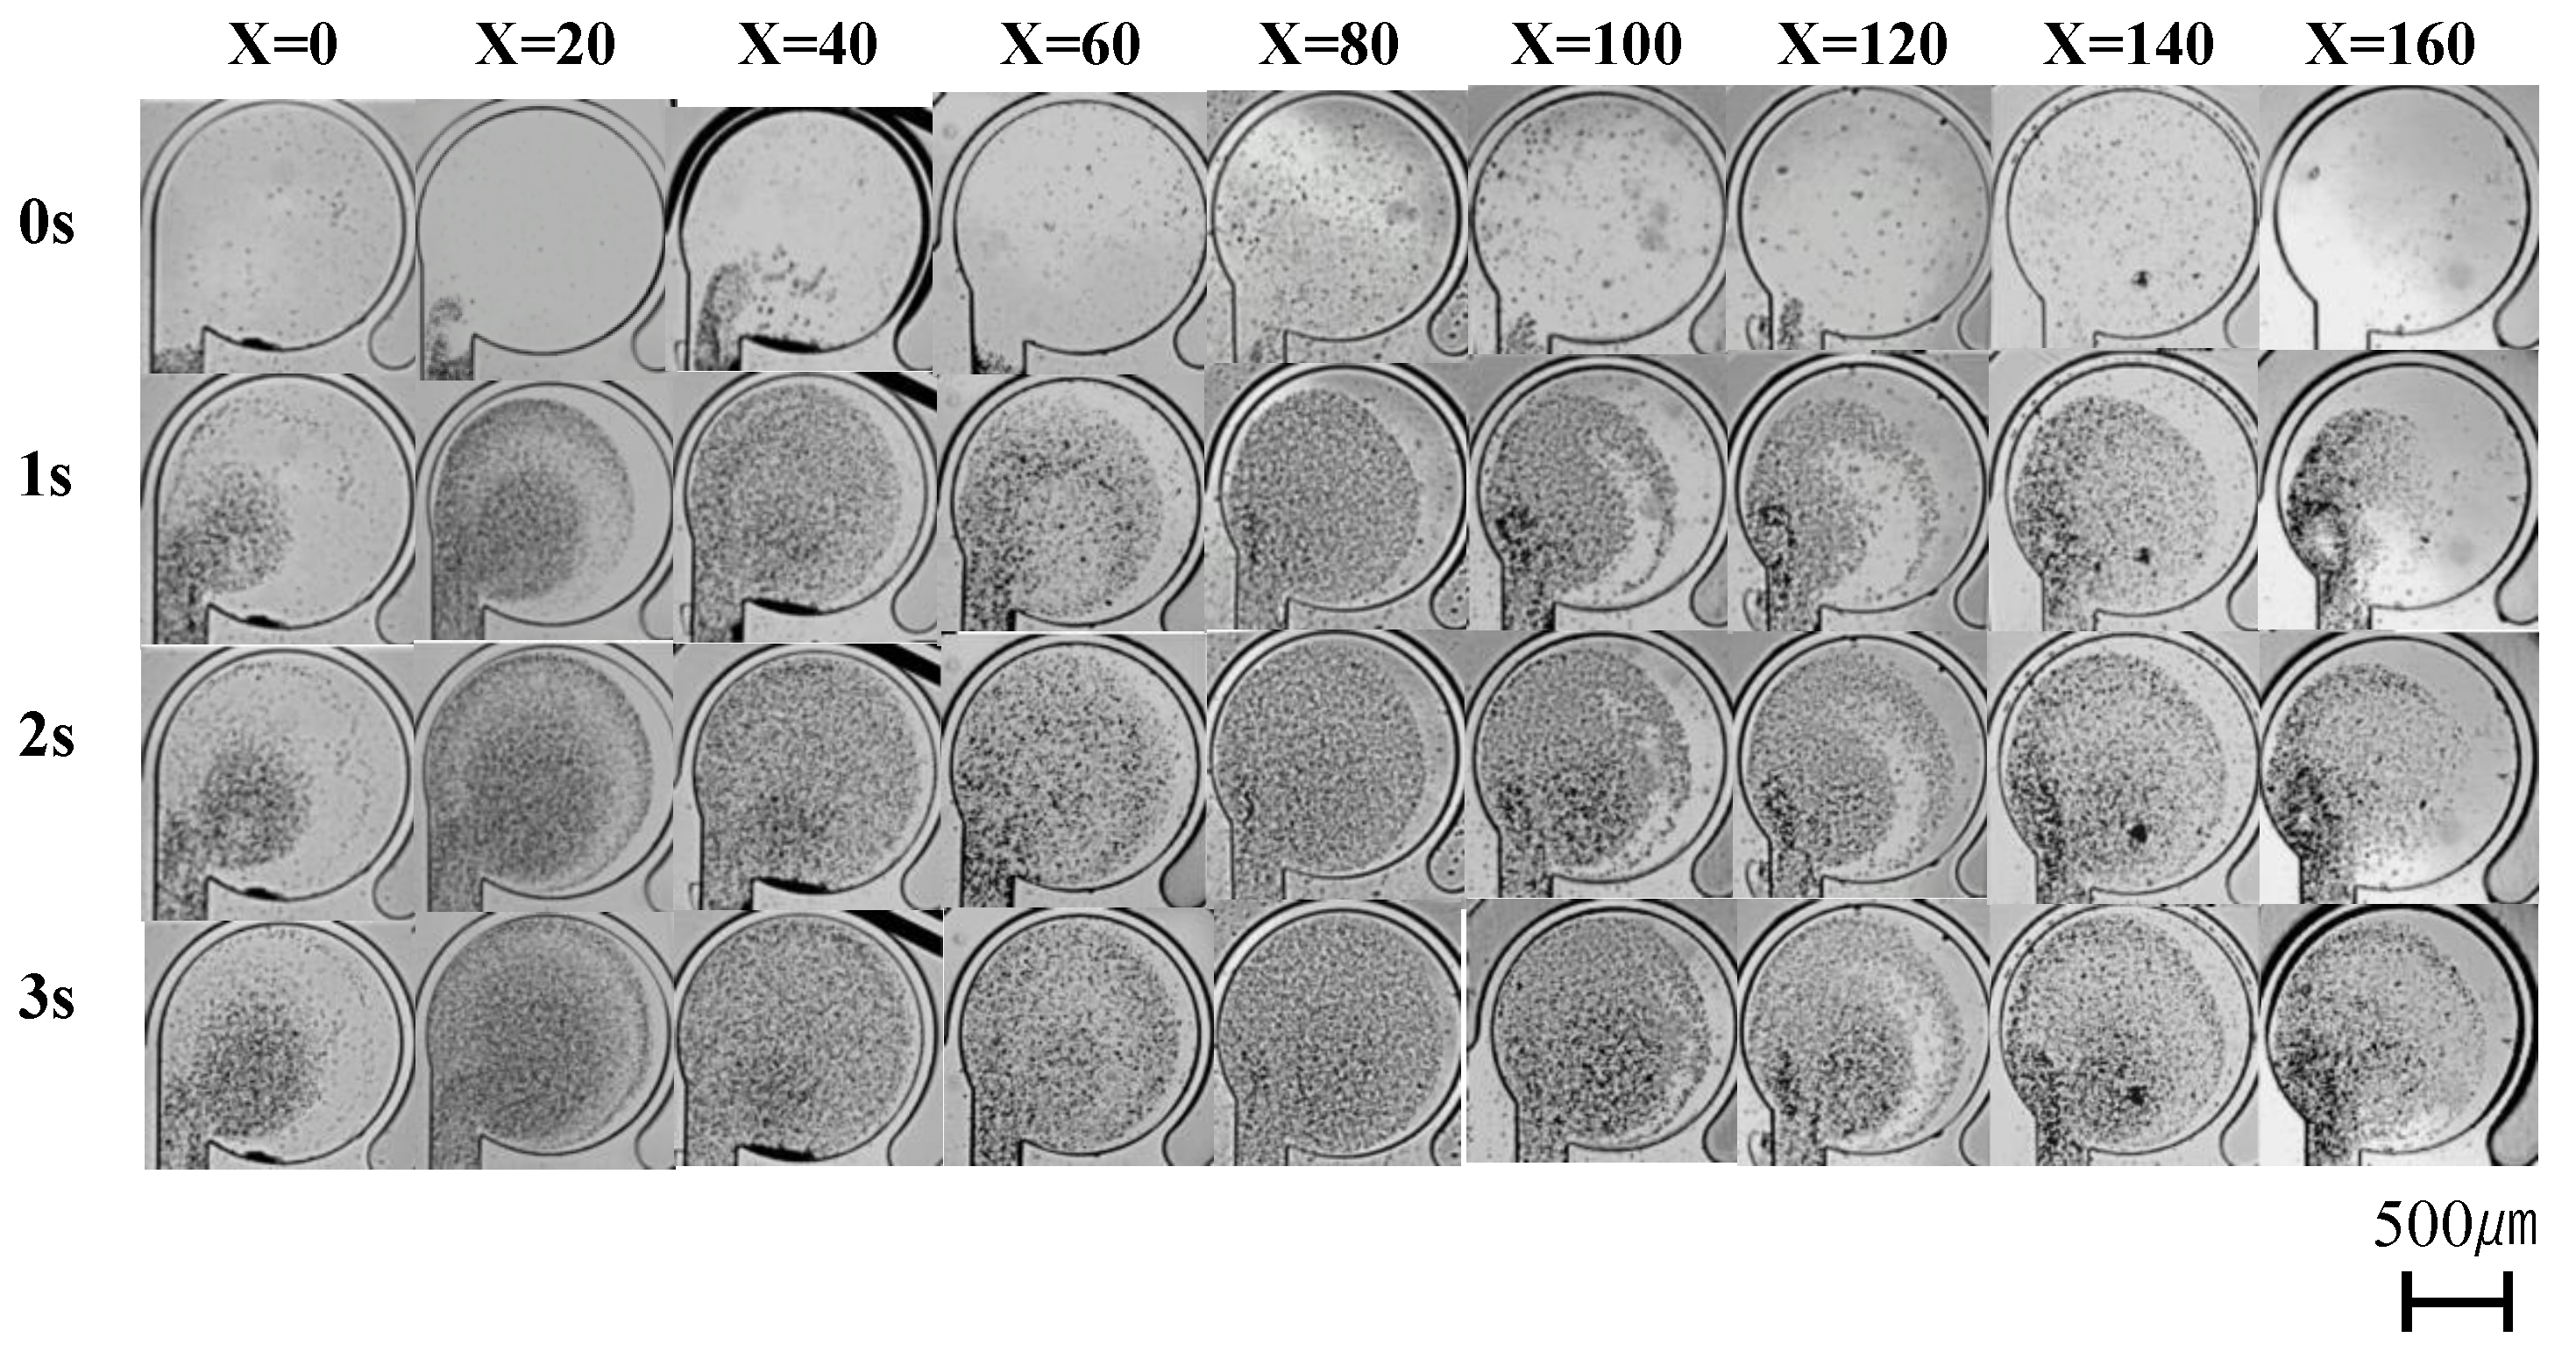
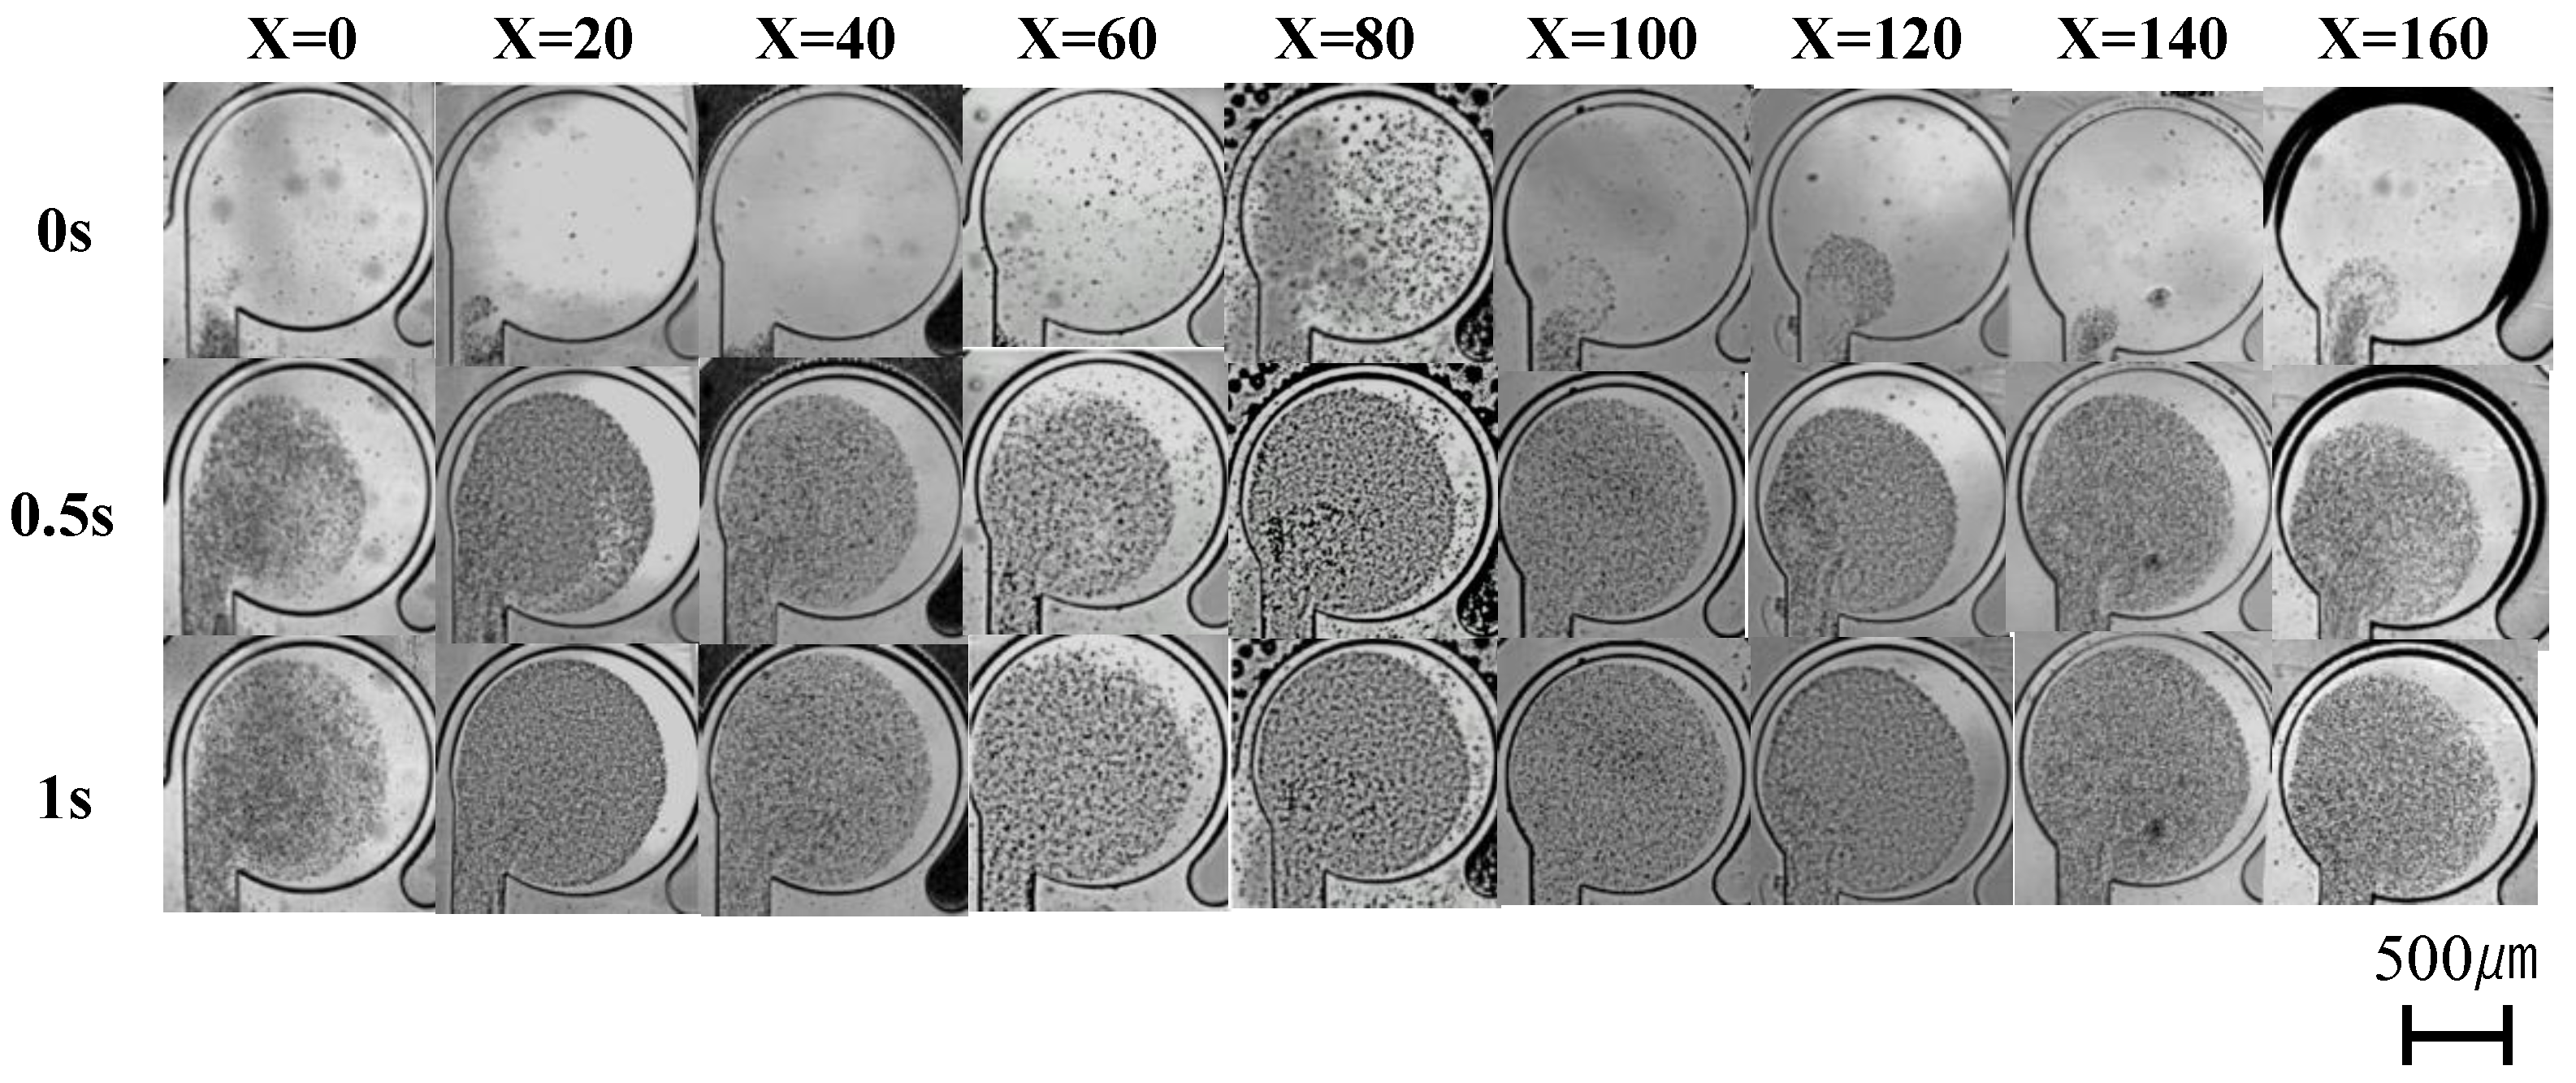
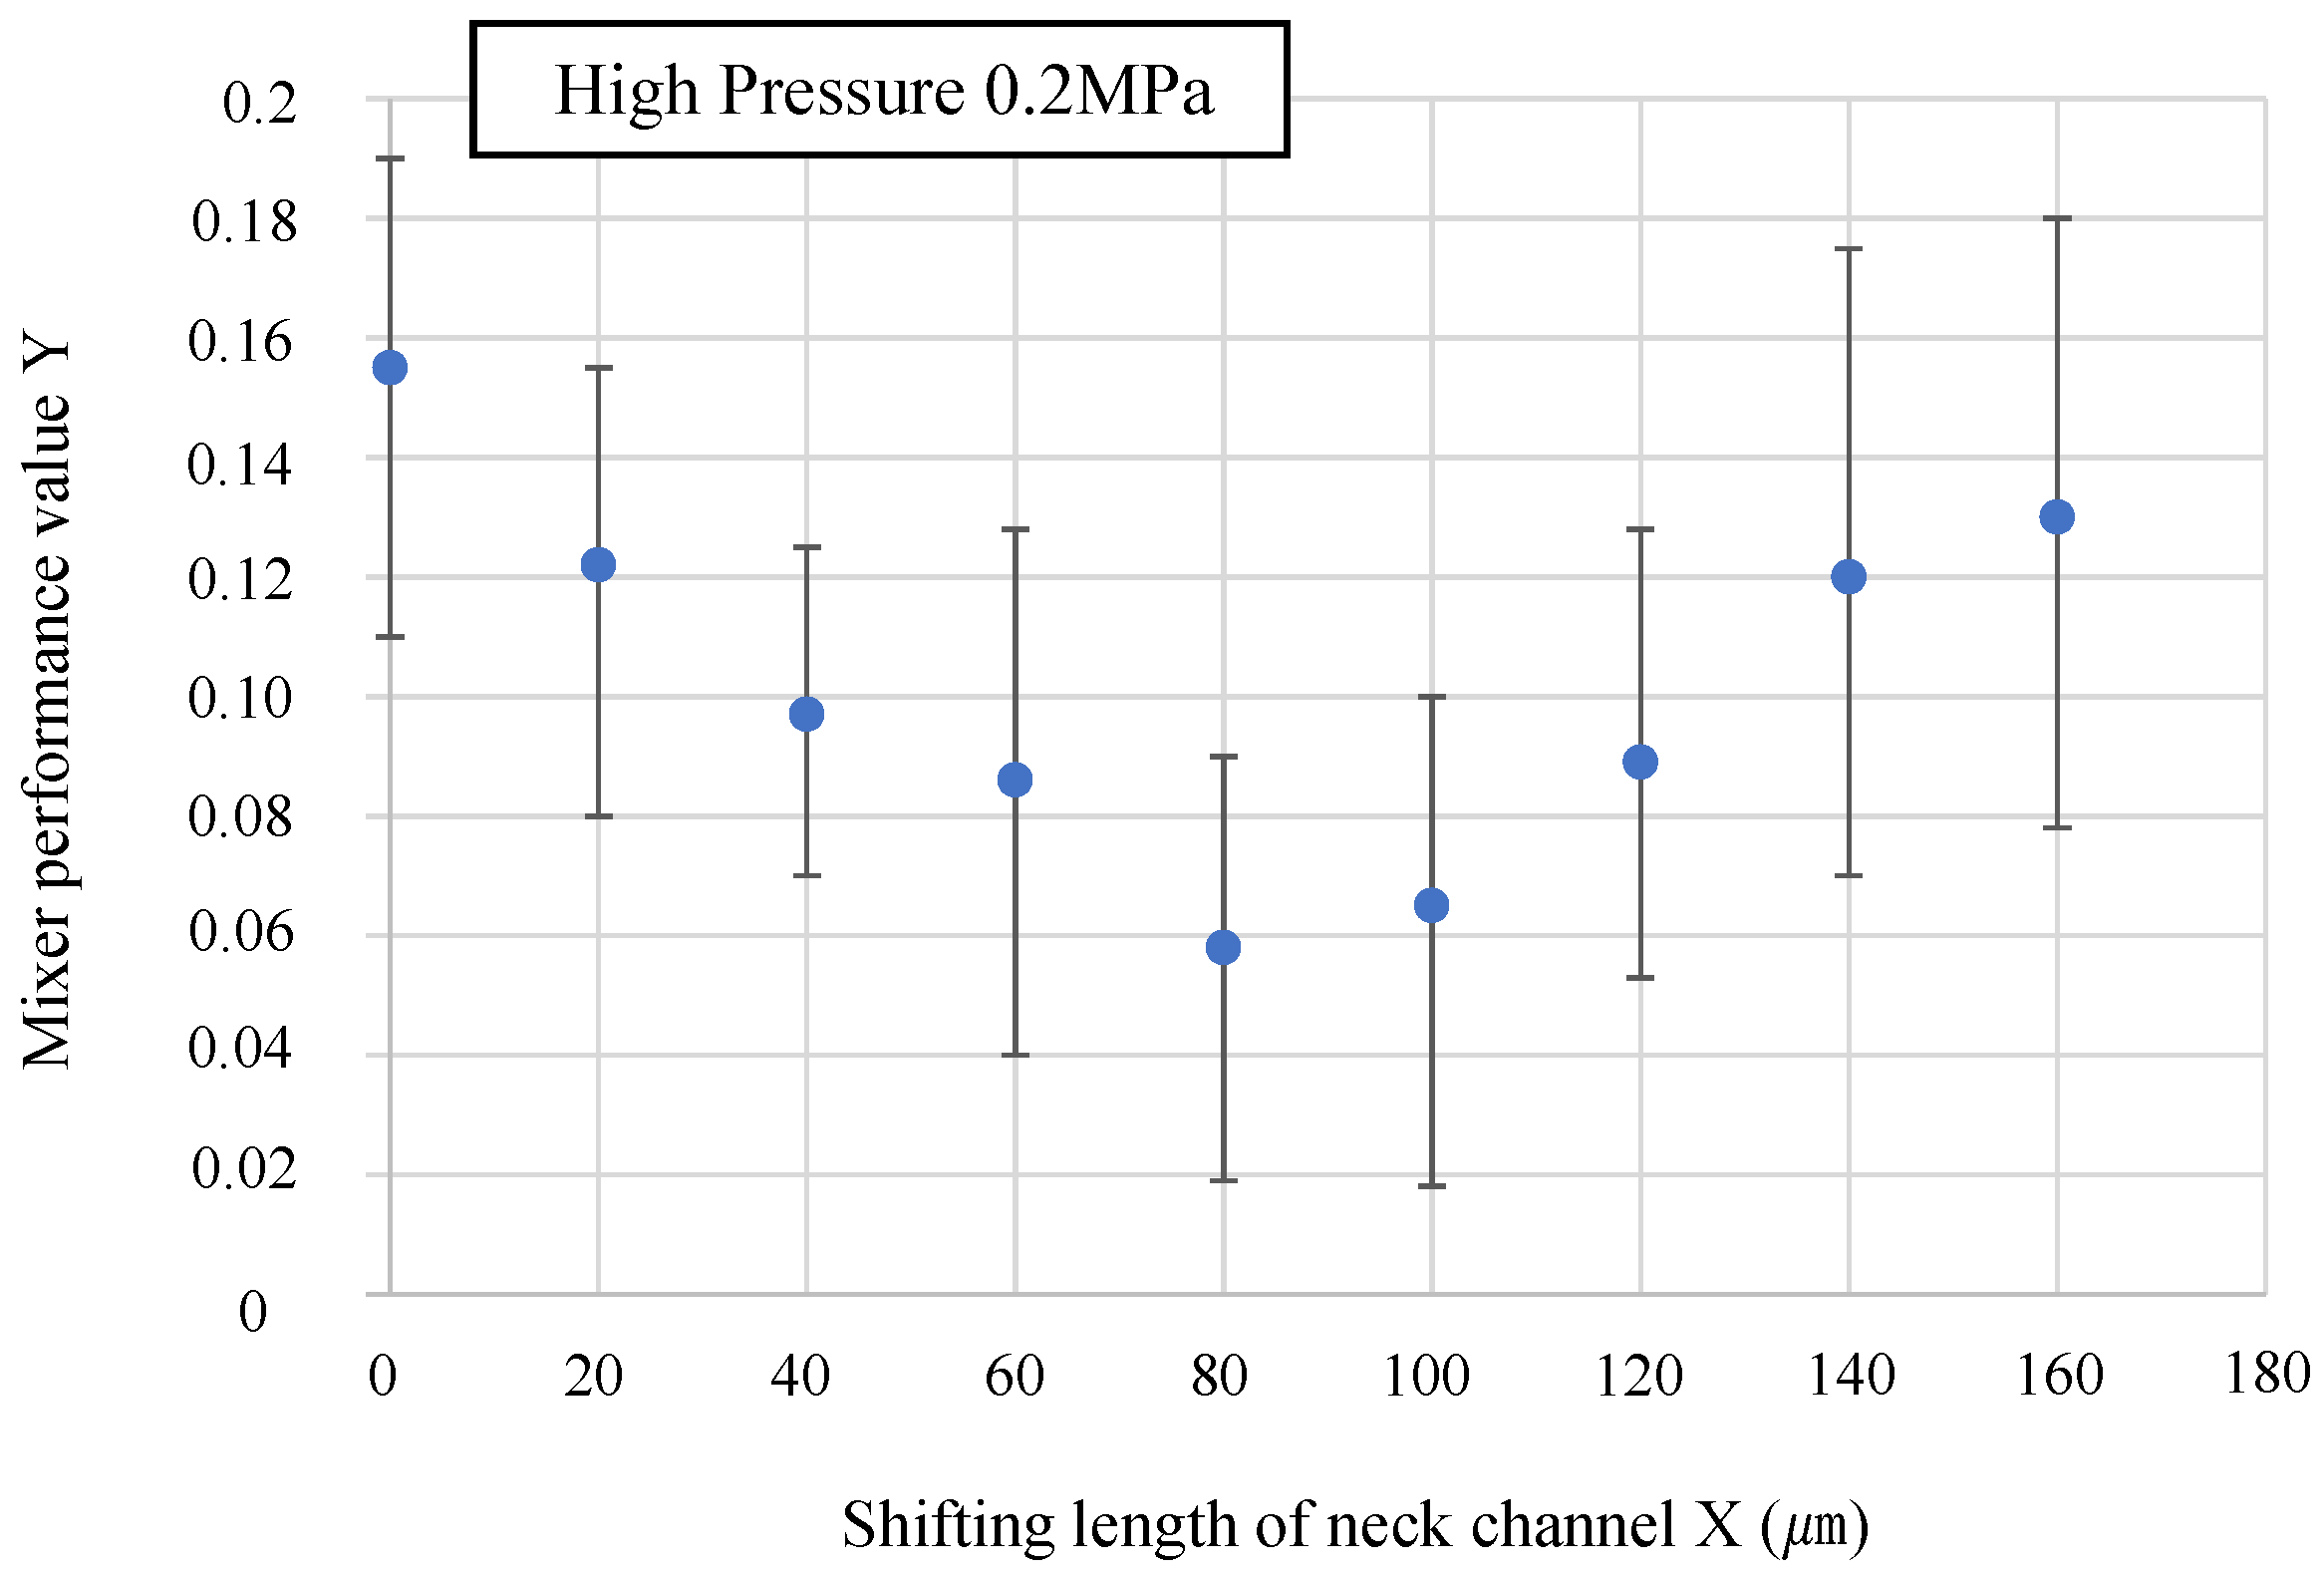
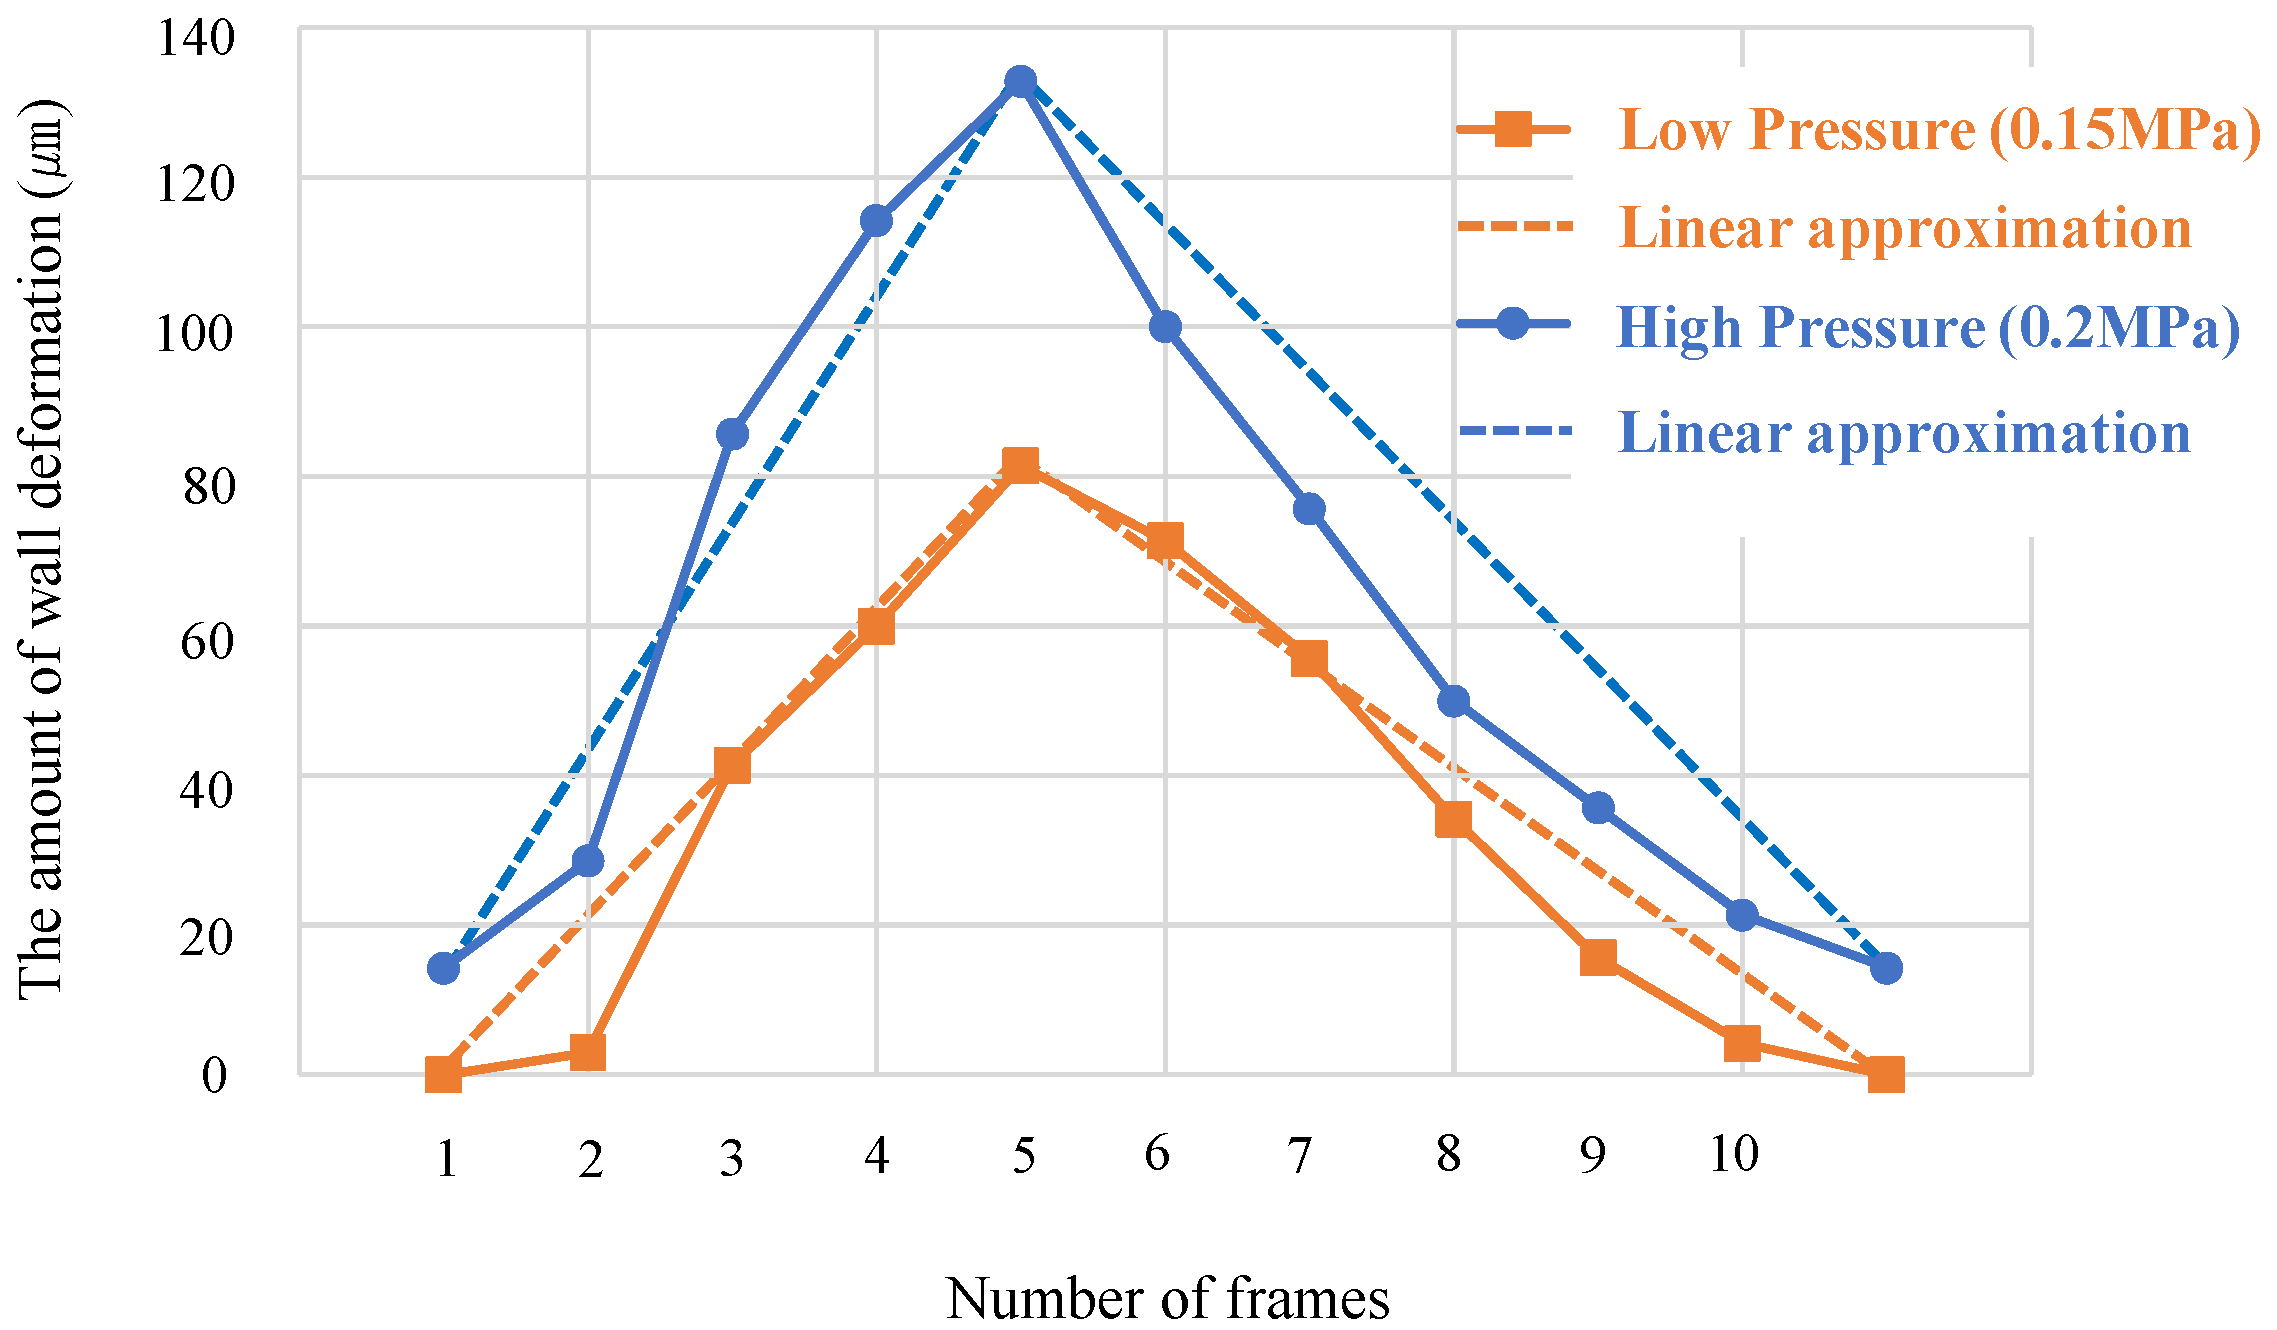
3. Result
Comparison of Mixing Performance
4. Discussion
5. Conclusions
Author Contributions
Funding
Data Availability Statement
Conflicts of Interest
References
- Raza, W.; Hossain, S.; Kim, K.W. Review of Passive Micromixers with a Comparative Analysis. Micromachines 2020, 11, 455. [Google Scholar] [CrossRef] [PubMed]
- Park, S.; Kim, J.K.; Park, J.; Chung, S.; Chung, C.; Chang, J.K. Rapid three-dimensional passive rotation micromixer using the breakup process. J. Micromech. Microeng. 2003, 14, 6–14. [Google Scholar] [CrossRef]
- Alam, A.; Afzal, A.; Kim, K.-Y. Mixing performance of a planar micromixer with circular obstruct ions in a curved microchannel. Chem. Eng. Res. Des. 2014, 92, 423–434. [Google Scholar] [CrossRef]
- Afzal, A.; Kim, K.-Y. Passive split and recombination micromixer with convergent–divergent walls. Chem. Eng. J. 2012, 203, 182–192. [Google Scholar] [CrossRef]
- Ansari, M.A.; Kim, K.-Y.; Anwar, K.; Kim, S.M. A novel passive micromixer based on unbalanced splits and collisions of fluid streams. J. Micromech. Microeng. 2010, 20, 055007. [Google Scholar] [CrossRef]
- Liu, R.H.; Stremler, M.A.; Sharp, K.V.; Olsen, M.G.; Santiago, J.G.; Adrian, R.J.; Aref, H.; Beebe, D.J. Passive Mixing in a Three-Dimensional Serpentine Microchannel. J. Microelectromech. Syst. 2000, 9, 190–197. [Google Scholar] [CrossRef]
- Lin, C.-H.; Tsai, C.-H.; Fu, L.-M. A rapid three-dimensional vortex micromixer utilizing self-rotation effects under low Reynolds number conditions. J. Micromech. Microeng. 2005, 15, 935. [Google Scholar] [CrossRef]
- Hong, H.; Choi, I.; Ahn, C.H. A novel in-plane passive microfluidic mixer with modified Tesla structures. Lab Chip 2004, 4, 109–113. [Google Scholar] [CrossRef]
- Yang, J.-T.; Huang, K.-J.; Lin, Y.-C. Geometric effects on fluid mixing in passive grooved micromixers. Lab Chip 2005, 5, 1140–1147. [Google Scholar] [CrossRef]
- Viktorov, V.; Nimafar, M. A novel generation of 3D SAR-based passive micromixer: Efficient mixing and low pressure drop at a low Reynolds number. J. Micromech. Microeng. 2013, 23, 055023. [Google Scholar] [CrossRef]
- Zhou, T.; Wang, H.; Shi, L.; Liu, Z.; Joo, S.W. An enhanced electroosmotic micromixer with an efficient asymmetric lateral structure. Micromachines 2016, 7, 218. [Google Scholar] [CrossRef] [PubMed]
- Ahmed, D.; Mao, X.; Juluri, B.K.; Huang, T.J. A fast microfluidic mixer based on acoustically driven sidewall-trapped microbubbles. Microfluid Nanofluid 2009, 7, 727–731. [Google Scholar] [CrossRef]
- Abbas, Y.; Miwa, J.; Zengerle, R.; von Stetten, F. Active continuous-flow micromixer using an external braille pin actuator array. Micromachines 2013, 4, 80–89. [Google Scholar] [CrossRef]
- Glasgow, I.; Lieber, S.; Aubry, N. Parameters Influencing Pulsed Flow Mixing in Microchannels. Anal. Chem. 2004, 76, 4825–4832. [Google Scholar] [CrossRef] [PubMed]
- Owen, D.; Ballard, M.; Alexeev, A.; Hesketh, P.J. Rapid microfluidic mixing via rotating magnetic microbeads. Sens. Actuators A Phys. 2016, 251, 84–91. [Google Scholar] [CrossRef]
- Yang, Z.; Matsumoto, S.; Goto, H.; Matsumoto, M.; Maeda, R. Ultrasonic micromixer for microfluidic systems. Sens. Actuators A 2001, 93, 266–272. [Google Scholar] [CrossRef]
- Tsai, T.-H.; Liou, D.-S.; Kuo, L.-S.; Chen, P.-H. Rapid mixing between ferro-nanofluid and water in a semi-active Y-type micromixer. Sens. Actuators A 2009, 153, 267–273. [Google Scholar] [CrossRef]
- Bahrami, D.; Nadooshan, A.A.; Bayaref, M. Effect of non-uniform magnetic field on mixing index of a sinusoidal micromixer. Korean J. Chem. Eng. 2022, 39, 316–327. [Google Scholar] [CrossRef]
- Veldurthi, N.; Chandel, S.; Bhave, T.; Bodas, D. Computational fluid dynamic analysis of poly (dimethyl siloxane) magnetic actuator based micromixer. Sens. Actuators B 2015, 212, 419–424. [Google Scholar] [CrossRef]
- Huang, P.; Xie, Y.; Ahmed, D.; Rufo, J.; Nama, N.; Chen, Y.; Chan, C.Y.; Huang, T.J. An acoustofluidic micromixer based on oscillating sidewall sharp-edges. Lab Chip 2013, 13, 3847–3852. [Google Scholar] [CrossRef]
- Oddy, M.H.; Santiago, J.G.; Mikkelsen, J.C. Electrokinetic Instability Micromixing. Anal. Chem. 2001, 73, 5822–5832. [Google Scholar] [CrossRef] [PubMed]
- Eilenberger, C.; Rothbauer, M.; Selinger, F.; Gerhartl, A.; Jordan, C.; Harasek, M.; Schädl, B.; Grillari, J.; Weghuber, J.; Neuhaus, W.; et al. A Microfluidic Multisize Spheroid Array for Multiparametric Screening of Anticancer Drugs and Blood–Brain BarrierTransport Properties. Adv. Sci. 2021, 8, 2004856. [Google Scholar] [CrossRef] [PubMed]
- Lim, W.; Park, S. A Microfluidic Spheroid Culture Device with a Concentration Gradient Generator for High-Throughput Screening of Drug Efficacy. Molecules 2018, 23, 3355. [Google Scholar] [CrossRef] [PubMed]
- Cui, X.; Dini, S.; Dai, S.; Bi, J.; Binder, B.J.; Green, J.E.F.; Zhang, H. A mechanistic study on tumour spheroid formation in thermosensitive hydrogels: Experiments and mathematical modelling. RSC Adv. 2016, 6, 73282–73291. [Google Scholar] [CrossRef]
- Glicklis, R.; Merchuk, J.C.; Cohen, S. Modeling Mass Transfer in Hepatocyte Spheroids via Cell Viability, Spheroid Size, and Hepatocellular Functions. Biotechnol. Bioeng. 2004, 86, 672–680. [Google Scholar] [CrossRef]


| Low Pressure (0.15 MPa) | High Pressure (0.2 MPa) | |
|---|---|---|
| Average wall deformation (µm) | 40.5 | 73.5 |
| Appropriate shift length (µm) | 40 | 80 |
Disclaimer/Publisher’s Note: The statements, opinions and data contained in all publications are solely those of the individual author(s) and contributor(s) and not of MDPI and/or the editor(s). MDPI and/or the editor(s) disclaim responsibility for any injury to people or property resulting from any ideas, methods, instructions or products referred to in the content. |
© 2023 by the authors. Licensee MDPI, Basel, Switzerland. This article is an open access article distributed under the terms and conditions of the Creative Commons Attribution (CC BY) license (https://creativecommons.org/licenses/by/4.0/).
Share and Cite
Yamamoto, D.; Takayama, T. Design Optimization Method for Large-Size Sidewall-Driven Micromixer to Generate Powerful Swirling Flow. Micromachines 2023, 14, 2246. https://doi.org/10.3390/mi14122246
Yamamoto D, Takayama T. Design Optimization Method for Large-Size Sidewall-Driven Micromixer to Generate Powerful Swirling Flow. Micromachines. 2023; 14(12):2246. https://doi.org/10.3390/mi14122246
Chicago/Turabian StyleYamamoto, Daichi, and Toshio Takayama. 2023. "Design Optimization Method for Large-Size Sidewall-Driven Micromixer to Generate Powerful Swirling Flow" Micromachines 14, no. 12: 2246. https://doi.org/10.3390/mi14122246