
Temperature-to-Digital Converters’ Evolution, Trends and Techniques across the Last Two Decades: A Review


Abstract
:1. Introduction
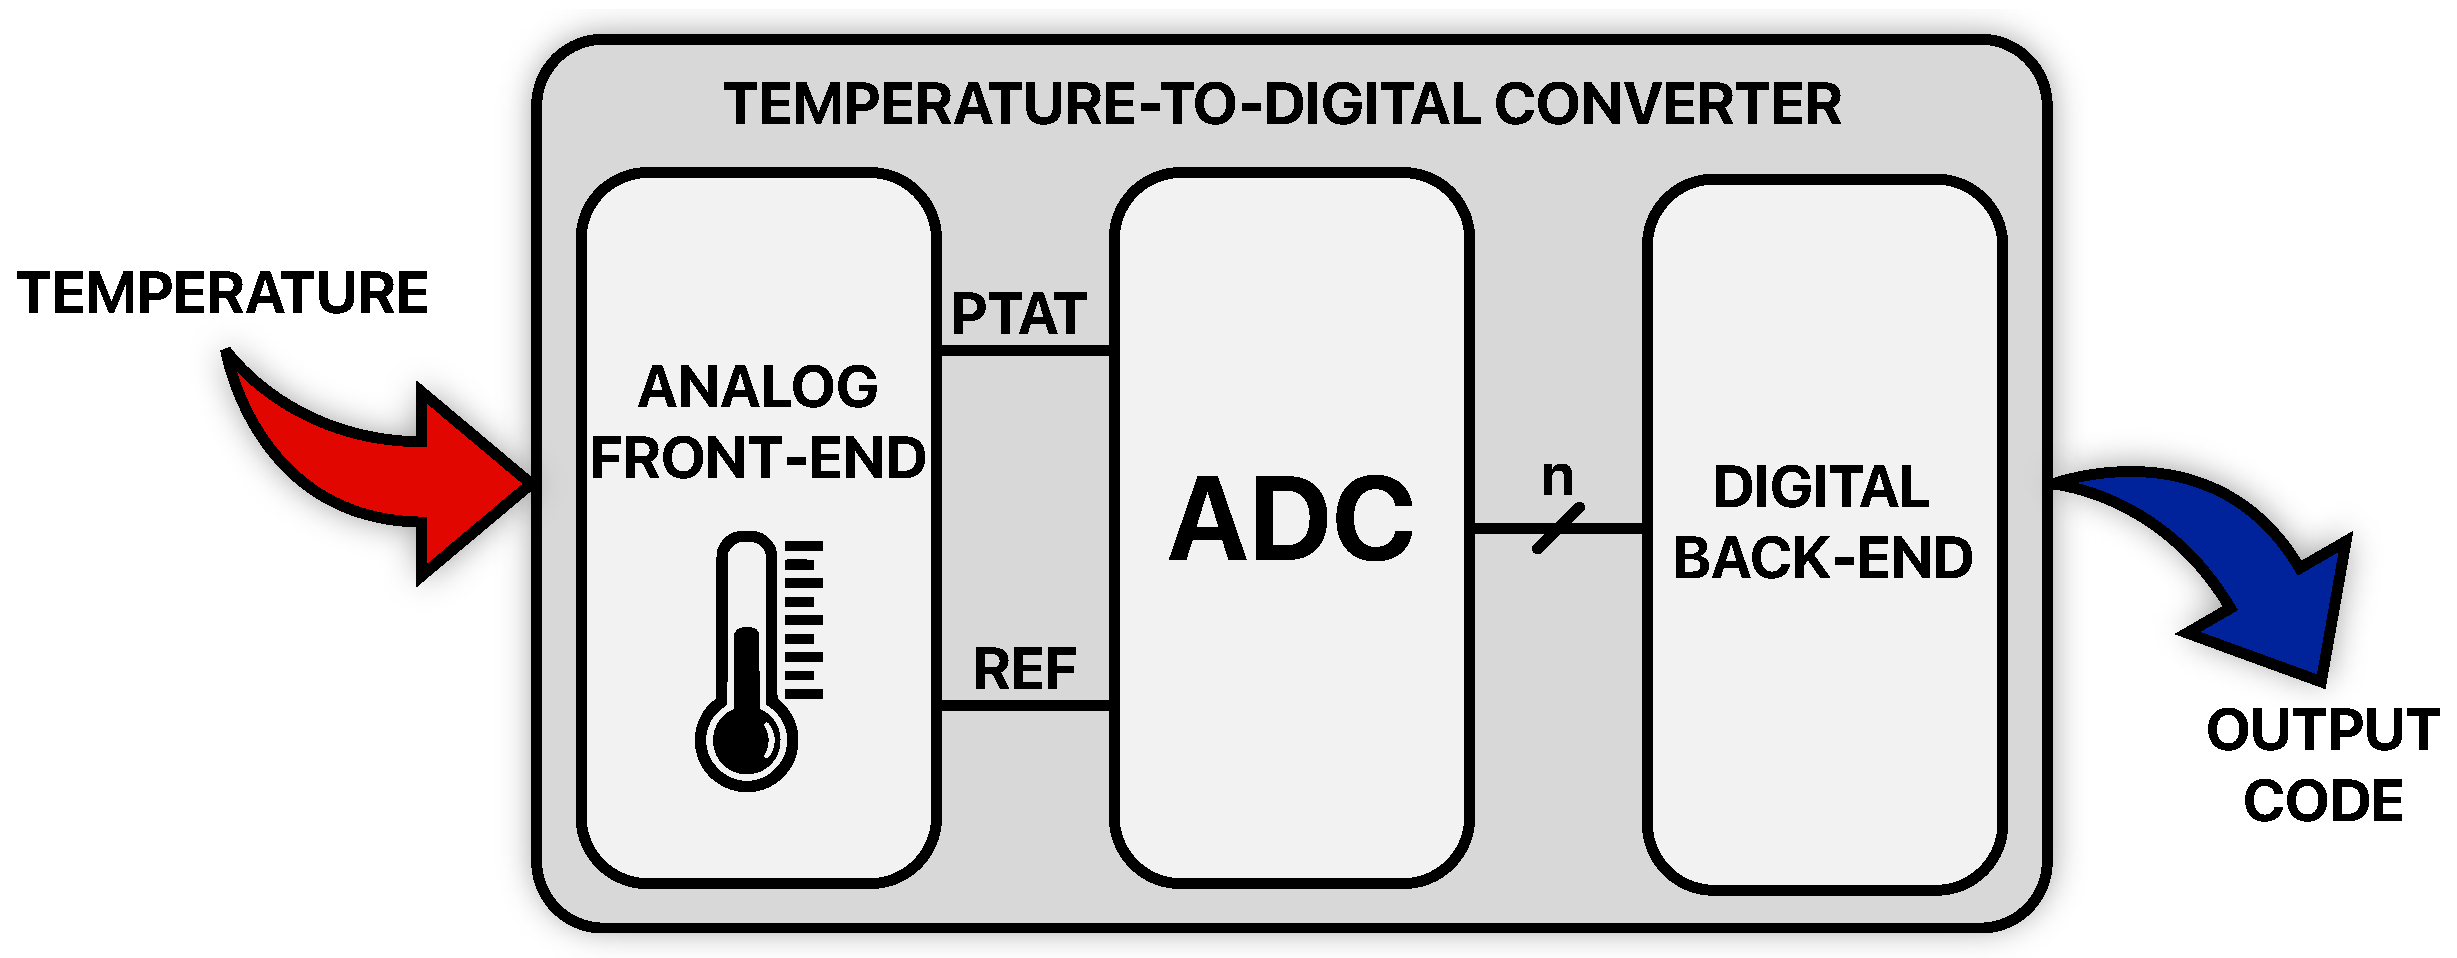
2. Temperature-to-Digital Converters: Theory and Design Techniques
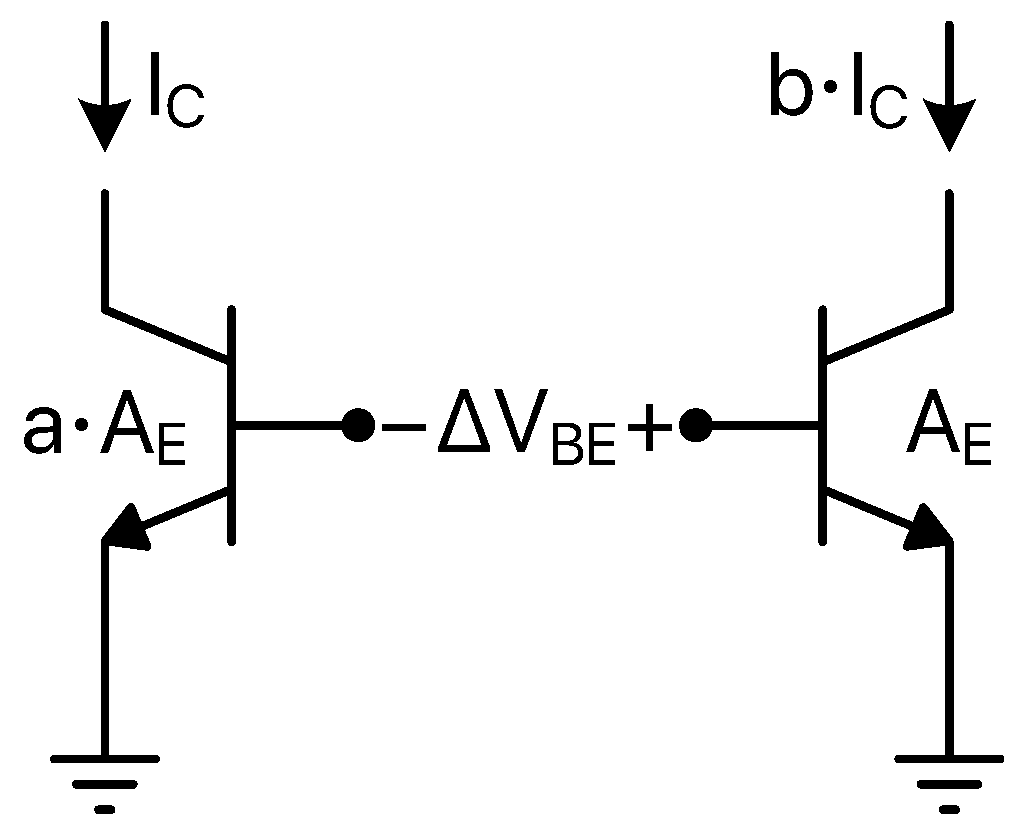
2.1. BJT-Based TDCs
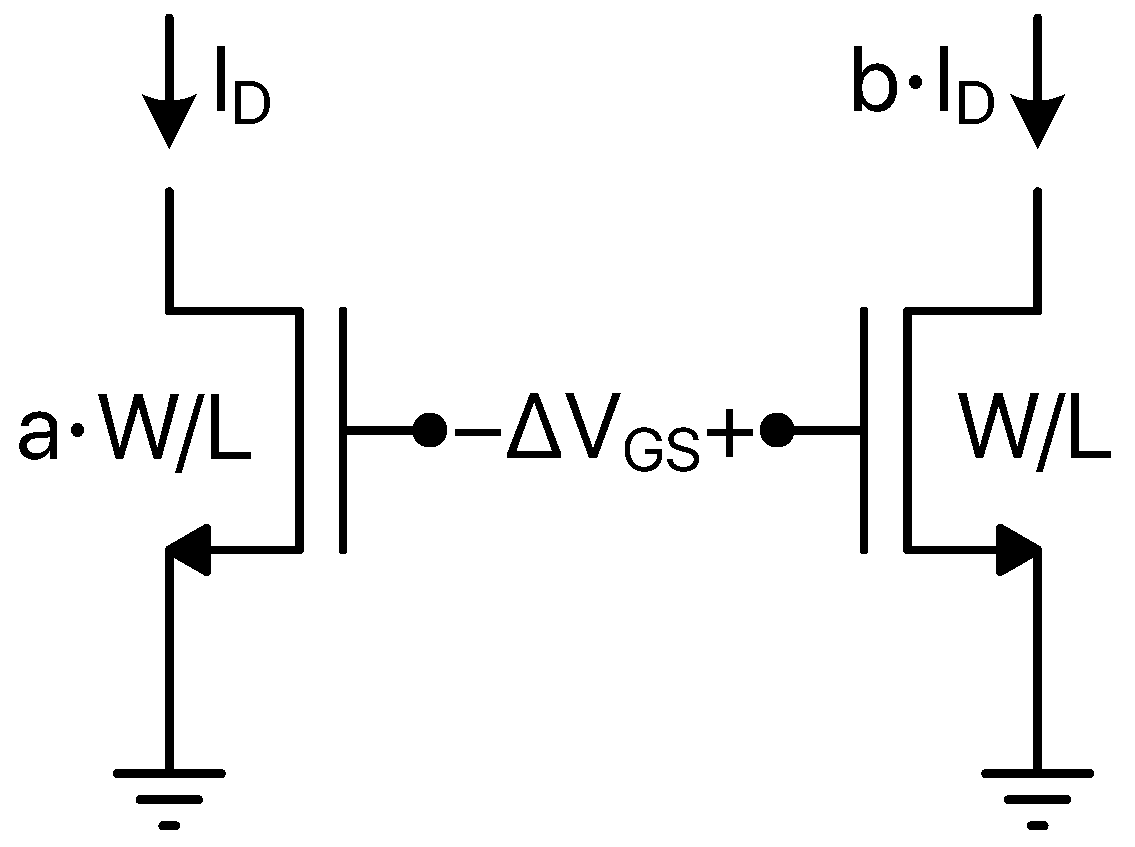
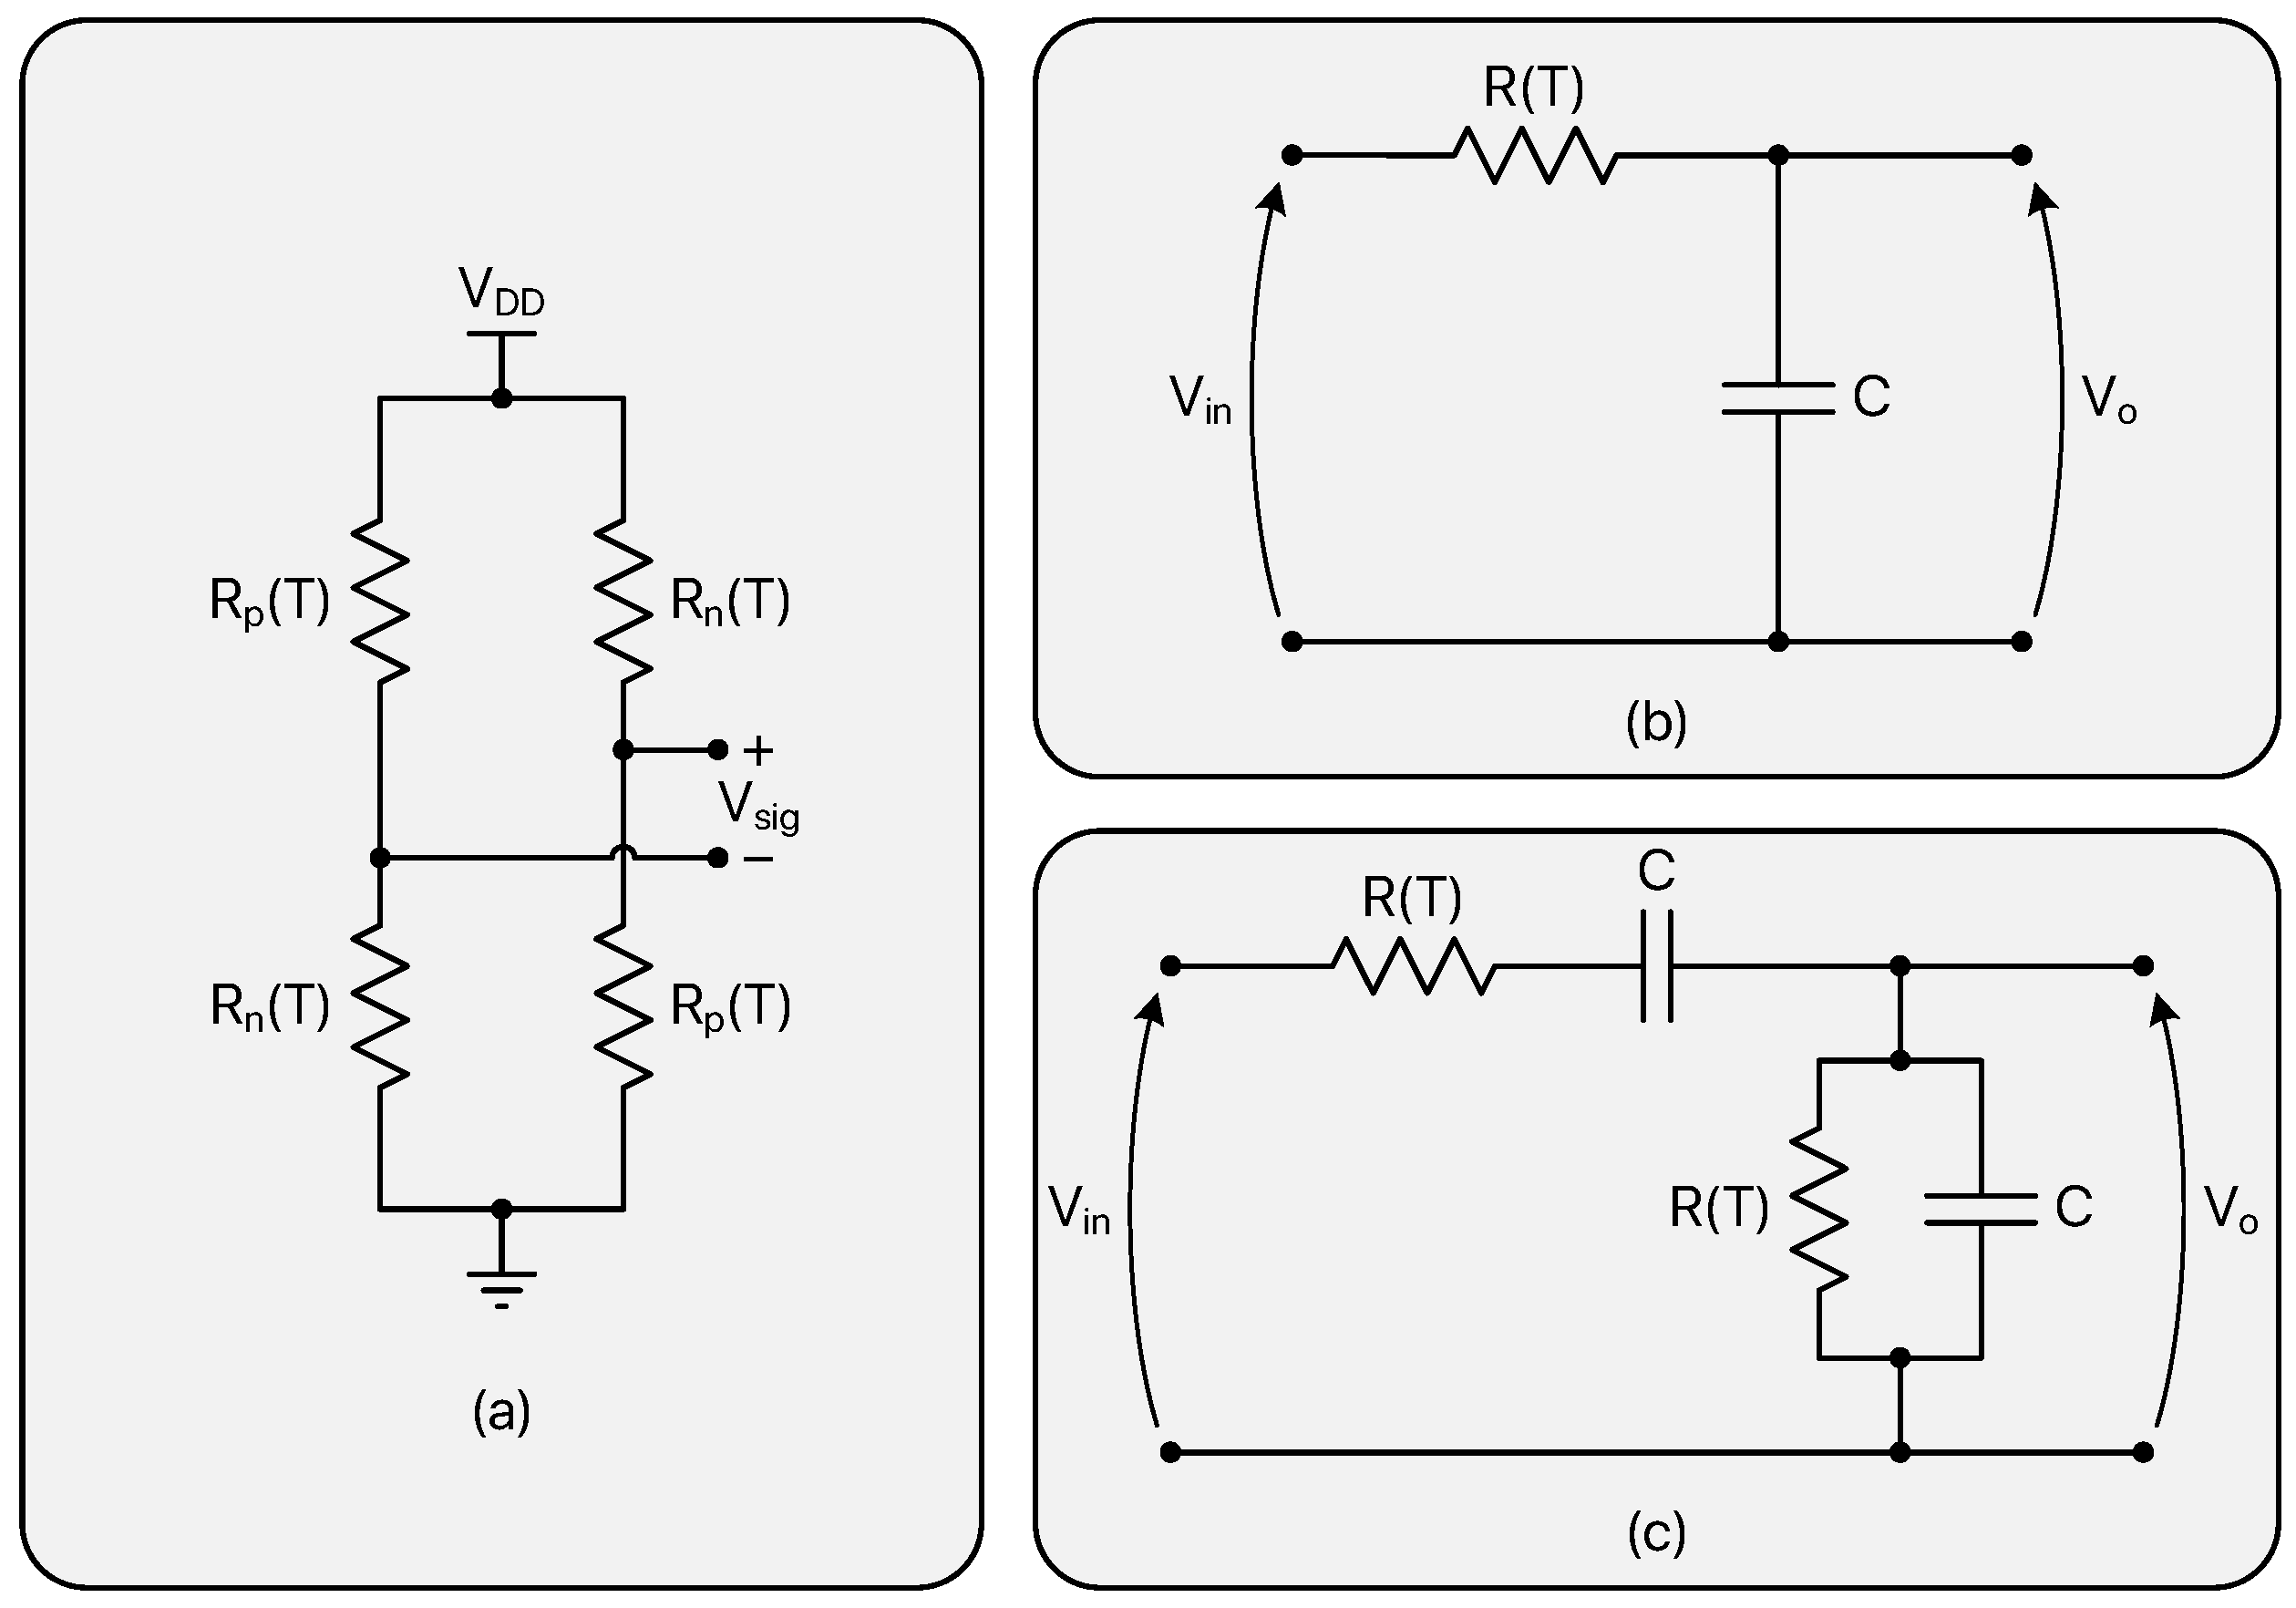
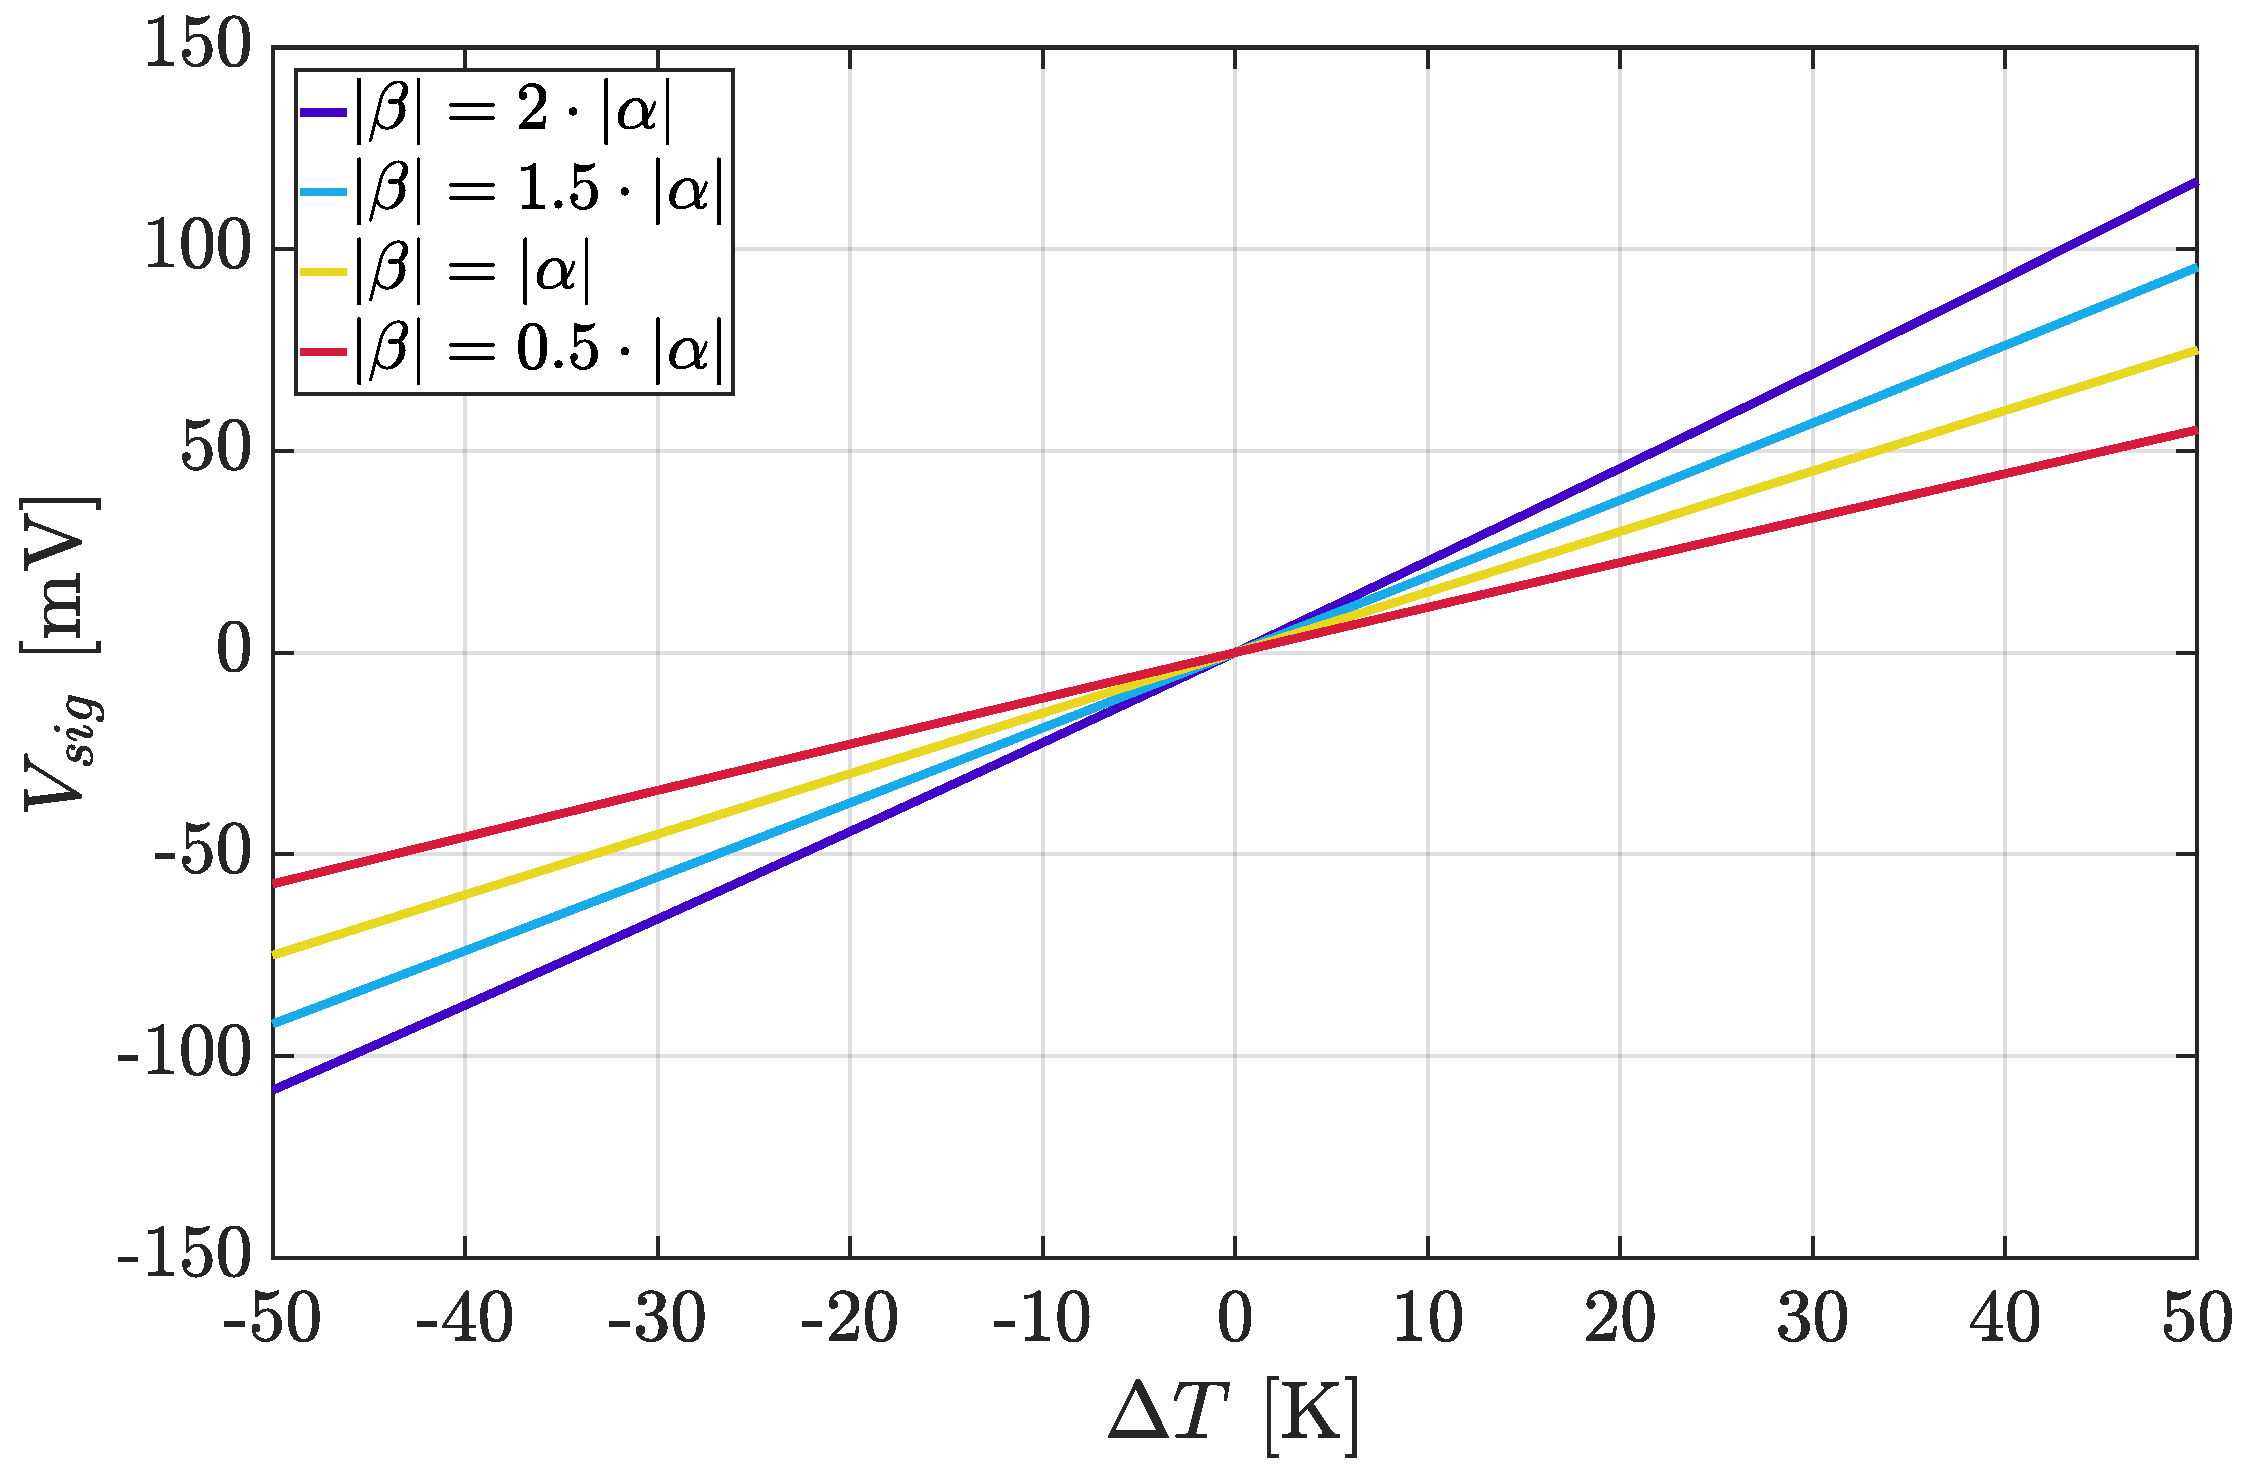
2.2. MOS-Based TDCs
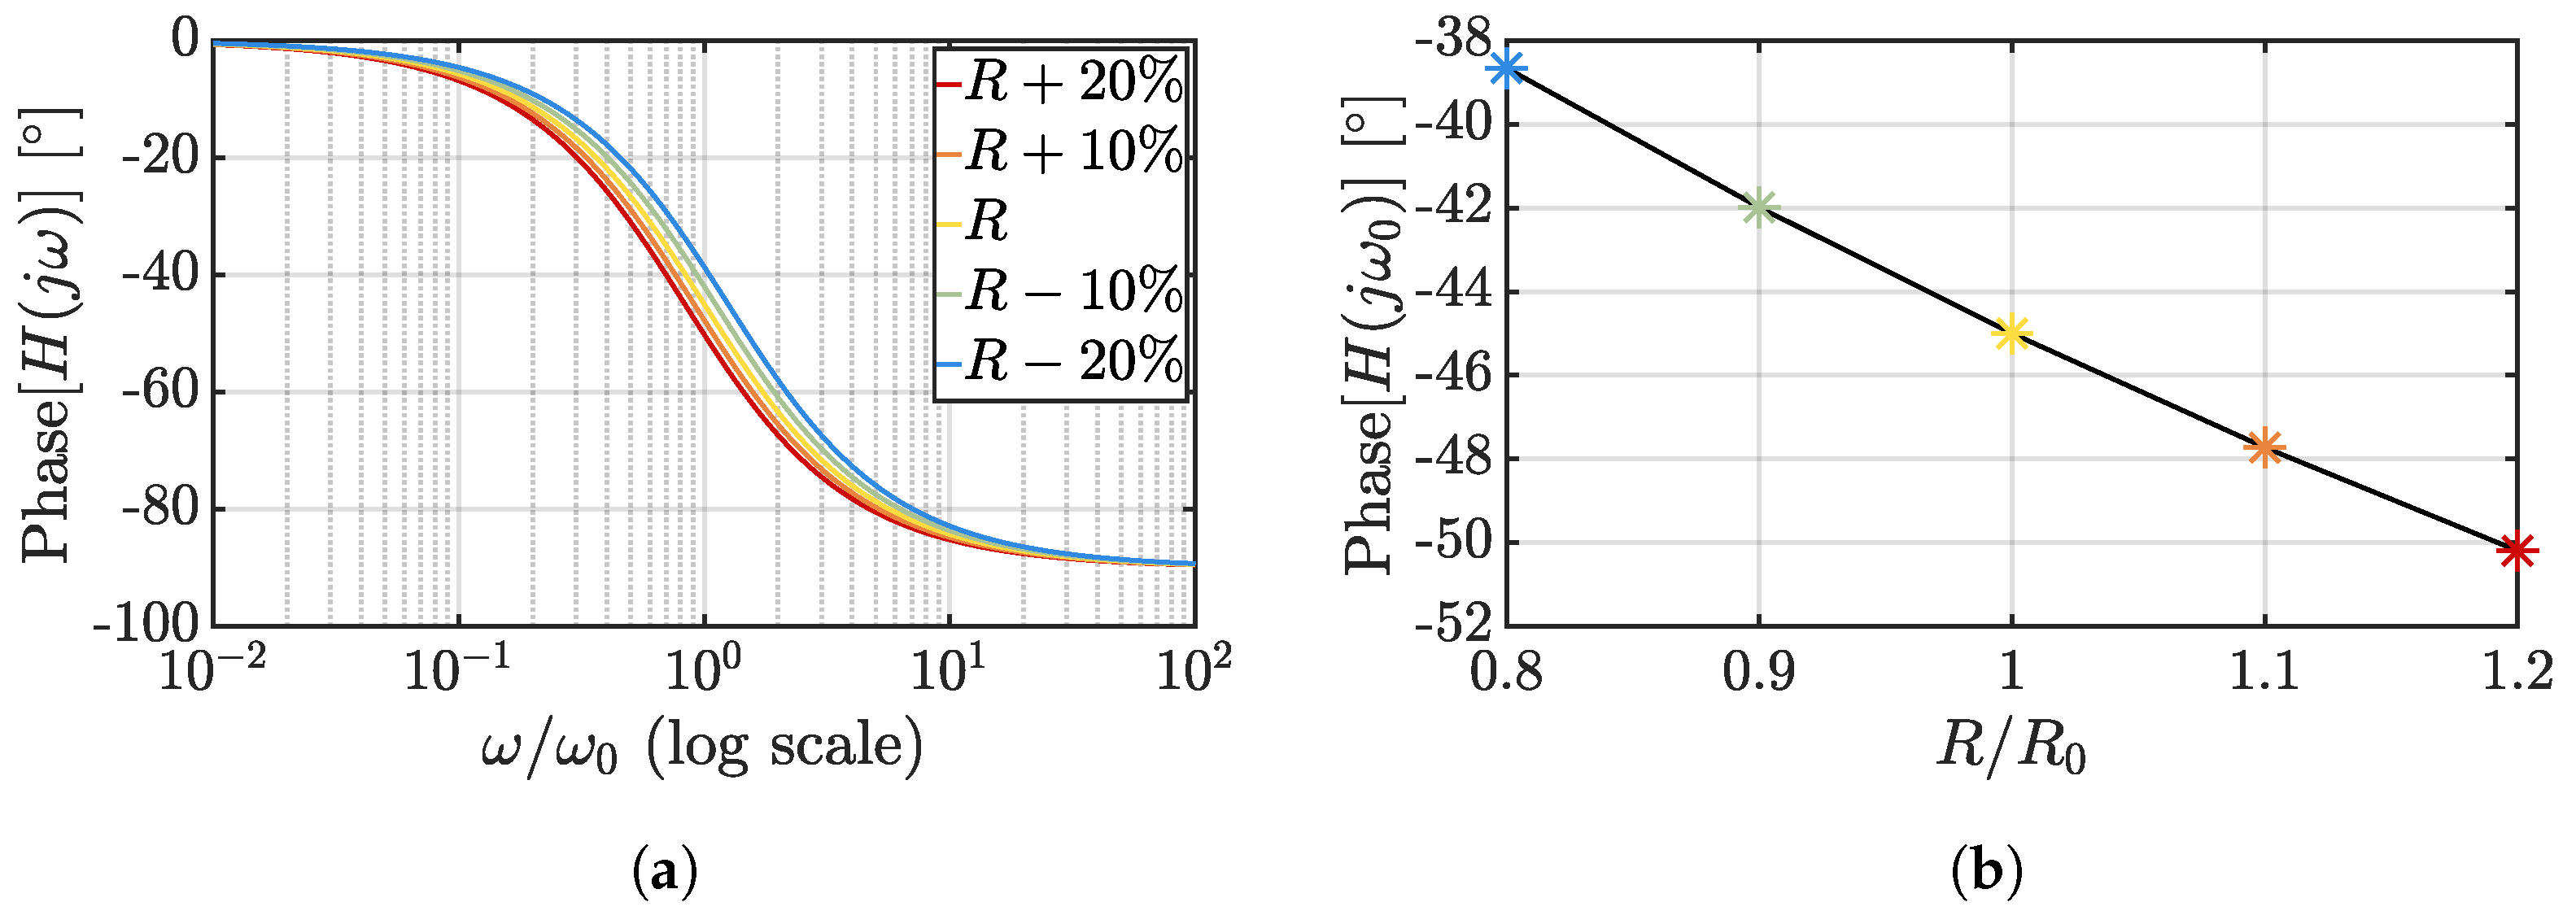
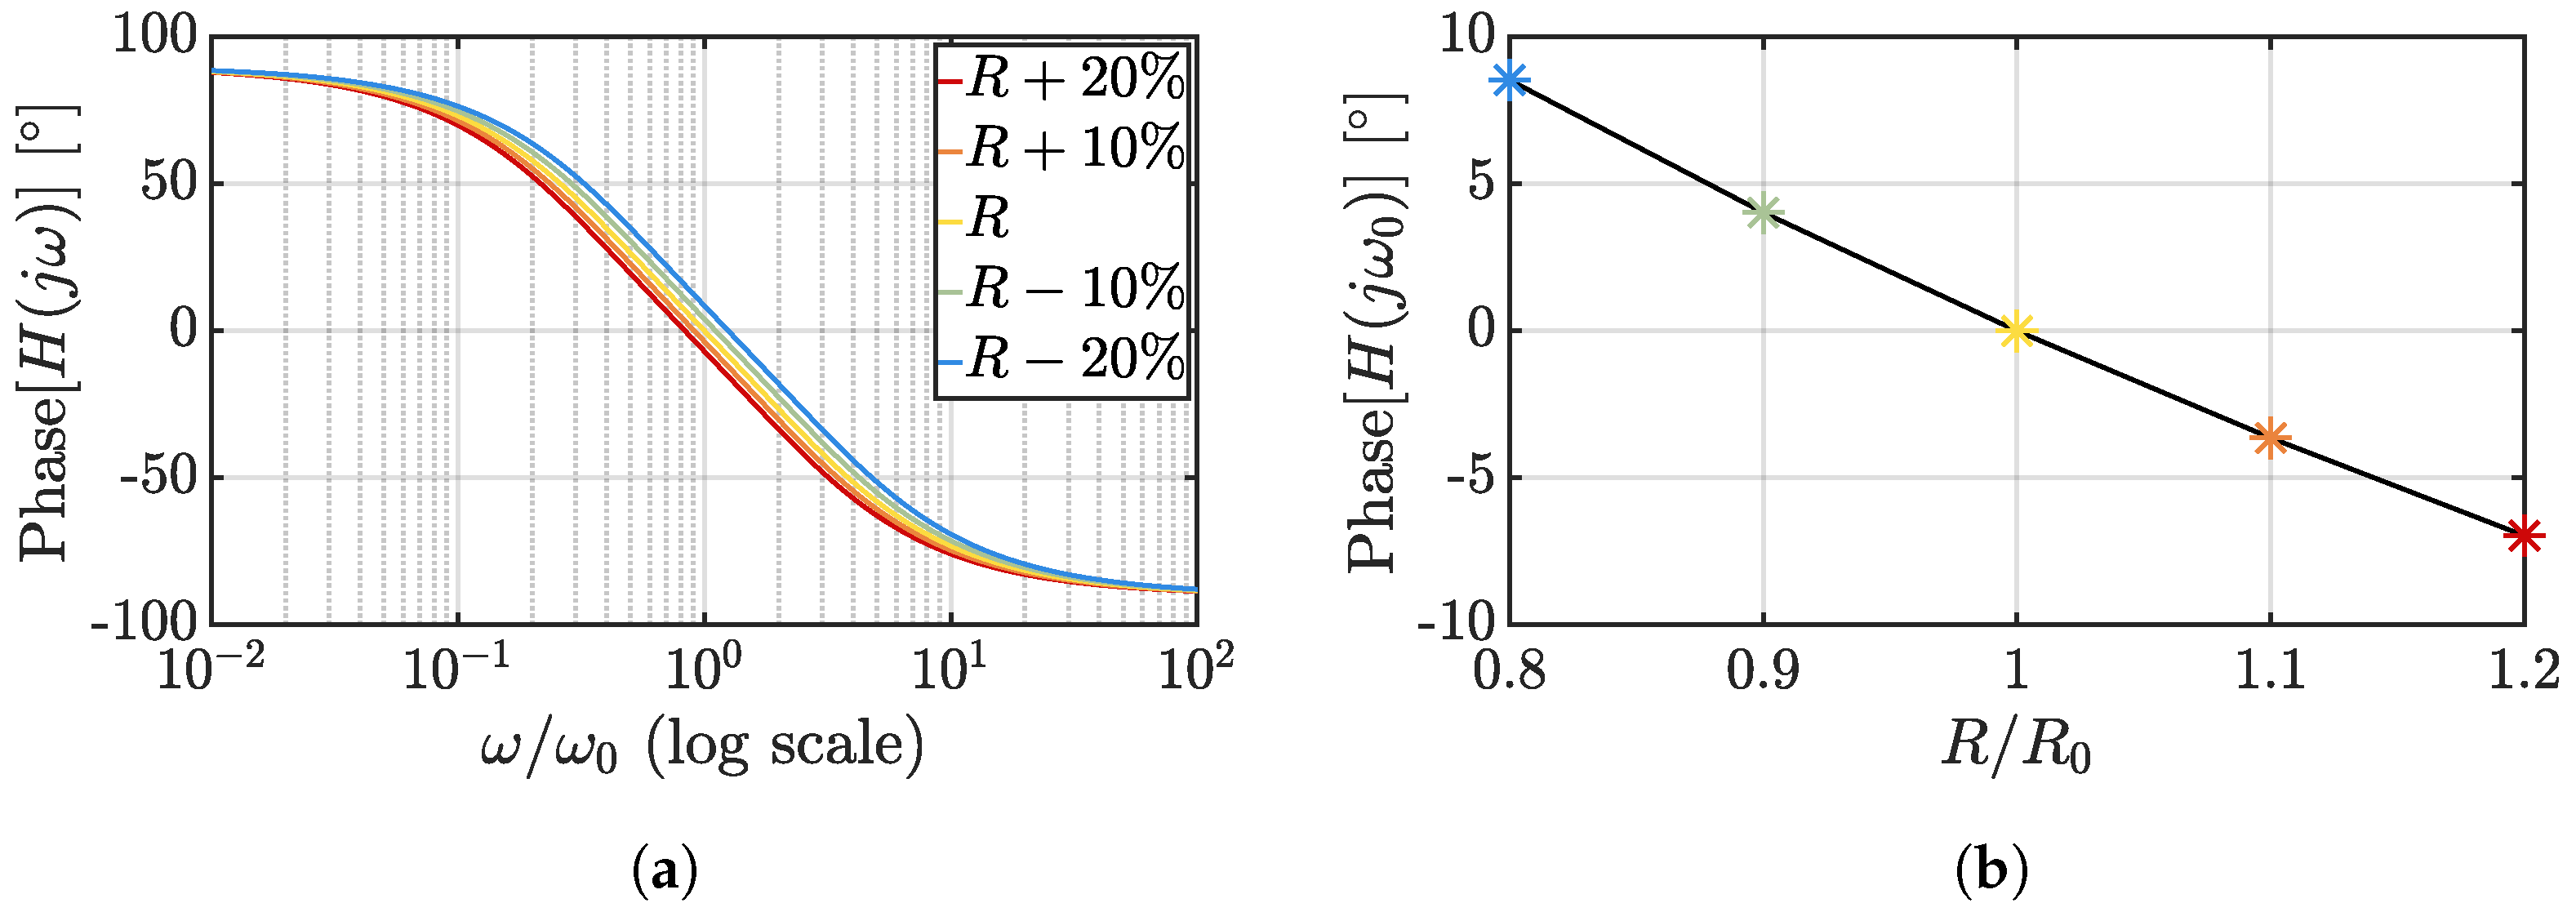
2.3. Resistor-Based TDCs
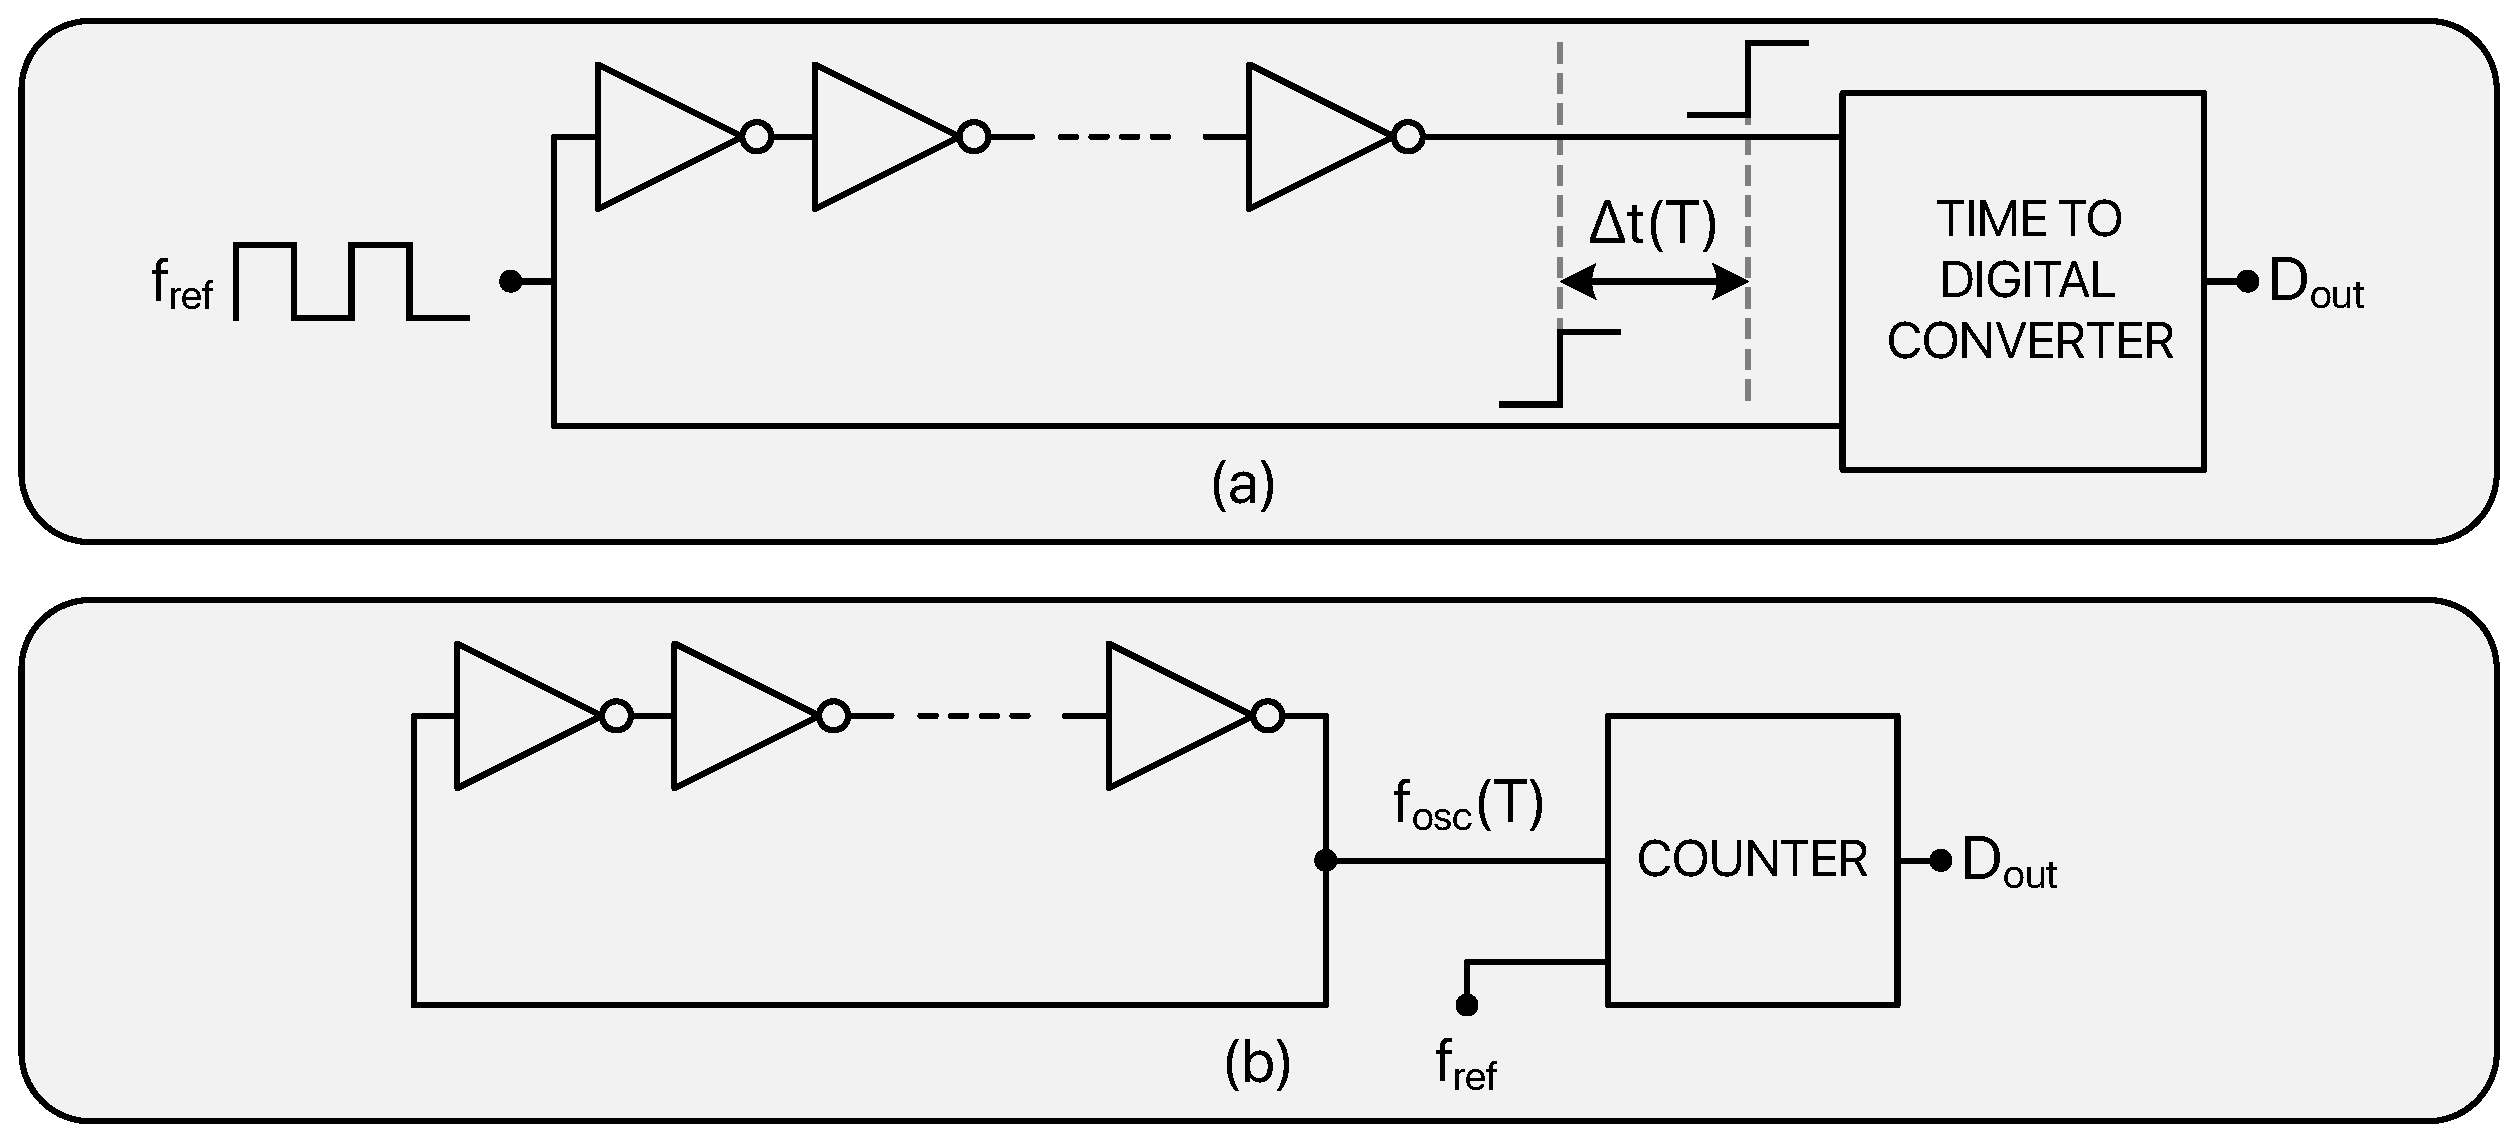
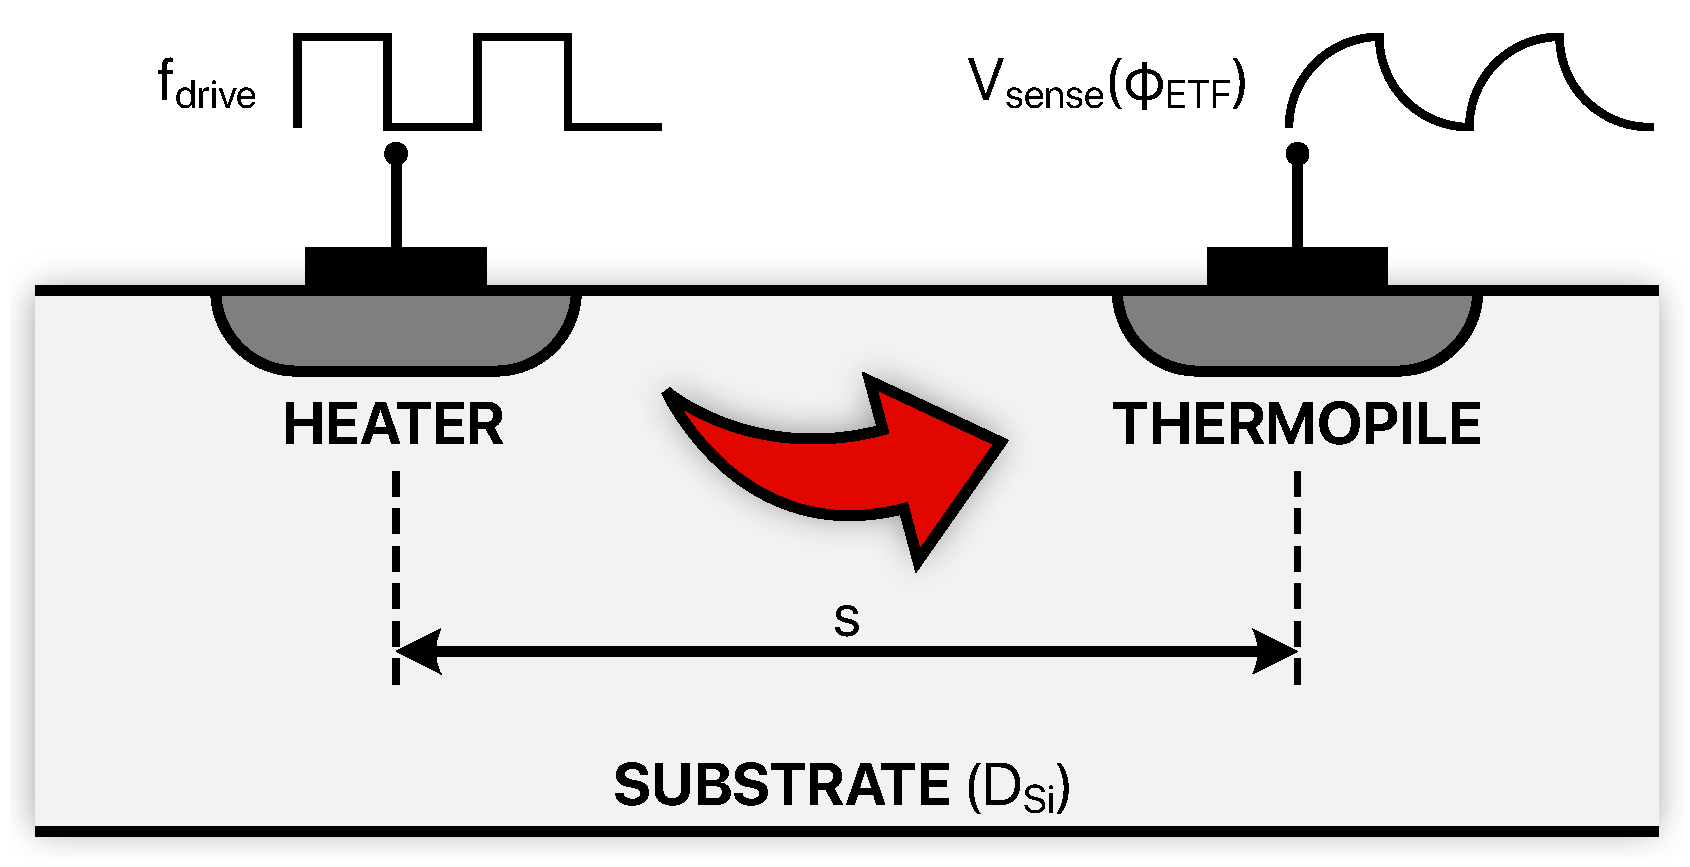
2.4. TD-Based TDCs
3. State-of-the-Art Review and Design Trends
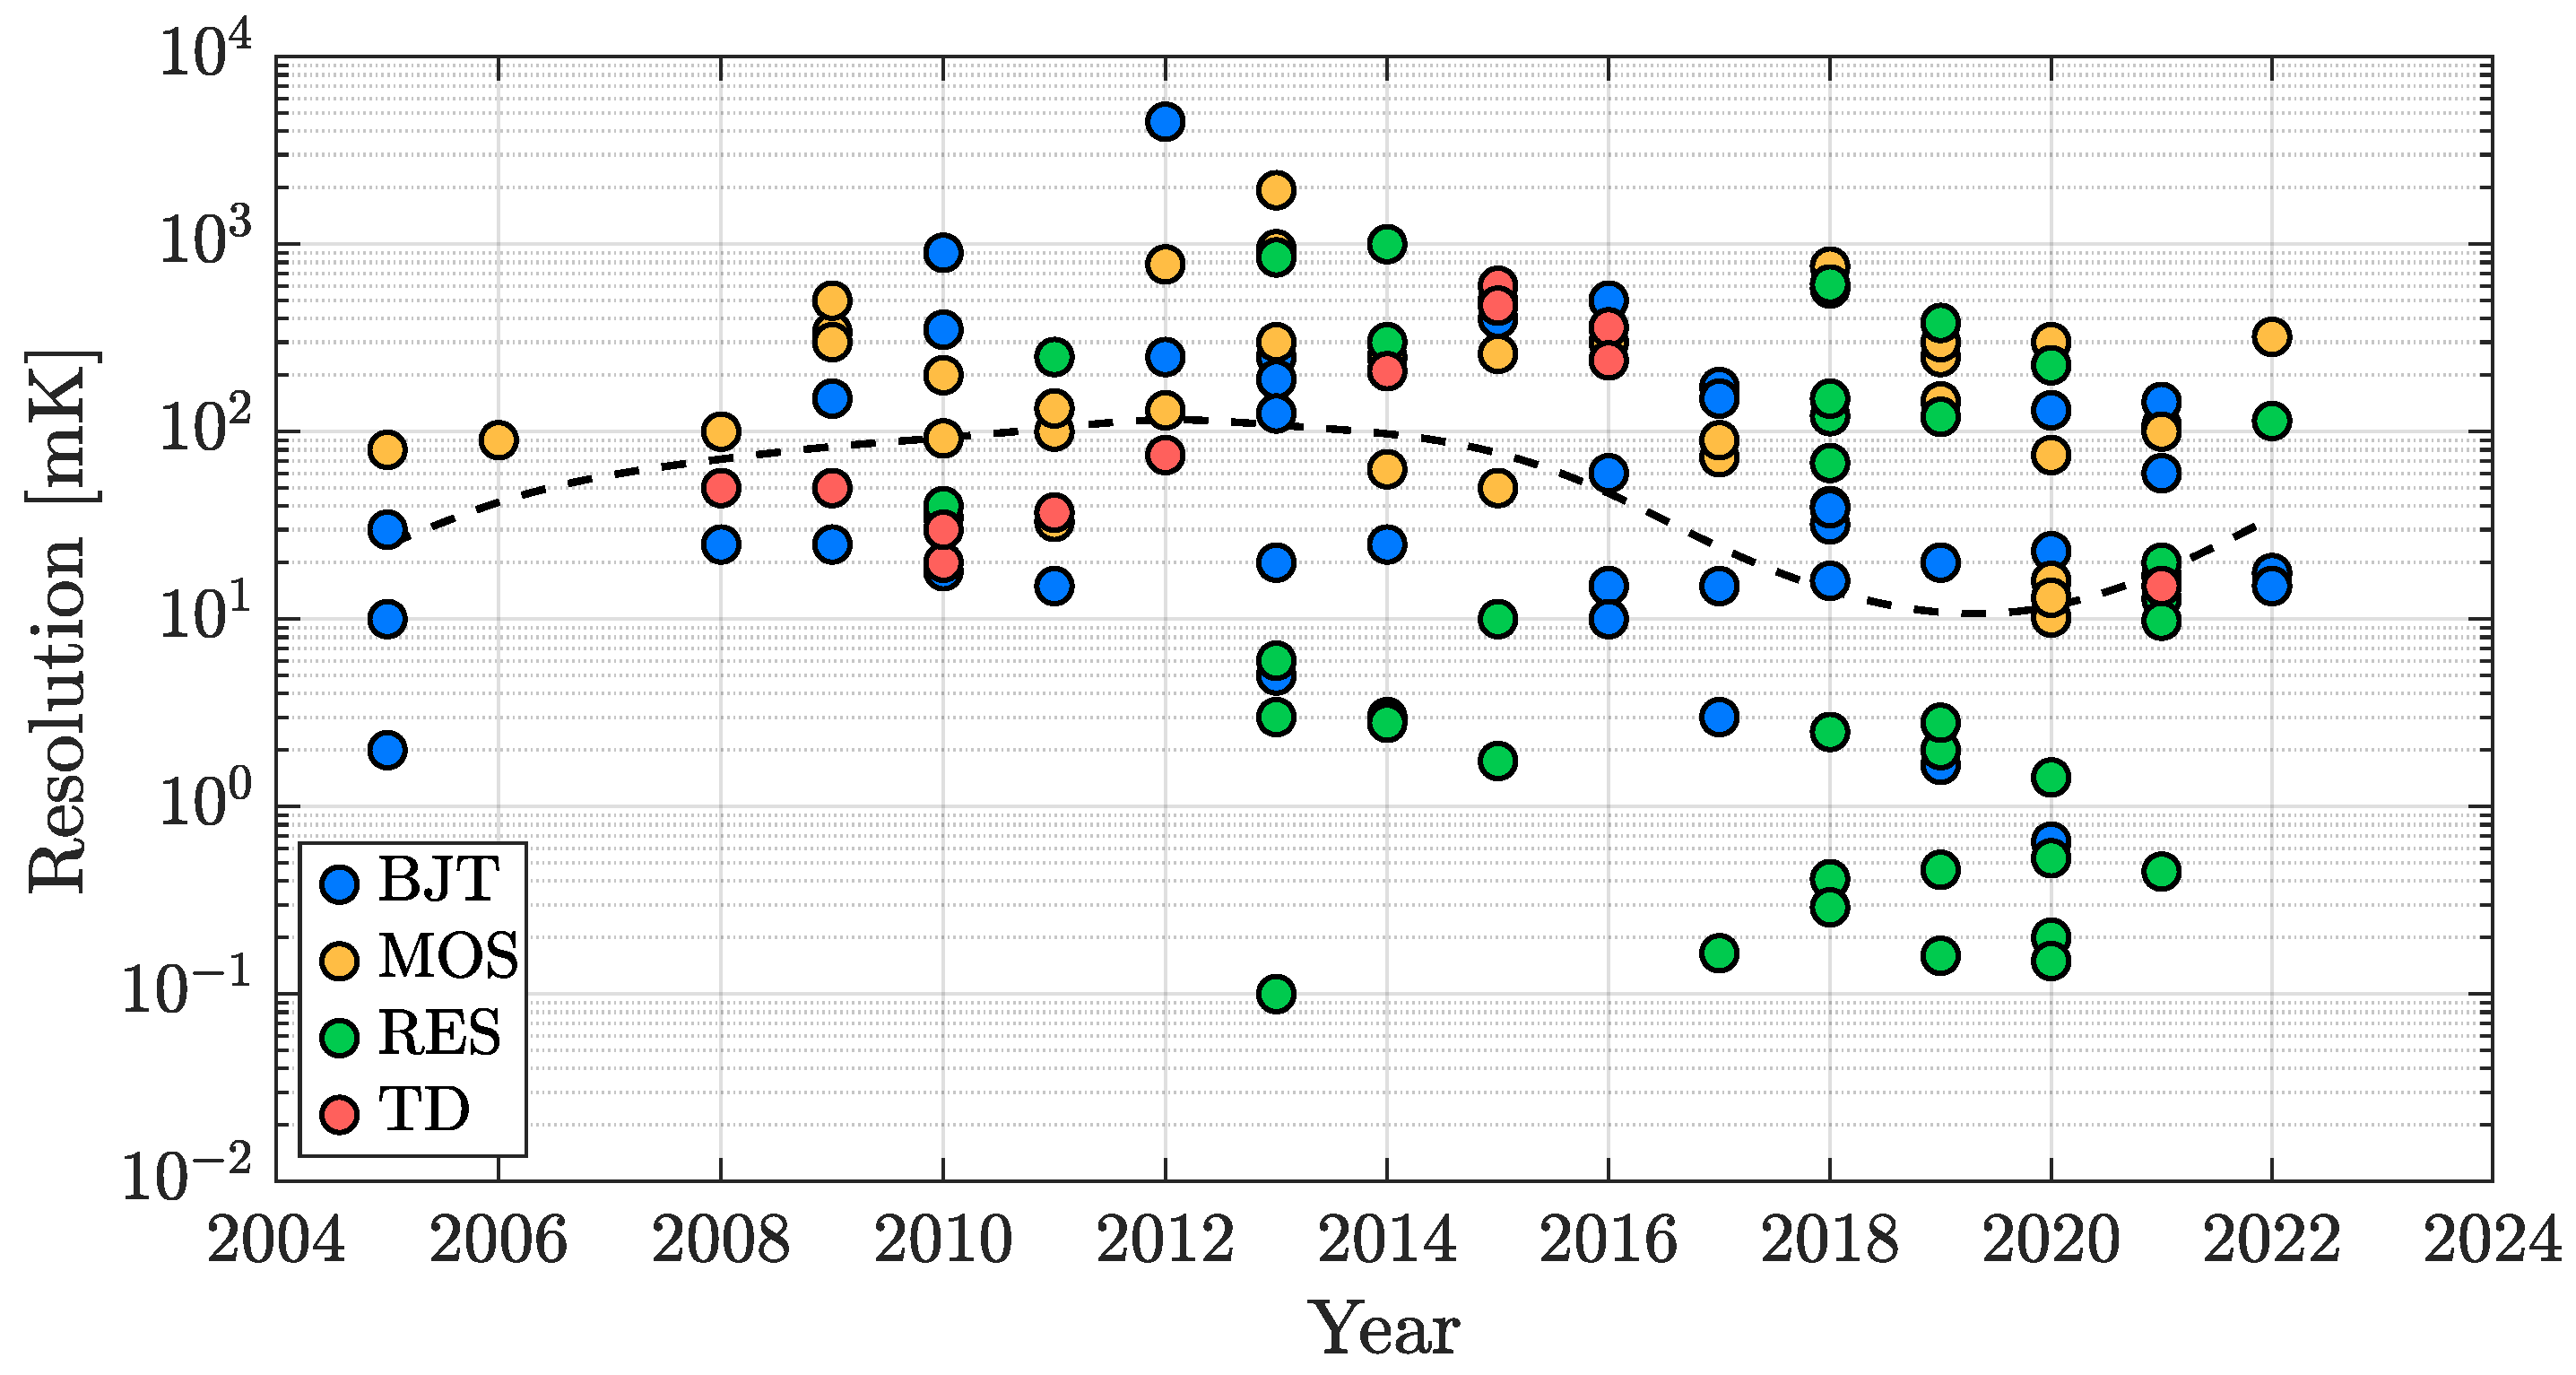
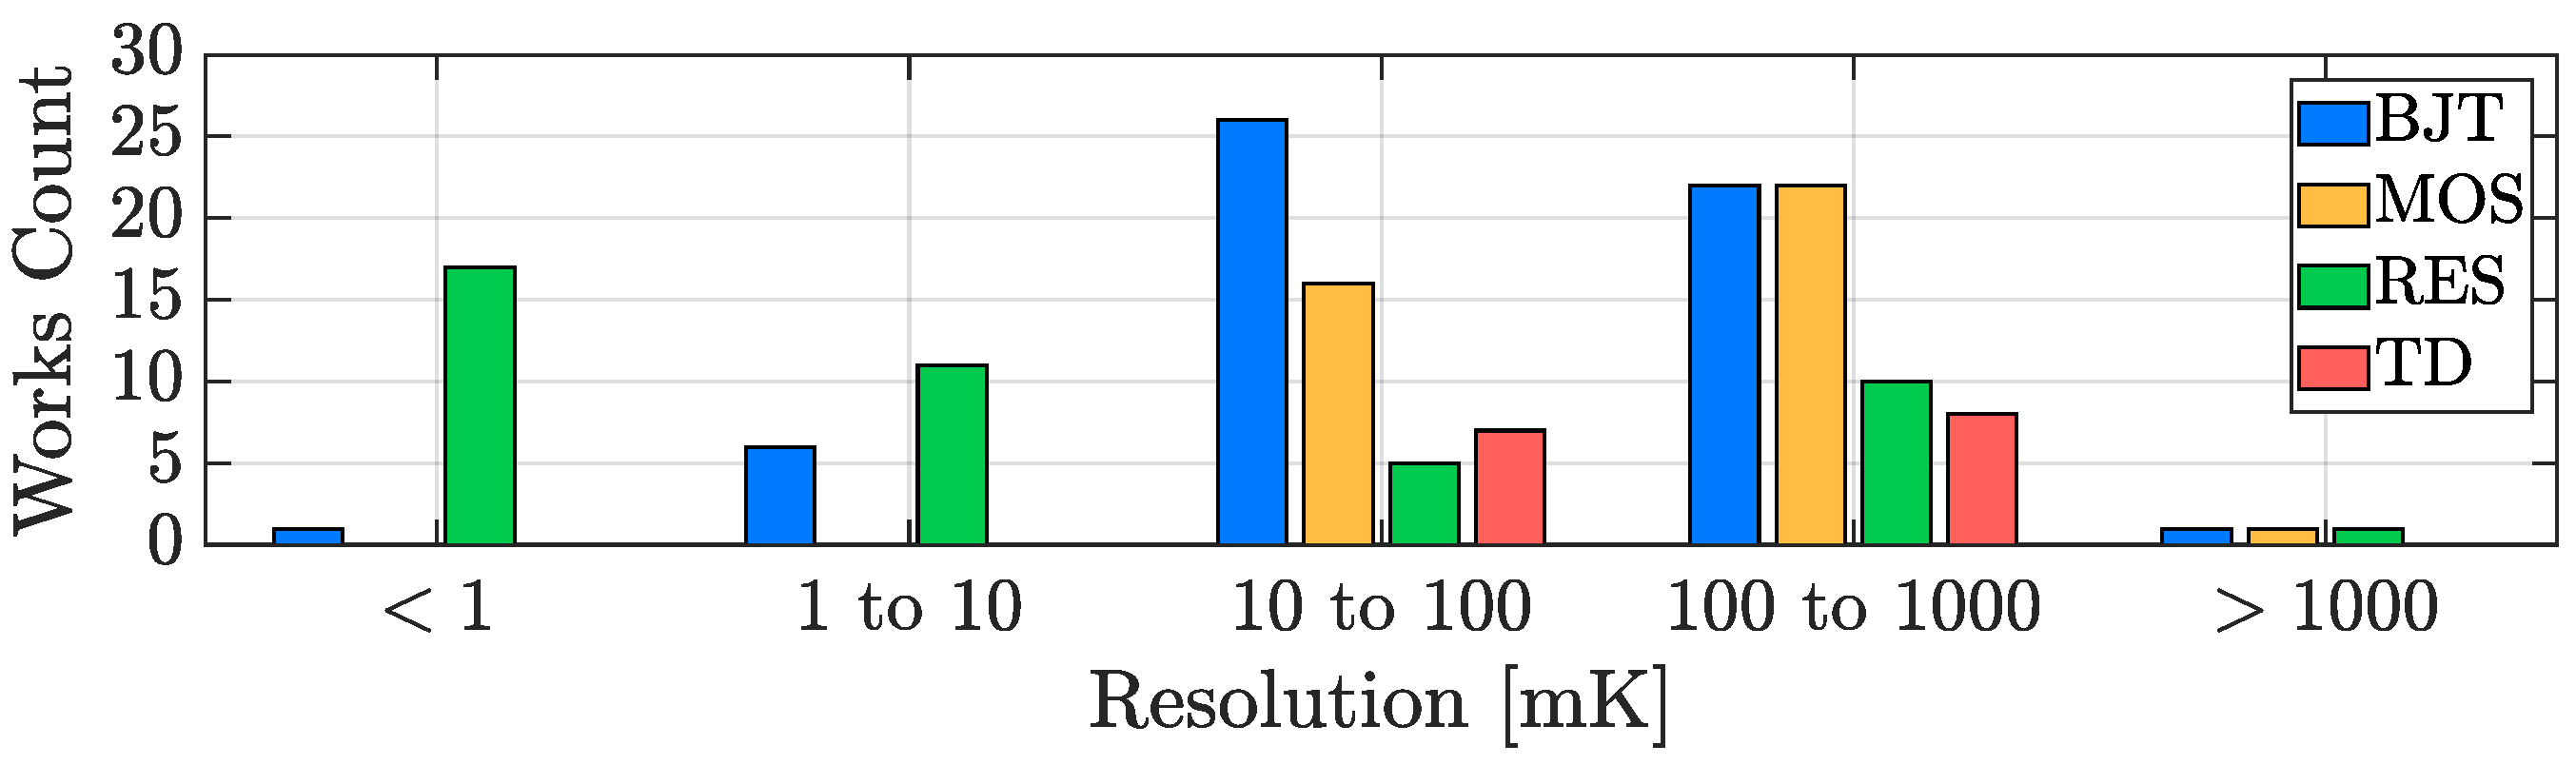
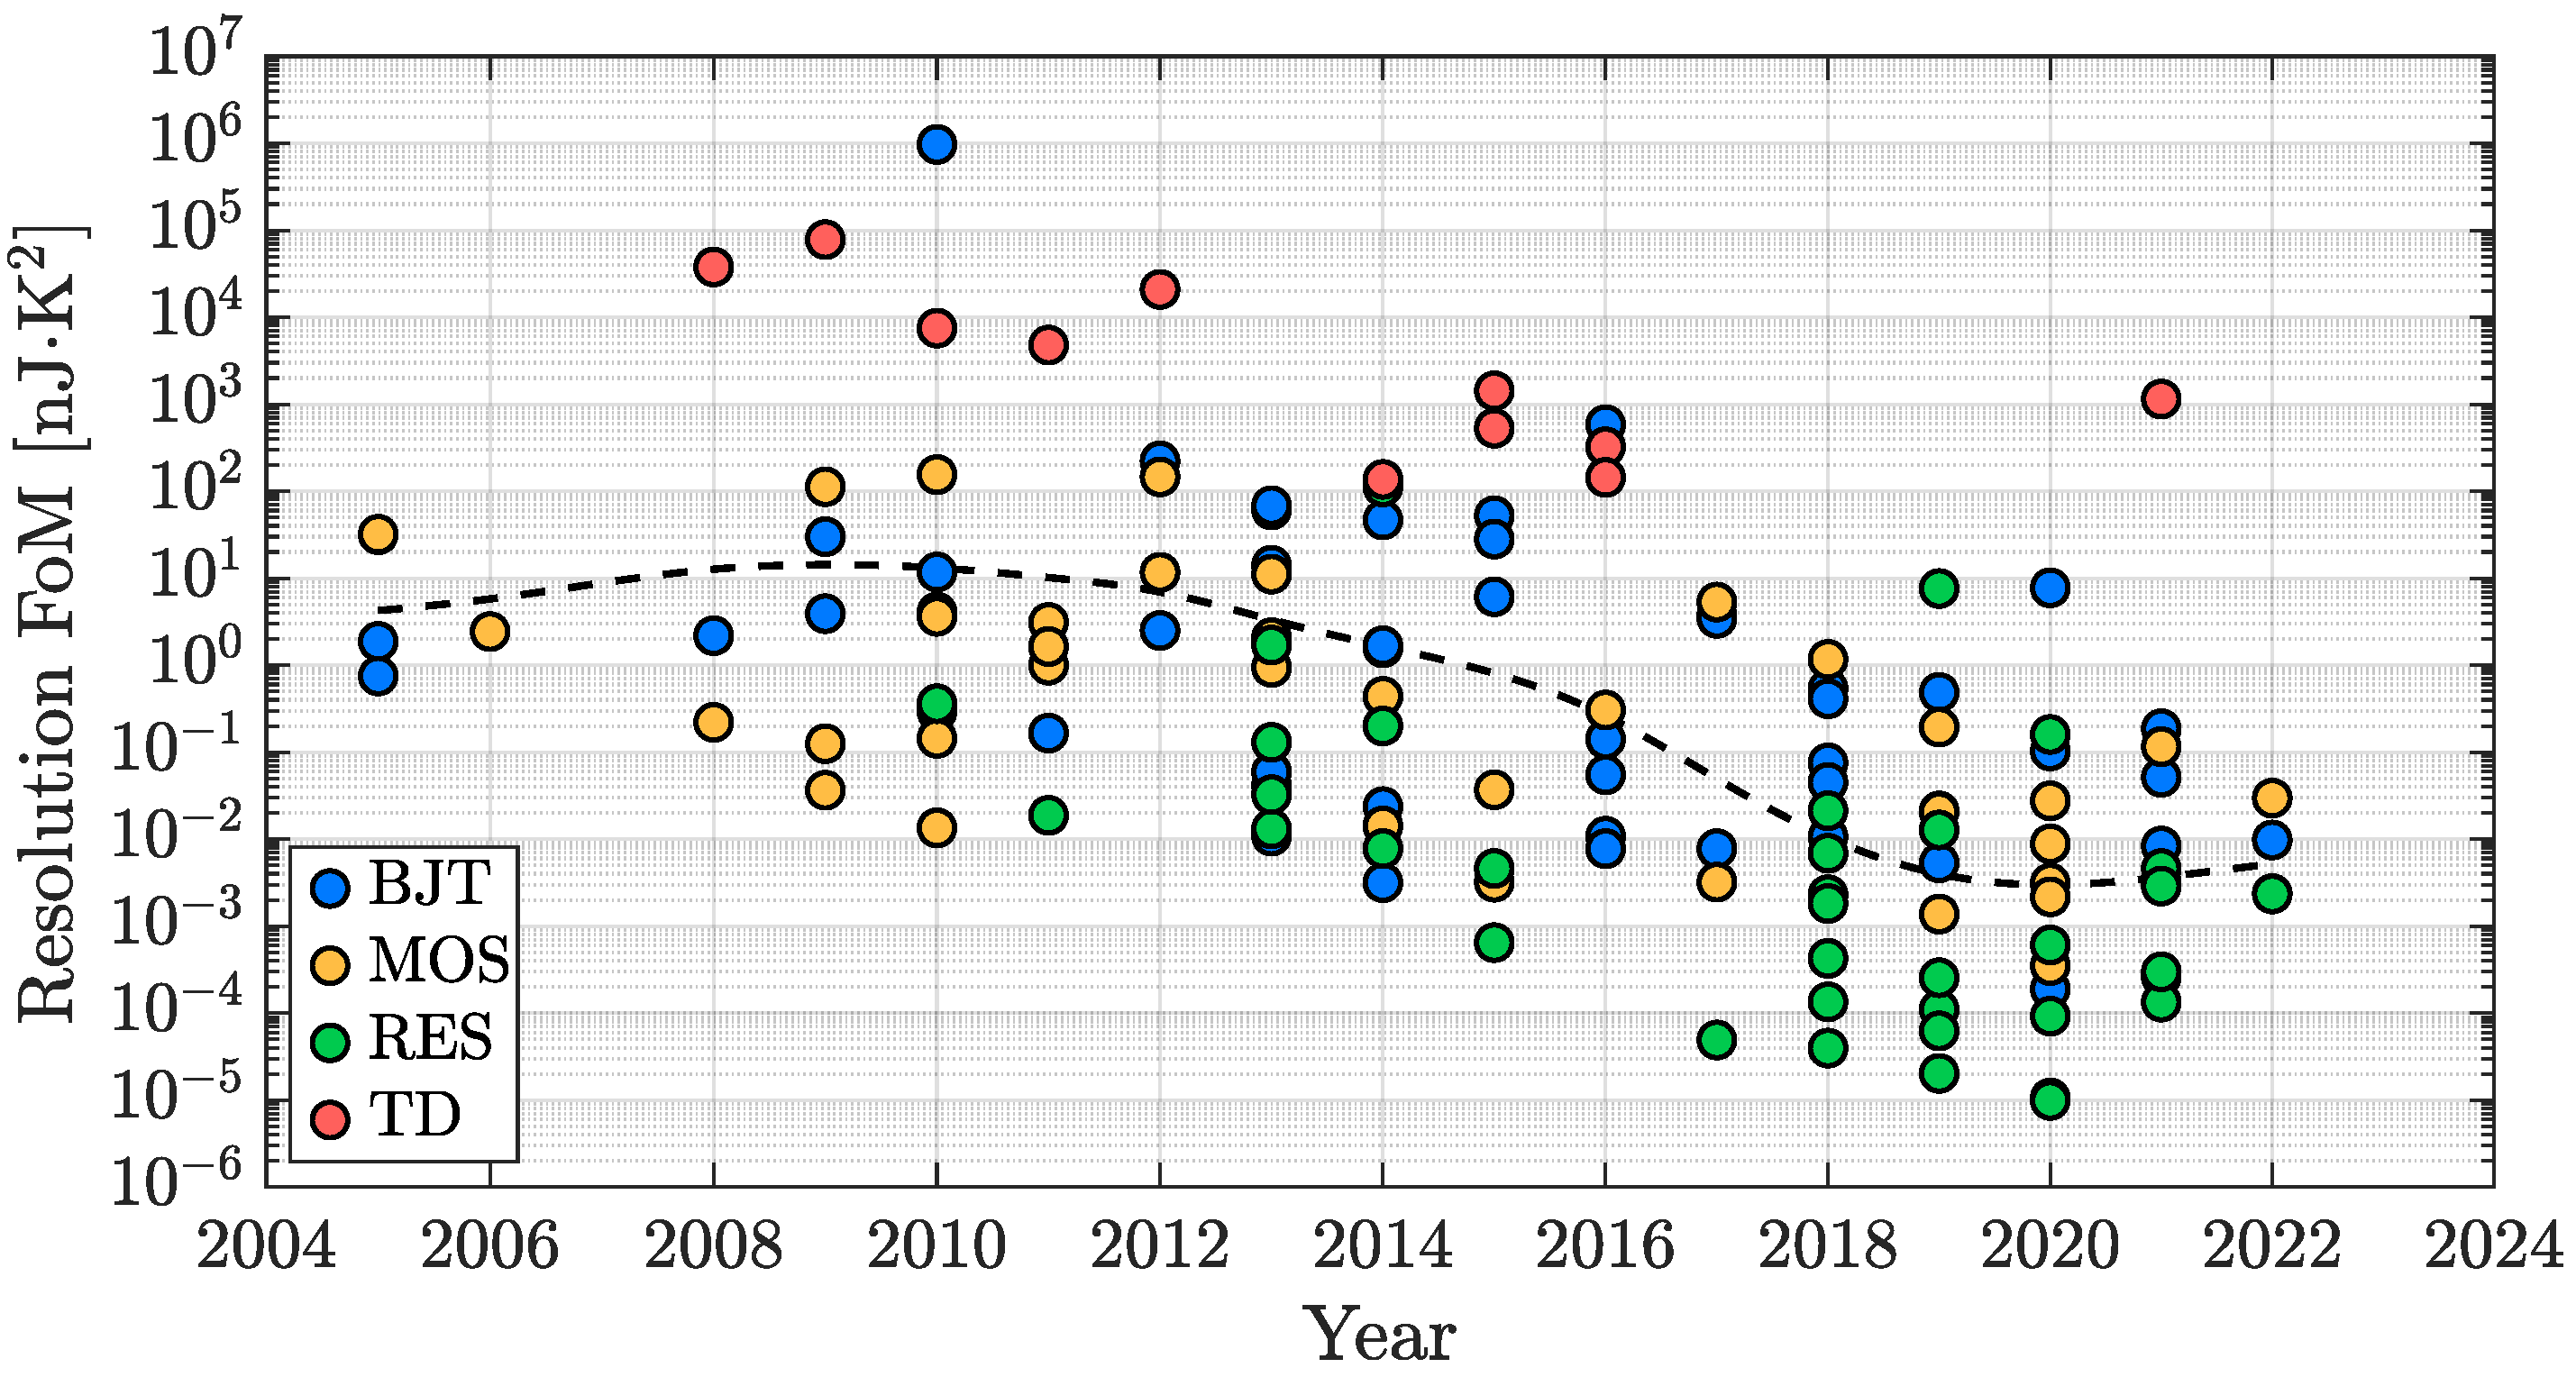
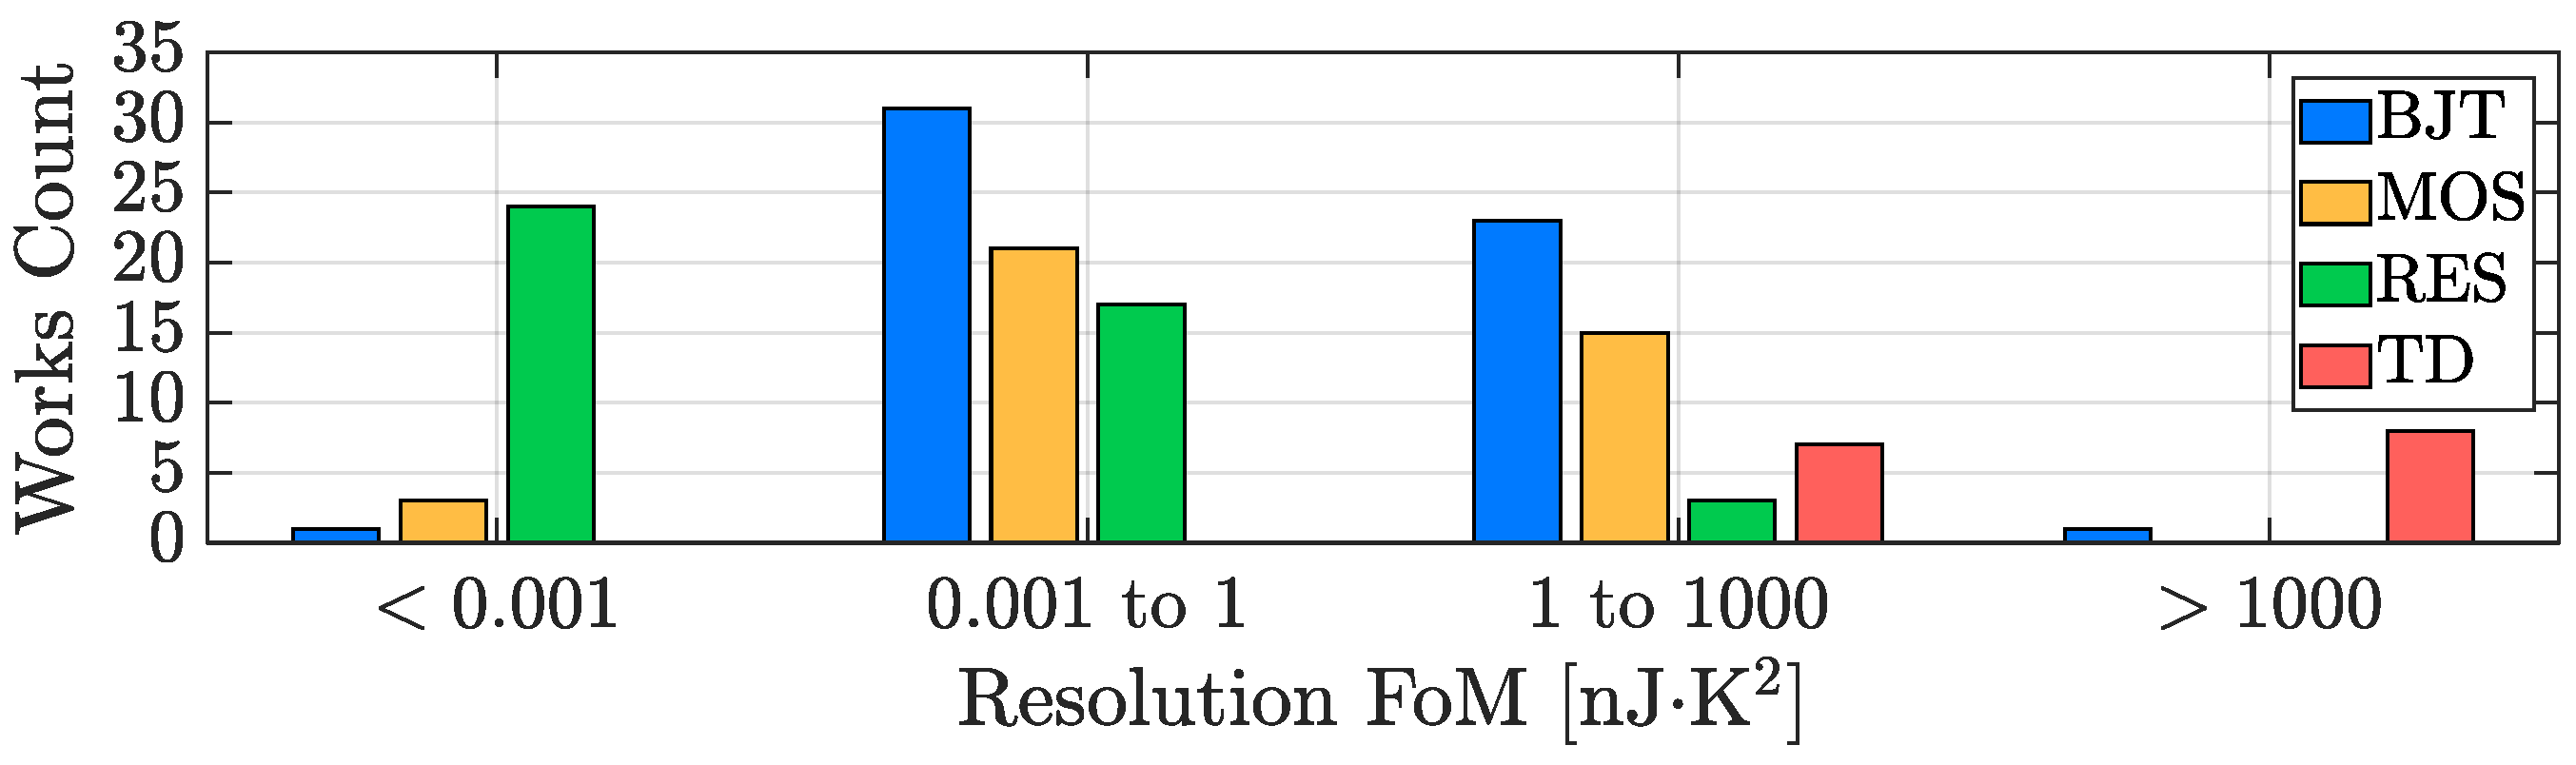
3.1. Resolution
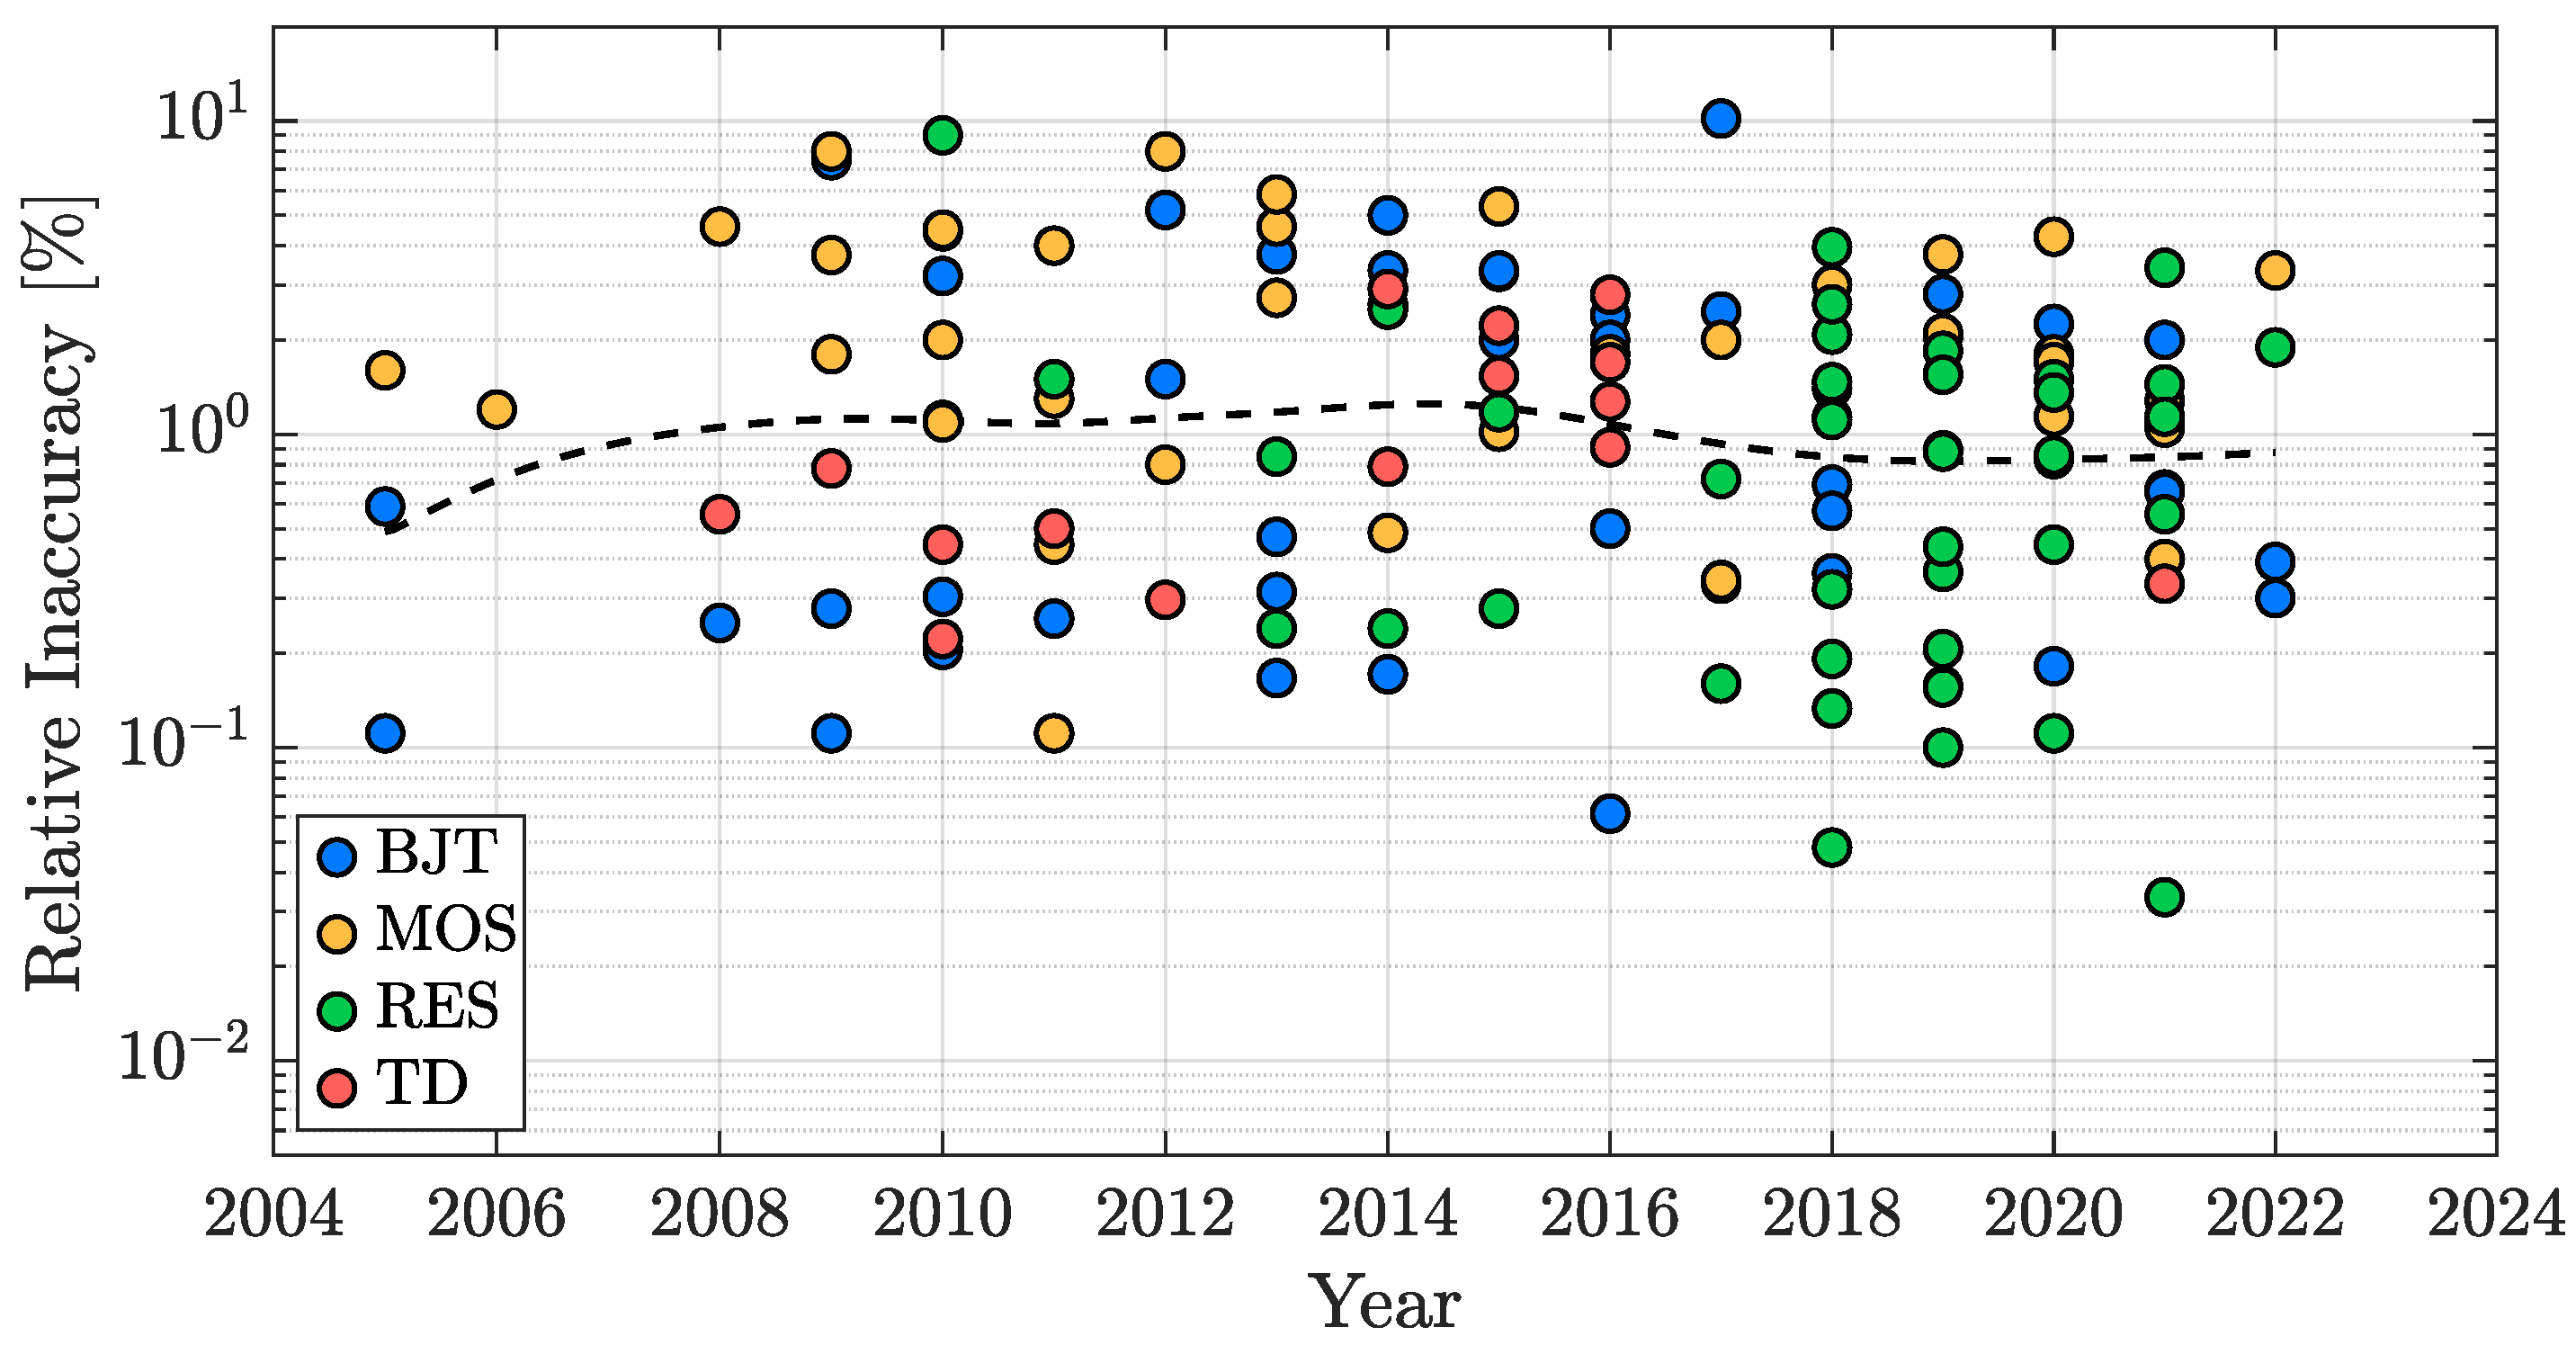
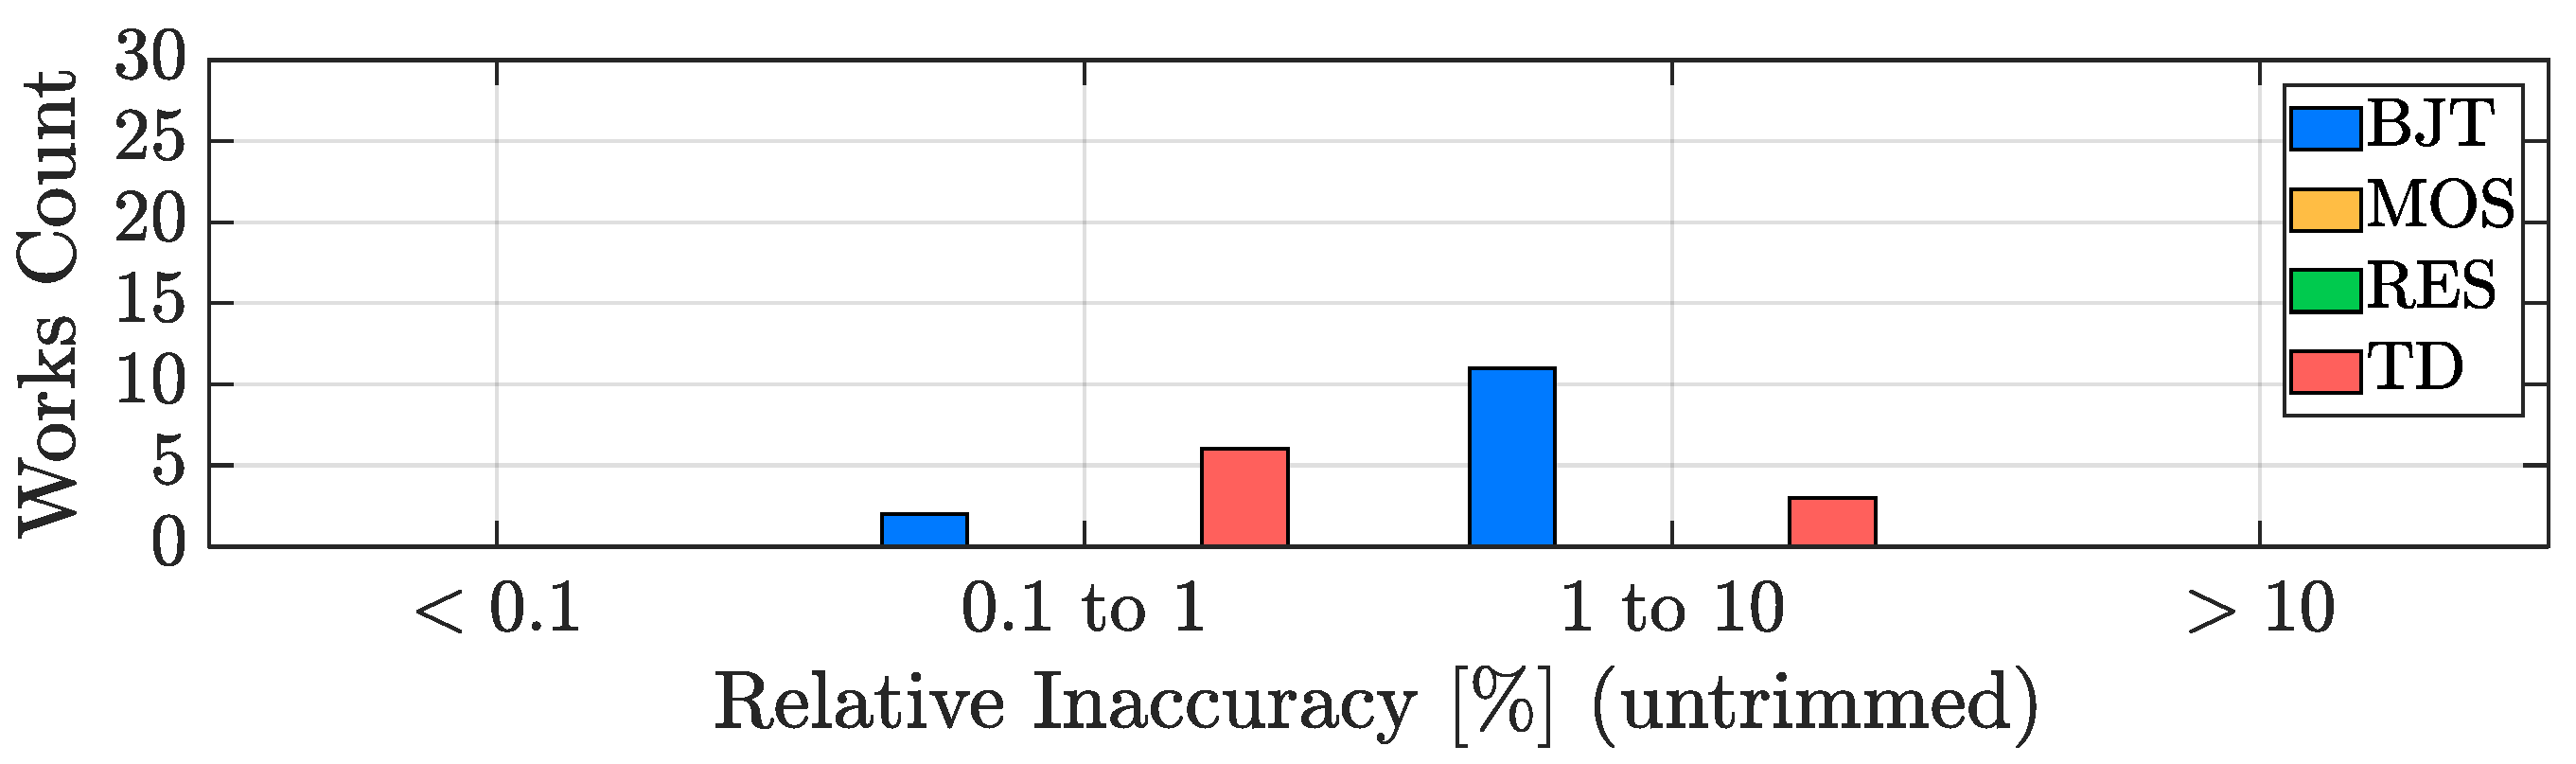
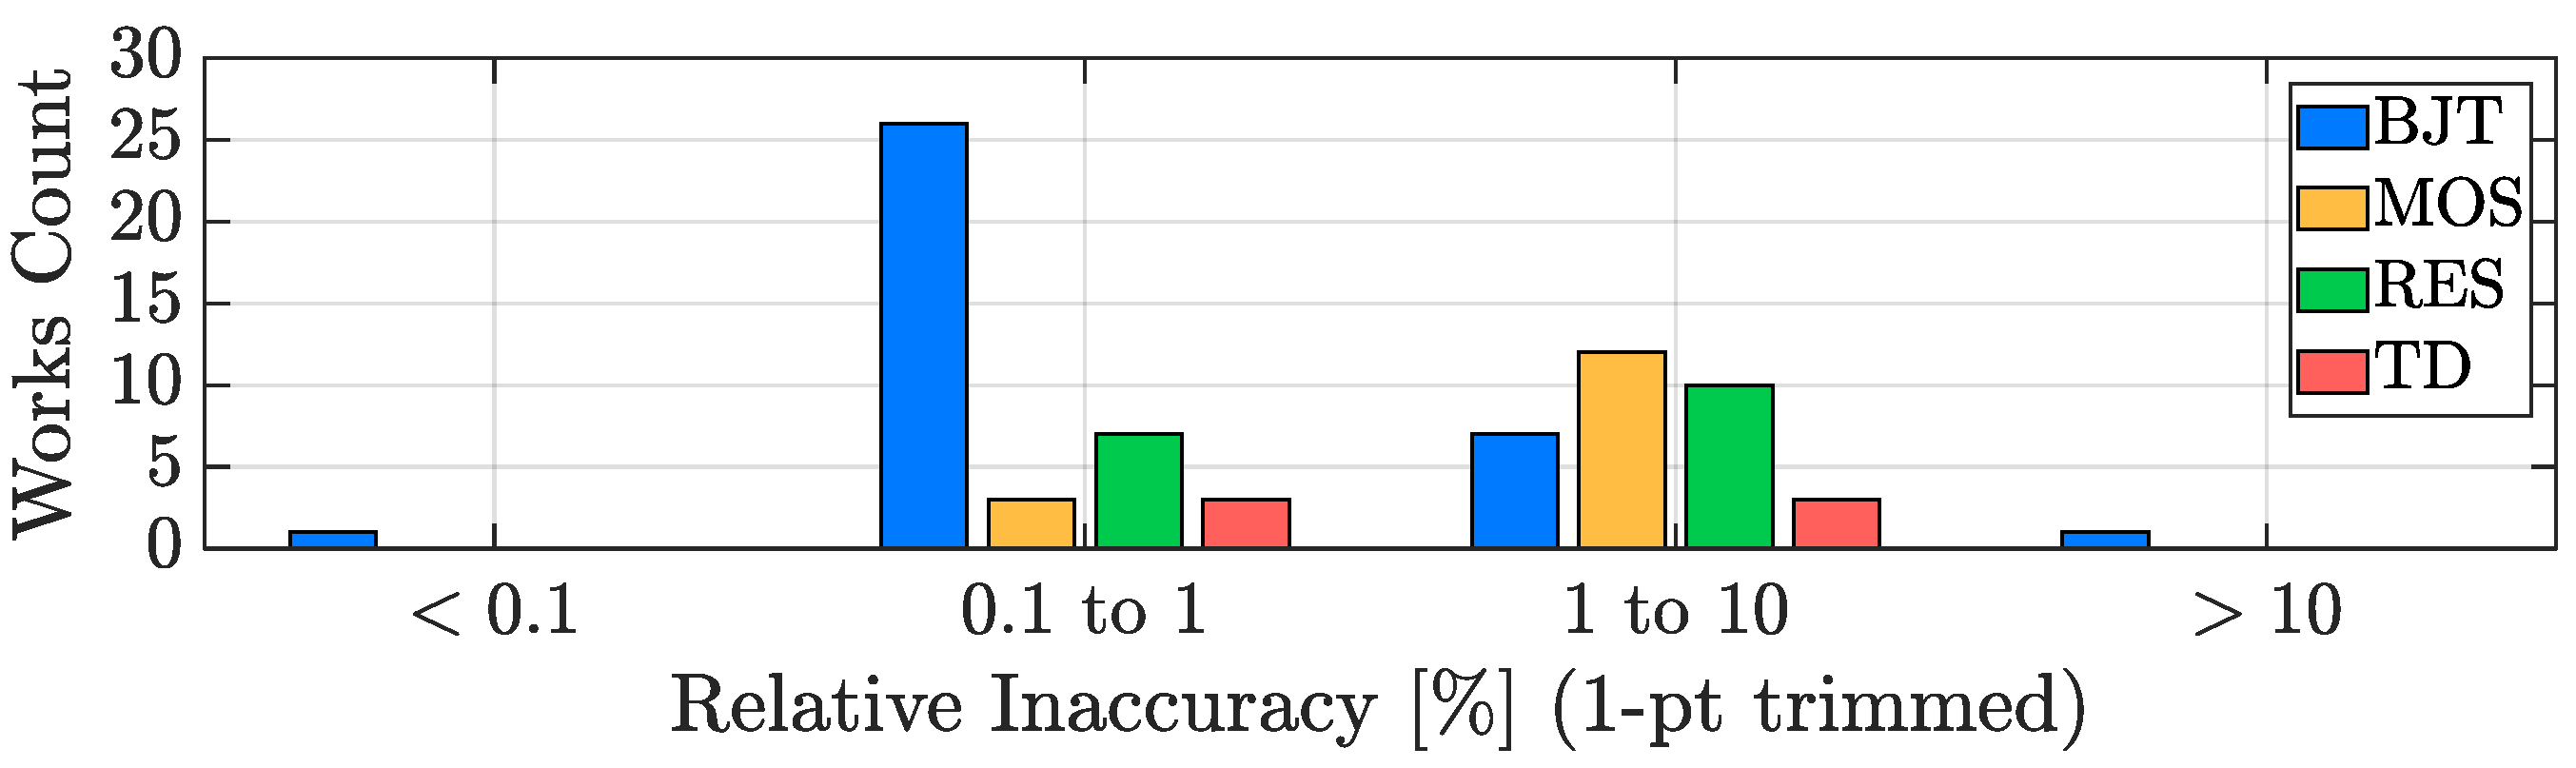
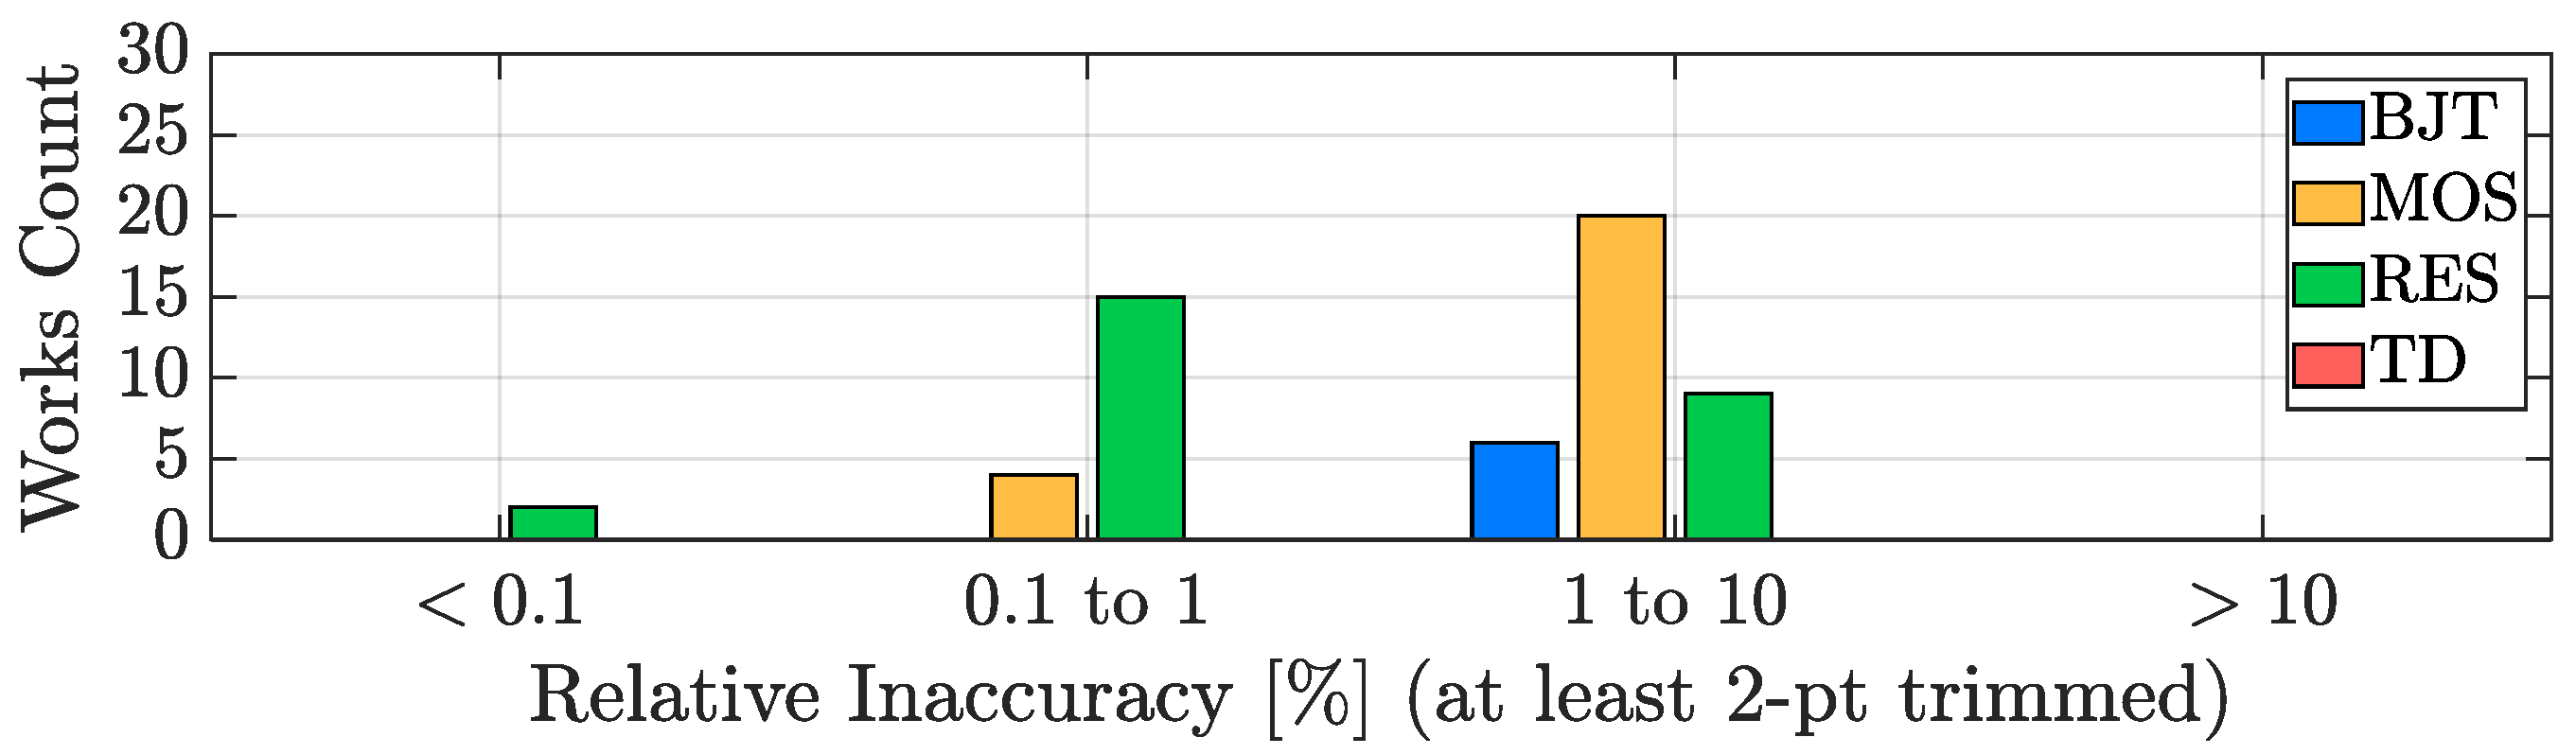
3.2. Inaccuracy
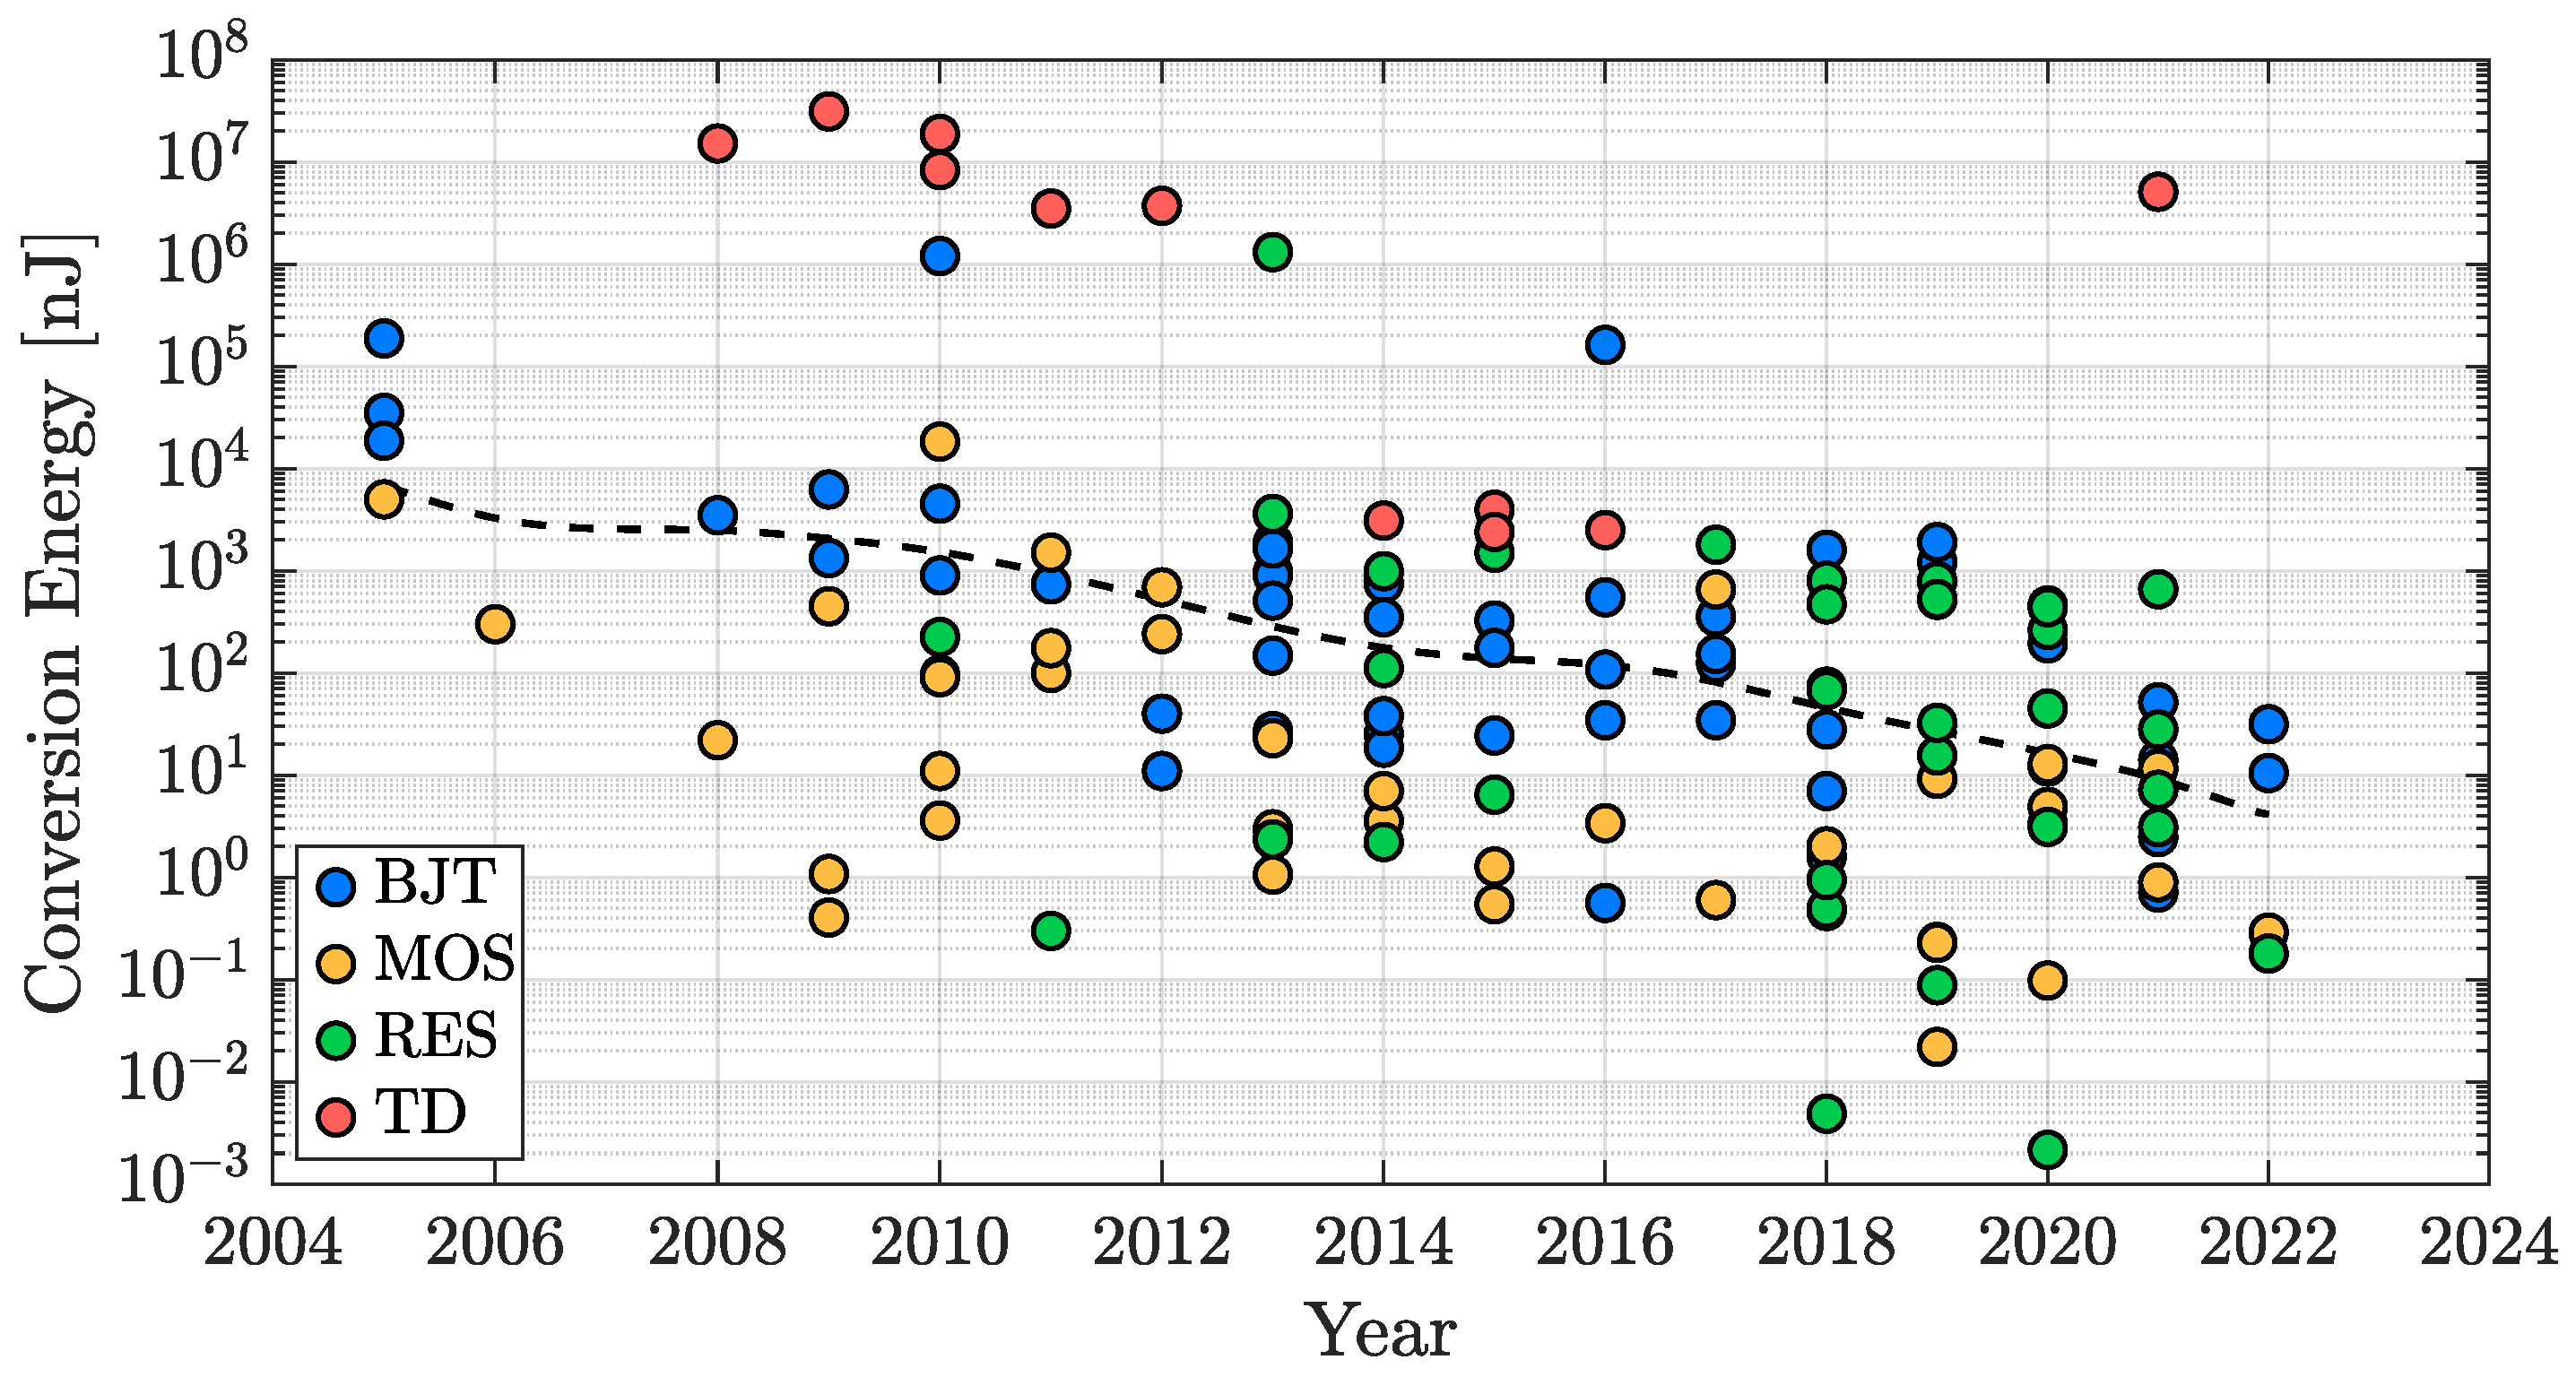
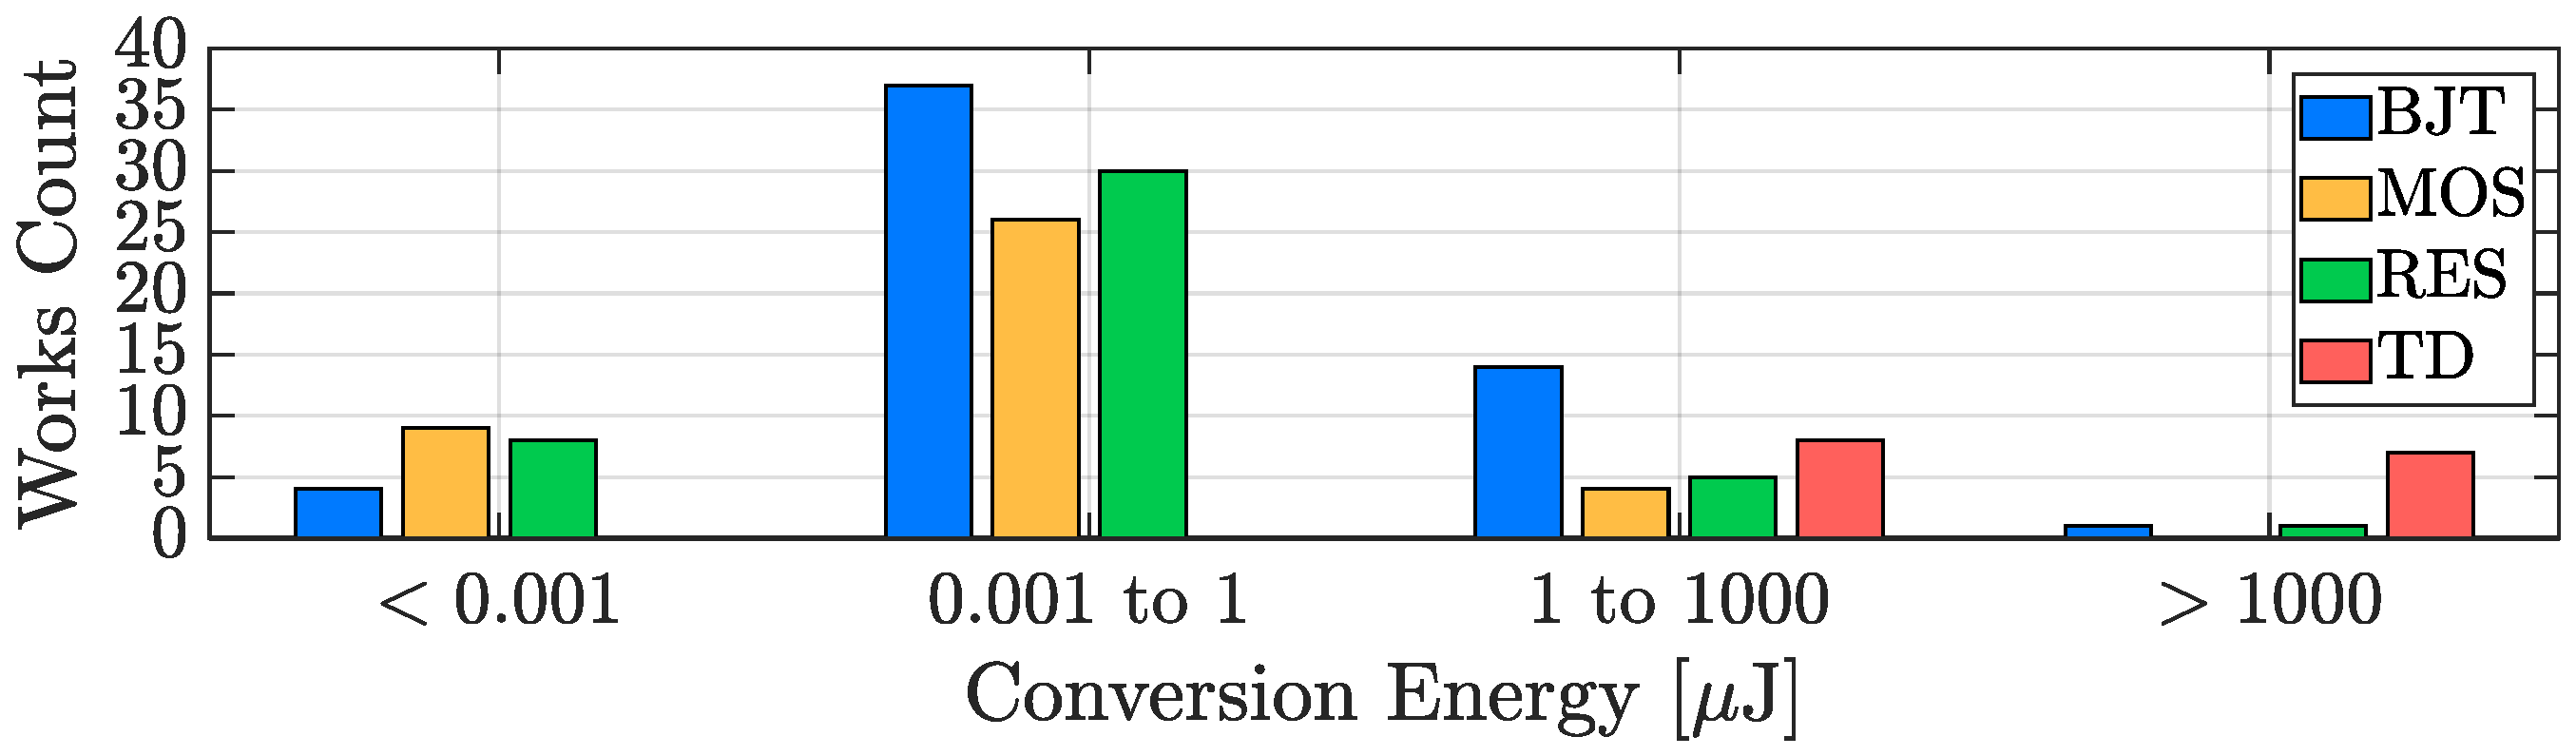
3.3. Conversion Energy
3.4. Energy Efficiency
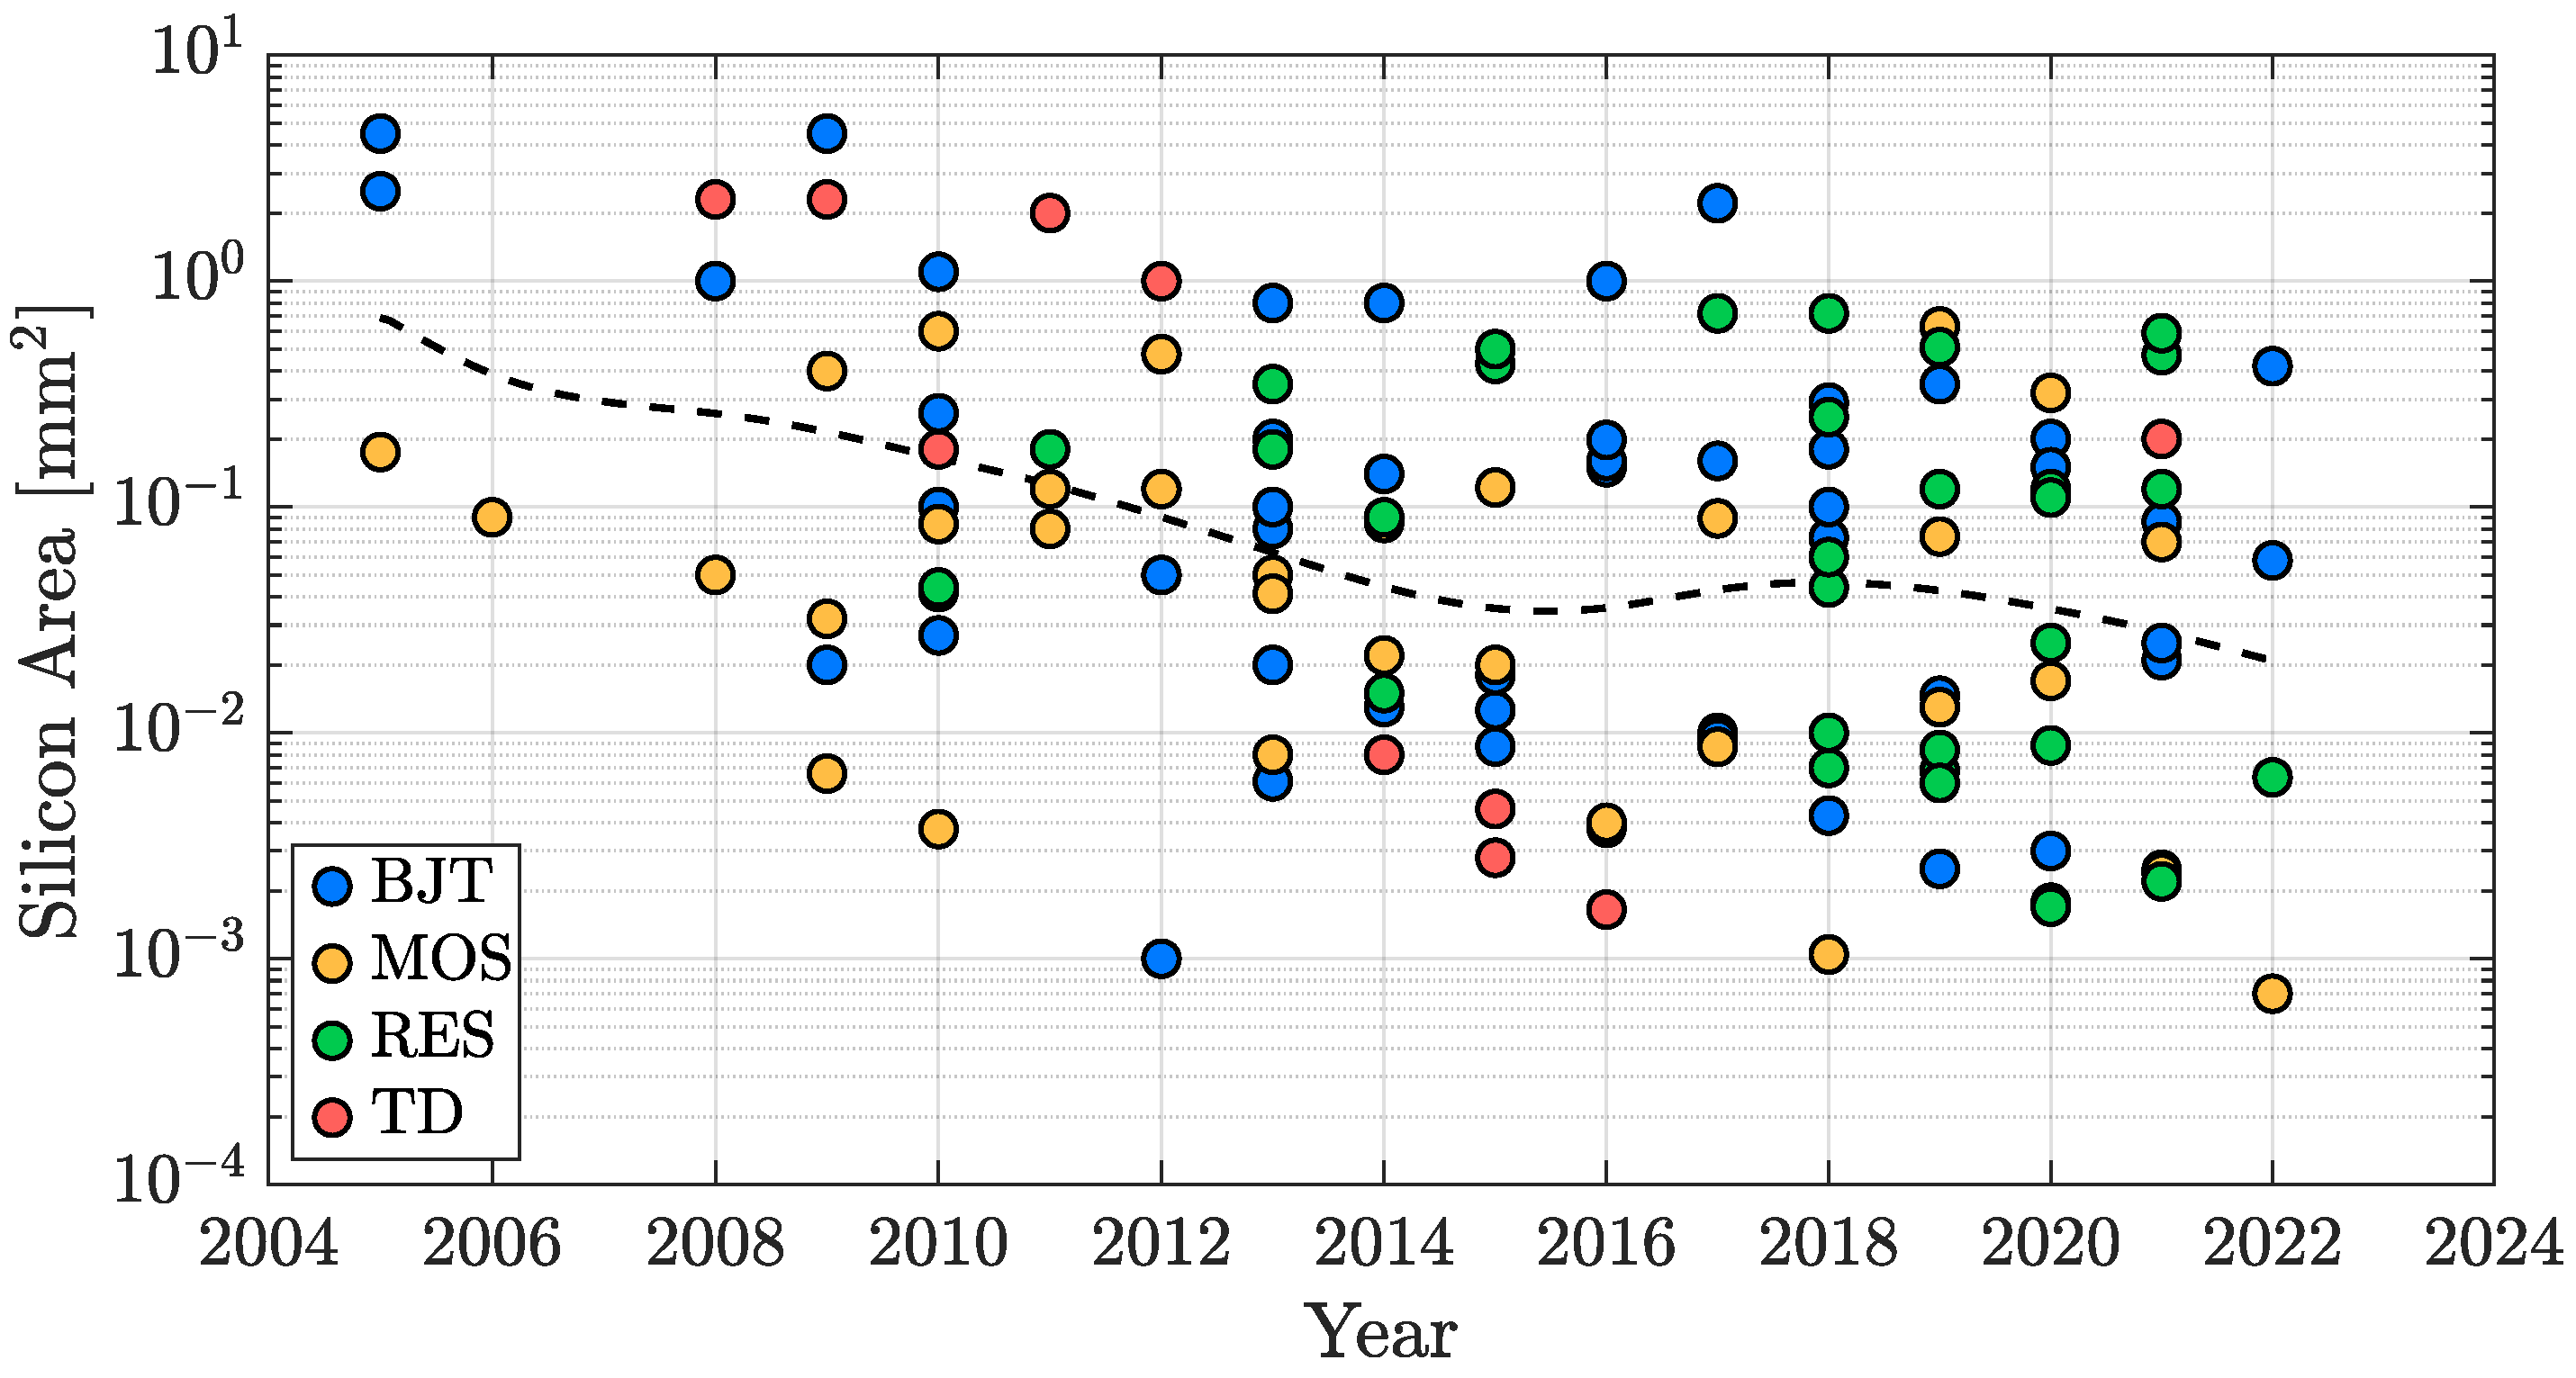
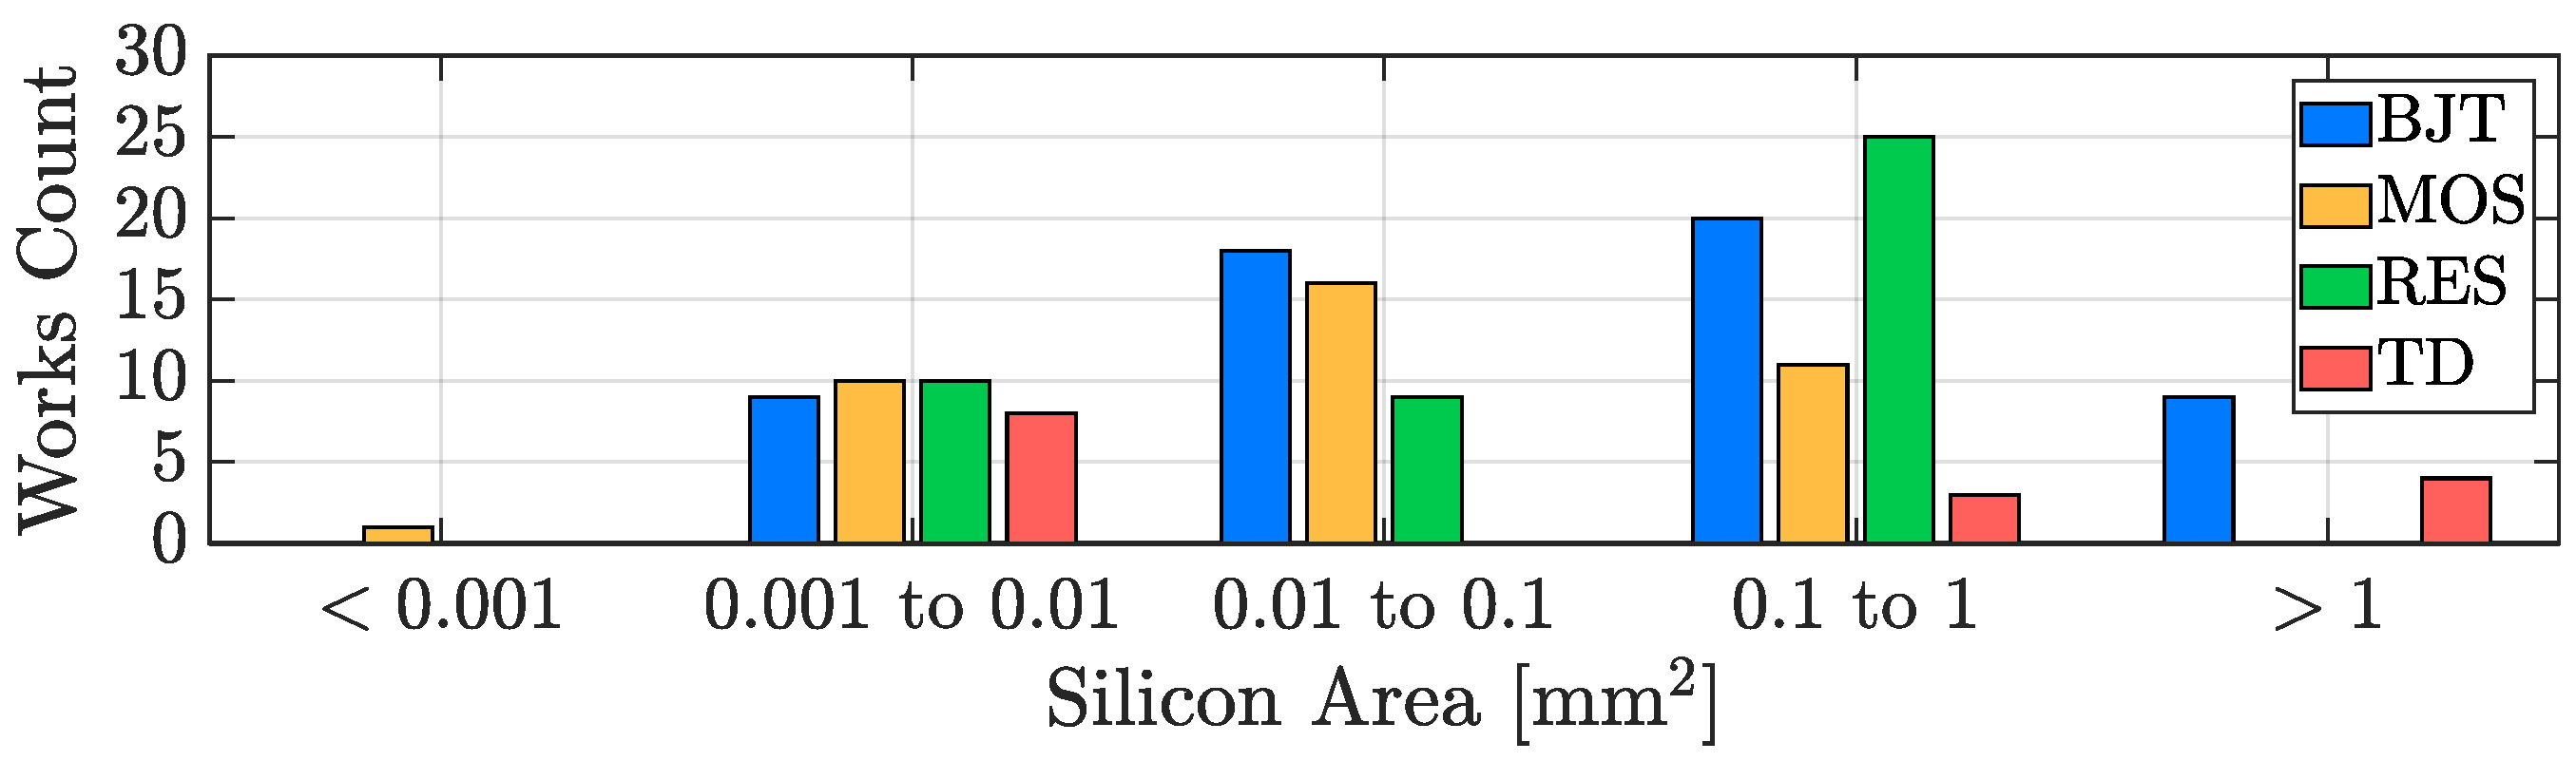
3.5. Silicon Area
4. Conclusions
Author Contributions
Funding
Data Availability Statement
Conflicts of Interest
Abbreviations
| ADC | Analog-to-Digital Converter |
| AFE | Analog Front-End |
| BJT | Bipolar Junction Transistor |
| CMOS | Complementary Metal-Oxide-Semiconductor |
| CTAT | Complementary-To-Absolute-Temperature |
| DBE | Digital-Back-End |
| DSP | Digital Signal Processing |
| DVFS | Dynamic Voltage and Frequency Scaling |
| ETF | ElectroThermal Filter |
| FoM | Figure of Merit |
| IoT | Internet of Things |
| MEMS | Micro-Electro-Mechanical System |
| MOSFET | Metal-Oxide-Semiconductor Field-Effect Transistor |
| OSR | OverSampling Ratio |
| PTAT | Proportional-To-Absolute-Temperature |
| REF | REFerence |
| RES | RESistor |
| RFID | Radio-Frequency IDentification |
| SAR | Successive Approximation Register |
| S/H | Sample and Hold |
| TC | Temperature Coefficient |
| TD | Thermal Diffusivity |
| TDC | Temperature-to-Digital Converter |
| ZTC | Zero-Temperature-Coefficient |
References
- Rupp, K. 42 Years of Microprocessor Trend Data. Available online: www.karlrupp.net/2018/02/42-years-of-microprocessor-trend-data (accessed on 5 October 2022).
- Sheikh, H.F.; Ahmad, I.; Wang, Z.; Ranka, S. An overview and classification of thermal-aware scheduling techniques for multi-core processing systems. Sustain. Comput. Inform. Syst. 2012, 2, 151–169. [Google Scholar] [CrossRef]
- Shor, J.S.; Luria, K. Miniaturized BJT-Based Thermal Sensor for Microprocessors in 32- and 22-nm Technologies. IEEE J. Solid-State Circuits 2013, 48, 2860–2867. [Google Scholar] [CrossRef]
- Oshita, T.; Shor, J.S.; Duarte, D.E.; Kornfeld, A.; Zilberman, D. Compact BJT-Based Thermal Sensor for Processor Applications in a 14 nm tri-Gate CMOS Process. IEEE J. Solid-State Circuits 2015, 50, 799–807. [Google Scholar] [CrossRef]
- Bass, O.; Shor, J. A Miniaturized 0.003 mm2 PNP-Based Thermal Sensor for Dense CPU Thermal Monitoring. IEEE Trans. Circuits Syst. I: Regul. Pap. 2020, 67, 2984–2992. [Google Scholar] [CrossRef]
- Yanazawa, H.; Homma, K. Growing market of MEMS and technology development in process and tools specialized to MEMS. In Proceedings of the 2017 IEEE Electron Devices Technology and Manufacturing Conference (EDTM), Toyama, Japan, 28 February–2 March 2017; pp. 143–144. [Google Scholar]
- Chen, L.T.; Lee, C.Y.; Cheng, W.H. MEMS-based humidity sensor with integrated temperature compensation mechanism. Sens. Actuators A Phys. 2008, 147, 522–528. [Google Scholar] [CrossRef]
- Salvia, J.C.; Melamud, R.; Chandorkar, S.A.; Lord, S.F.; Kenny, T.W. Real-Time Temperature Compensation of MEMS Oscillators Using an Integrated Micro-Oven and a Phase-Locked Loop. J. Microelectromechanical Syst. 2010, 19, 192–201. [Google Scholar] [CrossRef]
- Zotov, S.A.; Simon, B.R.; Trusov, A.A.; Shkel, A.M. High Quality Factor Resonant MEMS Accelerometer with Continuous Thermal Compensation. IEEE Sens. J. 2015, 15, 5045–5052. [Google Scholar] [CrossRef]
- Zaliasl, S.; Salvia, J.C.; Hill, G.C.; Chen, L.; Joo, K.; Palwai, R.; Arumugam, N.; Phadke, M.; Mukherjee, S.; Lee, H.C.; et al. A 3 ppm 1.5 × 0.8 mm² 1.0 µA 32.768 kHz MEMS-Based Oscillator. IEEE J. Solid-State Circuits 2015, 50, 291–302. [Google Scholar] [CrossRef] [Green Version]
- Aprile, A.; Folz, M.; Gardino, D.; Malcovati, P.; Bonizzoni, E. A Compact 2.5-nJ Energy/Conversion NPN-Based Temperature-to-Digital Converter with a Fully Current-Mode Processing Architecture. In Proceedings of the 48th European Solid-State Circuits Conference (ESSCIRC), Milan, Italy, 19–22 September 2022; pp. 473–476. [Google Scholar]
- Vaz, A.; Ubarretxena, A.; Zalbide, I.; Pardo, D.; Solar, H.; Garcia-Alonso, A.; Berenguer, R. Full Passive UHF Tag with a Temperature Sensor Suitable for Human Body Temperature Monitoring. IEEE Trans. Circuits Syst. II Express Briefs 2010, 57, 95–99. [Google Scholar] [CrossRef]
- Law, M.K.; Lu, S.; Wu, T.; Bermak, A.; Mak, P.; Martins, R.P. A 1.1 µW CMOS Smart Temperature Sensor with an Inaccuracy of ±0.2 °C (3σ) for Clinical Temperature Monitoring. IEEE Sens. J. 2016, 16, 2272–2281. [Google Scholar]
- Pan, S.; Makinwa, K.A.A. A 6.6-µW Wheatstone-Bridge Temperature Sensor for Biomedical Applications. IEEE Solid-State Circuits Lett. 2020, 3, 334–337. [Google Scholar] [CrossRef]
- Law, M.K.; Bermak, A.; Luong, H.C. A Sub-µW Embedded CMOS Temperature Sensor for RFID Food Monitoring Application. IEEE J. Solid-State Circuits 2010, 45, 1246–1255. [Google Scholar] [CrossRef]
- Wang, B.; Law, M.K.; Bermak, A.; Luong, H.C. A Passive RFID Tag Embedded Temperature Sensor with Improved Process Spreads Immunity for a −30 °C to 60 °C Sensing Range. IEEE Trans. Circuits Syst. I Regul. Pap. 2014, 61, 337–346. [Google Scholar] [CrossRef]
- Cho, N.; Song, S.J.; Kim, S.; Kim, S.; Yoo, H.J. A 5.1-µW UHF RFID tag chip integrated with sensors for wireless environmental monitoring. In Proceedings of the 31st European Solid-State Circuits Conference (ESSCIRC), Grenoble, France, 12–16 September 2005; pp. 279–282. [Google Scholar]
- Shen, H.; Li, L.; Zhou, Y. Fully integrated passive UHF RFID tag with temperature sensor for environment monitoring. In Proceedings of the 7th International Conference on ASIC (ASICON), Guilin, China, 22–25 October 2007; pp. 360–363. [Google Scholar]
- Yin, J.; Yi, J.; Law, M.K.; Ling, Y.; Lee, M.C.; Ng, K.P.; Gao, B.; Luong, H.C.; Bermak, A.; Chan, M.; et al. A System-on-Chip EPC Gen-2 Passive UHF RFID Tag with Embedded Temperature Sensor. IEEE J. Solid-State Circuits 2010, 45, 2404–2420. [Google Scholar]
- Opasjumruskit, K.; Thanthipwan, T.; Sathusen, O.; Sirinamarattana, P.; Gadmanee, P.; Pootarapan, E.; Wongkomet, N.; Thanachayanont, A.; Thamsirianunt, M. Self-powered wireless temperature sensors exploit RFID technology. IEEE Pervasive Comput. 2006, 5, 54–61. [Google Scholar] [CrossRef]
- Bakker, A. CMOS smart temperature sensors—An overview. IEEE Sens. J. 2002, 2, 1423–1427. [Google Scholar]
- Li, J.; Lin, Y.; Ning, N.; Yu, Q. A +0.44 °C/−0.4 °C Inaccuracy Temperature Sensor with Multi-Threshold MOSFET-Based Sensing Element and CMOS Thyristor-Based VCO. IEEE Trans. Circuits Syst. I Regul. Pap. 2021, 68, 1102–1113. [Google Scholar] [CrossRef]
- Aprile, A.; Folz, M.; Gardino, D.; Malcovati, P.; Bonizzoni, E. A One-Point Exponential Trimming Technique for an Effective Suppression of Process Spread in BJT-based Temperature Processing Circuits. In Proceedings of the 2022 IEEE International Symposium on Circuits and Systems (ISCAS), Austin, TX, USA, 28 May–1 June 2022; pp. 881–884. [Google Scholar]
- Makinwa, K.A.A. Smart temperature sensors in standard CMOS. Procedia Eng. 2010, 5, 930–939. [Google Scholar] [CrossRef] [Green Version]
- Aprile, A.; Moisello, E.; Bonizzoni, E.; Malcovati, P. An Extensive Investigation and Analysis of Temperature-to-Digital Converter FoMs. In Proceedings of the 28th IEEE International Conference on Electronics, Circuits, and Systems (ICECS), Dubai, United Arab Emirates, 28 November–1 December 2021; pp. 1–4. [Google Scholar]
- Zjajo, A.; Barragan, M.J.; de Gyvez, J.P. Low-Power Die-Level Process Variation and Temperature Monitors for Yield Analysis and Optimization in Deep-Submicron CMOS. IEEE Trans. Instrum. Meas. 2012, 61, 2212–2221. [Google Scholar] [CrossRef]
- Shim, D.; Jeong, H.; Lee, H.; Rhee, C.; Jeong, D.K.; Kim, S. A Process-Variation-Tolerant On-Chip CMOS Thermometer for Auto Temperature Compensated Self-Refresh of Low-Power Mobile DRAM. IEEE J. Solid-State Circuits 2013, 48, 2550–2557. [Google Scholar] [CrossRef]
- Pelzers, K.; Xin, H.; Cantatore, E.; Harpe, P. A 2.18-pJ/conversion, 1656-µm2 Temperature Sensor with a 0.61-pJ·K2 FoM and 52-pW Stand-By Power. IEEE Solid-State Circuits Lett. 2020, 3, 82–85. [Google Scholar] [CrossRef]
- Chen, P.; Hu, Y.; Liou, J.; Ren, B. A 486 kS/s CMOS Time-Domain Smart Temperature Sensor with −0.85 °C/0.78 °C Voltage-Calibrated Error. In Proceedings of the 2015 IEEE International Symposium on Circuits and Systems (ISCAS), Lisbon, Portugal, 24–27 May 2015; pp. 2109–2112. [Google Scholar]
- Chen, P.; Chen, C.C.; Peng, Y.H.; Wang, K.M.; Wang, Y.S. A Time-Domain SAR Smart Temperature Sensor with Curvature Compensation and a 3σ Inaccuracy of −0.4 °C ∼ +0.6 °C Over a 0 °C to 90 °C Range. IEEE J. Solid-State Circuits 2010, 45, 600–609. [Google Scholar] [CrossRef]
- Park, H.; Kim, J. A 0.8-V Resistor-Based Temperature Sensor in 65-nm CMOS with Supply Sensitivity of 0.28 °C/V. IEEE J. Solid-State Circuits 2018, 53, 906–912. [Google Scholar] [CrossRef]
- Sebastiano, F.; Breems, L.J.; Makinwa, K.A.A.; Drago, S.; Leenaerts, D.M.W.; Nauta, B. A 1.2 V 10 µW NPN-Based Temperature Sensor in 65nm CMOS with an Inaccuracy of ±0.2 °C (3σ) from −70 °C to 125 °C. In Proceedings of the 2010 IEEE International Solid-State Circuits Conference (ISSCC), San Francisco, CA, USA, 7–11 February 2010; pp. 312–313. [Google Scholar]
- Souri, K.; Makinwa, K.A.A. A 0.12 mm2 7.4 µW Micropower Temperature Sensor with an Inaccuracy of ±0.2 °C (3σ) from −30 °C to 125 °C. IEEE J. Solid-State Circuits 2011, 46, 1693–1700. [Google Scholar] [CrossRef]
- Souri, K.; Souri, K.; Makinwa, K.A.A. A 40 µW CMOS Temperature Sensor with an Inaccuracy of ±0.4 °C (3σ) from −55 °C to 200 °C. In Proceedings of the 39th European Solid-State Circuits Conference (ESSCIRC), Bucharest, Romania, 16–20 September 2013; pp. 221–224. [Google Scholar]
- Eitan, R.; Cohen, A. Untrimmed Low-Power Thermal Sensor for SoC in 22 nm Digital Fabrication Technology. J. Low Power Electron. Appl. 2014, 4, 304–316. [Google Scholar] [CrossRef] [Green Version]
- Heidary, A.; Wang, G.; Makinwa, K.A.A.; Meijer, G. A BJT-based CMOS Temperature Sensor with a 3.6 pJ·K2-Resolution FoM. In Proceedings of the 2014 IEEE International Solid-State Circuits Conference (ISSCC), San Francisco, CA, USA, 9–13 February 2014; pp. 224–225. [Google Scholar]
- Deng, C.; Sheng, Y.; Wang, S.; Hu, W.; Diao, S.; Qian, D. A CMOS Smart Temperature Sensor with Single-Point Calibration Method for Clinical Use. IEEE Trans. Circuits Syst. II Express Briefs 2016, 63, 136–140. [Google Scholar] [CrossRef]
- Eberlein, M.; Yahav, I. A 28nm CMOS Ultra-Compact Thermal Sensor in Current-Mode Technique. In Proceedings of the 2016 Symposium on VLSI Circuits (VLSI Circuits), Honolulu, HI, USA, 15–17 June 2016; pp. 1–2. [Google Scholar]
- Shalmany, S.H.; Draxelmayr, D.; Makinwa, K.A.A. A ±5 A Integrated Current-Sensing System with ±0.3% Gain Error and 16 µA Offset from −55 °C to +85 °C. IEEE J. Solid-State Circuits 2016, 51, 800–808. [Google Scholar]
- Hsu, Y.C.; Tai, C.L.; Chuang, M.C.; Roth, A.; Soenen, E. An 18.75 µW Dynamic-Distributing-Bias Temperature Sensor with 0.87°C (3σ) Untrimmed Inaccuracy and 0.00946 mm2 Area. In Proceedings of the 2017 IEEE International Solid-State Circuits Conference (ISSCC), San Francisco, CA, USA, 5–9 February 2017; pp. 102–103. [Google Scholar]
- Yousefzadeh, B.; Shalmany, S.H.; Makinwa, K.A.A. A BJT-Based Temperature-to-Digital Converter with ±60 mK (3σ) Inaccuracy from −55 °C to +125 °C in 0.16-µm CMOS. IEEE J. Solid-State Circuits 2017, 52, 1044–1052. [Google Scholar] [CrossRef] [Green Version]
- Tang, Z.; Fang, Y.; Yu, X.P.; Shi, Z.; Tan, N. A CMOS Temperature Sensor with Versatile Readout Scheme and High Accuracy for Multi-Sensor Systems. IEEE Trans. Circuits Syst. I: Regul. Pap. 2018, 65, 3821–3829. [Google Scholar] [CrossRef]
- Wang, B.; Law, M.K.; Tsui, C.Y.; Bermak, A. A 10.6 pJ·K2 Resolution FoM Temperature Sensor Using Astable Multivibrator. IEEE Trans. Circuits Syst. II Express Briefs 2018, 65, 869–873. [Google Scholar] [CrossRef]
- Tang, Z.; Fang, Y.; Huang, Z.; Yu, X.P.; Shi, Z.; Tan, N.N. An Untrimmed BJT-Based Temperature Sensor with Dynamic Current-Gain Compensation in 55-nm CMOS Process. IEEE Trans. Circuits Syst. II Express Briefs 2019, 66, 1613–1617. [Google Scholar] [CrossRef]
- Shalmany, S.H.; Souri, K.; Sönmez, U.; Souri, K.; D’Urbino, M.; Hussaini, S.; Tauro, D.; Tabatabaei, S. A 620µW BJT-Based Temperature-to-Digital Converter with 0.65mK Resolution and FoM of 190fJ·K2. In Proceedings of the 2020 IEEE International Solid- State Circuits Conference (ISSCC), San Francisco, CA, USA, 16–20 February 2020; pp. 70–72. [Google Scholar]
- Yousefzadeh, B.; Makinwa, K.A.A. A BJT-Based Temperature-to-Digital Converter with a ±0.25°C 3σ-Inaccuracy from −40 °C to +180 °C Using Heater-Assisted Voltage Calibration. IEEE J. Solid-State Circuits 2020, 55, 369–377. [Google Scholar] [CrossRef]
- Huang, Z.; Tang, Z.; Yu, X.P.; Shi, Z.; Lin, L.; Tan, N.N. A BJT-Based CMOS Temperature Sensor with Duty-Cycle-Modulated Output and ±0.5 °C (3σ) Inaccuracy from −40 °C to 125 °C. IEEE Trans. Circuits Syst. II Express Briefs 2021, 68, 2780–2784. [Google Scholar] [CrossRef]
- Aprile, A.; Gardino, D.; Malcovati, P.; Bonizzoni, E. Linearity Boosting Technique Analysis for a Modified Current-Mode Bandgap Reference. In Proceedings of the 27th IEEE International Conference on Electronics, Circuits, and Systems (ICECS), Glasgow, UK, 23–25 November 2020; pp. 1–4. [Google Scholar]
- Aprile, A.; Moisello, E.; Bonizzoni, E.; Malcovati, P. Performance Comparison of BJT and MOS Devices as Temperature Sensing Elements. In Proceedings of the 29th IEEE International Conference on Electronics, Circuits, and Systems (ICECS), Glasgow, UK, 24–26 October 2022; pp. 1–4. [Google Scholar]
- Souri, K.; Chae, Y.; Ponomarev, Y.; Makinwa, K.A.A. A Precision DTMOST-based Temperature Sensor. In Proceedings of the 37th European Solid-State Circuits Conference (ESSCIRC), Helsinki, Finland, 12–16 September 2011; pp. 279–282. [Google Scholar]
- Lee, S.C.; Chiueh, H. A 69 µW CMOS Smart Temperature Sensor with an Inaccuracy of ±0.8 °C (3σ) from −50 °C to 150 °C. In Proceedings of the 2012 SENSORS Conference, Taipei, Taiwan, 28–31 October 2012; pp. 1–4. [Google Scholar]
- Someya, T.; Islam, A.K.M.M.; Sakurai, T.; Takamiya, M. An 11-nW CMOS Temperature-to-Digital Converter Utilizing Sub-Threshold Current at Sub-Thermal Drain Voltage. IEEE J. Solid-State Circuits 2019, 54, 613–622. [Google Scholar] [CrossRef]
- Someya, T.; Islam, A.K.M.M.; Okada, K. A 6.4 nW 1.7% Relative Inaccuracy CMOS Temperature Sensor Utilizing Sub-Thermal Drain Voltage Stabilization and Frequency-Locked Loop. IEEE Solid-State Circuits Lett. 2020, 3, 458–461. [Google Scholar] [CrossRef]
- Chen, P.; Chen, T.K.; Wang, Y.S.; Chen, C.C. A Time-Domain Sub-Micro Watt Temperature Sensor with Digital Set-Point Programming. IEEE Sens. J. 2009, 9, 1639–1646. [Google Scholar] [CrossRef]
- Chen, P.; Chen, S.C.; Shen, Y.S.; Peng, Y.J. All-Digital Time-Domain Smart Temperature Sensor with an Inter-Batch Inaccuracy of −0.7 °C–+0.6 °C After One-Point Calibration. IEEE Trans. Circuits Syst. I: Regul. Pap. 2011, 68, 913–920. [Google Scholar] [CrossRef]
- Ha, D.; Woo, K.; Meninger, S.; Xanthopoulos, T.; Crain, E.; Ham, D. Time-Domain CMOS Temperature Sensors with Dual Delay-Locked Loops for Microprocessor Thermal Monitoring. IEEE Trans. Very Large Scale Integr. (VLSI) Syst. 2012, 20, 1590–1601. [Google Scholar] [CrossRef]
- Song, W.; Lee, J.; Cho, N.; Burm, J. An Ultralow Power Time-Domain Temperature Sensor with Time-Domain Delta–Sigma TDC. IEEE Trans. Circuits Syst. II Express Briefs 2017, 64, 1117–1121. [Google Scholar] [CrossRef]
- Ueno, K.; Asai, T.; Amemiya, Y. Low-power temperature-to-frequency converter consisting of subthreshold CMOS circuits for integrated smart temperature sensors. Sens. Actuators A Phys. 2011, 165, 132–137. [Google Scholar] [CrossRef]
- Hwang, S.; Koo, J.; Kim, K.; Lee, H.; Kim, C. A 0.008 mm2 500 µW 469 kS/s Frequency-to-Digital Converter Based CMOS Temperature Sensor with Process Variation Compensation. IEEE Trans. Circuits Syst. I Regul. Pap. 2013, 60, 2241–2248. [Google Scholar] [CrossRef]
- Jeong, S.; Foo, Z.; Lee, Y.; Sim, J.Y.; Blaauw, D.; Sylvester, D. A Fully-Integrated 71 nW CMOS Temperature Sensor for Low Power Wireless Sensor Nodes. IEEE J. Solid-State Circuits 2014, 49, 1682–1693. [Google Scholar] [CrossRef]
- Anand, T.; Makinwa, K.A.A.; Hanumolu, P.K. A Self-referenced VCO-based Temperature Sensor with 0.034 °C/mV Supply Sensitivity in 65nm CMOS. In Proceedings of the 2015 Symposium on VLSI Circuits (VLSI Circuits), Kyoto, Japan, 17–19 June 2015; pp. C200–C201. [Google Scholar]
- Kim, Y.; Choi, W.; Kim, J.; Lee, S.; Lee, S.; Kim, H.; Makinwa, K.A.A.; Chae, Y.; Kim, T.W. A 0.02 mm2 Embedded Temperature Sensor with ±2°C Inaccuracy for Self-Refresh Control in 25nm Mobile DRAM. In Proceedings of the 41st European Solid-State Circuits Conference (ESSCIRC), Graz, Austria, 14–18 September 2015; pp. 267–270. [Google Scholar]
- Yang, K.; Dong, Q.; Jung, W.; Zhang, Y.; Choi, M.; Blaauw, D.; Sylvester, D. A 0.6 nJ −0.22/+0.19 °C Inaccuracy Temperature Sensor Using Exponential Subthreshold Oscillation Dependence. In Proceedings of the 2017 IEEE International Solid-State Circuits Conference (ISSCC), San Francisco, CA, USA, 5–9 February 2017; pp. 160–161. [Google Scholar]
- Cochet, M.; Keller, B.; Clerc, S.; Abouzeid, F.; Cathelin, A.; Autran, J.L.; Roche, P.; Nikolić, B. A 225 µm2 Probe Single-Point Calibration Digital Temperature Sensor Using Body-Bias Adjustment in 28 nm FD-SOI CMOS. IEEE Solid-State Circuits Lett. 2018, 1, 14–17. [Google Scholar] [CrossRef]
- Truesdell, D.S.; Calhoun, B.H. A 640 pW 22 pJ/sample Gate Leakage-Based Digital CMOS Temperature Sensor with 0.25 °C Resolution. In Proceedings of the 2019 IEEE Custom Integrated Circuits Conference (CICC), Austin, TX, USA, 14–17 April 2019; pp. 1–4. [Google Scholar]
- Wang, H.; Mercier, P.P. A 763 pW 230 pJ/Conversion Fully Integrated CMOS Temperature-to-Digital Converter with +0.81 °C/−0.75 °C Inaccuracy. IEEE J. Solid-State Circuits 2019, 54, 2281–2290. [Google Scholar] [CrossRef]
- Shahmohammadi, M.; Souri, K.; Makinwa, K.A.A. A Resistor-Based Temperature Sensor for MEMS Frequency References. In Proceedings of the 39th European Solid State Circuits Conference (ESSCIRC), Bucharest, Romania, 16–20 September 2013; pp. 225–228. [Google Scholar]
- Wang, A.; Chen, C.; Liu, C.; Shi, C.J.R. A 9-Bit Resistor-Based Highly Digital Temperature Sensor with a SAR-Quantization Embedded Differential Low-Pass Filter in 65-nm CMOS with a 2.5-µs Conversion Time. IEEE Sens. J. 2019, 19, 7215–7225. [Google Scholar] [CrossRef]
- Xin, H.; Andraud, M.; Baltus, P.; Cantatore, E.; Harpe, P. A 174 pW–488.3 nW 1 S/s–100 kS/s All-Dynamic Resistive Temperature Sensor with Speed/Resolution/Resistance Adaptability. IEEE Solid-State Circuits Lett. 2018, 1, 70–73. [Google Scholar] [CrossRef]
- Pan, S.; Makinwa, K.A.A. A 0.25 mm2-Resistor-Based Temperature Sensor with an Inaccuracy of 0.12 °C (3σ) from −55 °C to 125 °C. IEEE J. Solid-State Circuits 2018, 53, 3347–3355. [Google Scholar] [CrossRef] [Green Version]
- Pan, S.; Makinwa, K.A.A. A 10 fJ·K2 Wheatstone Bridge Temperature Sensor with a Tail-Resistor-Linearized OTA. IEEE J. Solid-State Circuits 2021, 56, 501–510. [Google Scholar] [CrossRef]
- Jain, A.; Jiang, H.; Pochet, C.; Hall, D.A. A 310 nW Temperature Sensor Achieving 9.8 mK Resolution Using a DFLL-Based Readout Circuit. IEEE Trans. Circuits Syst. II Express Briefs 2022, 69, 704–708. [Google Scholar] [CrossRef]
- Mordakhay, A.; Shor, J. Miniaturized, 0.01 mm2, Resistor-Based Thermal Sensor with an Energy Consumption of 0.9 nJ and a Conversion Time of 80 µs for Processor Applications. IEEE J. Solid-State Circuits 2018, 53, 2958–2969. [Google Scholar] [CrossRef]
- Ku, H.S.; Choi, S.; Sim, J.Y. A 12µs-Conversion, 20mK-Resolution Temperature Sensor Based on SAR ADC. IEEE Trans. Circuits Syst. II Express Briefs 2022, 69, 789–793. [Google Scholar]
- Park, P.; Makinwa, K.A.A.; Ruffieux, D. A Resistor-Based Temperature Sensor for a Real Time Clock with ±2 ppm Frequency Stability. In Proceedings of the 40th European Solid State Circuits Conference (ESSCIRC), Venice Lido, Italy, 22–26 September 2014; pp. 391–394. [Google Scholar]
- Pan, S.; Luo, Y.; Shalmany, S.H.; Makinwa, K.A.A. A Resistor-Based Temperature Sensor with a 0.13 pJ·K2 Resolution FoM. IEEE J. Solid-State Circuits 2018, 53, 164–173. [Google Scholar] [CrossRef] [Green Version]
- Pan, S.; Gürleyük, Ç.; Pimenta, M.F.; Makinwa, K.A.A. A 0.12 mm2 Wien-Bridge Temperature Sensor with 0.1 °C (3σ) Inaccuracy from −40 °C to 180 °C. In Proceedings of the 2019 IEEE International Solid-State Circuits Conference (ISSCC), San Francisco, CA, USA, 17–21 February 2019; pp. 184–186. [Google Scholar]
- Angevare, J.A.; Makinwa, K.A.A. A 6800-µm2 Resistor-Based Temperature Sensor with ±0.35 °C (3σ) Inaccuracy in 180-nm CMOS. IEEE J. Solid-State Circuits 2019, 54, 2649–2657. [Google Scholar] [CrossRef] [Green Version]
- Xia, S.; Makinwa, K.A.A. Design of an Optimized Electrothermal Filter for a Temperature-to-Frequency Converter. In Proceedings of the 2007 SENSORS Conference, Atlanta, GA, USA, 28–31 October 2007; pp. 1255–1258. [Google Scholar]
- Kashmiri, S.M.; Xia, S.; Makinwa, K.A.A. A Temperature-to-Digital Converter Based on an Optimized Electrothermal Filter. IEEE J. Solid-State Circuits 2009, 44, 2026–2035. [Google Scholar] [CrossRef] [Green Version]
- van Vroonhoven, C.P.L.; Makinwa, K.A.A. Thermal Diffusivity Sensing: A New Temperature Sensing Paradigm. In Proceedings of the 2011 IEEE Custom Integrated Circuits Conference (CICC), San Jose, CA, USA, 19–21 September 2011; pp. 1–6. [Google Scholar]
- van Vroonhoven, C.P.L.; D’Aquino, D.; Makinwa, K.A.A. A ±0.4 °C (3σ) −70 to 200 °C Time-Domain Temperature Sensor Based on Heat Diffusion in Si and SiO2. In Proceedings of the 2012 IEEE International Solid-State Circuits Conference (ISSCC), San Francisco, CA, USA, 19–23 February 2012; pp. 204–206. [Google Scholar]
- Sönmez, U.; Sebastiano, F.; Makinwa, K.A.A. Compact Thermal-Diffusivity-Based Temperature Sensors in 40-nm CMOS for SoC Thermal Monitoring. IEEE J. Solid-State Circuits 2017, 52, 834–843. [Google Scholar] [CrossRef]
- Pan, S.; Angevare, J.A.; Makinwa, K.A.A. A Self-Calibrated Hybrid Thermal-Diffusivity/Resistor-Based Temperature Sensor. IEEE J. Solid-State Circuits 2021, 56, 3551–3559. [Google Scholar] [CrossRef]
- Makinwa, K.A.A. Smart Temperature Sensor Survey. Available online: http://ei.ewi.tudelft.nl/docs/TSensor_survey.xls (accessed on 5 October 2022).
- Aiello, O.; Alioto, M. Capacitance-Based Voltage Regulation and Reference-Free Temperature-to-Digital Converter down to 0.3 V and 2.5 nW for Direct Harvesting. In Proceedings of the 48th European Solid-State Circuits Conference (ESSCIRC), Milan, Italy, 19–22 September 2022; pp. 381–384. [Google Scholar]
- Chowdhury, G.; Hassibi, A. An On-Chip Temperature Sensor with a Self-Discharging Diode in 32-nm SOI CMOS. IEEE Trans. Circuits Syst. II Express Briefs 2012, 59, 568–572. [Google Scholar] [CrossRef]


| Resistor Type | TC [K] |
|---|---|
| n+ diffusion | |
| p+ diffusion | |
| n-poly | |
| n-well |
| Resistor Type | TC [K] |
|---|---|
| n+ diffusion with salicide | |
| n+ diffusion without salicide | |
| n+ poly with salicide | |
| n+ poly without salicide | |
| n-well under oxide diffusion | |
| n-well under shallow trench isolation | |
| p+ diffusion with salicide | |
| p+ diffusion without salicide | |
| p+ poly with salicide | |
| p+ poly without salicide |
| [K] | [K] | Sensitivity [mV/K] | Nonlinearity 1 [mV] |
|---|---|---|---|
| 2.25 | 126 | ||
| 1.88 | 52.44 | ||
| 1.5 | 0 | ||
| 1.13 | 31.46 |
| BJT-Based TDCs | MOS-Based TDCs | Resistor-Based TDCs | TD-Based TDCs | |
|---|---|---|---|---|
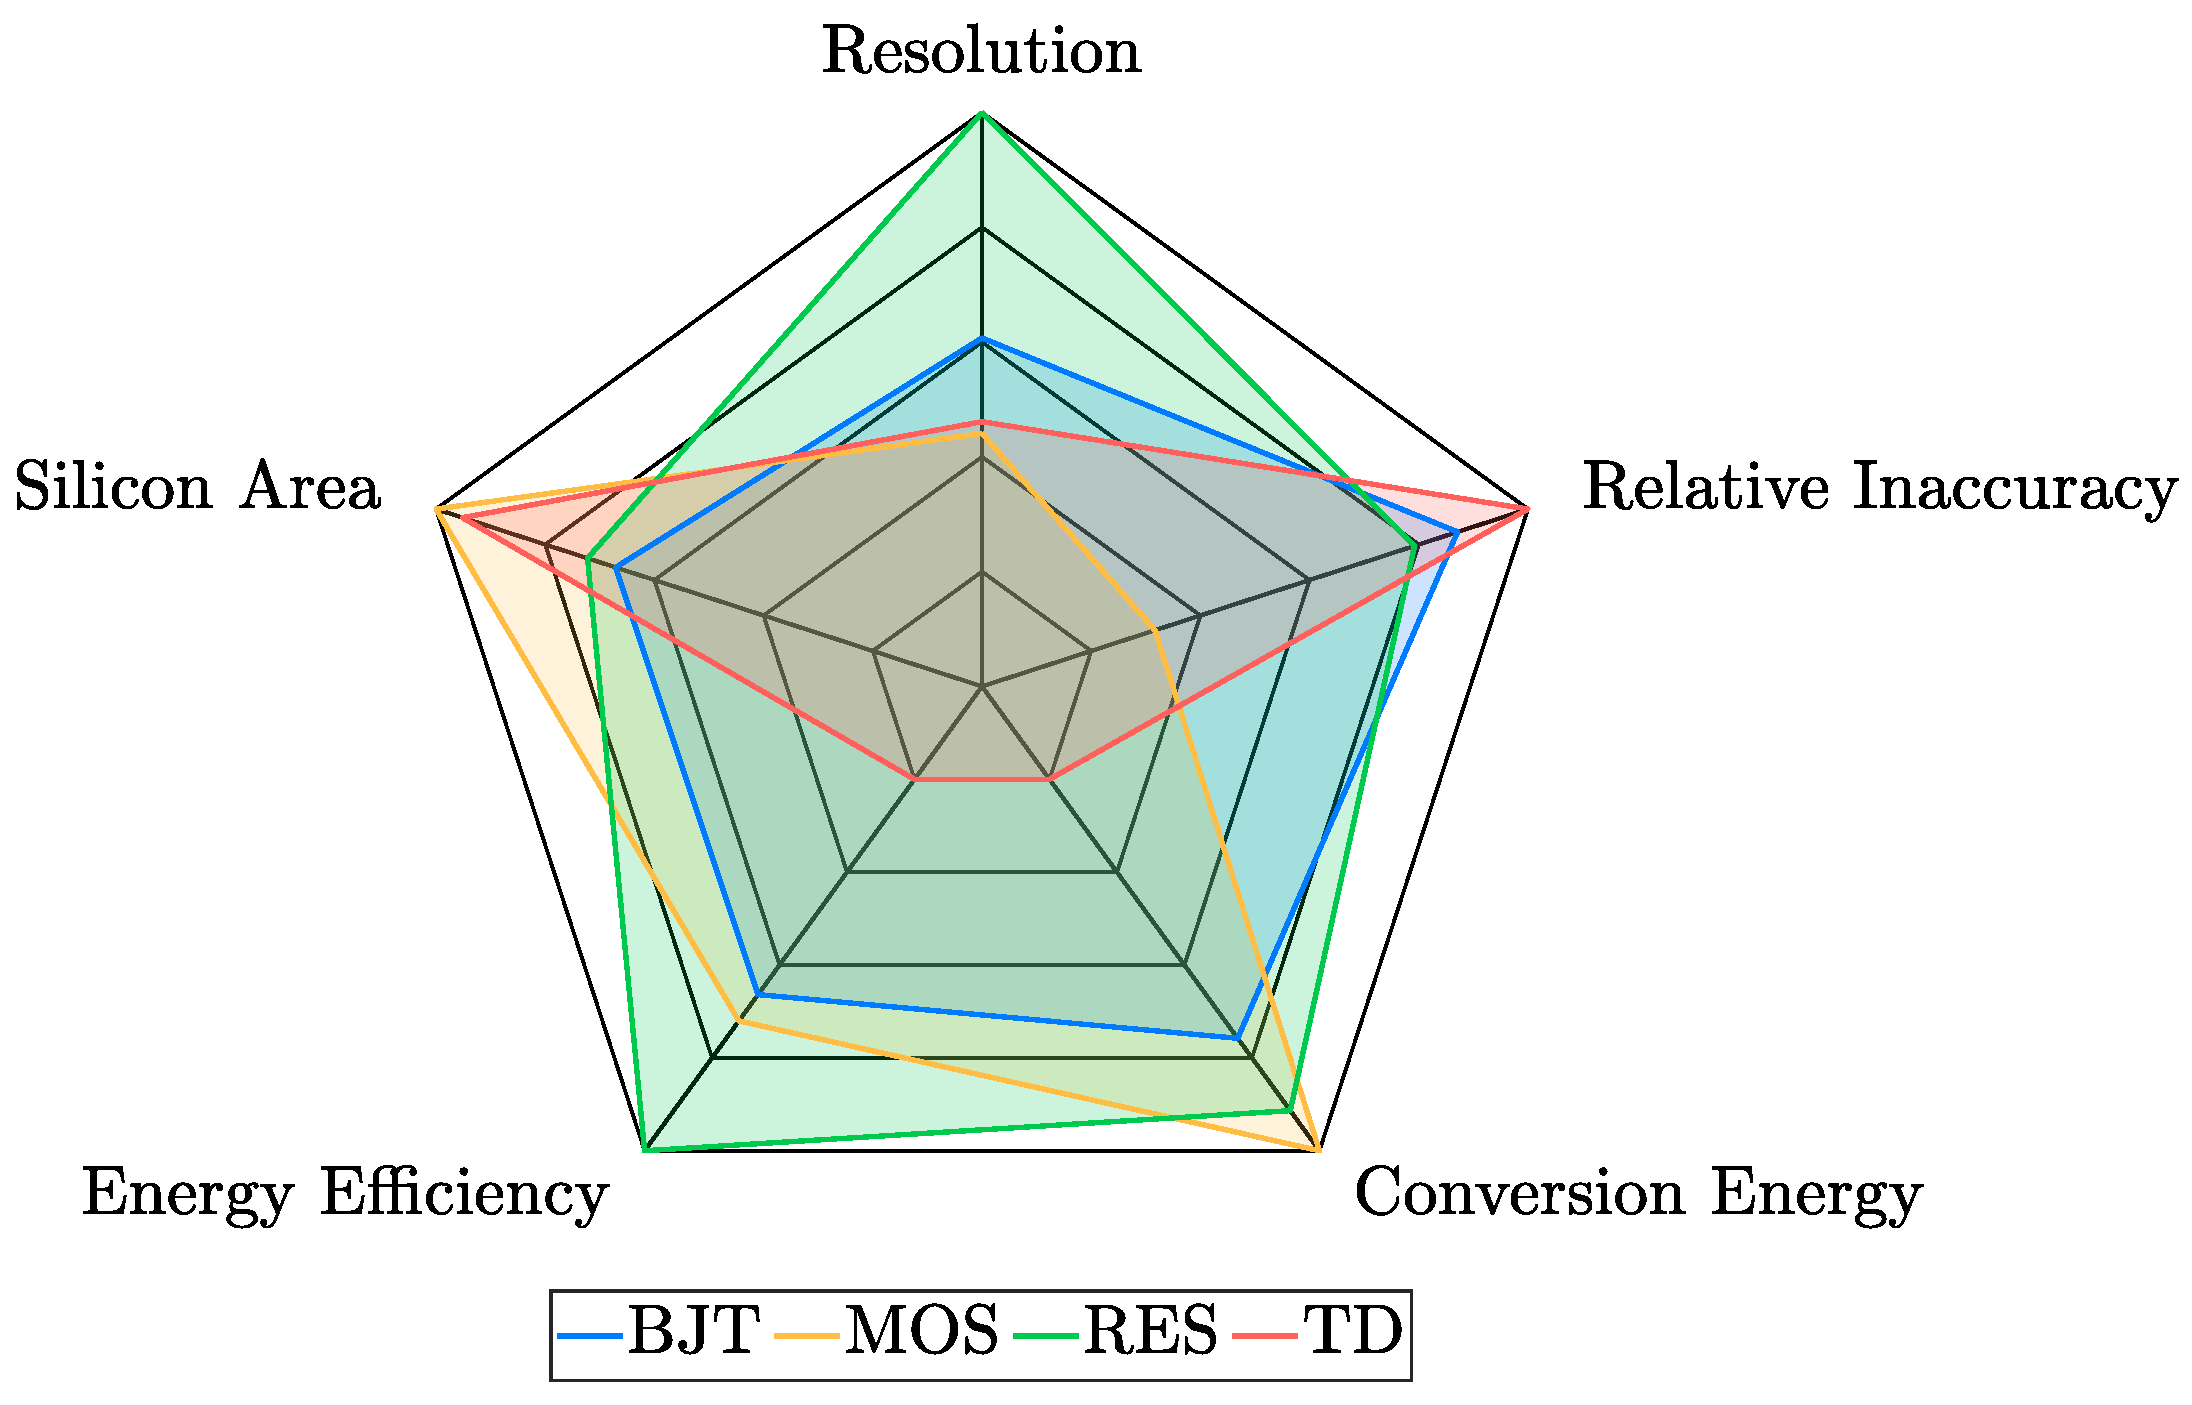
| Resolution | 48 mK | 125 mK | 5 mK | 112 mK |
| Relative Inaccuracy (untrimmed) | 1.95% | / | / | 0.77% |
| Relative Inaccuracy (1-pt trimmed) | 0.46% | 2.10 % | 1.21% | 0.98% |
| Relative Inaccuracy (at least 2-pt trimmed) | 3.47% | 1.59% | 0.45% | / |
| Conversion Energy | 195 nJ | 12 nJ | 51 nJ | 121 µJ |
| Resolution FoM | 0.45 nJ·K | 0.18 nJ·K | 1.43 fJ·K | 1.53 µJ·K |
| Silicon Area | 0.085 mm | 0.033 mm | 0.073 mm | 0.038 mm |
Publisher’s Note: MDPI stays neutral with regard to jurisdictional claims in published maps and institutional affiliations. |
© 2022 by the authors. Licensee MDPI, Basel, Switzerland. This article is an open access article distributed under the terms and conditions of the Creative Commons Attribution (CC BY) license (https://creativecommons.org/licenses/by/4.0/).
Share and Cite
Aprile, A.; Bonizzoni, E.; Malcovati, P. Temperature-to-Digital Converters’ Evolution, Trends and Techniques across the Last Two Decades: A Review. Micromachines 2022, 13, 2025. https://doi.org/10.3390/mi13112025
Aprile A, Bonizzoni E, Malcovati P. Temperature-to-Digital Converters’ Evolution, Trends and Techniques across the Last Two Decades: A Review. Micromachines. 2022; 13(11):2025. https://doi.org/10.3390/mi13112025
Chicago/Turabian StyleAprile, Antonio, Edoardo Bonizzoni, and Piero Malcovati. 2022. "Temperature-to-Digital Converters’ Evolution, Trends and Techniques across the Last Two Decades: A Review" Micromachines 13, no. 11: 2025. https://doi.org/10.3390/mi13112025