
Monitoring Symptoms of Infectious Diseases: Perspectives for Printed Wearable Sensors


Abstract
:1. Introduction
2. Infectious Diseases
2.1. Overview
2.2. Epidemics
2.2.1. COVID-19
2.2.2. Crimean-Congo Hemorrhagic Fever (CCHF)
2.2.3. Ebola Virus Disease (EBOV) and Marburg Virus Disease (MARV)
2.2.4. Lassa Hemorrhagic Fever (LHF)
2.2.5. Middle East Respiratory Syndrome (MERS) and Severe Acute Respiratory Syndrome (SARS)
2.2.6. Rift Valley Fever (RVF)
2.2.7. Nipah Virus Disease (NiV)
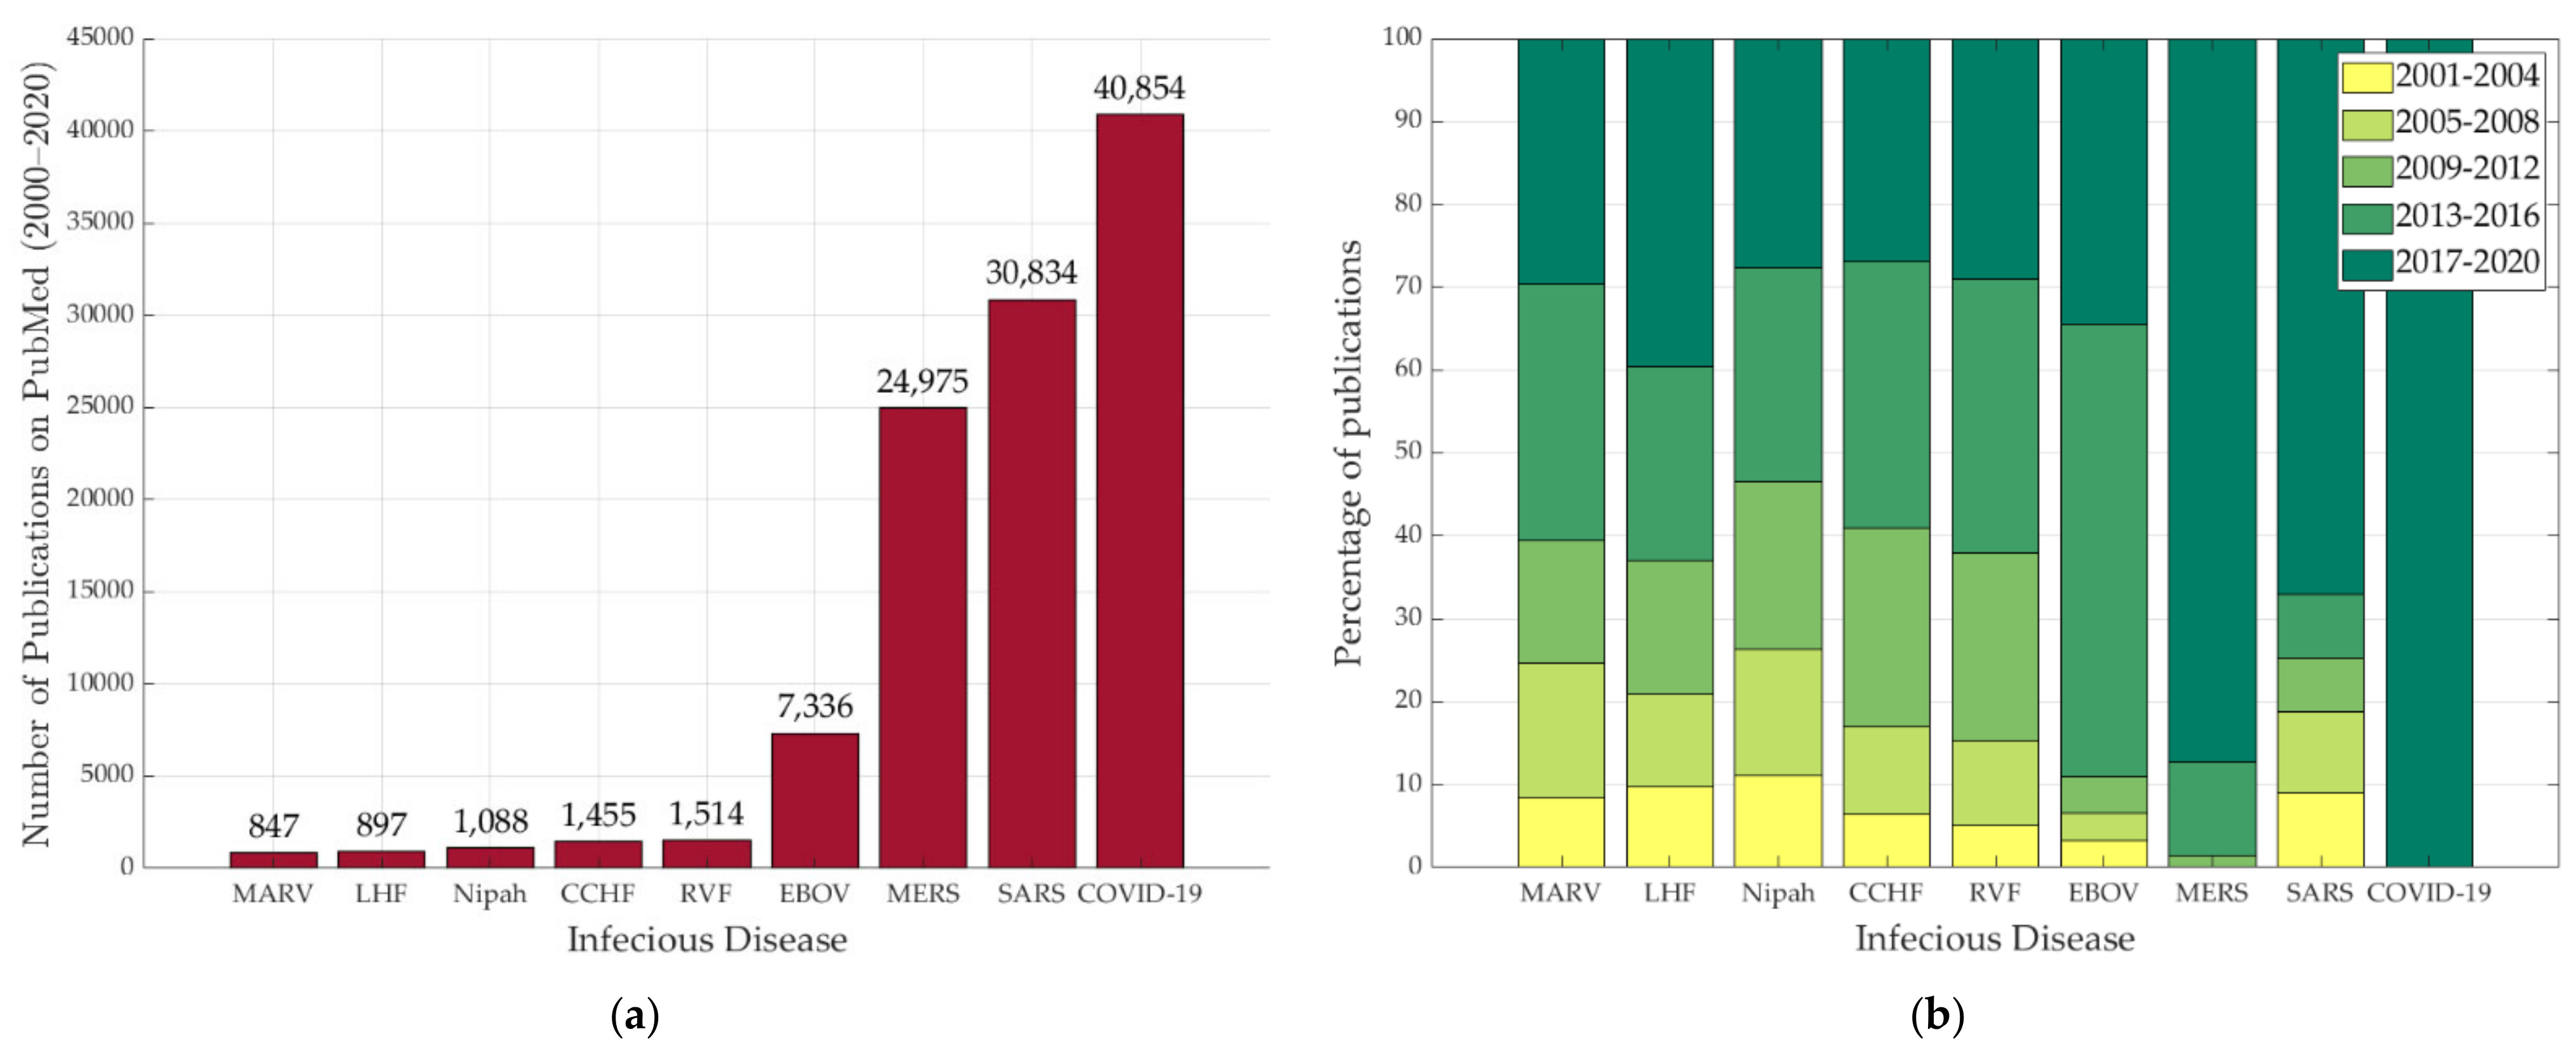
2.3. Infectious Diseases in the Literature
2.4. Disease Surveilance
3. Wearable Sensors
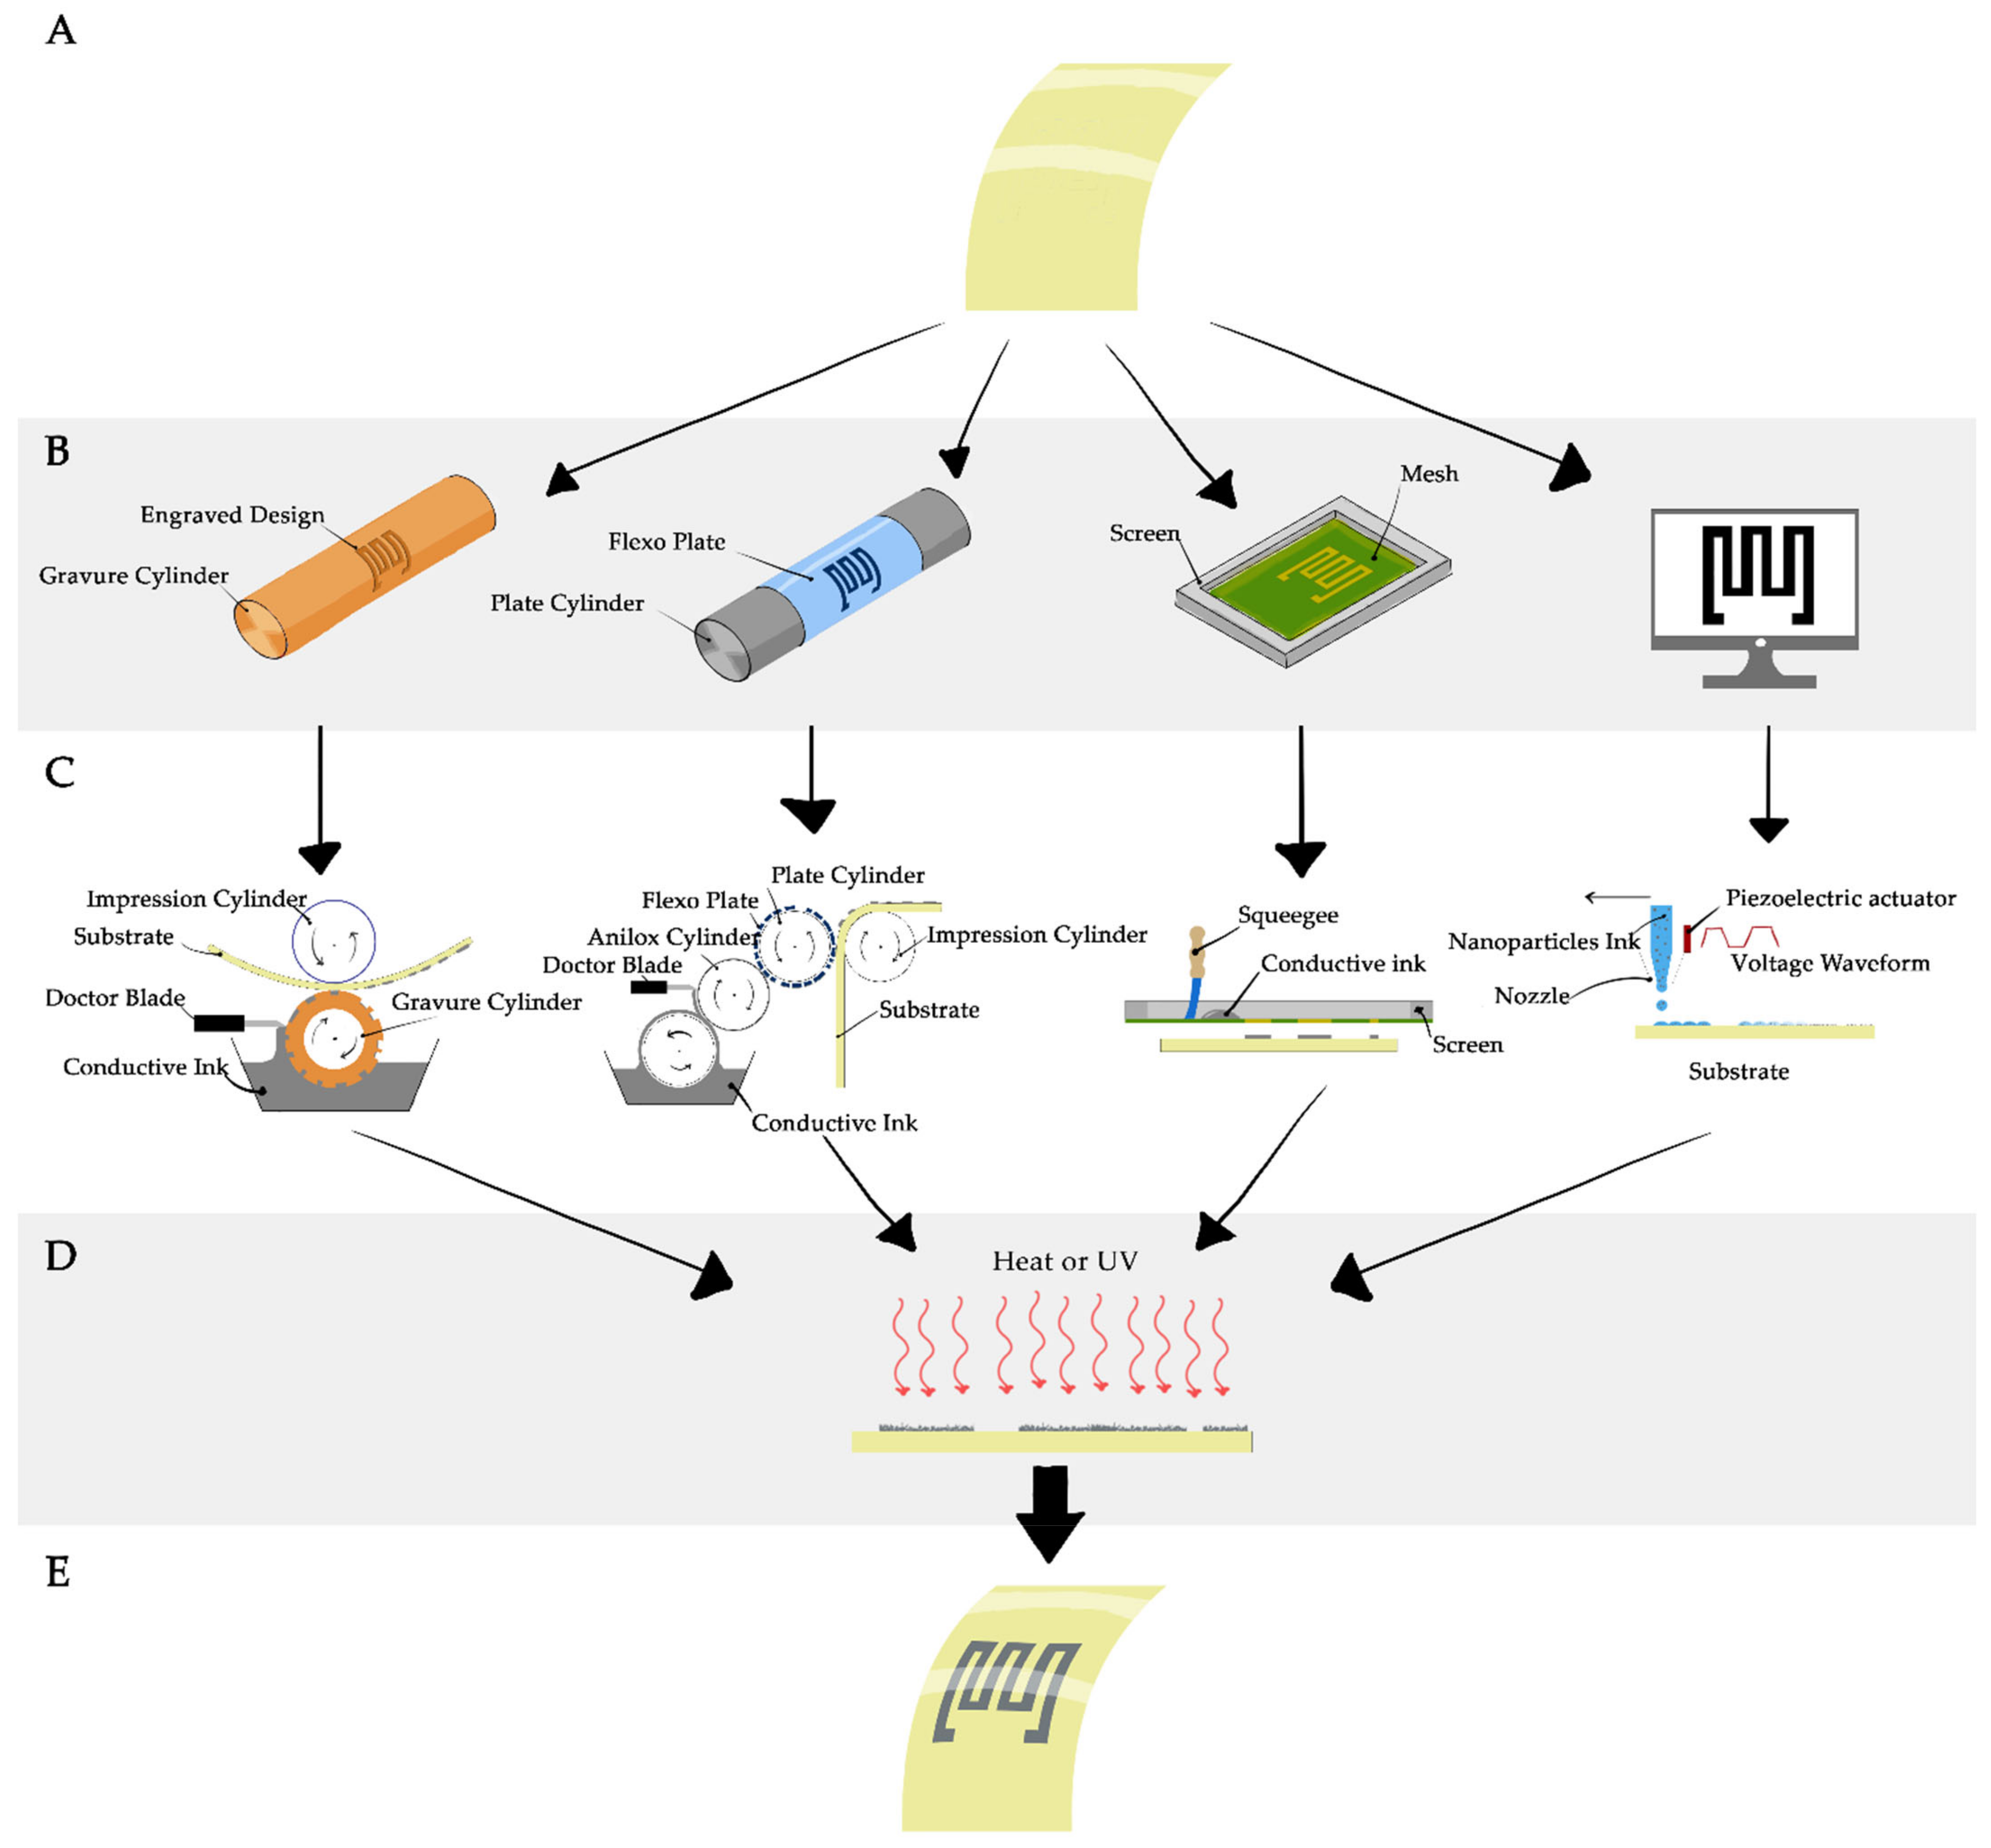
3.1. Printing Technologies
3.1.1. Flexographic Printing
3.1.2. Gravure Printing
3.1.3. Screen Printing
3.1.4. Inkjet Printing
4. Vital Signs Monitoring for Infectious Disease Symptoms
4.1. Body Temperature
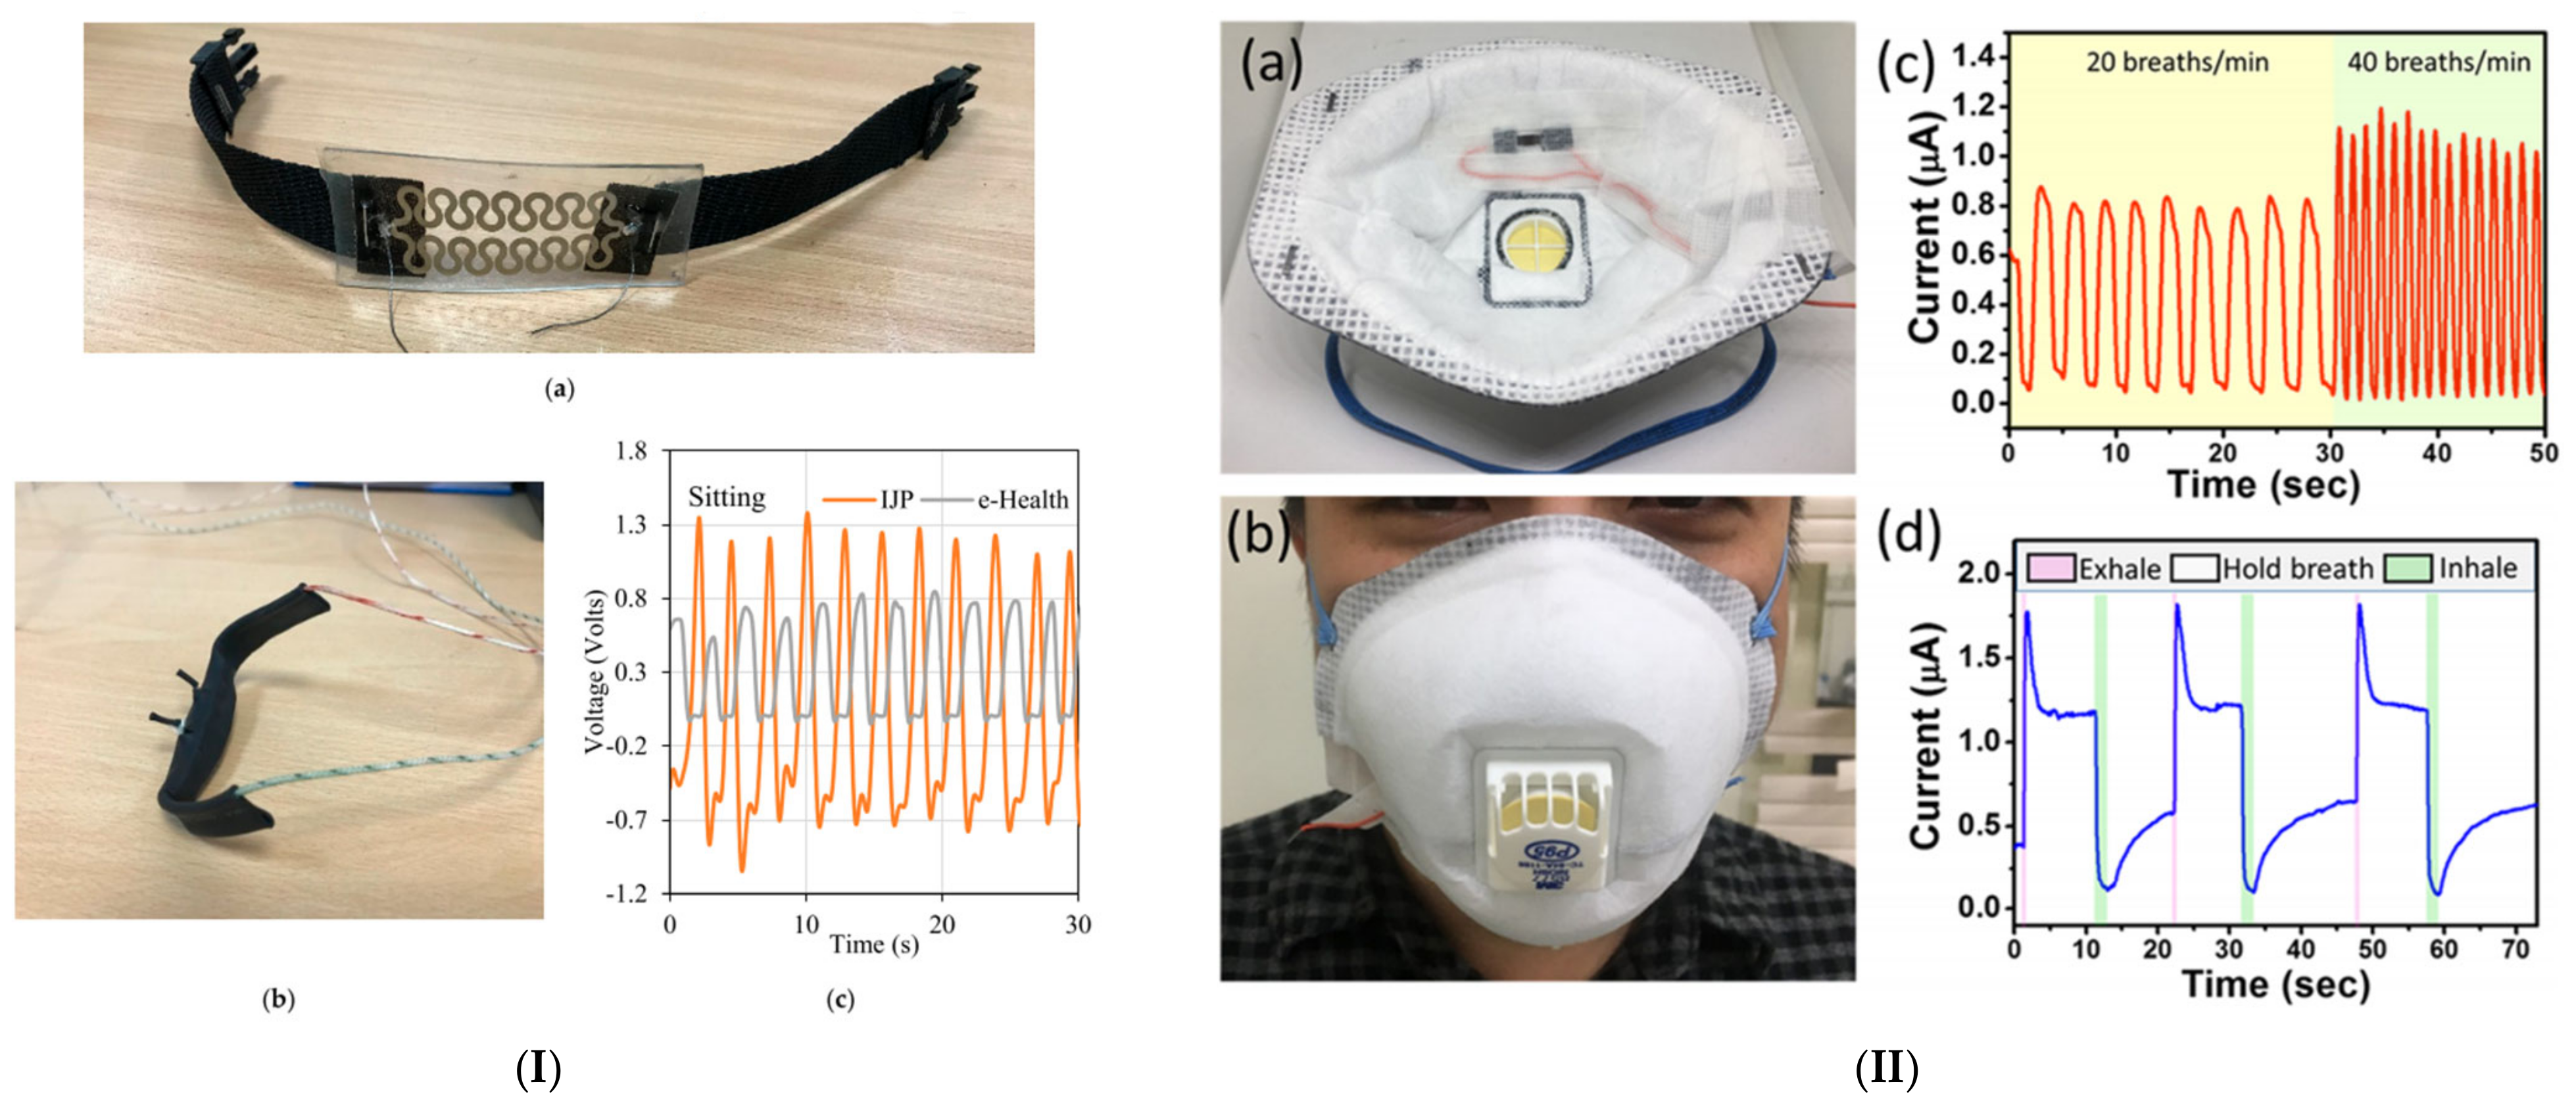
4.2. Respiratory Rate
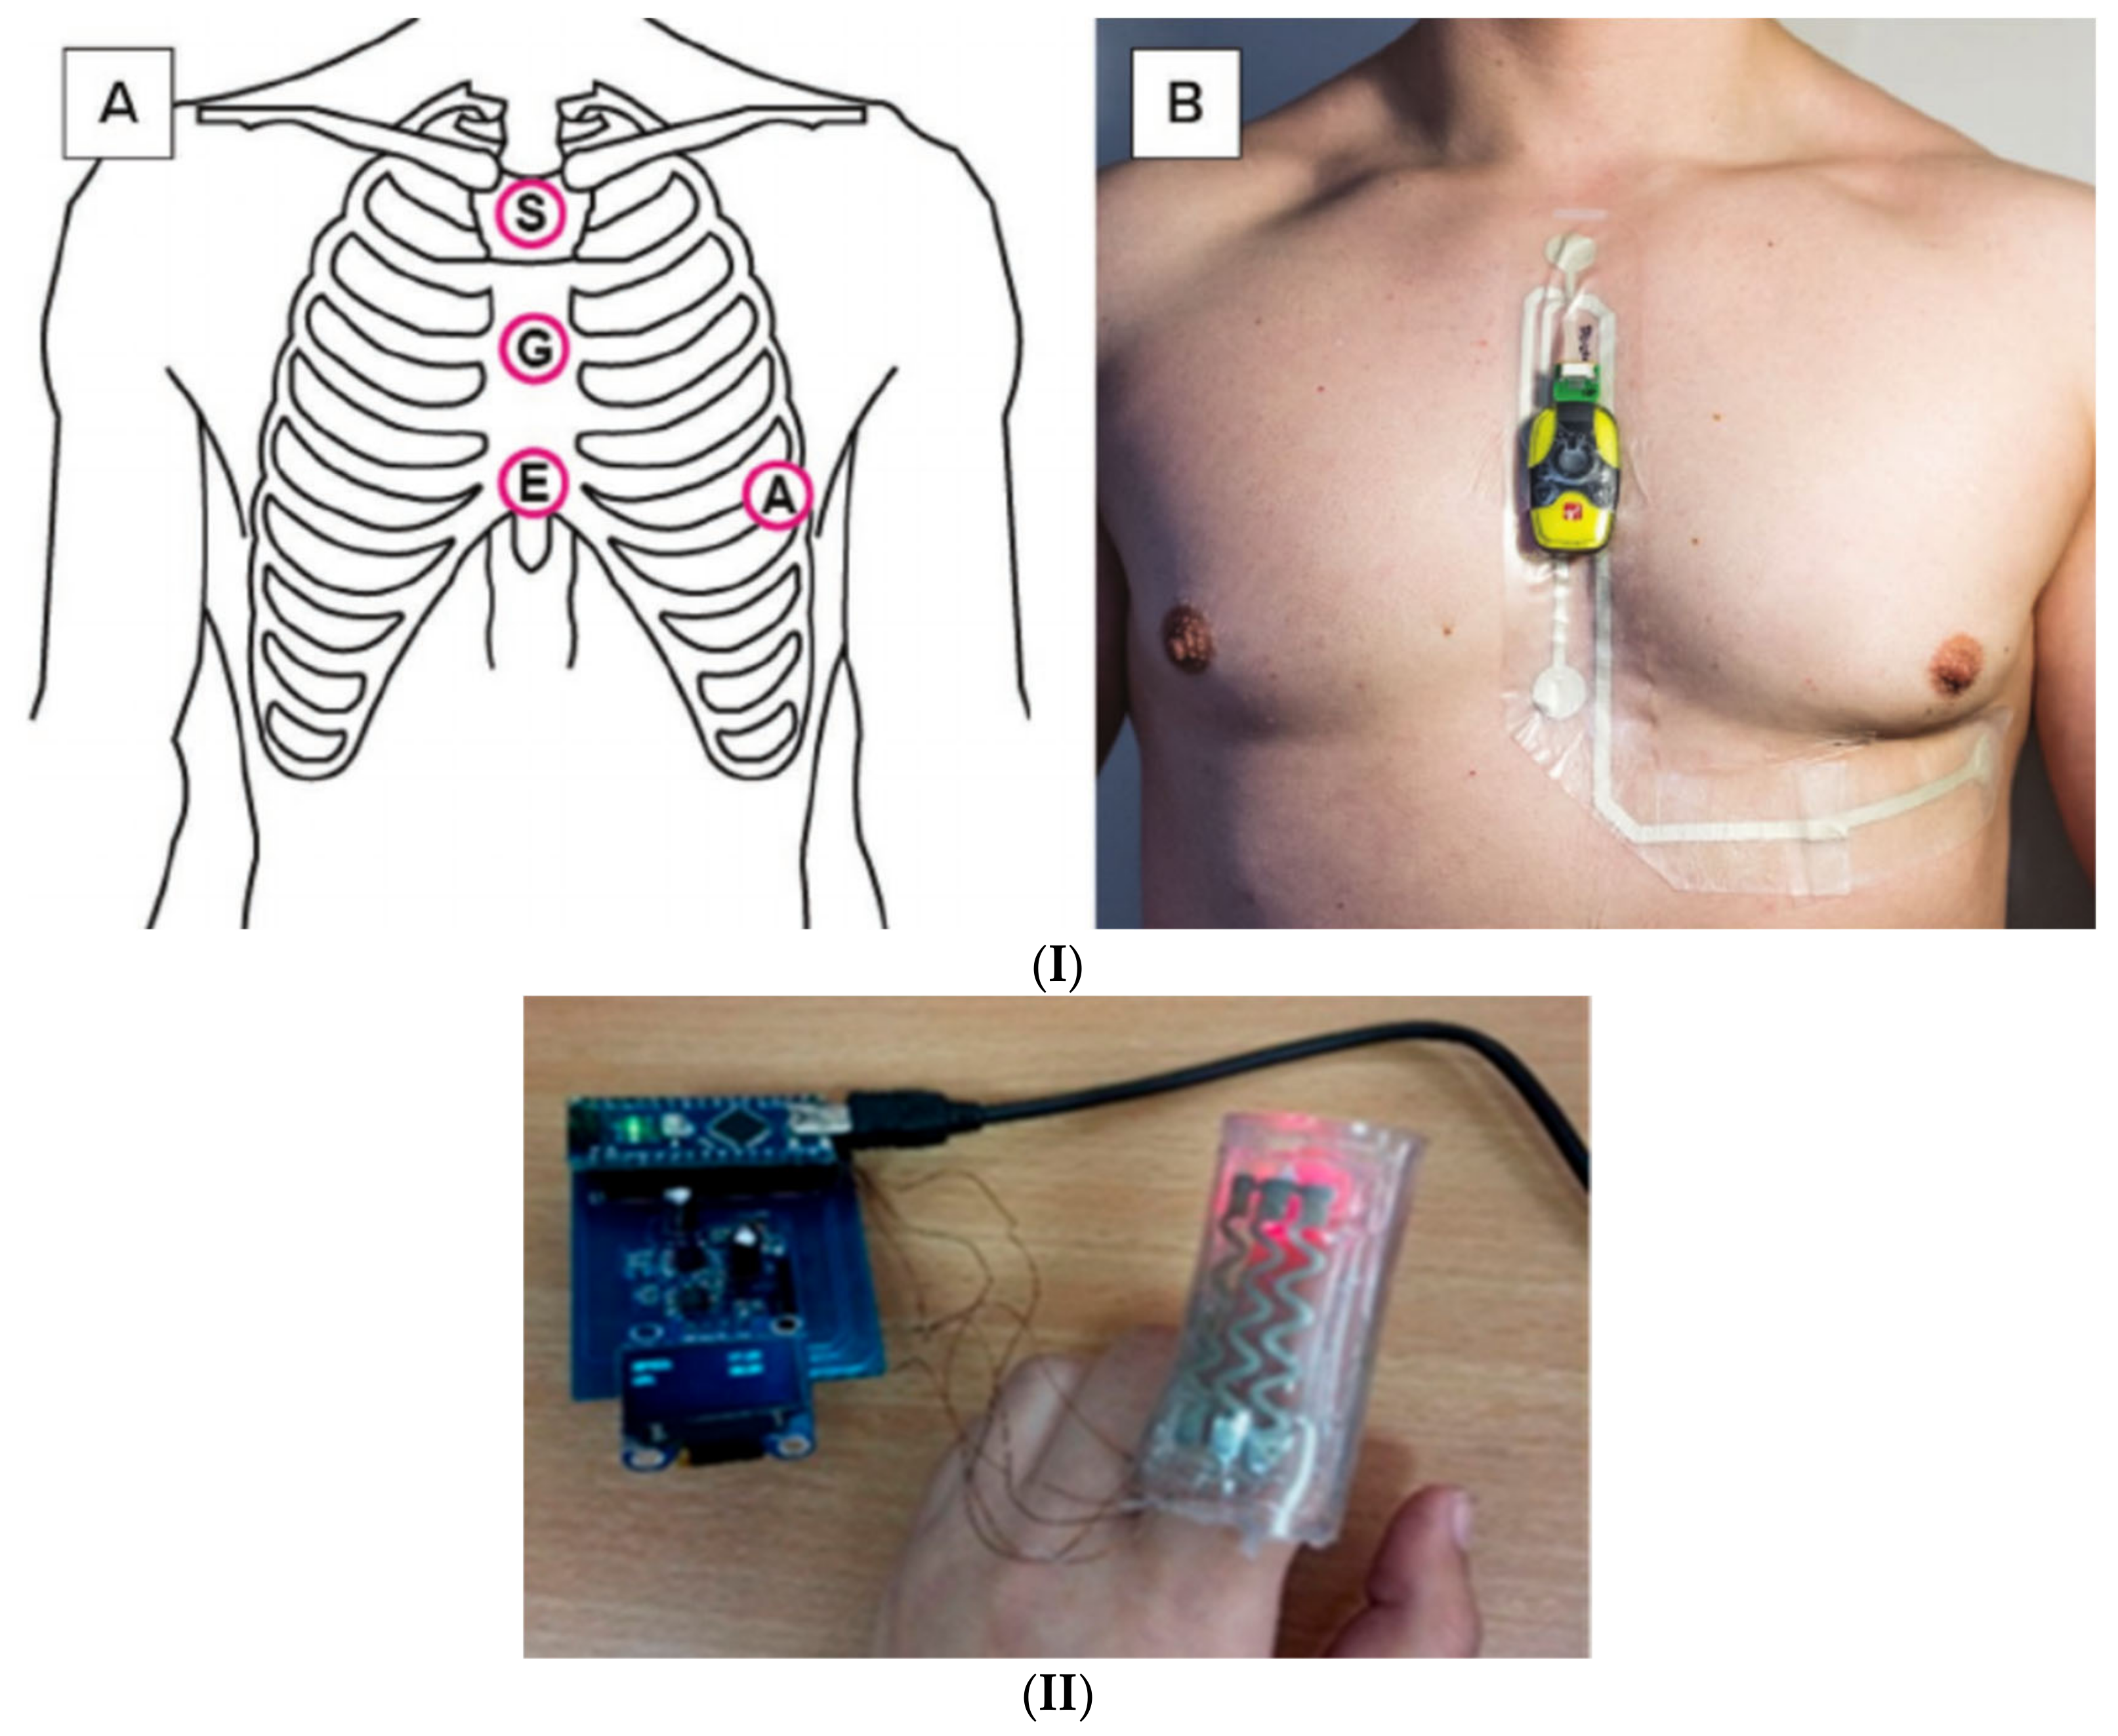
4.3. Heart Rate
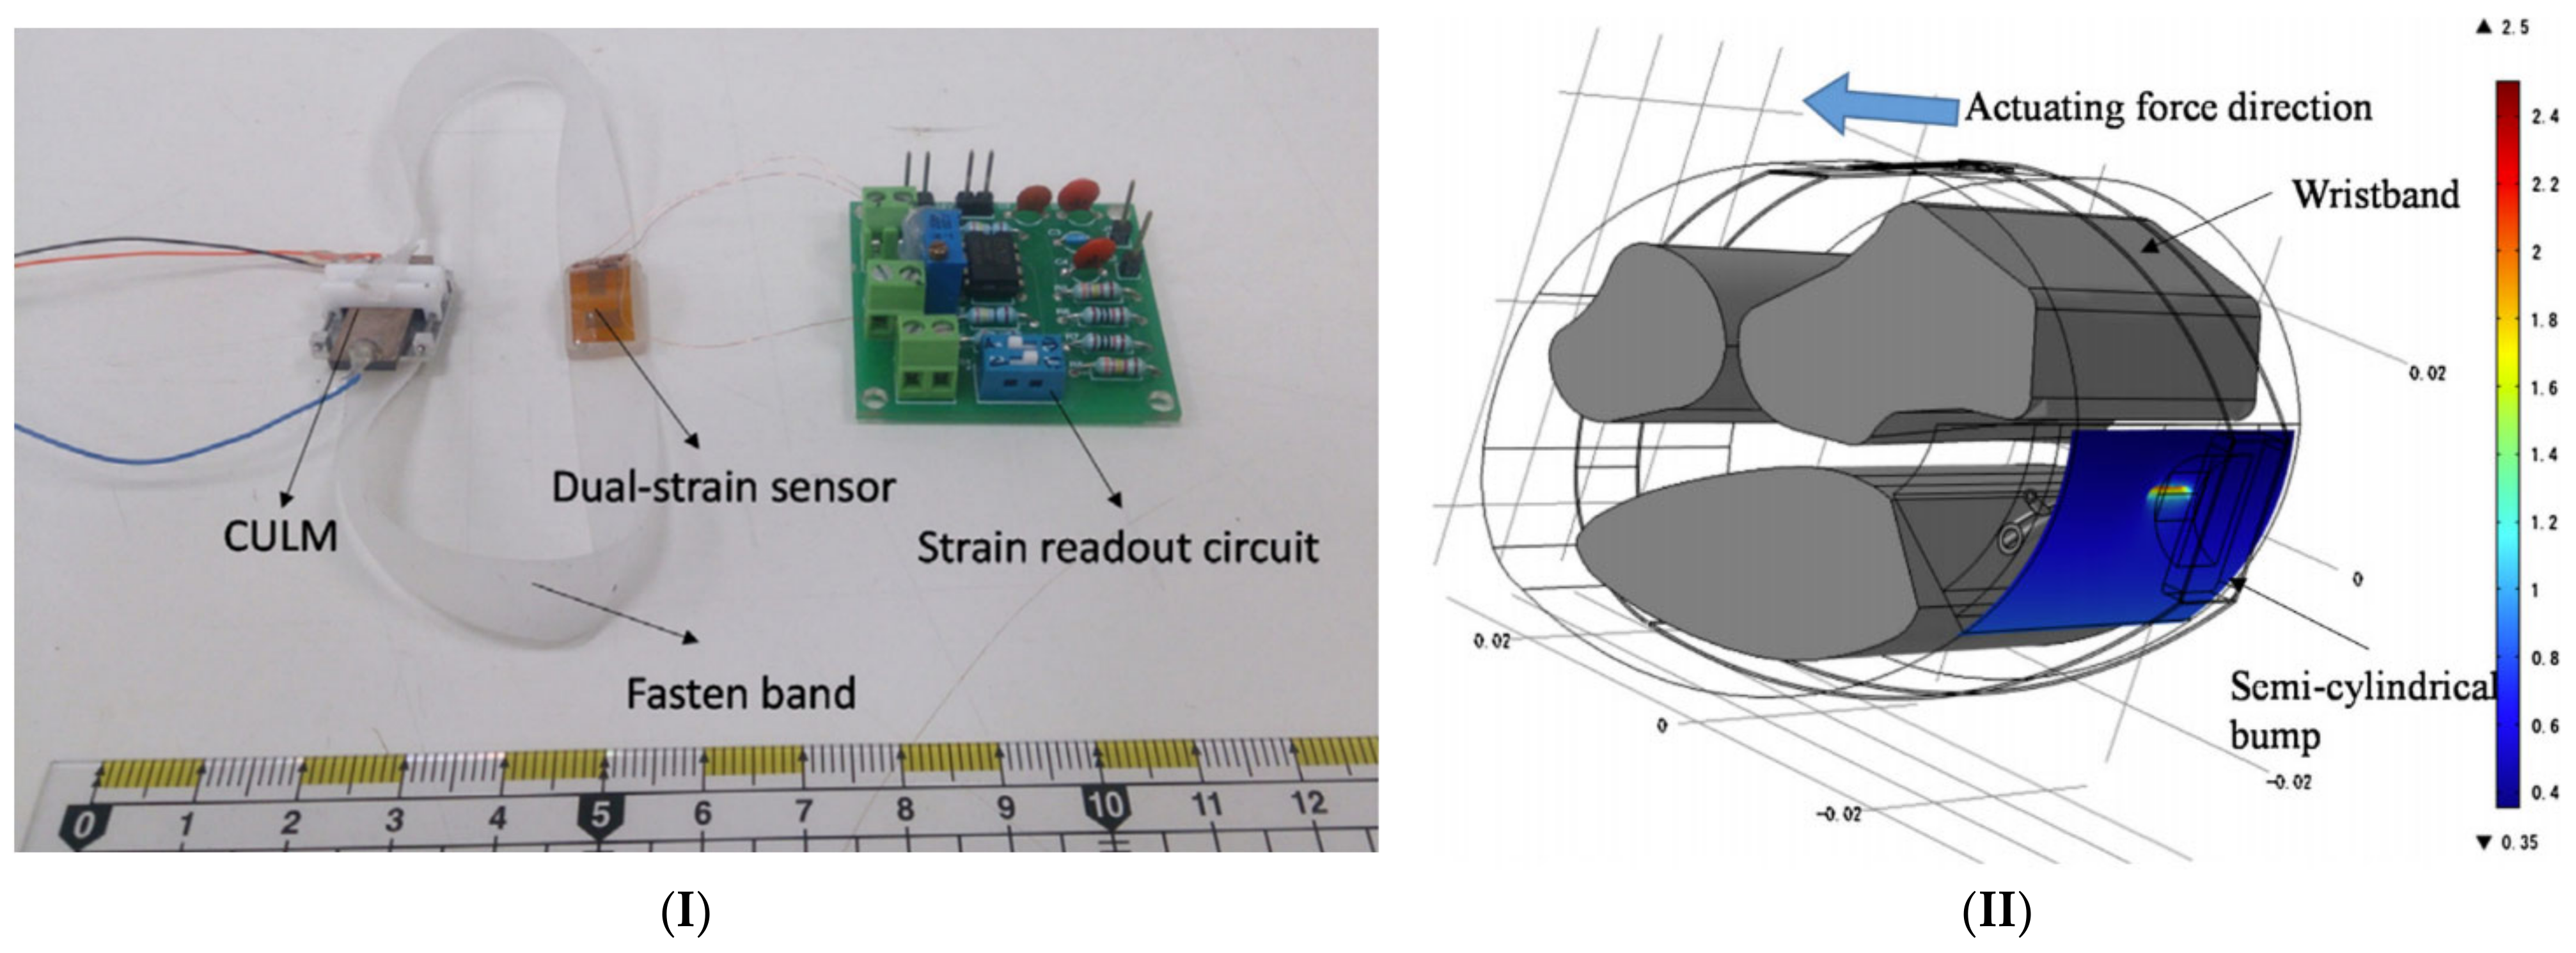
4.4. Blood Pressure
5. Conclusions
Supplementary Materials
Author Contributions
Funding
Institutional Review Board Statement
Informed Consent Statement
Data Availability Statement
Acknowledgments
Conflicts of Interest
References
- Hughes, J.M. Emerging infectious diseases: A CDC perspective. Emerg. Infect. Dis. 2001, 7, 494–496. [Google Scholar] [CrossRef] [PubMed]
- Murray, J.; Cohen, A.L. Infectious Disease Surveillance. In International Encyclopedia of Public Health; Elsevier Inc.: Amsterdam, The Netherlands, 2016; pp. 222–229. ISBN 9780128037089. [Google Scholar]
- Hospital Beds per 1,000 People, 1970 to 2011. Available online: https://ourworldindata.org/grapher/hospital-beds-per-1000-people?tab=chart&country=~OWID_WRL (accessed on 15 December 2020).
- Najafi, B.; Khan, T.; Wrobel, J. Laboratory in a box: Wearable sensors and its advantages for gait analysis. In Proceedings of the Annual International Conference of the IEEE Engineering in Medicine and Biology Society, EMBS, Boston, MA, USA, 30 August–3 September 2011; Volume 2011, pp. 6507–6510. [Google Scholar]
- Aminian, K.; Najafi, B. Capturing human motion using body-fixed sensors: Outdoor measurement and clinical applications. Comput. Animat. Virtual Worlds 2004, 15, 79–94. [Google Scholar] [CrossRef]
- Fayyaz Shahandashti, P.; Pourkheyrollah, H.; Jahanshahi, A.; Ghafoorifard, H. Highly conformable stretchable dry electrodes based on inexpensive flex substrate for long-term biopotential (EMG/ECG) monitoring. Sens. Actuators A Phys. 2019, 295, 678–686. [Google Scholar] [CrossRef]
- Pang, C.; Lee, G.Y.; Kim, T., II; Kim, S.M.; Kim, H.N.; Ahn, S.H.; Suh, K.Y. A flexible and highly sensitive strain-gauge sensor using reversible interlocking of nanofibres. Nat. Mater. 2012, 11, 795–801. [Google Scholar] [CrossRef]
- Chung, Y.T.; Yeh, C.Y.; Shu, Y.C.; Chuang, K.T.; Chen, C.C.; Kao, H.Y.; Ko, W.C.; Chen, P.L.; Ko, N.Y. Continuous temperature monitoring by a wearable device for early detection of febrile events in the SARS-CoV-2 outbreak in Taiwan, 2020. J. Microbiol. Immunol. Infect. 2020, 53, 503–504. [Google Scholar] [CrossRef] [PubMed]
- Khan, Y.; Ostfeld, A.E.; Lochner, C.M.; Pierre, A.; Arias, A.C. Monitoring of Vital Signs with Flexible and Wearable Medical Devices. Adv. Mater. 2016, 28, 4373–4395. [Google Scholar] [CrossRef]
- Hauer, K.; Dutzi, I.; Gordt, K.; Schwenk, M. Specific motor and cognitive performances predict falls during ward-based geriatric rehabilitation in patients with dementia. Sensors 2020, 20, 5385. [Google Scholar] [CrossRef]
- Dobkin, B.H. Wearable motion sensors to continuously measure real-world physical activities. Curr. Opin. Neurol. 2013, 26, 602–608. [Google Scholar] [CrossRef]
- Lazazzera, R.; Belhaj, Y.; Carrault, G. A newwearable device for blood pressure estimation using photoplethysmogram. Sensors 2019, 19, 2557. [Google Scholar] [CrossRef] [Green Version]
- Carek, A.M.; Conant, J.; Joshi, A.; Kang, H.; Inan, O.T. SeismoWatch. Proc. ACM Interact. Mob. Wearable Ubiquitous Technol. 2017, 1, 1–16. [Google Scholar] [CrossRef]
- Sharma, P.; Hui, X.; Zhou, J.; Conroy, T.B.; Kan, E.C. Wearable radio-frequency sensing of respiratory rate, respiratory volume, and heart rate. NPJ Digit. Med. 2020, 3, 98. [Google Scholar] [CrossRef]
- Aliverti, A. Wearable technology: Role in respiratory health and disease. Breathe 2017, 13, e27–e36. [Google Scholar] [CrossRef] [Green Version]
- Song, Y.; Min, J.; Yu, Y.; Wang, H.; Yang, Y.; Zhang, H.; Gao, W. Wireless battery-free wearable sweat sensor powered by human motion. Sci. Adv. 2020, 6, 9842. [Google Scholar] [CrossRef] [PubMed]
- Chung, M.; Fortunato, G.; Radacsi, N. Wearable flexible sweat sensors for healthcare monitoring: A review. J. R. Soc. Interface 2019, 16, 20190217. [Google Scholar] [CrossRef] [PubMed]
- Yan, T.; Wang, Z.; Wang, Y.Q.; Pan, Z.J. Carbon/graphene composite nanofiber yarns for highly sensitive strain sensors. Mater. Des. 2018, 143, 214–223. [Google Scholar] [CrossRef]
- Chen, J.; Zhu, Y.; Jiang, W. A stretchable and transparent strain sensor based on sandwich-like PDMS/CNTs/PDMS composite containing an ultrathin conductive CNT layer. Compos. Sci. Technol. 2020, 186, 107938. [Google Scholar] [CrossRef]
- Tao, L.Q.; Wang, D.Y.; Tian, H.; Ju, Z.Y.; Liu, Y.; Pang, Y.; Chen, Y.Q.; Yang, Y.; Ren, T.L. Self-adapted and tunable graphene strain sensors for detecting both subtle and large human motions. Nanoscale 2017, 9, 8266–8273. [Google Scholar] [CrossRef] [PubMed]
- Kaidarova, A.; Khan, M.A.; Marengo, M.; Swanepoel, L.; Przybysz, A.; Muller, C.; Fahlman, A.; Buttner, U.; Geraldi, N.R.; Wilson, R.P.; et al. Wearable multifunctional printed graphene sensors. NPJ Flex. Electron. 2019, 3, 1–10. [Google Scholar] [CrossRef] [Green Version]
- De, D.; Mukherjee, A. Femto-cloud based secure and economic distributed diagnosis and home health care system. J. Med. Imaging Health Inform. 2015, 5, 435–447. [Google Scholar] [CrossRef]
- Edoh, T. Risk Prevention of Spreading Emerging Infectious Diseases Using a HybridCrowdsensing Paradigm, Optical Sensors, and Smartphone. J. Med. Syst. 2018, 42. [Google Scholar] [CrossRef]
- Sareen, S.; Sood, S.K.; Gupta, S.K. IoT-based cloud framework to control Ebola virus outbreak. J. Ambient Intell. Humaniz. Comput. 2018, 9, 459–476. [Google Scholar] [CrossRef]
- Radin, J.M.; Wineinger, N.E.; Topol, E.J.; Steinhubl, S.R. Harnessing wearable device data to improve state-level real-time surveillance of influenza-like illness in the USA: A population-based study. Lancet Digit. Health 2020, 2, e85–e93. [Google Scholar] [CrossRef] [Green Version]
- Mohammadzadeh, N.; Gholamzadeh, M.; Saeedi, S.; Rezayi, S. The application of wearable smart sensors for monitoring the vital signs of patients in epidemics: A systematic literature review. J. Ambient Intell. Humaniz. Comput. 2020, 1, 1. [Google Scholar] [CrossRef]
- National Institutes of Health (US). Biological Sciences Curriculum Study. Understanding Emerging and Re-emerging Infectious Diseases. 2007. Available online: https://www.ncbi.nlm.nih.gov/books/NBK20370/ (accessed on 2 May 2021).
- Rawlins, M. Infectious diseases. J. Pharm. Pract. Res. 2012, 42, 157–159. [Google Scholar]
- National Research Council. Opportunities in Biology; Pifat-Mrzljak, G., Ed.; National Academies Press: Washington, DC, USA, 1989; ISBN 978-0-309-03927-7. [Google Scholar]
- Bloom, D.E.; Cadarette, D. Infectious disease threats in the twenty-first century: Strengthening the global response. Front. Immunol. 2019, 10, 549. [Google Scholar] [CrossRef] [Green Version]
- Morse, S.S. Factors in the Emergence of Infectious Diseases. In Plagues and Politics; Palgrave Macmillan UK: London, UK, 2001; pp. 8–26. [Google Scholar]
- Feldmann, H.; Czub, M.; Jones, S.; Dick, D.; Garbutt, M.; Grolla, A.; Artsob, H. Emerging and re-emerging infectious diseases. Med. Microbiol. Immunol. 2002, 191, 63–74. [Google Scholar] [CrossRef] [PubMed]
- Morens, D.M.; Folkers, G.K.; Fauci, A.S. The challenge of emerging and re-emerging infectious diseases. Nature 2004, 430, 242–249. [Google Scholar] [CrossRef]
- Massey, A. Epidemiology in Relation to Air Travel. H. K. Lewis & Co.: London, UK, 1933; Volume 104. [Google Scholar]
- Prioritizing Diseases for Research and Development in Emergency Contexts. Available online: https://www.who.int/activities/prioritizing-diseases-for-research-and-development-in-emergency-contexts (accessed on 19 May 2020).
- Lovato, A.; de Filippis, C. Clinical Presentation of COVID-19: A Systematic Review Focusing on Upper Airway Symptoms. Ear. Nose Throat J. 2020. [Google Scholar] [CrossRef] [PubMed] [Green Version]
- Hao, Q.; Wu, H.; Wang, Q. Difficulties in False Negative Diagnosis of Coronavirus Disease 2019: A Case Report. Infect. Dis. Prepr. 2020, 1–12. [Google Scholar] [CrossRef] [Green Version]
- Liu, J.; Liao, X.; Qian, S.; Yuan, J.; Wang, F.; Liu, Y.; Wang, Z.; Wang, F.S.; Liu, L.; Zhang, Z. Community Transmission of Severe Acute Respiratory Syndrome Coronavirus 2, Shenzhen, China, 2020. Emerg. Infect. Dis. 2020, 26. [Google Scholar] [CrossRef] [PubMed]
- Chan, J.F.W.; Yuan, S.; Kok, K.H.; To, K.K.W.; Chu, H.; Yang, J.; Xing, F.; Liu, J.; Yip, C.C.Y.; Poon, R.W.S.; et al. A familial cluster of pneumonia associated with the 2019 novel coronavirus indicating person-to-person transmission: A study of a family cluster. Lancet 2020, 395, 514–523. [Google Scholar] [CrossRef] [Green Version]
- Modes of Transmission of Virus Causing COVID-19: Implications for IPC Precaution Recommendations. Available online: https://www.who.int/news-room/commentaries/detail/modes-of-transmission-of-virus-causing-covid-19-implications-for-ipc-precaution-recommendations (accessed on 19 May 2020).
- Ong, S.W.X.; Tan, Y.K.; Chia, P.Y.; Lee, T.H.; Ng, O.T.; Wong, M.S.Y.; Marimuthu, K. Air, Surface Environmental, and Personal Protective Equipment Contamination by Severe Acute Respiratory Syndrome Coronavirus 2 (SARS-CoV-2) from a Symptomatic Patient. JAMA J. Am. Med. Assoc. 2020, 323, 1610–1612. [Google Scholar] [CrossRef] [PubMed] [Green Version]
- Li, Q.; Guan, X.; Wu, P.; Wang, X.; Zhou, L.; Tong, Y.; Ren, R.; Leung, K.S.M.; Lau, E.H.Y.; Wong, J.Y.; et al. Early Transmission Dynamics in Wuhan, China, of Novel Coronavirus–Infected Pneumonia. N. Engl. J. Med. 2020, 382, 1199–1207. [Google Scholar] [CrossRef]
- Fu, L.; Wang, B.; Yuan, T.; Chen, X.; Ao, Y.; Fitzpatrick, T.; Li, P.; Zhou, Y.; Lin, Y.F.; Duan, Q.; et al. Clinical characteristics of coronavirus disease 2019 (COVID-19) in China: A systematic review and meta-analysis. J. Infect. 2020. [Google Scholar] [CrossRef] [PubMed]
- Esakandari, H.; Nabi-Afjadi, M.; Fakkari-Afjadi, J.; Farahmandian, N.; Miresmaeili, S.M.; Bahreini, E. A comprehensive review of COVID-19 characteristics. Biol. Proced. Online 2020, 22, 1–10. [Google Scholar] [CrossRef]
- Rothan, H.A.; Byrareddy, S.N. The epidemiology and pathogenesis of coronavirus disease (COVID-19) outbreak. J. Autoimmun. 2020, 102433. [Google Scholar] [CrossRef]
- Ren, L.-L.; Wang, Y.-M.; Wu, Z.-Q.; Xiang, Z.-C.; Guo, L.; Xu, T.; Jiang, Y.-Z.; Xiong, Y.; Li, Y.-J.; Li, X.-W.; et al. Identification of a novel coronavirus causing severe pneumonia in human. Chin. Med. J. 2020, 1. [Google Scholar] [CrossRef]
- Jiang, F.; Deng, L.; Zhang, L.; Cai, Y.; Cheung, C.W.; Xia, Z. Review of the Clinical Characteristics of Coronavirus Disease 2019 (COVID-19). J. Gen. Intern. Med. 2020, 2019. [Google Scholar] [CrossRef] [Green Version]
- Lovato, A.; de Filippis, C.; Marioni, G. Upper airway symptoms in coronavirus disease 2019 (COVID-19). Am. J. Otolaryngol. Head Neck Med. Surg. 2020, 41, 102474. [Google Scholar] [CrossRef] [PubMed]
- Tahamtan, A.; Ardebili, A. Real-time RT-PCR in COVID-19 detection: Issues affecting the results. Expert Rev. Mol. Diagn. 2020, 20, 453–454. [Google Scholar] [CrossRef] [Green Version]
- Guo, Y.-R.; Cao, Q.-D.; Hong, Z.-S.; Tan, Y.-Y.; Chen, S.-D.; Jin, H.-J.; Tan, K.-S.; Wang, D.-Y.; Yan, Y. The origin, transmission and clinical therapies on coronavirus disease 2019 (COVID-19) outbreak—An update on the status. Mil. Med. Res. 2020, 7, 1–10. [Google Scholar] [CrossRef] [Green Version]
- Liu, W.; Liu, L.; Kou, G.; Zheng, Y.; Ding, Y.; Ni, W.; Wang, Q.; Tan, L.; Wu, W.; Tang, S.; et al. Evaluation of Nucleocapsid and Spike Protein-based ELISAs for detecting antibodies against SARS-CoV-2. J. Clin. Microbiol. 2020. [Google Scholar] [CrossRef] [PubMed] [Green Version]
- Yang, Y.; Yang, M.; Shen, C.; Wang, F.; Yuan, J.; Li, J.; Zhang, M.; Wang, Z.; Xing, L.; Wei, J.; et al. Evaluating the accuracy of different respiratory specimens in the laboratory diagnosis and monitoring the viral shedding of 2019-nCoV infections. medRxiv 2020. [Google Scholar] [CrossRef] [Green Version]
- Rothe, C.; Schunk, M.; Sothmann, P.; Bretzel, G.; Froeschl, G.; Wallrauch, C.; Zimmer, T.; Thiel, V.; Janke, C.; Guggemos, W.; et al. Transmission of 2019-NCOV infection from an asymptomatic contact in Germany. N. Engl. J. Med. 2020, 382, 970–971. [Google Scholar] [CrossRef] [PubMed] [Green Version]
- Advice on the Use of Point-of-Care Immunodiagnostic Tests for COVID-19. Available online: https://www.who.int/news-room/commentaries/detail/advice-on-the-use-of-point-of-care-immunodiagnostic-tests-for-covid-19 (accessed on 20 May 2020).
- Meo, S.A.; Bukhari, I.A.; Akram, J.; Meo, A.S.; Klonoff, D.C. COVID-19 vaccines: Comparison of biological, pharmacological characteristics and adverse effects of pfizer/BioNTech and moderna vaccines. Eur. Rev. Med. Pharmacol. Sci. 2021, 25, 1663–1679. [Google Scholar] [CrossRef]
- Sohrabi, C.; Alsafi, Z.; O’Neill, N.; Khan, M.; Kerwan, A.; Al-Jabir, A.; Iosifidis, C.; Agha, R. World Health Organization declares global emergency: A review of the 2019 novel coronavirus (COVID-19). Int. J. Surg. 2020, 76, 71–76. [Google Scholar] [CrossRef]
- Wang, D.; Hu, B.; Hu, C.; Zhu, F.; Liu, X.; Zhang, J.; Wang, B.; Xiang, H.; Cheng, Z.; Xiong, Y.; et al. Clinical Characteristics of 138 Hospitalized Patients with 2019 Novel Coronavirus-Infected Pneumonia in Wuhan, China. JAMA J. Am. Med. Assoc. 2020, 323, 1061–1069. [Google Scholar] [CrossRef] [PubMed]
- Musa, A.; Mohd Zim, M.; Fadzil, M.; Mohd Razali, N.; Wong, J.L.; Md Kassim, R.M.N.; Ismail, T.; Abdul Rani, M.F.; Ismail, A. Resting Heart Rate Following Acute Exacerbation of COPD Predicts Future Exacerbation. Chest 2016, 149, A346. [Google Scholar] [CrossRef]
- World Health Organization. Clinical Management of Severe Acute Respiratory Infection When Novel Coronavirus (nCoV) Infection Is Suspected; WHO: Geneva, Switzerland, 2020; Volume 2019, p. 12. [Google Scholar]
- Huang, C.; Wang, Y.; Li, X.; Ren, L.; Zhao, J.; Hu, Y.; Zhang, L.; Fan, G.; Xu, J.; Gu, X.; et al. Clinical features of patients infected with 2019 novel coronavirus in Wuhan, China. Lancet 2020, 395, 497–506. [Google Scholar] [CrossRef] [Green Version]
- Magill, A.J.; Strickland, G.T.; Maguire, J.H.; Ryan, E.T.; Solomon, T. Hunter’s Tropical Medicine and Emerging Infectious Disease; Elsevier Health Sciences: Amsterdam, The Netherlands, 2012; ISBN 9781455740437. [Google Scholar]
- Crimean-Congo Haemorrhagic Fever. Available online: https://www.who.int/en/news-room/fact-sheets/detail/crimean-congo-haemorrhagic-fever (accessed on 21 May 2020).
- Hawman, D.W.; Feldmann, H. Recent advances in understanding crimean-congo hemorrhagic fever virus [version 1; peer review: 4 approved]. F1000Research 2018, 7. [Google Scholar] [CrossRef] [Green Version]
- Fillâtre, P.; Revest, M.; Tattevin, P. Crimean-Congo hemorrhagic fever: An update. Med. Mal. Infect. 2019, 49, 574–585. [Google Scholar] [CrossRef] [PubMed]
- Transmission | Crimean-Congo Hemorrhagic Fever (CCHF) | CDC. Available online: https://www.cdc.gov/vhf/crimean-congo/transmission/index.html (accessed on 21 May 2020).
- Kaya, A.; Engin, A.; Güven, A.S.; Içaĝasioĝlu, F.D.; Cevit, Ö.; Elaldi, N.; Gültürk, A. Crimean-Congo hemorrhagic fever disease due to tick bite with very long incubation periods. Int. J. Infect. Dis. 2011, 15. [Google Scholar] [CrossRef] [PubMed] [Green Version]
- Bente, D.A.; Forrester, N.L.; Watts, D.M.; McAuley, A.J.; Whitehouse, C.A.; Bray, M. Crimean-Congo hemorrhagic fever: History, epidemiology, pathogenesis, clinical syndrome and genetic diversity. Antivir. Res. 2013, 100, 159–189. [Google Scholar] [CrossRef] [Green Version]
- Yun, N.E.; Walker, D.H. Pathogenesis of lassa fever. Viruses 2012, 4, 2031–2048. [Google Scholar] [CrossRef]
- Keshtkar-Jahromi, M.; Kuhn, J.H.; Christova, I.; Bradfute, S.B.; Jahrling, P.B.; Bavari, S. Crimean-Congo hemorrhagic fever: Current and future prospects of vaccines and therapies. Antivir. Res. 2011, 90, 85–92. [Google Scholar] [CrossRef] [Green Version]
- Papa, A.; Mirazimi, A.; Köksal, I.; Estrada-Pena, A.; Feldmann, H. Recent advances in research on Crimean-Congo hemorrhagic fever. J. Clin. Virol. 2015, 64, 137–143. [Google Scholar] [CrossRef] [PubMed] [Green Version]
- Çevik, M.A.; Erbay, A.; Bodur, H.; Gülderen, E.; Baştuǧ, A.; Kubar, A.; Akinci, E. Clinical and laboratory features of Crimean-Congo hemorrhagic fever: Predictors of fatality. Int. J. Infect. Dis. 2008, 12, 374–379. [Google Scholar] [CrossRef] [Green Version]
- Whitehouse, C.A. Crimean-Congo hemorrhagic fever. Antivir. Res. 2004, 64, 145–160. [Google Scholar] [CrossRef]
- Ndjoyi-Mbiguino, A.; Zoa-Assoumou, S.; Mourembou, G.; Ennaji, M.M. Ebola and Marburg Virus: A Brief Review; Elsevier Inc.: Amsterdam, The Netherlands, 2020; ISBN 9780128194003. [Google Scholar]
- Brainard, J.; Hooper, L.; Pond, K.; Edmunds, K.; Hunter, P.R. Risk factors for transmission of Ebola or Marburg virus disease: A systematic review and meta-analysis. Int. J. Epidemiol. 2016, 45, 102–116. [Google Scholar] [CrossRef] [Green Version]
- Factsheet about Ebola and Marburg Virus Diseases. Available online: https://www.ecdc.europa.eu/en/ebola-and-marburg-fevers/facts/factsheet (accessed on 26 May 2020).
- Ebola Virus Disease. Available online: https://www.who.int/news-room/fact-sheets/detail/ebola-virus-disease (accessed on 21 May 2020).
- WHO. What We Know about Transmission of the Ebola Virus among Humans; WHO: Geneva, Switzerland, 2015. [Google Scholar]
- Marburg Virus Disease. Available online: https://www.who.int/news-room/fact-sheets/detail/marburg-virus-disease (accessed on 26 May 2020).
- Nishiura, H.; Chowell, G. Transmision dynamics and control of Ebola virus disease: A review. BMC Med. 2014, 12, 196. [Google Scholar]
- Brauburger, K.; Hume, A.J.; Mühlberger, E.; Olejnik, J. Forty-five years of marburg virus research. Viruses 2012, 4, 1878–1927. [Google Scholar] [CrossRef] [PubMed] [Green Version]
- Oliver, G.F.; Carr, J.M.; Smith, J.R. Emerging infectious uveitis: Chikungunya, dengue, Zika and Ebola: A review. Clin. Exp. Ophthalmol. 2019, 47, 372–380. [Google Scholar] [CrossRef] [Green Version]
- Henao-Restrepo, A.M.; Camacho, A.; Longini, I.M.; Watson, C.H.; Edmunds, W.J.; Egger, M.; Carroll, M.W.; Dean, N.E.; Diatta, I.; Doumbia, M.; et al. Efficacy and effectiveness of an rVSV-vectored vaccine in preventing Ebola virus disease: Final results from the Guinea ring vaccination, open-label, cluster-randomised trial (Ebola Ça Suffit!). Lancet 2017, 389, 505–518. [Google Scholar] [CrossRef] [Green Version]
- Rojas, M.; Monsalve, D.M.; Pacheco, Y.; Acosta-Ampudia, Y.; Ramírez-Santana, C.; Ansari, A.A.; Gershwin, M.E.; Anaya, J.M. Ebola virus disease: An emerging and re-emerging viral threat. J. Autoimmun. 2020, 106, 102375. [Google Scholar] [CrossRef]
- WHO. Optimized Supportive Care for Ebola Virus Disease Clinical Management Standard Operating Procedures; WHO: Geneva, Switzerland, 2019; ISBN 9789241515894. [Google Scholar]
- Schieffelin, J.S.; Shaffer, J.G.; Goba, A.; Gbakie, M.; Gire, S.K.; Colubri, A.; Sealfon, R.S.G.; Kanneh, L.; Moigboi, A.; Momoh, M.; et al. Clinical illness and outcomes in patients with Ebola in Sierra Leone. N. Engl. J. Med. 2014, 371, 2092–2100. [Google Scholar] [CrossRef] [PubMed]
- McCormick, J.B.; Fisher-Hoch, S.P. Lassa fever. Curr. Top. Microbiol. Immunol. 2002, 262, 75–109. [Google Scholar] [PubMed]
- Asogun, D.A.; Günther, S.; Akpede, G.O.; Ihekweazu, C.; Zumla, A. Lassa Fever: Epidemiology, Clinical Features, Diagnosis, Management and Prevention. Infect. Dis. Clin. North Am. 2019, 33, 933–951. [Google Scholar] [CrossRef]
- Richmond, J.K.; Baglole, D.J. Lassa fever: Epidemiology, clinical features, and social consequences. Br. Med. J. 2003, 327, 1271–1275. [Google Scholar] [CrossRef]
- Happi, A.N.; Happi, C.T.; Schoepp, R.J. Lassa fever diagnostics: Past, present, and future. Curr. Opin. Virol. 2019, 37, 132–138. [Google Scholar] [CrossRef] [PubMed]
- Ogoina, D. Lassa Fever: A Clinical and Epidemiological Review. Niger Delta J. Med. Med. Res. 2013, 1, 1–10. [Google Scholar]
- Schmitz, H.; Köhler, B.; Laue, T.; Drosten, C.; Veldkamp, P.J.; Günther, S.; Emmerich, P.; Geisen, H.P.; Fleischer, K.; Beersma, M.F.C.; et al. Monitoring of clinical and laboratory data in two cases of imported Lassa fever. Microbes Infect. 2002, 4, 43–50. [Google Scholar] [CrossRef]
- Ajayi, N.A.; Ukwaja, K.N.; Ifebunandu, N.A.; Nnabu, R.; Onwe, F.I.; Asogun, D.A. Lassa fever—Full recovery without Ribavarin treatment: A case report. Afr. Health Sci. 2014, 14, 1074–1077. [Google Scholar] [CrossRef] [Green Version]
- De Wit, E.; Van Doremalen, N.; Falzarano, D.; Munster, V.J. SARS and MERS: Recent insights into emerging coronaviruses. Nat. Rev. Microbiol. 2016, 14, 523–534. [Google Scholar] [CrossRef]
- Zumla, A.; Hui, D.S.; Perlman, S. Middle East respiratory syndrome. Lancet 2015, 386, 995–1007. [Google Scholar] [CrossRef] [Green Version]
- Banerjee, A.; Baid, K.; Mossman, K. Molecular Pathogenesis of Middle East Respiratory Syndrome (MERS) Coronavirus. Curr. Clin. Microbiol. Rep. 2019, 6, 139–147. [Google Scholar] [CrossRef] [Green Version]
- Yin, Y.; Wunderink, R.G. MERS, SARS and other coronaviruses as causes of pneumonia. Respirology 2018, 23, 130–137. [Google Scholar] [CrossRef] [Green Version]
- Middle East Respiratory Syndrome Coronavirus (MERS-CoV). Available online: https://www.who.int/news-room/fact-sheets/detail/middle-east-respiratory-syndrome-coronavirus-(mers-cov) (accessed on 27 May 2020).
- Perlman, S.; Netland, J. Coronaviruses post-SARS: Update on replication and pathogenesis. Nat. Rev. Microbiol. 2009, 7, 439–450. [Google Scholar] [CrossRef] [Green Version]
- Mackay, I.M.; Arden, K.E. Middle East respiratory syndrome: An emerging coronavirus infection tracked by the crowd. Virus Res. 2015, 202, 60–88. [Google Scholar] [CrossRef]
- Otter, J.A.; Donskey, C.; Yezli, S.; Douthwaite, S.; Goldenberg, S.D.; Weber, D.J. Transmission of SARS and MERS coronaviruses and influenza virus in healthcare settings: The possible role of dry surface contamination. J. Hosp. Infect. 2016, 92, 235–250. [Google Scholar] [CrossRef] [PubMed] [Green Version]
- Cheng, V.C.C.; Chan, J.F.W.; To, K.K.W.; Yuen, K.Y. Clinical management and infection control of SARS: Lessons learned. Antivir. Res. 2013, 100, 407–419. [Google Scholar] [CrossRef] [Green Version]
- Li, A.M.; Ng, P.C. Severe acute respiratory syndrome (SARS) in neonates and children. Arch. Dis. Child. Fetal Neonatal Ed. 2005, 90, 461–466. [Google Scholar] [CrossRef] [PubMed] [Green Version]
- Ng, P.C.; Leung, C.; Chiu, W.K.; Wong, S.F.; Hon, E.K.L. SARS in newborns and children. Biol. Neonate 2004, 85, 293–298. [Google Scholar] [CrossRef] [PubMed]
- Banik, G.R.; Khandaker, G.; Rashid, H. Middle East Respiratory Syndrome Coronavirus “MERS-CoV”: Current Knowledge Gaps. Paediatr. Respir. Rev. 2015, 16, 197–202. [Google Scholar] [CrossRef]
- Jiang, X.; Rayner, S.; Luo, M.H. Does SARS-CoV-2 has a longer incubation period than SARS and MERS? J. Med. Virol. 2020, 92, 476–478. [Google Scholar] [CrossRef]
- Baharoon, S.; Memish, Z.A. MERS-CoV as an emerging respiratory illness: A review of prevention methods. Travel Med. Infect. Dis. 2019, 32, 101520. [Google Scholar] [CrossRef]
- Shehata, M.M.; Gomaa, M.R.; Ali, M.A.; Kayali, G. Middle East respiratory syndrome coronavirus: A comprehensive review. Front. Med. 2016, 10, 120–136. [Google Scholar] [CrossRef] [Green Version]
- Alfaraj, S.H.; Al-Tawfiq, J.A.; Altuwaijri, T.A.; Memish, Z.A. Middle East respiratory syndrome coronavirus in pediatrics: A report of seven cases from Saudi Arabia. Front. Med. 2019, 13, 126–130. [Google Scholar] [CrossRef] [Green Version]
- Geng, H.Y.; Tan, W.J. A novel human coronavirus: Middle East respiratory syndrome human coronavirus. Sci. China Life Sci. 2013, 56, 683–687. [Google Scholar] [CrossRef] [Green Version]
- World Health Organization. Clinical Management of Severe Acute Respiratory Infection When Middle East respiratory Syndrome Coronavirus (MERS-CoV) Infection Is Suspected. Interim Guidance Updated January 2019 WHO/MERS/Clinical/15.1 Revision 1; WHO: Geneva, Switzerland, 2019; pp. 1–12. [Google Scholar]
- Guarner, J. Three Emerging Coronaviruses in Two Decades: The Story of SARS, MERS, and Now COVID-19. Am. J. Clin. Pathol. 2020, 153, 420–421. [Google Scholar] [CrossRef]
- WHO. Middle East Respiratory Syndrome Coronavirus (MERS-CoV); WHO: Geneva, Switzerland, 2020. [Google Scholar]
- Chan-Yeung, M.; Xu, R.H. SARS: Epidemiology. Respirology 2003, 8, S9–S14. [Google Scholar] [CrossRef] [PubMed]
- SARS (Severe Acute Respiratory Syndrome)—NHS. Available online: https://www.nhs.uk/conditions/sars/ (accessed on 27 May 2020).
- Schneider, E. Severe Acute Respiratory Syndrome (SARS). Netter’s Infect. Dis. 2012, 537–543. [Google Scholar] [CrossRef] [Green Version]
- Al-Tawfiq, J.A.; Hinedi, K. The calm before the storm: Clinical observations of Middle East respiratory syndrome (MERS) patients. J. Chemother. 2018, 30, 179–182. [Google Scholar] [CrossRef]
- Leung, G.M.; Hedley, A.J.; Kong, J.; Lam, T.H.; Lau, F.L.; Rainer, T.; Wong, T.W.; Tong, Y.H. A clinical prediction rule for diagnosing severe acute respiratory syndrome in the emergency department. Hong Kong Med. J. 2008, 14, 8–10. [Google Scholar] [CrossRef] [Green Version]
- Boshra, H.; Lorenzo, G.; Busquets, N.; Brun, A. Rift Valley Fever: Recent Insights into Pathogenesis and Prevention. J. Virol. 2011, 85, 6098–6105. [Google Scholar] [CrossRef] [Green Version]
- Bishop, D.H.; Calisher, C.H.; Casals, J.; Chumakov, M.P.; Gaidamovich, S.Y.; Hannoun, C.; Lvov, D.K.; Marshall, I.D.; Oker-Blom, N.; Pettersson, R.F.; et al. Bunyaviridae. Intervirology 1980, 14, 125–143. [Google Scholar] [CrossRef] [PubMed]
- Zuckerman, A.J.; Simpson, D.I.H. Rift Valley fever. Nature 1978, 271, 308. [Google Scholar] [CrossRef]
- Vloet, R.P.M.; Vogels, C.B.F.; Koenraadt, C.J.M.; Pijlman, G.P.; Eiden, M.; Gonzales, J.L.; van Keulen, L.J.M.; Wichgers Schreur, P.J.; Kortekaas, J. Transmission of Rift Valley fever virus from European-breed lambs to Culex pipiens mosquitoes. PLoS Negl. Trop. Dis. 2017, 11, e0006145. [Google Scholar] [CrossRef] [Green Version]
- Pepin, M.; Bouloy, M.; Bird, B.H.; Kemp, A.; Paweska, J. Rift Valley fever virus (Bunyaviridae: Phlebovirus): An update on pathogenesis, molecular epidemiology, vectors, diagnostics and prevention. Vet. Res. 2010, 41. [Google Scholar] [CrossRef] [Green Version]
- Ikegami, T.; Makino, S. The pathogenesis of rift valley fever. Viruses 2011, 3, 493–519. [Google Scholar] [CrossRef] [Green Version]
- Rift Valley Fever | CDC. Available online: https://www.cdc.gov/vhf/rvf/index.html (accessed on 1 June 2020).
- Al-Hazmi, M.; Ayoola, E.A.; Abdurahman, M.; Banzal, S.; Ashraf, J.; El-Bushra, A.; Hazmi, A.; Abdullah, M.; Abbo, H.; Elamin, A.; et al. Epidemic Rift Valley Fever in Saudi Arabia: A Clinical Study of Severe Illness in Humans. Clin. Infect. Dis. 2003, 36, 245–252. [Google Scholar] [CrossRef] [Green Version]
- Zaki, A.; Coudrier, D.; Yousef, A.I.; Fakeeh, M.; Bouloy, M.; Billecocq, A. Production of monoclonal antibodies against Rift Valley fever virus: Application for rapid diagnosis tests (virus detection and ELISA) in human sera. J. Virol. Methods 2006, 131, 34–40. [Google Scholar] [CrossRef] [PubMed]
- El Imam, M.; El Sabiq, M.; Omran, M.; Abdalkareem, A.; El Gaili Mohamed, M.A.; Elbashir, A.; Khalafala, O. Acute renal failure associated with the Rift Valley fever: A single center study. Saudi J. Kidney Dis. Transpl. 2009, 20, 1047–1052. [Google Scholar]
- Bird, B.H.; Ksiazek, T.G.; Nichol, S.T.; MacLachlan, N.J. Rift Valley fever virus. J. Am. Vet. Med. Assoc. 2009, 234, 883–893. [Google Scholar] [CrossRef] [Green Version]
- Kahlon, S.S.; Peter, C.J.; LeDuc, J.; Muchiri, E.M.; Muiruri, S.; Njenga, M.K.; Breiman, R.F.; White, A.C.; King, C.H. Case report: Severe rift valley fever may present with a characteristic clinical syndrome. Am. J. Trop. Med. Hyg. 2010, 82, 371–375. [Google Scholar] [CrossRef] [Green Version]
- Narang, R. Nipah virus: Biology, disease, treatment, control, and prevention. J. Mahatma Gandhi Inst. Med. Sci. 2018, 23, 65. [Google Scholar] [CrossRef]
- Nipah Virus. Available online: https://www.who.int/news-room/fact-sheets/detail/nipah-virus (accessed on 30 May 2020).
- Ganguly, S.; Choudhary, S.; Kumar, V.; Pagrut, N.; Faran, N. Nipah virus: An Update on Prevention and Control Strategies with Special Reference to the Latest Outbreak in India. Int. J. Vet. Sci. Anim. Husb. 2018, 3, 20–21. [Google Scholar]
- Escaffre, O.; Borisevich, V.; Rockx, B. Pathogenesis of Hendra and Nipah virus infection in humans. J. Infect. Dev. Ctries. 2013, 7, 308–311. [Google Scholar] [CrossRef] [PubMed]
- Chua, K.B.; Lam, S.K.; Goh, K.J.; Hooi, P.S.; Ksiazek, T.G.; Kamarulzaman, A.; Olson, J.; Tan, C.T. The presence of nipah virus in respiratory secretions and urine of patients during an outbreak of nipah virus encephalitis in Malaysia. J. Infect. 2001, 42, 40–43. [Google Scholar] [CrossRef] [PubMed]
- Hossain, M.J.; Gurley, E.S.; Montgomery, J.M.; Bell, M.; Carroll, D.S.; Hsu, V.P.; Formenty, P.; Croisier, A.; Bertherat, E.; Faiz, M.A.; et al. Clinical Presentation of Nipah Virus Infection in Bangladesh. Clin. Infect. Dis. 2008, 46, 977–984. [Google Scholar] [CrossRef] [PubMed]
- Singh, R.K.; Dhama, K.; Chakraborty, S.; Tiwari, R.; Natesan, S.; Khandia, R.; Munjal, A.; Vora, K.S.; Latheef, S.K.; Karthik, K.; et al. Nipah virus: Epidemiology, pathology, immunobiology and advances in diagnosis, vaccine designing and control strategies–a comprehensive review. Vet. Q. 2019, 39, 26–55. [Google Scholar] [CrossRef] [PubMed] [Green Version]
- Goh, K.J.; Tan, C.T.; Chew, N.K.; Tan, P.S.K.; Kamarulzaman, A.; Sarji, S.A.; Wong, K.T.; Abdullah, B.J.J.; Chua, K.B.; Lam, S.K. Clinical features of Nipah virus encephalitis among pig farmers in Malaysia. N. Engl. J. Med. 2000, 342, 1229–1235. [Google Scholar] [CrossRef] [Green Version]
- Mazzola, L.T.; Kelly-Cirino, C. Diagnostics for Nipah virus: A zoonotic pathogen endemic to Southeast Asia. BMJ Glob. Heal. 2019, 4, e001118. [Google Scholar] [CrossRef] [PubMed]
- Ashwlayan, V.D. Nipah virus: An update. MOJ Drug Des. Dev. Ther. 2018, 2, 211–214. [Google Scholar] [CrossRef]
- Broder, C.C.; Xu, K.; Nikolov, D.B.; Zhu, Z.; Dimitrov, D.S.; Middleton, D.; Pallister, J.; Geisbert, T.W.; Bossart, K.N.; Wang, L.F. A treatment for and vaccine against the deadly Hendra and Nipah viruses. Antivir. Res. 2013, 100, 8–13. [Google Scholar] [CrossRef] [PubMed] [Green Version]
- Mahmudur, R.; Mushtuq, H.M. National Guideline for Management, Prevention and Control of Nipah Virus Infection including Encephalitis, 1st ed.; Ministry of Health & Family Welfare: Dhaka, Bangladesh, 2011.
- Cascella, M.; Rajnik, M.; Cuomo, A.; Dulebohn, S.C.; Di Napoli, R. Features, Evaluation and Treatment Coronavirus (COVID-19). StatPearls Publishing: Treasure Island, FL, USA, 2020. [Google Scholar]
- WHO. Director-General’s Opening Remarks at the Media Briefing on COVID-19—3 March 2020. Available online: https://www.who.int/dg/speeches/detail/who-director-general-s-opening-remarks-at-the-media-briefing-on-covid-19---3-march-2020 (accessed on 20 May 2020).
- Yan, Y.; Chang, L.; Wang, L. Laboratory testing of SARS-CoV, MERS-CoV, and SARS-CoV-2 (2019-nCoV): Current status, challenges, and countermeasures. Rev. Med. Virol. 2020, 30. [Google Scholar] [CrossRef]
- Kaner, J.; Schaack, S. Understanding Ebola: The 2014 epidemic. Global. Health 2016, 12, 53. [Google Scholar] [CrossRef] [Green Version]
- Brekke, I.J.; Puntervoll, L.H.; Pedersen, P.B.; Kellett, J.; Brabrand, M. The value of vital sign trends in predicting and monitoring clinical deterioration: A systematic review. PLoS ONE 2019, 14, e0210875. [Google Scholar] [CrossRef]
- Churpek, M.M.; Adhikari, R.; Edelson, D.P. The value of vital sign trends for detecting clinical deterioration on the wards. Resuscitation 2016, 102, 1–5. [Google Scholar] [CrossRef] [Green Version]
- Zipfel, C.; Bansal, S. Assessing the interactions between COVID-19 and influenza in the United States. medRxiv Prepr. Serv. Health Sci. 2020. [Google Scholar] [CrossRef] [Green Version]
- Ghosh, E.; Eshelman, L.; Yang, L.; Carlson, E.; Lord, B. Description of vital signs data measurement frequency in a medical/surgical unit at a community hospital in United States. Data Br. 2018, 16, 612–616. [Google Scholar] [CrossRef]
- Ajami, S.; ArabChadegani, R. Barriers to implement Electronic Health Records (EHRs). Mater. Socio Medica 2013, 25, 213. [Google Scholar] [CrossRef] [PubMed] [Green Version]
- Heikenfeld, J.; Jajack, A.; Rogers, J.; Gutruf, P.; Tian, L.; Pan, T.; Li, R.; Khine, M.; Kim, J.; Wang, J.; et al. Wearable sensors: Modalities, challenges, and prospects. Lab Chip 2018, 18, 217–248. [Google Scholar] [CrossRef] [PubMed] [Green Version]
- Mishra, T.; Wang, M.; Metwally, A.A.; Bogu, G.K.; Brooks, A.W.; Bahmani, A.; Alavi, A.; Celli, A.; Higgs, E.; Dagan-Rosenfeld, O.; et al. Pre-symptomatic detection of COVID-19 from smartwatch data. Nat. Biomed. Eng. 2020, 4. [Google Scholar] [CrossRef]
- Lukas, H.; Xu, C.; Yu, Y.; Gao, W. Emerging Telemedicine Tools for Remote COVID-19 Diagnosis, Monitoring, and Management. ACS Nano 2020. [Google Scholar] [CrossRef]
- Kim, J.; Campbell, A.S.; de Ávila, B.E.F.; Wang, J. Wearable biosensors for healthcare monitoring. Nat. Biotechnol. 2019, 37, 389–406. [Google Scholar] [CrossRef]
- Guk, K.; Han, G.; Lim, J.; Jeong, K.; Kang, T.; Lim, E.K.; Jung, J. Evolution of wearable devices with real-time disease monitoring for personalized healthcare. Nanomaterials 2019, 9, 813. [Google Scholar] [CrossRef] [Green Version]
- Khan, S.; Ali, S.; Bermak, A. Recent developments in printing flexible and wearable sensing electronics for healthcare applications. Sensors 2019, 19, 1230. [Google Scholar] [CrossRef] [PubMed] [Green Version]
- Carey, T.; Cacovich, S.; Divitini, G.; Ren, J.; Mansouri, A.; Kim, J.M.; Wang, C.; Ducati, C.; Sordan, R.; Torrisi, F. Fully inkjet-printed two-dimensional material field-effect heterojunctions for wearable and textile electronics. Nat. Commun. 2017, 8, 1–11. [Google Scholar] [CrossRef] [Green Version]
- Abu-Khalaf, J.M.; Al-Ghussain, L.; Al-Halhouli, A. Fabrication of stretchable circuits on polydimethylsiloxane (PDMS) pre-stretched substrates by inkjet printing silver nanoparticles. Materials 2018, 11, 2377. [Google Scholar] [CrossRef] [Green Version]
- Khan, S.; Lorenzelli, L.; Dahiya, R.S. Technologies for Printing Sensors and Electronics Over Large Flexible Substrates: A Review. IEEE Sens. J. 2015, 15. [Google Scholar] [CrossRef]
- Søndergaard, R.; Hösel, M.; Angmo, D.; Larsen-Olsen, T.T.; Krebs, F.C. Roll-to-roll fabrication of polymer solar cells. Mater. Today 2012, 15, 36–49. [Google Scholar] [CrossRef] [Green Version]
- Gamota, D.R.; Brazis, P.; Kalyanasundaram, K.J.Z. Printed Organic and Molecular Electronics; Gamota, D., Brazis, P., Kalyanasundaram, K., Zhang, J., Eds.; Springer: Boston, MA, USA, 2004; ISBN 978-1-4613-4783-5. [Google Scholar]
- Moonen, P.F.; Yakimets, I.; Huskens, J. Fabrication of transistors on flexible substrates: From mass-printing to high-resolution alternative lithography strategies. Adv. Mater. 2012, 24, 5526–5541. [Google Scholar] [CrossRef]
- Deganello, D.; Cherry, J.A.; Gethin, D.T.; Claypole, T.C. Patterning of micro-scale conductive networks using reel-to-reel flexographic printing. Thin Solid Films 2010, 518, 6113–6116. [Google Scholar] [CrossRef]
- Maksud, M.I.; Yusof, M.S.; Jamil, M.M.A. A Study on Printed Multiple Solid Line by Combining Micro- contact and Flexographic Printing Process for Microelectronic and Biomedical Applications. Int. J. Integr. Eng. 2014, 5, 36–39. [Google Scholar]
- Søndergaard, R.R.; Hösel, M.; Krebs, F.C. Roll-to-Roll fabrication of large area functional organic materials. J. Polym. Sci. Part B Polym. Phys. 2013, 51, 16–34. [Google Scholar] [CrossRef]
- Tian, D.; Song, Y.; Jiang, L. Patterning of controllable surface wettability for printing techniques. Chem. Soc. Rev. 2013, 42, 5184–5209. [Google Scholar] [CrossRef]
- Lee, J.W.; Mun, K.K.; Yoo, Y.T. A comparative study on roll-to-roll gravure printing on PET and BOPP webs with aqueous ink. Prog. Org. Coat. 2009, 64, 98–108. [Google Scholar] [CrossRef]
- Bariya, M.; Nyein, H.Y.Y.; Javey, A. Wearable sweat sensors. Nat. Electron. 2018, 1, 160–171. [Google Scholar] [CrossRef]
- Reddy, A.S.G.; Narakathu, B.B.; Atashbar, M.Z.; Rebros, M.; Rebrosova, E.; Joyce, M.K. Gravure printed electrochemical biosensor. Procedia Eng. 2011, 25, 956–959. [Google Scholar] [CrossRef] [Green Version]
- Burda, I.; Baechler, C.; Gardin, S.; Verma, A.; Terrasi, G.P.; Kovacs, G. Low-cost scalable printing of carbon nanotube electrodes on elastomeric substrates: Towards the industrial production of EAP transducers. Sens. Actuators A Phys. 2018, 279, 712–724. [Google Scholar] [CrossRef]
- Kim, S.; Sung, H.J. Effect of printing parameters on gravure patterning with conductive silver ink. J. Micromechanics Microengineering 2015, 25, 45004. [Google Scholar] [CrossRef]
- Jung, M.; Noh, J.; Kim, J.; Kim, D.; Cho, G. Roll to plate printed stretchable silver electrode using single walled carbon nanotube on elastomeric substrate. J. Nanosci. Nanotechnol. 2013, 13, 5620–5623. [Google Scholar] [CrossRef] [PubMed]
- Windmiller, J.R.; Wang, J. Wearable Electrochemical Sensors and Biosensors: A Review. Electroanalysis 2013, 25, 29–46. [Google Scholar] [CrossRef]
- Ma, Z.; Li, S.; Wang, H.; Cheng, W.; Li, Y.; Pan, L.; Shi, Y. Advanced electronic skin devices for healthcare applications. J. Mater. Chem. B 2019, 7, 173–197. [Google Scholar] [CrossRef]
- Wu, W. Inorganic nanomaterials for printed electronics: A review. Nanoscale 2017, 9, 7342–7372. [Google Scholar] [CrossRef] [PubMed]
- Cai, S.; Han, Z.; Wang, F.; Zheng, K.; Cao, Y.; Ma, Y.; Feng, X. Review on flexible photonics/electronics integrated devices and fabrication strategy. Sci. China Inf. Sci. 2018, 61, 1–27. [Google Scholar] [CrossRef] [Green Version]
- Aleeva, Y.; Pignataro, B. Recent advances in upscalable wet methods and ink formulations for printed electronics. J. Mater. Chem. C 2014, 2, 6436–6453. [Google Scholar] [CrossRef] [Green Version]
- Kipphan, H. Handbook of Print Media; Kipphan, H., Ed.; Springer: Berlin/Heidelberg, Germany, 2001; Volume 13, ISBN 978-3-540-67326-2. [Google Scholar]
- Goldberg, H.D.; Brown, R.B.; Liu, D.P.; Meyerhoff, M.E. Screen printing: A technology for the batch fabrication of integrated chemical-sensor arrays. Sens. Actuators B. Chem. 1994, 21, 171–183. [Google Scholar] [CrossRef] [Green Version]
- Linag, T.; Sun, W.Z.; Wang, L.; Wang, Y.H.; Li, H. Effect of surface energies on screen printing resolution. In IEEE Transactions on Components, Packaging, and Manufacturing Technology: Part B; IEEE: Piscataway, NJ, USA, 1996; Volume 19, pp. 423–426. [Google Scholar] [CrossRef]
- Mechanisms, M.S. Fabrication Strategies and Features. Sensors 2018, 18, 645. [Google Scholar] [CrossRef] [Green Version]
- Cui, Z. Printing practice for the fabrication of flexible and stretchable electronics. Sci. China Technol. Sci. 2019, 62, 224–232. [Google Scholar] [CrossRef]
- Hong, S.; Lee, S.; Kim, D.H. Materials and Design Strategies of Stretchable Electrodes for Electronic Skin and its Applications. Proc. IEEE 2019, 107, 2185–2197. [Google Scholar] [CrossRef]
- Al-Halhouli, A.; Al-Ghussain, L.; El Bouri, S.; Liu, H.; Zheng, D. Fabrication and Evaluation of a Novel Non-Invasive Stretchable and Wearable Respiratory Rate Sensor Based on Silver Nanoparticles Using Inkjet Printing Technology. Polymers 2019, 11, 1518. [Google Scholar] [CrossRef] [Green Version]
- Tan, E.; Jing, Q.; Smith, M.; Kar-Narayan, S.; Occhipinti, L. Needs and Enabling Technologies for Stretchable Electronics Commercialization. MRS Adv. 2017, 2, 1721–1729. [Google Scholar] [CrossRef] [Green Version]
- Jung, S.; Hoath, S.D.; Martin, G.D.; Hutchings, I.M. Inkjet Printing Process for Large Area Electronics. Large Area Flex. Electron. 2015, 315–344. [Google Scholar] [CrossRef]
- Nayak, L.; Mohanty, S.; Nayak, S.K.; Ramadoss, A. A review on inkjet printing of nanoparticle inks for flexible electronics. J. Mater. Chem. C 2019, 7, 8771–8795. [Google Scholar] [CrossRef]
- Abu-Khalaf, J.; Saraireh, R.; Eisa, S.; Al-Halhouli, A. Experimental characterization of inkjet-printed stretchable circuits for wearable sensor applications. Sensors 2018, 18, 3476. [Google Scholar] [CrossRef] [Green Version]
- Al-Halhouli, A.; Qitouqa, H.; Alashqar, A.; Abu-Khalaf, J. Inkjet printing for the fabrication of flexible/stretchable wearable electronic devices and sensors. Sens. Rev. 2018, 38, 438–452. [Google Scholar] [CrossRef]
- Park, J.; Moon, J. Control of colloidal particle deposit patterns within picoliter droplets ejected by ink-jet printing. Langmuir 2006, 22, 3506–3513. [Google Scholar] [CrossRef]
- Singh, M.; Haverinen, H.M.; Dhagat, P.; Jabbour, G.E. Inkjet printing-process and its applications. Adv. Mater. 2010, 22, 673–685. [Google Scholar] [CrossRef]
- Castrejón-Pita, J.R.; Baxter, W.R.S.; Morgan, J.; Temple, S.; Martin, G.D.; Hutchings, I.M. Future, opportunities and challenges of inkjet technologies. At. Sprays 2013, 23, 571–595. [Google Scholar] [CrossRef] [Green Version]
- Fernandes, D.F.; Majidi, C.; Tavakoli, M. Digitally printed stretchable electronics: A review. J. Mater. Chem. C 2019, 7, 14035–14068. [Google Scholar] [CrossRef]
- Chuang, M.Y. Inkjet Printing of Ag Nanoparticles using Dimatix Inkjet Printer, No 2; ScholarlyCommons, Paper 40; University of Pennsylvania: Philadelphia, PA, USA, 2017. [Google Scholar]
- Setti, L.; Piana, C.; Bonazzi, S.; Ballarin, B.; Frascaro, D.; Fraleoni-Morgera, A.; Giuliani, S. Thermal Inkjet Technology for the Microdeposition of Biological Molecules as a Viable Route for the Realization of Biosensors. Anal. Lett. 2004, 37, 1559–1570. [Google Scholar] [CrossRef]
- Tao, R.; Zhang, J.; Fang, Z.; Ning, H.; Chen, J.; Yang, C.; Zhou, Y.; Yao, R.; Song, Y.; Peng, J. Zigzag Hollow Cracks of Silver Nanoparticle Film Regulated by Its Drying Micro-environment. Nanoscale Res. Lett. 2018, 13, 354. [Google Scholar] [CrossRef] [PubMed]
- Lau, G.-K.; Shrestha, M. Ink-Jet Printing of Micro-Electro-Mechanical Systems (MEMS). Micromachines 2017, 8, 194. [Google Scholar] [CrossRef] [Green Version]
- Cui, X.; Boland, T.; D’Lima, D.D.; Lotz, M.K. Thermal Inkjet Printing in Tissue Engineering and Regenerative Medicine. Recent Pat. Drug Deliv. Formul. 2012, 6, 149–155. [Google Scholar] [CrossRef] [PubMed]
- Sundriyal, P.; Bhattacharya, S. Inkjet-Printed Sensors on Flexible Substrates; Springer: Singapore, 2018; pp. 89–113. [Google Scholar]
- Gao, M.; Li, L.; Song, Y. Inkjet printing wearable electronic devices. J. Mater. Chem. C 2017, 5, 2971–2993. [Google Scholar] [CrossRef]
- Shin, K.Y.; Lee, S.H.; Oh, J.H. Solvent and substrate effects on inkjet-printed dots and lines of silver nanoparticle colloids. J. Micromechanics Microengineering 2011, 21. [Google Scholar] [CrossRef]
- Abu-Khalaf, J.; Al-Ghussain, L.; Nadi, A.; Saraireh, R.; Rabayah, A.; Altarazi, S.; Al-Halhouli, A. Optimization of geometry parameters of inkjet-printed silver nanoparticle traces on PDMS substrates using response surface methodology. Materials 2019, 12, 3329. [Google Scholar] [CrossRef] [Green Version]
- Wu, J.; Wang, R.; Yu, H.; Li, G.; Xu, K.; Tien, N.C.; Roberts, R.C.; Li, D. Inkjet-printed microelectrodes on PDMS as biosensors for functionalized microfluidic systems. Lab Chip 2015, 15, 690–695. [Google Scholar] [CrossRef]
- Tavakoli, M.; Malakooti, M.H.; Paisana, H.; Ohm, Y.; Green Marques, D.; Alhais Lopes, P.; Piedade, A.P.; de Almeida, A.T.; Majidi, C. EGaIn-Assisted Room-Temperature Sintering of Silver Nanoparticles for Stretchable, Inkjet-Printed, Thin-Film Electronics. Adv. Mater. 2018, 30, 1–7. [Google Scholar] [CrossRef] [PubMed]
- Kim, S.; Cook, B.; Le, T.; Cooper, J.; Lee, H.; Lakafosis, V.; Vyas, R.; Moro, R.; Bozzi, M.; Georgiadis, A.; et al. Inkjet-printed antennas, sensors and circuits on paper substrate. IET Microw. Antennas Propag. 2013, 7, 858–868. [Google Scholar] [CrossRef] [Green Version]
- Borghetti, M.; Serpelloni, M.; Sardini, E.; Pandini, S. Mechanical behavior of strain sensors based on PEDOT:PSS and silver nanoparticles inks deposited on polymer substrate by inkjet printing. Sens. Actuators A Phys. 2016, 243, 71–80. [Google Scholar] [CrossRef]
- Tortorich, R.; Choi, J.-W. Inkjet Printing of Carbon Nanotubes. Nanomaterials 2013, 3, 453–468. [Google Scholar] [CrossRef] [Green Version]
- Cummins, G.; Kay, R.; Terry, J.; Desmulliez, M.P.Y.; Walton, A.J. Optimization and characterization of drop-on-demand inkjet printing process for platinum organometallic inks. In Proceedings of the 2011 IEEE 13th Electronics Packaging Technology Conference EPTC, Singapore, 7–9 December 2011; pp. 256–261. [Google Scholar] [CrossRef]
- Kamyshny, A.; Steinke, J.; Shlomo Magdassi, S. Metal-based Inkjet Inks for Printed Electronics. Open Appl. Phys. J. 1973, 7, 429–431. [Google Scholar] [CrossRef]
- Yin, Z.P.; Huang, Y.A.; Bu, N.B.; Wang, X.M.; Xiong, Y.L. Inkjet printing for flexible electronics: Materials, processes and equipments. Chin. Sci. Bull. 2010, 55, 3383–3407. [Google Scholar] [CrossRef]
- Ogoina, D. Fever, fever patterns and diseases called “fever”—A review. J. Infect. Public Health 2011, 4, 108–124. [Google Scholar] [CrossRef] [PubMed] [Green Version]
- Rutledge, A. Physiotherapy for Respiratory and Cardiac Problems: Adults and Paediatric, 3rd Edition. Physiother. Canada 2003, 55, 127. [Google Scholar] [CrossRef]
- Lee, E.K.; Kim, M.K.; Lee, C.H. Skin-Mountable Biosensors and Therapeutics: A Review. Annu. Rev. Biomed. Eng. 2019, 21, 299–323. [Google Scholar] [CrossRef] [PubMed]
- Axelrod, Y.K.; Diringer, M.N. Temperature Management in Acute Neurologic Disorders. Neurol. Clin. 2008, 26, 585–603. [Google Scholar] [CrossRef] [PubMed]
- Mackowiak, P.A.; Wasserman, S.S.; Levine, M.M. A critical appraisal of 98.6 degrees F, the upper limit of the normal body temperature, and other legacies of Carl Reinhold August Wunderlich. JAMA 1992, 268, 1578–1580. [Google Scholar] [CrossRef] [PubMed]
- Young, P.J.; Saxena, M.; Beasley, R.; Bellomo, R.; Bailey, M.; Pilcher, D.; Finfer, S.; Harrison, D.; Myburgh, J.; Rowan, K. Early peak temperature and mortality in critically ill patients with or without infection. Intensive Care Med. 2012, 38, 437–444. [Google Scholar] [CrossRef] [Green Version]
- Lim, C.L.; Byrne, C.; Lee, J.K.W. Human thermoregulation and measurement of body temperature in exercise and clinical settings. Ann. Acad. Med. Singapore 2008, 37, 347–353. [Google Scholar] [PubMed]
- Chen, H.-Y.; Chen, A.; Chen, C. Investigation of the Impact of Infrared Sensors on Core Body Temperature Monitoring by Comparing Measurement Sites. Sensors 2020, 20, 2885. [Google Scholar] [CrossRef] [PubMed]
- Rossignoli, I.; Benito, P.J.; Herrero, A.J. Reliability of infrared thermography in skin temperature evaluation of wheelchair users. Spinal Cord 2015, 53, 243–248. [Google Scholar] [CrossRef] [Green Version]
- Young, P.J.; Saxena, M. Fever management in intensive care patients with infections. Crit. Care 2014, 18. [Google Scholar] [CrossRef] [PubMed] [Green Version]
- Kaydos-Daniels, S.C.; Olowokure, B.; Chang, H.J.; Barwick, R.S.; Deng, J.F.; Lee, M.L.; Kuo, S.H.S.; Su, I.J.; Chen, K.T.; Maloney, S.A.; et al. Body Temperature Monitoring and SARS Fever Hotline, Taiwan. Emerg. Infect. Dis. 2004, 10, 373–376. [Google Scholar] [CrossRef] [Green Version]
- Tamura, T.; Huang, M.; Togawa, T. Current Developments in Wearable Thermometers. Adv. Biomed. Eng. 2018, 7, 88–99. [Google Scholar] [CrossRef] [Green Version]
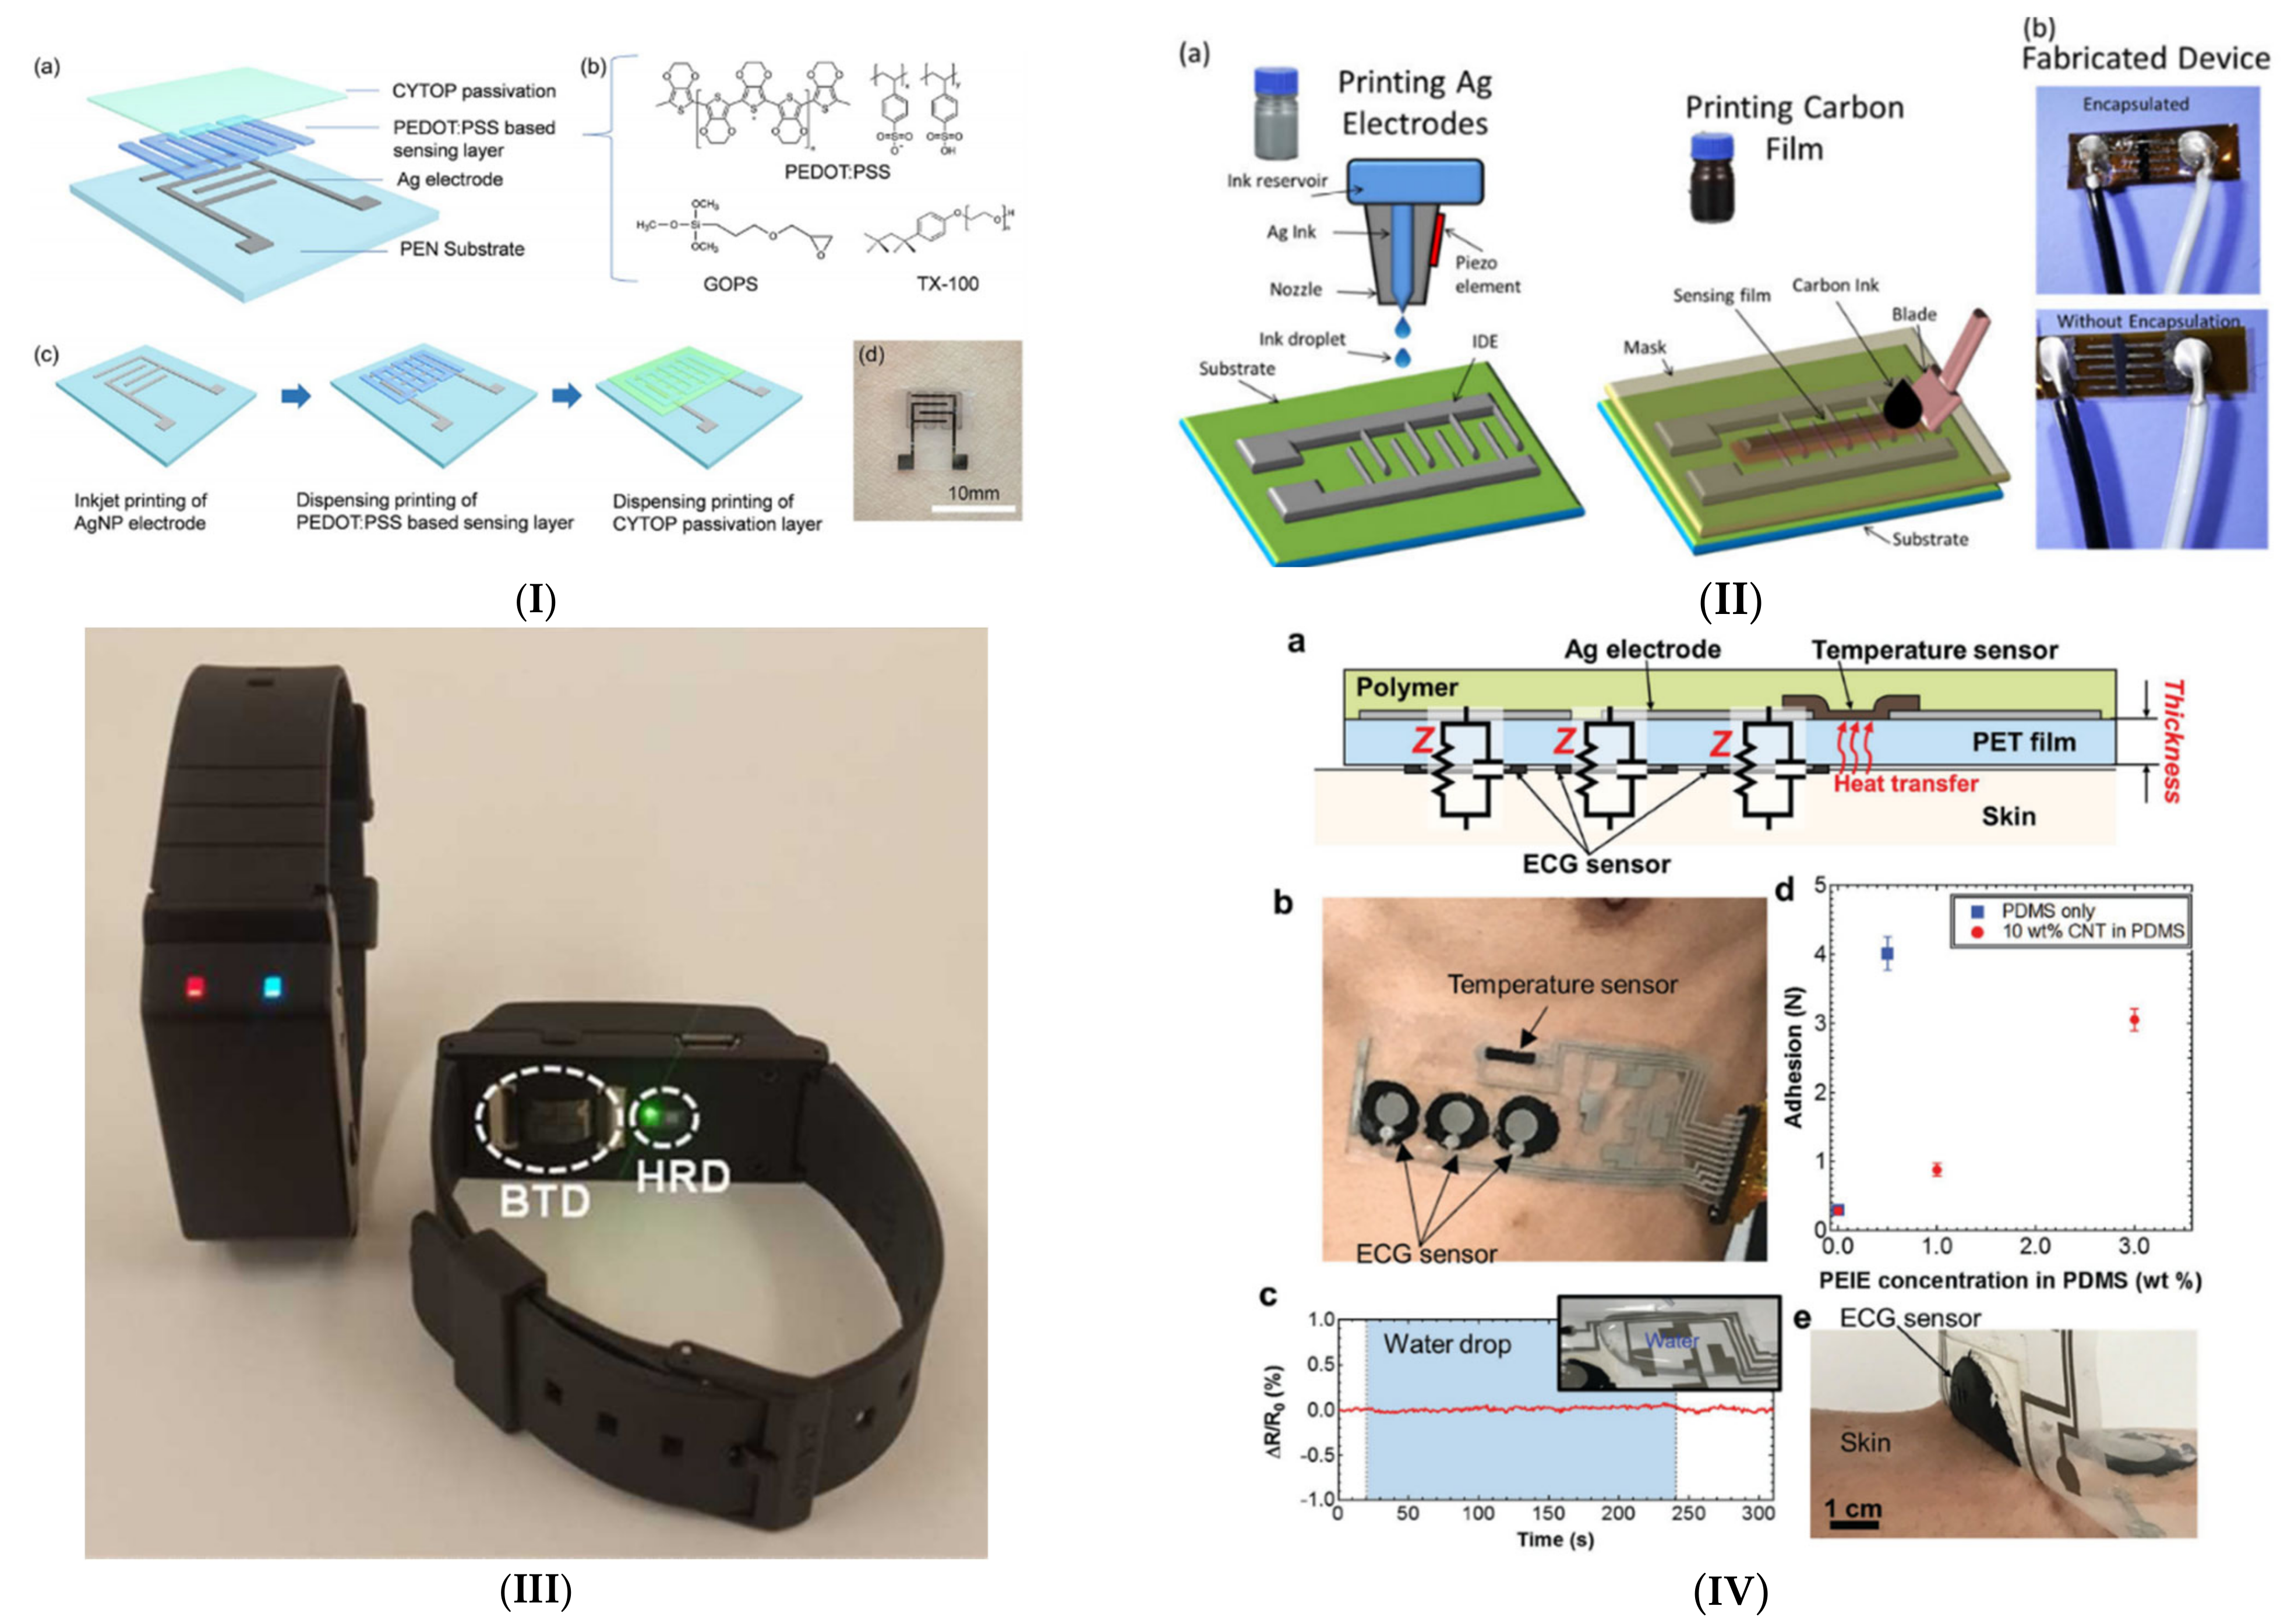
- Wang, Y.F.; Sekine, T.; Takeda, Y.; Yokosawa, K.; Matsui, H.; Kumaki, D.; Shiba, T.; Nishikawa, T.; Tokito, S. Fully Printed PEDOT:PSS-based Temperature Sensor with High Humidity Stability for Wireless Healthcare Monitoring. Sci. Rep. 2020, 10, 1–9. [Google Scholar] [CrossRef] [Green Version]
- Ali, S.; Khan, S.; Bermak, A. Inkjet-Printed Human Body Temperature Sensor for Wearable Electronics. IEEE Access 2019, 7, 163981–163987. [Google Scholar] [CrossRef]
- Dankoco, M.D.; Tesfay, G.Y.; Benevent, E.; Bendahan, M. Temperature sensor realized by inkjet printing process on flexible substrate. Mater. Sci. Eng. B Solid State Mater. Adv. Technol. 2016, 205, 1–5. [Google Scholar] [CrossRef]
- Yamamoto, Y.; Yamamoto, D.; Takada, M.; Naito, H.; Arie, T.; Akita, S.; Takei, K. Efficient Skin Temperature Sensor and Stable Gel-Less Sticky ECG Sensor for a Wearable Flexible Healthcare Patch. Adv. Healthc. Mater. 2017, 6, 1–7. [Google Scholar] [CrossRef]
- Han, D.C.; Shin, H.J.; Yeom, S.H.; Lee, W. Wearable Human Health-monitoring Band using Inkjet-printed Flexible Temperature Sensor. J. Sens. Sci. Technol. 2017, 26, 301–305. [Google Scholar] [CrossRef]
- Yamamoto, D.; Nakata, S.; Kanao, K.; Arie, T.; Akita, S.; Takei, K. All-printed, planar-type multi-functional wearable flexible patch integrated with acceleration, temperature, and ECG sensors. Proc. IEEE Int. Conf. Micro Electro Mech. Syst. 2017, 239–242. [Google Scholar] [CrossRef]
- Voutilainen, J.; Happonen, T.; Hakkinen, J.; Fabritius, T. All Silk-Screen Printed Polymer-Based Remotely Readable Temperature Sensor. IEEE Sens. J. 2015, 15, 723–733. [Google Scholar] [CrossRef]
- Eshkeiti, A.; Joyce, M.; Narakathu, B.B.; Emamian, S.; Avuthu, S.G.R.; Joyce, M.; Atashbar, M.Z. A novel self-supported printed flexible strain sensor for monitoring body movement and temperature. Proc. IEEE Sens. 2014, 2014, 1615–1618. [Google Scholar] [CrossRef]
- AL-Khalidi, F.Q.; Saatchi, R.; Burke, D.; Elphick, H.; Tan, S. Respiration rate monitoring methods: A review. Pediatr. Pulmonol. 2011, 46, 523–529. [Google Scholar] [CrossRef] [PubMed] [Green Version]
- Fieselmann, J.F.; Hendryx, M.S.; Helms, C.M.; Wakefield, D.S. Respiratory rate predicts cardiopulmonary arrest for internal medicine inpatients. J. Gen. Intern. Med. 1993, 8, 354–360. [Google Scholar] [CrossRef]
- Strauß, R.; Ewig, S.; Richter, K.; König, T.; Heller, G.; Bauer, T.T. The prognostic significance of respiratory rate in patients with pneumonia: A retrospective analysis of data from 705 928 hospitalized patients in Germany from 2010–2012. Dtsch. Arztebl. Int. 2014, 111, 503–508. [Google Scholar] [CrossRef] [Green Version]
- Huang, M.C.; Xu, W.; Liu, J.; Samy, L.; Vajid, A.; Alshurafa, N.; Sarrafzadeh, M. Inconspicuous on-bed respiratory rate monitoring. In Proceedings of the 6th International Conference on PErvasive Technologies Related to Assistive Environments (PETRA ’13), Rhodes Greece, 29–31 May 2013; Association for Computing Machinery: New York, NY, USA, 2013; pp. 1–8, Article 18. [Google Scholar] [CrossRef]
- Subbe, C.P.; Davies, R.G.; Williams, E.; Rutherford, P.; Gemmell, L. Effect of introducing the Modified Early Warning score on clinical outcomes, cardio-pulmonary arrests and intensive care utilisation in acute medical admissions. Anaesthesia 2003, 58, 797–802. [Google Scholar] [CrossRef]
- Main, E.; Denehy, L. (Eds.) Cardiorespiratory Physiotherapy: Adults and Paediatrics E-Book: Formerly Physiotherapy for Respiratory and Cardiac Problems, 5th ed.; Elsevier Health Sciences: Amsterdam, The Netherlands, 2016. [Google Scholar]
- Bakr, A.F.; Habib, H.S. Normal values of pulse oximetry in newborns at high altitude. J. Trop. Pediatr. 2005, 51, 170–173. [Google Scholar] [CrossRef] [PubMed] [Green Version]
- Fleming, S.; Thompson, M.; Stevens, R.; Heneghan, C.; Plüddemann, A.; Maconochie, I.; Tarassenko, L.; Mant, D. Normal ranges of heart rate and respiratory rate in children from birth to 18 years of age: A systematic review of observational studies. Lancet 2011, 377, 1011–1018. [Google Scholar] [CrossRef] [PubMed] [Green Version]
- Flenady, T.; Dwyer, T.; Applegarth, J. Accurate respiratory rates count: So should you! Australas. Emerg. Nurs. J. 2017, 20, 45–47. [Google Scholar] [CrossRef] [Green Version]
- Takayama, A.; Nagamine, T.; Kotani, K. Aging is independently associated with an increasing normal respiratory rate among an older adult population in a clinical setting: A cross-sectional study. Geriatr. Gerontol. Int. 2019, 19, 1179–1183. [Google Scholar] [CrossRef] [PubMed]
- Rodríguez-Molinero, A.; Narvaiza, L.; Ruiz, J.; Gálvez-Barrõn, C. Normal respiratory rate and peripheral blood oxygen saturation in the elderly population. J. Am. Geriatr. Soc. 2013, 61, 2238–2240. [Google Scholar] [CrossRef]
- Merilampi, S.; Björninen, T.; Haukka, V.; Ruuskanen, P.; Ukkonen, L.; Sydänheimo, L. Microelectronics Reliability Analysis of electrically conductive silver ink on stretchable substrates under tensile load. Microelectron. Reliab. 2011, 50, 2001–2011. [Google Scholar] [CrossRef]
- Cretikos, M.A.; Bellomo, R.; Hillman, K.; Chen, J.; Finfer, S.; Flabouris, A. Respiratory rate: The neglected vital sign. Med. J. Aust. 2008, 188, 657–659. [Google Scholar] [CrossRef] [PubMed]
- Massaroni, C.; Nicolò, A.; Lo Presti, D.; Sacchetti, M.; Silvestri, S.; Schena, E. Contact-based methods for measuring respiratory rate. Sensors 2019, 19, 908. [Google Scholar] [CrossRef] [PubMed] [Green Version]
- Reichert, S.; Gass, R.; Brandt, C.; Andrès, E. Analysis of Respiratory Sounds: State of the Art. Clin. Med. Circ. Respir. Pulm. Med. 2008, 2, 45–58. [Google Scholar] [CrossRef]
- Hsu, C.H.; Chow, J.C. Design and clinic monitoring of a newly developed non-attached infant apnea monitor. Biomed. Eng. Appl. Basis Commun. 2005, 17, 126–134. [Google Scholar] [CrossRef] [Green Version]
- Branson, R.D.; Gentile, M.A. Is Humidification Always Necessary during Noninvasive Ventilation in the Hospital? Respir. Care 2010, 55, 209–216. [Google Scholar] [PubMed]
- Aminiahidashti, H.; Shafiee, S.; Zamani Kiasari, A.; Sazgar, M. Applications of End-Tidal Carbon Dioxide (ETCO2) Monitoring in Emergency Department; a Narrative Review. Emergency 2018, 6, e5. [Google Scholar] [CrossRef]
- Charlton, P.H.; Bonnici, T.; Tarassenko, L.; Clifton, D.A.; Beale, R.; Watkinson, P.J. An assessment of algorithms to estimate respiratory rate from the electrocardiogram and photoplethysmogram. Physiol. Meas. 2016, 37, 610–626. [Google Scholar] [CrossRef]
- Cho, Y.; Julier, S.J.; Marquardt, N.; Bianchi-Berthouze, N. Robust tracking of respiratory rate in high-dynamic range scenes using mobile thermal imaging. Biomed. Opt. Express 2017, 8, 4480. [Google Scholar] [CrossRef] [PubMed] [Green Version]
- McBride, J.; Knight, D.; Piper, J.; Smith, G.B. Long-term effect of introducing an early warning score on respiratory rate charting on general wards. Resuscitation 2005, 65, 41–44. [Google Scholar] [CrossRef]
- Hogan, J. Why don’t nurses monitor the respiratory rates of patients? Br. J. Nurs. 2006, 15, 489–492. [Google Scholar] [CrossRef]
- Marjanovic, N.; Mimoz, O.; Guenezan, J. An easy and accurate respiratory rate monitor is necessary. J. Clin. Monit. Comput. 2020, 34, 221–222. [Google Scholar] [CrossRef] [Green Version]
- Liu, Y.; Wang, H.; Zhao, W.; Zhang, M.; Qin, H.; Xie, Y. Flexible, stretchable sensors for wearable health monitoring: Sensing mechanisms, materials, fabrication strategies and features. Sensors 2018, 18, 645. [Google Scholar] [CrossRef] [PubMed] [Green Version]
- Al-Halhouli, A.; Al-Ghussain, L.; El Bouri, S.; Habash, F.; Liu, H.; Zheng, D. Clinical Evaluation of Stretchable and Wearable Inkjet-Printed Strain Gauge Sensor for Respiratory Rate Monitoring at Different Body Postures. Appl. Sci. 2020, 10, 480. [Google Scholar] [CrossRef] [Green Version]
- Al-Halhouli, A.; Al-Ghussain, L.; El Bouri, S.; Liu, H.; Zheng, D. Clinical evaluation of stretchable and wearable inkjet-printed strain gauge sensor for respiratory rate monitoring at different measurements locations. J. Clin. Monit. Comput. 2020. [Google Scholar] [CrossRef]
- Al-Halhouli, A.; Al-Ghussain, L.; Khallouf, O.; Rabadi, A.; Alawadi, J.; Liu, H.; Al Oweidat, K.; Chen, F.; Zheng, D. Clinical Evaluation of Respiratory Rate Measurements on COPD (Male) Patients Using Wearable Inkjet-Printed Sensor. Sensors 2021, 21, 468. [Google Scholar] [CrossRef] [PubMed]
- Maier, D.; Laubender, E.; Basavanna, A.; Schumann, S.; Güder, F.; Urban, G.A.; Dincer, C. Toward Continuous Monitoring of Breath Biochemistry: A Paper-Based Wearable Sensor for Real-Time Hydrogen Peroxide Measurement in Simulated Breath. ACS Sens. 2019, 4, 2945–2951. [Google Scholar] [CrossRef] [PubMed]
- Yang, W.; Li, N.W.; Zhao, S.; Yuan, Z.; Wang, J.; Du, X.; Wang, B.; Cao, R.; Li, X.; Xu, W.; et al. A Breathable and Screen-Printed Pressure Sensor Based on Nanofiber Membranes for Electronic Skins. Adv. Mater. Technol. 2018, 3, 1700241. [Google Scholar] [CrossRef]
- Cao, R.; Wang, J.; Zhao, S.; Yang, W.; Yuan, Z.; Yin, Y.; Du, X.; Li, N.W.; Zhang, X.; Li, X.; et al. Self-powered nanofiber-based screen-print triboelectric sensors for respiratory monitoring. Nano Res. 2018, 11, 3771–3779. [Google Scholar] [CrossRef]
- Su, C.-H.; Chiu, H.-L.; Chen, Y.-C.; Yesilmen, M.; Schulz, F.; Ketelsen, B.; Vossmeyer, T.; Liao, Y.-C. Highly Responsive PEG/Gold Nanoparticle Thin-Film Humidity Sensor via Inkjet Printing Technology. Langmuir 2019, 35, 3256–3264. [Google Scholar] [CrossRef] [PubMed]
- Lu, R.; Haider, M.R.; Gardner, S.; Alexander, J.I.D.; Massoud, Y. A Paper-Based Inkjet-Printed Graphene Sensor for Breathing-Flow Monitoring. IEEE Sens. Lett. 2019, 3, 1–4. [Google Scholar] [CrossRef]
- Mohapatra, B.I.; Shamsir Morshed, S.; Islam, S.K. Inkjet printed thin film electronic traces on paper for low-cost body-worn electronic patch sensors. In Proceedings of the 2018 IEEE 15th International Conference on Wearable and Implantable Body Sensor Networks (BSN), 2018, Las Vegas, NV, USA, 4–7 March 2018; 2018; pp. 169–172. [Google Scholar] [CrossRef]
- Palatini, P. Elevated Heart Rate: A “New” Cardiovascular Risk Factor? Prog. Cardiovasc. Dis. 2009, 52, 1–5. [Google Scholar] [CrossRef]
- Warnier, M.J.; Rutten, F.H.; De Boer, A.; Hoes, A.W.; De Bruin, M.L. Resting Heart Rate Is a Risk Factor for Mortality in Chronic Obstructive Pulmonary Disease, but Not for Exacerbations or Pneumonia. PLoS ONE 2014, 9, e105152. [Google Scholar] [CrossRef] [Green Version]
- Karjalainen, J.; Viitasalo, M. Fever and Cardiac Rhythm. Arch. Intern. Med. 1986, 146, 1169–1171. [Google Scholar] [CrossRef] [PubMed]
- D’souza, A.; Bucchi, A.; Johnsen, A.B.; Logantha, S.J.R.J.; Monfredi, O.; Yanni, J.; Prehar, S.; Hart, G.; Cartwright, E.; Wisloff, U.; et al. Exercise training reduces resting heart rate via downregulation of the funny channel HCN4. Nat. Commun. 2014, 5. [Google Scholar] [CrossRef]
- Prabhavathi, K.; Tamarai Selvi, K.; Poornima, K.N.; Sarvanan, A. Role of biological sex in normal cardiac function and in its disease outcome—A review. J. Clin. Diagnostic Res. 2014, 8, BE01. [Google Scholar] [CrossRef]
- Capoferri, G.; Osthoff, M.; Egli, A.; Stoeckle, M.; Bassetti, S. Relative bradycardia in patients with COVID-19. Clin. Microbiol. Infect. 2020. [Google Scholar] [CrossRef]
- Nikolaidou, T.; Pellicori, P.; Zhang, J.; Kazmi, S.; Goode, K.M.; Cleland, J.G.; Clark, A.L. Prevalence, predictors, and prognostic implications of PR interval prolongation in patients with heart failure. Clin. Res. Cardiol. 2018, 107, 108–119. [Google Scholar] [CrossRef] [Green Version]
- Antonicelli, R.; Ripa, C.; Abbatecola, A.M.; Capparuccia, C.A.; Ferrara, L.; Spazzafumo, L. Validation of the 3-lead tele-ECG versus the 12-lead tele-ECG and the conventional 12-lead ECG method in older people. J. Telemed. Telecare 2012, 18, 104–108. [Google Scholar] [CrossRef] [PubMed]
- Langley, R.; Cunningham, S. How Should Oxygen Supplementation Be Guided by Pulse Oximetry in Children: Do We Know the Level? Front. Pediatr. 2017, 4, 1. [Google Scholar] [CrossRef] [Green Version]
- Torp, K.D.; Modi, P.; Simon, L.V. Pulse Oximetry; StatPearls Publishing: Treasure Island, FL, USA, 2021. [Google Scholar]
- Van Gastel, M.; Stuijk, S.; De Haan, G. Camera-based pulse-oximetry—Validated risks and opportunities from theoretical analysis. Biomed. Opt. Express 2018, 9, 102. [Google Scholar] [CrossRef] [Green Version]
- De La Merced Díaz-González, C.; De La Rosa Hormiga, M.; María Ramal López, J.; Déniz Rivero, Y.; Sandra, M.; Morales, M. Concordance among Measurements Obtained by Three Pulse Oximeters Currently Used by Health Professionals Internal Medicine Section. J. Clin. Diagnostic Res. 2014, 8, 9–12. [Google Scholar] [CrossRef]
- Nitzan, M.; Romem, A.; Koppel, R. Pulse oximetry: Fundamentals and technology update. Med. Devices Evid. Res. 2014, 7, 231–239. [Google Scholar] [CrossRef] [PubMed]
- Wilson-Baig, N.; McDonnell, T.; Bentley, A. Discrepancy between SpO2 and SaO2 in patients with COVID-19. Anaesthesia 2020, 16, 258–260. [Google Scholar] [CrossRef]
- Perkins, G.D.; McAuley, D.F.; Giles, S.; Routledge, H.; Gao, F. Do changes in pulse oximeter oxygen saturation predict equivalent changes in arterial oxygen saturation? Crit. Care 2003, 7, R67. [Google Scholar] [CrossRef] [PubMed] [Green Version]
- Vuorinen, T.; Noponen, K.; Vehkaoja, A.; Onnia, T.; Laakso, E.; Leppänen, S.; Mansikkamäki, K.; Seppänen, T.; Mäntysalo, M. Validation of Printed, Skin-Mounted Multilead Electrode for ECG Measurements. Adv. Mater. Technol. 2019, 4, 1900246. [Google Scholar] [CrossRef]
- Lochner, C.M.; Khan, Y.; Pierre, A.; Arias, A.C. All-organic optoelectronic sensor for pulse oximetry. Nat. Commun. 2014, 5, 5745. [Google Scholar] [CrossRef] [Green Version]
- Yokota, T.; Zalar, P.; Kaltenbrunner, M.; Jinno, H.; Matsuhisa, N.; Kitanosako, H.; Tachibana, Y.; Yukita, W.; Koizumi, M.; Someya, T. Ultraflexible organic photonic skin. Sci. Adv. 2016, 2, e1501856. [Google Scholar] [CrossRef] [Green Version]
- He, F.J.; MacGregor, G.A. Blood pressure is the most important cause of death and disability in the world. Eur. Hear. J. Suppl. 2007, 9. [Google Scholar] [CrossRef] [Green Version]
- Hypertension. Available online: https://www.who.int/news-room/fact-sheets/detail/hypertension (accessed on 26 October 2020).
- Fortino, G.; Giampà, V. PPG-based methods for non invasive and continuous blood pressure measurement: An overview and development issues in body sensor networks. In Proceedings of the 2010 IEEE International Workshop on Medical Measurements and Applications, MeMeA 2010—Proceedings, Ottawa, ON, Canada, 30 April–1 May 2010; pp. 10–13. [Google Scholar]
- Nye, R.; Zhang, Z.; Fang, Q. Continuous non-invasive blood pressure monitoring using photoplethysmography: A review. In Proceedings of the 2015 International Symposium on Bioelectronics and Bioinformatics (ISBB), Beijing, China, 14–17 October 2015; pp. 176–179. [Google Scholar] [CrossRef]
- Barrios, L.; Oldrati, P.; Santini, S.; Lutterotti, A. Evaluating the accuracy of heart rate sensors based on photoplethysmography for in-the-wild analysis. In Proceedings of the 13th EAI International Conference on Pervasive Computing Technologies for Healthcare (PervasiveHealth’19), Trento, Italy, 20–23 May 2019; Association for Computing Machinery: New York, NY, USA, 2019; pp. 251–261. [Google Scholar] [CrossRef]
- Turner, J.R.; Viera, A.J.; Shimbo, D. Ambulatory blood pressure monitoring in clinical practice: A review. Am. J. Med. 2015, 128, 14–20. [Google Scholar] [CrossRef] [PubMed] [Green Version]
- Tjahjadi, H.; Ramli, K. Review of photoplethysmography based non-invasive continuous blood pressure method. In Proceedings of the 2017 15th International Conference on Quality in Research (QiR): International Symposium on Electrical and Computer Engineering, Bali, Indonesia, 24–27 July 2017; pp. 173–178. [Google Scholar] [CrossRef]
- Peter, L.; Noury, N.; Cerny, M. A review of methods for non-invasive and continuous blood pressure monitoring: Pulse transit time method is promising? IRBM 2014, 35, 271–282. [Google Scholar] [CrossRef]
- Tjahjadi, H.; Ramli, K.; Murfi, H. Noninvasive Classification of Blood Pressure Based on Photoplethysmography Signals Using Bidirectional Long Short-Term Memory and Time-Frequency Analysis. IEEE Access 2020, 8, 20735–20748. [Google Scholar] [CrossRef]
- Musini, V.M.; Wright, J.M. Factors affecting blood pressure variability: Lessons learned from two systematic reviews of randomized controlled trials. PLoS ONE 2009, 4, e5673. [Google Scholar] [CrossRef] [PubMed] [Green Version]
- Lopez, G.; Shuzo, M.; Ushida, H.; Hidaka, K.; Yanagimoto, S.; Imai, Y.; Kosaka, A.; Delaunay, J.-J.; Yamada, I. Continuous Blood Pressure Monitoring in Daily Life*. J. Adv. Mech. Des. 2010, 4. [Google Scholar] [CrossRef] [Green Version]
- Pickering, T.G.; Shimbo, D.; Haas, D. Ambulatory blood-pressure monitoring. N. Engl. J. Med. 2006, 354, 2368–2374. [Google Scholar] [CrossRef] [PubMed] [Green Version]
- Wang, Y.J.; Chen, T.Y.; Tsai, M.C.; Wu, C.H. Noninvasive blood pressure monitor using strain gauges, a fastening band, and a wrist elasticity model. Sens. Actuators A Phys. 2016, 252, 198–208. [Google Scholar] [CrossRef]
- Noh, S.; Yoon, C.; Hyun, E.; Yoon, H.N.; Chung, T.J.; Park, K.S.; Kim, H.C. Ferroelectret film-based patch-type sensor for continuous blood pressure monitoring. Electron. Lett. 2014, 50, 143–144. [Google Scholar] [CrossRef]
- Simjanoska, M.; Gjoreski, M.; Gams, M.; Madevska Bogdanova, A. Non-Invasive Blood Pressure Estimation from ECG Using Machine Learning Techniques. Sensors 2018, 18, 1160. [Google Scholar] [CrossRef] [Green Version]
- Ghufran Khalid, S.; Zhang, J.; Chen, F.; Zheng, D.; Editor, G.; Shang, Y. Blood Pressure Estimation Using Photoplethysmography Only: Comparison between Different Machine Learning Approaches. J. Health Eng. 2018. [Google Scholar] [CrossRef] [Green Version]


| Emerging Diseases | COVID-19 | CCHF | EBOV, MARV | LHF | MERS, SARS | RVF | NiV |
|---|---|---|---|---|---|---|---|
| Pathogen | SARS-COV-2 virus [142] | Crimean–Congo hemorrhagic fever virus (CCHFV) [63] | Ebola and Marburg viruses [73] | Lassa virus [68] | MERS-CoV and SARS-CoV for MERS and SARS | Rift Valley Fever Virus (RVFV) [118,119] | Nipah virus (NiV) [130] |
| CFR | 3.4% [143] | 10–40% [62] | 24–90% [76,78] | 1% [86] | MERS 34.4% [112], SARS 11% [113] | Less than 1% [120] | 40–75% [131] |
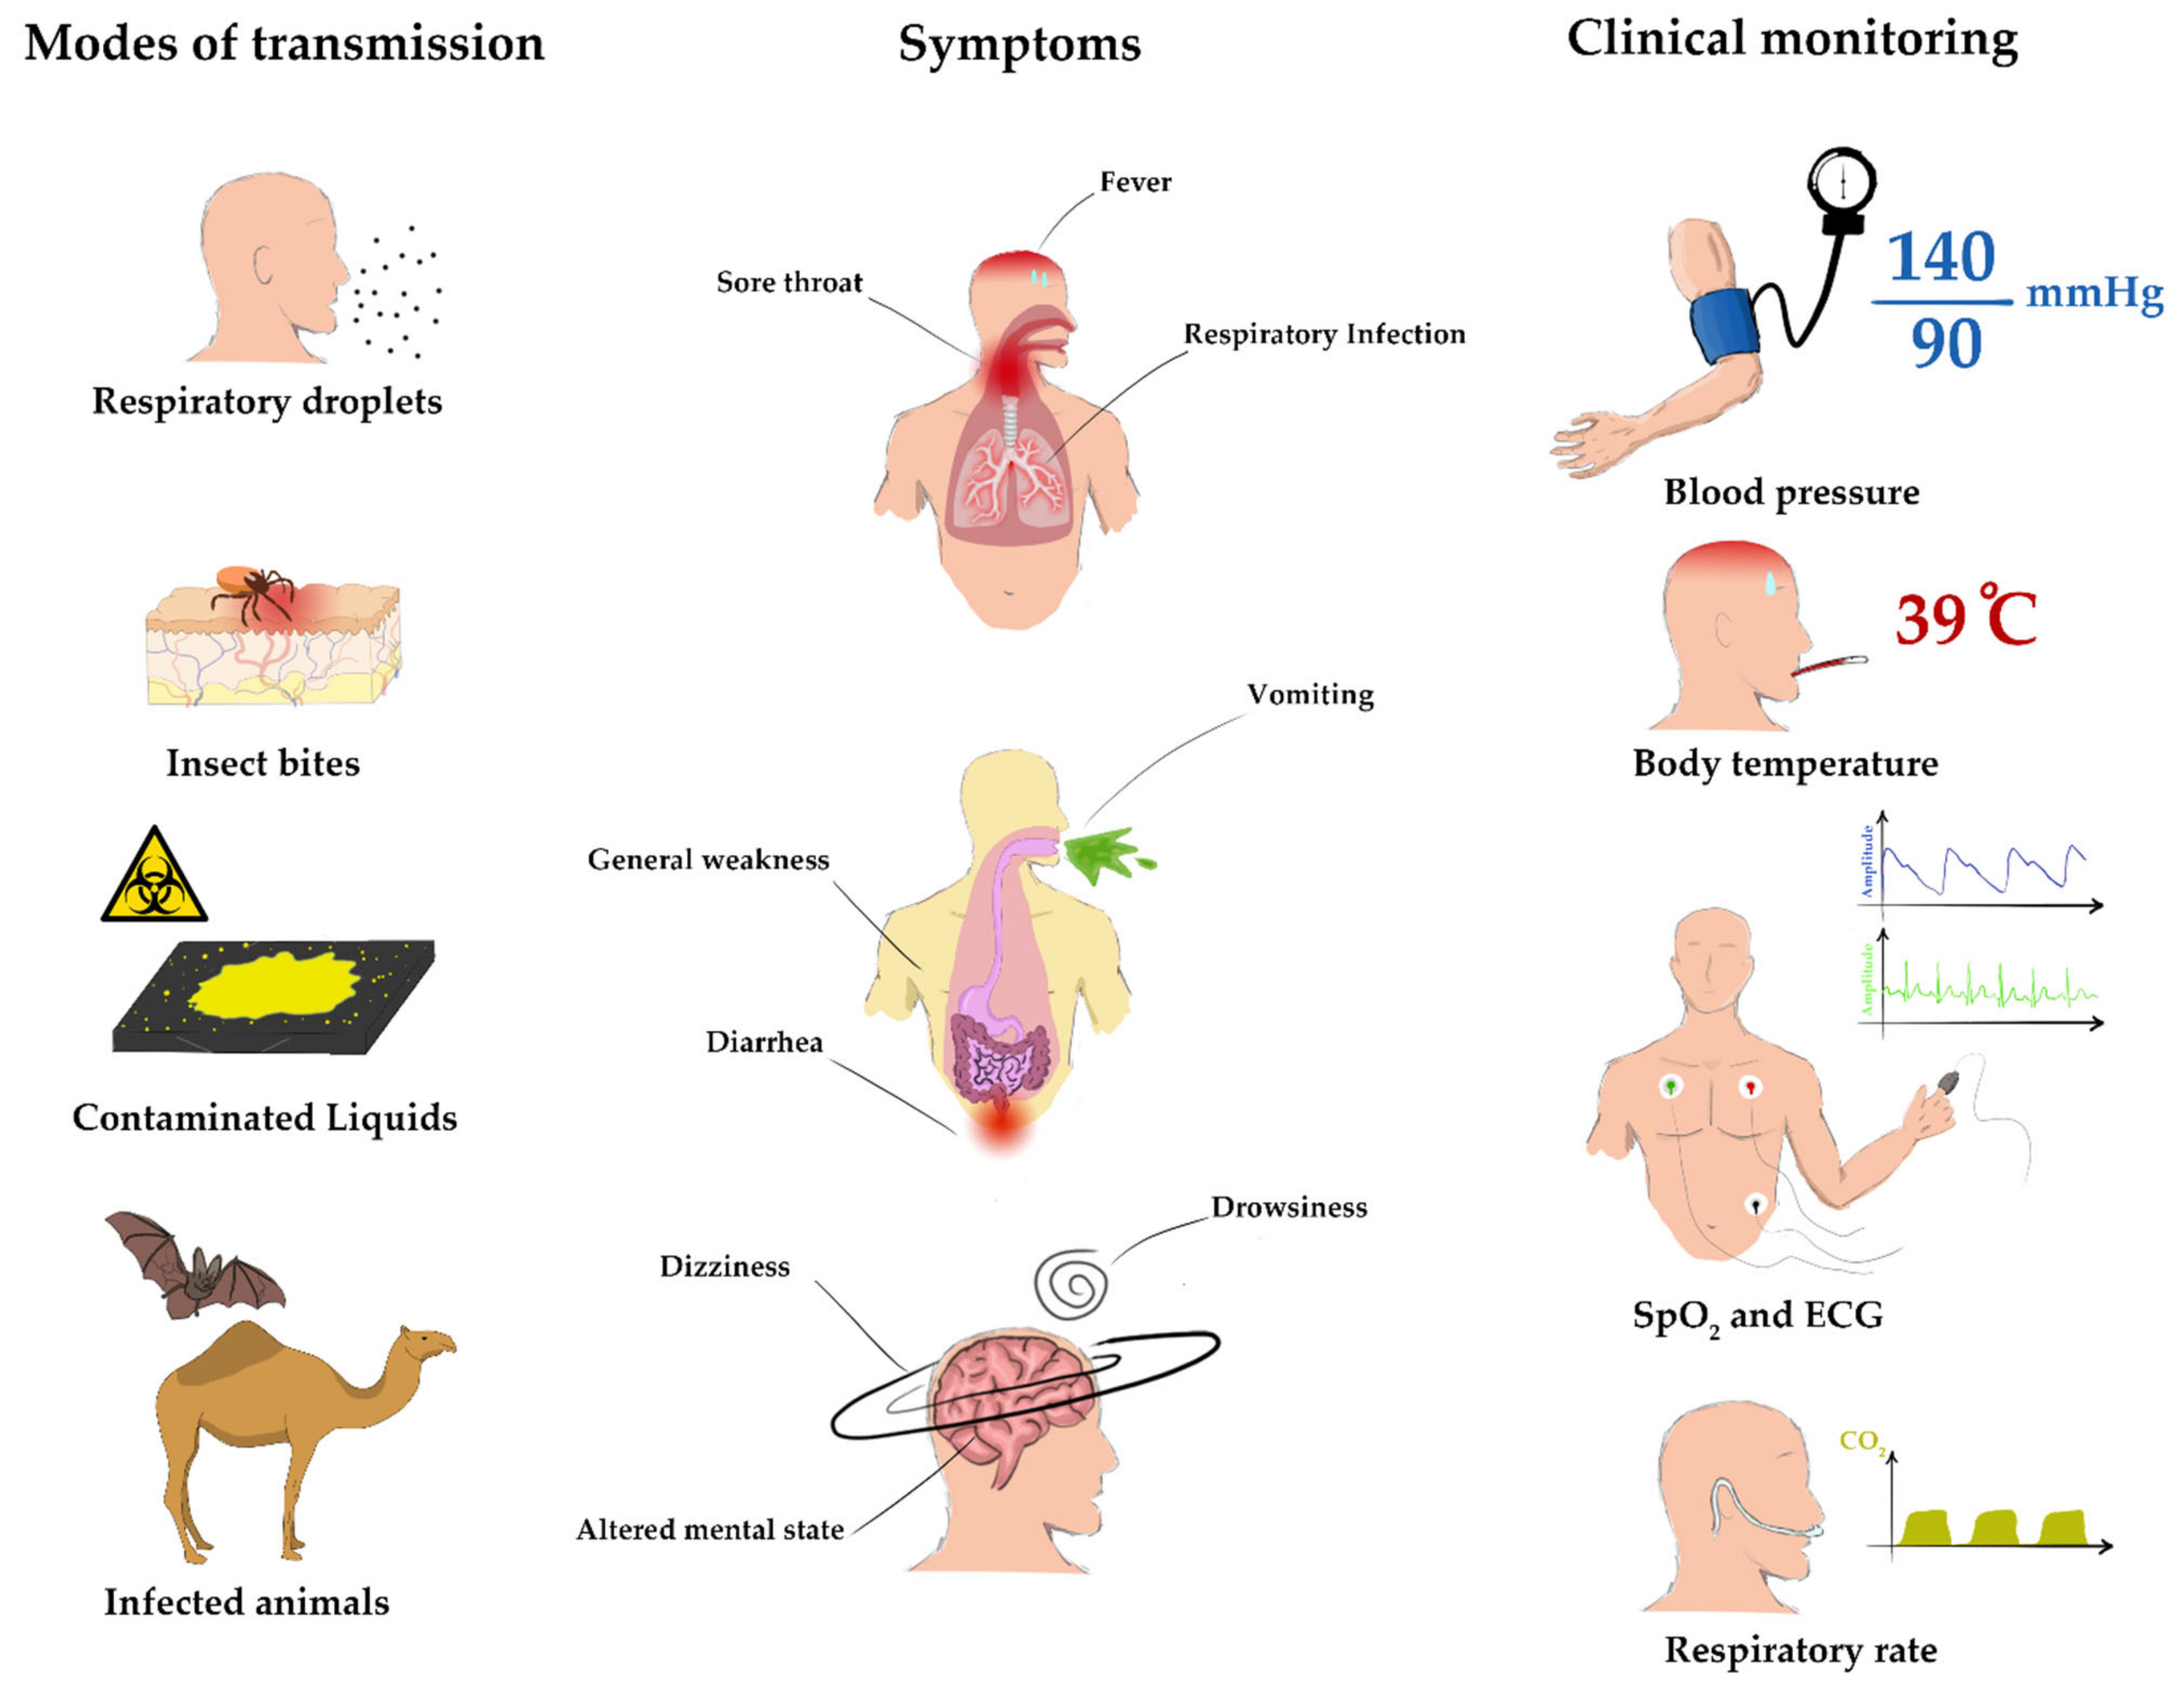
| Transmission | Respiratory droplets [38,39] | Tick bites, exposure to infected livestock, and human to human transmission [62,65] | Direct contact with contaminated bodily fluids of infected humans and animals [74,75,76] | Direct contact with infected persons or animals and their bodily fluids [86] | Respiratory droplets [94] | Mosquito bites, direct contact with infected animals. [120,121,122] | Direct contact with infected fruit bats, pigs, or other infected animals and their secretions [131] |
| Symptoms | Fever, cough, shortness of breath, loss of taste and smell [43,45,46,47,48] | Fever, muscle pain, dizziness, vomiting, diarrhea, headache, photophobia [62] | Fever, fatigue, diarrhea, vomiting, hemorrhagic manifestations [80,81] | High fever, general weakness, malaise, sore throat, headache, muscle [88] | Fever, chills, coughing, malaise, myalgia, and headache [93] | Fever, fatigue, and muscle pain [120,122,123,124,125] | Fever, cough, vomiting, sore throat, unconsciousness, and disorientation [131,135,136,137] |
| Diagnosis | rRT-PCR and antibody detection [49,50,51] | ELISA, serum neutralization, antigen detection and RT-PCR | ELISA, antigen detection, RT-PCR, and virus isolation [76,78] | ELISA, RT-PCR, virus isolation by cell culture and antigen detection [86,89] | rRT-PCR and antibody detection tests [144] | ELISA, virus isolation and RT-PCR. [122,126] | RT-PCR and ELISA [138] |
| Vaccine | Vaccine is available | No licensed vaccine is available | No vaccines are available [82] | No vaccines are available [86] | No vaccines are available [97,114] | No vaccine is available [120] | No vaccine is. available [130,139,140] |
| Clinical Monitoring | BT, RR, HR, and SpO2. [58,59,60] | BT, HR, BP [62,72] | BT, HR, RR, BP, SpO2, consciousness, and glucose [84,85] | BT, BP, HR, and RR, in addition to other laboratory tests [91,92] | BT, SpO2, RR, BP, HR, Bodily fluids, and Sepsis [110,115,116,117] | BT and BP are crucial clinical features to be continuously monitored [123,129] | BT, SpO2, RR [141] |
| Group | Position | Printing Method | Substrate | Active Material | Sensing Method | Sensitivity |
|---|---|---|---|---|---|---|
| A. Eshkeiti et al. [230] | Wrist | Screen | PET | Silver | Resistive | N/A |
| Wang et al. [223] | Arm | Inkjet | PEN | PEDOT:PSS | Resistive | −7.7 m°C−1 |
| Ali et al. [224] | Wrist | Inkjet, Screen | Kapton | Carbon | Resistive | 3.7 m°C−1 |
| Dankoco et al. [225] | N/A | Inkjet | Kapton | Silver | Resistive | 2.23 m°C−1 |
| Yamamoto et al. [226,228] | Chest | Screen | PET | CNT and PEDOT:PSS | Resistive | 13 m°C−1 |
| Voutilainen et al. [229] | N/A | Screen | PET | Polymer paste | Capacitive | 9 kHz °C−1 |
| Han et al. [227] | Wrist | Inkjet | N/A | PEDOT:PSS | Resistive | N/A |
| Group | Position | Printing Method | Substrate | Active Material | Sensing Method | Sensitivity |
|---|---|---|---|---|---|---|
| Al-Halhouli et al. [184,255,256] | Chest, abdomen | Inkjet | PDMS | Silver nanoparticles | Resistive/strain | 0.11 S −1 |
| Yang et al. [259] | Facemask | Screen | PVDF NM | Silver nanowires | Capacitive/pressure | 4.2 kPa−1 |
| Cao et al. [260] | Facemask | Screen | PVDF NM | Silver nanoparticles | Triboelectric/pressure | 0.065–0.385 kPa−1 |
| Lu et al. [262] | Mouth | Inkjet | glossy photo-paper | Graphene | Impedance/temperature, humidity | N/A |
| Su et al. [261] | Facemask | Inkjet | PET | Gold nanoparticles | Resistive/humidity | N/A |
| Mohapatra el at. [263] | Nose | Inkjet | Polyimide | Silver nanoparticles | Resistive/moisture | N/A |
| Group | Position | Printing Method | Substrate | Active Material | Sensing Parameter | Error |
|---|---|---|---|---|---|---|
| Yamamoto et al. [226,228] | Chest | Screen | PET | CNT | ECG/3 electrodes | N/A |
| Vuorinen et al. [279] | Chest | Screen | TPU | Silver | ECG/4 electrodes | N/A |
| Abu-Khalaf et al. [188] | Finger | Inkjet | PDMS | Silver | HR/SpO2 | HR: ±4.72%, SpO2: ±0.755% |
| Lochner et al. [280] | Finger | Blade coating, spin coating | PEN, PET, ITO coated glass | Organic materials | HR/SpO2 | HR: 1%, SpO2: 2% |
| Group | Position | Printing Method | Substrate | Active Material | Sensing Parameter | Error |
|---|---|---|---|---|---|---|
| Wang et al. [294] | Wrist | Screen printing | Polyimide film (PI) | Silver paste | Resistive/strain | −2.0 ± 3.9 mmHg |
| Noh et al. [295] | Chest | Screen printing | EMFi | Silver paste | ECG/electrodes | −0.16 ± 4.12 mmHg |
Publisher’s Note: MDPI stays neutral with regard to jurisdictional claims in published maps and institutional affiliations. |
© 2021 by the authors. Licensee MDPI, Basel, Switzerland. This article is an open access article distributed under the terms and conditions of the Creative Commons Attribution (CC BY) license (https://creativecommons.org/licenses/by/4.0/).
Share and Cite
Al-Halhouli, A.; Albagdady, A.; Alawadi, J.; Abeeleh, M.A. Monitoring Symptoms of Infectious Diseases: Perspectives for Printed Wearable Sensors. Micromachines 2021, 12, 620. https://doi.org/10.3390/mi12060620
Al-Halhouli A, Albagdady A, Alawadi J, Abeeleh MA. Monitoring Symptoms of Infectious Diseases: Perspectives for Printed Wearable Sensors. Micromachines. 2021; 12(6):620. https://doi.org/10.3390/mi12060620
Chicago/Turabian StyleAl-Halhouli, Ala’aldeen, Ahmed Albagdady, Ja’far Alawadi, and Mahmoud Abu Abeeleh. 2021. "Monitoring Symptoms of Infectious Diseases: Perspectives for Printed Wearable Sensors" Micromachines 12, no. 6: 620. https://doi.org/10.3390/mi12060620