
Laser Spot Micro-Welding of Ultra-Thin Steel Sheet


Abstract
:1. Introduction
2. Materials and Methods
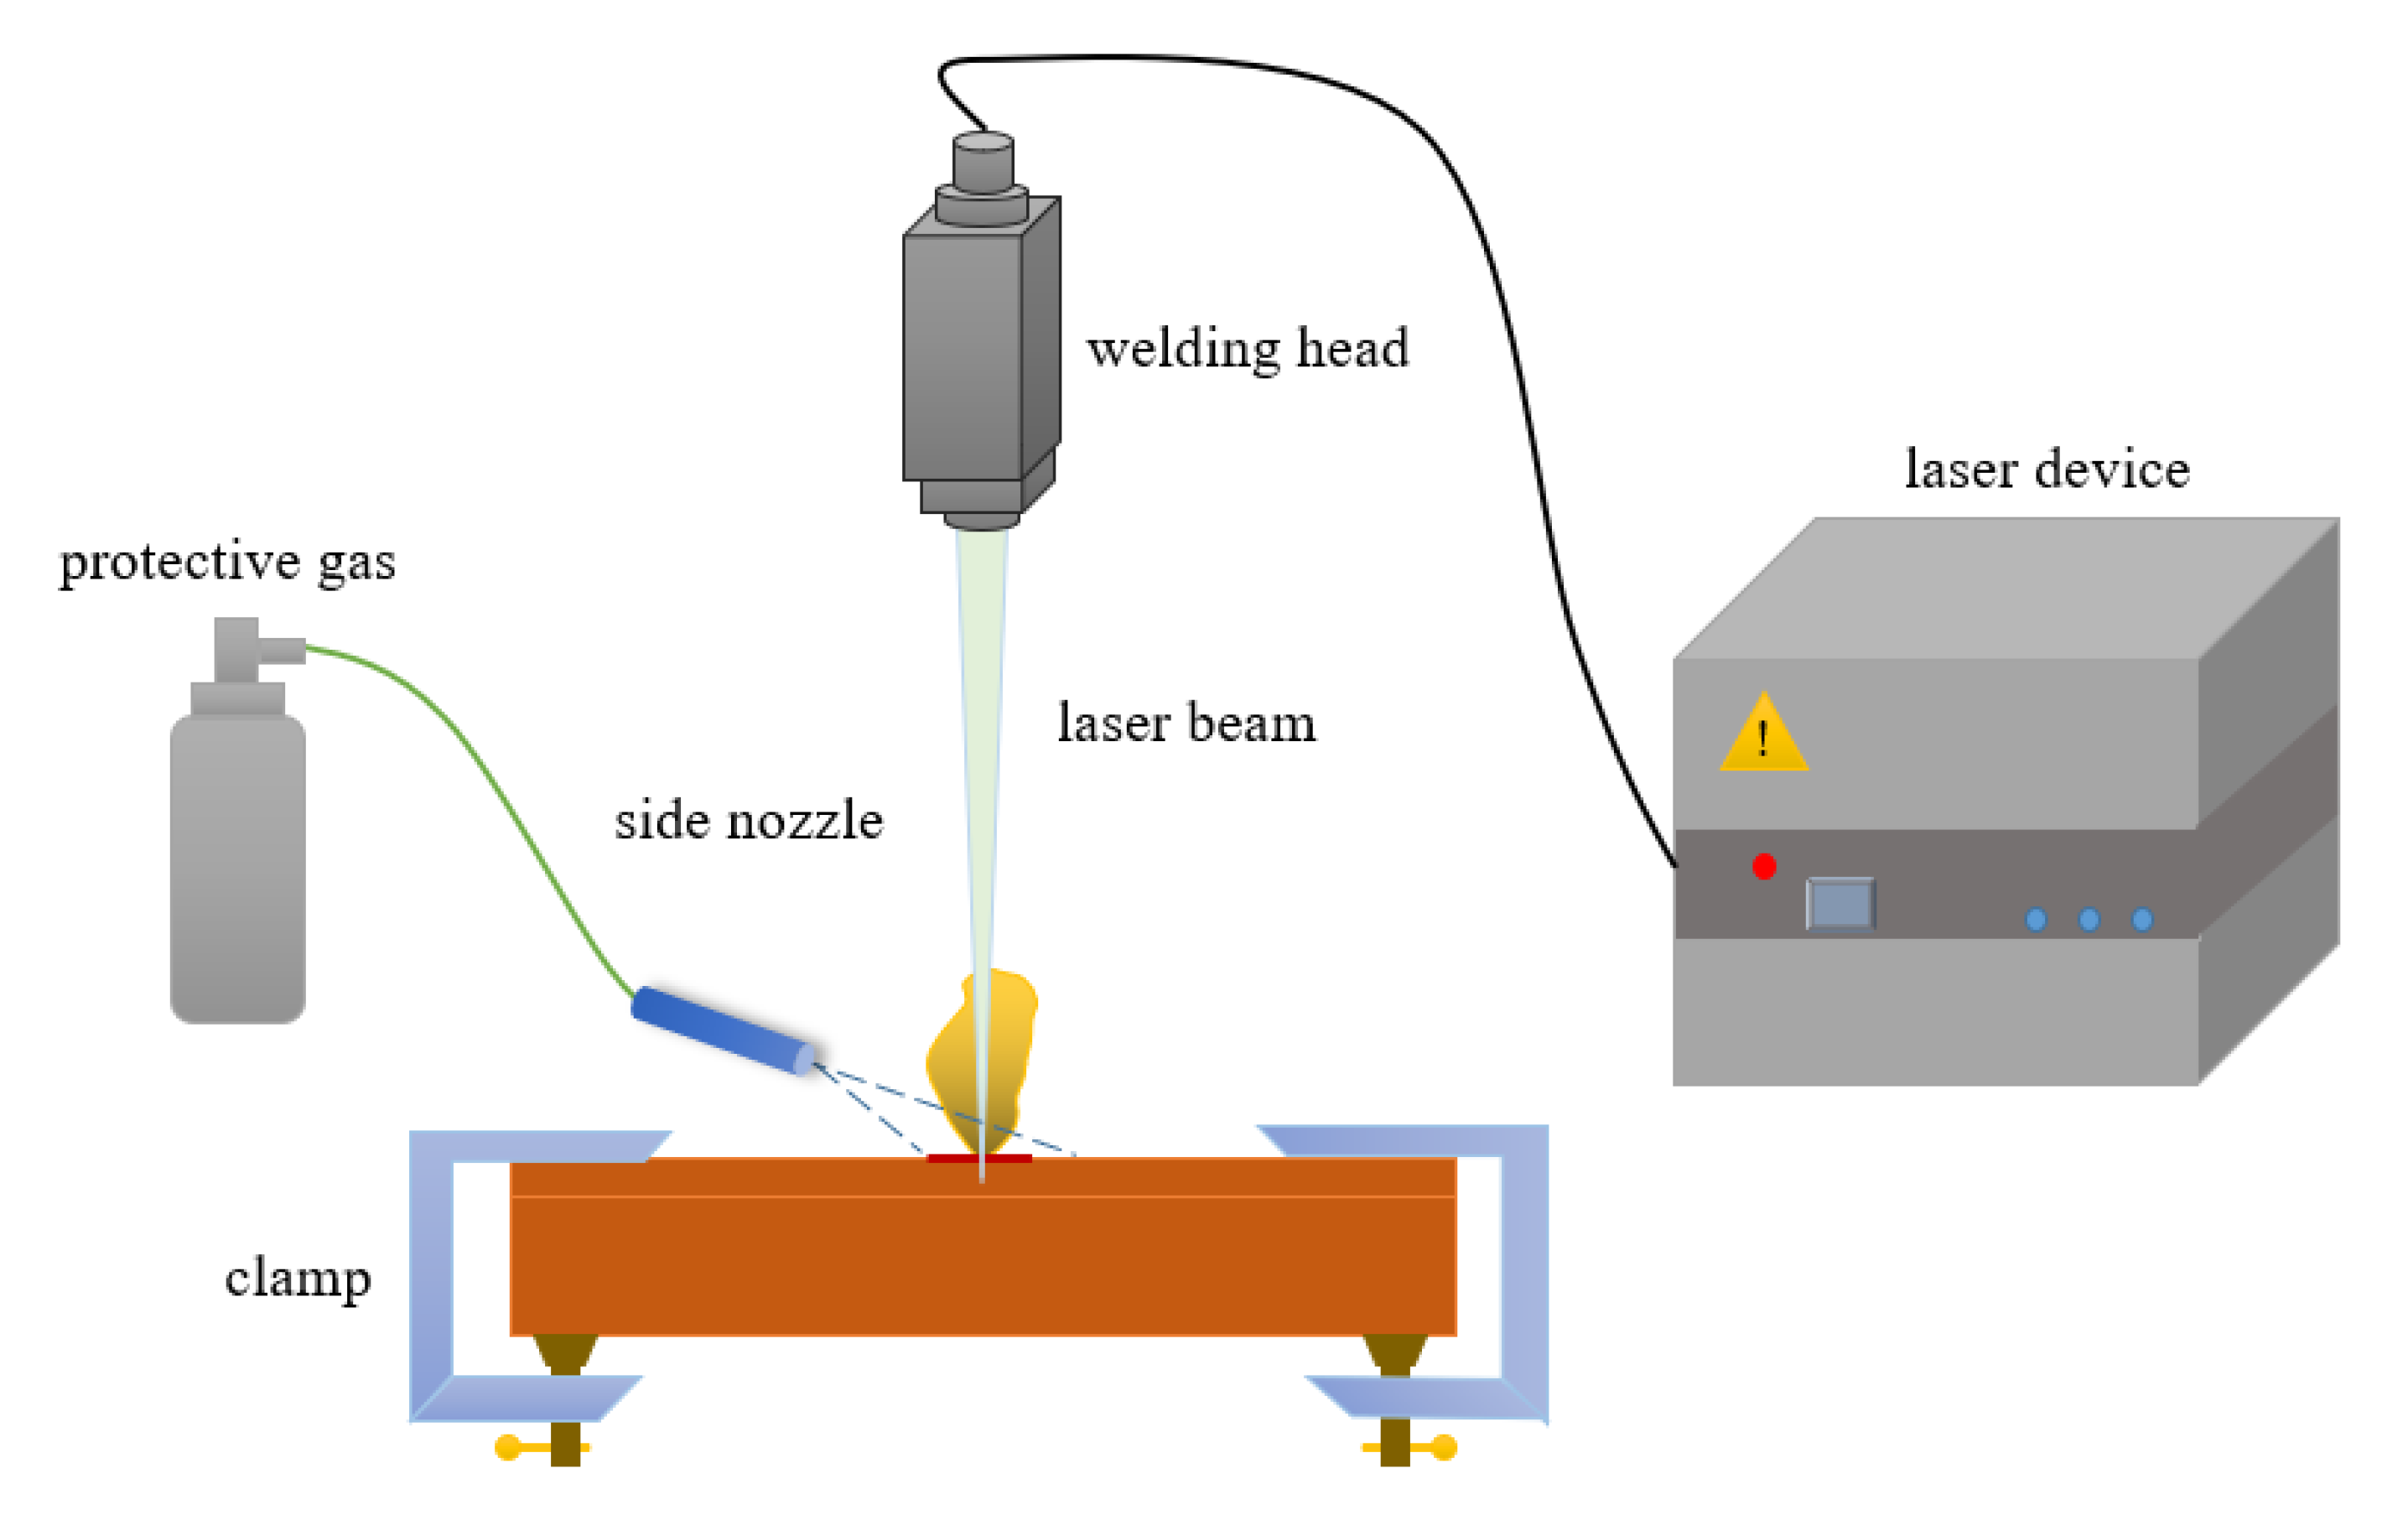
2.1. Experiments
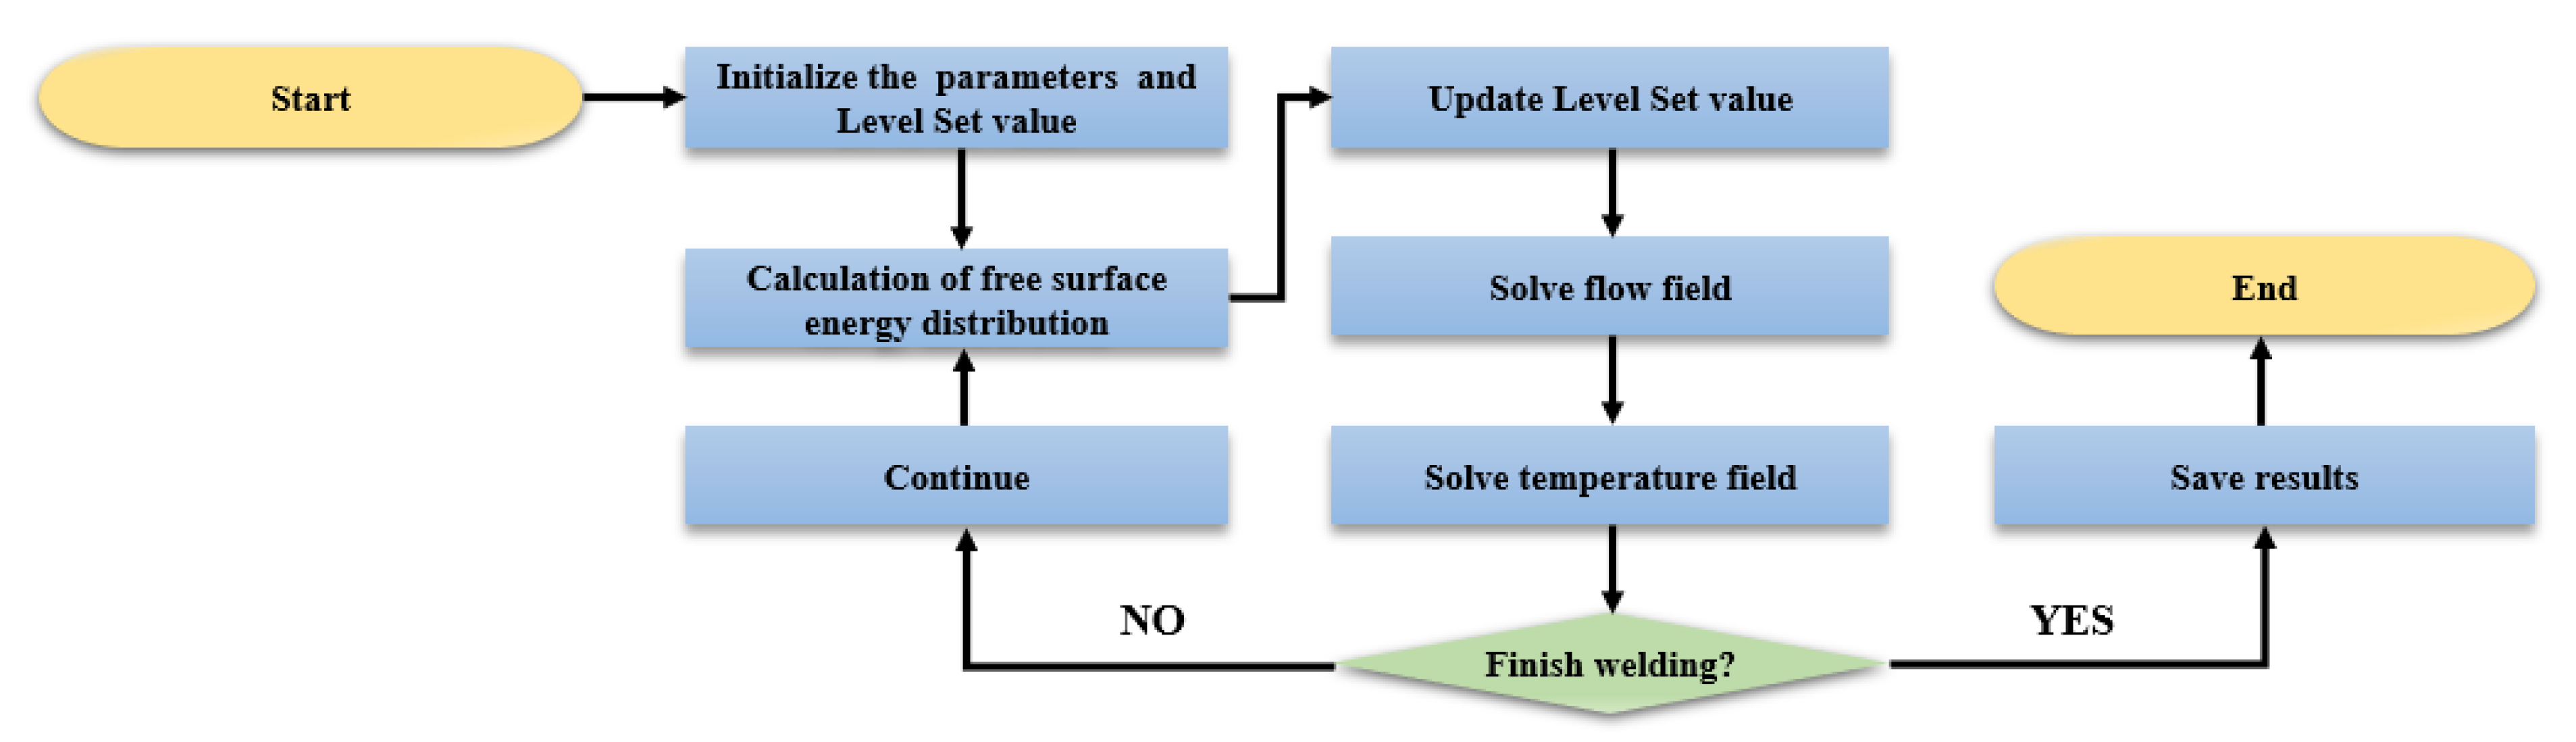
2.2. Numerical Simulation
3. Results and Discussion
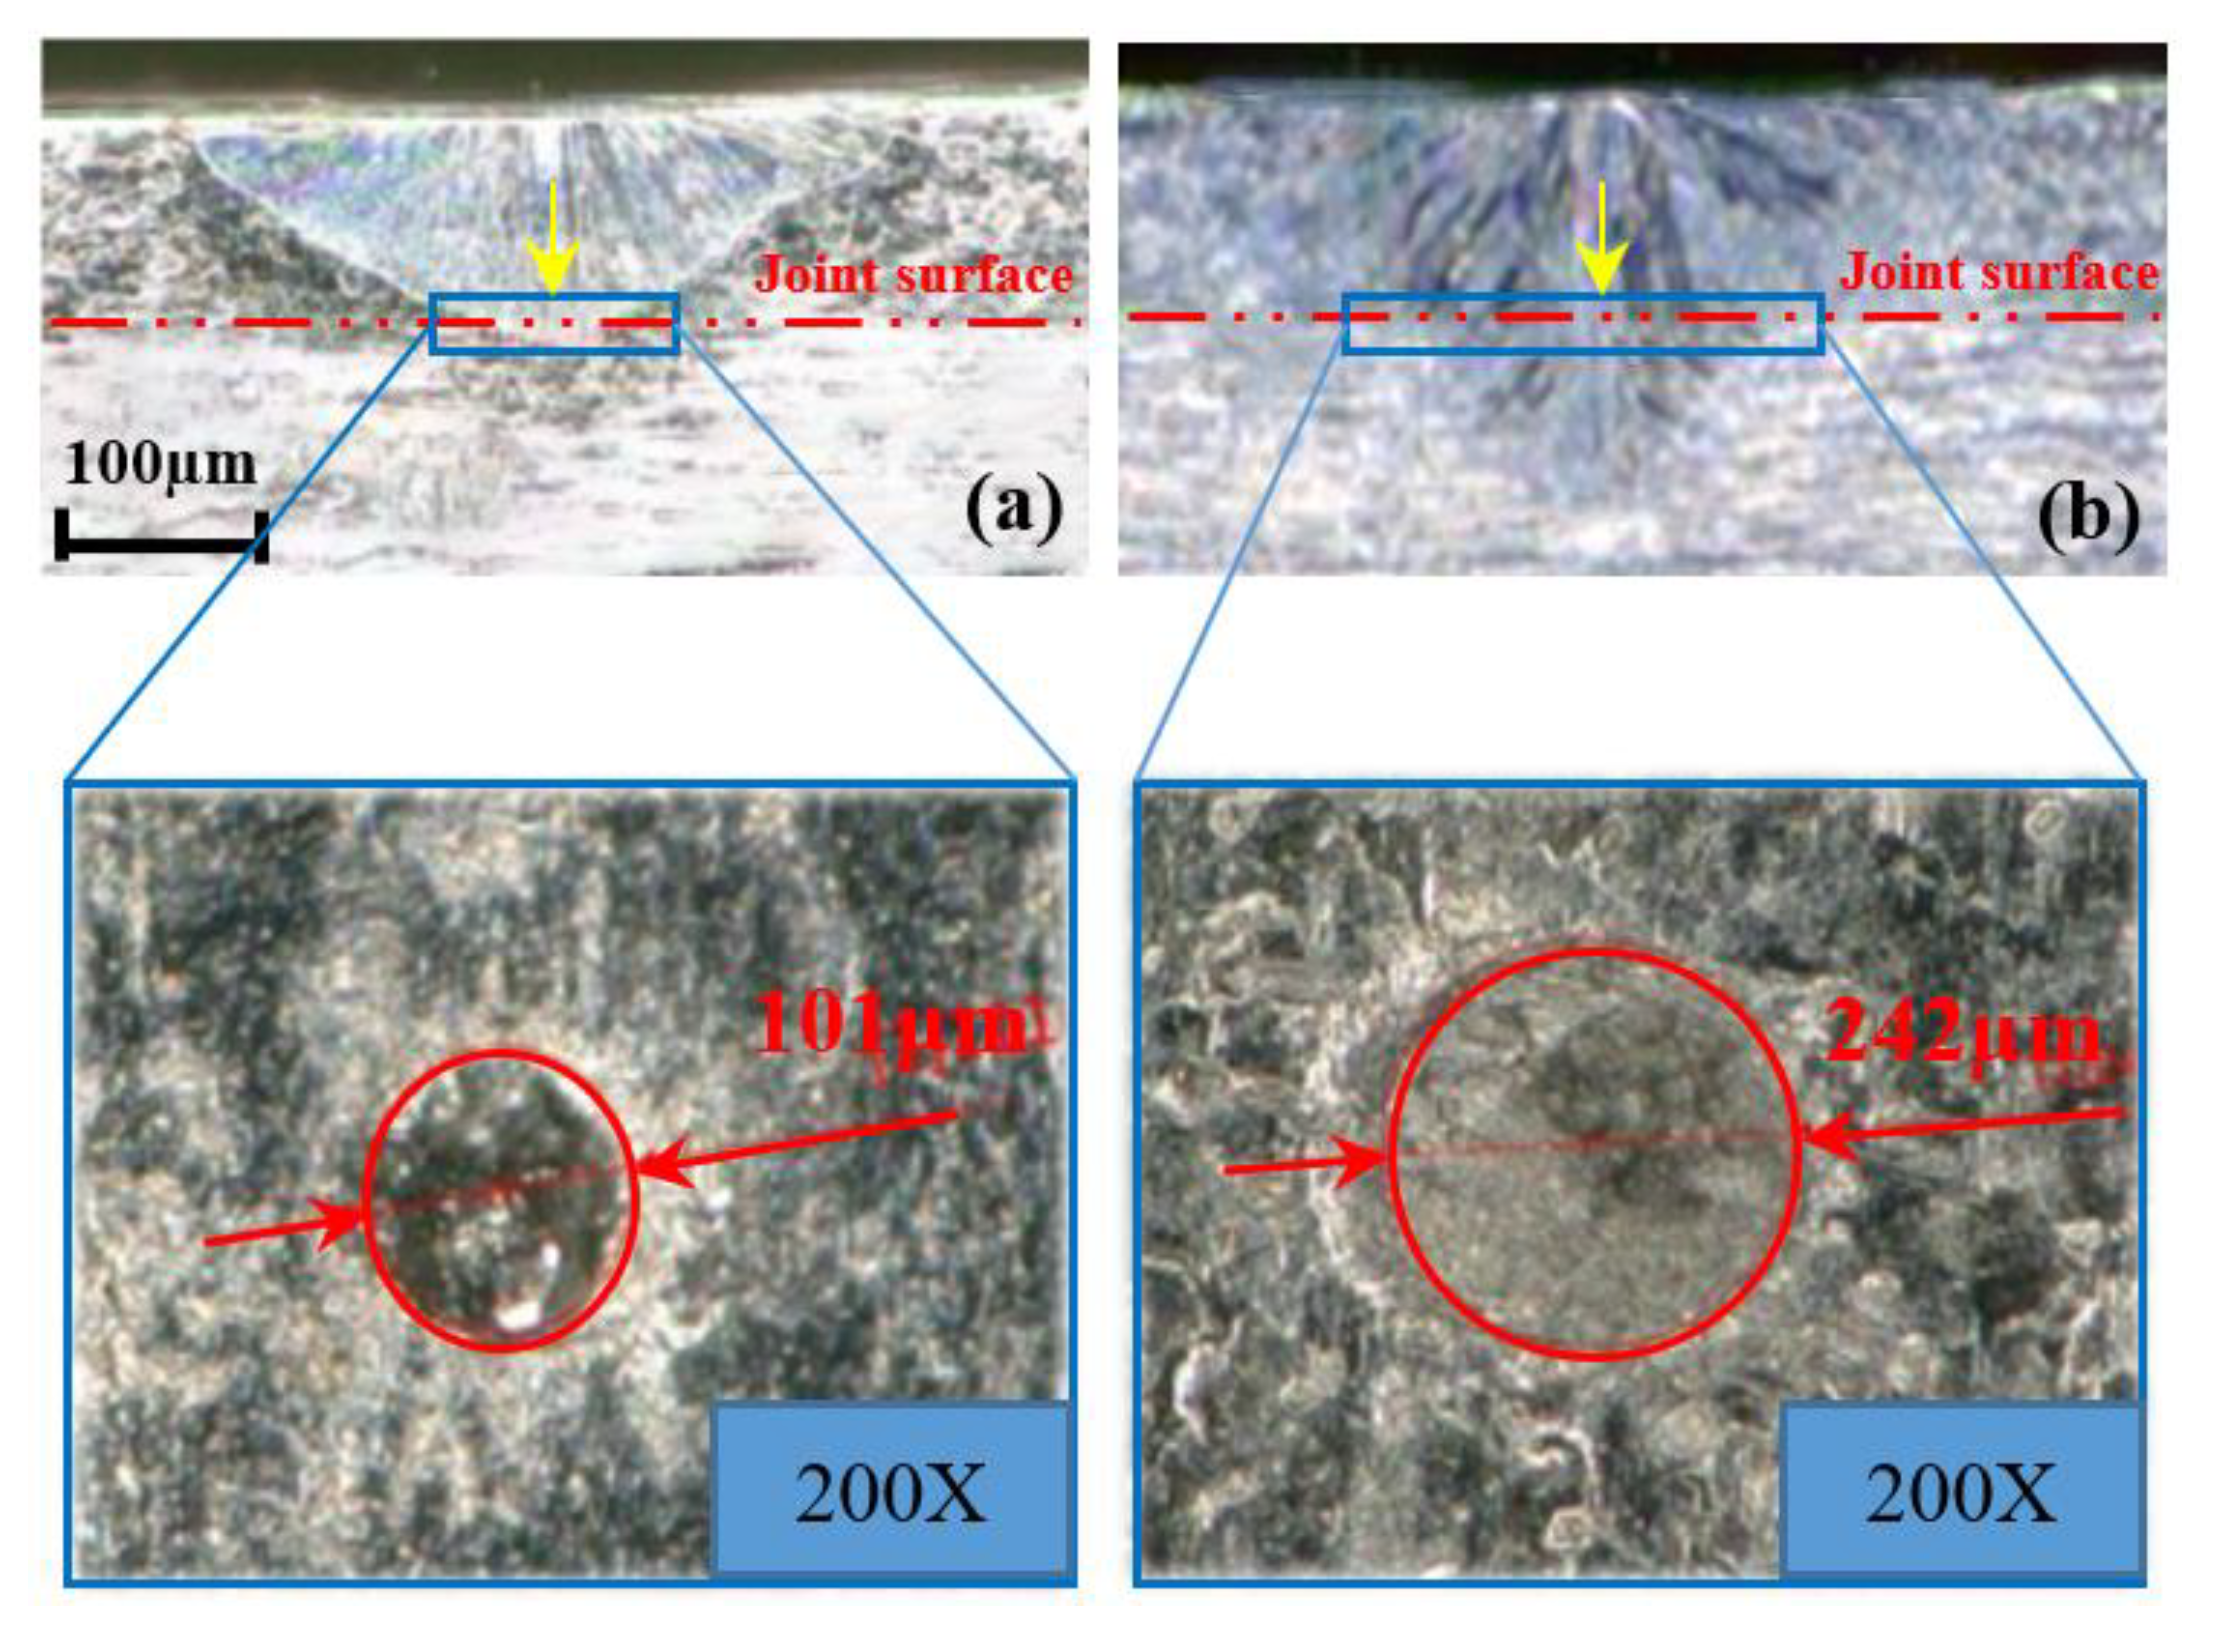
3.1. Experimental Results
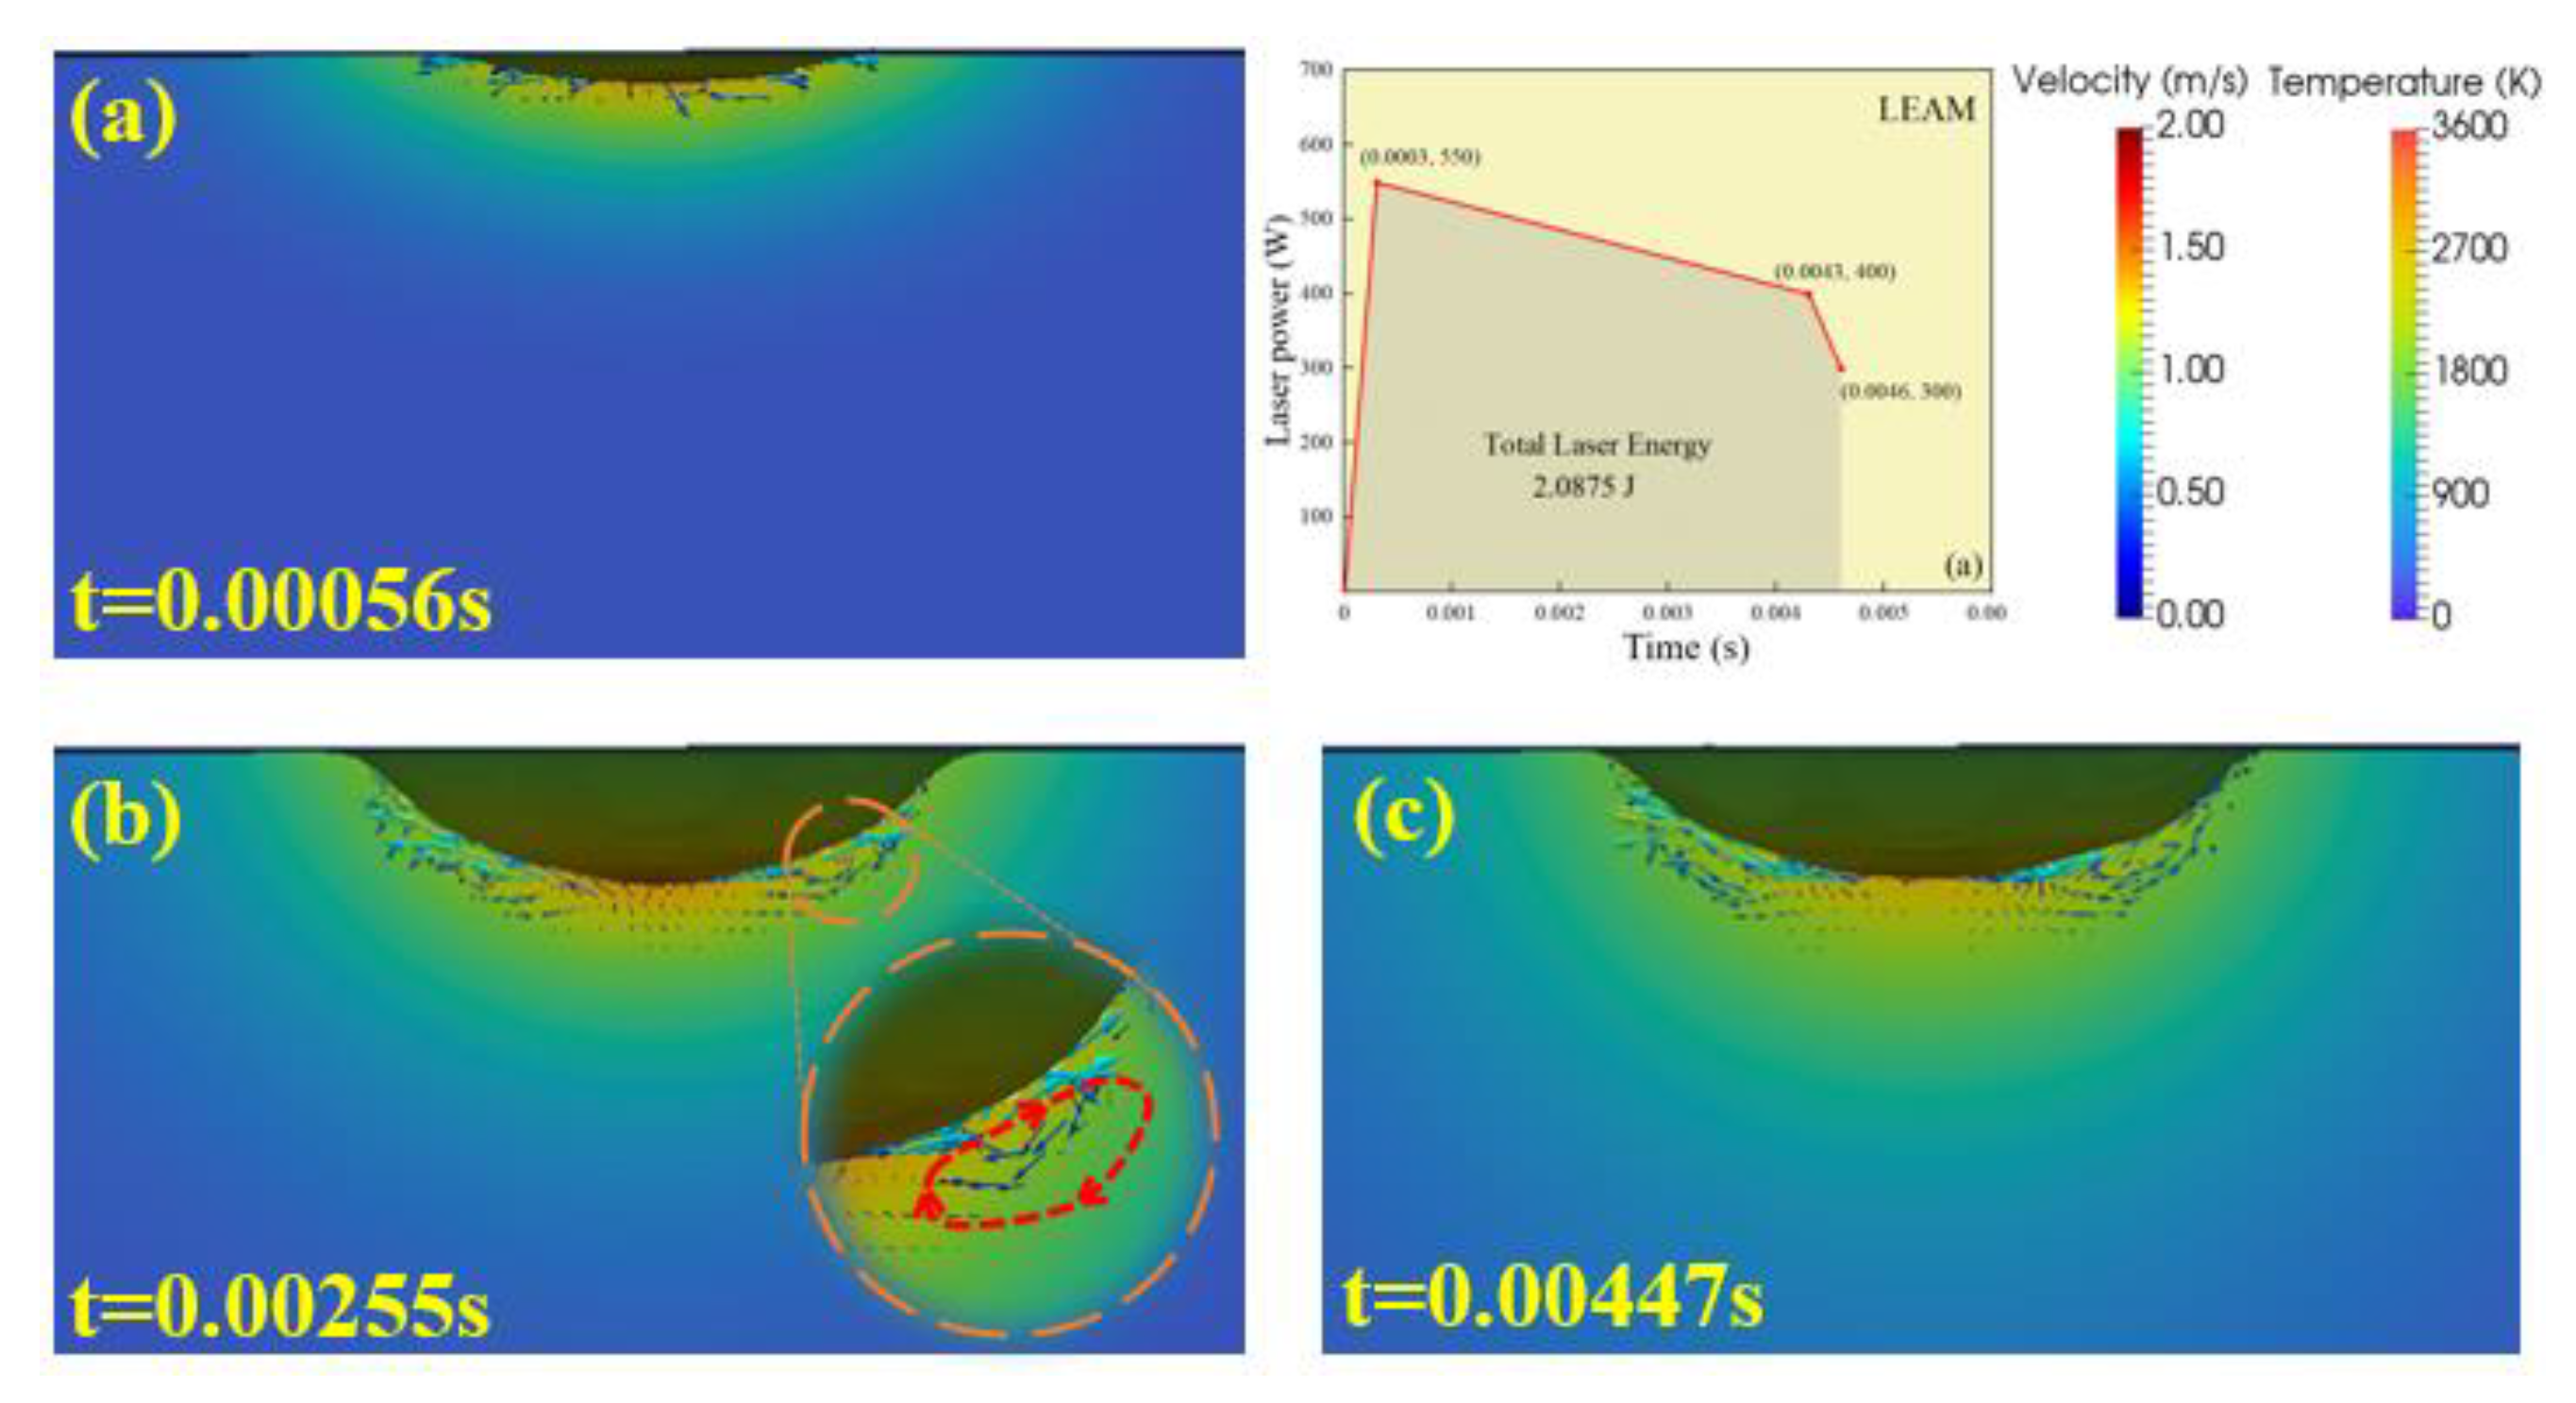
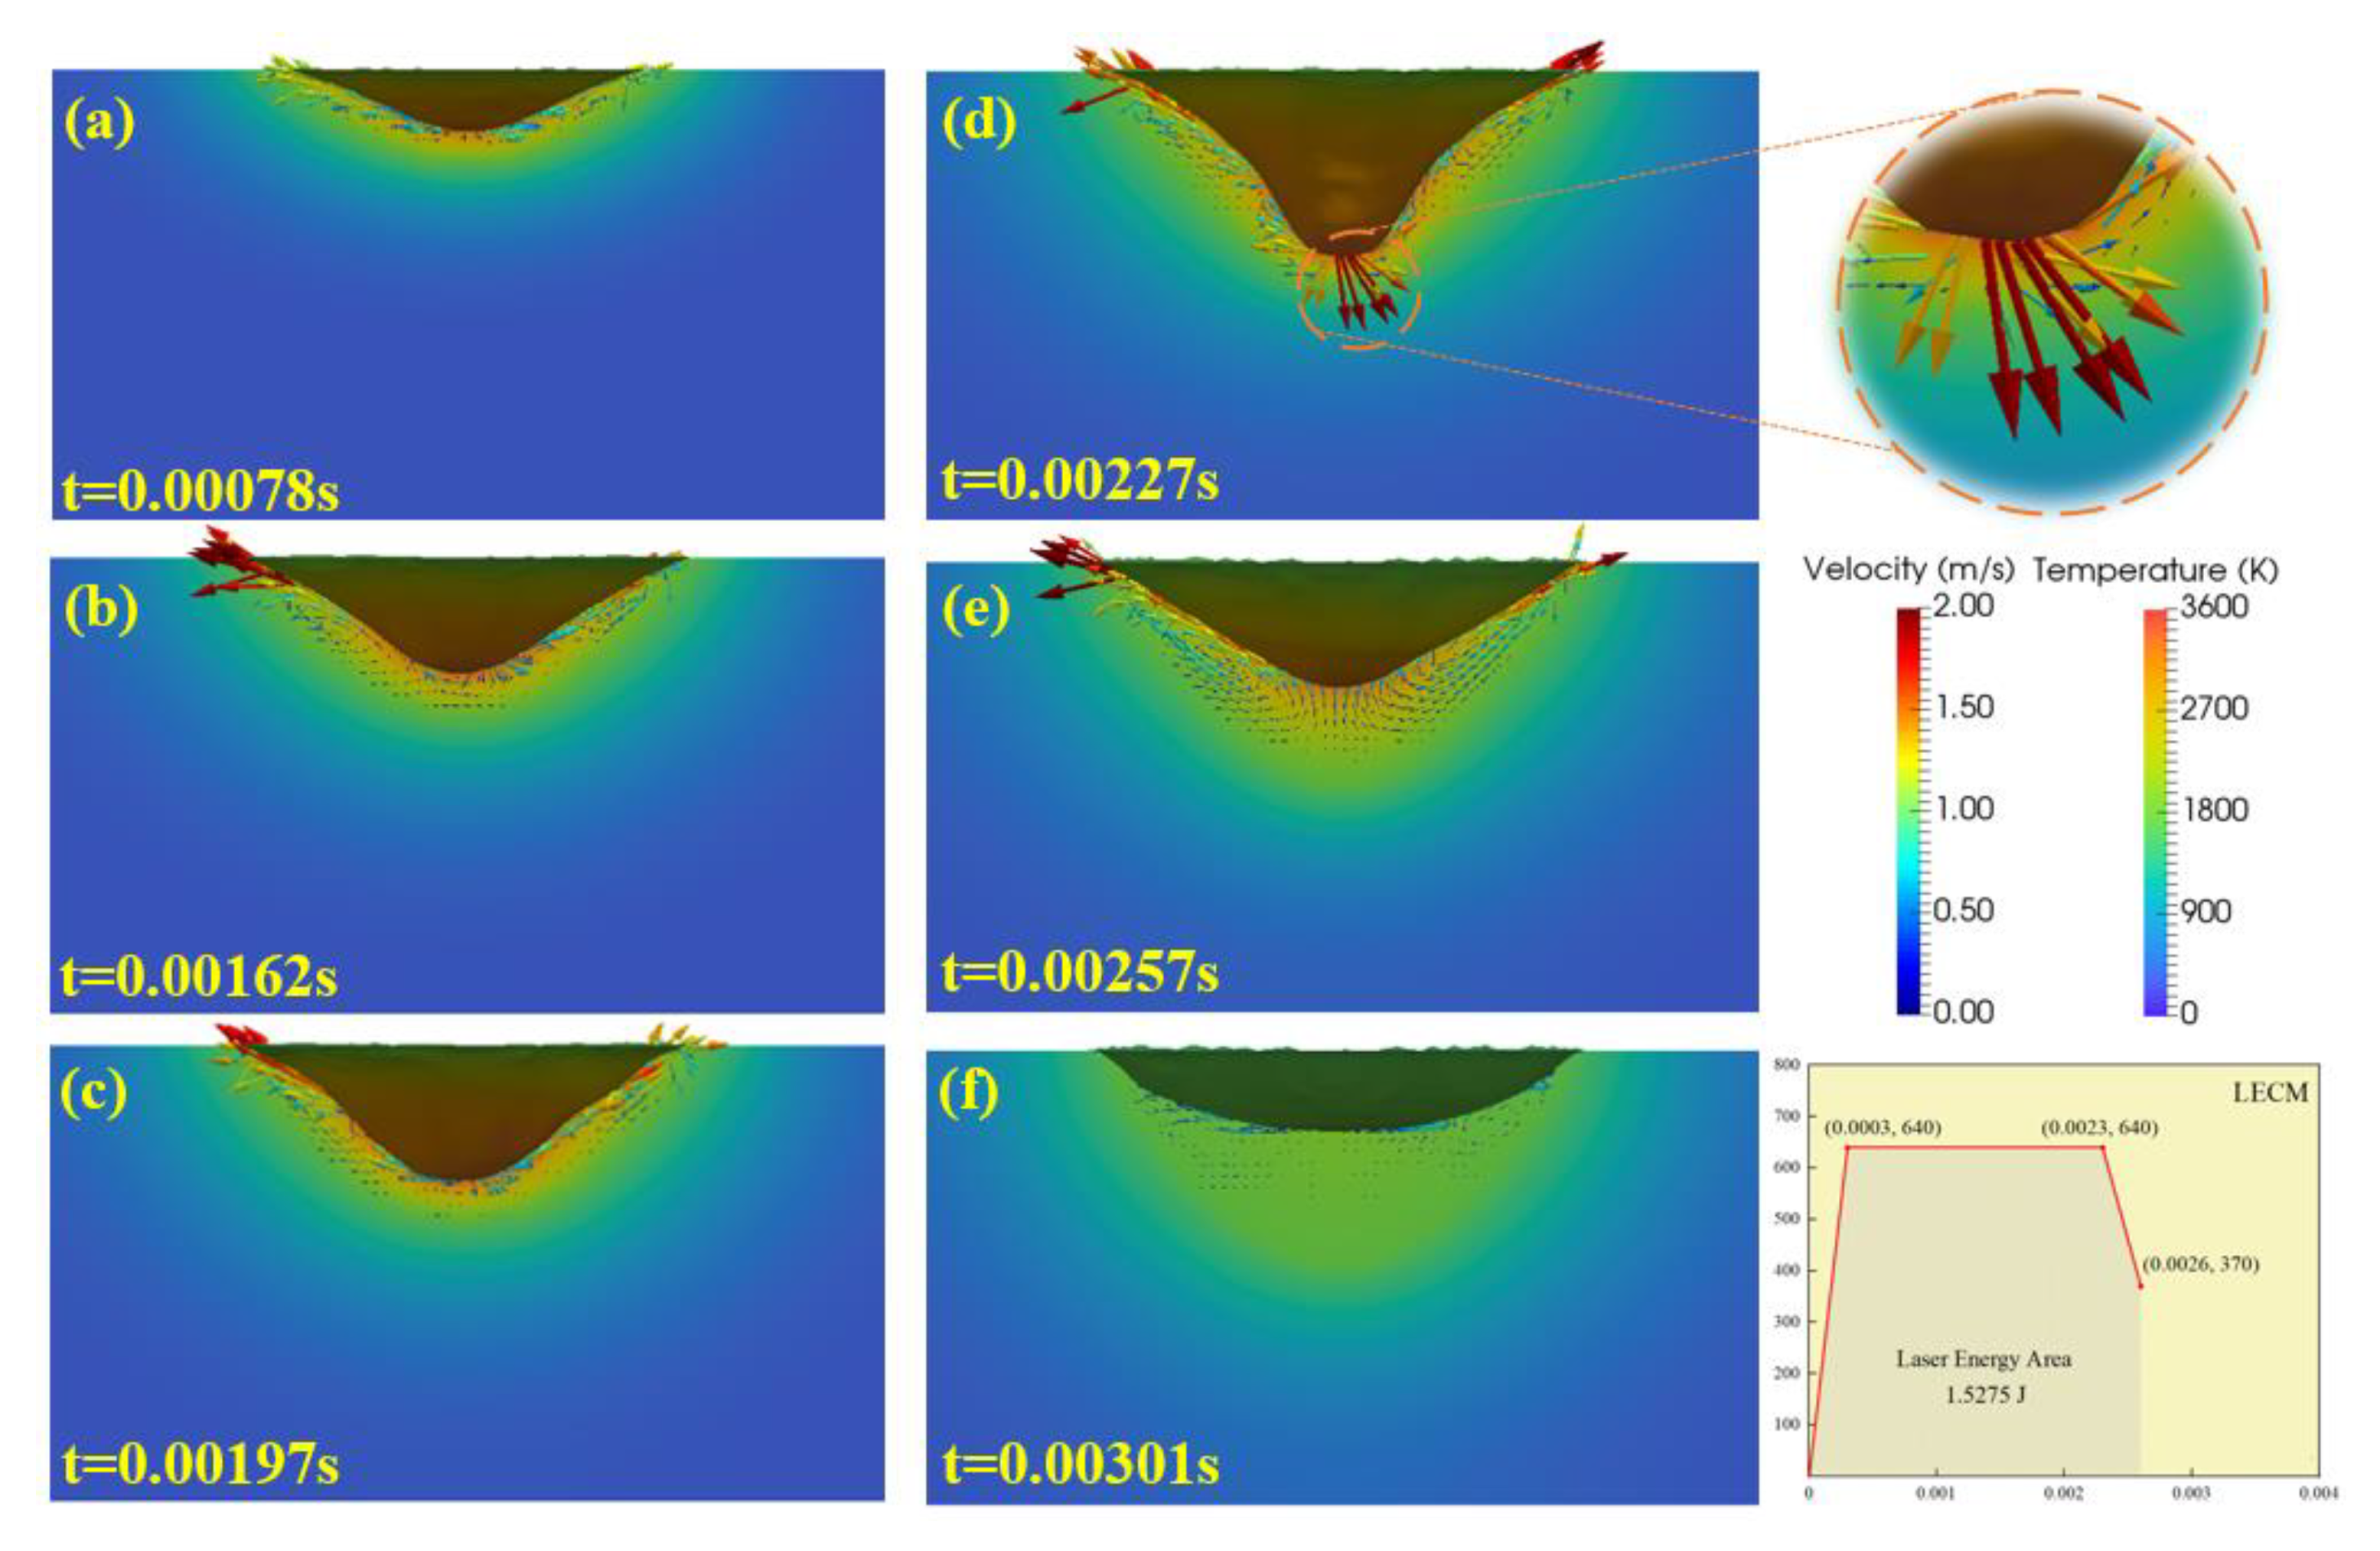
3.2. Simulation Results
3.3. Mechanism of the Difference in Weld Depth under Different Waveforms
3.4. Effective Optimization of the Laser Pulse Waveform
4. Conclusions
- (1)
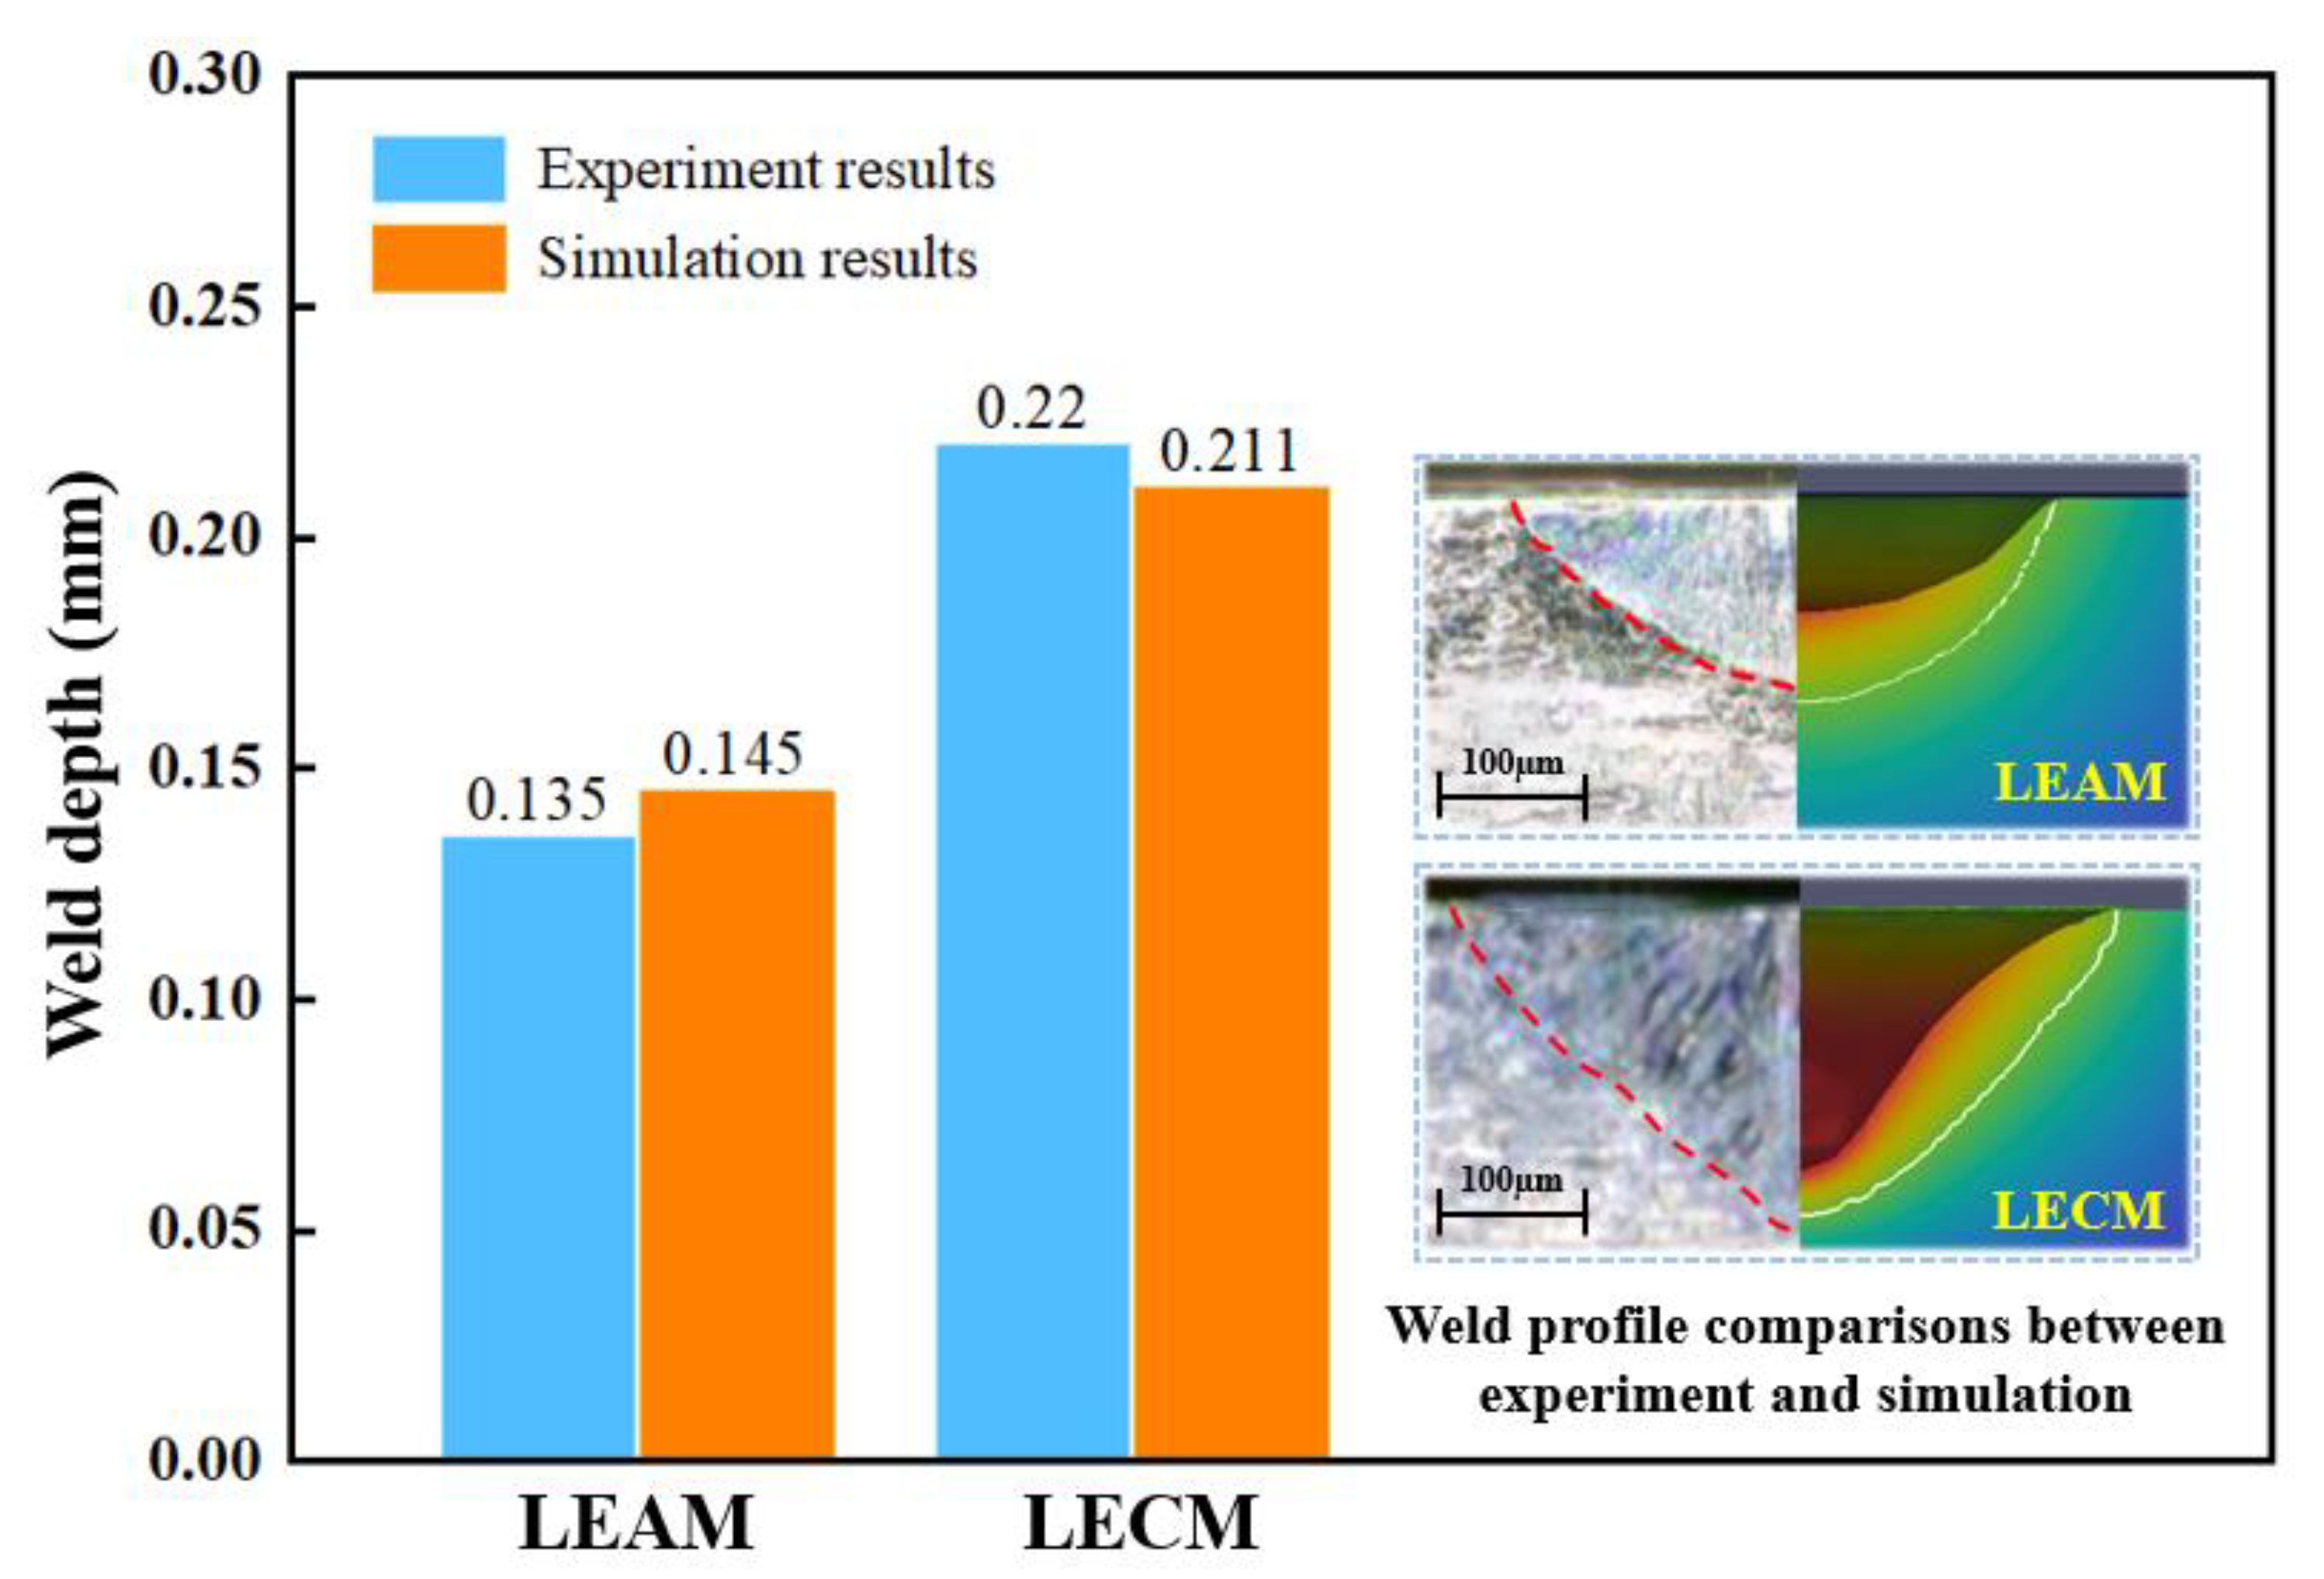
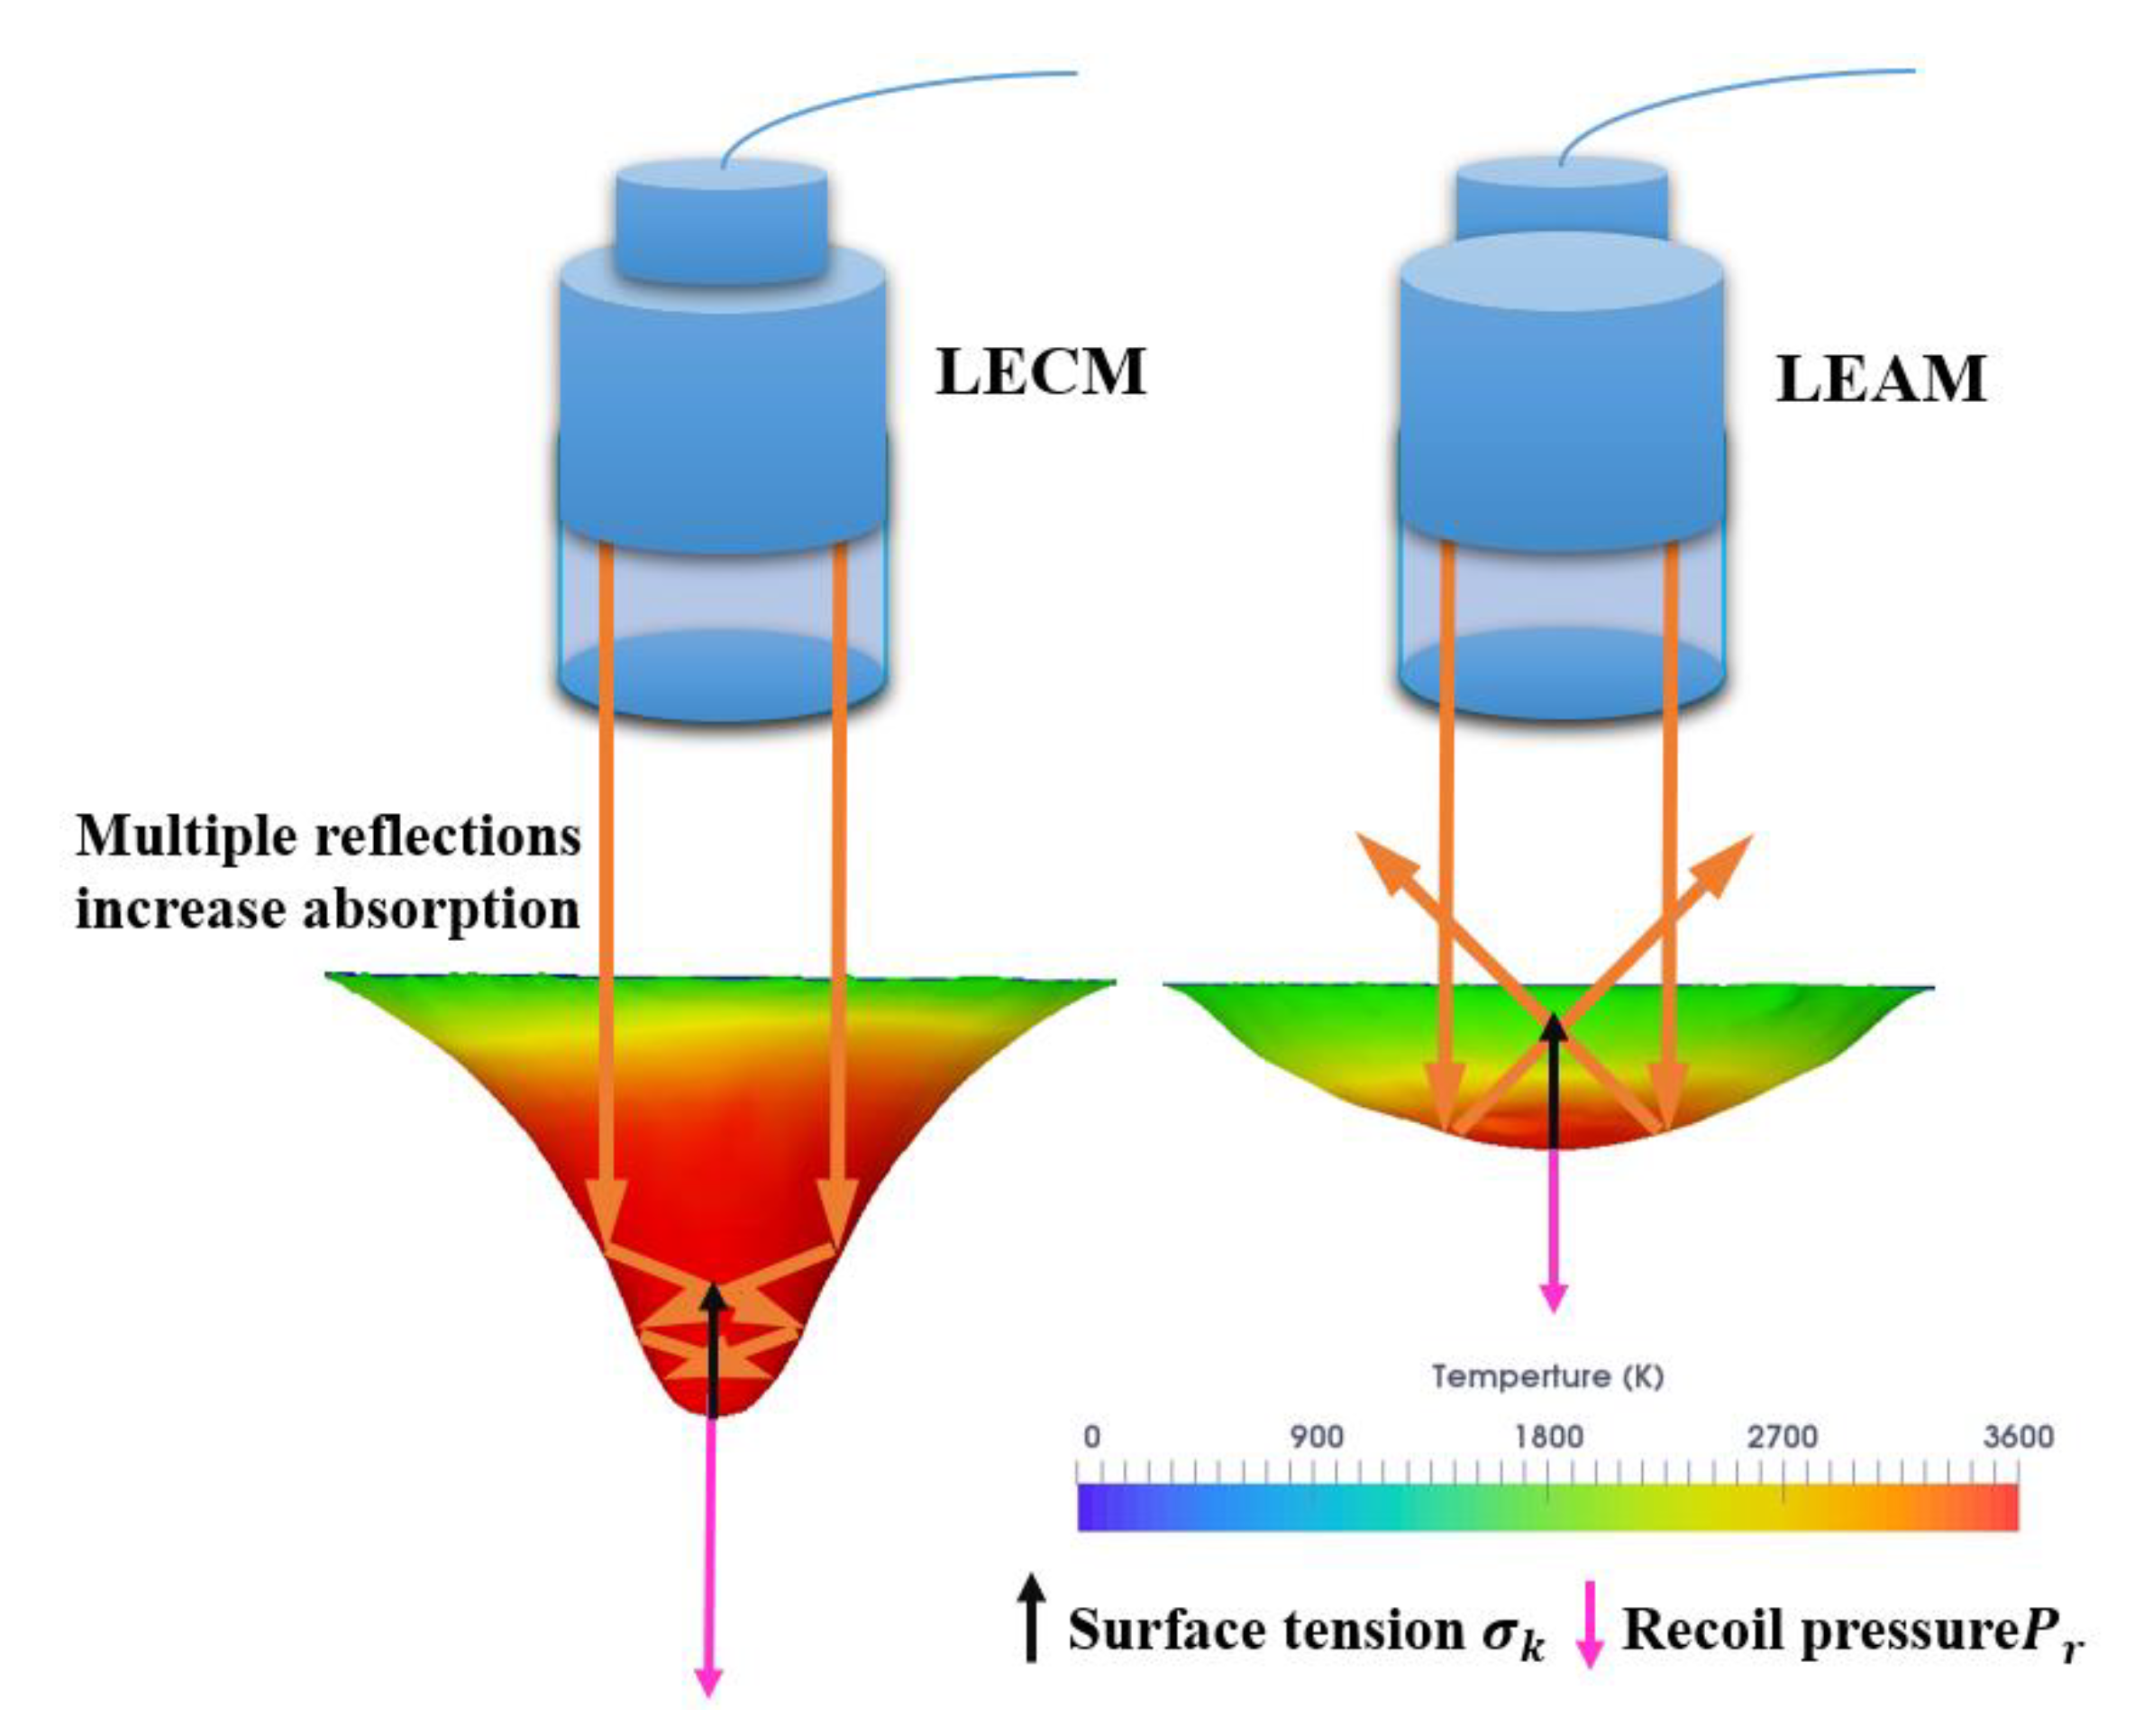
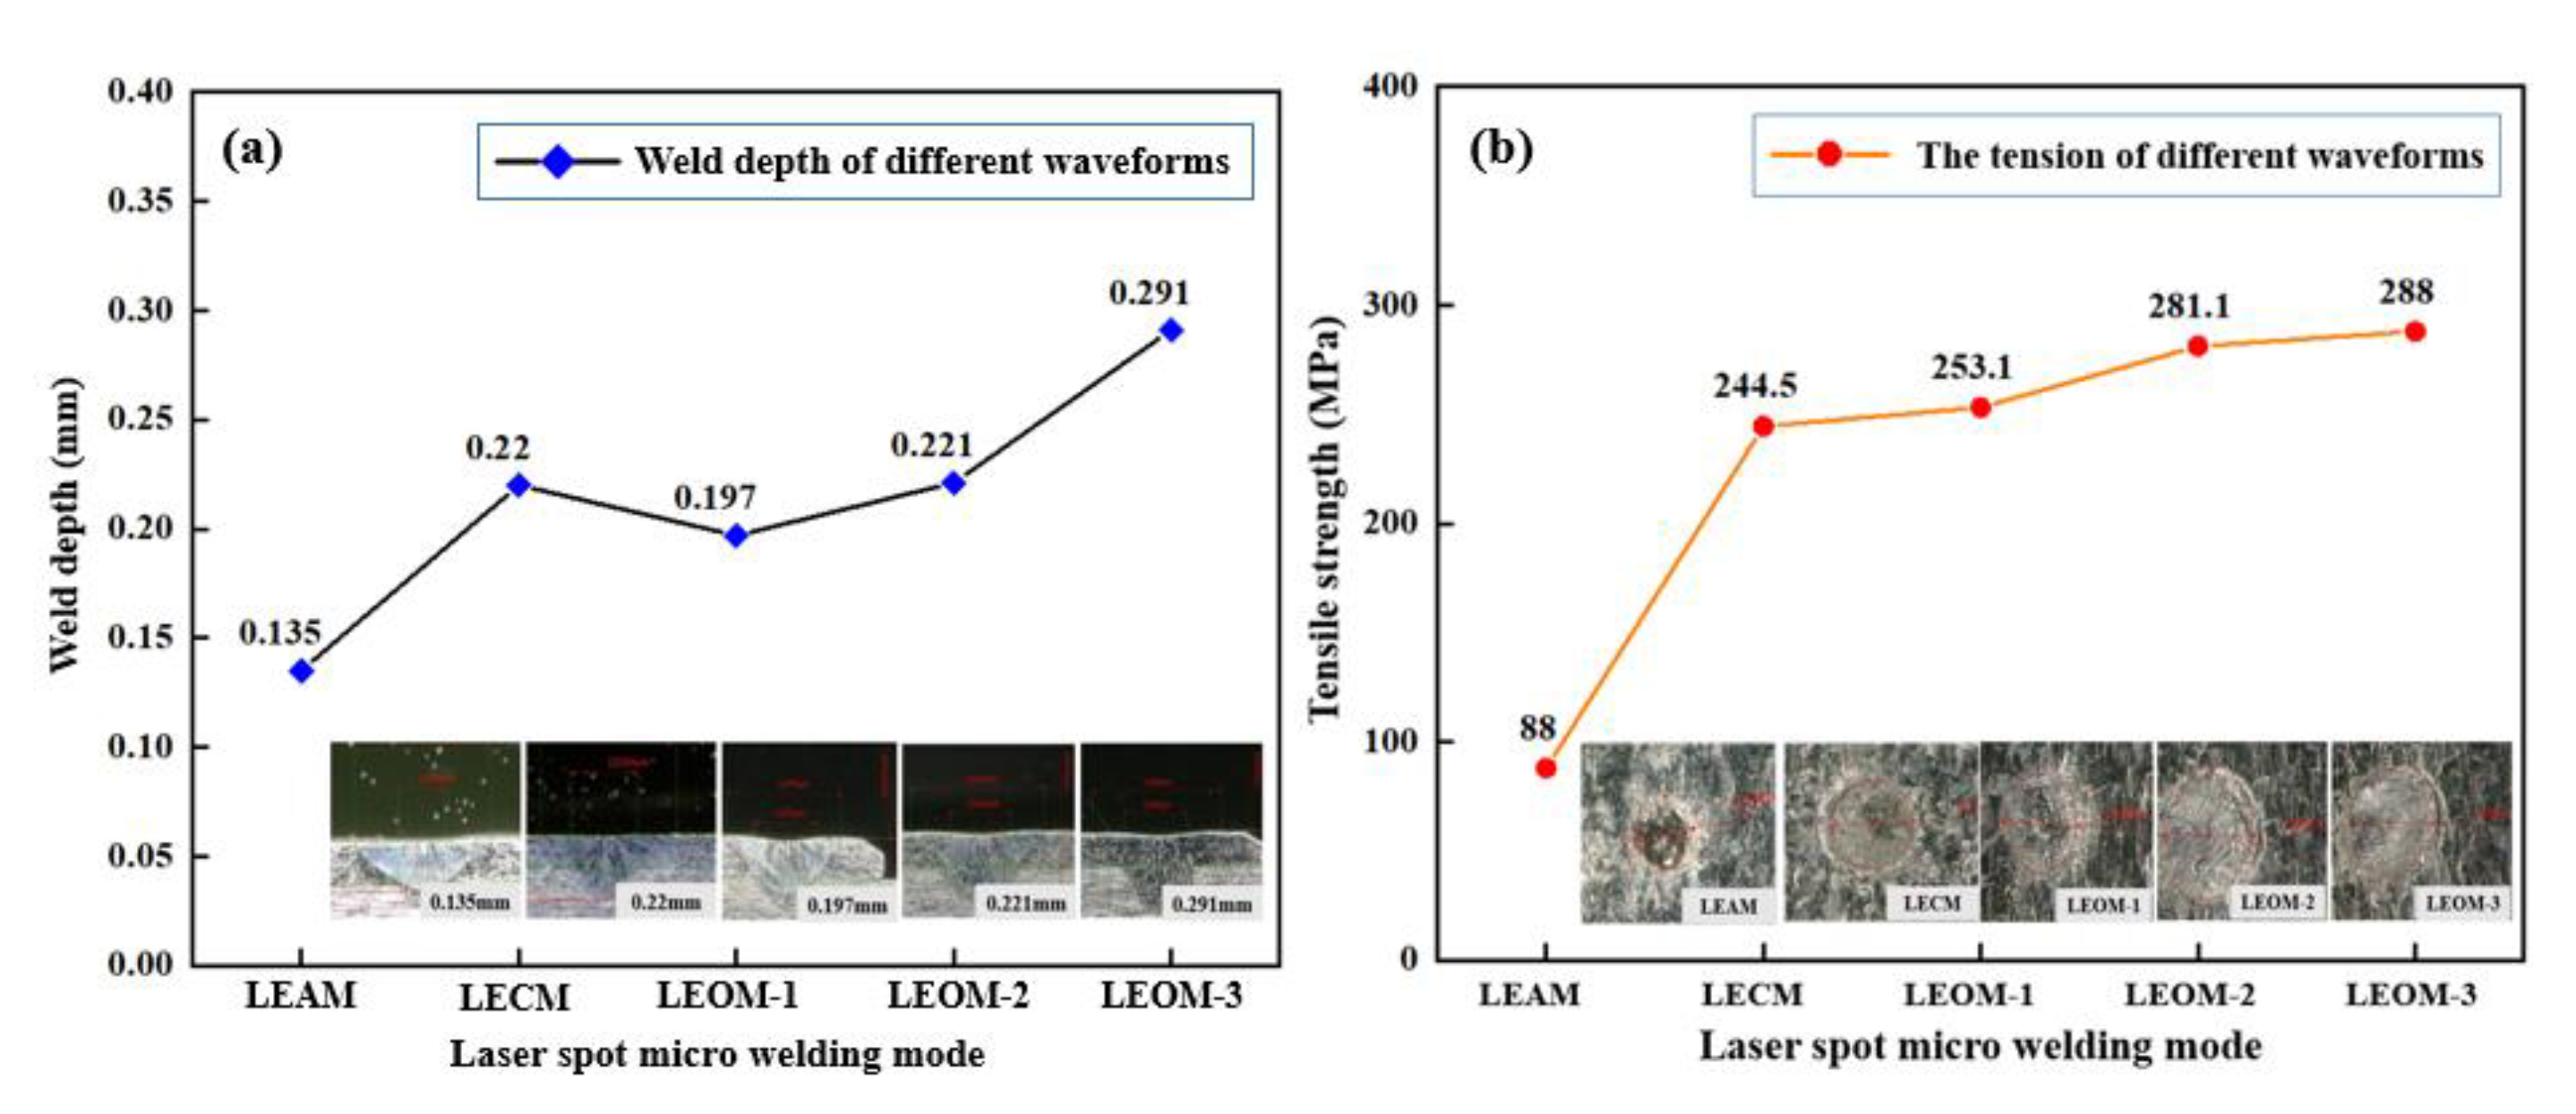
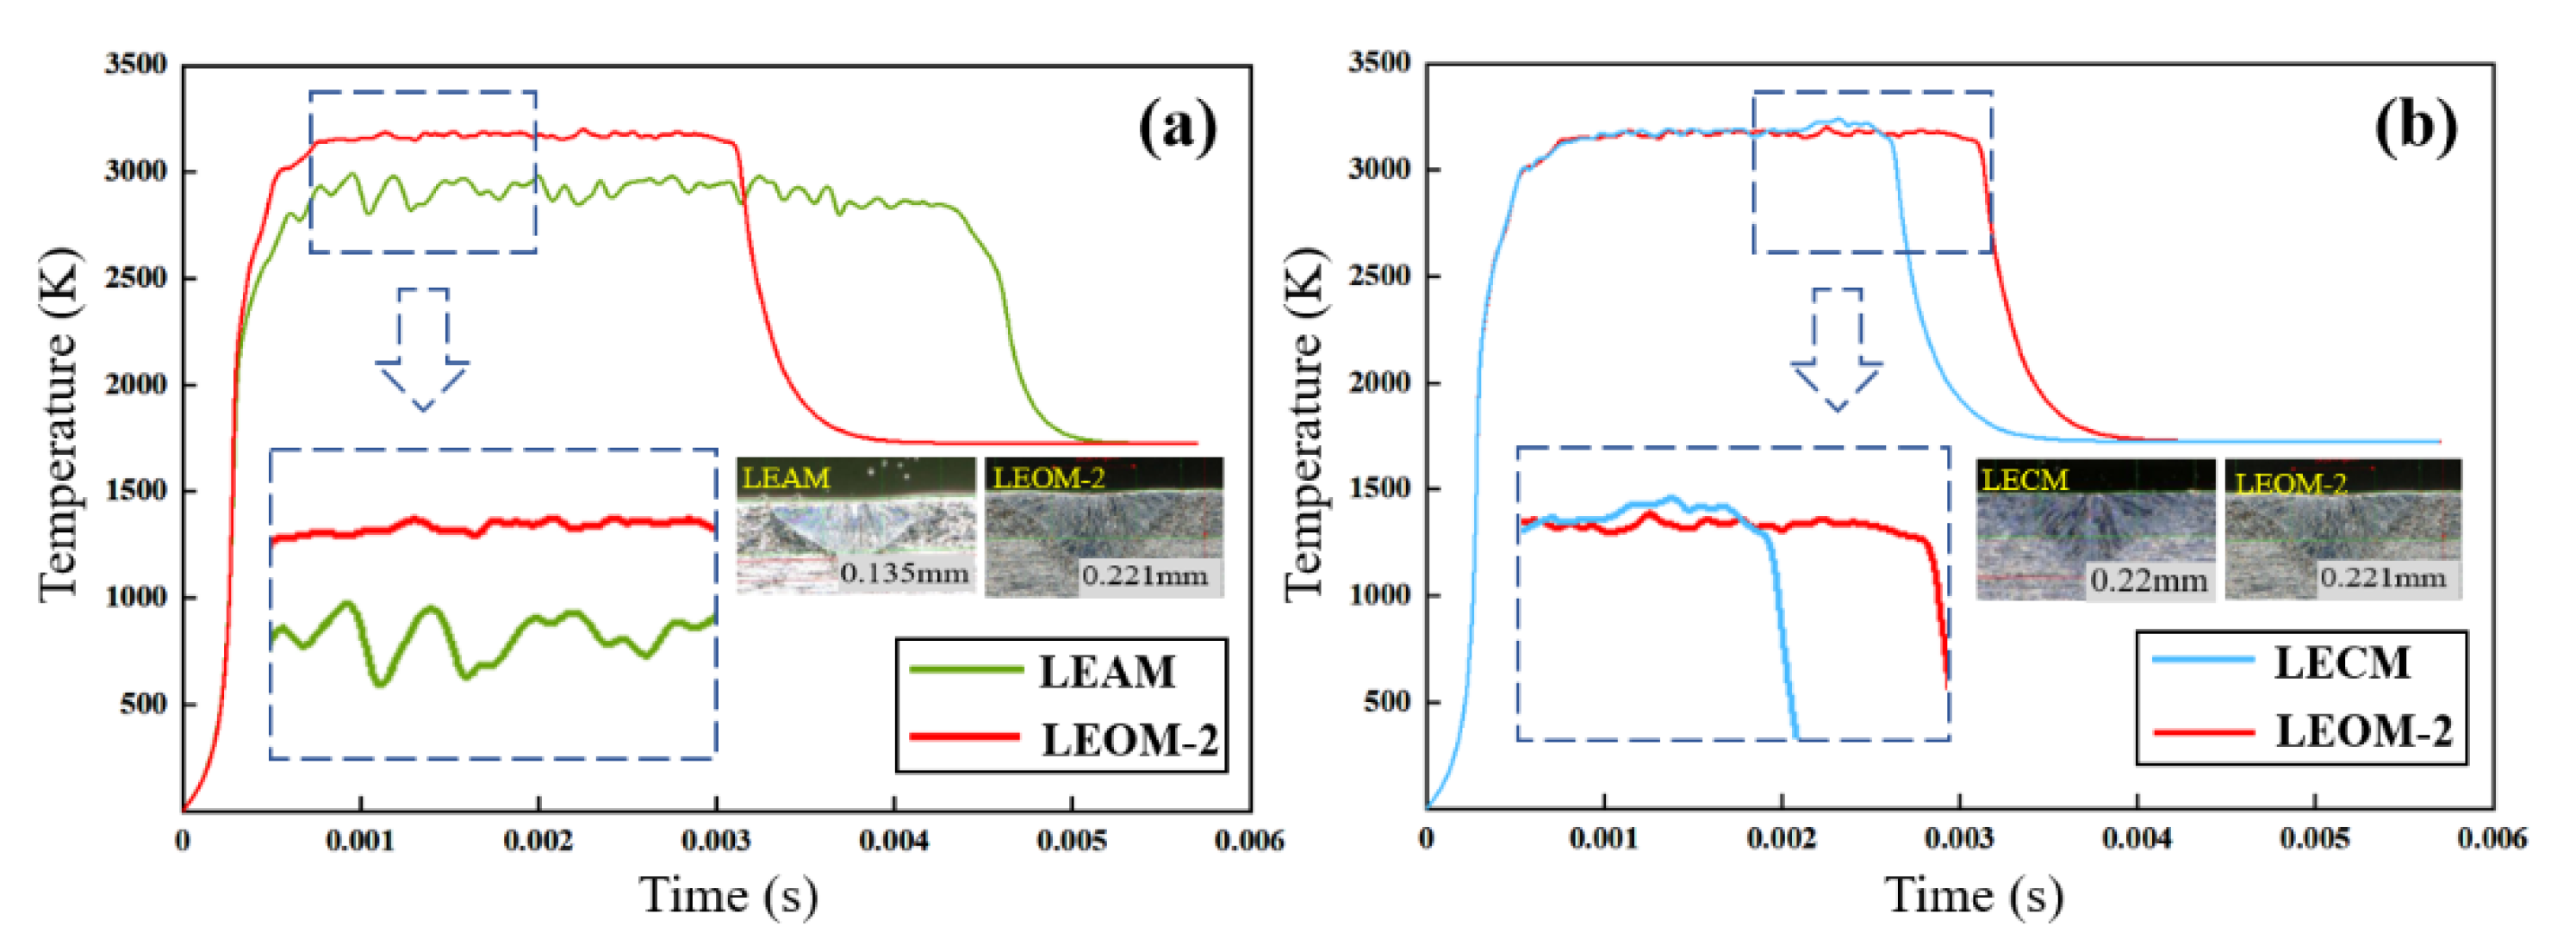
- This paper explores the micro-welding process of the LSMW through experimental and numerical simulation methods. The simulation results show that LECM is a keyhole welding mode, and LEAM tends to be a thermally conductive welding mode. The experimental results show that LECM with low laser input energy can obtain a greater weld depth than LEAM. The weld depth of LECM mode can reach 0.22 mm, while the weld depth of LEAM is 0.135 mm. The tensile strength of LECM mode can reach 244.5 MPa, which is much greater than that of LEAM mode at 88 MPa. Both experimental and simulation results show that LECM mode has better welding performance than LEAM.
- (2)
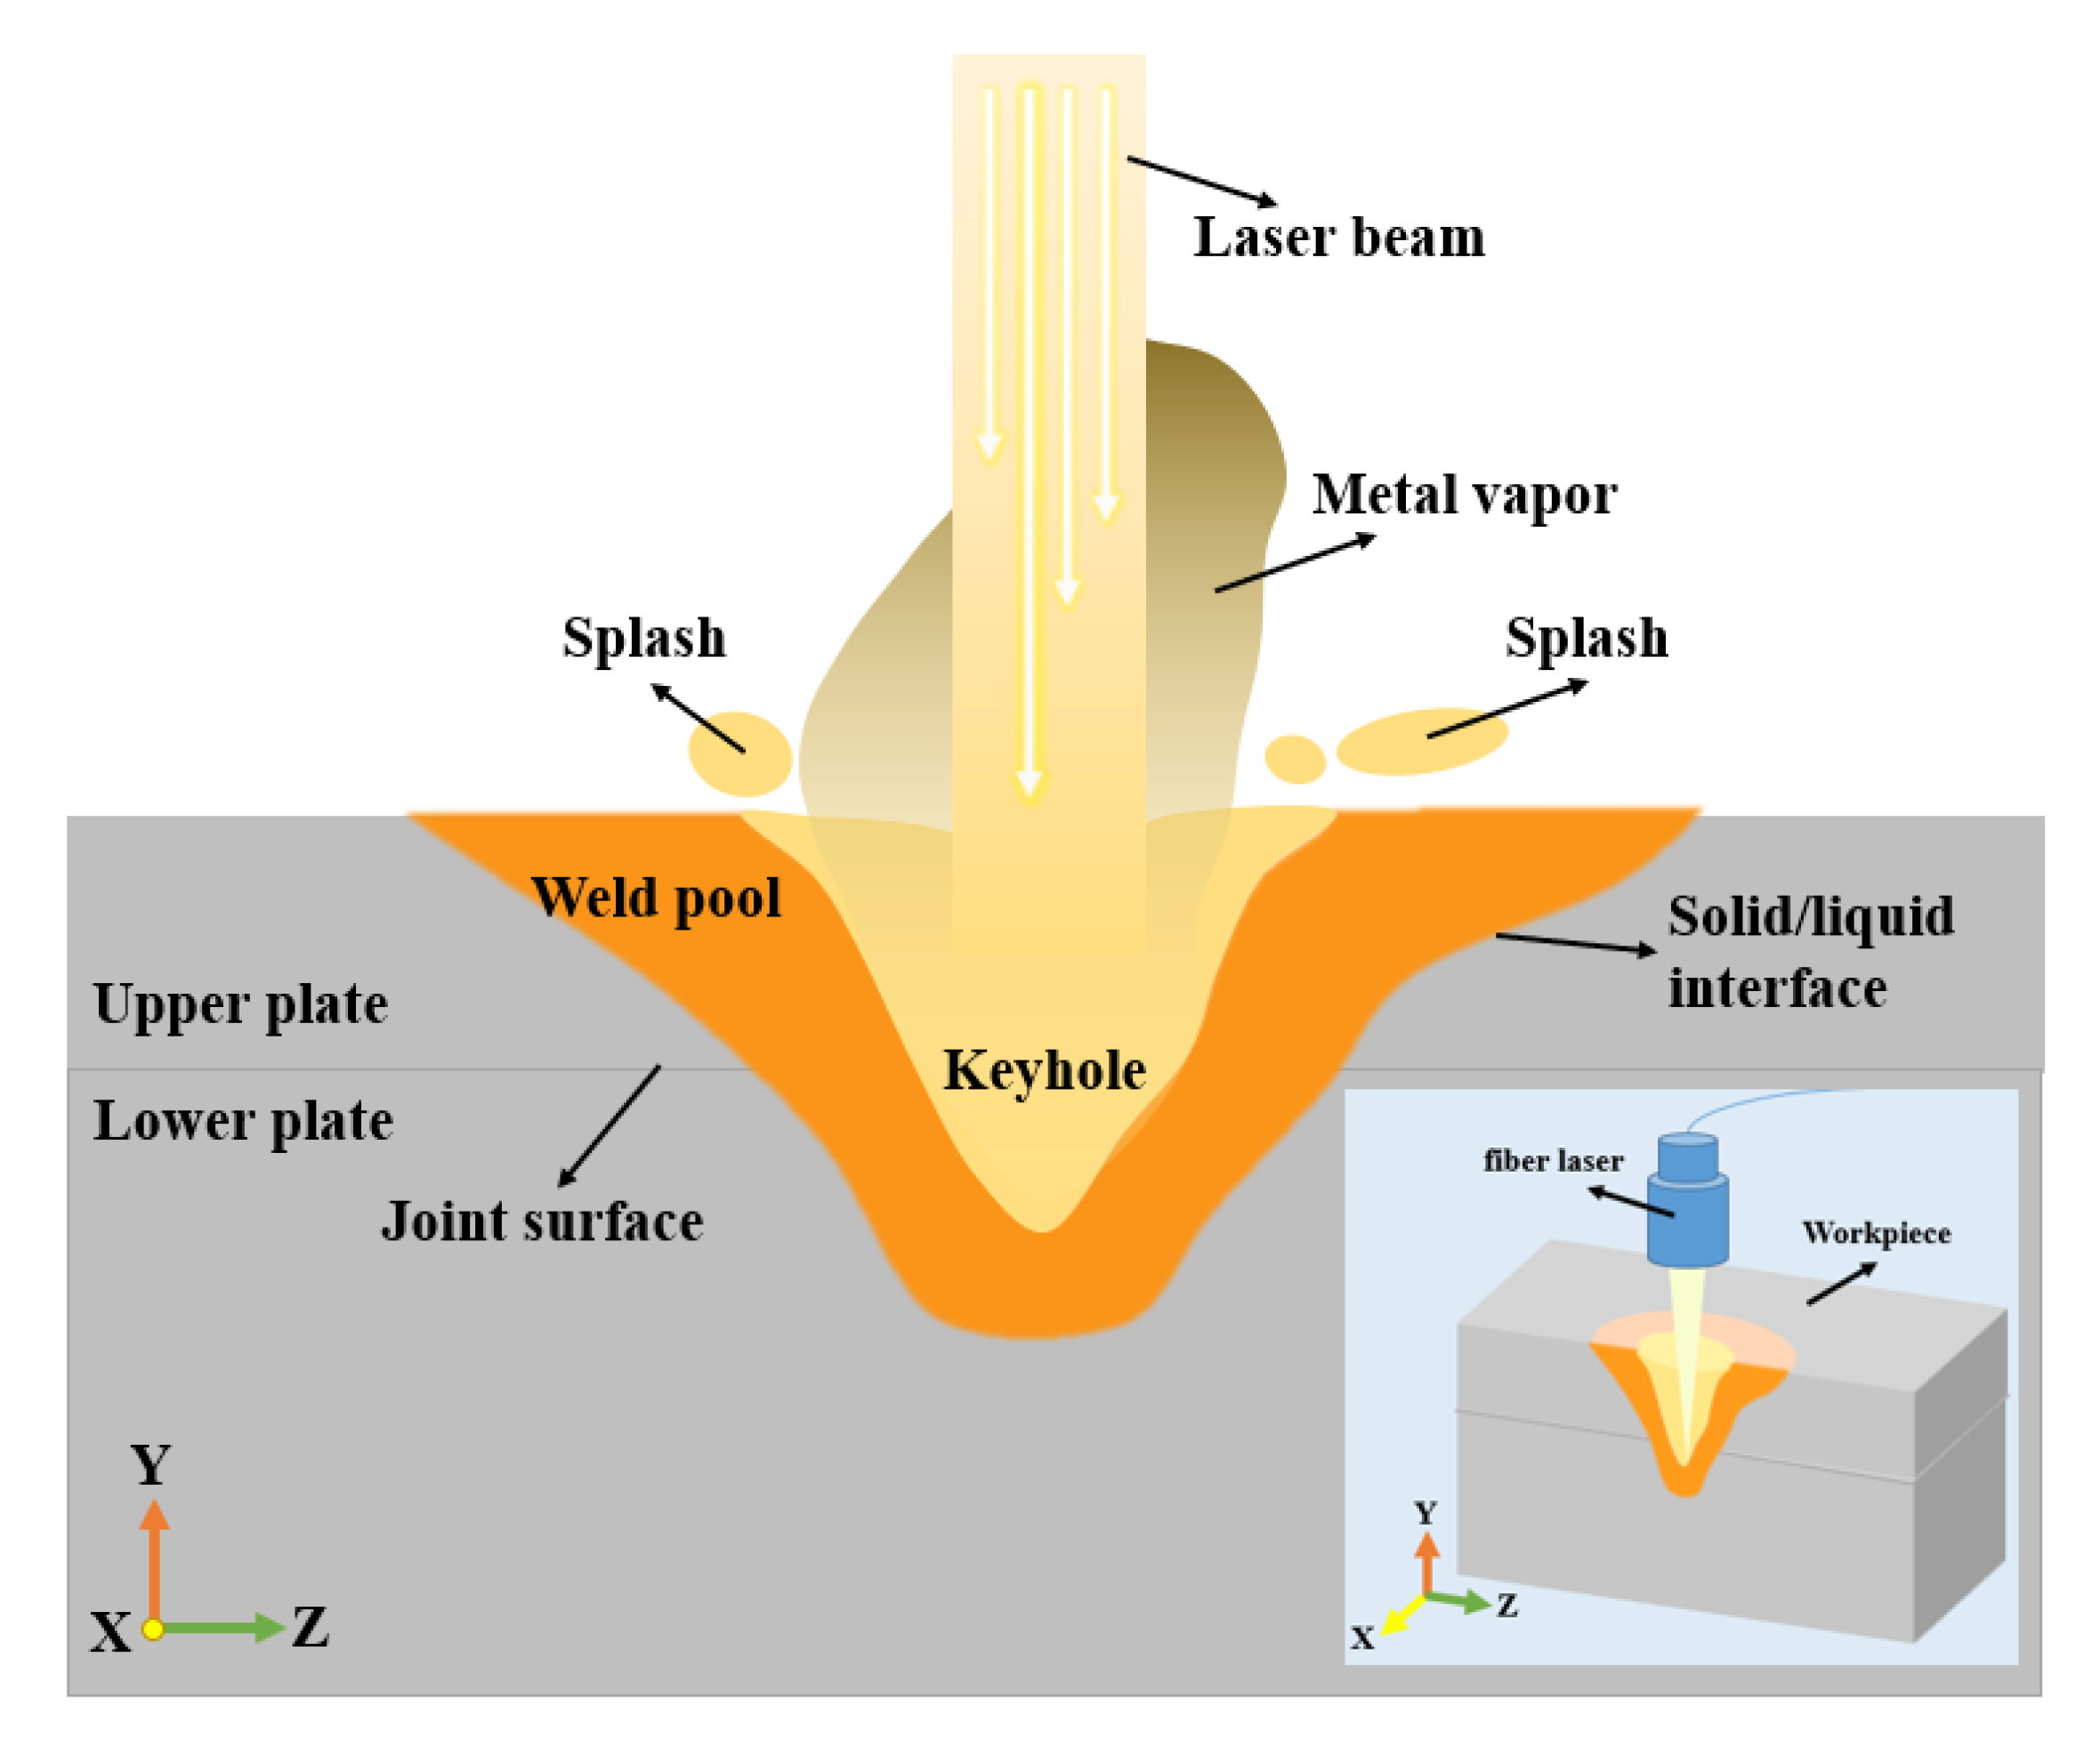
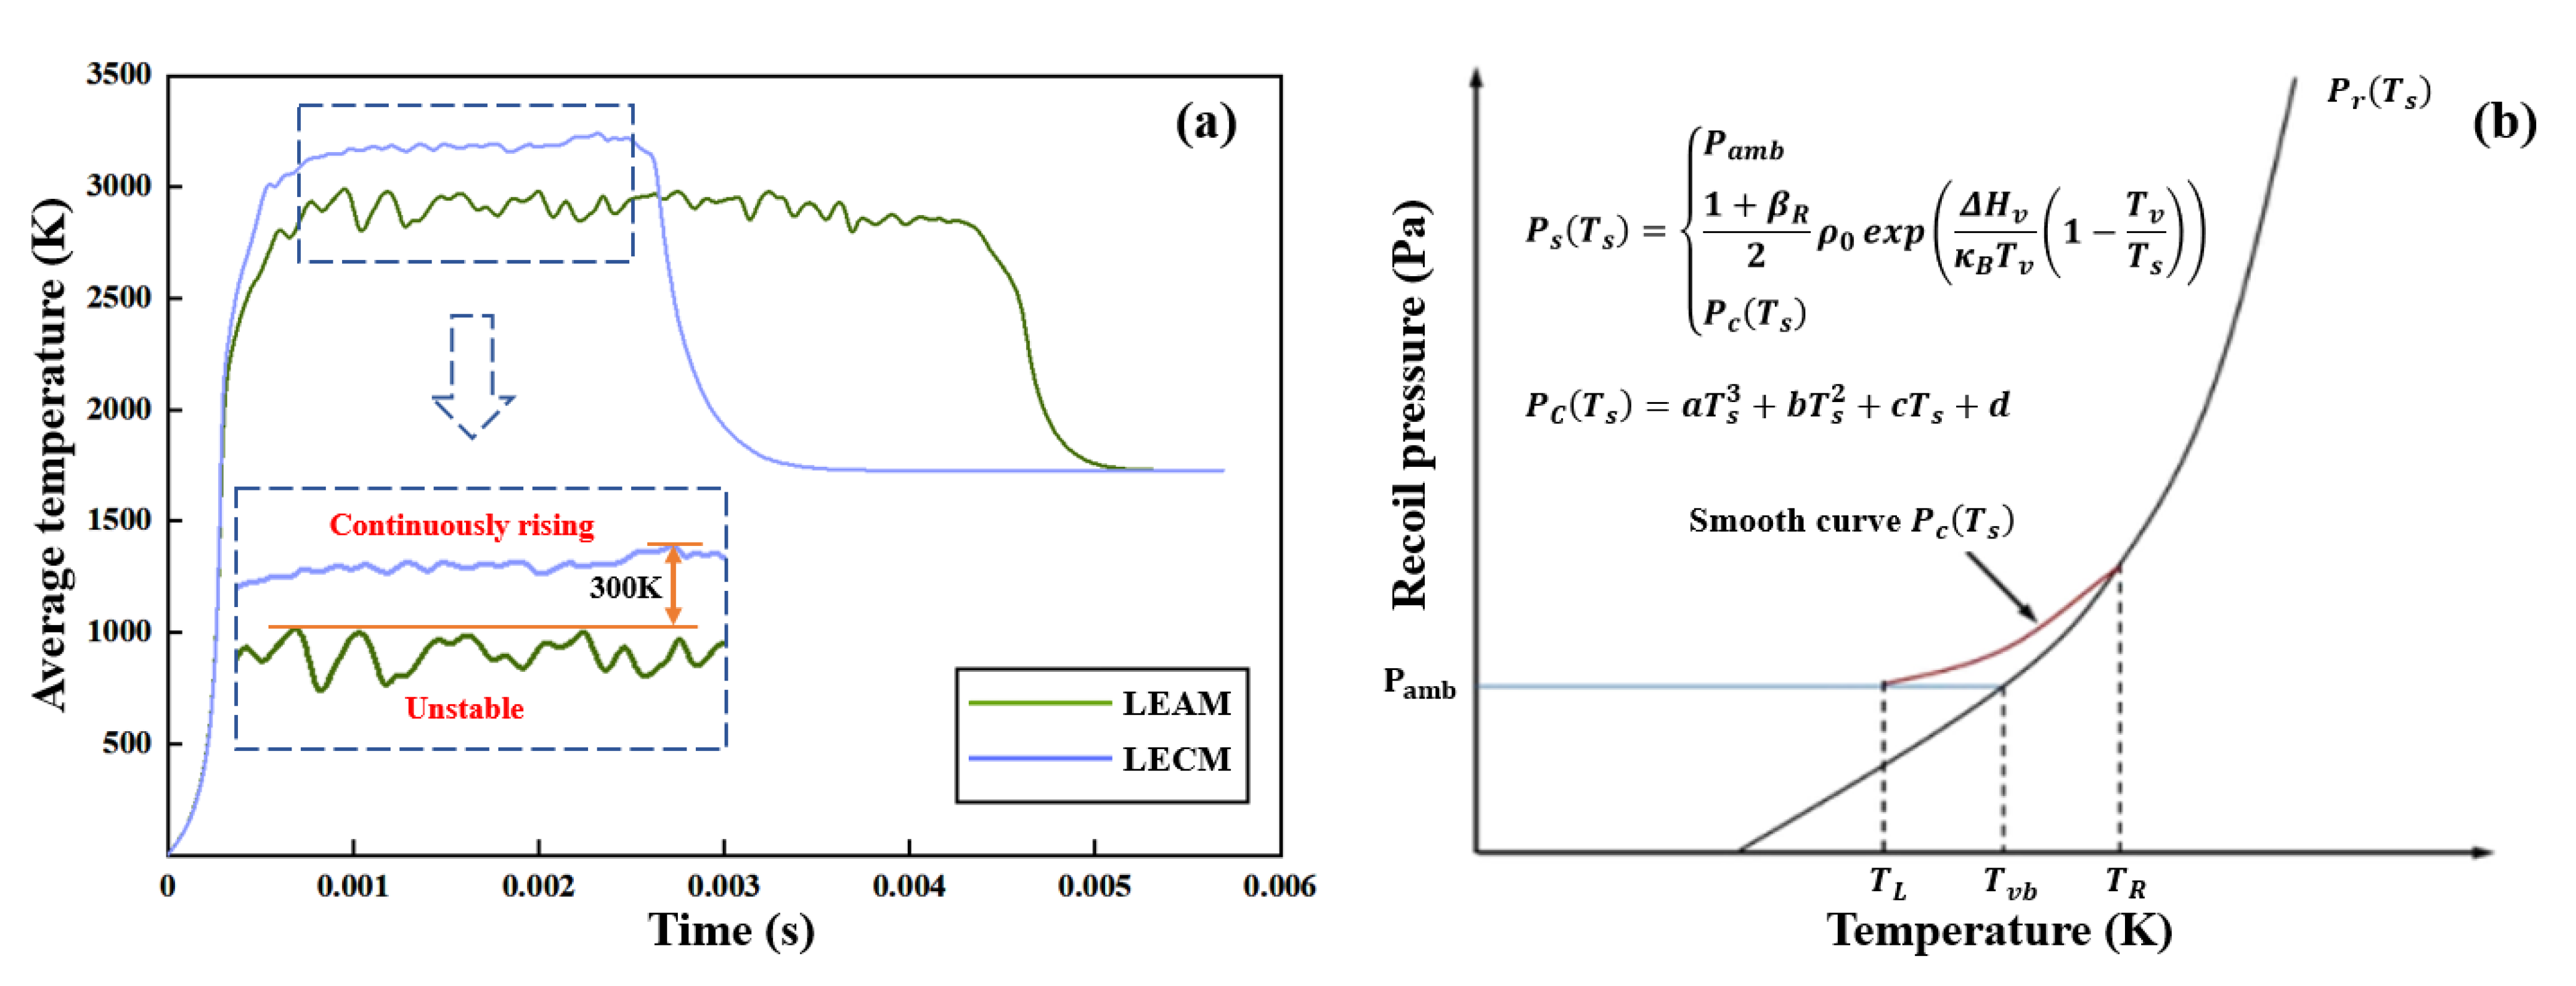
- Analysis based on the simulation results reveals that the premature attenuation of the laser power in the LSMW process will cause the temperature fluctuation and decline in the keyhole, and it is difficult to generate a large recoil pressure to maintain the opening of the keyhole. Finally, the whole process is more active in the thermal conductivity mode, and a weak weld phenomenon has appeared. On the other hand, because of the peak power, the internal temperature of the keyhole can be at a higher level, resulting in the keyhole effect. It is more conducive to the multiple reflections of the laser beam in the keyhole. Therefore, the LECM mode with less laser energy is able to produce a greater weld depth than LEAM due to the presence of peak power.
- (3)
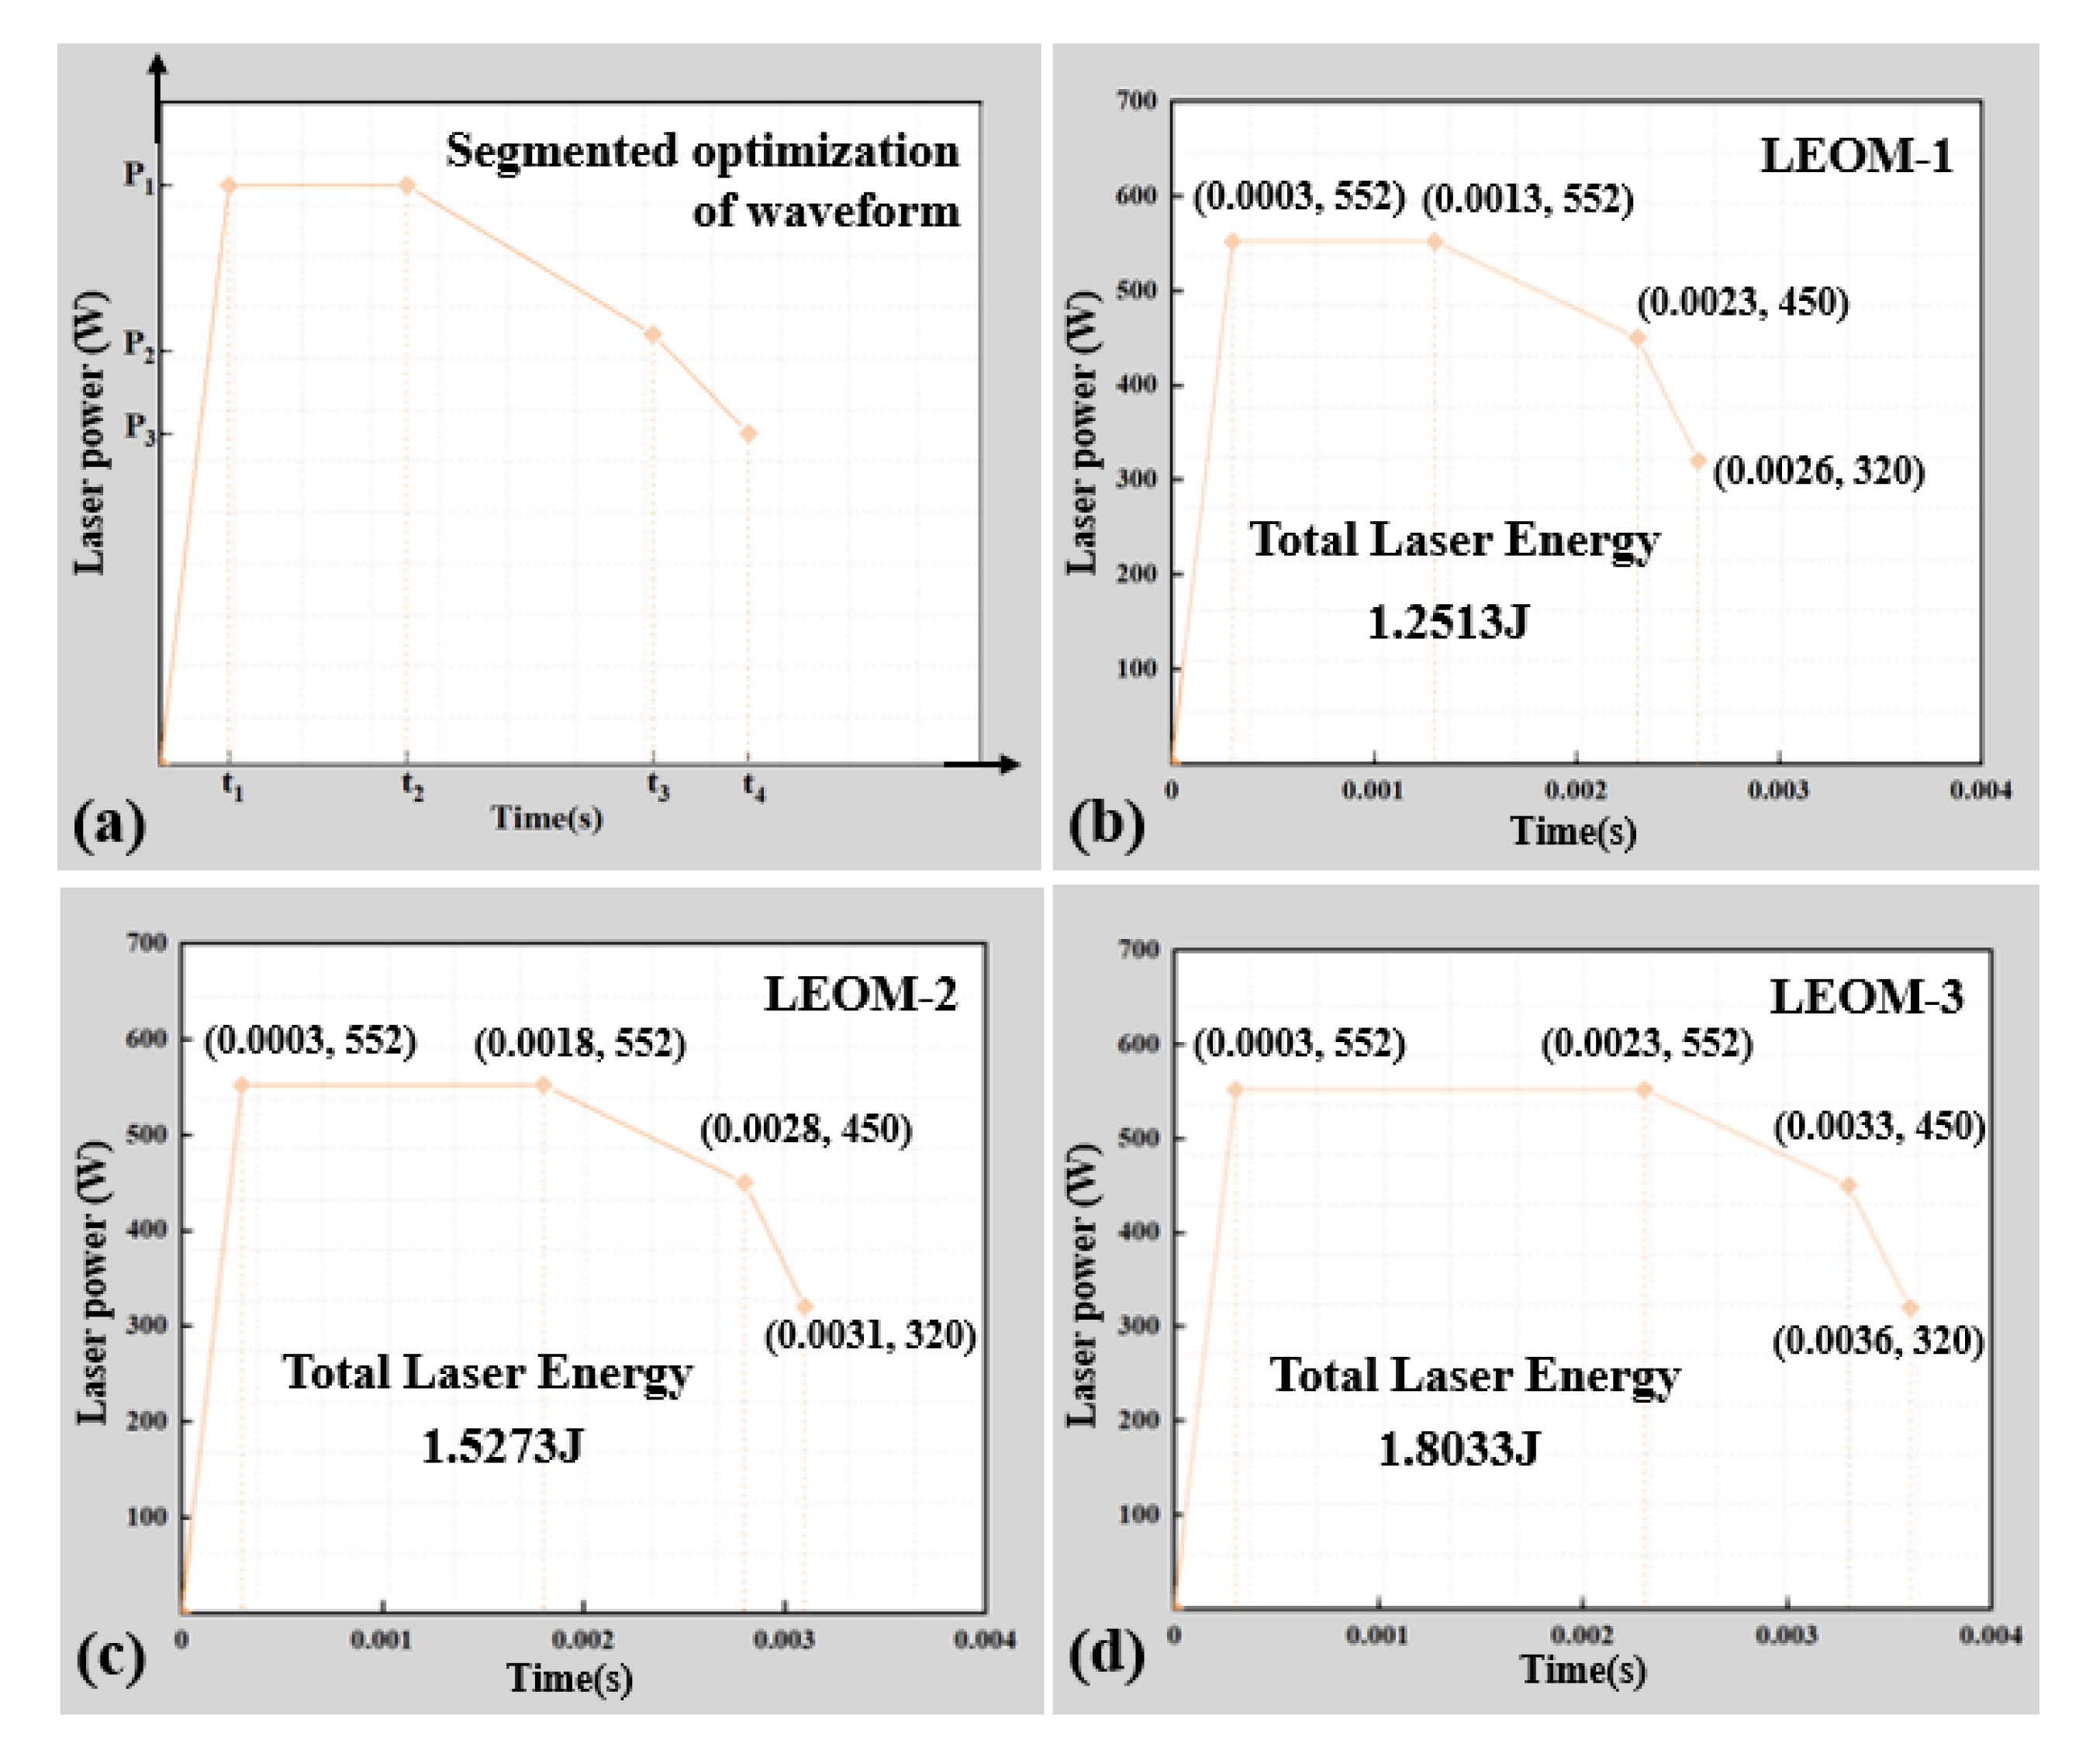
- A laser pulse waveform segmented optimization method, in this paper, is proposed for the practical engineering application, which combines LEAM and LECM into a four-segment waveform. The laser energy after waveform optimization is well utilized, and the bonding ability is increased. The experimental results show that the weld depth can be optimized to 0.291 mm, and the tensile strength can reach 288 MPa. It can reach the required weld depth in a short time and improve the welding efficiency of the LSMW process. Besides, the simulation results show that the temperature in the keyhole is also well optimized below the material boiling point. It is always in a stable state, and the possibility of welding spatter is reduced to a greater extent.
Author Contributions
Funding
Conflicts of Interest
Appendix A
Appendix A.1. Governing Equations
Appendix A.2. Boundary Conditions
Appendix A.3. Simulation Parameters

| Physical Parameters | Units | Value |
|---|---|---|
| Density | 7200 | |
| Thermal conductivity coefficient | 35 (298 K) | |
| Specific heat | 760 (298 K) | |
| Kinematic viscosity μ | 0.006 | |
| Latent heat of fusion | 6 × 10⁵ | |
| Latent heat of evaporation | 6.52 × 10⁶ | |
| Solidus temperature | K | 1727 |
| Liquidus temperature | K | 1697 |
| Evaporation temperature | K | 3100 |
| Surface tension coefficient | N/m | 1 |
| Thermal-capillary force coefficient | N/m·K | −0.43 × 10⁻³ |
References
- Chatterjee, S.; Mahapatra, S.S.; Bharadwaj, V.; Upadhyay, B.N.; Bindra, K.S.; Thomas, J. Parametric appraisal of mechanical and metallurgical behavior of butt welded joints using pulsed Nd: YAG laser on thin sheets of AISI 316. Opt. Laser Technol. 2019, 117, 186–199. [Google Scholar] [CrossRef]
- Liao, Y.C.; Yu, M.H. Effects of laser beam energy and incident angle on the pulse laser welding of stainless steel thin sheet. J. Mater. Process. Technol. 2007, 190, 102–108. [Google Scholar] [CrossRef]
- Cai, C.; Li, L.Q.; Tao, W.; Peng, G.C.; Wang, X. Weld Bead Size, Microstructure, and Corrosion Behavior of Zirconium Alloys Joints Welded by Pulsed Laser Spot Welding. J. Mater. Eng. Perform. 2016, 25, 3783–3792. [Google Scholar] [CrossRef]
- Safari, M.; Farzin, M. Experimental and numerical investigation of laser bending of tailor machined blanks. Opt. Laser Technol. 2013, 48, 513–522. [Google Scholar] [CrossRef]
- Deng, S.J.; Guo, Q.; Wang, H.P.; Lu, F.G.; Solomon, J.; Carlson, B.E. Effectiveness of pre-scanning on zinc evaporation in laser spot welding of zinc-coated steels. Int. J. Adv. Manuf. Technol. 2020, 106, 4423–4436. [Google Scholar] [CrossRef]
- Martínez, S.; Lamikiz, A.; Ukar, E.; Calleja, A.; Arrizubieta, J.A.; De Lacalle, L.L. Analysis of the regimes in the scanner-based laser hardening process. Opt. Lasers Eng. 2017, 90, 72–80. [Google Scholar] [CrossRef]
- Zhang, Y.; Ying, Y.Y.; Liu, X.X.; Wei, H.Y. Deformation control during the laser welding of a Ti6Al4V thin plate using a synchronous gas cooling method. Mater. Des. 2016, 90, 931–941. [Google Scholar] [CrossRef]
- Iordachescu, D.; Blasco, M.; Lopez, R.; Cuesta, A.; Iordachescu, M.; Ocana, J.L. Recent achievements and trends in laser welding of thin plates. J. Optoelectron. Adv. Mater. 2011, 13, 981–985. [Google Scholar]
- Fysikopoulos, A.; Pastras, G.; Stavridis, J.; Stavropoulos, P.; Chryssolouris, G. On the Performance Evaluation of Remote Laser Welding Process: An Automotive Case Study. Procedia CIRP 2016, 41, 969–974. [Google Scholar] [CrossRef] [Green Version]
- Shin, J.S.; Oh, S.Y.; Park, H.; Chung, C.M.; Seon, S.; Kim, T.S.; Lee, L.; Lee, J. Laser cutting of steel plates up to 100mm in thickness with a 6-kW fiber laser for application to the dismantling of nuclear facilities. Opt. Lasers Eng. 2018, 100, 98–104. [Google Scholar] [CrossRef]
- Torkamany, M.J.; Tahamtan, S.; Sabbaghzadeh, J. Dissimilar welding of carbon steel to 5754 aluminum alloy by Nd: YAG pulsed laser. Mater. Des. 2010, 31, 458–465. [Google Scholar] [CrossRef]
- Kou, S.; Limmaneevichitr, C.; Wei, P.S. Oscillatory Marangoni flow: A fundamental study by conduction-mode laser spot welding. Weld. J. 2011, 90, 229–240. [Google Scholar]
- Wang, T.; Chen, Y.B.; Li, L.Q.; Wu, L. An experimental study on laser spot welding of 304 stainless steel. Appl. Laser 2005, 25, 233–236. [Google Scholar]
- Shah, A.; Kumar, A.; Ramkumar, J. Analysis of transient thermo-fluidic behavior of melt pool during spot laser welding of 304 stainless-steel. J. Mater. Process. Technol. 2018, 256, 109–120. [Google Scholar] [CrossRef]
- Wang, P.C.; Ewing, K.M. Effect of weld design on the fatigue strength of laser and resistance spot welded tubular T-joint for automotive applications. Weld. J. 1994, 73, 209–217. [Google Scholar]
- Sun, J.M.; Liu, X.Z.; Tong, Y.G.; Deng, D.A. A comparative study on welding temperature fields, residual stress distributions, and deformations induced by laser beam welding and CO2 gas arc welding. Mater. Des. 2014, 63, 519–530. [Google Scholar] [CrossRef]
- Torkamany, M.J.; Sabbaghzadeh, J.; Hamedi, M.J. Effect of laser welding mode on the microstructure and mechanical performance of dissimilar laser spot welds between low carbon and austenitic stainless steels. Mater. Des. 2012, 34, 666–672. [Google Scholar] [CrossRef]
- Yilbas, B.S.; Akhtar, S. Laser Welding of AISI 316 Steel: Microstructural and Stress Analysis. J. Manuf. Sci. Eng. 2013, 135, 922–926. [Google Scholar] [CrossRef]
- Saldi, Z.; Kidess, A.; Kenjeres, S.; Zhao, C.Y.; Richardson, I.M.; Kleijn, C.R. Effect of enhanced heat and mass transport and flow reversal during cooldown on weld pool shapes in laser spot welding of steel. Int. J. Heat Mass Transf. 2013, 66, 879–888. [Google Scholar] [CrossRef]
- Tadamalle, A.P.; Reddy, Y.P.; Ramjee, E. Influence of laser welding process parameters on weld pool geometry and duty cycle. Adv. Prod. Eng. Manag. 2013, 8, 52–60. [Google Scholar] [CrossRef] [Green Version]
- Jouvard, J.M.; Girard, K.; Perret, O. Keyhole formation and power deposition in Nd: YAG laser spot welding. J. Phys. D Appl. Phys. 2001, 34, 2894–2901. [Google Scholar] [CrossRef]
- Lippold, J.C. Solidification Behavior and Cracking Susceptibility of Pulsed-Laser Welds in Austenitic Stainless Steels. Weld. J. 1994, 73, 129–139. [Google Scholar]
- Mys, I.; Geiger, M. Use of pre-pulse in laser spot welding of materials with high optical reflection. Proc. SPIE 2003, 5063, 314–318. [Google Scholar]
- Sibillano, T.; Ancona, A.; Rizzi, D.; Rodil, S.S.; Nieto, J.R.; Konuk, A.R.; Aarts, R.G.K.M.; Huis, A.J. Study on the correlation between plasma electron temperature and penetration depth in laser welding processes. Phys. Procedia 2010, 5, 429–436. [Google Scholar] [CrossRef] [Green Version]
- Seiji, K.; Naoki, S.; Masami, M.; Akira, M. X-ray transmission in-situ observation of keyhole during laser spot welding and pulse-shaping for prevention of porosity. Process ICALEO 2001, 15, 1003–1011. [Google Scholar]
- Mishra, S.; Debroy, T. A heat-transfer and fluid-flow-based model to obtain a specific weld geometry using various combinations of welding variables. J. Appl. Phys. 2005, 98, 1–10. [Google Scholar] [CrossRef] [Green Version]
- Kang, M.; Fedkiw, R.P.; Liu, X.D. A boundary condition capturing method for multiphase Incompressible flow. J. Sci. Comput. 2000, 15, 323–360. [Google Scholar] [CrossRef]
- Lee, J.Y.; Ko, S.H.; Farson, D.F.; Yoo, C.D. Mechanism of keyhole formation and stability in stationary laser welding. J. Phys. D Appl. Phys. 2002, 35, 1570–1576. [Google Scholar] [CrossRef]
- Yang, Y.S.; Lee, S.H. A study on the joining strength of laser spot welding for automotive applications. J. Mater. Process. Technol. 1999, 94, 151–156. [Google Scholar] [CrossRef]
- Zhang, W.H.; Sun, D.Q.; Han, L.J.; Liu, D.Y. Interfacial microstructure and mechanical property of resistance spot welded joint of high strength steel and aluminium alloy with 4047 AlSi12 interlayer. Mater. Des. 2014, 57, 186–194. [Google Scholar] [CrossRef]
- He, X.; Norris, J.T.; Fuerschbach, P.W.; Debroy, T. Liquid metal expulsion during laser spot welding of 304 stainless steel. J. Phys. D Appl. Phys. 2006, 39, 525–534. [Google Scholar] [CrossRef]
- Lapsanska, H.; Chmelickova, H.; Hrabovsky, M. Effect of Beam Energy on Weld Geometric Characteristics in Nd: YAG Laser Overlapping Spot Welding of Thin AISI 304 Stainless Steel Sheets. Metall. Mater. Trans. B 2010, 41, 1108–1115. [Google Scholar] [CrossRef]
- Krahmer, D.M.; Polvorosa, R.; De Lacalle, L.L.; Alonso-Pinillos, U.; Abate, G.; Riu, F. Alternatives for Specimen Manufacturing in Tensile Testing of Steel Plates. Exp. Tech. 2016, 40, 1555–1565. [Google Scholar] [CrossRef]
- He, X.; Fuerschbach, P.W.; Debroy, T. Heat transfer and fluid flow during laser spot welding of 304 stainless steel. J. Phys. D Appl. Phys. 2003, 36, 1388–1398. [Google Scholar] [CrossRef]
- De, A.; Maiti, S.K.; Walsh, C.A.; Bhadeshia, H.K.D.H. Finite element simulation of laser spot welding. Sci. Technol. Weld. Join. 2003, 8, 377–384. [Google Scholar] [CrossRef]
- He, X.; Debroy, T.; Fuerschbach, P.W. Probing temperature during laser spot welding from vapor composition and modeling. J. Appl. Phys. 2003, 94, 6949–6958. [Google Scholar] [CrossRef] [Green Version]
- Huang, B.; Chen, X.; Pang, S.Y.; Hu, R.Z. A three-dimensional model of coupling dynamics of keyhole and weld pool during electron beam welding. Int. J. Heat Mass Transf. 2017, 115, 159–173. [Google Scholar] [CrossRef]
- Eggers, J. Nonlinear dynamics and breakup of free-surface flows. Rev. Mod. Phys. 1997, 69, 865–929. [Google Scholar] [CrossRef] [Green Version]
- Rai, R.; DebRoy, T. Tailoring weld geometry during keyhole mode laser welding using a genetic algorithm and a heat transfer model. J. Phys. D Appl. Phys. 2006, 39, 1257–1266. [Google Scholar] [CrossRef]
- Zhou, J.; Tsai, H.L.; Lehnhoff, T.F. Investigation of transport phenomena and defect formation in pulsed laser keyhole welding of zinc-coated steels. J. Phys. D Appl. Phys. 2006, 39, 5338–5355. [Google Scholar] [CrossRef]
- Pang, S.Y.; Chen, X.; Zhou, J.X.; Shao, X.Y.; Gong, S.L.; Xiao, J.Z. Dynamics of vapor plume in transient keyhole during laser welding of stainless steel: Local evaporation, plume swing and gas entrapment into porosity. Opt. Lasers Eng. 2016, 82, 28–40. [Google Scholar] [CrossRef]
- Pang, S.Y.; Chen, L.L.; Zhou, J.X.; Yin, Y.J.; Chen, T. A three-dimensional sharp interface model for self-consistent keyhole and weld pool dynamics in deep penetration laser welding. J. Phys. D Appl. Phys. 2011, 44, 025301. [Google Scholar] [CrossRef]
- Pang, S.Y.; Chen, W.D.; Zhou, J.X.; Liao, D.M. Self-consistent modeling of keyhole and weld pool dynamics in tandem dual beam laser welding of aluminum alloy. J. Mater. Process. Technol. 2015, 217, 131–143. [Google Scholar] [CrossRef]
- Pang, S.Y.; Hirano, K.; Fabbro, R.; Jiang, T. Explanation of penetration depth variation during laser welding under variable ambient pressure. J. Laser Appl. 2015, 27, 022007. [Google Scholar] [CrossRef]
- Fabbro, R.; Hirano, K.; Pang, S. Analysis of the physical processes occurring during deep penetration laser welding under reduced pressure. J. Laser Appl. 2016, 28, 022427. [Google Scholar] [CrossRef] [Green Version]
- Hirano, K.; Fabbro, R.; Muller, M. Experimental determination of temperature threshold for melt surface deformation during laser interaction on iron at atmospheric pressure. J. Phys. D Appl. Phys. 2011, 44, 435402. [Google Scholar] [CrossRef] [Green Version]
- Hu, R.; Pang, S.; Chen, X.; Liang, L.; Shao, X. An octree-based adaptive mesh refinement method for three-dimensional modeling of keyhole mode laser welding. Int. J. Heat Mass Transf. 2017, 115, 258–263. [Google Scholar] [CrossRef]


| C | Si | Mn | P | S | Ni | Cr | Fe |
|---|---|---|---|---|---|---|---|
| 0.07 | 0.46 | 0.78 | 0.032 | 0.006 | 8.10 | 18.32 | Balance |
| Process Name | LEAM | LECM |
|---|---|---|
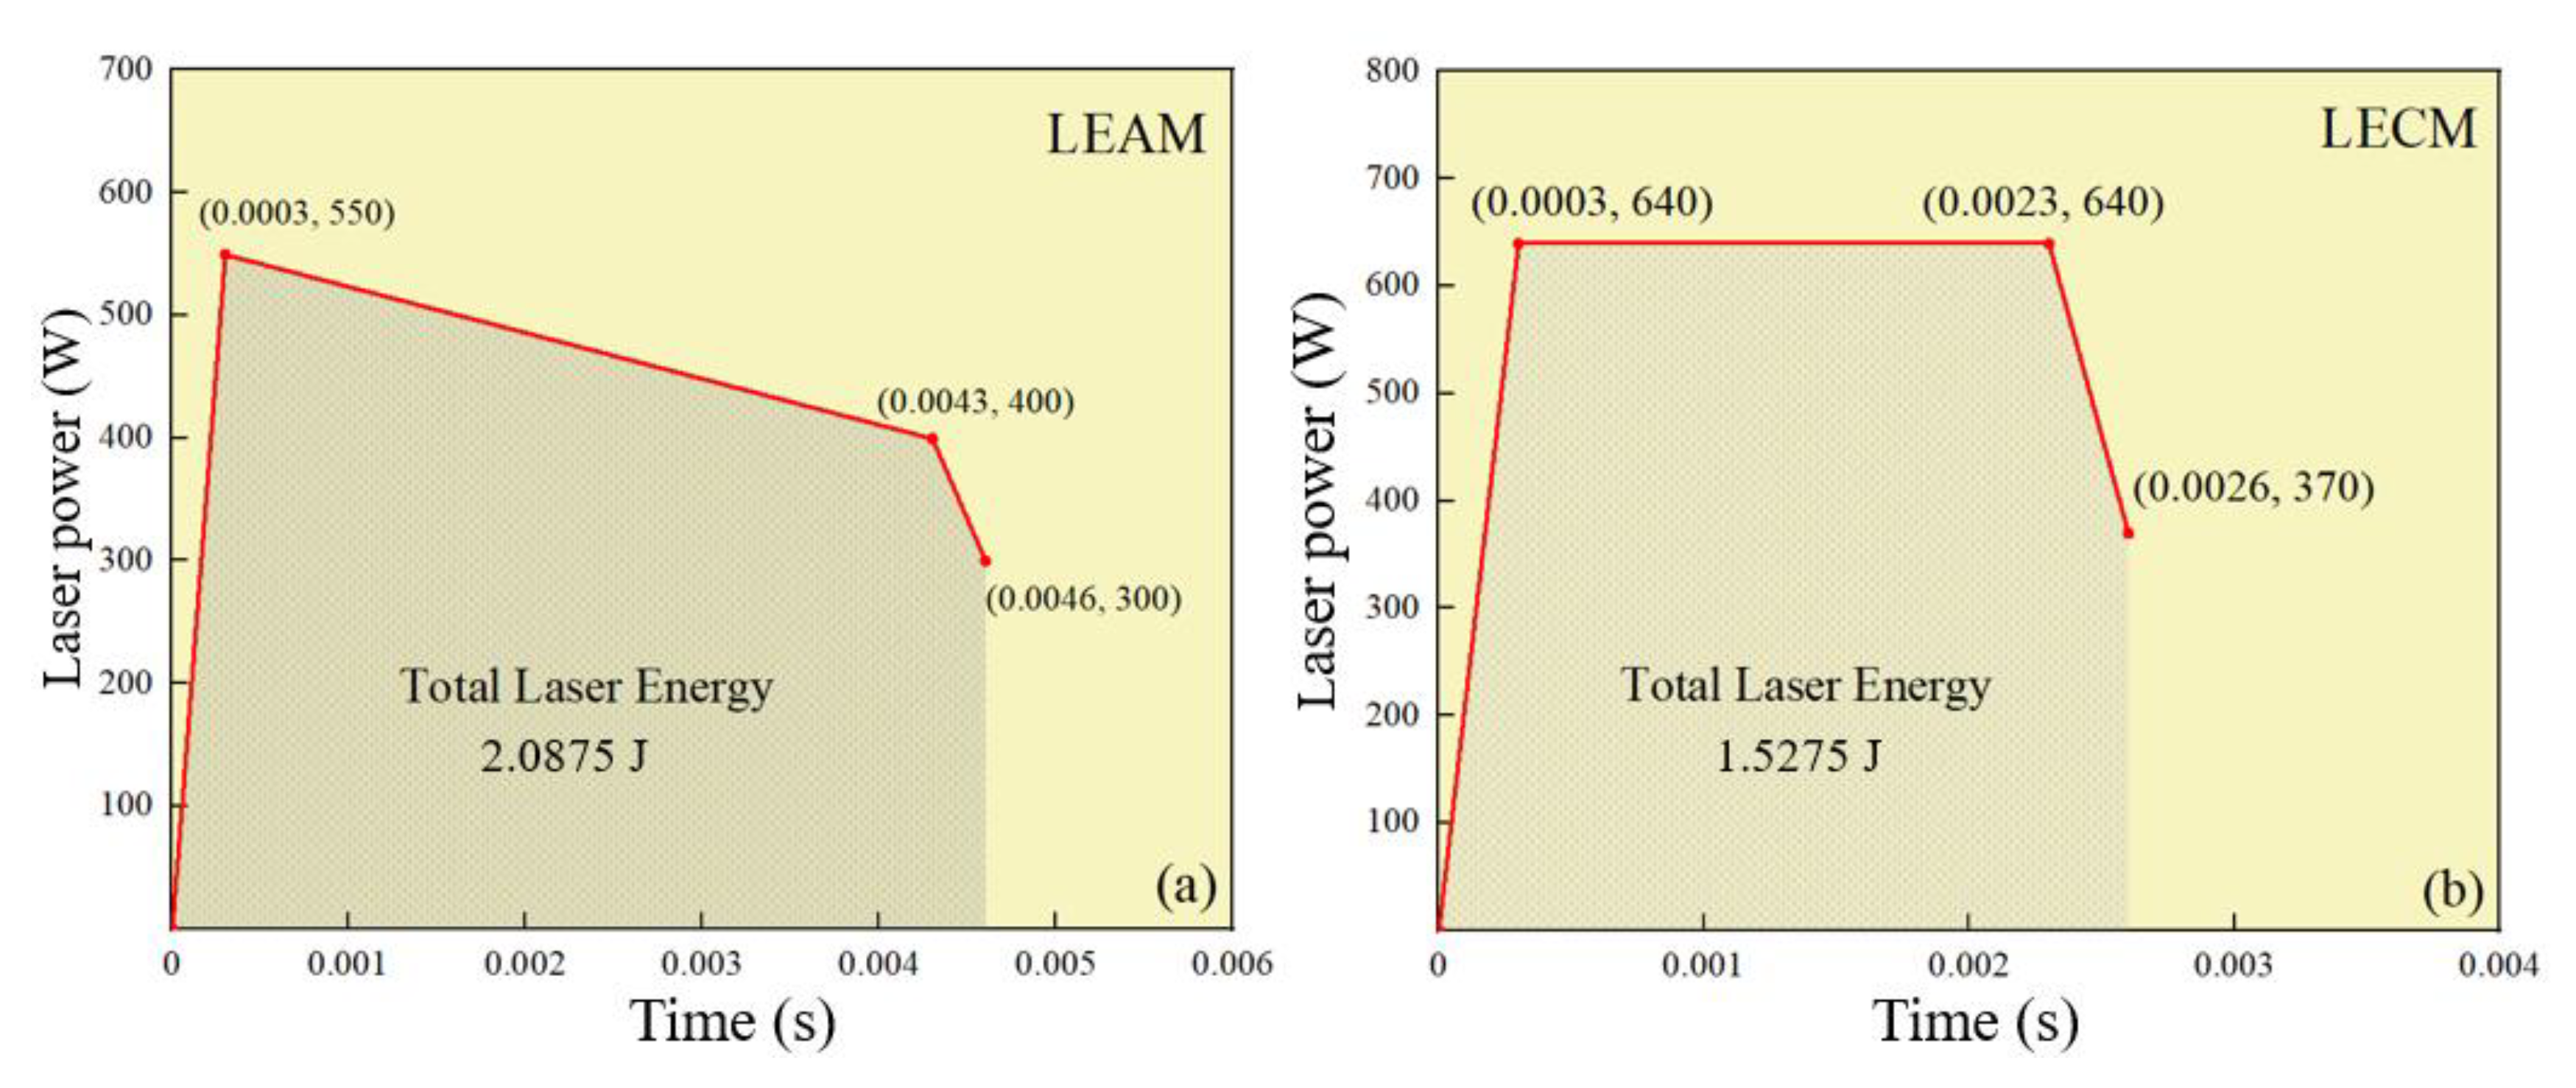
| Waveform duration (s) | t1 = 0.0003, t2 = 0.0043, t3 = 0.0046 | t1 = 0.0003, t2 = 0.0023, t3 = 0.0026 |
| Action laser power (W) | P1 = 550, P2 = 400, P3 = 300 | P1 = 640, P2 = 640, P3 = 370 |
| Total input energy (J) | 2.0875 J | 1.5275 J |
| Process Name | LEOM-1 | LEOM-2 | LEOM-3 |
|---|---|---|---|
| Waveform duration (s) | t1 = 0.0003, t2 = 0.0013, t3 = 0.0023, t4 = 0.0026 | t1 = 0.0003, t2 = 0.0018, t3 = 0.0028, t4 = 0.0031 | t1 = 0.0003, t2 = 0.0023, t3 = 0.0033, t4 = 0.0036 |
| Action laser power (W) | P1 = 552, P2 = 552, P3 = 450, P4 = 320 | ||
| Total input energy (J) | 1.2513 | 1.5273 | 1.8033 |
Publisher’s Note: MDPI stays neutral with regard to jurisdictional claims in published maps and institutional affiliations. |
© 2021 by the authors. Licensee MDPI, Basel, Switzerland. This article is an open access article distributed under the terms and conditions of the Creative Commons Attribution (CC BY) license (http://creativecommons.org/licenses/by/4.0/).
Share and Cite
Li, Q.; Mu, Z.; Luo, M.; Huang, A.; Pang, S. Laser Spot Micro-Welding of Ultra-Thin Steel Sheet. Micromachines 2021, 12, 342. https://doi.org/10.3390/mi12030342
Li Q, Mu Z, Luo M, Huang A, Pang S. Laser Spot Micro-Welding of Ultra-Thin Steel Sheet. Micromachines. 2021; 12(3):342. https://doi.org/10.3390/mi12030342
Chicago/Turabian StyleLi, Quanhong, Zhongyan Mu, Manlelan Luo, Anguo Huang, and Shengyong Pang. 2021. "Laser Spot Micro-Welding of Ultra-Thin Steel Sheet" Micromachines 12, no. 3: 342. https://doi.org/10.3390/mi12030342