Second Harmonic Generation from Phase-Engineered Metasurfaces of Nanoprisms

 , , and
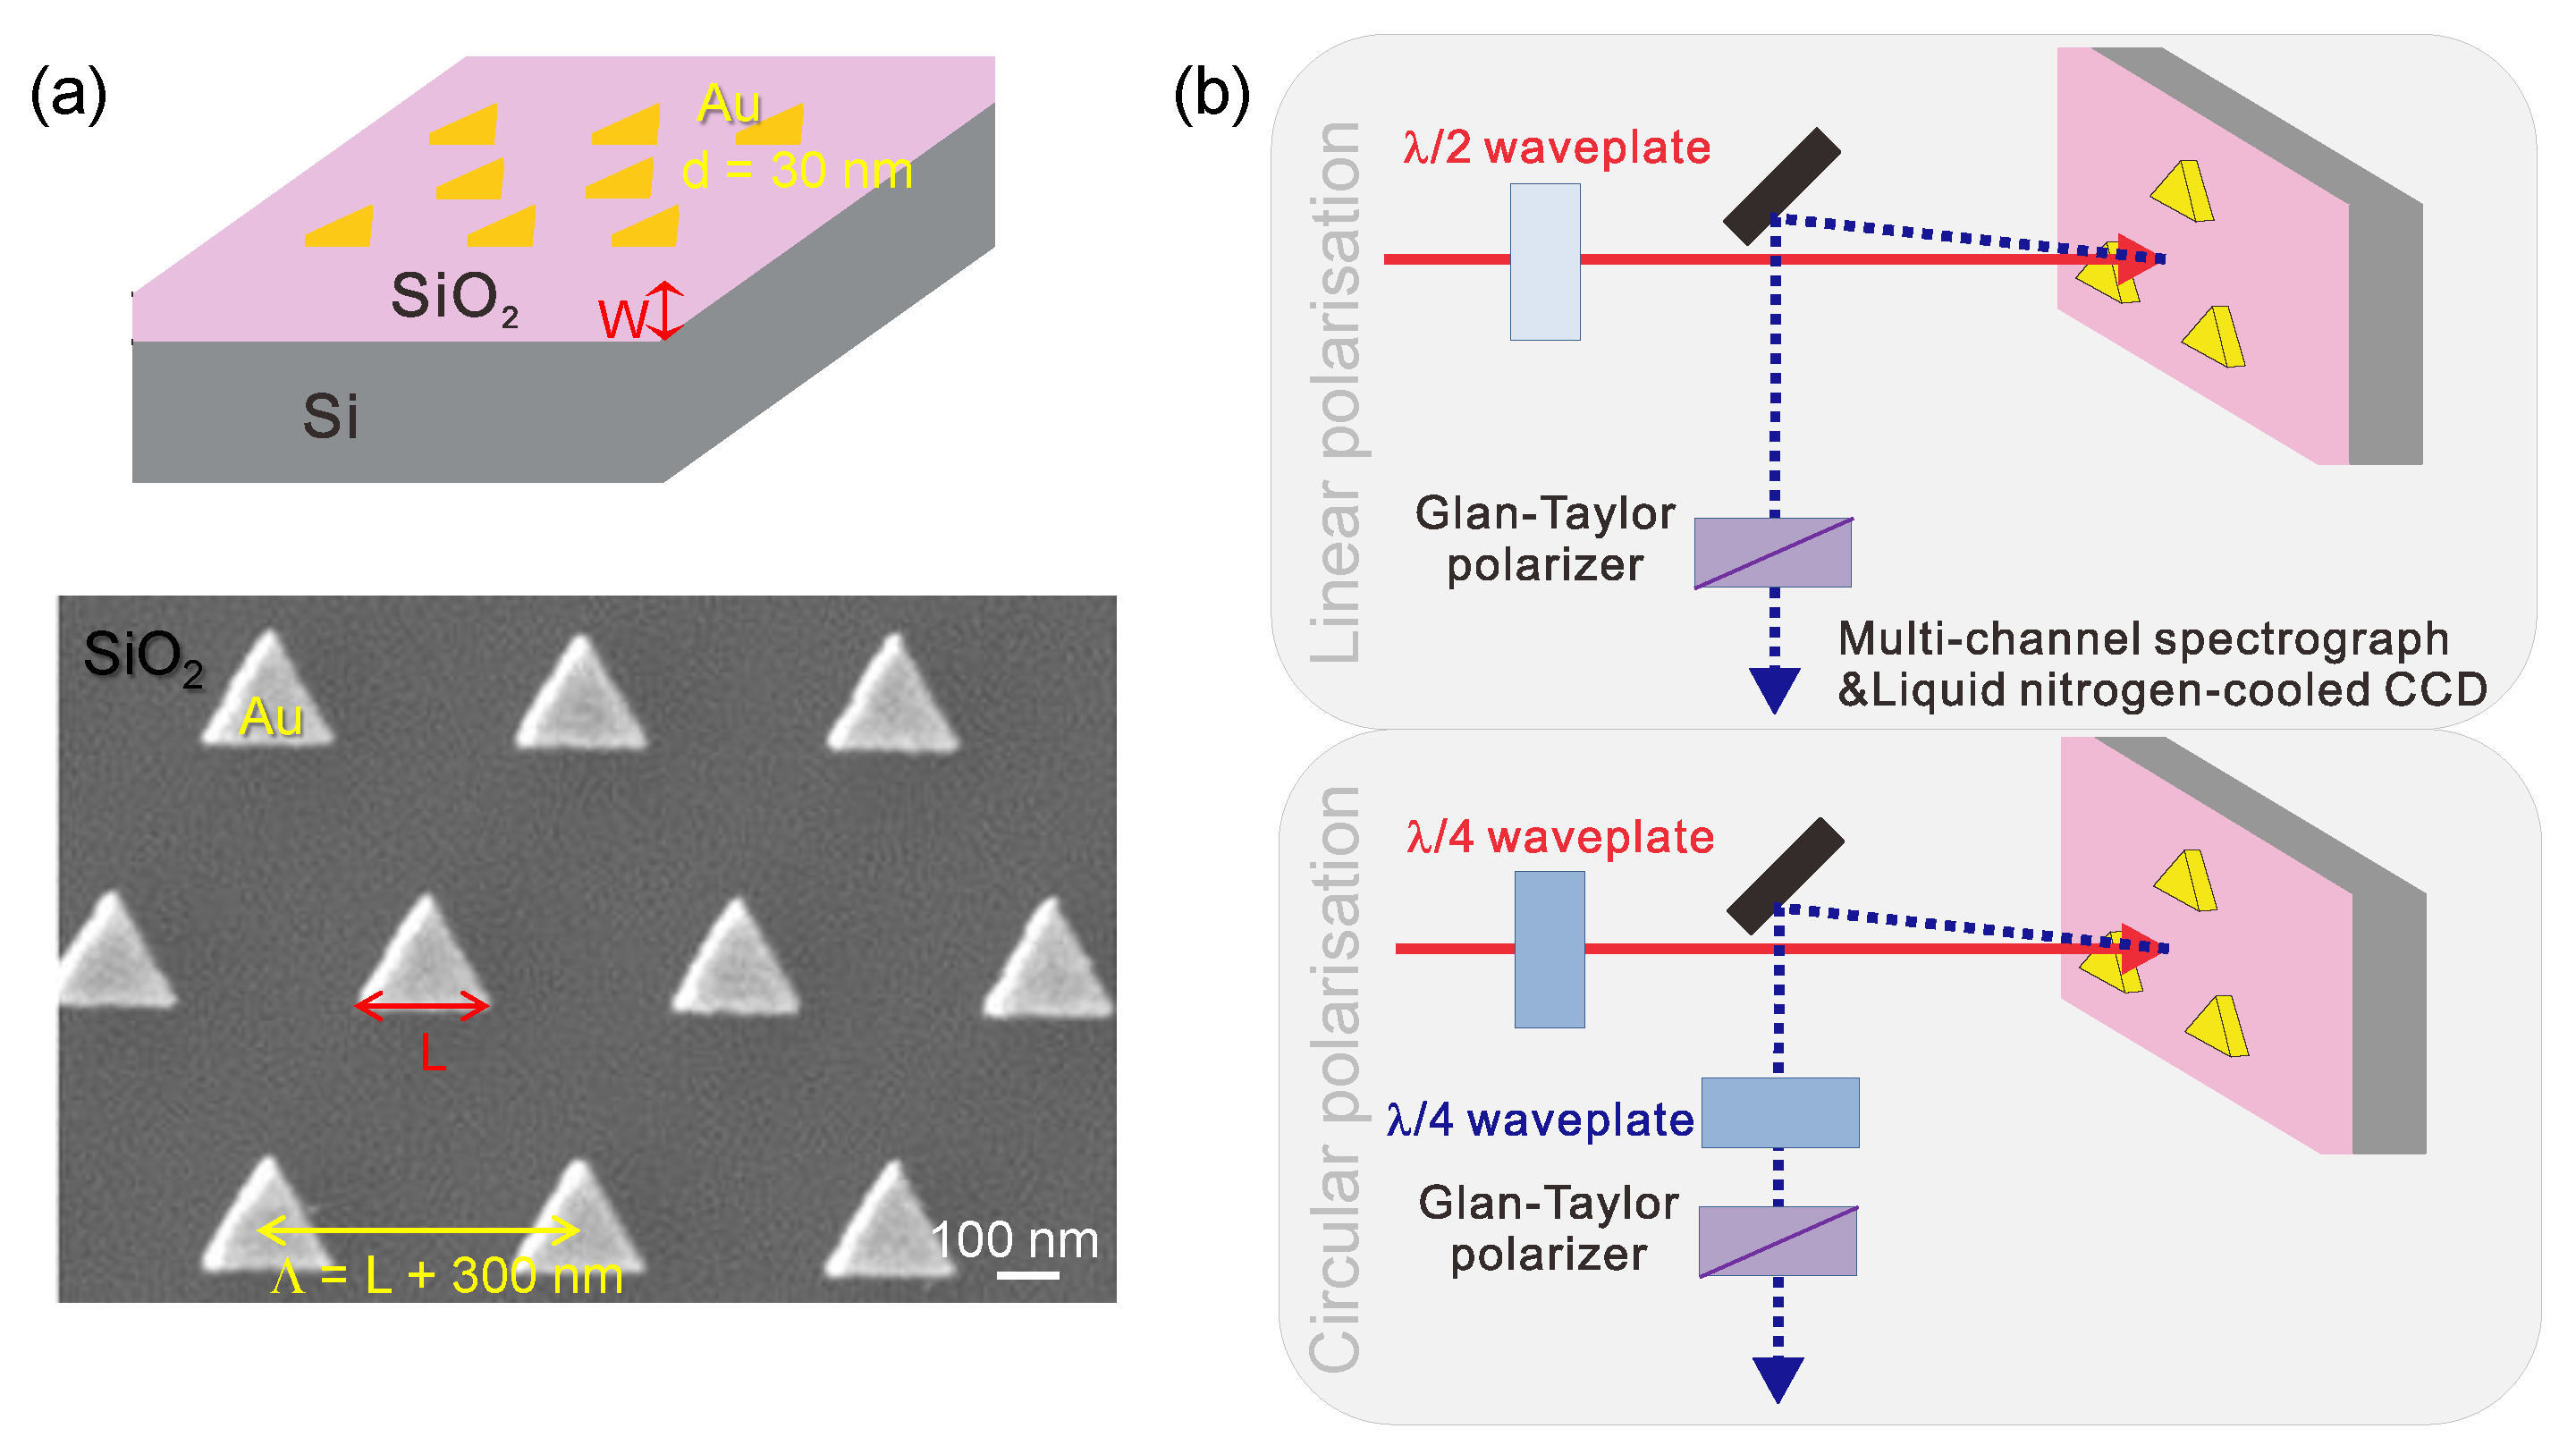
Abstract
:1. Introduction
2. Experimental
2.1. Fabrication of Metasurfaces
2.2. Characterisation of Metasurfaces
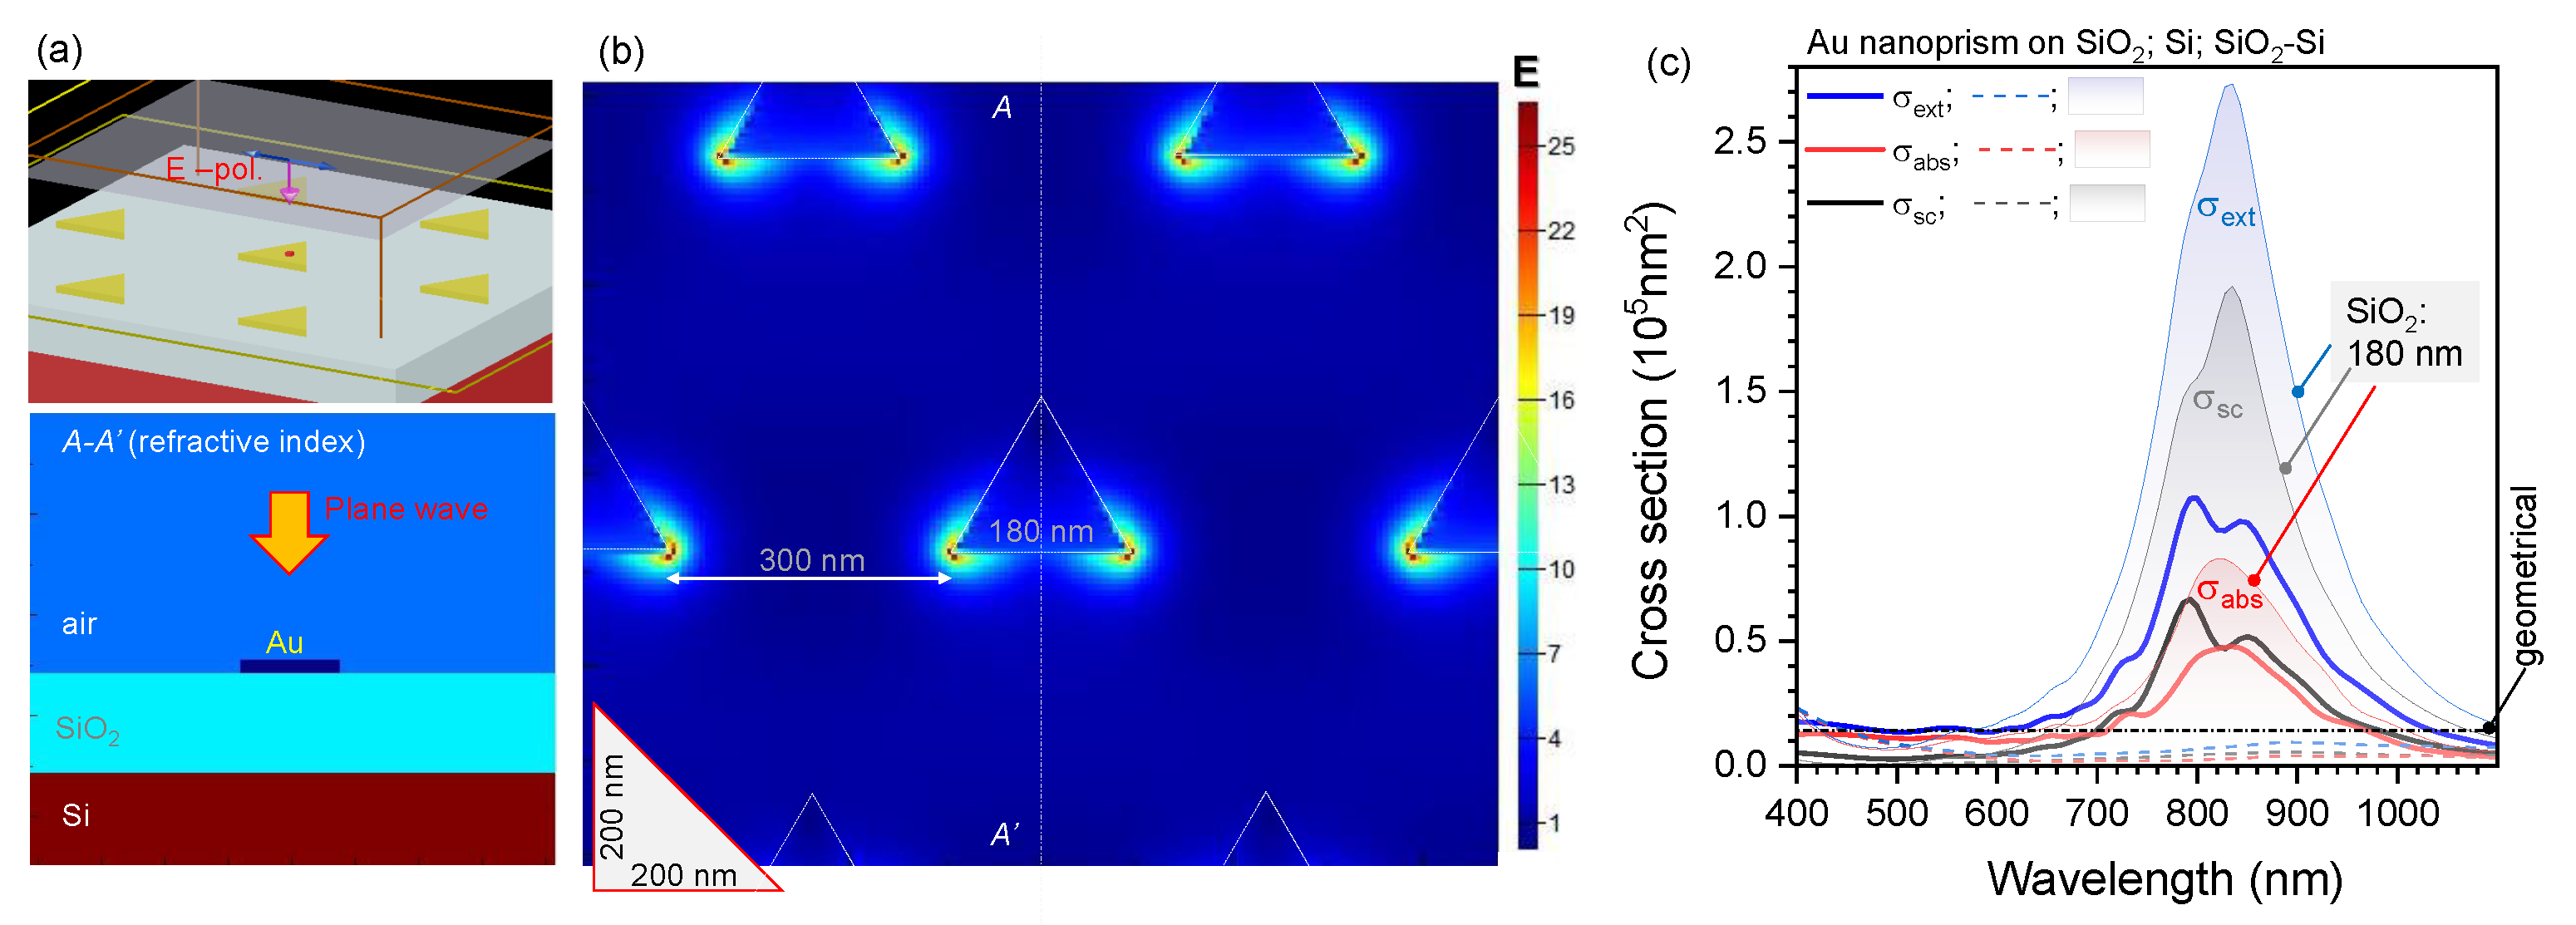
2.3. Numerical Modeling
3. Results and Discussion
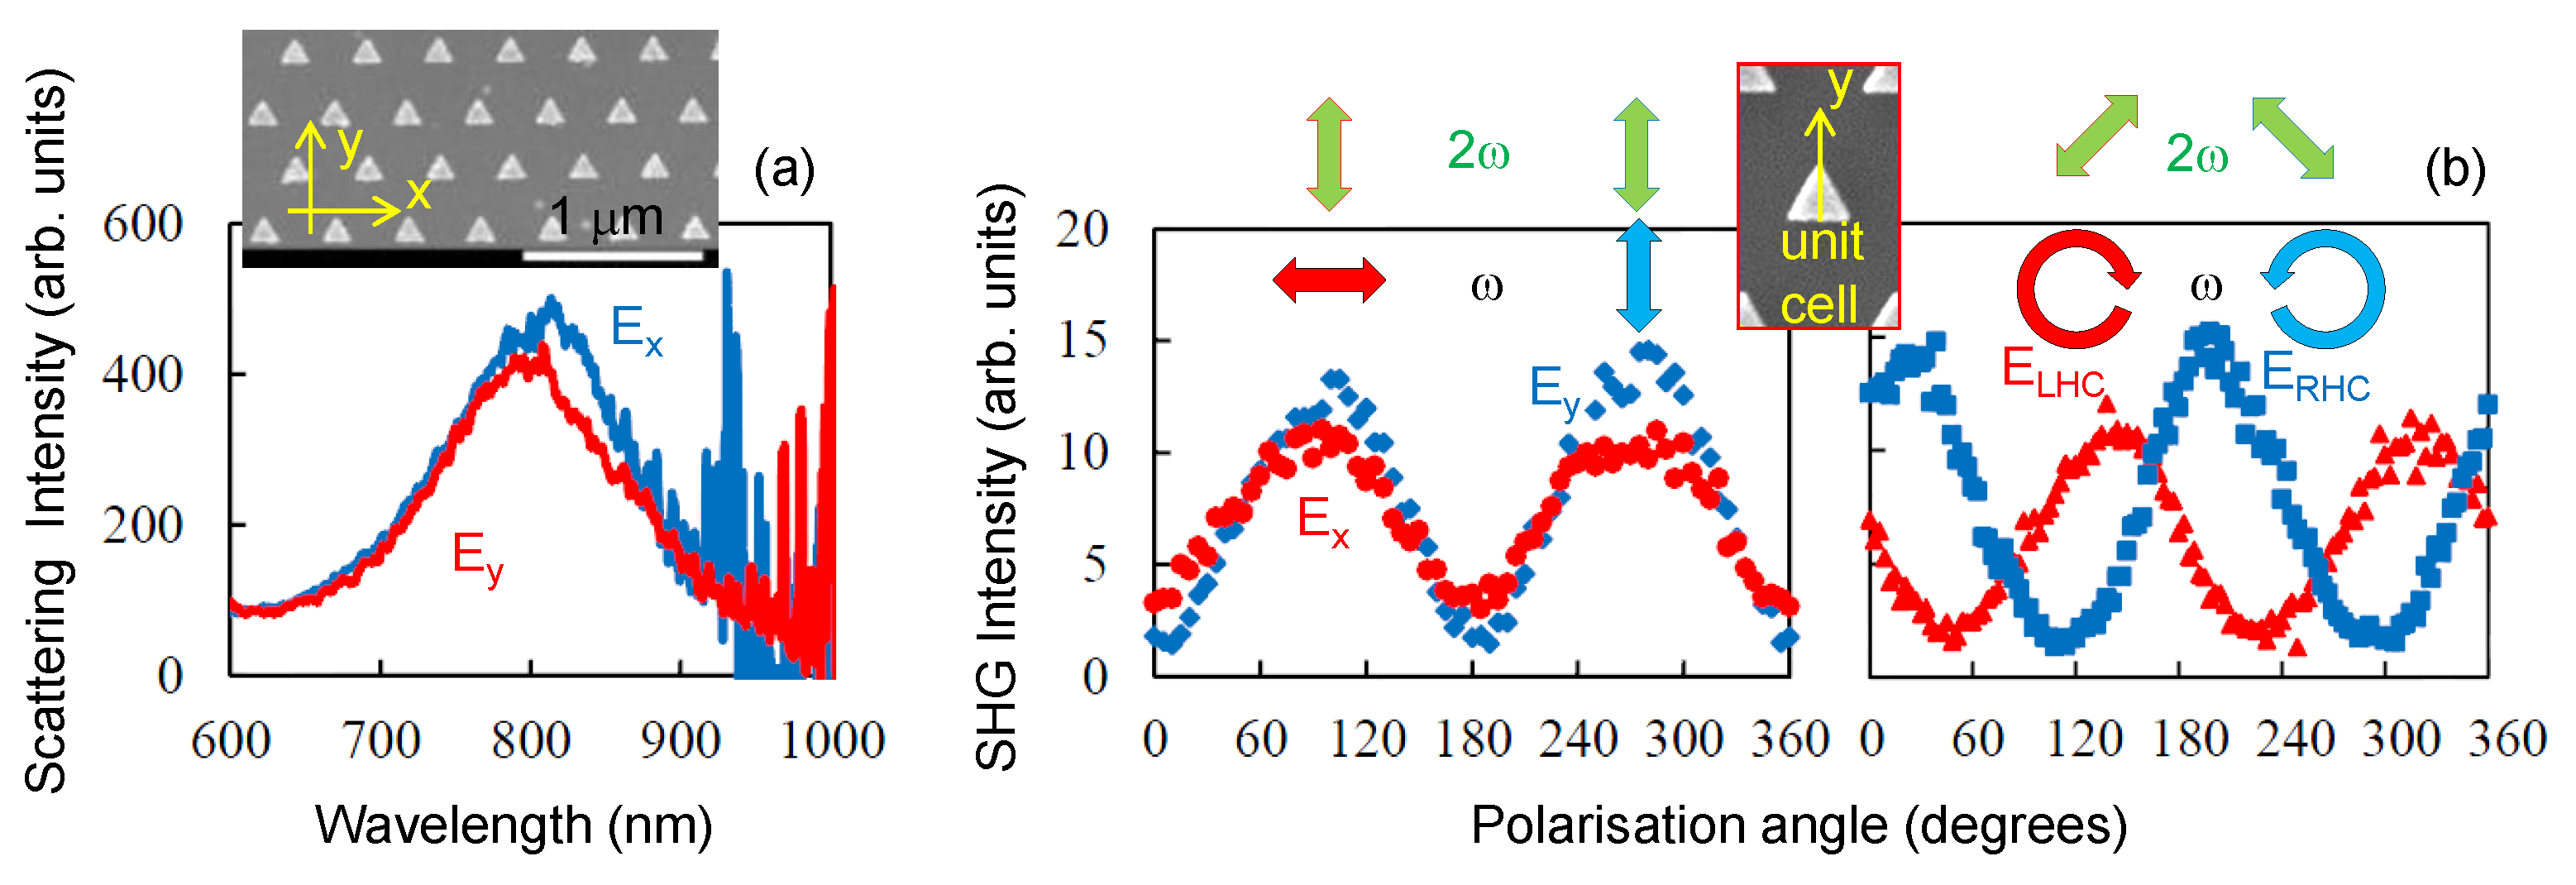
3.1. Au Triangular Nanoprisms on Glass
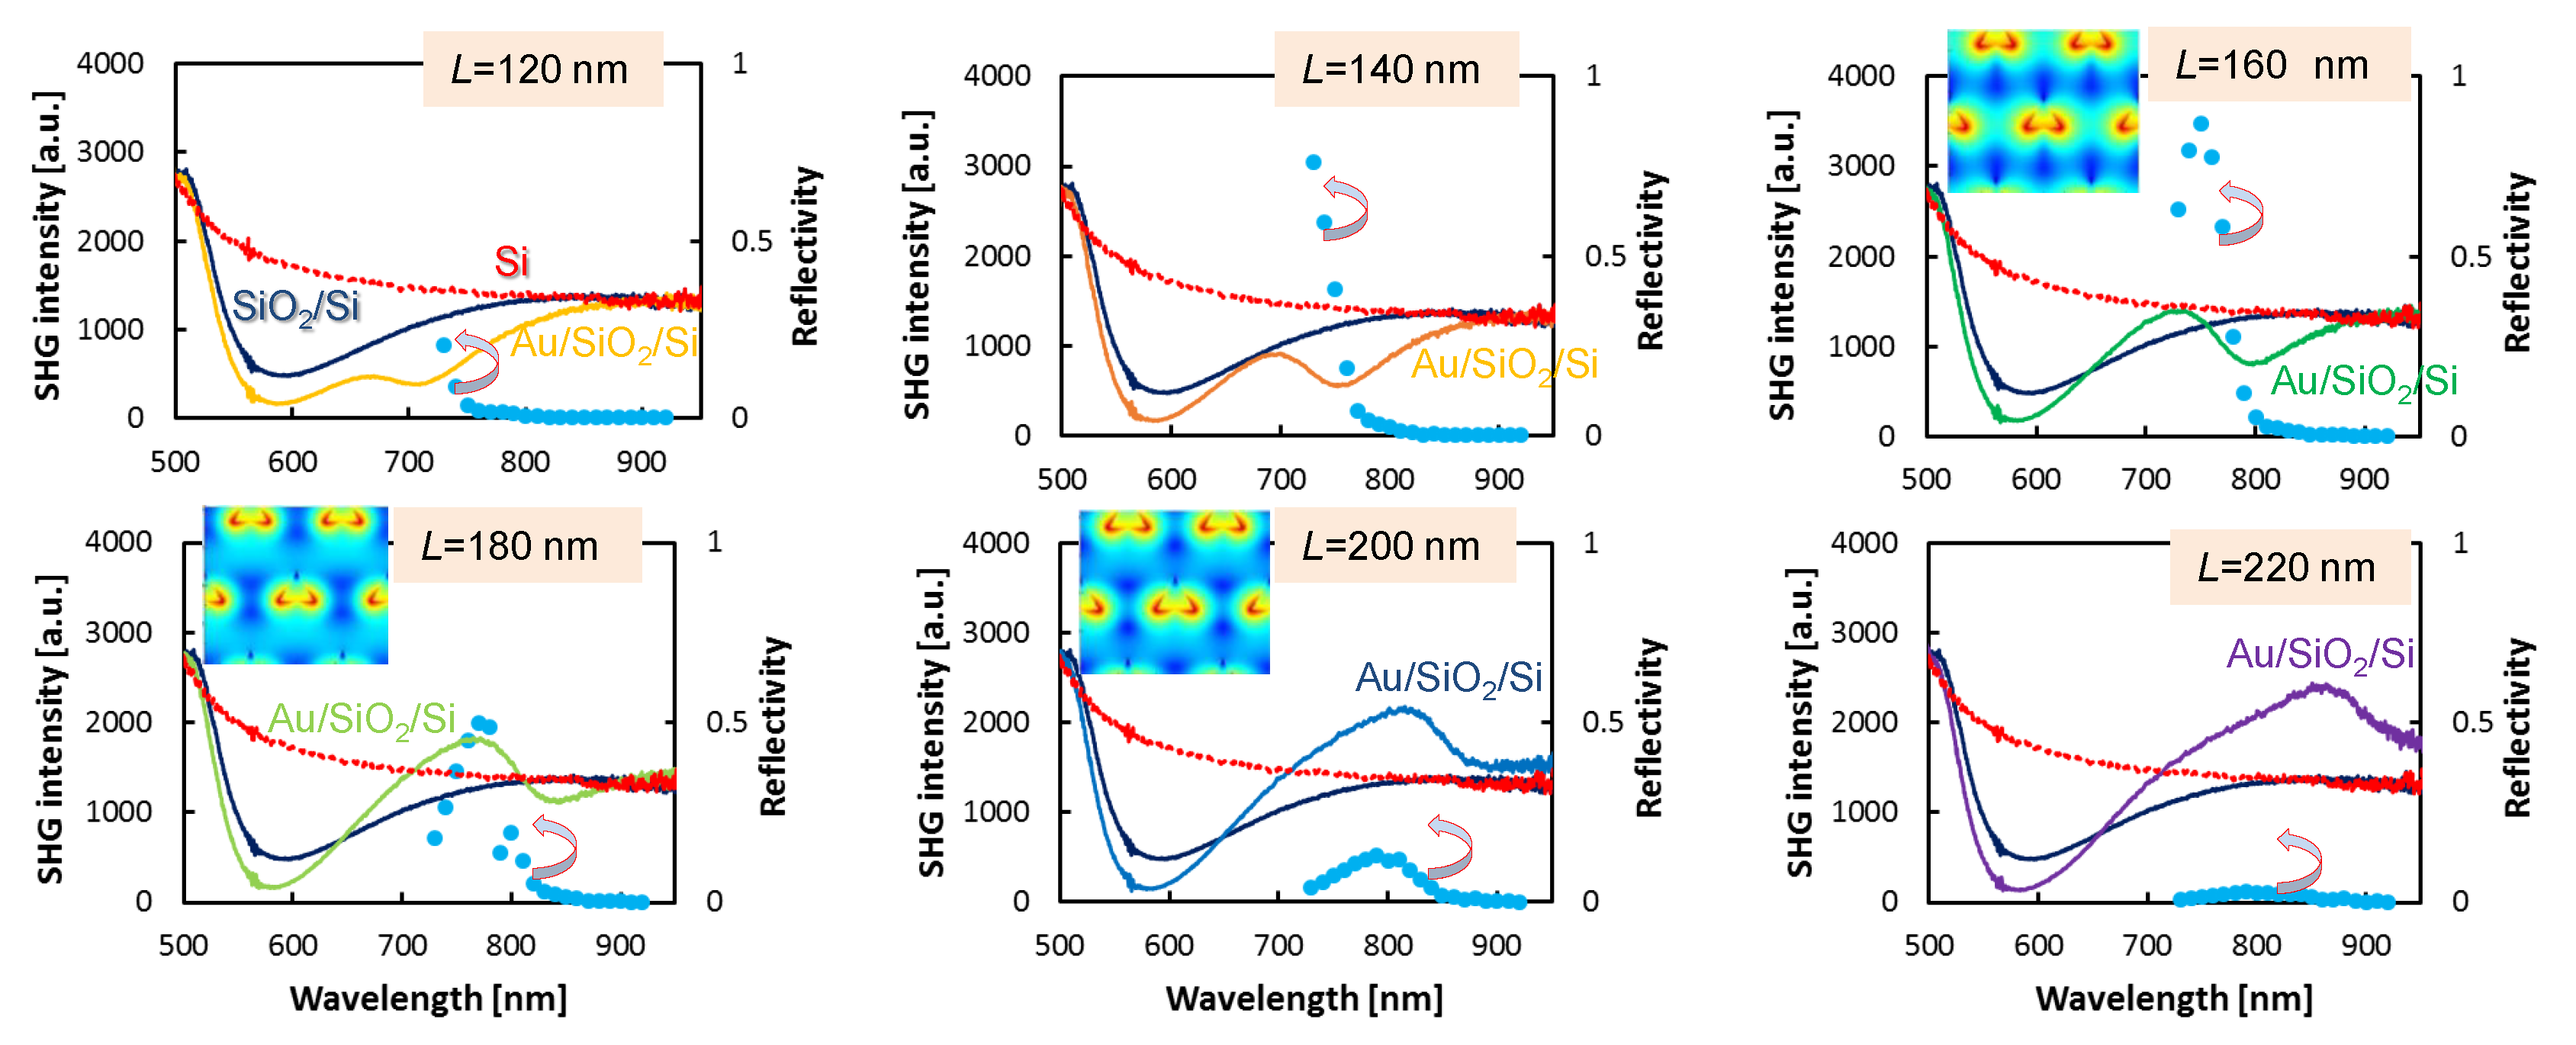
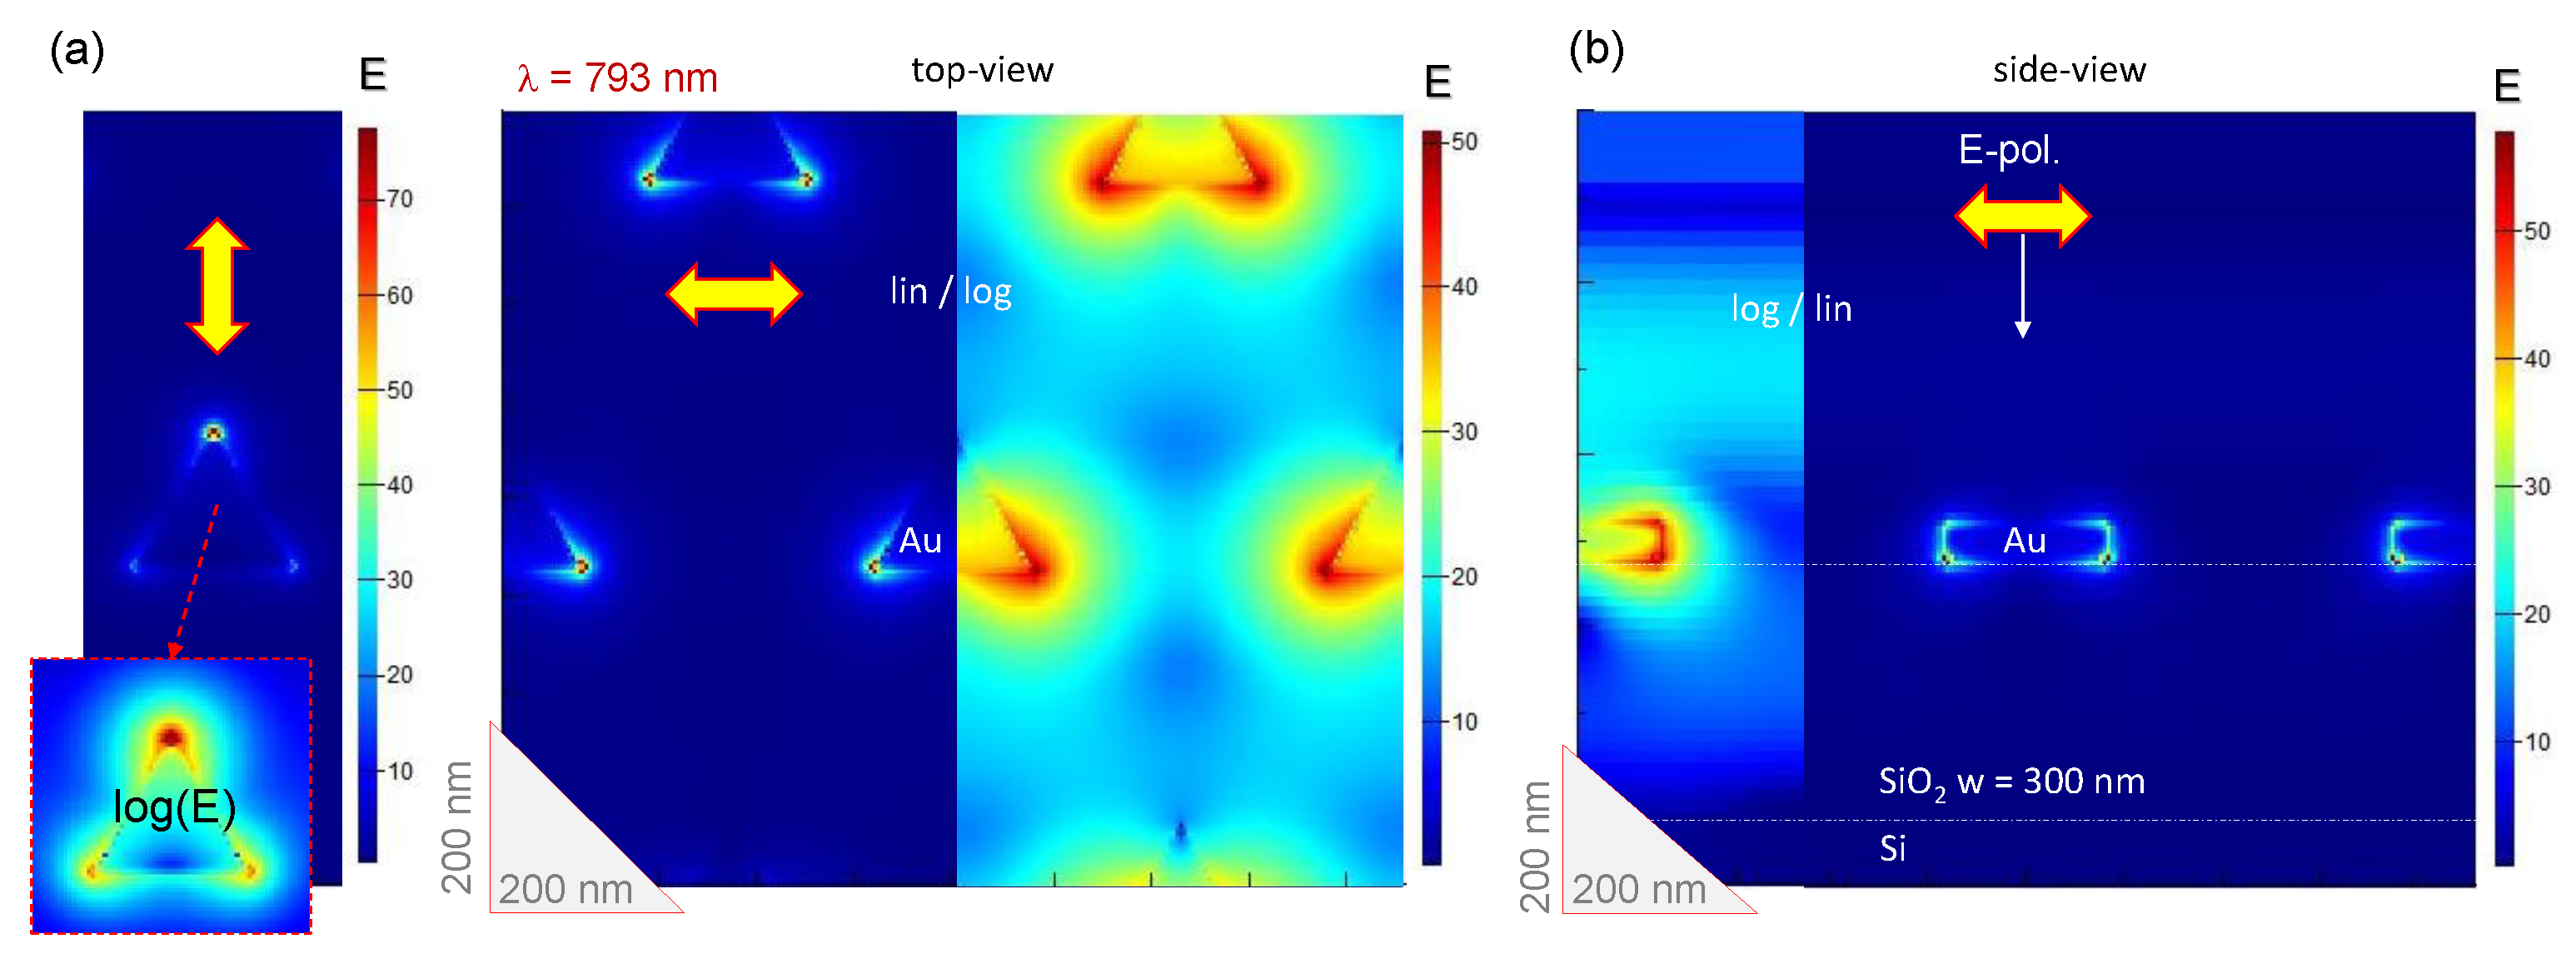
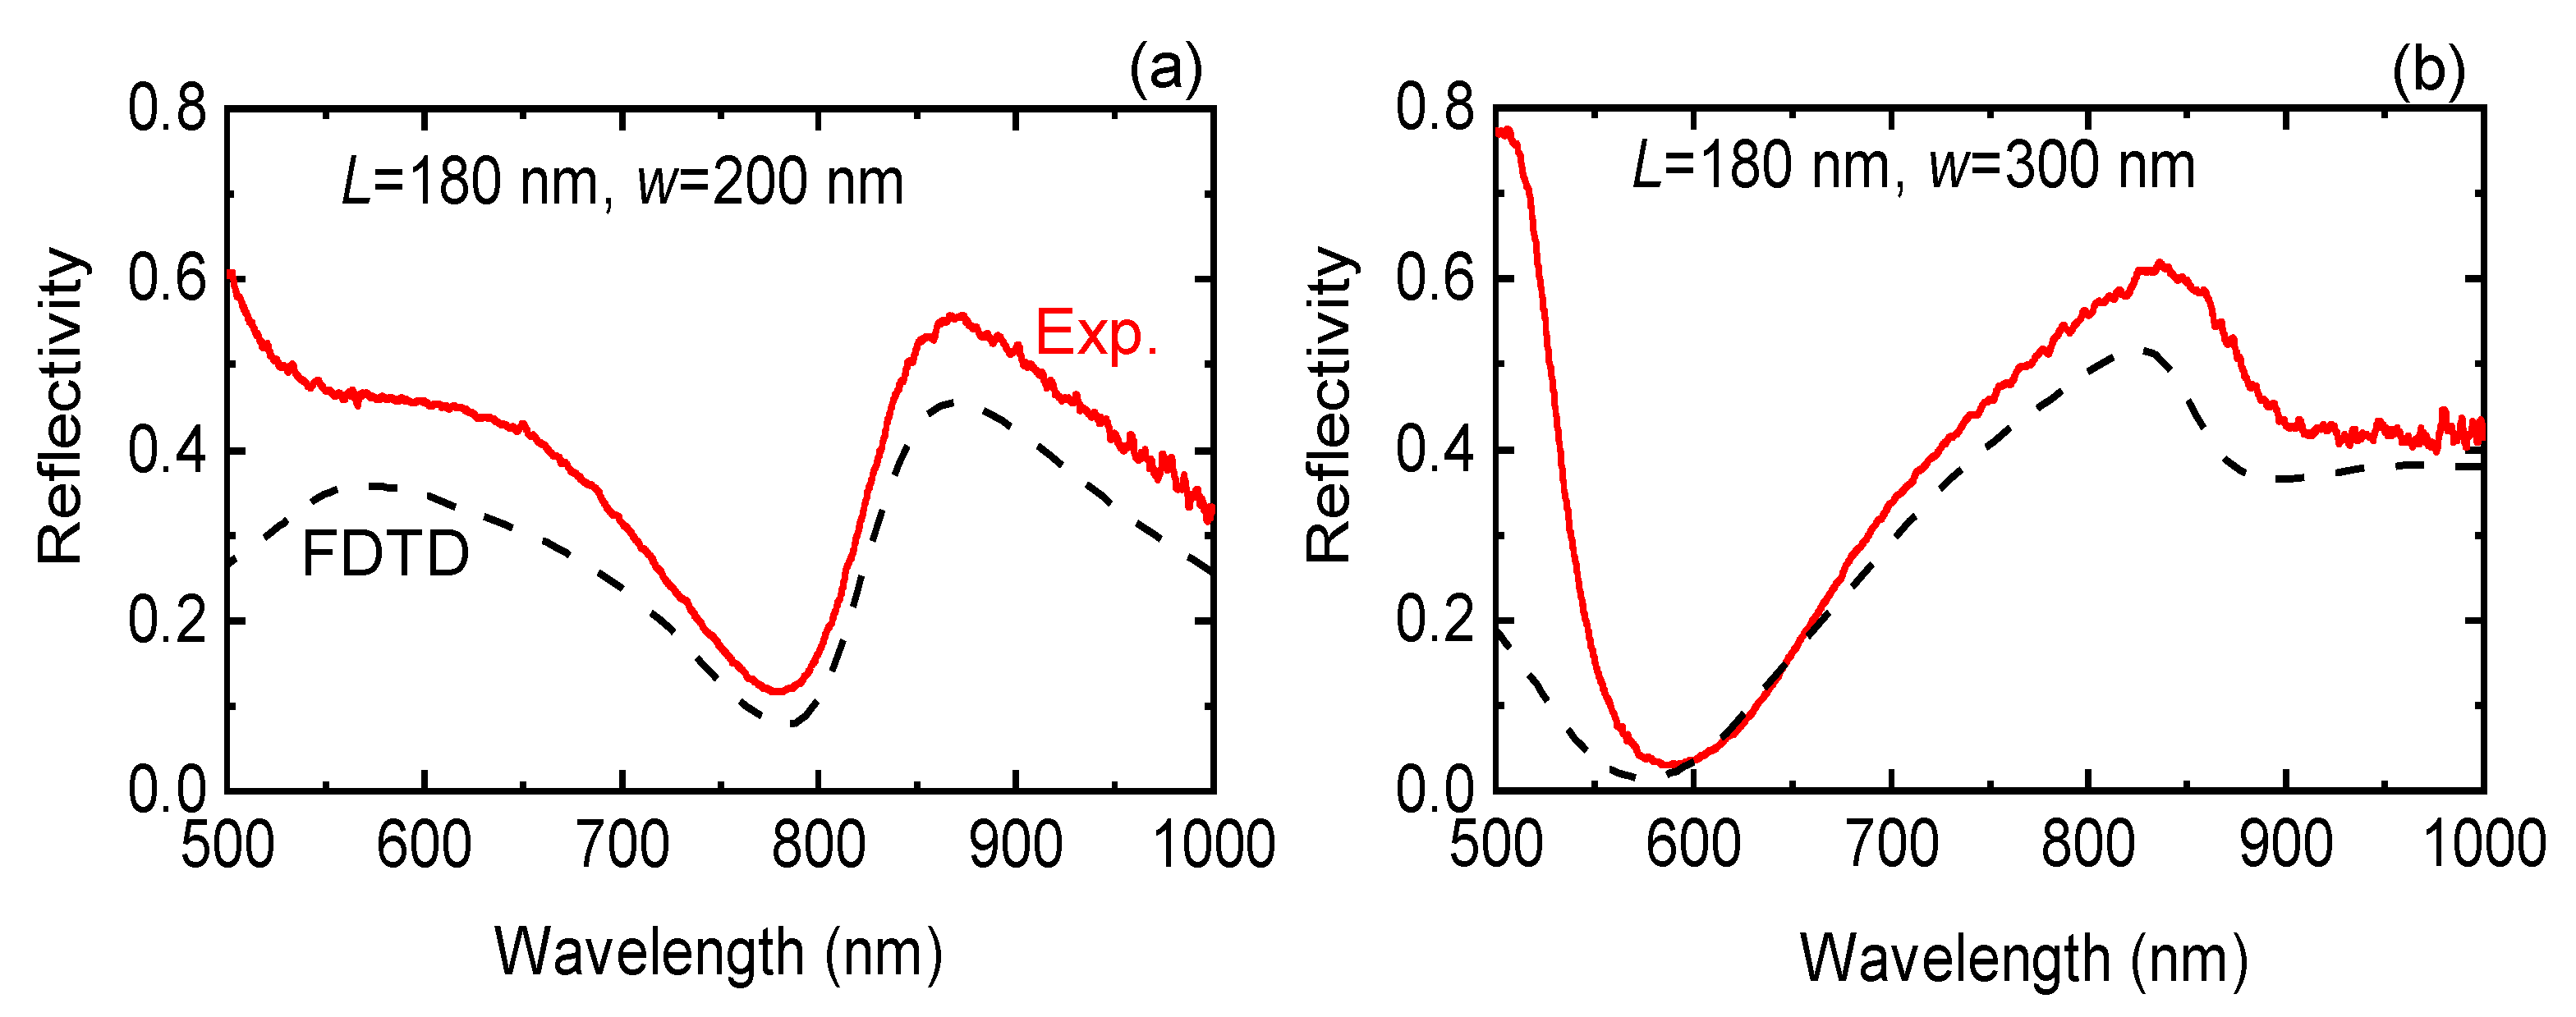
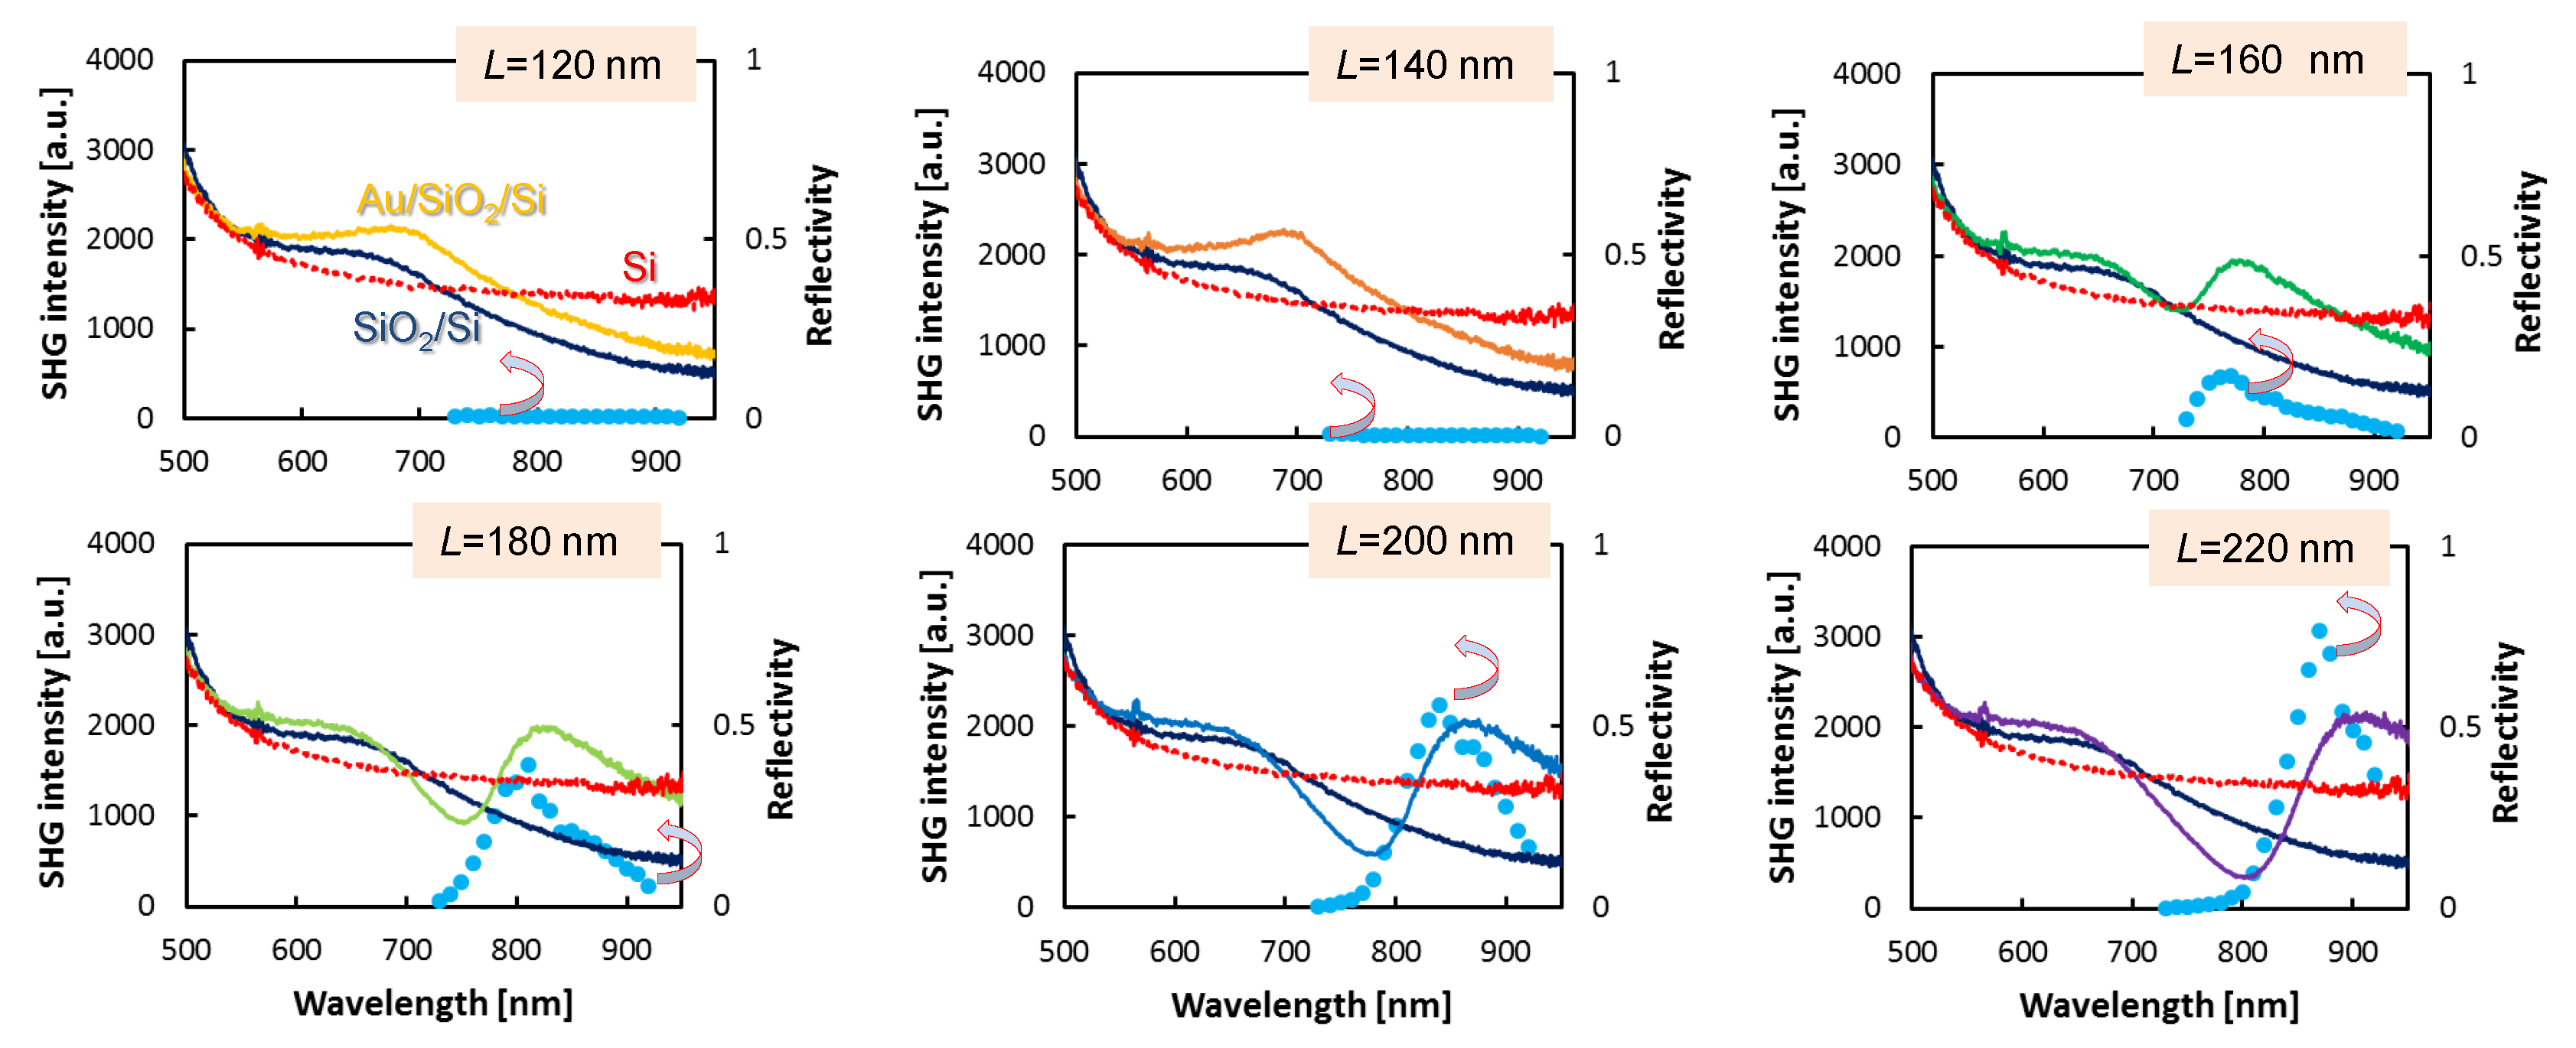
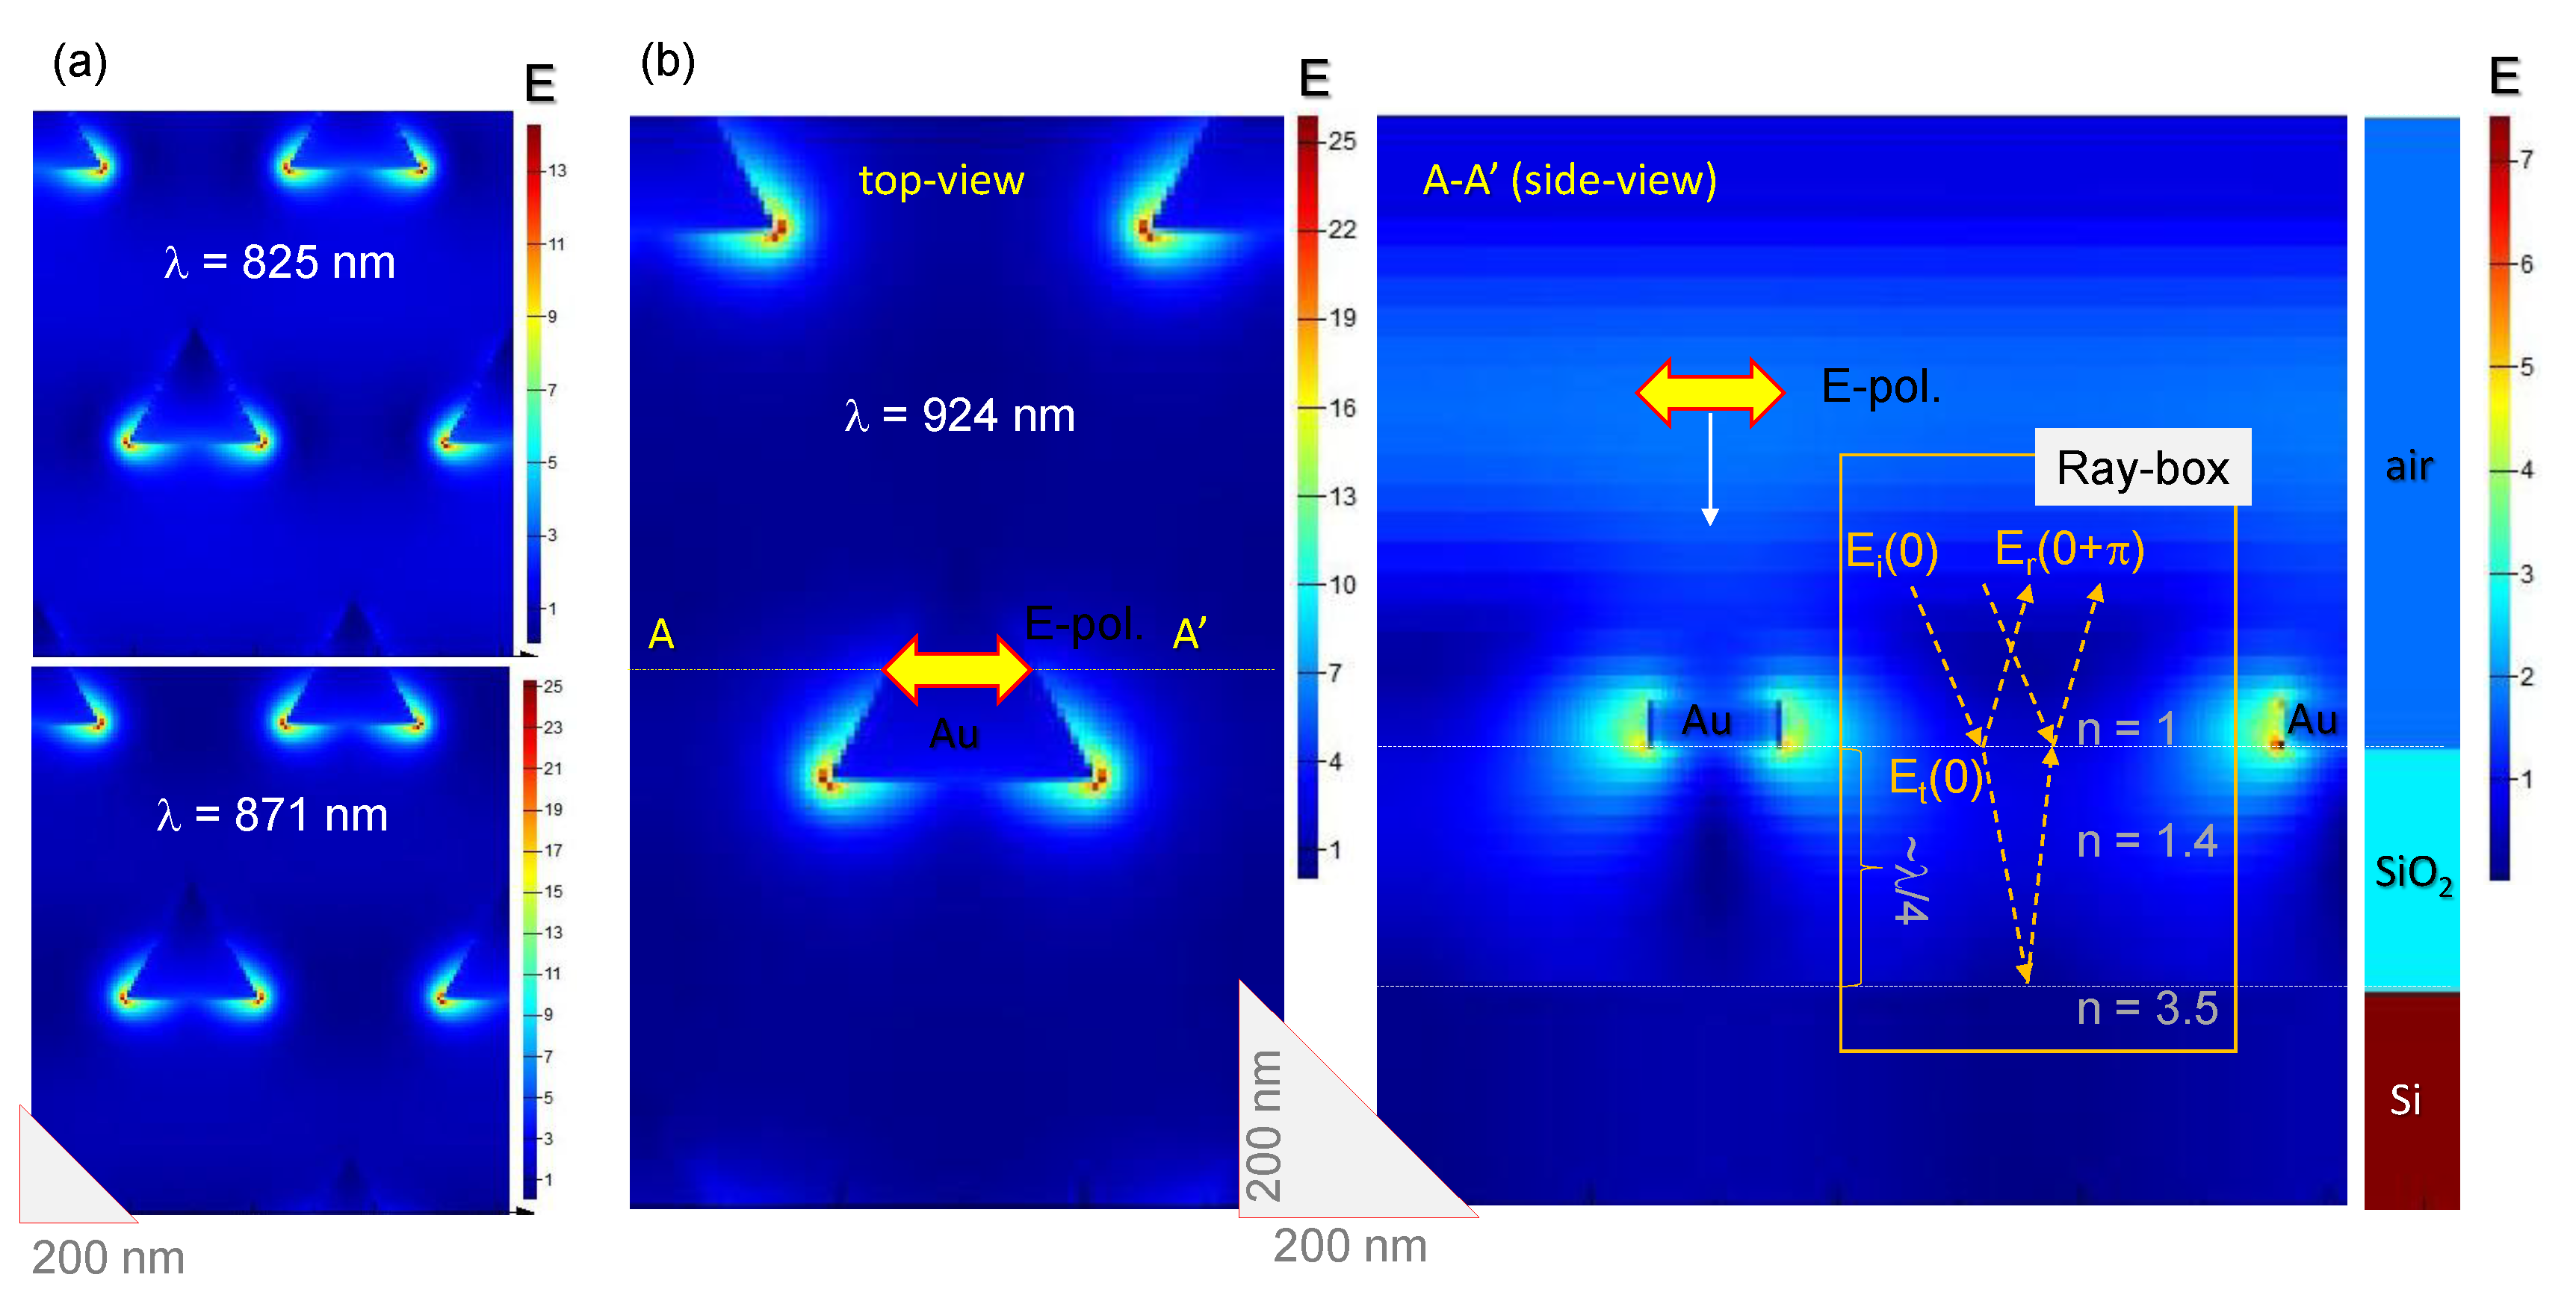
3.2. Au Triangular Nanoprisms on Si with SiO Spacer
4. Conclusions and Outlook
Author Contributions
Funding
Acknowledgments
Conflicts of Interest
Appendix A. Reflection and SHG Spectra for w = 200 nm SiO2 on Si


References
- Sun, Q.C.; Ding, Y.C.; Sagar, D.M.; Nagpal, P. Photon upconversion towards applications in energy conversion and bioimaging. Progr. Surface Sci. 2017, 92, 281–316. [Google Scholar] [CrossRef]
- Wen, S.; Zhou, J.; Schuck, P.J.; Suh, Y.D.; Schmidt, T.W.; Jin, D. Future and challenges for hybrid upconversion nanosystems. Nat. Photonics 2019, 13, 828–838. [Google Scholar] [CrossRef]
- Zhou, J.; Chizhik, A.I.; Chu, S.; Jin, D. Single-particle spectroscopy for functional nanomaterials. Nature 2020, 579, 41–50. [Google Scholar] [CrossRef] [PubMed]
- Aouani, H.; Rahmani, M.; Navarro-CÃ a, M.; Maier, S.A. Third-harmonic-upconversion enhancement from a single semiconductor nanoparticle coupled to a plasmonic antenna. Nat. Nanotech. 2014, 9, 290–294. [Google Scholar] [CrossRef] [PubMed]
- Kauranen, M.; Zayats, A.V. Nonlinear plasmonics. Nano Lett. 2012, 6, 737–748. [Google Scholar] [CrossRef]
- Butet, J.; Brevet, P.R.; Martin, O.J.F. Optical second harmonic generation in plasmonic nanostructures: From fundamental principles to advanced applications. ACS Nano 2015, 9, 10545–10562. [Google Scholar] [CrossRef]
- Krasnok, A.; Tymchenko, M.; Alu, A. Nonlinear metasurfaces: A paradigm shift in nonlinear optics. Mater. Today 2014, 21, 8–21. [Google Scholar] [CrossRef]
- Guixin, L.; Shuang, Z.; Thomas, Z. Nonlinear photonic metasurfaces. Nat. Rev. Mater. 2017, 2, 17010. [Google Scholar]
- Hasan, S.B.; Lederer, F.; Rockstuhl, C. Nonlinear plasmonic antennas. Mater. Today 2014, 17, 478–485. [Google Scholar] [CrossRef]
- Wang, C.; Li, Z.; Kim, M.H.; Xiong, X.; Ren, X.F.; Guo, G.C.; Yu, N.; Lončar, M. Metasurface-assisted phase-matching-free second harmonic generation in lithium niobate waveguides. Nat. Comm. 2017, 8, 2098. [Google Scholar] [CrossRef]
- Cherepakhin, A.B.; Pavlov, D.V.; Shishkin, I.I.; Voroshilov, P.M.; Juodkazis, S.; Makarov, S.V.; Kuchmizhak, A.A. Laser-printed hollow nanostructures for nonlinear plasmonics. Appl. Phys. Lett. 2020, 117, 041108. [Google Scholar] [CrossRef]
- Vanagas, E.; Kudryashov, I.; Tuzhilin, D.; Juodkazis, S.; Matsuo, S.; Misawa, H. Surface nanostructuring of borosilicate glass by femtosecond nJ energy pulses. Appl. Phys. Lett. 2003, 82, 2901–2903. [Google Scholar] [CrossRef]
- Ueno, K.; Juodkazis, S.; Mizeikis, V.; Sasaki, K.; Misawa, H. Clusters of closely spaced gold nanoparticles as a source of two-photon photoluminescence at visible wavelengths. Adv. Mater. 2008, 20, 26–29. [Google Scholar] [CrossRef]
- Dhama, R.; Caligiuri, V.; Petti, L.; Rashed, A.R.; Rippa, M.; Lento, R.; Termine, R.; Caglayan, H.; De Luca, A. Extraordinary Effects in Quasi-Periodic Gold Nanocavities: Enhanced Transmission and Polarization Control of Cavity Modes. ACS Nano 2018, 12, 504–512. [Google Scholar] [CrossRef] [PubMed]
- Marino, G.; Gigli, C.; Rocco, D.; Lemaître, A.; Favero, I.; De Angelis, C.; Leo, G. Zero-Order Second Harmonic Generation from AlGaAs-on-Insulator Metasurfaces. ACS Photonics 2019, 6, 1226–1231. [Google Scholar] [CrossRef] [Green Version]
- Han, A.; Dineen, C.; Babicheva, V.E.; Moloney, J.V. Second harmonic generation in metasurfaces with multipole resonant coupling. Nanophotonics 2019, 9, 3545–3556. [Google Scholar] [CrossRef]
- Carletti, L.; Li, C.; Sautter, J.; Staude, I.; De Angelis, C.; Li, T.; Neshev, D.N. Second harmonic generation in monolithic lithium niobate metasurfaces. Opt. Express 2019, 27, 3545–3556. [Google Scholar] [CrossRef]
- Zheng, Y.; Rosa, L.; Thai, T.; Ng, S.H.; Juodkazis, S.; Bach, U. Phase controlled SERS enhancement. Sci. Rep. 2019, 9, 744. [Google Scholar] [CrossRef] [Green Version]
- Jayawardhana, S.; Rosa, L.; Juodkazis, S.; Stoddart, P.R. Additional Enhancement of Electric Field in Surface-Enhanced Raman Scattering due to Fresnel Mechanism. Sci. Rep. 2013, 3, 2335. [Google Scholar] [CrossRef]
- Cheng, O.H.C.; Son, D.H.; Sheldon, M. Light-induced magnetism in plasmonic gold nanoparticles. Nat. Photonics 2020, 14, 365–368. [Google Scholar] [CrossRef] [Green Version]
- Nie, W.; Jiang, S.; Li, R.; Ren, F.; Clayton, A.; Juodkazis, S.; Chen, F. Plasmon-induced photoluminescence and Raman enhancement in Pr:CaF2 crystal by embedded silver nanoparticles. Appl. Surf. Sci. 2020, 530, 147018. [Google Scholar] [CrossRef]
- Konishi, K.; Higuchi, T.; Li, J.; Larsson, J.; Ishii, S.; Kuwata-Gonokami, M. Polarization-Controlled Circular Second-Harmonic Generation from Metal Hole Arrays with Threefold Rotational Symmetry. Phys. Rev. Sci. Lett. 2014, 112, 135502. [Google Scholar] [CrossRef] [PubMed]
- O Brien, K.; Suchowski, H.; Rho, J.; Salandrino, A.; Kante, B.; Yin, X.; Zhang, X. Predicting nonlinear properties of metamaterials from the linear response. Nat. Mater. 2015, 14, 379–383. [Google Scholar] [CrossRef] [PubMed]
- Wang, F.X.; Rodriguez, F.J.; Albers, W.M.; Ahorinta, R.; Sipe, J.E.; Kauranen, M. Surface and bulk contribution to the second-order nonlinear optical response of a gold film. Phys. Rev. B 2009, 80, 233402. [Google Scholar] [CrossRef]
- Sipe, J.E.; So, V.C.Y.; Fukui, M.; Stegemann, G.I. Analysis of second-harfnonic generation at metal surfaces. Phys. Rev. B 1980, 21, 4389–4402. [Google Scholar] [CrossRef]
- Maytorena, J.A.; Mochan, W.L.; Mendoza, B.S. Hydrodynamic model for second-harmonic generation at conductor surfaces with continuous profiles. Phys. Rev. B 1995, 51, 2556–2562. [Google Scholar] [CrossRef] [PubMed]
- Canfield, B.K.; Husu, H.; Laukkanen, J.; Bai, B.; Kuittinen, M.; Turunen, J.; Kauranen, M. Local Field Asymmetry Drives Second-Harmonic Generation in Noncentrosymmetric Nanodimers. Nano Lett. 2007, 7, 1251–1255. [Google Scholar] [CrossRef]
- Boyd, R.W. Nonlinear Optics; Chapter 1. The Nonlinear Optical Susceptibility; Academic Press: Cambridge, MA, USA, 2008; p. 1. [Google Scholar]
- Rishabh, R.; Hamed, A.; Juodkazis, S.; Moss, D.; Pierre-Michel, A.; Sivashankar, K. Investigating Analyte Co-Localization at Electromagnetic Gap Hot-Spots For Highly Sensitive Biomolecular Detection by Plasmon Enhanced Spectroscopies. Adv. Opt. Mat. 2020. submitted. [Google Scholar]
- Nishijima, Y.; Balcytis, A.; Naganuma, S.; Seniutinas, G.; Juodkazis, S. Tailoring metal and insulator contributions in plasmonic perfect absorber metasurfaces. ACS Appl. Nano Mater. 2018, 1, 3557–3564. [Google Scholar] [CrossRef]
- To, N.; Nishijima, Y.; Juodkazis, S. Detailed Experiment-Theory Comparison of Mid-Infrared Metasurface Perfect Absorbers. Micromachines 2020, 11, 409. [Google Scholar] [CrossRef] [Green Version]
- Kumagai, T.; To, N.; Balcytis, A.; Seniutinas, G.; Juodkazis, S.; Nishijima, Y. Kirchhoff’s Thermal Radiation from Lithography-Free Black Metals. Micromachines 2020, 11, 824. [Google Scholar] [CrossRef] [PubMed]
- Yamasaki, K.; Juodkazis, S.; Matsuo, S.; Misawa, H. Three-dimensional microchannels in polymers: One step fabrication. Appl. Phys. A 2003, 77, 371–373. [Google Scholar] [CrossRef]
- Buividas, R.; Rekštytė, S.; Malinauskas, M.; Juodkazis, S. Nano-groove and 3D fabrication by controlled avalanche using femtosecond laser pulses. Opt. Mater. Express 2013, 3, 1674–1686. [Google Scholar] [CrossRef]
- Seet, K.K.; Mizeikis, V.; Juodkazis, S.; Misawa, H. Three-Dimensional Horizontal Circular Spirals Photonic Crystals with stop gaps below 1 μm. Appl. Phys. Lett. 2006, 88, 221101. [Google Scholar] [CrossRef]
- Li, Z.Z.; Wang, L.; Fan, H.; Yu, Y.H.; Chen, Q.D.; Juodkazis, S.; Sun, H.B. O-FIB: far-field-induced near-field breakdown for direct nanowriting in an atmospheric environment. Light Sci. Appl. 2020, 9, 052003. [Google Scholar] [CrossRef] [Green Version]
- Sugita, A.; Ito, K.; Sato, Y.; Suzuki, R.; Sato, K.; Narumi, T.; Mase, N.; Takano, Y.; Matsushita, T.; Tasaka, S.; et al. The role of chemisorption for push-pull chromophores on SiO2 surfaces in non-electrically poling host-guest NLO polymers. J. Photochem. Photobiol. A Chem. 2017, 340, 35–45. [Google Scholar] [CrossRef]
- Yogo, H.; Matsui, T.; Nihashi, S.; Hirabayashi, T.; Inami, W.; Ono, A.; Kawata, Y.; Sugita, A. Polarized second-harmonic-generation spectroscopy for Au nanorods arrayed on SiO2 substrates at localized surface plasmon resonances. Jpn. J. Appl. Phys. 2017, 56, 122002. [Google Scholar] [CrossRef]
- Sugita, A.; Kaname, S.; Mochizuki, K.; Kikuchi, K.; Ono, A.; Inami, W.; Kawata, Y. Second harmonic conversions of surface-plasmon-polariton-enhanced optical fields in nonlinear optics polymer/Ag/glass structures. Phys. Rev. B 2020, 101, 045303. [Google Scholar] [CrossRef]
- Rosa, H.G.; Ho, Y.W.; Verzhbitskiy, I.; Rodrigues, M.; Taniguchi, T.; Watanabe, K.; Eda, G.; Pereira, V.M.; Gomes, J. Characterization of the second- and third-harmonic optical susceptibilities of atomically thin tungsten diselenide. Sci. Rep. 2018, 8, 10035. [Google Scholar] [CrossRef] [Green Version]
- Makihara, K.; Kaneta, D.; Iwamura, T.; Sugita, A.; Leproux, P.; Couderc, V.; Kano, H. Photo-induced meta-stable polar conformations in polystyrene microspheres revealed by time-resolved SHG microscopy. Appl. Phys. Express 2020, 13, 052003. [Google Scholar] [CrossRef]
- Ryu, M.; Honda, R.; Reich, A.; Cernescu, A.; Li, J.L.; Hu, J.; Juodkazis, S.; Morikawa, J. Near-Field IR Orientational Spectroscopy of Silk. Appl. Sci. 2019, 9, 3991. [Google Scholar] [CrossRef] [Green Version]
- Fujisawa, H.; Ryu, M.; Lundgaard, S.; Linklater, D.P.; Ivanova, E.P.; Nishijima, Y.; Juodkazis, S.; Morikawa, J. Direct Measurement of Temperature Diffusivity of Nanocellulose-Doped Biodegradable Composite Films. Micromachines 2020, 11, 738. [Google Scholar] [CrossRef] [PubMed]
- Shoji, T.; Mototsuji, A.; Balcytis, A.; Linklater, D.; Juodkazis, S.; Tsuboi, Y. Optical tweezing and binding at high irradiation powers on black-Si. Sci. Rep. 2017, 7, 12298. [Google Scholar] [CrossRef] [PubMed]
- Misawa, H.; Juodkazis, S. Photophysics and photochemistry of a laser manipulated microparticle. Prog. Polym. Sci. 1999, 24, 665–697. [Google Scholar] [CrossRef]
- Koya, A.; Cunha, J.; Guo, T.; Toma, A.; Garoli, D.; Wang, T.; Juodkazis, S.; Cojoc, D.; Zaccaria, R. Novel Plasmonic Nanocavities for Optical Trapping Assisted Biosensing Applications. Adv. Opt. Mat. 2020, 8, 1901481. [Google Scholar] [CrossRef]
- Žukauskas, A.; Malinauskas, M.; Kadys, A.; Gervinskas, G.; Seniutinas, G.; Kandasamy, S.; Juodkazis, S. Black silicon: Substrate for laser 3D micro/nano-polymerization. Opt. Express 2013, 21, 6901–6909. [Google Scholar] [CrossRef]
- Gervinskas, G.; Seniutinas, G.; Hartley, J.S.; Kandasamy, S.; Stoddart, P.R.; Fahim, N.F.; Juodkazis, S. Surface-enhanced Raman scattering sensing on black silicon. Ann. Phys. 2013, 525, 907–914. [Google Scholar] [CrossRef]
- Buividas, R.; Stoddart, P.R.; Juodkazis, S. Laser fabricated ripple substrates for surface-enahnced Raman scattering. Ann. Phys. 2012, 524, L5–L10. [Google Scholar] [CrossRef]
- Mitsai, E.; Kuchmizhak, A.; Pustovalov, E.; Sergeev, A.; Mironenko, A.; Bratskaya, S.; Linklater, D.; Balcytis, A.; Ivanova, E.; Juodkazis, S. Chemically non-perturbing SERS detection of a catalytic reaction with black silicon. Nanoscale 2018, 10, 9780–9787. [Google Scholar] [CrossRef] [Green Version]
- Linklater, D.P.; Baulin, V.A.; Juodkazis, S.; Crawford, R.J.; Stoodley, P.; Ivanova, E.P. Mechano-bactericidal actions of nanostructured surfaces. Nat. Rev. Microbiol. 2020, 1–15. [Google Scholar] [CrossRef]
- Linklater, D.; Nguyen, H.; Bhadra, C.; Juodkazis, S.; Ivanova, E. Influence of nanoscale topology on bactericidal efficiency of black silicon surfaces. Nanotechnology 2017, 28, 469501. [Google Scholar] [CrossRef]
- Linklater, D.; Juodkazis, S.; Ivanova, E. Nanofabrication of mechano-bactericidal surfaces. Nanoscale 2017, 9, 16564–16585. [Google Scholar] [CrossRef] [PubMed]
- Abd-El-Aziz, A.S.; Antonietti, M.; Barner-Kowollik, C.; Binder, W.H.; Baker, A.; Boyer, C.; Buchmeiser, M.R.; Cheng, S.Z.D.; De Agosto, F.; Floudas, G.; et al. The Next 100 Years of Polymer Science. Macromol. Chem. Phys. 2020, 2020, 2000216. [Google Scholar] [CrossRef]


© 2020 by the authors. Licensee MDPI, Basel, Switzerland. This article is an open access article distributed under the terms and conditions of the Creative Commons Attribution (CC BY) license (http://creativecommons.org/licenses/by/4.0/).
Share and Cite
Mochizuki, K.; Sugiura, M.; Yogo, H.; Lundgaard, S.; Hu, J.; Ng, S.H.; Nishijima, Y.; Juodkazis, S.; Sugita, A. Second Harmonic Generation from Phase-Engineered Metasurfaces of Nanoprisms. Micromachines 2020, 11, 848. https://doi.org/10.3390/mi11090848
Mochizuki K, Sugiura M, Yogo H, Lundgaard S, Hu J, Ng SH, Nishijima Y, Juodkazis S, Sugita A. Second Harmonic Generation from Phase-Engineered Metasurfaces of Nanoprisms. Micromachines. 2020; 11(9):848. https://doi.org/10.3390/mi11090848
Chicago/Turabian StyleMochizuki, Kanta, Mako Sugiura, Hirofumi Yogo, Stefan Lundgaard, Jingwen Hu, Soon Hock Ng, Yoshiaki Nishijima, Saulius Juodkazis, and Atsushi Sugita. 2020. "Second Harmonic Generation from Phase-Engineered Metasurfaces of Nanoprisms" Micromachines 11, no. 9: 848. https://doi.org/10.3390/mi11090848